Embed Size (px)
Citation preview
China Telecom Corporation Limited19 Mar 2014 | www.chinatelecom-h.com
2 | 2013 Annual Results
Forward-Looking Statements
Certain statements contained in this document may be viewed as “forward-looking statements” within the meaning of Section 27A of the U.S. Securities Act of 1933 (as amended) and Section 21E of the U.S. Securities Exchange Act of 1934 (as amended). Such forward-looking statements are subject to known and unknown risks, uncertainties and other factors, which may cause the actual performance, financial condition or results of operations of China Telecom Corporation Limited (the “Company”) to be materially different from any future performance, financial condition or results of operations implied by such forward-looking statements. In addition, we do not intend to update these forward-looking statements. Further information regarding these risks, uncertainties and other factors is included in the Company’s most recent Annual Report on Form 20-F filed with the U.S. Securities and Exchange Commission (the “SEC”) and in the Company’s other filings with the SEC.
3 | 2013 Annual Results
Presented By
Chairman & CEO
President & COO
EVP & CFO
Mr. Wang Xiaochu
Mr. Yang Jie
Madam Wu Andi
4 | 2013 Annual Results
Business Review
Financial Performance
2.
3.
Overview1.
5 | 2013 Annual Results
Highlights
To deploy LTE network appropriately with regard to government policy & business development, building a nationwide integrated 4G/ 3G high-speed network to enhance operating return
Robust business development optimized revenue structure & drove double-digit growth in revenue & net profit
Mobile scale expansion with enhanced customer value & scale benefits
Completed intensive phase of fibre network upgrade in cities as planned, boosting broadband growth & long-term competitiveness
To deepen comprehensive reform for creating a “New China Telecom”, capitalizing on external opportunities
4
2
3
1
5
6 | 2013 Annual Results
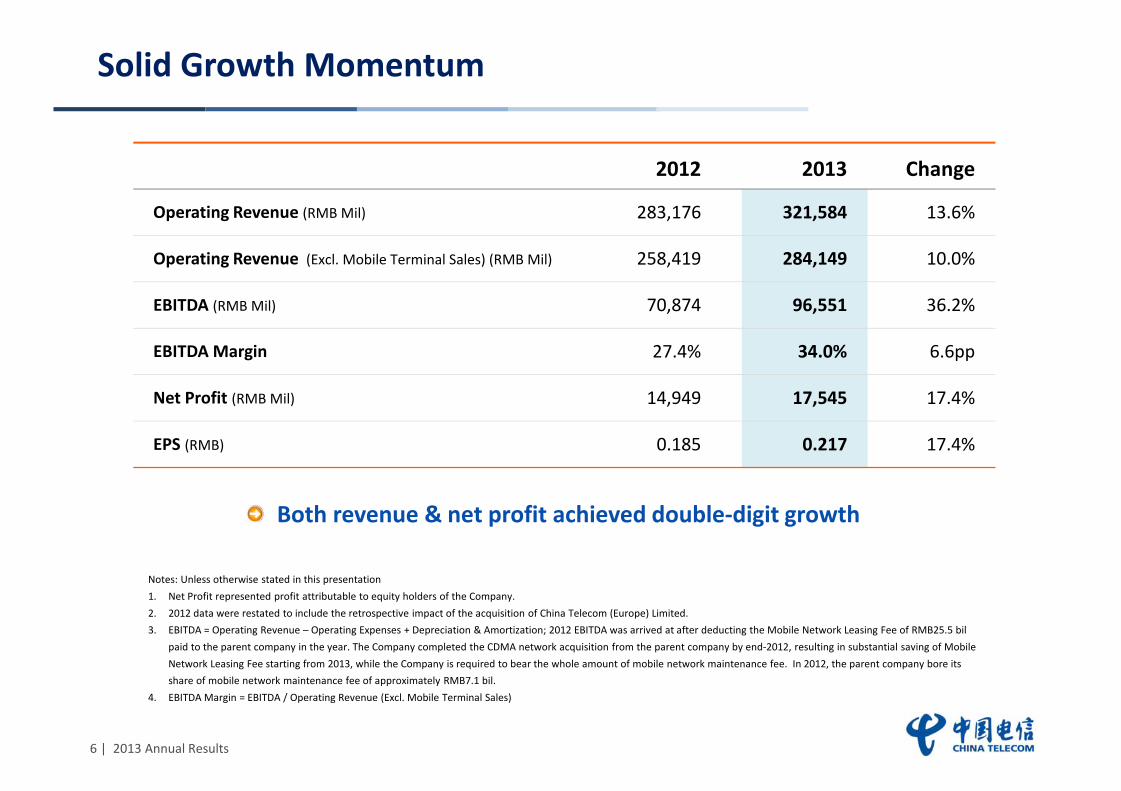
Solid Growth Momentum
2012 2013 Change
Operating Revenue (RMB Mil) 283,176 321,584 13.6%
Operating Revenue (Excl. Mobile Terminal Sales) (RMB Mil) 258,419 284,149 10.0%
EBITDA (RMB Mil) 70,874 96,551 36.2%
EBITDA Margin 27.4% 34.0% 6.6pp
Net Profit (RMB Mil) 14,949 17,545 17.4%
EPS (RMB) 0.185 0.217 17.4%
Notes: Unless otherwise stated in this presentation1. Net Profit represented profit attributable to equity holders of the Company.2. 2012 data were restated to include the retrospective impact of the acquisition of China Telecom (Europe) Limited.3. EBITDA = Operating Revenue – Operating Expenses + Depreciation & Amortization; 2012 EBITDA was arrived at after deducting the Mobile Network Leasing Fee of RMB25.5 bil
paid to the parent company in the year. The Company completed the CDMA network acquisition from the parent company by end-2012, resulting in substantial saving of Mobile Network Leasing Fee starting from 2013, while the Company is required to bear the whole amount of mobile network maintenance fee. In 2012, the parent company bore its share of mobile network maintenance fee of approximately RMB7.1 bil.
4. EBITDA Margin = EBITDA / Operating Revenue (Excl. Mobile Terminal Sales)
Both revenue & net profit achieved double-digit growth
7 | 2013 Annual Results
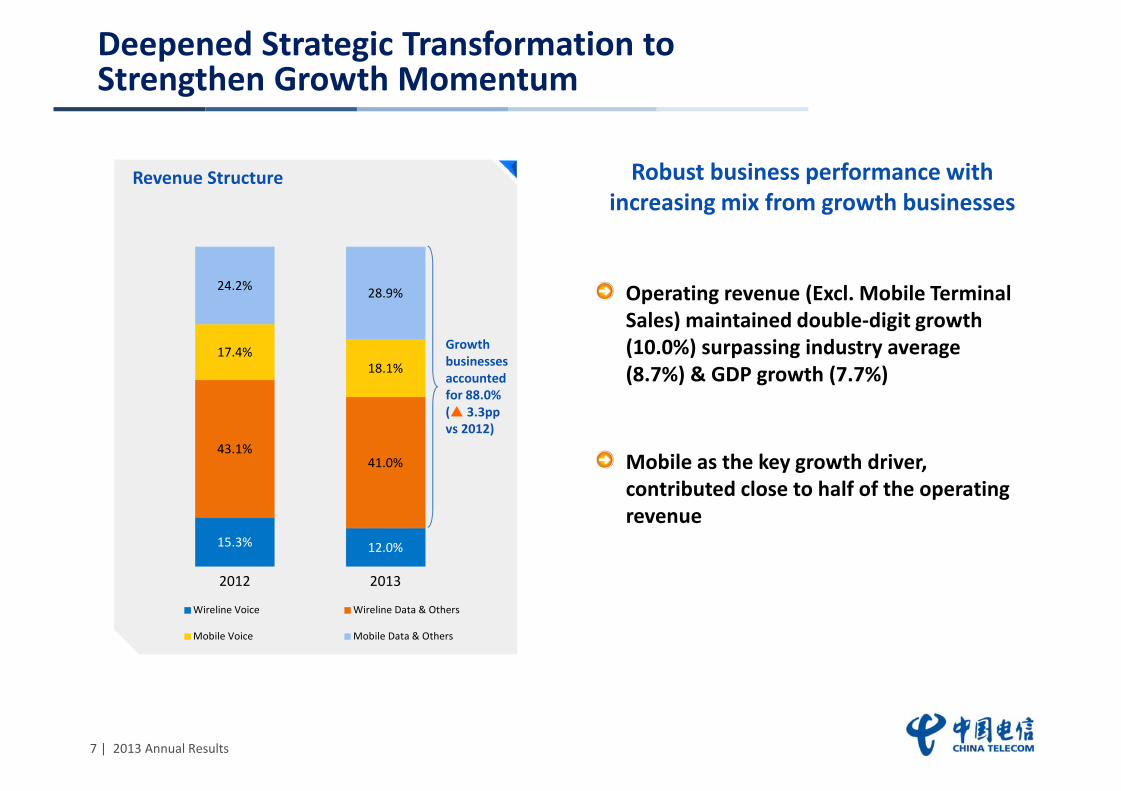
15.3% 12.0%
43.1%41.0%
17.4%18.1%
24.2% 28.9%
2012 2013
Wireline Voice Wireline Data & Others
Mobile Voice Mobile Data & Others
Deepened Strategic Transformation to Strengthen Growth Momentum
Growth businesses accounted for 88.0%( 3.3pp vs 2012)
Operating revenue (Excl. Mobile Terminal Sales) maintained double-digit growth (10.0%) surpassing industry average (8.7%) & GDP growth (7.7%)
Mobile as the key growth driver, contributed close to half of the operating revenue
Robust business performance with increasing mix from growth businesses
Revenue Structure
8 | 2013 Annual Results
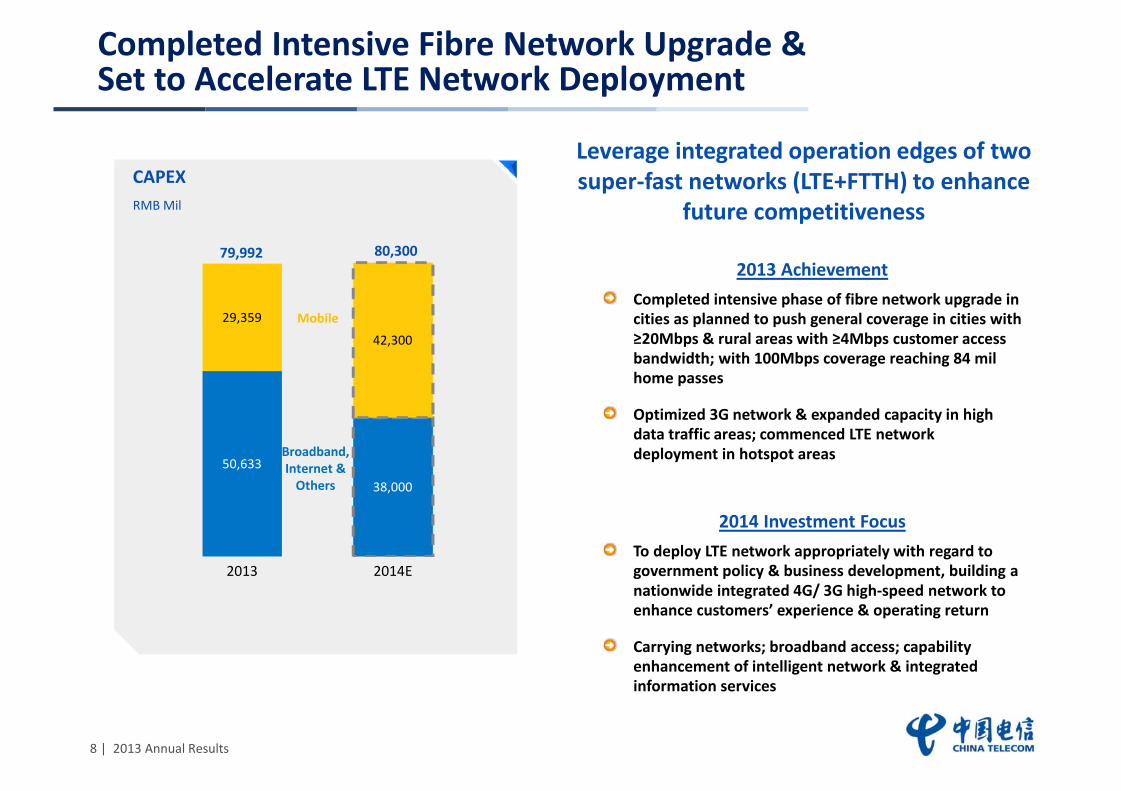
Completed Intensive Fibre Network Upgrade & Set to Accelerate LTE Network Deployment
2013 AchievementCompleted intensive phase of fibre network upgrade in cities as planned to push general coverage in cities with ≥20Mbps & rural areas with ≥4Mbps customer access bandwidth; with 100Mbps coverage reaching 84 mil home passes
Optimized 3G network & expanded capacity in high data traffic areas; commenced LTE network deployment in hotspot areas
2014 Investment FocusTo deploy LTE network appropriately with regard to government policy & business development, building a nationwide integrated 4G/ 3G high-speed network to enhance customers’ experience & operating return
Carrying networks; broadband access; capability enhancement of intelligent network & integrated information services
Leverage integrated operation edges of two super-fast networks (LTE+FTTH) to enhance
future competitivenessCAPEXRMB Mil
50,633
38,000
29,359
42,300
2013 2014E
79,992 80,300
Mobile
Broadband, Internet &
Others
9 | 2013 Annual Results
e-Surfing 4G to Drive Future Growth & Return
One LTE network incorporating both TD & FDD LTE accesses, with most of the LTE CAPEX supporting both TD & FDD LTE services (incl. infrastructure, towers & core network…) & flexible deployment of more spectrum resources for enhanced return
LTE deployment starts from hotspots in densely populated areas of the cities
To overlay on existing superior nationwide 3G & high-speed fibre broadband networks to provide customers with high-speed & seamless data service experience
Launched LTE services in nearly 100 major cities in mid-Feb 2014, with the first batch of 4G data devices all compatible with TD-LTE
Currently applying for LTE-FDD trial licence while expanding width & depth of LTE network coverage in major cities to create superior network quality & accelerating e-Surfing 4G handset value chain development to assure superior 4G handset service experience & investment return in future
One hybrid LTE network of integrated resources to boost investment return & operating efficiency
10 | 2013 Annual Results
Increase Dividend to Enhance Shareholders’ Return
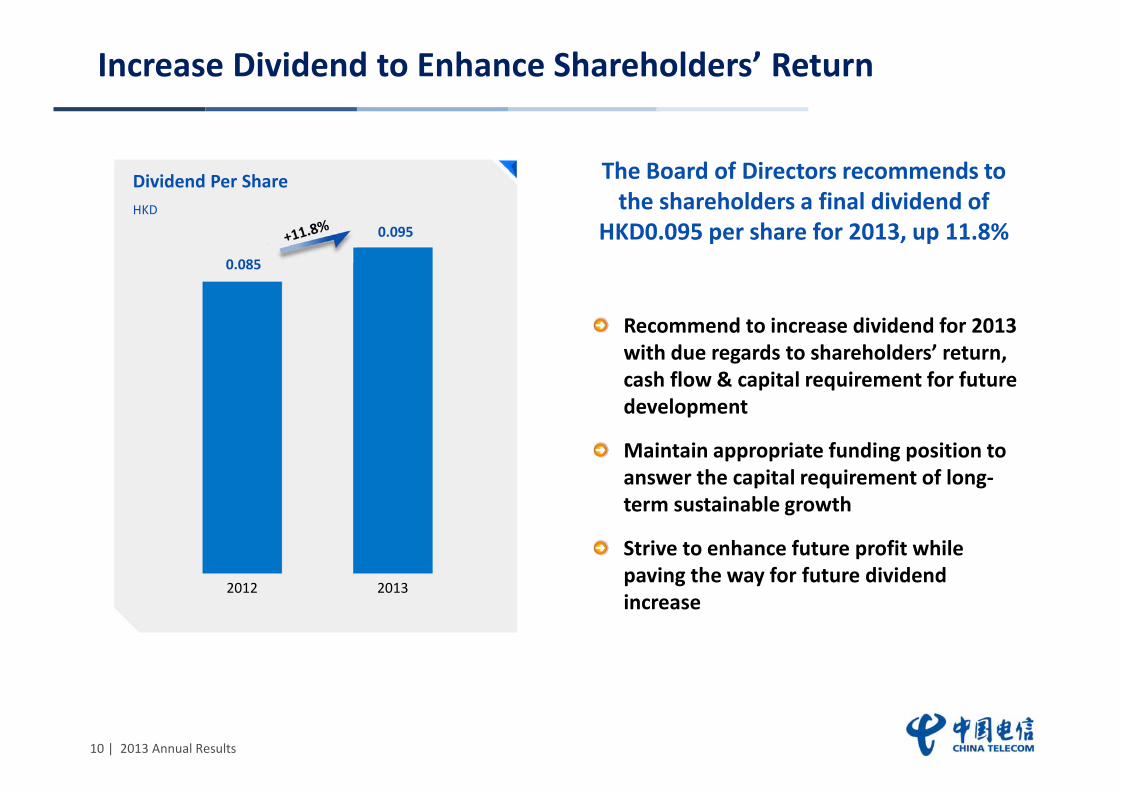
Recommend to increase dividend for 2013 with due regards to shareholders’ return, cash flow & capital requirement for future development
Maintain appropriate funding position to answer the capital requirement of long-term sustainable growth
Strive to enhance future profit while paving the way for future dividend increase
The Board of Directors recommends to the shareholders a final dividend of
HKD0.095 per share for 2013, up 11.8%
Dividend Per ShareHKD
0.085
0.095
2012 2013
11 | 2013 Annual Results
To Deepen Comprehensive Reform to Enhance Efficiency & Return
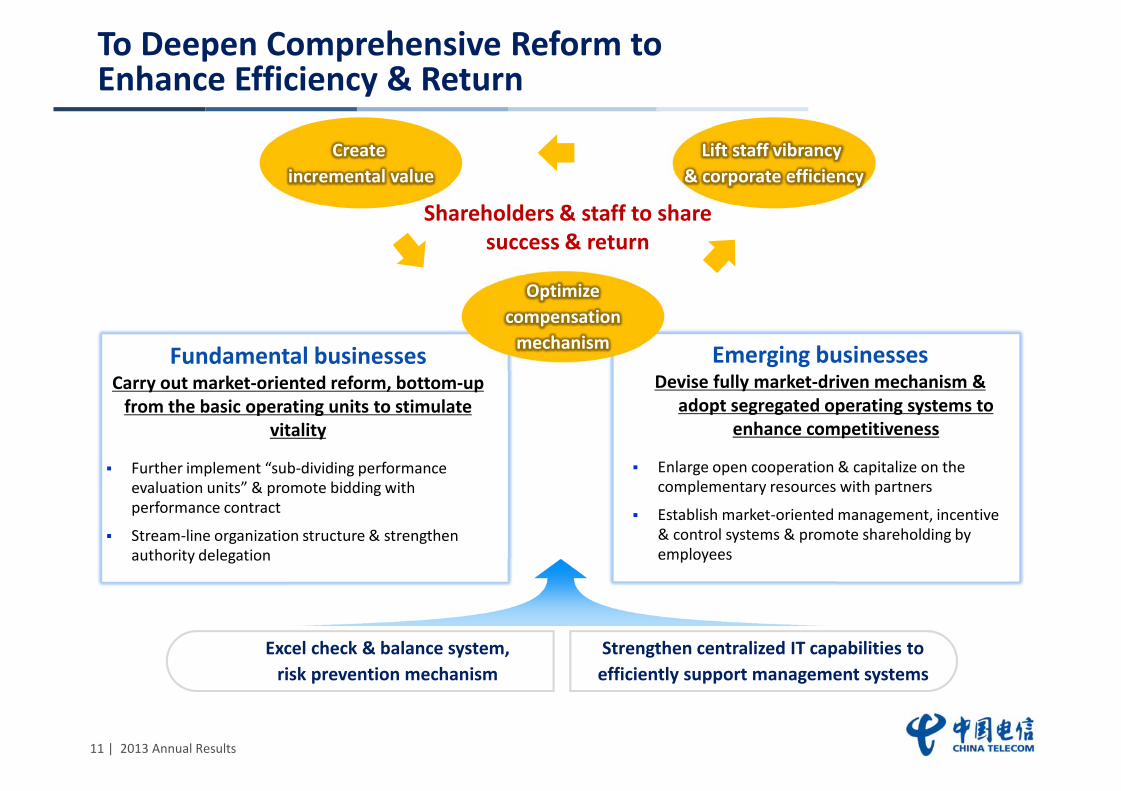
Optimize compensation
mechanism
Create incremental value
Lift staff vibrancy & corporate efficiency
Fundamental businessesCarry out market-oriented reform, bottom-up
from the basic operating units to stimulate vitality
Further implement “sub-dividing performance evaluation units” & promote bidding with performance contract
Stream-line organization structure & strengthen authority delegation
Emerging businessesDevise fully market-driven mechanism &
adopt segregated operating systems to enhance competitiveness
Enlarge open cooperation & capitalize on the complementary resources with partners
Establish market-oriented management, incentive & control systems & promote shareholding by employees
Shareholders & staff to share success & return
Strengthen centralized IT capabilities to efficiently support management systems
Excel check & balance system,risk prevention mechanism
12 | 2013 Annual Results
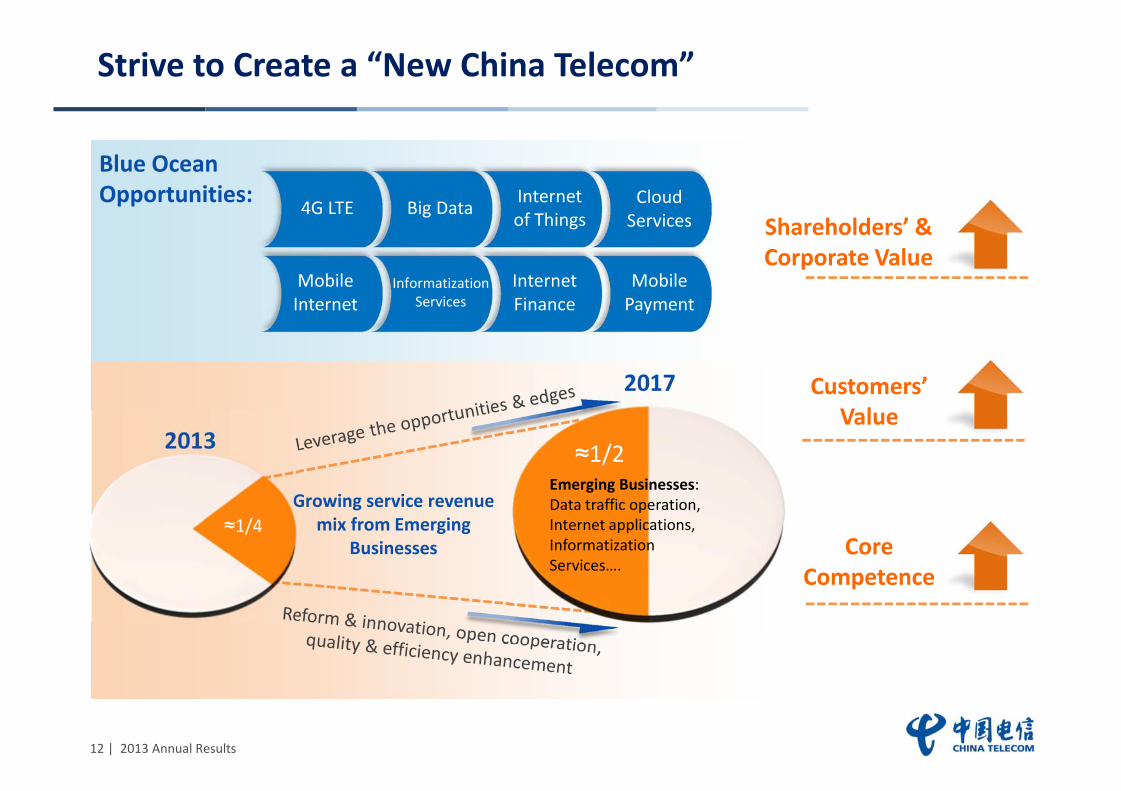
Strive to Create a “New China Telecom”
Growing service revenue mix from Emerging
Businesses
2013
2017
Blue OceanOpportunities:
InformatizationServices
Mobile Payment
Cloud Services
Internet of Things4G LTE
Mobile Internet
Big Data
Internet Finance
Core Competence
Customers’ Value
Shareholders’ & Corporate Value
≈1/4
≈1/2Emerging Businesses: Data traffic operation,Internet applications,InformatizationServices….
13 | 2013 Annual Results
Business Review
Financial Performance
2.
3.
Overview1.
14 | 2013 Annual Results
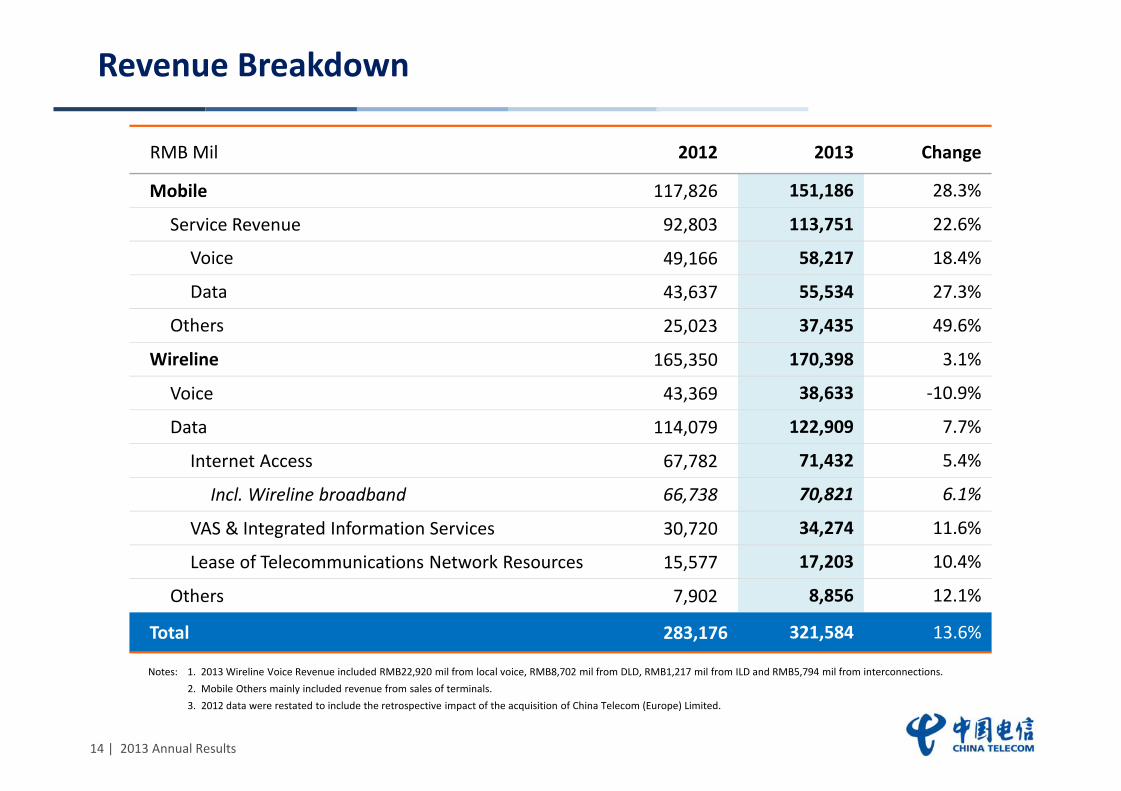
Revenue Breakdown
Notes: 1. 2013 Wireline Voice Revenue included RMB22,920 mil from local voice, RMB8,702 mil from DLD, RMB1,217 mil from ILD and RMB5,794 mil from interconnections.2. Mobile Others mainly included revenue from sales of terminals.3. 2012 data were restated to include the retrospective impact of the acquisition of China Telecom (Europe) Limited.
RMB Mil 2012 2013 Change
Mobile 117,826 151,186 28.3%
Service Revenue 92,803 113,751 22.6%
Voice 49,166 58,217 18.4%
Data 43,637 55,534 27.3%
Others 25,023 37,435 49.6%
Wireline 165,350 170,398 3.1%
Voice 43,369 38,633 -10.9%
Data 114,079 122,909 7.7%
Internet Access 67,782 71,432 5.4%
Incl. Wireline broadband 66,738 70,821 6.1%
VAS & Integrated Information Services 30,720 34,274 11.6%
Lease of Telecommunications Network Resources 15,577 17,203 10.4%
Others 7,902 8,856 12.1%
Total 283,176 321,584 13.6%
15 | 2013 Annual Results
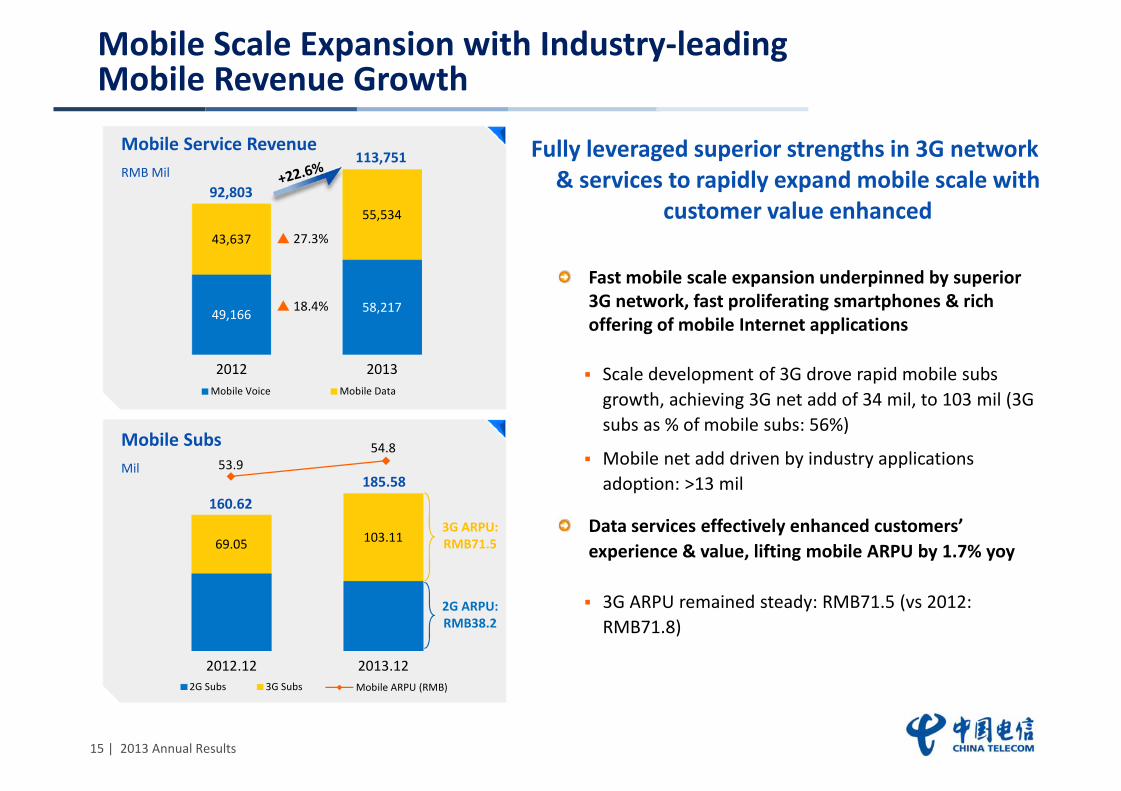
53.954.8
Mobile ARPU (RMB)
69.05 103.11
2012.12 2013.122G Subs 3G Subs
Mobile Scale Expansion with Industry-leading Mobile Revenue Growth
Mobile SubsMil
49,166 58,217
43,637
55,534
2012 2013Mobile Voice Mobile Data
Mobile Service RevenueRMB Mil
113,751
92,803
Fast mobile scale expansion underpinned by superior 3G network, fast proliferating smartphones & rich offering of mobile Internet applications
Scale development of 3G drove rapid mobile subs growth, achieving 3G net add of 34 mil, to 103 mil (3G subs as % of mobile subs: 56%)
Mobile net add driven by industry applications adoption: >13 mil
Data services effectively enhanced customers’ experience & value, lifting mobile ARPU by 1.7% yoy
3G ARPU remained steady: RMB71.5 (vs 2012: RMB71.8)
Fully leveraged superior strengths in 3G network & services to rapidly expand mobile scale with
customer value enhanced
185.58160.62
27.3%
18.4%
3G ARPU:RMB71.5
2G ARPU:RMB38.2
16 | 2013 Annual Results
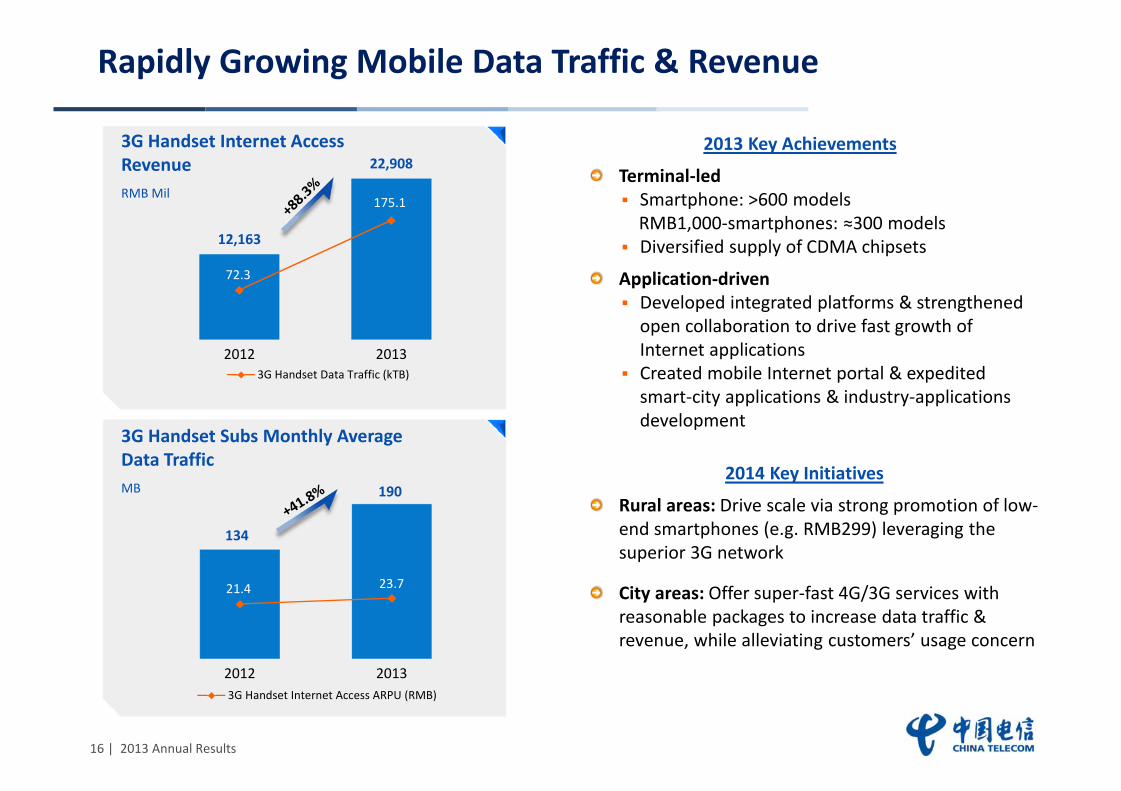
3G Handset Subs Monthly Average Data TrafficMB
12,163
22,908
72.3
175.1
2012 20133G Handset Data Traffic (kTB)
Rapidly Growing Mobile Data Traffic & Revenue
3G Handset Internet Access RevenueRMB Mil
2013 Key Achievements
Terminal-ledSmartphone: >600 modelsRMB1,000-smartphones: ≈300 modelsDiversified supply of CDMA chipsets
Application-drivenDeveloped integrated platforms & strengthened open collaboration to drive fast growth of Internet applications Created mobile Internet portal & expedited smart-city applications & industry-applications development
134
190
21.4 23.7
2012 20133G Handset Internet Access ARPU (RMB)
2014 Key Initiatives
Rural areas: Drive scale via strong promotion of low-end smartphones (e.g. RMB299) leveraging the superior 3G network
City areas: Offer super-fast 4G/3G services with reasonable packages to increase data traffic & revenue, while alleviating customers’ usage concern
17 | 2013 Annual Results
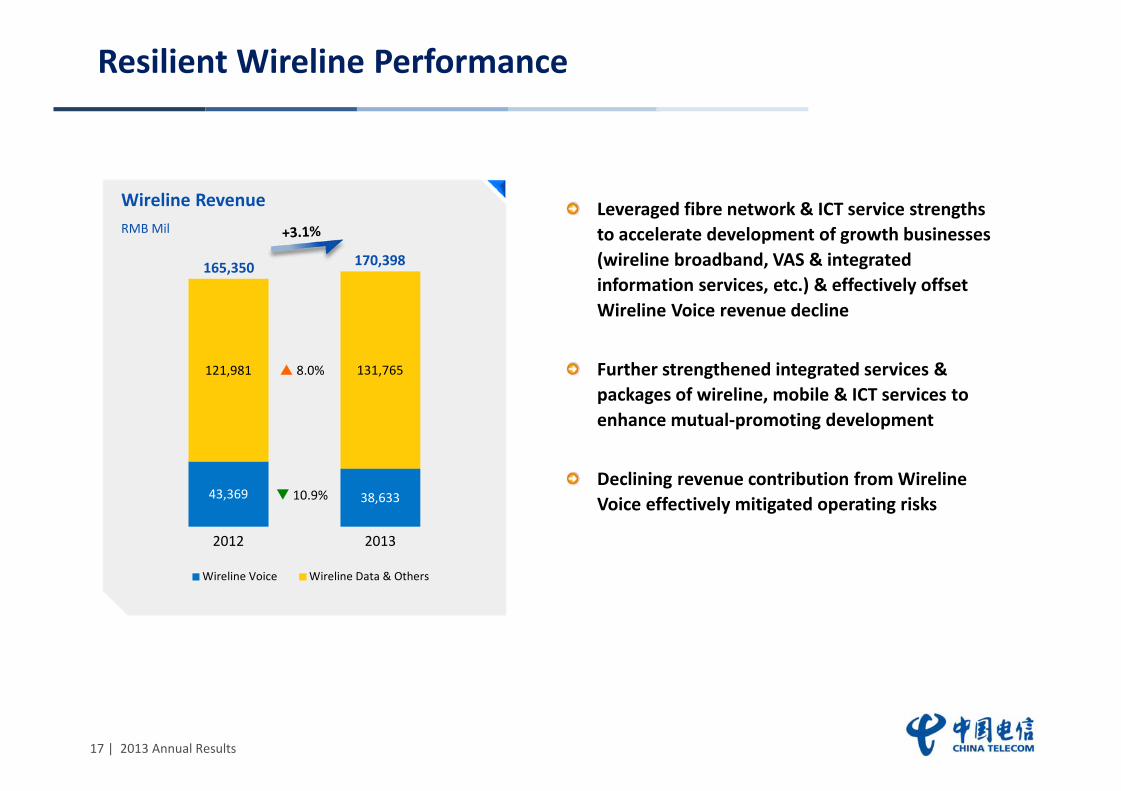
Resilient Wireline Performance
43,369 38,633
121,981 131,765
2012 2013
Wireline Voice Wireline Data & Others
Wireline RevenueRMB Mil
Leveraged fibre network & ICT service strengths to accelerate development of growth businesses (wireline broadband, VAS & integrated information services, etc.) & effectively offset Wireline Voice revenue decline
Further strengthened integrated services & packages of wireline, mobile & ICT services to enhance mutual-promoting development
Declining revenue contribution from WirelineVoice effectively mitigated operating risks
170,398165,350
8.0%
10.9%
18 | 2013 Annual Results
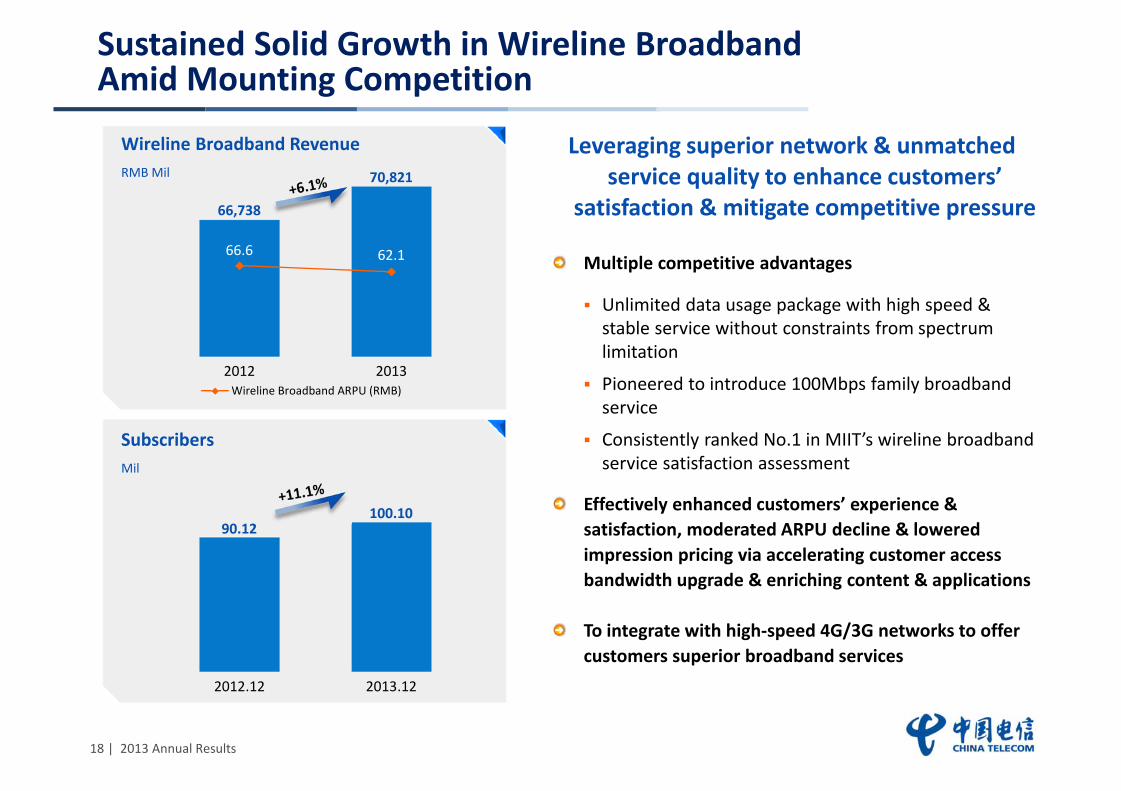
Sustained Solid Growth in Wireline BroadbandAmid Mounting Competition
SubscribersMil
Wireline Broadband RevenueRMB Mil
Multiple competitive advantages
Unlimited data usage package with high speed & stable service without constraints from spectrum limitation
Pioneered to introduce 100Mbps family broadband service
Consistently ranked No.1 in MIIT’s wireline broadband service satisfaction assessment
Effectively enhanced customers’ experience & satisfaction, moderated ARPU decline & lowered impression pricing via accelerating customer access bandwidth upgrade & enriching content & applications
To integrate with high-speed 4G/3G networks to offer customers superior broadband services
Leveraging superior network & unmatched service quality to enhance customers’
satisfaction & mitigate competitive pressure66.6 62.1
2012 2013Wireline Broadband ARPU (RMB)
2012.12 2013.12
70,821
66,738
100.1090.12
19 | 2013 Annual Results
2012 2013
8,839
5,923
1,728
10,561
7,801
2,782
ICT IDC iTV2012 2013
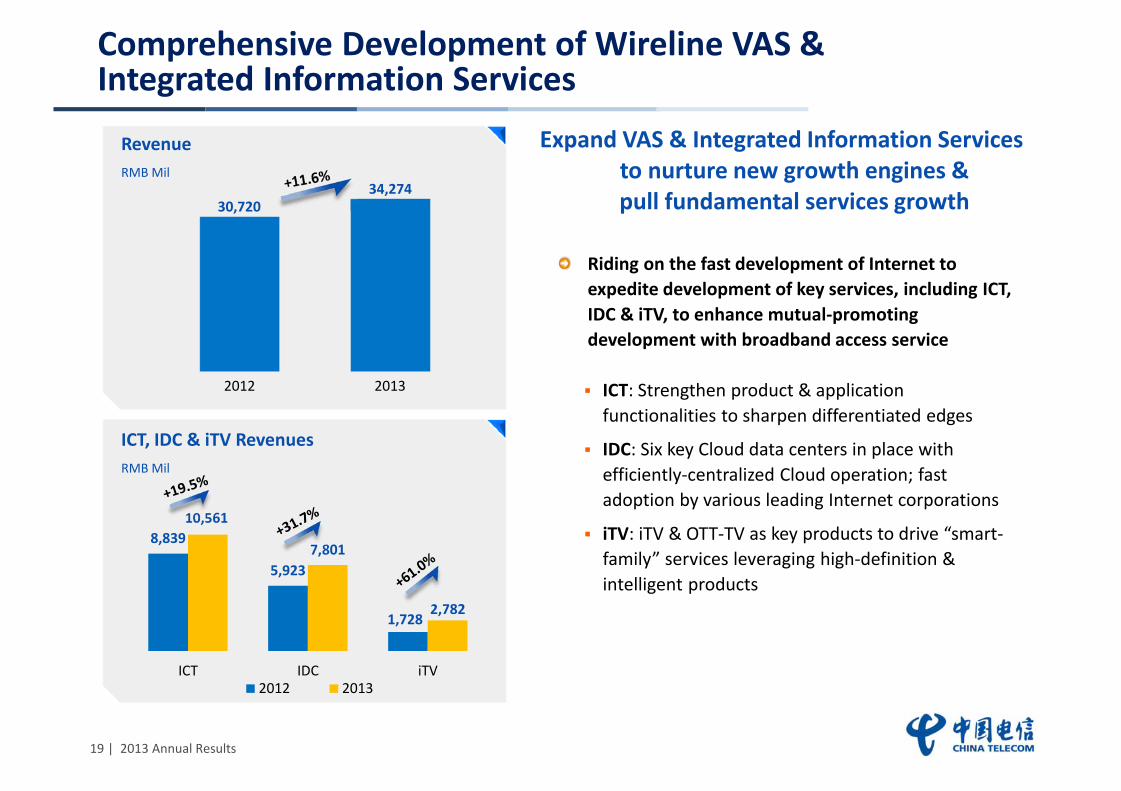
Comprehensive Development of Wireline VAS & Integrated Information Services
ICT, IDC & iTV RevenuesRMB Mil
RevenueRMB Mil
Riding on the fast development of Internet to expedite development of key services, including ICT, IDC & iTV, to enhance mutual-promoting development with broadband access service
ICT: Strengthen product & application functionalities to sharpen differentiated edges
IDC: Six key Cloud data centers in place with efficiently-centralized Cloud operation; fast adoption by various leading Internet corporations
iTV: iTV & OTT-TV as key products to drive “smart-family” services leveraging high-definition & intelligent products
Expand VAS & Integrated Information Services to nurture new growth engines & pull fundamental services growth34,274
30,720
20 | 2013 Annual Results
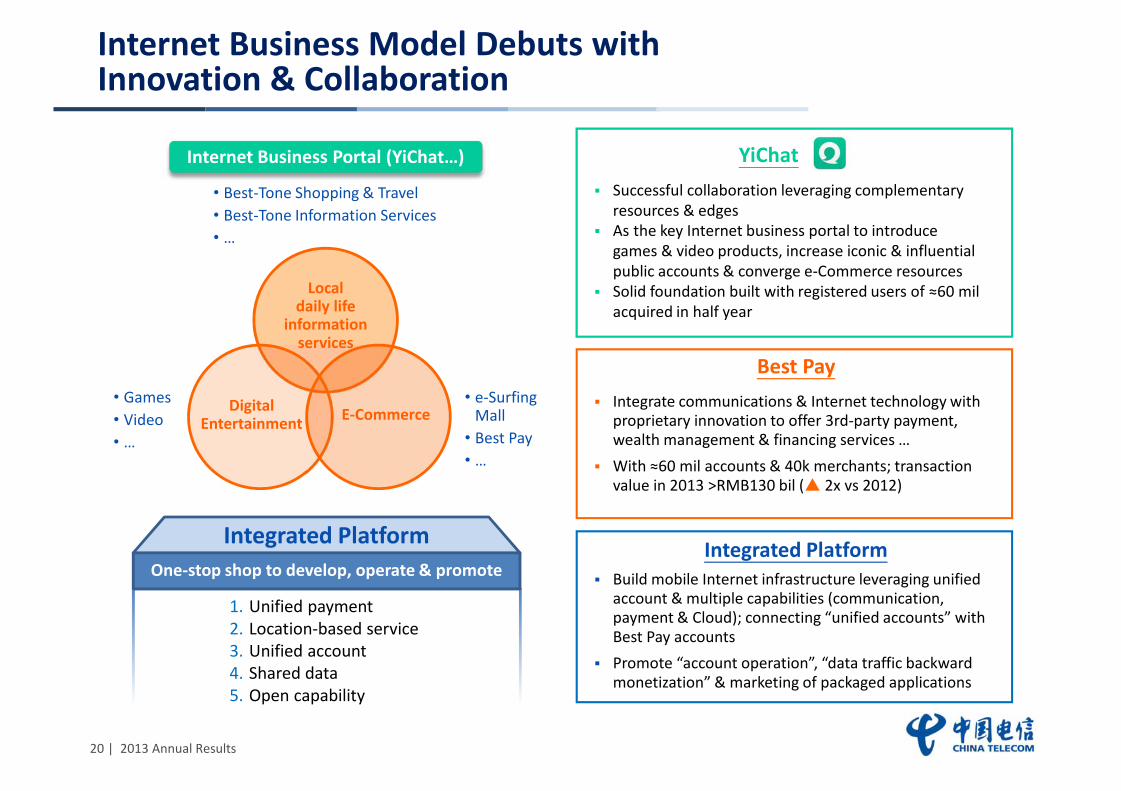
Internet Business Model Debuts with Innovation & Collaboration
Internet Business Portal (YiChat…)
E-CommerceDigitalEntertainment
• Best-Tone Shopping & Travel• Best-Tone Information Services• …
• e-SurfingMall• Best Pay• …
• Games• Video• …
1. Unified payment2. Location-based service3. Unified account4. Shared data5. Open capability
Integrated PlatformOne-stop shop to develop, operate & promote
Successful collaboration leveraging complementary resources & edgesAs the key Internet business portal to introducegames & video products, increase iconic & influentialpublic accounts & converge e-Commerce resourcesSolid foundation built with registered users of ≈60 mil acquired in half year
Integrate communications & Internet technology with proprietary innovation to offer 3rd-party payment, wealth management & financing services …With ≈60 mil accounts & 40k merchants; transaction value in 2013 >RMB130 bil ( 2x vs 2012)
Build mobile Internet infrastructure leveraging unified account & multiple capabilities (communication, payment & Cloud); connecting “unified accounts” with Best Pay accountsPromote “account operation”, “data traffic backward monetization” & marketing of packaged applications
Best Pay
Integrated Platform
Localdaily life
informationservices
YiChat
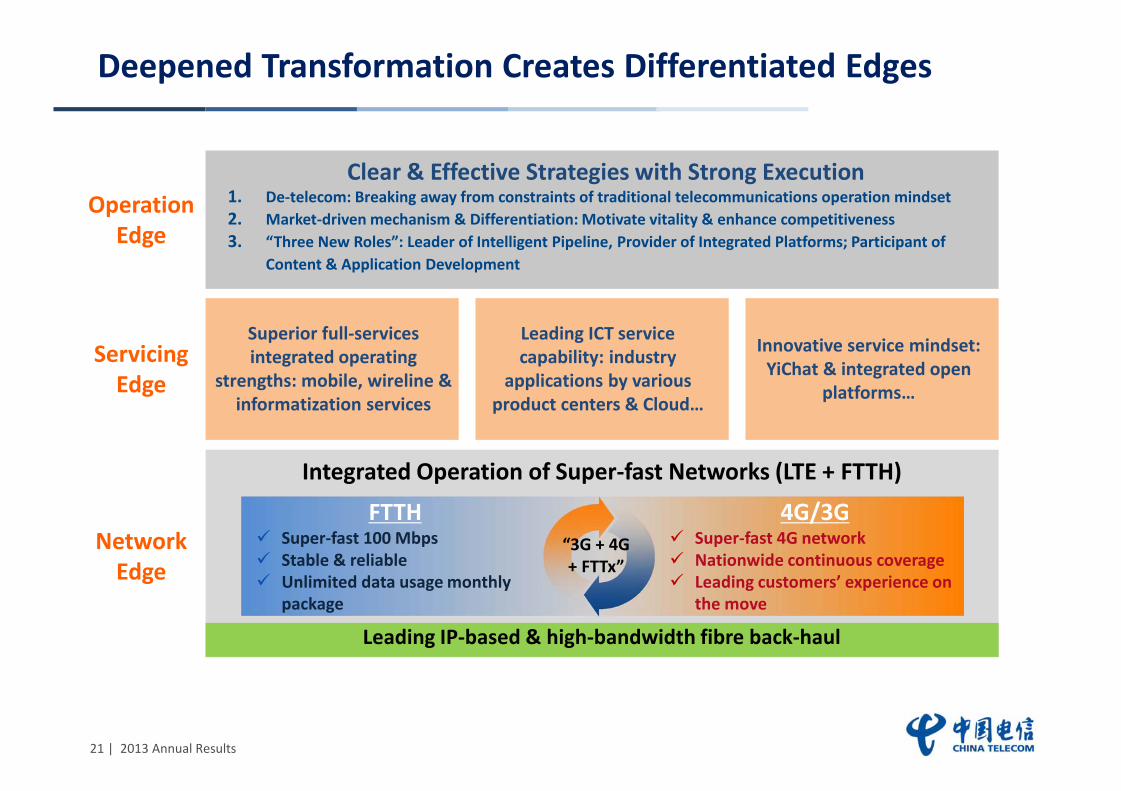
21 | 2013 Annual Results
Leading ICT service capability: industry
applications by various product centers & Cloud…
Superior full-services integrated operating
strengths: mobile, wireline & informatization services
Innovative service mindset:YiChat & integrated open
platforms…
Leading IP-based & high-bandwidth fibre back-haul
4G/3GSuper-fast 4G networkNationwide continuous coverageLeading customers’ experience on the move
“3G + 4G + FTTx”
Clear & Effective Strategies with Strong Execution1. De-telecom: Breaking away from constraints of traditional telecommunications operation mindset2. Market-driven mechanism & Differentiation: Motivate vitality & enhance competitiveness3. “Three New Roles”: Leader of Intelligent Pipeline, Provider of Integrated Platforms; Participant of
Content & Application Development
Integrated Operation of Super-fast Networks (LTE + FTTH)
FTTHSuper-fast 100 MbpsStable & reliableUnlimited data usage monthly package
Deepened Transformation Creates Differentiated Edges
Operation Edge
Servicing Edge
Network Edge
22 | 2013 Annual Results
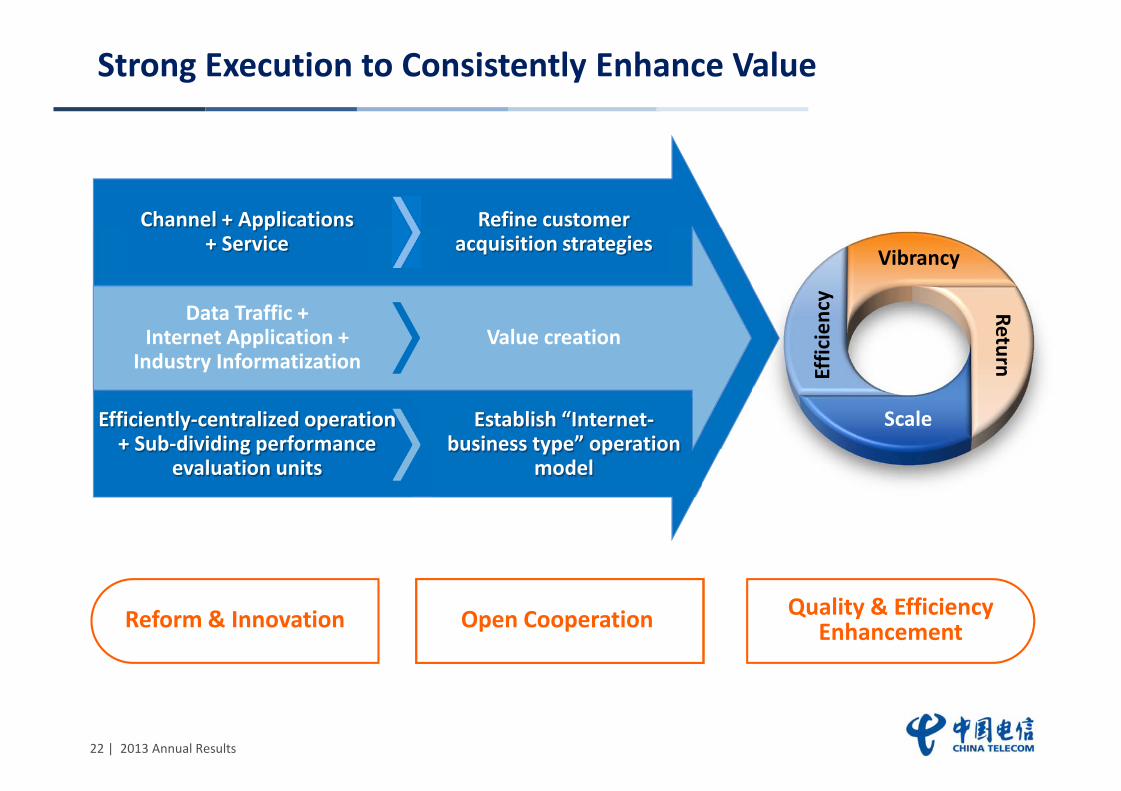
Strong Execution to Consistently Enhance Value
Data Traffic +Internet Application +
Industry InformatizationValue creation
Channel + Applications+ Service
Refine customeracquisition strategies
Efficiently-centralized operation+ Sub-dividing performance
evaluation units
Establish “Internet-business type” operation
model
Open Cooperation Quality & EfficiencyEnhancementReform & Innovation Open Cooperation
Vibrancy
Return
Effic
ienc
y
Scale
23 | 2013 Annual Results
Business Review
Financial Performance
2.
3.
Overview1.
24 | 2013 Annual Results
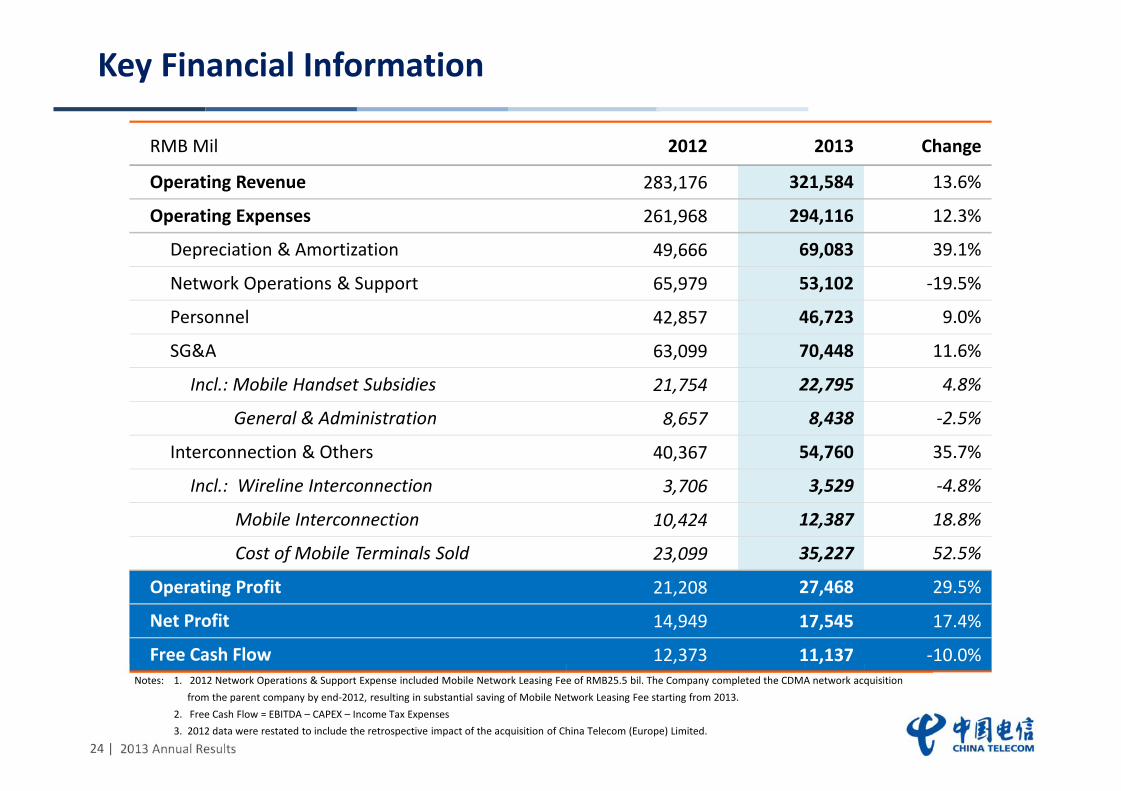
Key Financial Information
RMB Mil 2012 2013 Change
Operating Revenue 283,176 321,584 13.6%
Operating Expenses 261,968 294,116 12.3%
Depreciation & Amortization 49,666 69,083 39.1%
Network Operations & Support 65,979 53,102 -19.5%
Personnel 42,857 46,723 9.0%
SG&A 63,099 70,448 11.6%
Incl.: Mobile Handset Subsidies 21,754 22,795 4.8%
General & Administration 8,657 8,438 -2.5%
Interconnection & Others 40,367 54,760 35.7%
Incl.: Wireline Interconnection 3,706 3,529 -4.8%
Mobile Interconnection 10,424 12,387 18.8%
Cost of Mobile Terminals Sold 23,099 35,227 52.5%
Operating Profit 21,208 27,468 29.5%
Net Profit 14,949 17,545 17.4%
Free Cash Flow 12,373 11,137 -10.0%Notes: 1. 2012 Network Operations & Support Expense included Mobile Network Leasing Fee of RMB25.5 bil. The Company completed the CDMA network acquisition
from the parent company by end-2012, resulting in substantial saving of Mobile Network Leasing Fee starting from 2013.2. Free Cash Flow = EBITDA – CAPEX – Income Tax Expenses3. 2012 data were restated to include the retrospective impact of the acquisition of China Telecom (Europe) Limited.
25 | 2013 Annual Results
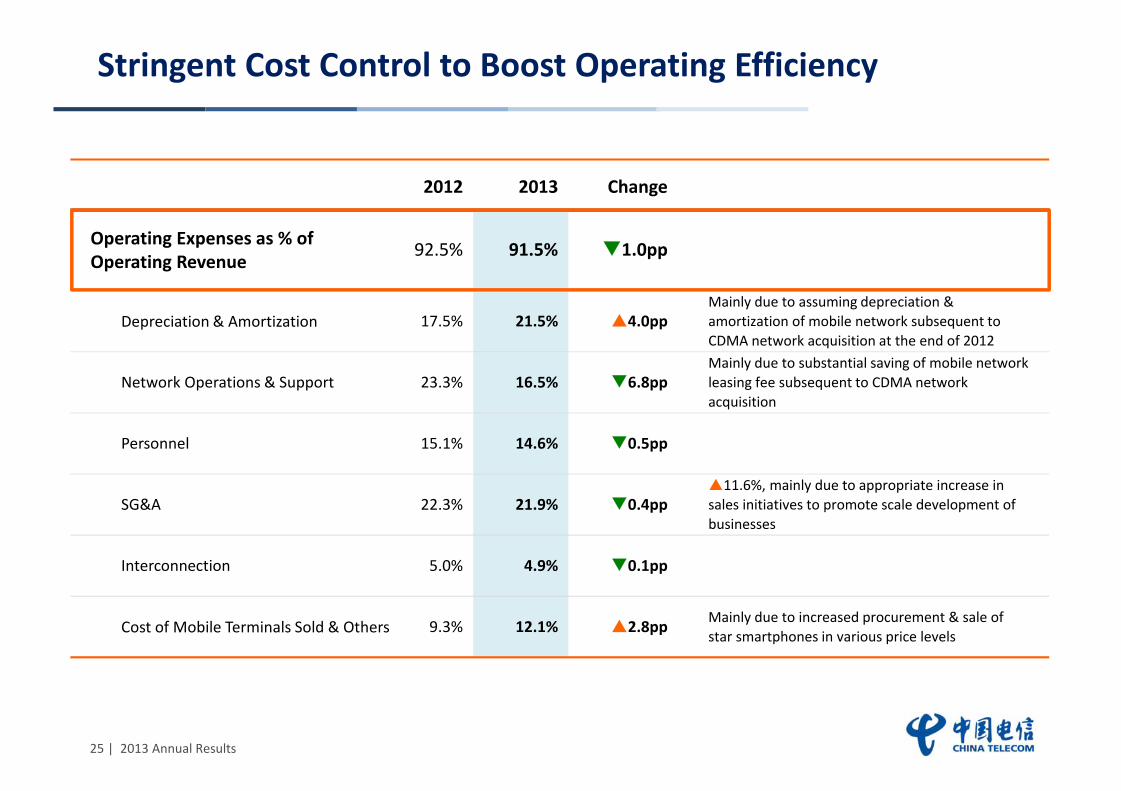
Stringent Cost Control to Boost Operating Efficiency
2012 2013 Change
Operating Expenses as % of Operating Revenue 92.5% 91.5% 1.0pp
Depreciation & Amortization 17.5% 21.5% 4.0ppMainly due to assuming depreciation & amortization of mobile network subsequent to CDMA network acquisition at the end of 2012
Network Operations & Support 23.3% 16.5% 6.8ppMainly due to substantial saving of mobile network leasing fee subsequent to CDMA network acquisition
Personnel 15.1% 14.6% 0.5pp
SG&A 22.3% 21.9% 0.4pp11.6%, mainly due to appropriate increase in
sales initiatives to promote scale development of businesses
Interconnection 5.0% 4.9% 0.1pp
Cost of Mobile Terminals Sold & Others 9.3% 12.1% 2.8pp Mainly due to increased procurement & sale of star smartphones in various price levels
26 | 2013 Annual Results
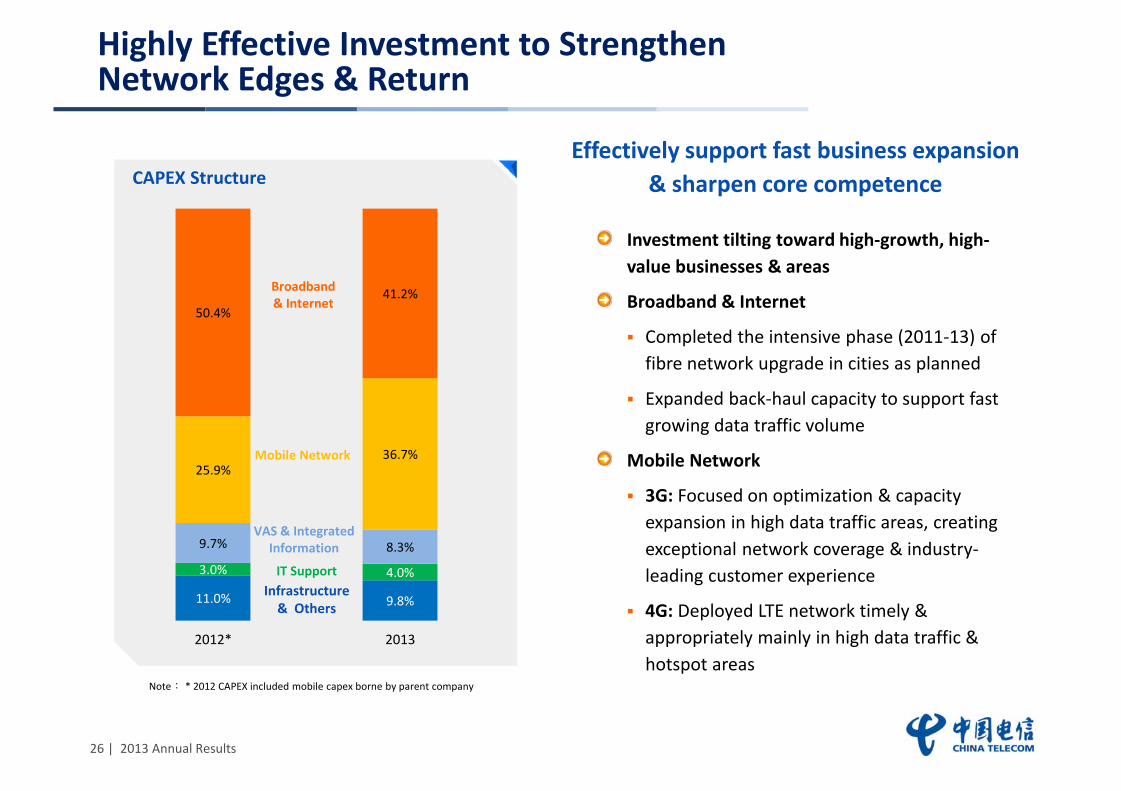
Highly Effective Investment to Strengthen Network Edges & Return
Investment tilting toward high-growth, high-value businesses & areas
Broadband & Internet
Completed the intensive phase (2011-13) of fibre network upgrade in cities as planned
Expanded back-haul capacity to support fast growing data traffic volume
Mobile Network
3G: Focused on optimization & capacity expansion in high data traffic areas, creating exceptional network coverage & industry-leading customer experience
4G: Deployed LTE network timely & appropriately mainly in high data traffic & hotspot areas
Effectively support fast business expansion & sharpen core competenceCAPEX Structure
11.0% 9.8%
3.0% 4.0%
9.7% 8.3%
25.9%36.7%
50.4%41.2%
2012* 2013
Infrastructure & Others
IT Support
VAS & Integrated Information
Mobile Network
Broadband & Internet
Note: * 2012 CAPEX included mobile capex borne by parent company
27 | 2013 Annual Results
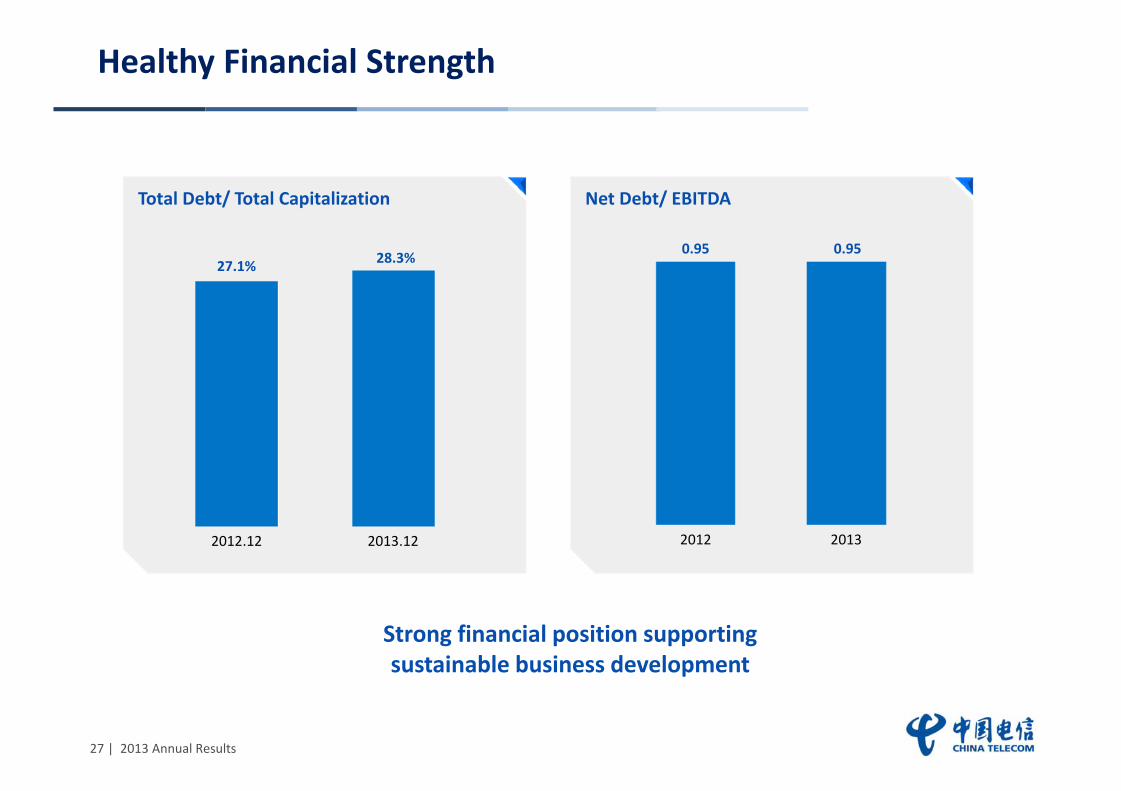
0.95 0.95
2012 2013
27.1% 28.3%
2012.12 2013.12
Healthy Financial Strength
Total Debt/ Total Capitalization
Strong financial position supporting sustainable business development
Net Debt/ EBITDA
28 | 2013 Annual Results
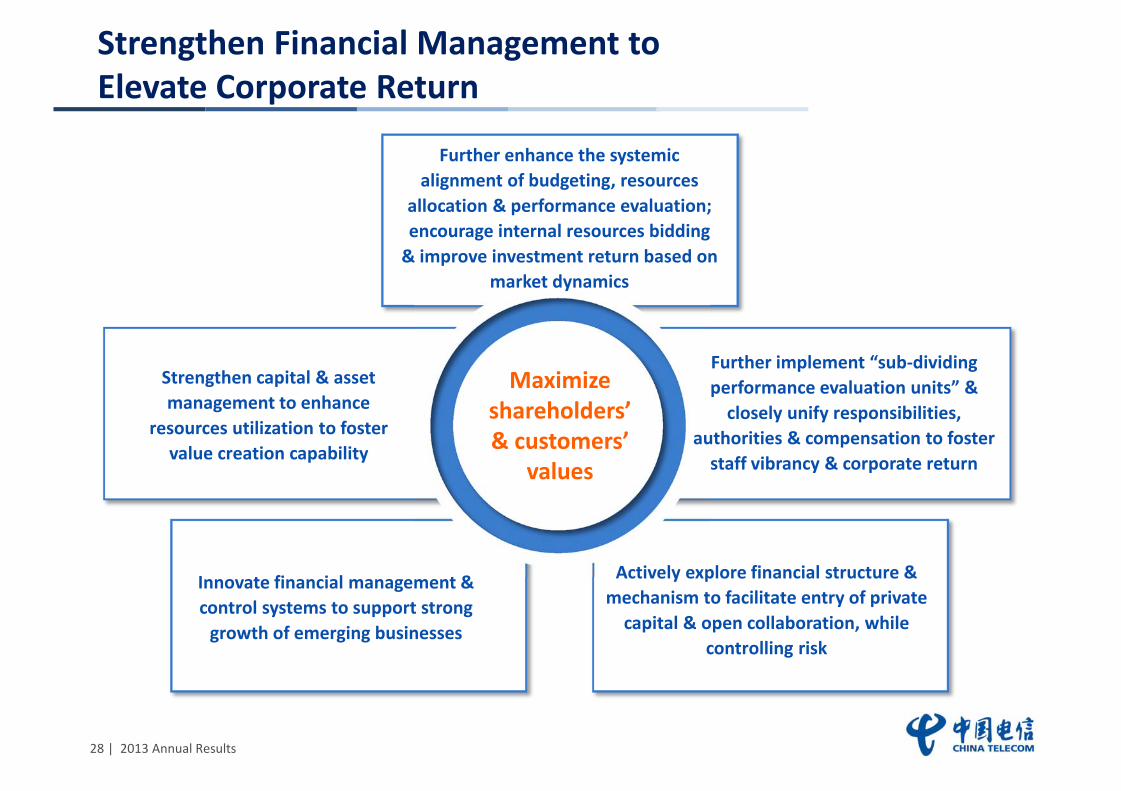
Strengthen Financial Management to Elevate Corporate Return
Innovate financial management & control systems to support strong
growth of emerging businesses
Further enhance the systemic alignment of budgeting, resources
allocation & performance evaluation; encourage internal resources bidding
& improve investment return based on market dynamics
Strengthen capital & asset management to enhance
resources utilization to foster value creation capability
Further implement “sub-dividing performance evaluation units” &
closely unify responsibilities, authorities & compensation to foster
staff vibrancy & corporate return
Actively explore financial structure & mechanism to facilitate entry of private
capital & open collaboration, while controlling risk
Maximize shareholders’ & customers’
values

“No. 1 Overall Best Managed Company
in Asia 2013”
“No. 1 Asia’s Most Honored
Company 2013”
“No. 1 Asia’s Overall Best Managed
Company 2014”
For further information & enquiries, please contact our Investor Relations Department at [email protected] or visit www.chinatelecom-h.com
Institutional Investor 2013
30 | 2013 Annual Results
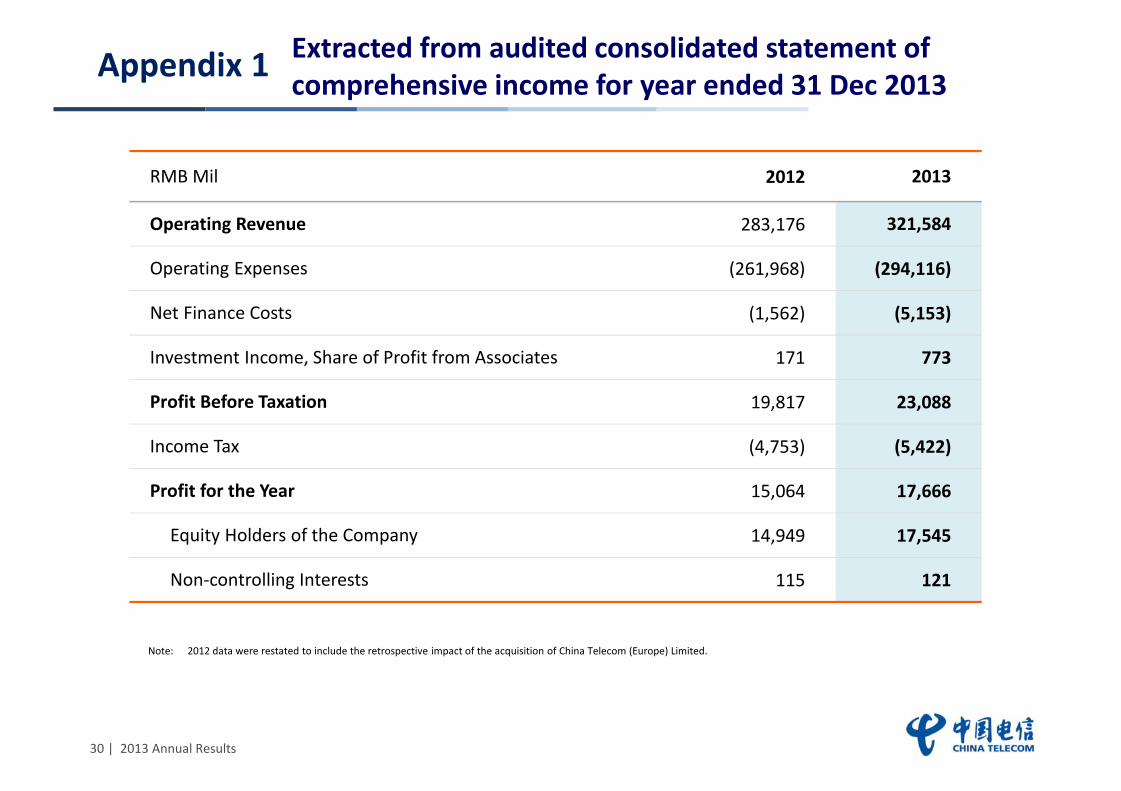
Appendix 1 Extracted from audited consolidated statement of comprehensive income for year ended 31 Dec 2013
Note: 2012 data were restated to include the retrospective impact of the acquisition of China Telecom (Europe) Limited.
RMB Mil 2012 2013
Operating Revenue 283,176 321,584
Operating Expenses (261,968) (294,116)
Net Finance Costs (1,562) (5,153)
Investment Income, Share of Profit from Associates 171 773
Profit Before Taxation 19,817 23,088
Income Tax (4,753) (5,422)
Profit for the Year 15,064 17,666
Equity Holders of the Company 14,949 17,545
Non-controlling Interests 115 121
31 | 2013 Annual Results
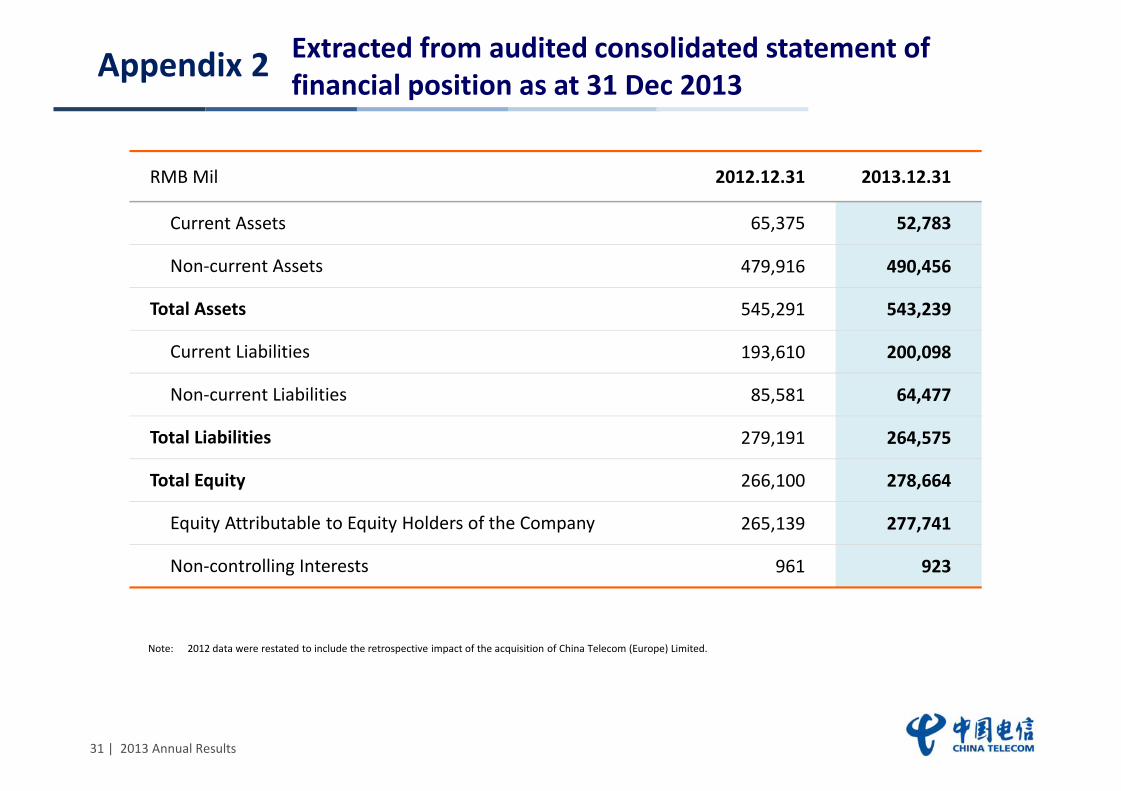
Appendix 2
Note: 2012 data were restated to include the retrospective impact of the acquisition of China Telecom (Europe) Limited.
Extracted from audited consolidated statement of financial position as at 31 Dec 2013
RMB Mil 2012.12.31 2013.12.31
Current Assets 65,375 52,783
Non-current Assets 479,916 490,456
Total Assets 545,291 543,239
Current Liabilities 193,610 200,098
Non-current Liabilities 85,581 64,477
Total Liabilities 279,191 264,575
Total Equity 266,100 278,664
Equity Attributable to Equity Holders of the Company 265,139 277,741
Non-controlling Interests 961 923
32 | 2013 Annual Results
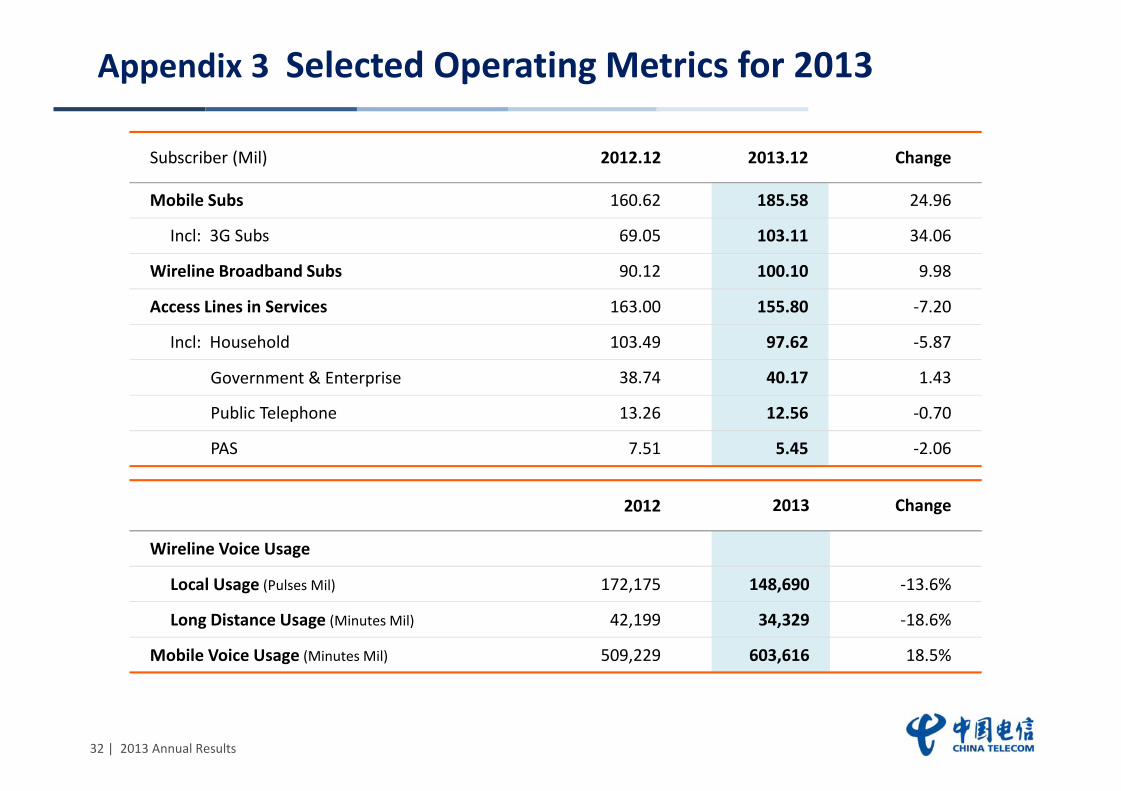
Appendix 3 Selected Operating Metrics for 2013
Subscriber (Mil) 2012.12 2013.12 Change
Mobile Subs 160.62 185.58 24.96
Incl: 3G Subs 69.05 103.11 34.06
Wireline Broadband Subs 90.12 100.10 9.98
Access Lines in Services 163.00 155.80 -7.20
Incl: Household 103.49 97.62 -5.87
Government & Enterprise 38.74 40.17 1.43
Public Telephone 13.26 12.56 -0.70
PAS 7.51 5.45 -2.06
2012 2013 Change
Wireline Voice Usage
Local Usage (Pulses Mil) 172,175 148,690 -13.6%
Long Distance Usage (Minutes Mil) 42,199 34,329 -18.6%
Mobile Voice Usage (Minutes Mil) 509,229 603,616 18.5%