Embed Size (px)
Citation preview

ChrematisticsChrematisticsChrematisticsChrematistics WORKING PAPERS IN FINANCEWORKING PAPERS IN FINANCEWORKING PAPERS IN FINANCEWORKING PAPERS IN FINANCE
SCHOOL OF SCHOOL OF SCHOOL OF SCHOOL OF ACCOUNTING, ACCOUNTING, ACCOUNTING, ACCOUNTING, ECONOMICS & FINANCEECONOMICS & FINANCEECONOMICS & FINANCEECONOMICS & FINANCE, , , ,
UNIVERSITY OF KWAZULUUNIVERSITY OF KWAZULUUNIVERSITY OF KWAZULUUNIVERSITY OF KWAZULU----NATALNATALNATALNATAL
Financial Management in NonFinancial Management in NonFinancial Management in NonFinancial Management in Non----Profit Organisations: Profit Organisations: Profit Organisations: Profit Organisations:
An Exploratory StudyAn Exploratory StudyAn Exploratory StudyAn Exploratory Study
Barry Strydom* And
Tim Stephen
Working Paper No. 0Working Paper No. 0Working Paper No. 0Working Paper No. 03333----2012201220122012 * Corresponding author: Barry Strydom
School of Accounting, Economics & Finance
University of KwaZulu-Natal
Tel. (+27)33-2605794 Fax. (+27)33-2606051
Copyright reserved.

Demographic Factors Affecting Subjective Financial Risk Tolerance:
South African Evidence
Barry Strydom1 and Tim Stephen
2
July 2012
Abstract
The recent financial crisis has resulted in a sharp decline in donor funding causing severe
financial difficulties for many non-profit organisations (NPO). This study examines
whether or not NPOs employ sound financial management practices and whether the use of
financial management practices has affected non-profit organisations’ ability to survive the
difficult economic climate. A survey was conducted of a sample of NPOs located in
Pietermaritzburg. The study finds that the majority of NPOs surveyed utilise recommended
financial management principles but that there is no statistical relationship between their
use and the experience of financial distress. It is found that having sufficient reserves and
the existence of a separate finance committee are significant related to the absence of
financial distress. Further we find evidence to suggest that the size and age of the NPO as
well as the experience of its financial manager are significant factors in whether or not
financial distress is experienced.
Keywords: Non-profit organizations, financial management, budgeting, cash management,
financial distress
1 Barry Strydom is Senior Lecturer in the School of Accounting, Economics & Finance, University of
Kwazulu-Natal, South Africa. 2 Tim Stephen is a post-graduate student in the School of Accounting, Economics & Finance, University of
Kwazulu-Natal, South Africa.
.

Demographic Factors Affecting Subjective Financial Risk Tolerance: A South African Survey
1
1. INTRODUCTION
Globally the importance of non-profit organizations (NPOs) in economic and social
development has grown with a major shift in development funding occurring from
government agencies to non-government organizations (NGOs) (Goddard and Assad, 2006:
377). NPOs have a key role to play in tackling the monumental challenge of social
development in South Africa (Conradie, 1999: 291). The NPO sector in South Africa is
substantial with 56 237 registered NPOs in 2009 (Department of Social Development, 2009:
7) and total income in 2004 estimated at R14 billion (Department of Social Development,
2005: 30). A 2002 Johns Hopkins report on the size and scope of the non-profit sector in
South Africa found that in combating poverty NPOs made a significant positive impact at a
community level due to their ability to respond quickly and efficiently to problems at a
community level (Department of Social Development, 2005: 30). The importance of NPOs,
however, is especially felt when they get into financial difficulty and are forced to cease
operations with the associated detrimental effect on those who have benefited from their
work and those who work with the organization (Conradie, 1999: 291).
Due to their reliance on external funding, NPOs are likely to encounter serious capacity
problems as a result of a decline in social welfare spending (LeRoux, 2005: 351). The recent
financial crisis has resulted in just such a sharp decline in donor funding presenting severe
financial challenges for many NPOs. Financial management is critical for the economic
sustainability of an NPO (Pajas and Vilain, 2004: 342) and the current reduction in available
funding has highlighted the importance of financial management for the sustainability of
NPOs in a difficult economic environment (York, 2009: 1). Grønbjerg et al. (2007: 7),
however, report that financial management is one of the most challenging areas that managers
of NPOs have to deal with. Relatively little research has been conducted on the financial
management of NPOs, particularly in South Africa. This study seeks to provide a starting
point for the possibility of investigating the management of NPOs by exploring the
possibilities for research in this important area. This paper thus seeks to investigate the extent
to which NPOs in the Pietermaritzburg area apply recommended financial management
practices, the impact that the financial crisis has had on them and whether or not a
relationship exists between the NPOs’ application of sound financial management and their
financial vulnerability.

Demographic Factors Affecting Subjective Financial Risk Tolerance: A South African Survey
2
2 FINANCIAL MANAGEMENT AND NPOs
2.1 The Goal of Financial Management
The generally accepted goal of for-profit financial management is maximising shareholder
wealth through increasing the share price of the company. Typically, this involves
maximising risk-adjusted profits through increasing revenues or reducing costs or both
(Zietlow, Hankin and Seidner, 2007: 11). In the context of an NPO which does not have
shareholders and which has as its goal delivering services to those in need, rather than
making profits, the standard model of financial management is clearly not appropriate. Krug
and Weinberg (2004: 325), therefore, describe the goal of financial management for NPOs as
ensuring that revenues can be maintained while delivering essential purposes. Copeland and
Smith (1978) suggest that NPOs which are donor funded (which describes most of the NPOs
surveyed in this study) have the primary objective of ‘donor utility maximisation’, namely to
ensure that the resources provided by the donor are utilized in the most efficient manner
possible. Zietlow et al. (2007: 12), in a study of 288 faith-based organizations in the United
States between 1992 and 1994, found that 38.5% stated that ‘financial break-even’ was their
primary financial objective with 20.5% identifying ‘maximising net revenues’ as their main
financial objective. They further noted that “…as a secondary objective respondents indicated
a concern for cost minimization (11.8%), avoiding financial risk (8.6%), and maximising net
donations (6.9%)”. It can thus be seen that the goal of financial management for an NPO,
namely survival or the minimization of deficits rather than maximising revenue, differs
significantly from a for-profit organization (Krug and Weinberg, 2004: 334). This
fundamental difference is likely to also result in differences in the practice of financial
management in an NPO setting.
2.2 The Scope of Financial Management for NPOs
Financial management is generally divided into three broad categories, namely capital
structure, capital budgeting and short-term financial management (also referred to as working
capital management). An NPO, however, typically does not generate its own income and
relies on external sources for its funding making debt, with its commitment to monthly
interest repayments, extremely risky and hence undesirable (Masters, 2010). In addition, an
Demographic Factors Affecting Subjective Financial Risk Tolerance: A South African Survey
3
NPO does not have shareholders and hence its capital structure does not include a substantial
equity component and so the relevance of capital structure theory for NPOs is limited. Unlike
capital structure, capital budgeting can “…have a dramatic impact on the character of an
NPO for many years since they often involve the commitment of extensive resources over a
long period of time” (Gaertner, 1982: 46). This paper, however, seeks to examine the impact
of the global financial recession on NPOs’ financial viability which is a function of their
ability to meet short-term financial commitments. As a result this study focuses specifically
on short-term financial management.
2.3 Short-Term Financial Management for NPOs
Short-term financial management involves decisions that affect current assets and liabilities,
usually involving cash inflows and outflows occurring within the next twelve months, and
comprises cash management, inventory management and accounts receivable management.
For most NPOs the issues of inventory management and accounts receivable management are
likely to be less significant but the forecasting/budgeting of future cash requirements and
management of cash is critical.
2.3.1 Budgeting and Forecasting
Budgeting is seen as one of the most challenging areas of managing an organisation’s
finances (Hankin, Seidner, and Zietlow, 1997: 147). One of the chief advantages of budgeting
for an NPO is that if planned and executed properly, the likelihood of the NPO being
economically sustainable is improved (Blazek, 2008: 71). In the 1970s, it was common
practice to advocate zero-base budgeting (ZBB), which requires managers to justify their
entire budgets each year with no base level of spending being assumed, but it was found to be
extremely time consuming and is seldom used (Anthony and Young, 1999: 453). The
incremental approach treats existing programmes as preapproved subject only to changes in
financial resources allocated which means that it is less time consuming and is also felt to be
less threatening to managers of programmes (Blazek, 2008: 69). Gambino and Reardon
(1981 cited in Zietlow, 1989: 220) note that with regards to the well-established NPOs in
their study, the use of budgeting and forecasting in particular was generally poor. Zietlow
(1989: 225), in an empirical analysis of 47 NPOs, found that seven prepared no budgets

Demographic Factors Affecting Subjective Financial Risk Tolerance: A South African Survey
4
whatsoever, and of those that do prepare budgets, less than half indicated that they even
attempted to utilize ZBB.
2.3.2. Management of Cash Resources
Often, the most important resource for a nonprofit is its cash (Blazek, 2008: 107). Zietlow
and Seidner (2007: 13) suggest that the primary objective of NPOs should be striving to meet
an “approximate liquidity target” over time. By doing so, a sound cash flow management
system can assist an organisation to survive any periods of strain or uncertainty. Cash
management is, thus, often used as an important indicator of the “fundamental health” of an
NPO with Pajas and Vilain (2004: 352) suggesting that because NPOs usually do not worry
about maximising their profits but do need cash to operate, cash management is even more
important for the nonprofit sector.
2.3.3. Performance Analysis
Accountability is seen as the number one priority for NPOs, both to the people or cause it
may support and to donors/funders who commit financial resources to the NPO, however,
performance analysis is an area in which NPOs are particularly weak (Evans, 2010: 26, 27).
Performance measurement can be multi-faceted, with two of the common techniques for
NPOs being ratio analysis and variance analysis.
Ratio Analysis
Various ratios are used for both internal and external monitoring as “measurement of
financial performance by ratio analysis helps identify organisational strengths and
weaknesses by detecting financial anomalies and focusing attention on issues of
organizational importance (Glynn et al. 2003, cited in Abraham, 2006: 1). Ratio analysis can
thus be used as a control mechanism for long-run targeting (Zietlow, 1989: 226). Zietlow
and Seidner (2007: 4), however, observe that the majority of NPOs do not use ratio analysis,
a statement borne out by Zietlow’s (1989: 225) finding that only 17% of his respondents
employed ratio analysis.
Demographic Factors Affecting Subjective Financial Risk Tolerance: A South African Survey
5
Variance Analysis
Pajas and Vilain (2004: 352) recommend using periodic reports to compare budgeted and
actual revenues and expenses. This is usually done after a budget has been approved and
allows for monitoring of expenditure (Blazek, 2008: 86). Anthony and Young (1999: 630)
state that the “principal purpose of variance analysis is to facilitate the management control
process”, because if any significant differences arise, the NPO will be able to identify
potential problems and make any necessary adjustments.
3 RESEARCH PROBLEM AND METHODOLOGY
3.1. Research Problem and Main Objectives
Given the important role that NPOs play in the sphere of social development, and in light of
the recent global financial crisis, the issue of NPO financial management with regards to the
efficiency and efficacy with which resources are utilised is an important one. Zietlow (1989:
228) found that NPOs’ use of key financial techniques increases with a) age; b) size; c) their
ability to hire or develop administrators with greater financial expertise. The objective of this
research project is thus to investigate the use of financial management by NPOs in the
Pietermaritzburg area and the extent to which these NPOs have been affected by the financial
crisis given their use of financial management. The key research questions addressed are:
• the extent to which NPOs in the Pietermaritzburg area apply financial management
practices;
• the relationship between each of demographic factors and NPOs’ use of financial
management is; and,
• whether or not a relationship exists between the NPOs’ application of financial
management practices and their financial vulnerability
3.2. Sample and Data Collection
Data for this research project was collected using a survey administered in the greater
Pietermaritzburg area over a period of three months – July to September 2010. A list of all
the registered NPOs in the greater Pietermaritzburg area from 1997 to 2007 was extracted
from the Department of Social Development database yielding an initial sample of 330

Demographic Factors Affecting Subjective Financial Risk Tolerance: A South African Survey
6
NPOs. The requirements for registration as an NPO, however, are relatively undemanding
and so the list had to be filtered to ensure that it contained suitable candidates for the purpose
of this research. Three criteria were applied to the NPOs, namely:
1. it operated to benefit society as a whole and not only members of the organisation
2. it has its head office in the greater Pietermaritzburg area
3. it had been operational for at least three years.
Criterion 1 has its basis in the focus on the role of NPOs in social upliftment and so
organizations that did not conform to Bird’s (1985: 161) classification of an NPO which
“…confer[s] benefits on those beyond their own membership” were excluded. Criterion 2
was based on the practical constraints of time and money which needed to keep the area of
study manageable. Finally criterion 3 allowed for the impact (if any) of the recent global
financial crisis to be captured.
A combination of probability and non-probability sampling techniques was used in the
research project. After the initial screening, the list was reduced to include the details of
approximately 250 NPOs. Every fifth NPO was selected in an attempt to obtain a
representative sample. Incorrect contact details meant that many NPOs could not be
contacted while some NPOs were not willing to participate. As a result only sixteen useable
responses were obtained through this process. Given the study’s objective of examining the
effect of the financial crisis on NPOs the above sample would be subject to the problem of
survivorship bias as only NPOs that are still operational appear on the Department of Social
Development’s database. In an attempt to mitigate survivorship bias, purposive sampling was
then employed to include NPOs which had either ceased to operate or were facing imminent
closure. Firstly, an expert in the sector with extensive experience in NPO-networking was
consulted and several NPOs were included based on her recommendation. Secondly, a
snowball technique was utilised to identify suitable NPOs by asking respondents to identify
other NPOs that they knew had experienced financial distress. A further sixteen usable
responses was obtained through this process of which seven had either ceased to operate or
were facing imminent closure. This resulted in a total sample of 32 usable responses.

Demographic Factors Affecting Subjective Financial Risk Tolerance: A South African Survey
7
Based on a review of the literature on the financial management of NPOs, an initial
questionnaire was drafted comprising five sections. Section 1 captured the general
characteristics of the NPO including demographic details concerning staff responsible for its
financial management. Section 2 then analysed the financial management practice of the
NPOs while Section 3 interrogated the NPOs’ funding sources. Section 4 examined how the
NPOs allocate resources and finally Section 5 asked questions regarding the impact of the
global financial crisis and the NPOs’ use of reserves and debt finance.
3.2. Method of Analysis
Descriptive statistics were used to report the preliminary results of the survey. The fact that
many of the responses to the survey questions resulted in ordinal data meant that non-
parametric tests were required to analyse the relationship between responses. Specifically, the
Chi-square test was used to test if two categorical variables were independent of each other.
The Chi-square statistic should only be estimated, however, on counts (frequencies) of data,
not in situations where there is a comparison of means, and if the expected or theoretical
frequencies in any of the cells is greater than or equal-to five (Malhotra, 1993: 495). In those
situations where a Chi-square test was not appropriate the Mann-Whitney test was employed
to compare the means of samples. When comparisons were conducted between the
distributions of two samples, including the median, dispersion, and skewness, the Kruskal-
Wallis test was used. An advantage of the Kruskal-Wallis test is that it can be used for small
samples when the Chi-square test is not appropriate (Cooper and Schindler, 1998: 675).
4 FINDINGS & ANALYSIS
4.1 Respondent Profiles
The mean age of the NPOs in the sample was 8.16 years with all but two of the NPOs having
been operational for five years or more since registration. The size of the NPOs was
measured using two variables namely total expenditure and the number of salaried employees
the results of which are presented below.

Demographic Factors Affecting Subjective Financial Risk Tolerance: A South African Survey
8
Table 1: Size Characteristics of NPOs
A. Total Annual Expenditure
< R1 million R1 million <R5 million > R5 million
No. of NPOs 9 (28%) 18 (56%) 5 (16%)
B. No. of Salaried Employees
0 - 9 10 - 19 20 - 39 40 - 59 > 60
No. of NPOs 13 (41%) 9 (27%) 4 (13%) 3 (9%) 3 (9%)
A distinction was made between the day-to-day financial activities of an NGO involving
basic record keeping, and the financial management of the NPO’s long-term financial
strategy including budgeting and control. Table 2 presents the responses regarding who is
responsible for these two aspects of financial management.
Table 2: Individual(s) Responsible for Day-to-day Financial Activities & Financial
Management
Day-to-day Financial Activities Financial Management
Frequency Percentage Frequency Percentage
No one - - 1 3.13
Director 6 18.75 9 28.13
Finance Manager 7 21.88 11 34.38
Bookkeeper 9 28.13 1 3.13
Administrator 8 25.00 3 9.38
Project manager 2 6.25 2 6.25
Treasurer - - 1 3.13
Board of Directors or Trustees - - 3 9.38
Financial Agent - - 1 3.13
Total 32 100 32 100
Bookkeepers and administrators are seen to be the most common individuals responsible for
the day-to-day financial activities of the NPOs. The financial management of the NPOs is
seen to be predominantly executed by the Financial Manger or Director of the NPO. Table 3
below reports the educational qualifications and experience of the Financial Administrators
of the NPOs relative to the size of the NPO.
Demographic Factors Affecting Subjective Financial Risk Tolerance: A South African Survey
9
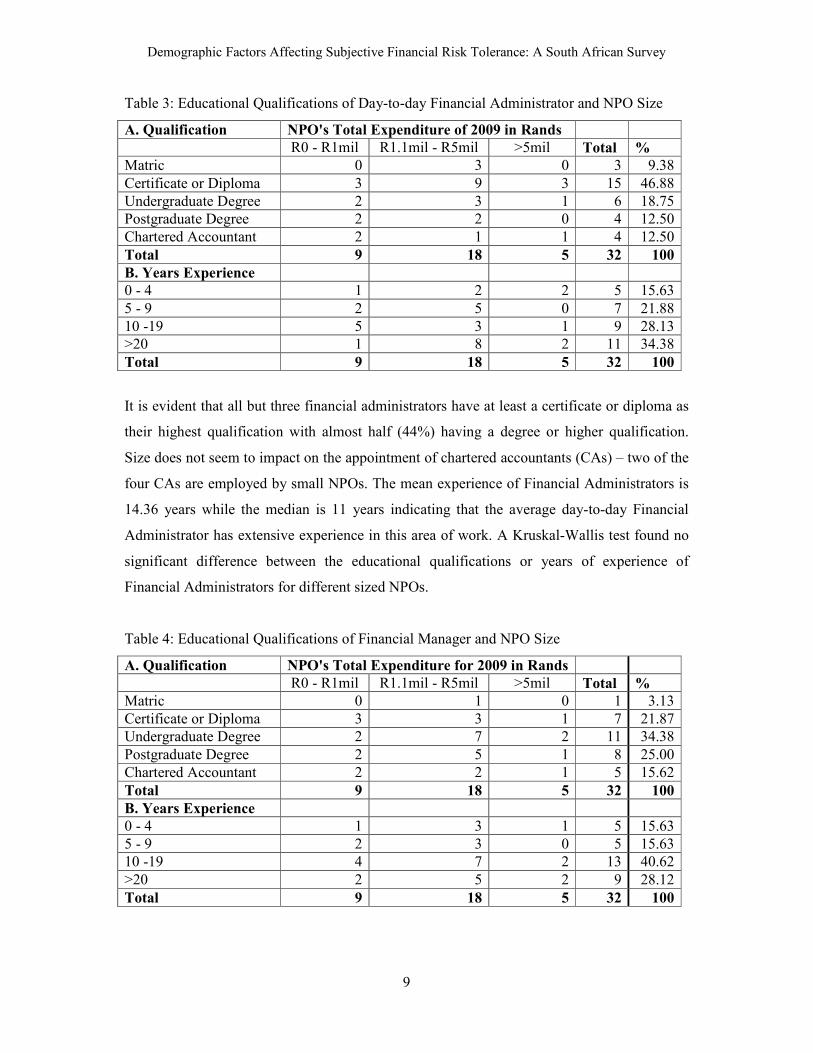
Table 3: Educational Qualifications of Day-to-day Financial Administrator and NPO Size
A. Qualification NPO's Total Expenditure of 2009 in Rands
R0 - R1mil R1.1mil - R5mil >5mil Total %
Matric 0 3 0 3 9.38
Certificate or Diploma 3 9 3 15 46.88
Undergraduate Degree 2 3 1 6 18.75
Postgraduate Degree 2 2 0 4 12.50
Chartered Accountant 2 1 1 4 12.50
Total 9 18 5 32 100
B. Years Experience
0 - 4 1 2 2 5 15.63
5 - 9 2 5 0 7 21.88
10 -19 5 3 1 9 28.13
>20 1 8 2 11 34.38
Total 9 18 5 32 100
It is evident that all but three financial administrators have at least a certificate or diploma as
their highest qualification with almost half (44%) having a degree or higher qualification.
Size does not seem to impact on the appointment of chartered accountants (CAs) – two of the
four CAs are employed by small NPOs. The mean experience of Financial Administrators is
14.36 years while the median is 11 years indicating that the average day-to-day Financial
Administrator has extensive experience in this area of work. A Kruskal-Wallis test found no
significant difference between the educational qualifications or years of experience of
Financial Administrators for different sized NPOs.
Table 4: Educational Qualifications of Financial Manager and NPO Size
A. Qualification NPO's Total Expenditure for 2009 in Rands
R0 - R1mil R1.1mil - R5mil >5mil Total %
Matric 0 1 0 1 3.13
Certificate or Diploma 3 3 1 7 21.87
Undergraduate Degree 2 7 2 11 34.38
Postgraduate Degree 2 5 1 8 25.00
Chartered Accountant 2 2 1 5 15.62
Total 9 18 5 32 100
B. Years Experience
0 - 4 1 3 1 5 15.63
5 - 9 2 3 0 5 15.63
10 -19 4 7 2 13 40.62
>20 2 5 2 9 28.12
Total 9 18 5 32 100
Demographic Factors Affecting Subjective Financial Risk Tolerance: A South African Survey
10
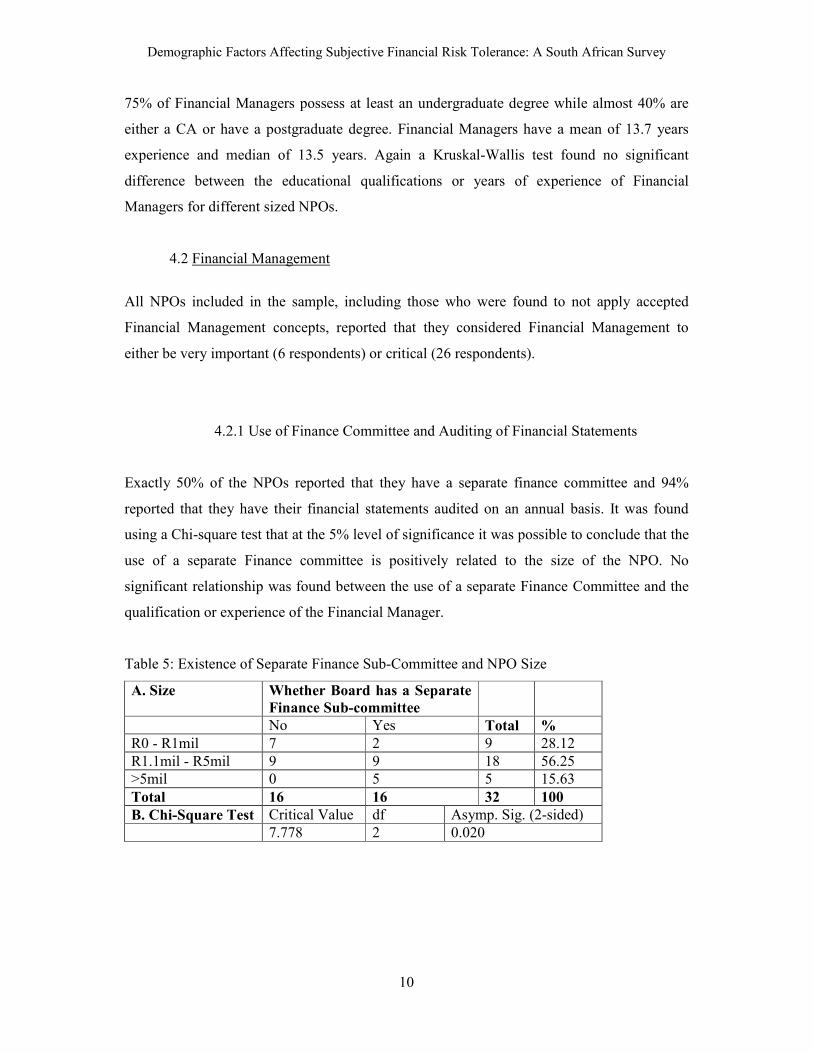
75% of Financial Managers possess at least an undergraduate degree while almost 40% are
either a CA or have a postgraduate degree. Financial Managers have a mean of 13.7 years
experience and median of 13.5 years. Again a Kruskal-Wallis test found no significant
difference between the educational qualifications or years of experience of Financial
Managers for different sized NPOs.
4.2 Financial Management
All NPOs included in the sample, including those who were found to not apply accepted
Financial Management concepts, reported that they considered Financial Management to
either be very important (6 respondents) or critical (26 respondents).
4.2.1 Use of Finance Committee and Auditing of Financial Statements
Exactly 50% of the NPOs reported that they have a separate finance committee and 94%
reported that they have their financial statements audited on an annual basis. It was found
using a Chi-square test that at the 5% level of significance it was possible to conclude that the
use of a separate Finance committee is positively related to the size of the NPO. No
significant relationship was found between the use of a separate Finance Committee and the
qualification or experience of the Financial Manager.
Table 5: Existence of Separate Finance Sub-Committee and NPO Size
A. Size Whether Board has a Separate
Finance Sub-committee
No Yes Total %
R0 - R1mil 7 2 9 28.12
R1.1mil - R5mil 9 9 18 56.25
>5mil 0 5 5 15.63
Total 16 16 32 100
B. Chi-Square Test Critical Value df Asymp. Sig. (2-sided)
7.778 2 0.020
Demographic Factors Affecting Subjective Financial Risk Tolerance: A South African Survey
11
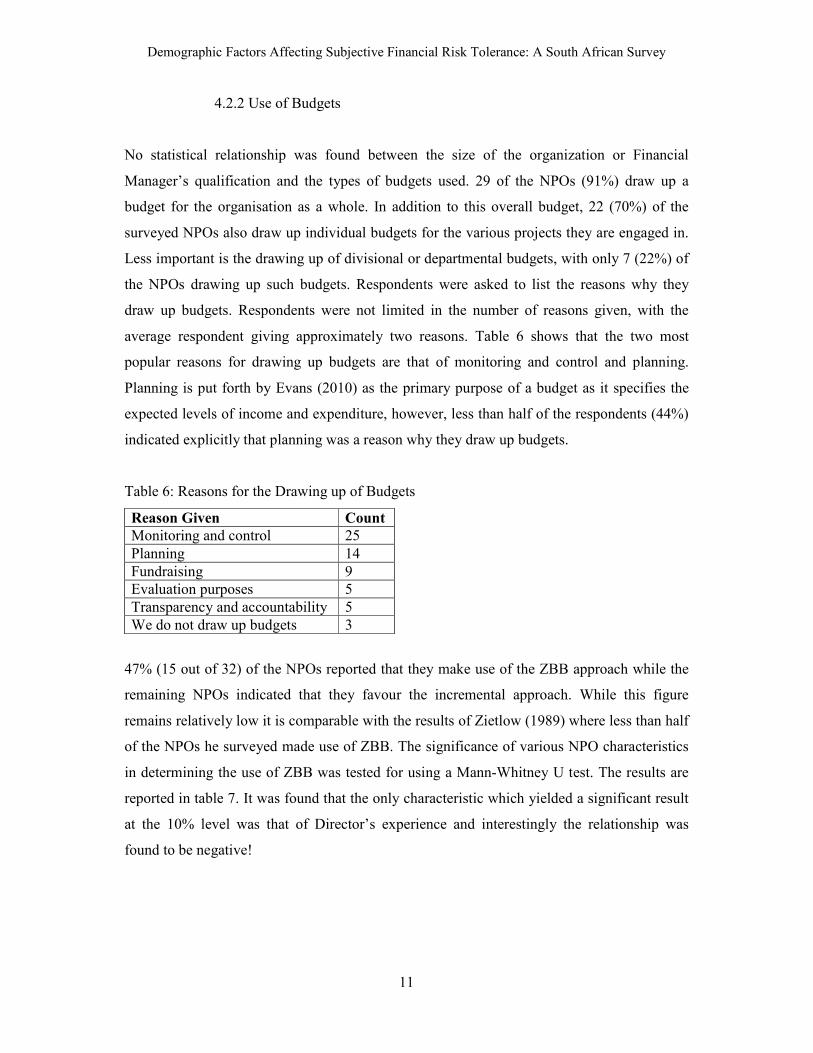
4.2.2 Use of Budgets
No statistical relationship was found between the size of the organization or Financial
Manager’s qualification and the types of budgets used. 29 of the NPOs (91%) draw up a
budget for the organisation as a whole. In addition to this overall budget, 22 (70%) of the
surveyed NPOs also draw up individual budgets for the various projects they are engaged in.
Less important is the drawing up of divisional or departmental budgets, with only 7 (22%) of
the NPOs drawing up such budgets. Respondents were asked to list the reasons why they
draw up budgets. Respondents were not limited in the number of reasons given, with the
average respondent giving approximately two reasons. Table 6 shows that the two most
popular reasons for drawing up budgets are that of monitoring and control and planning.
Planning is put forth by Evans (2010) as the primary purpose of a budget as it specifies the
expected levels of income and expenditure, however, less than half of the respondents (44%)
indicated explicitly that planning was a reason why they draw up budgets.
Table 6: Reasons for the Drawing up of Budgets
Reason Given Count
Monitoring and control 25
Planning 14
Fundraising 9
Evaluation purposes 5
Transparency and accountability 5
We do not draw up budgets 3
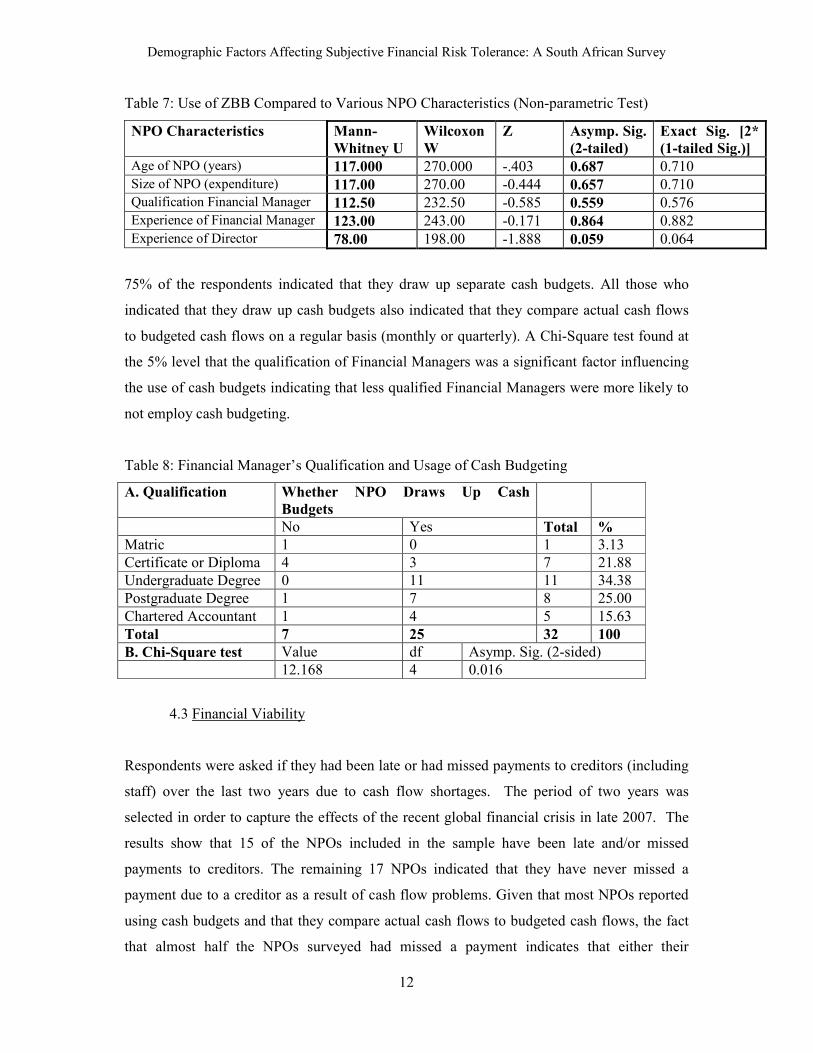
47% (15 out of 32) of the NPOs reported that they make use of the ZBB approach while the
remaining NPOs indicated that they favour the incremental approach. While this figure
remains relatively low it is comparable with the results of Zietlow (1989) where less than half
of the NPOs he surveyed made use of ZBB. The significance of various NPO characteristics
in determining the use of ZBB was tested for using a Mann-Whitney U test. The results are
reported in table 7. It was found that the only characteristic which yielded a significant result
at the 10% level was that of Director’s experience and interestingly the relationship was
found to be negative!
Demographic Factors Affecting Subjective Financial Risk Tolerance: A South African Survey
12
Table 7: Use of ZBB Compared to Various NPO Characteristics (Non-parametric Test)
NPO Characteristics Mann-
Whitney U
Wilcoxon
W
Z Asymp. Sig.
(2-tailed)
Exact Sig. [2*
(1-tailed Sig.)]
Age of NPO (years) 117.000 270.000 -.403 0.687 0.710
Size of NPO (expenditure) 117.00 270.00 -0.444 0.657 0.710
Qualification Financial Manager 112.50 232.50 -0.585 0.559 0.576
Experience of Financial Manager 123.00 243.00 -0.171 0.864 0.882
Experience of Director 78.00 198.00 -1.888 0.059 0.064
75% of the respondents indicated that they draw up separate cash budgets. All those who
indicated that they draw up cash budgets also indicated that they compare actual cash flows
to budgeted cash flows on a regular basis (monthly or quarterly). A Chi-Square test found at
the 5% level that the qualification of Financial Managers was a significant factor influencing
the use of cash budgets indicating that less qualified Financial Managers were more likely to
not employ cash budgeting.
Table 8: Financial Manager’s Qualification and Usage of Cash Budgeting
A. Qualification Whether NPO Draws Up Cash
Budgets
No Yes Total %
Matric 1 0 1 3.13
Certificate or Diploma 4 3 7 21.88
Undergraduate Degree 0 11 11 34.38
Postgraduate Degree 1 7 8 25.00
Chartered Accountant 1 4 5 15.63
Total 7 25 32 100
B. Chi-Square test Value df Asymp. Sig. (2-sided)
12.168 4 0.016
4.3 Financial Viability
Respondents were asked if they had been late or had missed payments to creditors (including
staff) over the last two years due to cash flow shortages. The period of two years was
selected in order to capture the effects of the recent global financial crisis in late 2007. The
results show that 15 of the NPOs included in the sample have been late and/or missed
payments to creditors. The remaining 17 NPOs indicated that they have never missed a
payment due to a creditor as a result of cash flow problems. Given that most NPOs reported
using cash budgets and that they compare actual cash flows to budgeted cash flows, the fact
that almost half the NPOs surveyed had missed a payment indicates that either their
Demographic Factors Affecting Subjective Financial Risk Tolerance: A South African Survey
13
monitoring of their cash flows was not effective or that the reasons they were not able to
make all payments on time was a result of factors beyond their control. Five NPOs indicated
that they have been late and/or missed payments on one or two occasions. Eight responded
that they had been late and/or missed payments on more than two occasions and, finally, two
NPOs had ceased operations due to cash flow shortages. Not being able to make a payment
on time was taken as an indicator of financial distress meaning that fifteen of the NPOs
surveyed were categorised as Distressed and the remaining seventeen as Not Distressed.
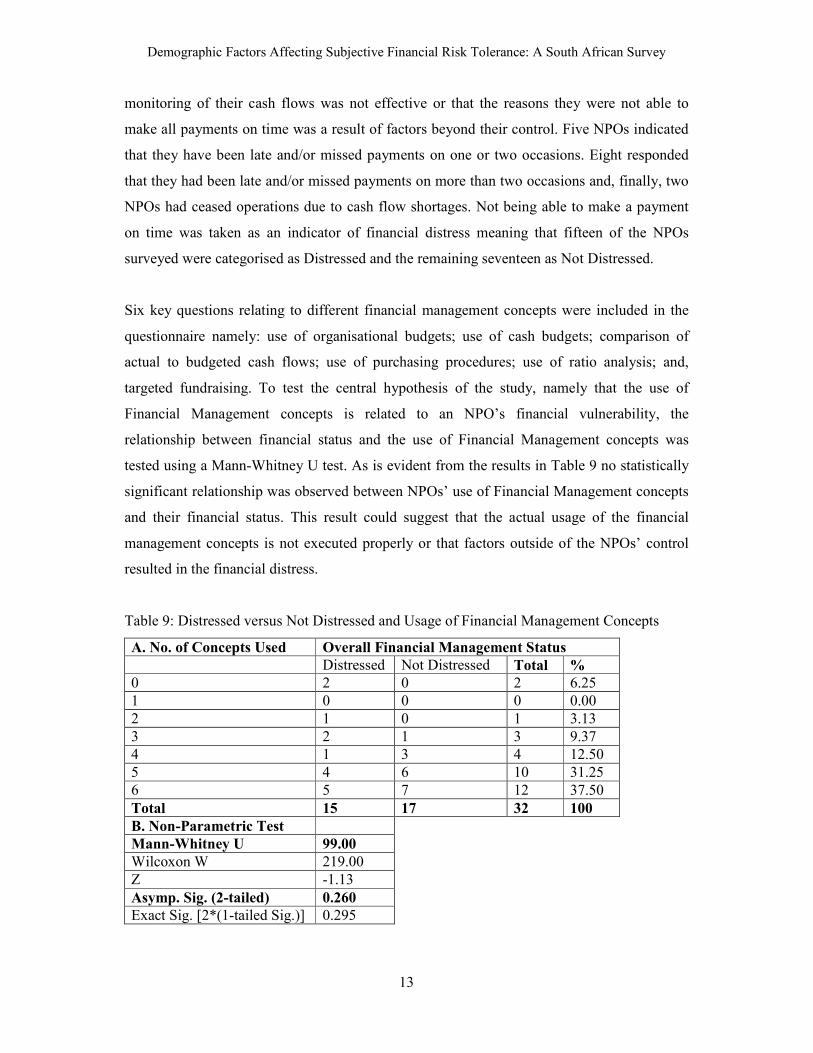
Six key questions relating to different financial management concepts were included in the
questionnaire namely: use of organisational budgets; use of cash budgets; comparison of
actual to budgeted cash flows; use of purchasing procedures; use of ratio analysis; and,
targeted fundraising. To test the central hypothesis of the study, namely that the use of
Financial Management concepts is related to an NPO’s financial vulnerability, the
relationship between financial status and the use of Financial Management concepts was
tested using a Mann-Whitney U test. As is evident from the results in Table 9 no statistically
significant relationship was observed between NPOs’ use of Financial Management concepts
and their financial status. This result could suggest that the actual usage of the financial
management concepts is not executed properly or that factors outside of the NPOs’ control
resulted in the financial distress.
Table 9: Distressed versus Not Distressed and Usage of Financial Management Concepts
A. No. of Concepts Used Overall Financial Management Status
Distressed Not Distressed Total %
0 2 0 2 6.25
1 0 0 0 0.00
2 1 0 1 3.13
3 2 1 3 9.37
4 1 3 4 12.50
5 4 6 10 31.25
6 5 7 12 37.50
Total 15 17 32 100
B. Non-Parametric Test
Mann-Whitney U 99.00
Wilcoxon W 219.00
Z -1.13
Asymp. Sig. (2-tailed) 0.260
Exact Sig. [2*(1-tailed Sig.)] 0.295
Demographic Factors Affecting Subjective Financial Risk Tolerance: A South African Survey
14
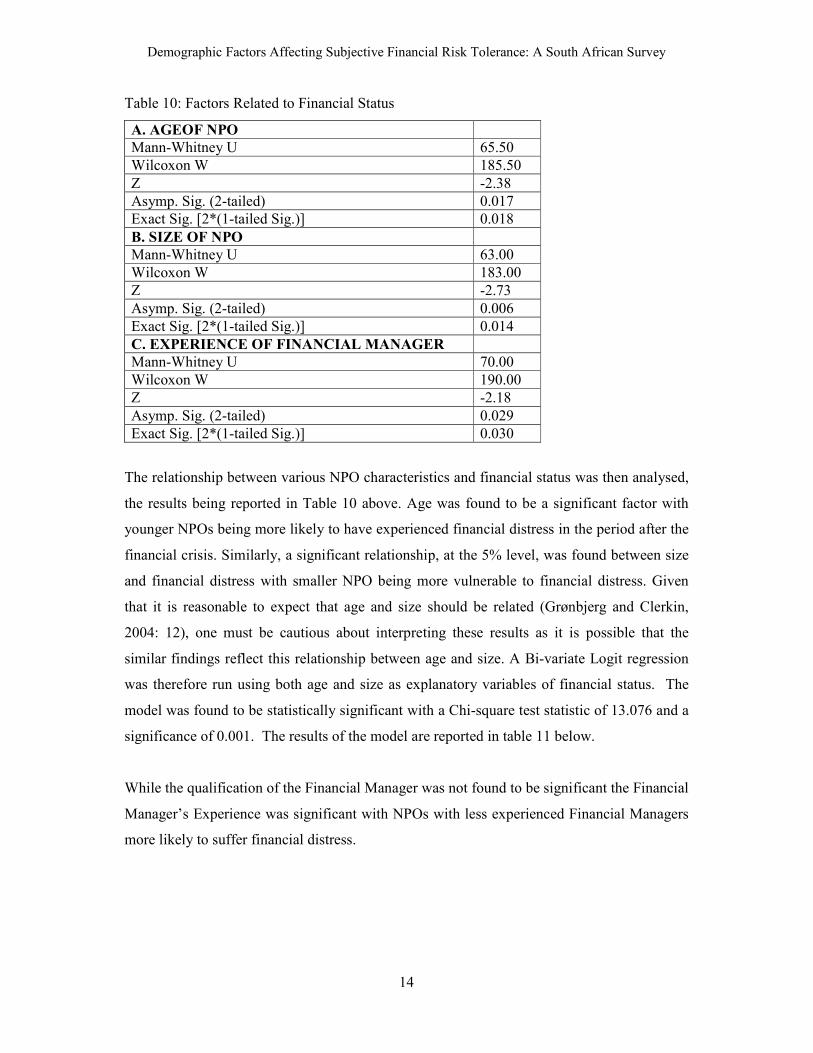
Table 10: Factors Related to Financial Status
A. AGEOF NPO
Mann-Whitney U 65.50
Wilcoxon W 185.50
Z -2.38
Asymp. Sig. (2-tailed) 0.017
Exact Sig. [2*(1-tailed Sig.)] 0.018
B. SIZE OF NPO
Mann-Whitney U 63.00
Wilcoxon W 183.00
Z -2.73
Asymp. Sig. (2-tailed) 0.006
Exact Sig. [2*(1-tailed Sig.)] 0.014
C. EXPERIENCE OF FINANCIAL MANAGER
Mann-Whitney U 70.00
Wilcoxon W 190.00
Z -2.18
Asymp. Sig. (2-tailed) 0.029
Exact Sig. [2*(1-tailed Sig.)] 0.030
The relationship between various NPO characteristics and financial status was then analysed,
the results being reported in Table 10 above. Age was found to be a significant factor with
younger NPOs being more likely to have experienced financial distress in the period after the
financial crisis. Similarly, a significant relationship, at the 5% level, was found between size
and financial distress with smaller NPO being more vulnerable to financial distress. Given
that it is reasonable to expect that age and size should be related (Grønbjerg and Clerkin,
2004: 12), one must be cautious about interpreting these results as it is possible that the
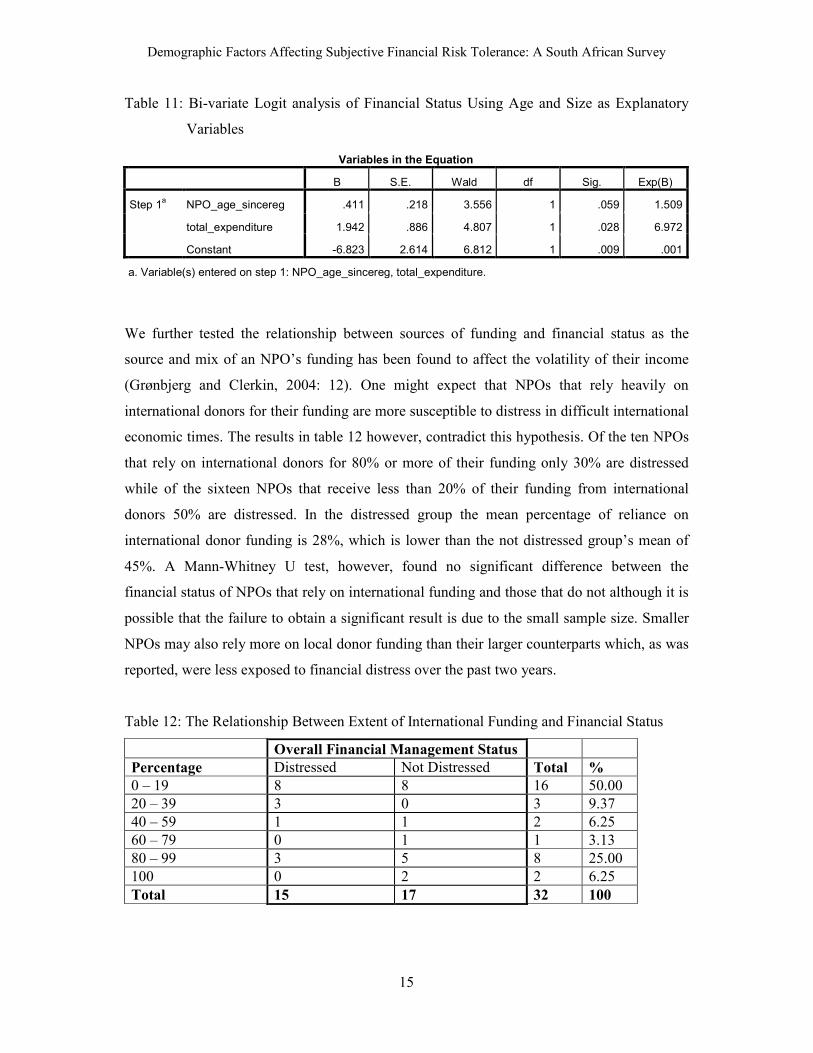
similar findings reflect this relationship between age and size. A Bi-variate Logit regression
was therefore run using both age and size as explanatory variables of financial status. The
model was found to be statistically significant with a Chi-square test statistic of 13.076 and a
significance of 0.001. The results of the model are reported in table 11 below.
While the qualification of the Financial Manager was not found to be significant the Financial
Manager’s Experience was significant with NPOs with less experienced Financial Managers
more likely to suffer financial distress.
Demographic Factors Affecting Subjective Financial Risk Tolerance: A South African Survey
15
Table 11: Bi-variate Logit analysis of Financial Status Using Age and Size as Explanatory
Variables
Variables in the Equation
B S.E. Wald df Sig. Exp(B)
Step 1a NPO_age_sincereg .411 .218 3.556 1 .059 1.509
total_expenditure 1.942 .886 4.807 1 .028 6.972
Constant -6.823 2.614 6.812 1 .009 .001
a. Variable(s) entered on step 1: NPO_age_sincereg, total_expenditure.
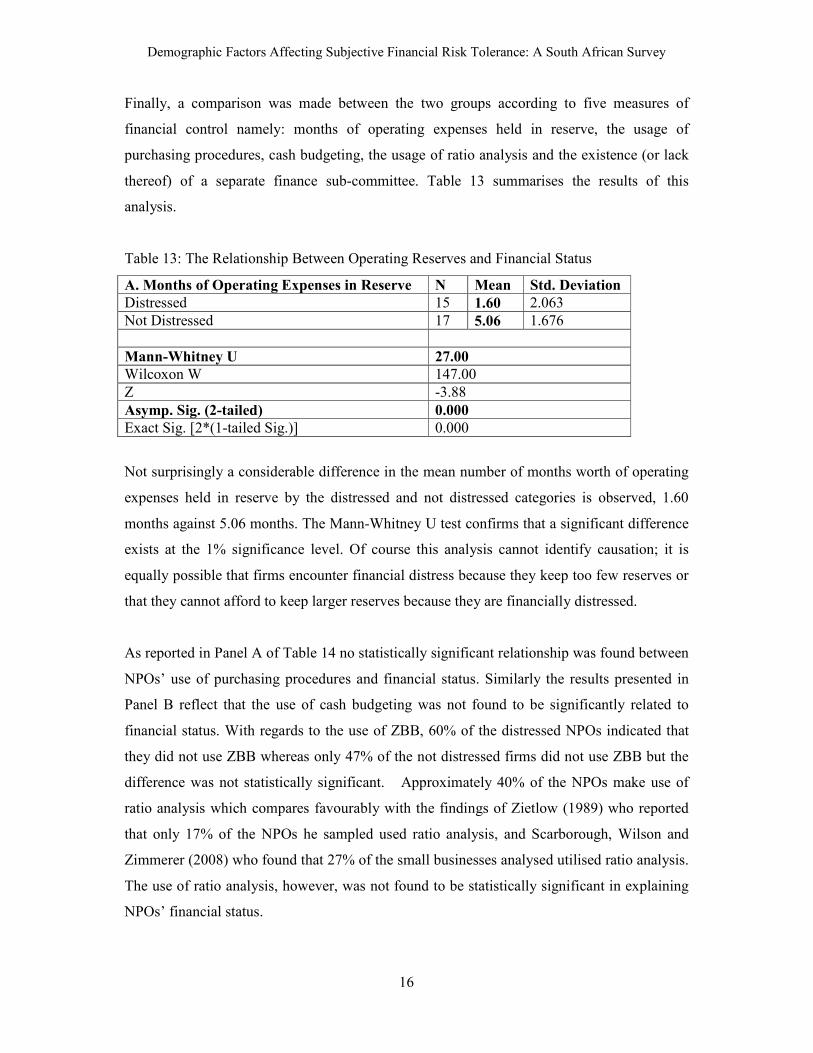
We further tested the relationship between sources of funding and financial status as the
source and mix of an NPO’s funding has been found to affect the volatility of their income
(Grønbjerg and Clerkin, 2004: 12). One might expect that NPOs that rely heavily on
international donors for their funding are more susceptible to distress in difficult international
economic times. The results in table 12 however, contradict this hypothesis. Of the ten NPOs
that rely on international donors for 80% or more of their funding only 30% are distressed
while of the sixteen NPOs that receive less than 20% of their funding from international
donors 50% are distressed. In the distressed group the mean percentage of reliance on
international donor funding is 28%, which is lower than the not distressed group’s mean of
45%. A Mann-Whitney U test, however, found no significant difference between the
financial status of NPOs that rely on international funding and those that do not although it is
possible that the failure to obtain a significant result is due to the small sample size. Smaller
NPOs may also rely more on local donor funding than their larger counterparts which, as was
reported, were less exposed to financial distress over the past two years.
Table 12: The Relationship Between Extent of International Funding and Financial Status
Overall Financial Management Status
Percentage Distressed Not Distressed Total %
0 – 19 8 8 16 50.00
20 – 39 3 0 3 9.37
40 – 59 1 1 2 6.25
60 – 79 0 1 1 3.13
80 – 99 3 5 8 25.00
100 0 2 2 6.25
Total 15 17 32 100
Demographic Factors Affecting Subjective Financial Risk Tolerance: A South African Survey
16
Finally, a comparison was made between the two groups according to five measures of
financial control namely: months of operating expenses held in reserve, the usage of
purchasing procedures, cash budgeting, the usage of ratio analysis and the existence (or lack
thereof) of a separate finance sub-committee. Table 13 summarises the results of this
analysis.
Table 13: The Relationship Between Operating Reserves and Financial Status
A. Months of Operating Expenses in Reserve N Mean Std. Deviation
Distressed 15 1.60 2.063
Not Distressed 17 5.06 1.676
Mann-Whitney U 27.00
Wilcoxon W 147.00
Z -3.88
Asymp. Sig. (2-tailed) 0.000
Exact Sig. [2*(1-tailed Sig.)] 0.000
Not surprisingly a considerable difference in the mean number of months worth of operating
expenses held in reserve by the distressed and not distressed categories is observed, 1.60
months against 5.06 months. The Mann-Whitney U test confirms that a significant difference
exists at the 1% significance level. Of course this analysis cannot identify causation; it is
equally possible that firms encounter financial distress because they keep too few reserves or
that they cannot afford to keep larger reserves because they are financially distressed.
As reported in Panel A of Table 14 no statistically significant relationship was found between
NPOs’ use of purchasing procedures and financial status. Similarly the results presented in
Panel B reflect that the use of cash budgeting was not found to be significantly related to
financial status. With regards to the use of ZBB, 60% of the distressed NPOs indicated that
they did not use ZBB whereas only 47% of the not distressed firms did not use ZBB but the
difference was not statistically significant. Approximately 40% of the NPOs make use of
ratio analysis which compares favourably with the findings of Zietlow (1989) who reported
that only 17% of the NPOs he sampled used ratio analysis, and Scarborough, Wilson and
Zimmerer (2008) who found that 27% of the small businesses analysed utilised ratio analysis.
The use of ratio analysis, however, was not found to be statistically significant in explaining
NPOs’ financial status.

Demographic Factors Affecting Subjective Financial Risk Tolerance: A South African Survey
17
Table 14: The relationship Between Cash Budgeting, Purchasing Procedures and Financial
Status
A. Use of Purchasing Procedures No Yes Total
Distressed 1 14 15
Not Distressed 7 10 17
Total 8 24 32
Value df
Asymp. Sig. (2-
sided)
Pearson Chi-Square 1.274 2 0.529
B. Use of cash budgets No Yes Total
Distressed 5 10 15
Not Distressed 3 14 17
Total 8 24 32
Value df
Asymp. Sig. (2-
sided)
Pearson Chi-Square 1.046 1 0.306
C. Use of ZBB No Yes Total
Distressed 6 9 15
Not Distressed 8 9 17
Total 32
Value df
Asymp. Sig. (2-
sided)
Mann-Whitney U 111.00 0.47
D. Use of Ratio
Analysis
Not familiar with term
used No Yes Total
Distressed 2 8 5 15
Not Distressed 0 9 8 17
Total 2 17 13 32
Value df
Asymp. Sig. (2-
sided)
Pearson Chi-Square 1 0.27
E. Use of Separate Finance Sub-committee? No Yes Total
Distressed 12 3 15
Not Distressed 4 13 17
Total 16 16 32
Value df
Asymp. Sig. (2-
sided)
Pearson Chi-Square 10.165 1 0.001
Panel E shows that the majority of Distressed NPOs do not have a separate finance sub-
committee while the majority of Not Distressed NPOs do have such a committee. A Chi-
square test confirms a statistically significant difference between the financial status of NPOs
employing such a committee and those that do not at a 1% level of significance. This finding
provides evidence of the value of explicit board oversight of an NPO’s financial performance
Demographic Factors Affecting Subjective Financial Risk Tolerance: A South African Survey
18
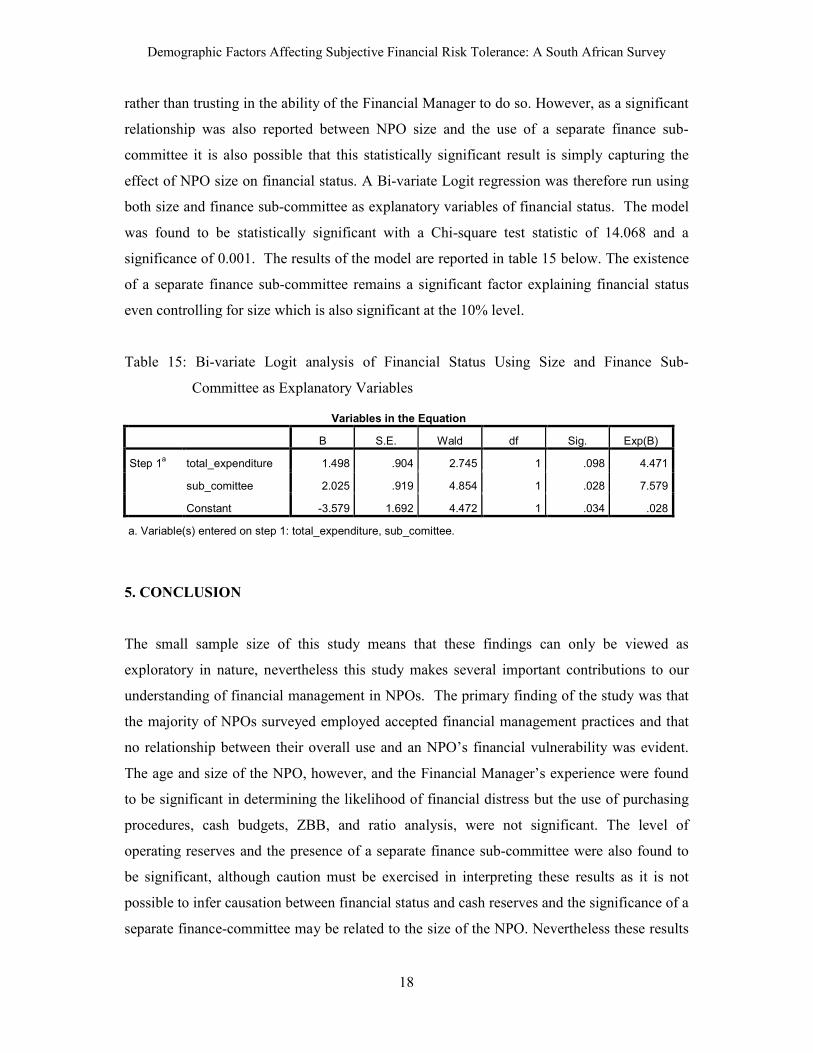
rather than trusting in the ability of the Financial Manager to do so. However, as a significant
relationship was also reported between NPO size and the use of a separate finance sub-
committee it is also possible that this statistically significant result is simply capturing the
effect of NPO size on financial status. A Bi-variate Logit regression was therefore run using
both size and finance sub-committee as explanatory variables of financial status. The model
was found to be statistically significant with a Chi-square test statistic of 14.068 and a
significance of 0.001. The results of the model are reported in table 15 below. The existence
of a separate finance sub-committee remains a significant factor explaining financial status
even controlling for size which is also significant at the 10% level.
Table 15: Bi-variate Logit analysis of Financial Status Using Size and Finance Sub-
Committee as Explanatory Variables
Variables in the Equation
B S.E. Wald df Sig. Exp(B)
Step 1a total_expenditure 1.498 .904 2.745 1 .098 4.471
sub_comittee 2.025 .919 4.854 1 .028 7.579
Constant -3.579 1.692 4.472 1 .034 .028
a. Variable(s) entered on step 1: total_expenditure, sub_comittee.
5. CONCLUSION
The small sample size of this study means that these findings can only be viewed as
exploratory in nature, nevertheless this study makes several important contributions to our
understanding of financial management in NPOs. The primary finding of the study was that
the majority of NPOs surveyed employed accepted financial management practices and that
no relationship between their overall use and an NPO’s financial vulnerability was evident.
The age and size of the NPO, however, and the Financial Manager’s experience were found
to be significant in determining the likelihood of financial distress but the use of purchasing
procedures, cash budgets, ZBB, and ratio analysis, were not significant. The level of
operating reserves and the presence of a separate finance sub-committee were also found to
be significant, although caution must be exercised in interpreting these results as it is not
possible to infer causation between financial status and cash reserves and the significance of a
separate finance-committee may be related to the size of the NPO. Nevertheless these results

Demographic Factors Affecting Subjective Financial Risk Tolerance: A South African Survey
19
are suggestive of the importance of sufficient cash reserves and of independent financial
oversight for the financial sustainability of an NPO and provide valuable empirical evidence
regarding sound NPO management practice. Further research needs to be done to fully
explore the links between these variables and financial sustainability.
Contrary to our expectations, the extent to which NPOs relied on international funding was
not found to increase their likelihood of having experienced financial distress post the global
financial crisis. Due to the small sample size and the study’s narrow geographic focus,
however, it is not possible to generalise this finding to all NPOs. It is possible that this result
is biased by the number of smaller NPOs in the sample who are less likely to be able to
access international funding. Two years may also be an insufficient period for the effects of
the financial recession to be fully felt if funders honour their existing financial commitments
but fail to renew their funding when it expires. Further research is thus required regarding the
relationship between financial sustainability and sources of funding for South African NPOs.
NPOs play a major role in addressing a variety of social challenges and yet relatively little
research has been done regarding their financial management and sustainability. A greater
theoretical and empirical understanding of NPOs’ financial management offers the promise
of improving their effectiveness. This study provides a starting point for further research on
this important topic by identifying a number of factors which impact on NPOs’ financial
viability and suggesting productive areas for further research.
References
Abraham, A. (2006). ‘Financial Management in the Nonprofit Sector: A Mission-Based
Approach to Ratio Analysis in Membership Organization.’ The Journal of American
Academy of Business. Vol. 9; No. 2; 212-217.
Anthony, R. N., and Young, D. W. (1999). Management Control in Nonprofit Organizations.
6th ed. New York: McGraw-Hill.
Bird, P. (1985). ‘The Level of Reserves in Fund-Raising Charities’. Financial Accountability
& Management. Vol. 1; No. 2; 161-171.
Blazek, J. (2008). Nonprofit Financial Planning Made Easy. New Jersey: John Wiley &
Sons.
Copeland, T. E., and Smith, K. V. (1978). ‘An Overview of Nonprofit Organizations’.
Journal of Economics and Business. Vol. 30; 21 – 27.
Department of Social Development. 2005. Assessment of NPO Act. Pretoria: Government
Demographic Factors Affecting Subjective Financial Risk Tolerance: A South African Survey
20
Printer.
Department of Social development Annual Report. (2009). [online]
http://www.info.gov.za/view/DownloadFileAction?id=108498 (Accessed 18 February 2010).
Evans, M.H. (2010). Excellence in Financial Management. Course 15: Creating Value in the
Nonprofit Sector. [online] http://www.exinfm.com/training/ [Accessed: 07 July 2010].
Gaertner, J. (1982). ‘Cash Budgets.’ In: Connors, T., and Callaghan, C. Financial
Management for Nonprofit Organizations. New York: American Management Associations.
pp. 57 – 64.
Goddard, A. and Assad, M.J. (2006). ‘Accounting and navigating legitimacy in Tanzanian
NGOs’. Accounting, Auditing & Accountability Journal. Vol. 19; No. 3; 377-404.
Grønbjerg, K. and Clerkin, R. (2004). Indiana Nonprofits: Managing Financial and Human
Resources. Nonprofit Survey Series Report No. 4. [online]
http://www.indiana.edu/~nonprof/results/npsurvey/insman1.pdf
Grønbjerg, K.; Cheney, L.; Leadingham, S. and Liu, H. (2007). ‘Nonprofit Capacity
Assessment: Indiana Charities, 2007’. Nonprofit Capacity Assessment Survey Series, Report
#1, (Bloomington, IN: Indiana University School of Public and Environmental Affairs.
[online] http://www.indiana.edu/~nonprof/results/npcapacity/charitycapacityassessment.pdf
Hankin, J.A., Seidner, A., Zietlow, J. (1997) Financial Management for Nonprofit
Organizations. New York et al.
Krug, K. and Weinberg, C.B. (2004). ‘Mission, Money, and Merit: Strategic Decision
Making by Nonprofit Managers’. Nonprofit Management & Leadership. Vol. 14; No. 3; 325-
342.
LeRoux, K.M. (2005). “What Drives Nonprofit Entrepreneurship? A look at budget trends of
Metro Detroit Social Services Agencies”. American Review of Public Administration. Vol.
35; No. 4; 350-362.
Masters, C. 2010. CEO of C. Masters Development Services (CMDS), Personal interview
10th June 2010.
Pajas, P., and Vilain, M. (2004). Finance of Nonprofit Organizations. In Zimmer, A. and
Priller, E. Future of Civil Society: Making Central European Nonprofit Organizations Work.
Weisbaden, Germany: V.S. Verlag fur Sozialwissenschaften. pp. 341-366.
York, P. (2009). The Sustainability Formula: How Nonprofit Organizations Can Thrive in
the Emerging Economy. New York: TCC Group.
Zietlow, J. T. (1989) ‘Capital and Operating Budgeting Practices in Pure Nonprofit
Organizations’. Financial Accountability and Management. 5(4): 219 – 232.
Zietlow, J. T., and Seidner, A. G. (2007). Cash & Investment Management for Nonprofit
Organizations. New Jersey: John Wiley & Sons, Inc.
Zietlow, J. T., Hankin, J. A., and Seidner, A. G. (2007). Financial management for nonprofit
organizations: policies and practices. New Jersey: John Wiley & Sons, Inc.


![Finance and Inequality - Berkeley-Haasfaculty.haas.berkeley.edu/ross_levine/Papers/finance and inequality... · Researchers have compiled measures of income inequality for [5] many](https://img.pdfslide.net/doc/110x75/5ae047507f8b9a1c248cfe8a/finance-and-inequality-berkeley-and-inequalityresearchers-have-compiled-measures.jpg)