Embed Size (px)
Citation preview

Christian Leadership AllianceMay 2, 20138:00 a.m.

Presenters
Caryn RyanManaging MemberMissionwell LLC
Mark JonesVP & Senior Banking ConsultantECCU

Clearperformance expectations
Clearperformance expectations
BudgetBudget
Actualize long‐term plans
Actualize long‐term plans
Coordinate the team’s activities
Coordinate the team’s activities
Control over processes
Control over processes
Optimize around constraints
Optimize around constraints
ActionsActionsInputsInputs ResultsResults MeaningMeaning
LearningLearning
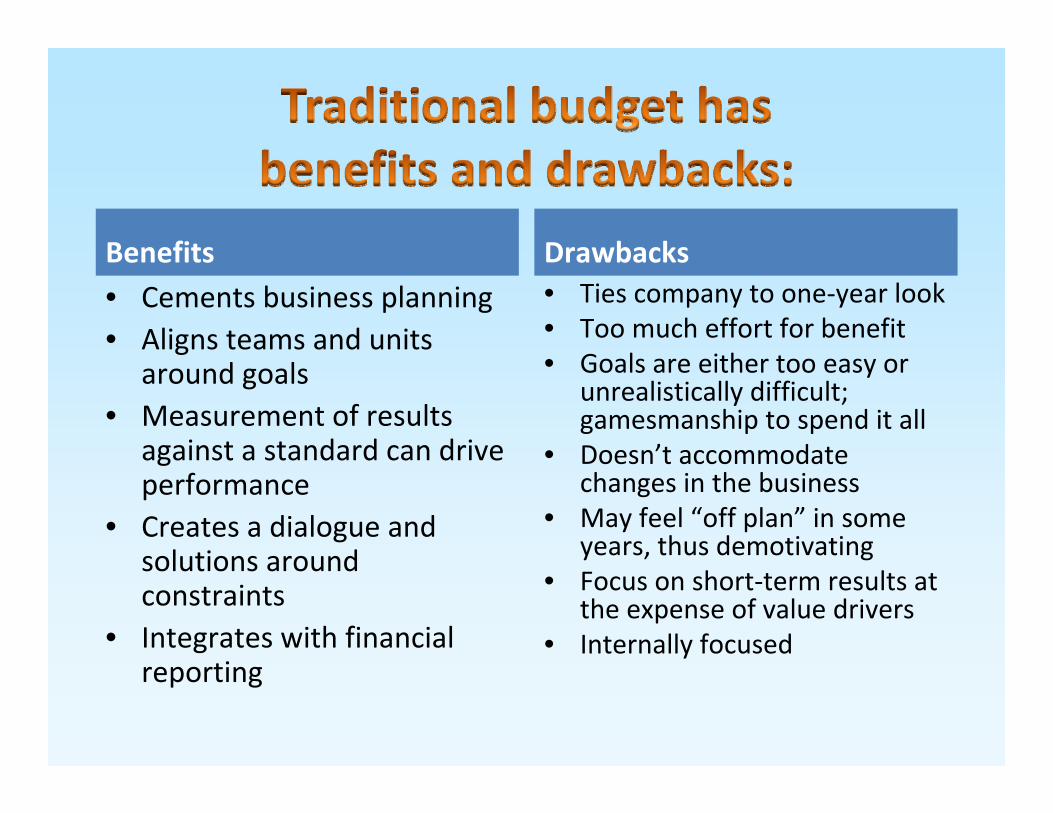
Benefits• Cements business planning• Aligns teams and units
around goals• Measurement of results
against a standard can drive performance
• Creates a dialogue and solutions around constraints
• Integrates with financial reporting
Drawbacks• Ties company to one‐year look• Too much effort for benefit• Goals are either too easy or
unrealistically difficult; gamesmanship to spend it all
• Doesn’t accommodate changes in the business
• May feel “off plan” in some years, thus demotivating
• Focus on short‐term results at the expense of value drivers
• Internally focused

• Activity‐based budgeting• Zero‐based budgeting• Rolling budgets/rolling forecasts• Flexible budgets• Risk‐weighted budgeting • Targets through benchmarking• Statistical forecasting techniques• Aligning budgets for impact
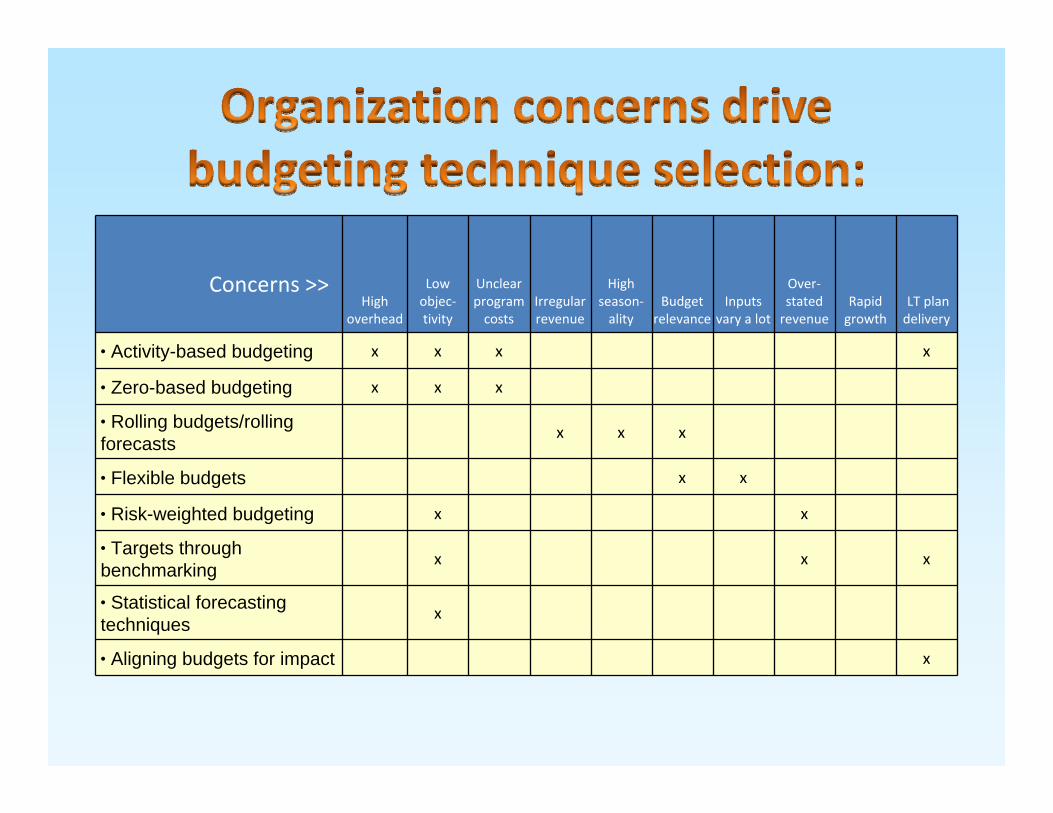
High overhead
Low objec‐tivity
Unclear program costs
Irregular revenue
High season‐ality
Budget relevance
Inputs vary a lot
Over‐stated revenue
Rapid growth
LT plan delivery
• Activity-based budgeting x x x x
• Zero-based budgeting x x x
• Rolling budgets/rolling forecasts x x x
• Flexible budgets x x
• Risk-weighted budgeting x x
• Targets through benchmarking x x x
• Statistical forecasting techniques x
• Aligning budgets for impact x
Concerns >>

• Based on activity‐based costing:– Approach to overhead allocation enhancing accuracy of costs– Applicable when overhead is a significant portion of costs and
products or services differ greatly in volume or complexity– Two‐step process: Defining activities and their cost drivers
• Benefit: More accurate cost of services/products– Multiple cost pools vs. one (traditional)– Improved control over overhead as managers see connections
to cost drivers– Improved pricing of services/products and decisions over
manufacturing• Drawback: Time consuming (use only as needed)

• You need to determine profitability of grants:– Grantors may ask for ABB
• You need to determine whether programs are recovering their costs.
• You want to benchmark your costs and need a standard methodology.
• You are stuck trying to determine where to focus cost reductions or activity increases.
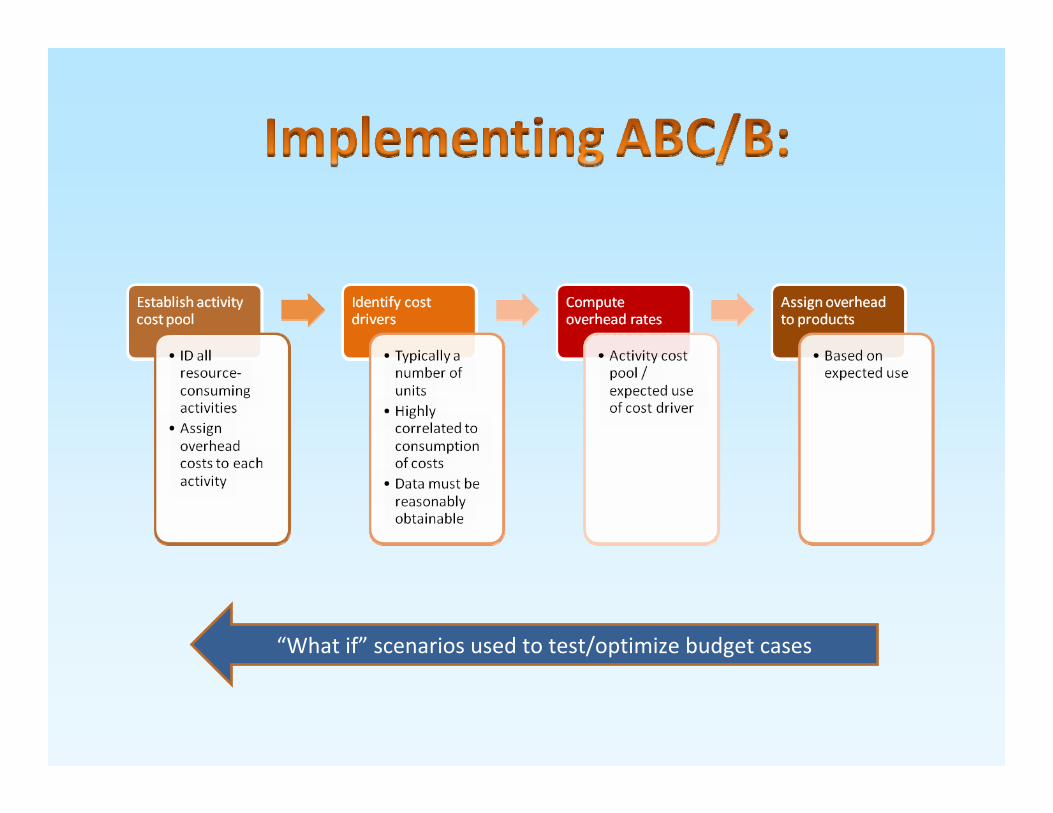
“What if” scenarios used to test/optimize budget cases

• Traditional budgeting is incremental. With ZBB, an activity, program, or position must make the cut‐off for investment each year.– Introduced by Peter Drucker in the 1960s. It’s andated for certain
governmental units at times.• Benefits:
– Ties use of resources to today’s goals. Every year is new.– Challenges the “status quo” > Fresh ideas and innovation
• Drawbacks:– Challenging status quo can be uncomfortable.– Time‐intensive. May work best to use on select activities rather than
across the board• Use when:
– Assumptions or circumstances have changed and a new approach is required.
– Generally not useful for grants (justified by funding).

1. Should the activity, program, or position be continued, or might other activities be higher priority?
2. Should the manner it’s performed change?3. If so, how, when, and by whom?4. How much should be spent on the activity or
program?5. Is change doable?

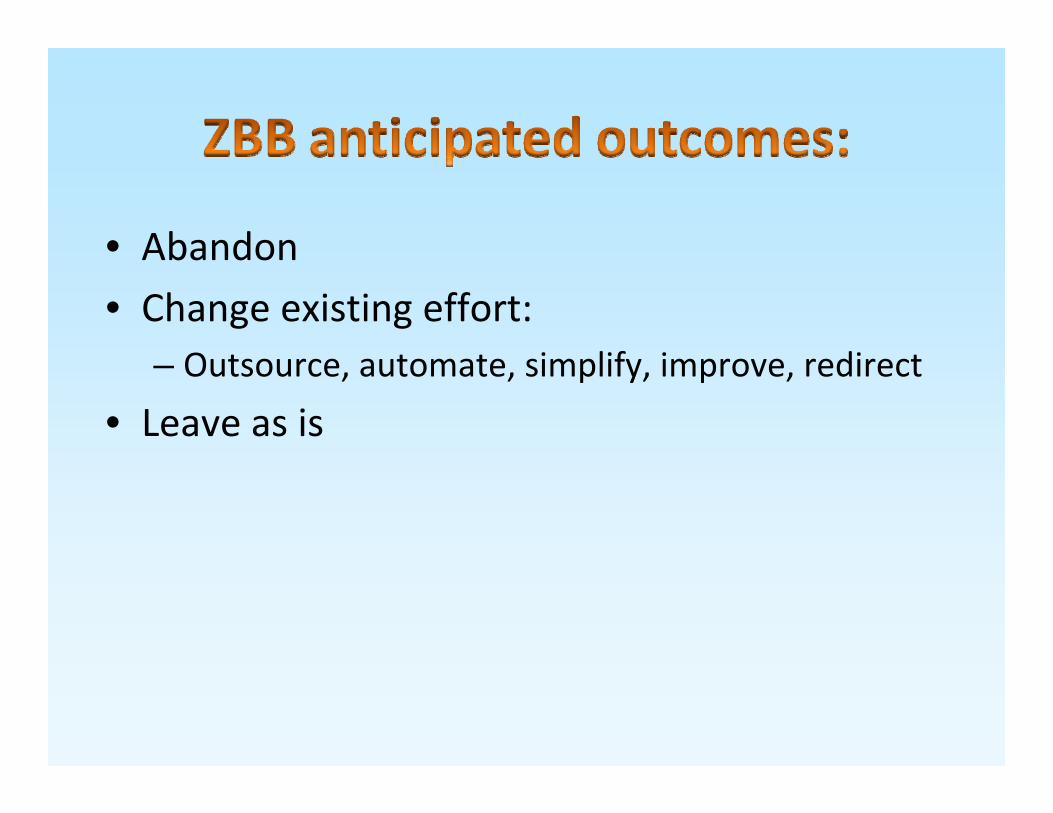
• Abandon • Change existing effort:
– Outsource, automate, simplify, improve, redirect
• Leave as is

• Traditional budget has static time frame of next fiscal year. Rolling, or continuous, budget adds a period (month or quarter, typically) as the current budget expires.– Example: Budgeting horizon is 18 months. A new quarter is added to the end
of the period as every quarter completes. • Advantages:
– Better reflection of actual results than a static budget– Organization focus is always out to the budget horizon (which requires more
planning)– Multi‐year rolling budget alerts you faster when you’re off long‐term plan– Avoids “coasting” if objectives are met early
• Disadvantages:– More resource intensive– Generally early budget assumptions are not revised, which can make early
periods irrelevant.– If early periods are revised (rolling forecast), it makes accountability (and
aligning rewards) more difficult– Generally cannot be as much of a participative budgeting process

• Use when: – You need to identify and adjust to trouble spots beyond the budget horizon, e.g., liquidity as a seasonal issue.
– Timing of revenue (month‐to‐month or quarter‐to‐quarter) is more difficult to plan, though you’re confident it will eventually happen.
– You want staff to focus on the pipeline of opportunities and cycle time to convert.

Efficient implementation typically requires automated budget tools.
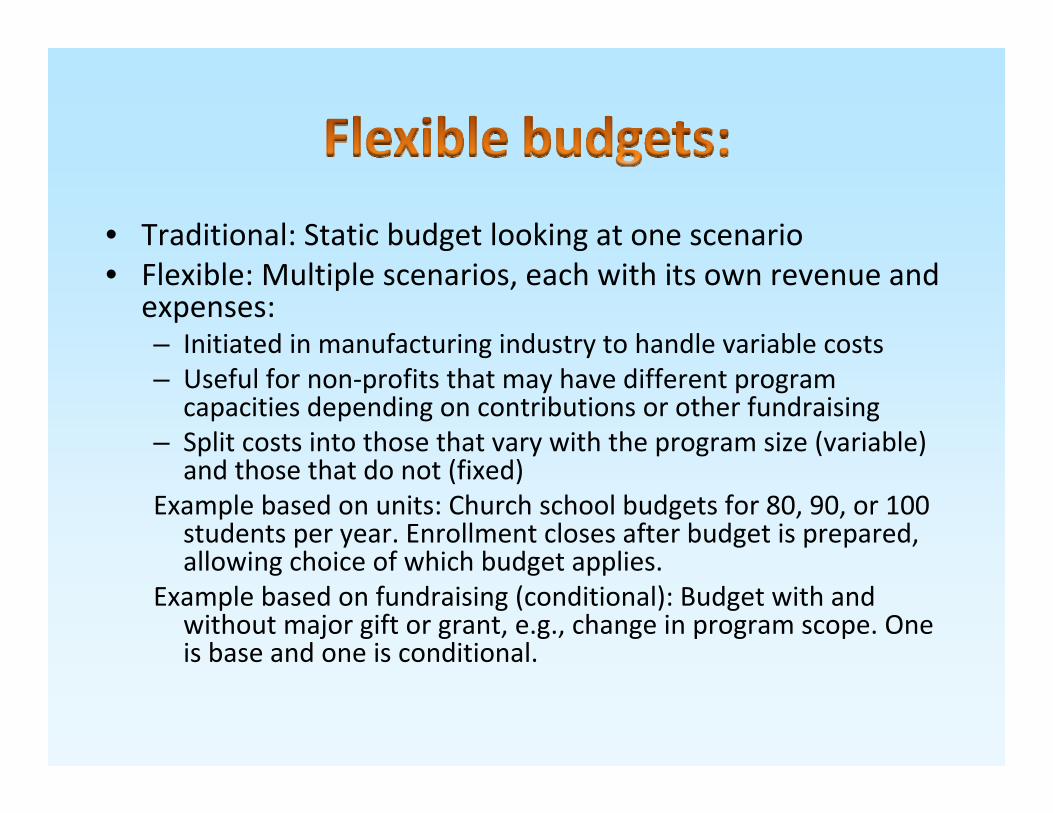
• Traditional: Static budget looking at one scenario• Flexible: Multiple scenarios, each with its own revenue and
expenses:– Initiated in manufacturing industry to handle variable costs– Useful for non‐profits that may have different program
capacities depending on contributions or other fundraising– Split costs into those that vary with the program size (variable)
and those that do not (fixed)Example based on units: Church school budgets for 80, 90, or 100
students per year. Enrollment closes after budget is prepared, allowing choice of which budget applies.
Example based on fundraising (conditional): Budget with and without major gift or grant, e.g., change in program scope. One is base and one is conditional.

• Advantages:– Multiple cases prepared, organization poised to move between cases and take necessary cost actions
• Disadvantages:– Accountability if there is a degree of control over what is flexing. If lose important grant, should organization be accountable?
• Use when: – Not clear what demand for services will take place– Not clear which grants will be received, impacting size or existence of certain programs
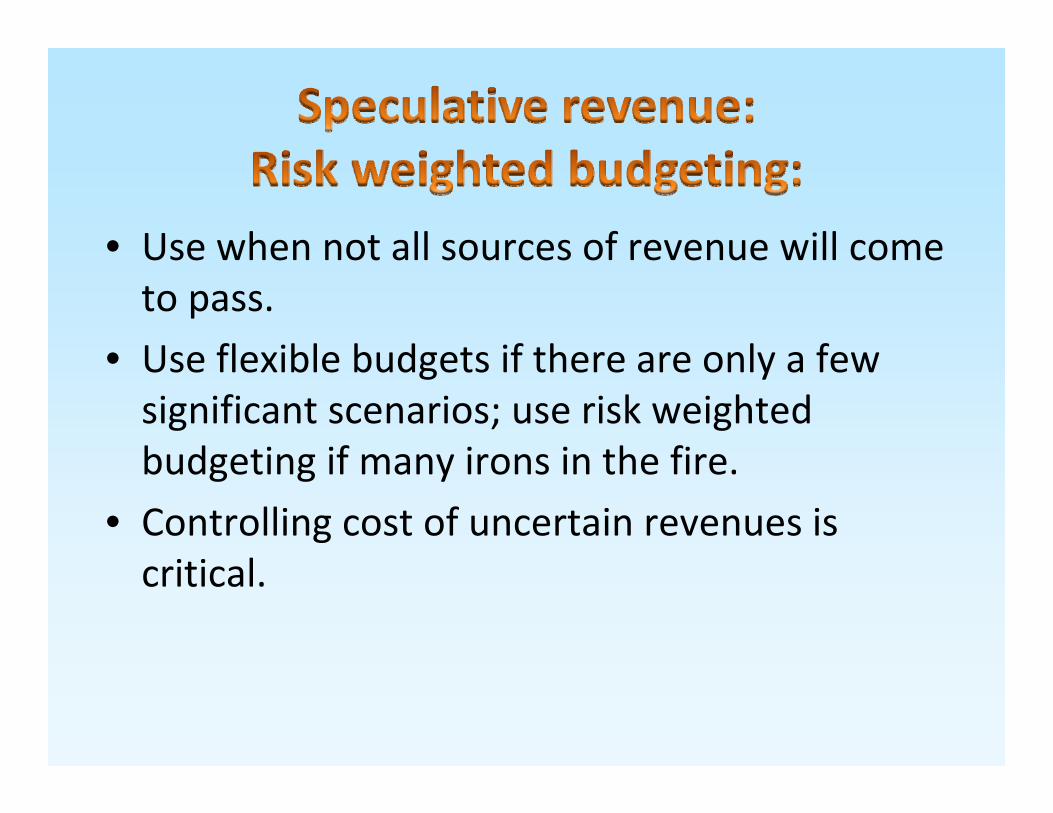
• Use when not all sources of revenue will come to pass.
• Use flexible budgets if there are only a few significant scenarios; use risk weighted budgeting if many irons in the fire.
• Controlling cost of uncertain revenues is critical.

Activity $ Amount % Likelihood
•Grant 1 200 25•Grant 2 500 20•Grant 3 50 90•Grant 4 125 75
– Subtotal grants 875 33– Risk‐weighted 289

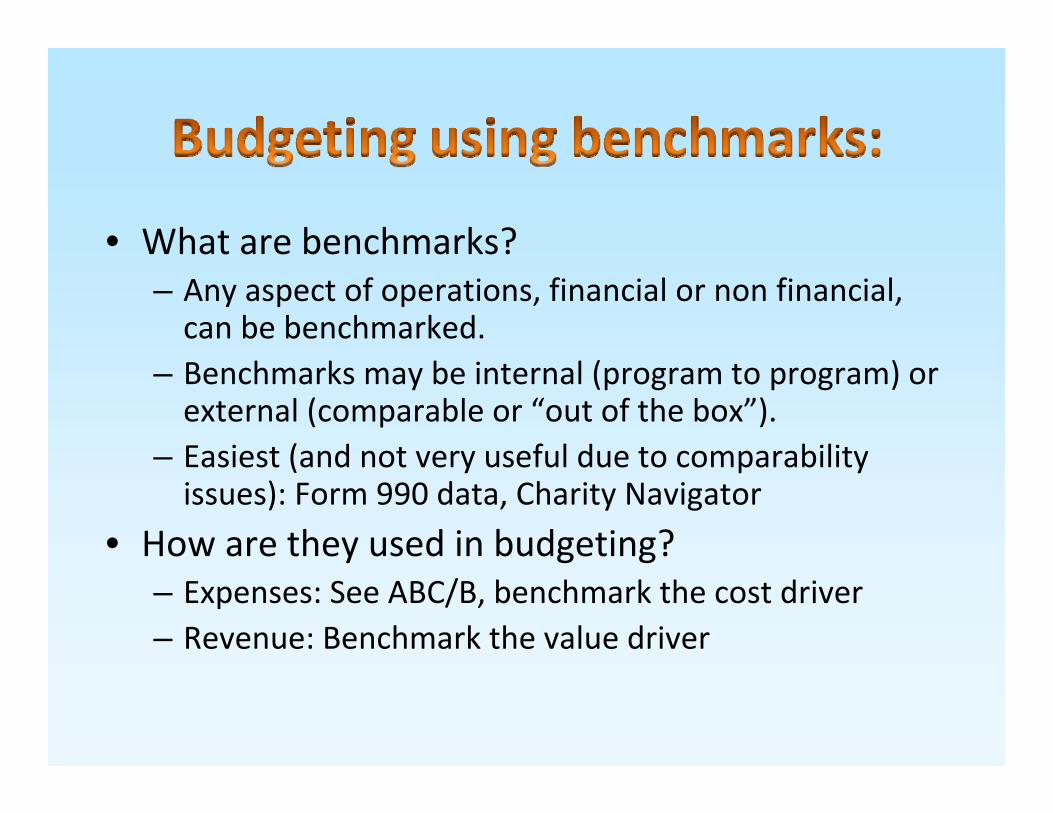
• What are benchmarks?– Any aspect of operations, financial or non financial, can be benchmarked.
– Benchmarks may be internal (program to program) or external (comparable or “out of the box”).
– Easiest (and not very useful due to comparability issues): Form 990 data, Charity Navigator
• How are they used in budgeting?– Expenses: See ABC/B, benchmark the cost driver– Revenue: Benchmark the value driver

• A key question for non‐profits is how to evaluate and forecast returns for different aspects of development:– Channels (direct mail, special events, major giving, web, radio, etc.)
– Within categories, campaigns or positions may be compared.

Can also prepare by development representative

• Need a track record or some history as baseline• Performance goals may be one‐year or multi‐year:– Tie to long ‐term planning objectives
• Incorporate transparently into budget:– May budget 80 percent of goal
• Align variable compensation, contract renewals, other rewards, and incentives to percent achievement of the goals:– Variable pay may start above 100% (budget or self‐funded)


• Simple regression techniques:– Exponential growth – Linear (least squares)– Use Excel (and common sense)
• Multiple regression• Non‐linear regression• Fuzzy logic
Don’t worry, we aren’t going here!

Month 1 2 3 4 5 6 7 8 9 10 11 12Actual revenue 4 6 9 13 18 26 24 25 26 30 30 38
ForecastMonth 13 14 15 16 17 18 19 20 21 22 23 24FY TotGROWTH: Exponential growth trend—think “compound interest" ‐ Last 12 months 56 68 81 97 117 140 168 201 242 290 348 417 2225‐ Last 6 months 38 42 46 50 54 59 64 70 76 83 90 98 769
FORECAST: Linear growth—continue a straight line‐ Last 12 months 39 42 45 48 51 54 57 60 62 65 68 71 662‐ Last 6 months 38 40 43 45 48 50 53 56 58 61 63 66 621

• Plot the data• Learn to use R2 and other statistical techniques for validity
• Correlation is NOT causality

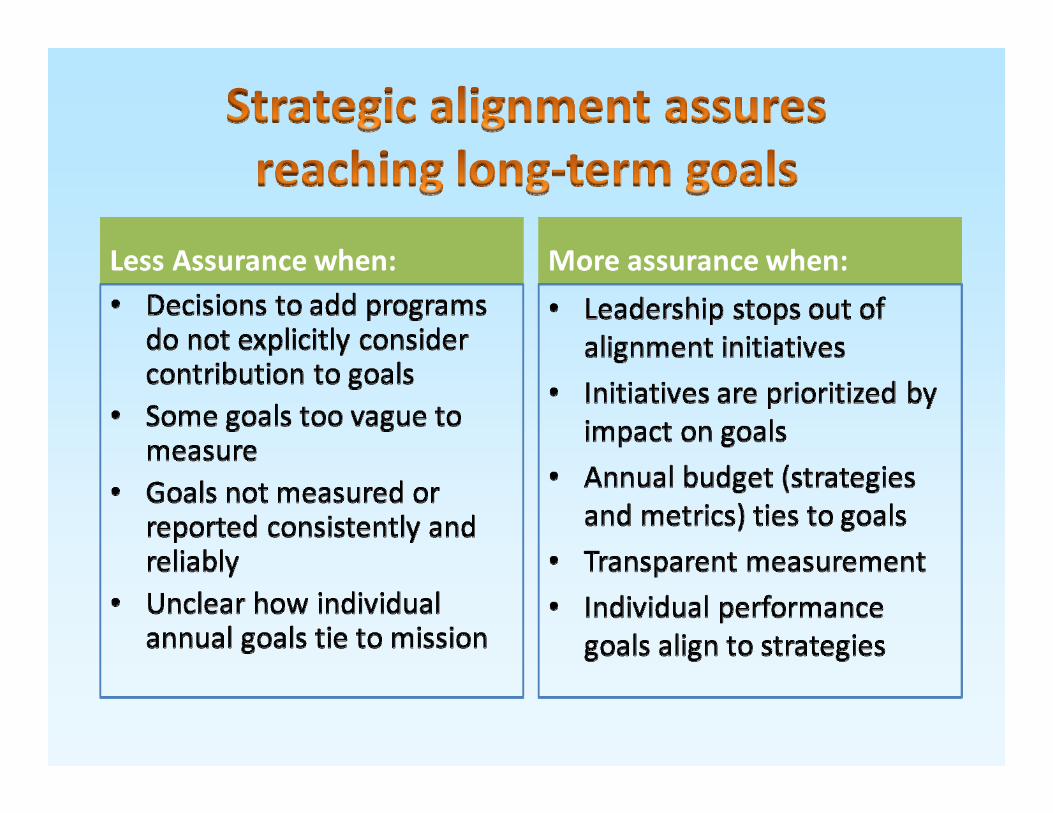
• Every long‐term plan is achieved a day at a time. Budget is a slice of your long‐term plan.
• Annual goals build to long‐term goals.• Or, they do not!
Long‐term goals
Budget

Occurs when each layer of the pyramid further articulates and describes the preceding layers, beginning at the top

Strategic priorities
Tactics in budget year
Strategic goals
Strategies (includes those crossing budget
year)
Program dollarsStaff FTEs

• Determine what techniques best fit your circumstances:– Culture– Resources available– Pressing issue you want to solve
• Consider the extra effort of advanced budgeting:– Need to go beyond financial system for data (e.g., donor data base)
– Budgeting software to allow greater frequency• Get senior leadership buy‐in to approach ahead:
– Unless its just analytical or simple forecasting (e.g., regression)

For more resources, visit www.eccu.org/cla2013.