Embed Size (px)
Citation preview
Ethnic Inequality and the Strength of Ethnic Identities in Sub-Saharan Africa
Masaaki Higashijima1
Christian Houle2
Abstract
Ethnic inequality has been argued to have numerous pernicious effects. Among other things, scholars have argued that it breeds political violence, destabilizes democracy, and impedes economic development. While the arguments developed by these literatures implicitly assume that ethnic inequality increases the degree to which individuals identify with their ethnicity, this assumption has yet to be tested empirically at the individual-level. This paper argues and empirically demonstrates that between-ethnic group inequality does strengthen ethnic identities. However, we also find that the magnitude of its effect weakens as inequality within ethnic groups increases. That is, individuals identify most strongly with their ethnic identity when ethnicity is reinforced by economic inequality. Using the Afrobarometer, we provide the first cross-national empirical test of the effect of ethnic inequality on the strength of ethnic identities at the individual-level. Our dataset covers 21 sub-Saharan African countries and 85 ethnic groups. Results strongly support our hypothesis.
1 Associated Professor, Graduate School of Information Sciences, Tohuko University, [email protected]. 2 Assistant Professor, Political Science, Michigan State University, [email protected].
1
1. Introduction
Ethnic inequality has been argued to have numerous pernicious effects. Among other things,
scholars have argued that ethnic inequality breeds civil wars (Cederman et al. 2011; Gubler and
Selway 2012; Østby 2008) and coups (Houle and Bodea 2017), destabilizes democracies (Houle
2015), impedes economic development (Alesina et al. 2016), reduces the provision of public
goods (Baldwin and Huber 2010), and encourages individuals to vote along ethnic lines (Houle
et al. 2017; Huber and Suryanarayan 2016). The arguments developed by these literatures,
however, rely on the implicit assumption that ethnic inequality increases the degree to which
individuals identify with their ethnicity. If ethnic inequality does not strengthen ethnic
identification, there is little reason to believe that it should, for example, increase people’s
willingness to vote along ethnic lines. Although based on an influential literature (Hechter 1975;
Bates 1974), this key assumption has yet to be tested empirically at the individual-level. We have
no large-N quantitative evidence supporting the claim that ethnic inequality strengthens ethnic
identification.
This paper fills this gap. We argue and empirically demonstrate that individuals identify
more strongly with their ethnicity when their ethnic group is either much poorer or much richer
than other groups of their country. The magnitude of the effect of between-ethnic group
inequality (BGI), however, depends on how wealth is distributed among the members of the
ethnic group: BGI’s effect strengthens as within-ethnic group inequality (WGI) decreases. That
is, individuals identify most strongly with their ethnic identity when ethnicity is reinforced by
inequality.
We posit that the relationship is driven by two main mechanisms. First, when WGI is
low, BGI increases the salience of ethnicity. This mechanism draws from the classical literature
2
on coinciding and reinforcing cleavages (e.g., Lipset 1960). When ethnicity is reinforced by
inequality, individuals are more likely to identify with their co-ethnics because they share similar
living conditions as them but have very different living conditions than members of other ethnic
groups. The second mechanism operates through the effect of ethnic inequality on policy
preferences. Between-group inequality increases the gap in the preferences over economic
policies between members of different ethnic groups. For example, members of poor groups will
be more supportive of pro-poor policies, such as a public health, than members of richer groups.
At the same time, when WGI is low, members of the same ethnic groups tend to share similar
policy preferences. Therefore, individuals will perceive themselves as closer to their co-ethnics,
and will be more likely to identify with them.
We test our hypothesis using data from rounds 3, 4 and 5 of the Afrobarometer. The
dataset covers 21 sub-Saharan African countries and 85 ethnic groups. Using ordered logit
models with country and survey round fixed-effects, we find strong support for our hypothesis:
BGI increases the likelihood that a respondent identifies with his/her ethnicity (as opposed to
his/her nationality), and the effect strengthens as WGI decreases. At very high levels of WGI, the
effect of BGI fails to attain statistical significance. The results are robust to multiple sensitivity
tests. In addition to testing the effect of BGI and WGI on the strength of ethnic identities, we test
several implications of the two causal mechanisms we propose.
The empirical focus on sub-Saharan Africa is mainly motivated by practical issues. The
Afrobarometer has particularly good questions on the strength of ethnic identities. While other
large cross-national surveys, such as the World Value Survey (WVS), also have questions on
whether respondents identify with their ethnicity or nationality, the questions of the
Afrobarometer better capture the concept of interest. Wave 3 of the WVS, for instance, has a
3
binary question for whether respondents identify more with their nationality or ethnicity. The
Afrobarometer, however, has a more precise question that ranges from one to five. It thus
captures the intensity of ethnic identities, not only whether the respondent identifies with
ethnicity or not.
2. The Strength of Ethnic Identities
Following the previous literature, we define the terms ‘ethnicity’ or ‘ethnic group’ as “the
nominal [membership] of an ascriptive category such as race, language, caste, tribe, or religion”
(Chandra 2004: 2). Although necessary, nominal membership in an ethnic group is not sufficient
for someone to identify primarily with his/her ethnicity. People have multiple sources of identity
beside ethnicity, such as nationality, gender, class, and region. Ethnicity needs to be ‘activated’
in order to serve as a relevant source of identity. We can only consider ethnicity as being
‘activated’ if an individual professes attachment to his/her nominal ethnic category (Chandra
2012: 9). We thus adopt a ‘constructivist’ rather than a ‘primordialist’ view of ethnicity. The
latter would suggest that ethnicity is inevitably salient. Instead, our argument relies on the
assumption that the strength of people’s ethnic identities can change in response to a variety of
socio-economic and political factors. We posit that ethnic inequality is one of these factors.
There is a large ‘constructivist’ literature that explores the determinants of the strength of
ethnic identities.3 Scholars argue that a variety of socio-economic factors affect the potency of
ethnic identities, including modernization (Deutsch 1953; Gelner 1983), social pressures within
ethnic communities (Laitin 1998), ethnically-bounded patronage networks (Bates 1974; Chandra
2004), and information shortages in new democracies (Birnir 2007; Conroy-Krutz 2012).
Another strand of research demonstrates that ethnic identities are politically constructed through
particular institutions (e.g. Posner 2005; Roeder 2007) or violence (Shayo and Zussman 2011; 3 See Fearon and Laitin (2000) and Chandra (2012) for reviews of this literature.
4
Sambanis and Shayo 2013). For instance, Posner (2005) argues that competitive elections in
Zambia prompted individuals to shift their identities from small tribe-based communities to large
ethno-linguistic groups. Investigating judicial decisions in Israel, Shayo and Zussman (2011)
find that terrorism increases the likelihood that judges make decisions favorable to their co-
ethnics.
A number of authors have employed individual-level surveys to study the determinants of
ethnic identification (e.g., Elkins and Sides 2007; Eifert et al. 2010). For example, Eifert et al.
(2010) demonstrate that, in Africa, political competition encourages individuals to identify with
their ethnicity. Building on their work, Higashijima and Nakai (2016) show that political
competition also plays a key role in the Baltic states. They find that temporal proximity to
competitive elections fuels ethnic attachments whenever there are strong ethnic parties. Elkins
and Sides (2007), for their part, show that minority groups are more likely to identify with their
ethnicity than groups that form a majority. They also find that, contrary to what a celebrated
literature argues, federalism and proportional representation have little effect on whether
members of minority groups identify with their nation rather than their ethnicity. Gibler et al.
(2012) explore the impact of conflicts. They show that interstate territorial disputes strengthen
national identities in targeted states, while civil conflicts foster ethnic identification.
3. Ethnic Inequality and The Strength of Ethnic Identities
Most authors working on the effect of ethnic inequality, for example on civil wars, ethnic voting
or democratic consolidation, assume that between-ethnic group inequality (BGI) strengthens
ethnic identities (e.g., Cederman et al. 2011; Huber and Suryanarayan 2016). The question of the
effect of within-ethnic group inequality (WGI), however, is much more contentious. The
literature can be divided into two camps.
5
A first group of authors – whose focus is on ethnic civil wars – argues that ethnic groups
with high WGI levels are more likely to instigate civil wars (e.g., Esteban and Ray 2008; Kuhn
and Weidmann 2015; Gates 2002).4 On the one hand, WGI creates a large group of poor
individuals with low opportunity costs that are willing to fight for low salaries and access to
spoils. On the other hand, WGI concentrates resources in the hand of a small elites within the
ethnic group, which can finance the war. According to these authors, WGI thus promotes civil
war because it enhances the capacity of the group to mobilize fighters and finance the war.
The second group of authors instead posits that WGI weakens ethnic identities (e.g.,
Gubler and Selway 2012; Houle 2015; Houle and Bodea 2017; Houle et al. 2017; Sambanis and
Milanovic 2011; Stewart 2000). Their argument is based on the classical literature on reinforcing
and cross-cutting cleavages (Lipset and Rokkan 1967; Rae and Taylor 1970). While most authors
from the first school of thought work on civil wars, authors in this second group work not only
on civil wars but also on democratic consolidation, coups, and ethnic voting, among other
subjects. This latter point is important because democratic breakdowns, coups and ethnic voting,
for example, unlike civil wars, do not require the prolonged mobilization of large fighting forces.
According to these authors, WGI reduces an ethnic group’s cohesion, which, for example,
decreases ethnic voting.
This paper espouses the view of the second group of authors. The argument made by the
first group – while highly relevant to phenomena that require prolonged large-scale mobilization
such as civil wars – is not as relevant when one looks at the question of the strength of ethnic
identities. The latter authors focus on the effect of WGI on a group’s ability to finance a war. Yet
4 It must be noted that these authors – with the exception of Kuhn and Weidmann (2015) – focus
on the direct effect of WGI, not on whether WGI conditions the effect of BGI. Therefore, the
question they address is fundamentally different than ours.
6
simply identifying with ethnicity does not require large financial resources or the mobilization of
large fighting forces.5 We thus argue that members of ethnic groups that are either much richer or
much poorer than other groups of the same country should be more likely to identify with their
ethnicity, and that the magnitude of the effect of between-group differences is conditional on the
level of inequality within ethnic groups: BGI’s effect weakens as WGI increases.6 In other
words, individuals identify more strongly with their ethnicity when ethnic and economic
cleavages reinforce one another than when they cross-cut each other.
Hypothesis 1: BGI strengthens ethnic identities and its effect weakens as WGI increases.
To be clear, our argument is not totally new to the literature. Horowitz (1985, 1971), in
particular, distinguishes between ranked group systems – in which class reinforces ethnicity –
and unranked group systems – in which class cross-cuts ethnicity.7 Despite the similarities, there
are at least two important differences between our argument and Horowitz’s (1985, 1971). The
first difference is conceptual. Ranked groups are not only ranked in terms of class but also in
5 It remains possible that WGI concentrates resources among political entrepreneurs, which may
enable them to mobilize their co-ethnics and strengthen ethnic identities. Which effect dominates
is ultimately an empirical question. The evidence provided below suggests that WGI weakens the
effect of BGI.
6 This also implies that, for example, groups with high (or intermediate) WGI and low (or
intermediate) BGI should only weakly identify with their ethnicity. Under such conditions, there
is little difference between members of different groups and members from the same group lack
cohesiveness. Individuals should identify with their social class rather than their ethnicity. As
shown in the right panel of Figure 2, our results indeed suggest that such groups have low levels
of ethnic identification.
7 Horowitz (1971) employs the terms horizontal and vertical ethnic arrangements instead.
7
terms of political and social statuses. In contrast, we do not assume that a group’s political and
social statuses always coincide with its economic status. In fact, in our dataset many poor groups
have historically been politically dominant (e.g., Hausas-Fulanis in Nigeria), and many rich
groups are politically marginalized.8
The second distinction pertains to the argument itself. Contrary to us, Horowitz (1985,
1971) does not argue that ethnicity is more relevant among ranked than unranked systems, or that
the former are more likely to experience ethnic conflicts. Instead, according to him, they are
simply susceptible to different kinds of conflicts: in ranked systems conflict takes the form of a
social revolution, and in unranked systems of competition over resources and political power
(Horowitz 1985: 29-32). The former is a form of class conflict, while the latter is purely ethnic.
In contrast, our argument suggests that ethnicity is more relevant when it is reinforced by
inequality.
We theorize that the relationship is driven by two mechanisms. First, large differences in
income/wealth across ethnic groups combined with low levels of inequality within groups
increase the salience of ethnicity. A large literature on reinforcing and cross-cutting cleavages
finds that individuals are more likely to identify with other members of their groups along one
cleavage (e.g., ethnicity) when they find themselves in the same group as them along other
cleavages (e.g., social class) (Bates 1974; Hetcher 1975; Houle 2015; Lipset 1960; Rae and
Taylor 1970; Selway 2011). For example, using experimental data, Dunning and Harrison (2010)
show that cross-cuttingness reduces ethnic voting in Mali.
8 Of the 20 ethnic groups that are coded as politically excluded in our dataset (based on the
Ethnic Power Relations dataset), 10 are poor and 10 are rich. Therefore, there is little correlation
between economic and political statuses.
8
These arguments suggest that between-group inequality should intensify ethnic identities
whenever within-group inequality is low. Individuals are particularly likely to identify with their
co-ethnics when they live under economic conditions similar to theirs (WGI is low) but very
different from those of members of other groups (BGI is high). Large economic differences
between groups, combined with within-group homogeneity, encourage individuals to draw sharp
lines between ‘us’ and ‘them,’ which erode feelings of belonging to the same nationality and
strengthen ethnic attachments. When BGI is high and WGI low, members of different ethnic
groups are also likely to be part of different social networks, which reduces interactions among
them.
Moreover, when ethnic cleavages are salient, political entrepreneurs have incentives to
appeal to ethnicity to gain political power, which magnifies the salience of ethnic identities even
further (Posner 2005; Higashijima and Nakai 2015). Politicians appeal to their co-ethnics by
adopting ethnically exclusive policies and by rallying around symbols that allegedly express the
history and memories of the ethnic group, thereby ‘scapegoating’ members of other groups.
These tactics are likely to be most successful when ethnicity is reinforced by economic
inequality because such conditions create clear demarcations between ‘insiders’ and ‘outsiders.’
These different effects are mutually reinforcing and result in a process whereby ethnic identities
becomes gradually more and more salient (Eifert et al. 2010).
Section 1 of the online appendix tests two of the implications of this mechanism. Both
tests rely on data from the Afrobarometer. First, this mechanism implies that, whenever BGI is
high, individuals ‘correctly’ perceive BGI as being elevated. We thus show that BGI indeed
increases the extent to which individuals believe that inequality between ethnic groups is high,
and that its effect weakens as WGI increases.9 Second, we demonstrate that BGI reduces trust
9 See Table A1 and Figure A1.
9
toward members of other ethnic groups and that its marginal effect is strongest at low levels of
WGI.10 This suggests that reinforcing ethnic and economic cleavages do enhance animosity
between groups.
Contrary to the first mechanism, the second one operates through the effect of ethnic
inequality on policy preferences. It relates strictly to the programmatic aspects of politics. When
BGI is high and WGI is low, members of different ethnic groups tend to have radically different
preferences over policies. At the same time, members from the same groups have similar policy
preferences. Members of poor ethnic groups should be more supportive of pro-poor policies,
such as income redistribution, public education or a high minimum wage, while members of
richer groups should be opposed to such policies.11 When WGI is low, BGI increases the degree
to which members of different ethnic groups support different economic policies and political
parties. Under such conditions, individuals will be less likely to identify with their nationality,
because they perceive members of other groups as having fundamentally different ideologies and
policy preferences. Instead, they will identify with their co-ethnics with whom they share
preferences over policies and parties.
Houle et al. (2017) directly test the effect of BGI across WGI levels on preferences for
redistribution among poor and rich ethnic groups. They use a total of 67 questions from the
Afrobarometer, the Latinobarometer, the World Value Survey and the Comparative Study of
10 See Table A2 and Figure A2.
11 This argument is essentially an extension of the arguments of Boix (2003) and Acemoglu and
Robinson (2006) about the effect of inter-group inequality on preferences over economic policies
to a situation in which groups are ethnic groups (rather than social classes). Acemoglu and
Robinson (2006: 109-113) extend their model to include between- and within-ethnic group
inequality and arrive to conclusions similar to ours.
10
Electoral Systems to construct a group-level indicator of support for redistribution. It captures
the degree to which an average member of the ethnic group supports pro-poor policies and
income redistribution toward the poor. They also compute group-level measures of BGI and
WGI using a methodology similar to ours (see below). Their dataset covers 62 countries and 202
ethnic groups worldwide. Consistent with our argument, they find that, among rich ethnic
groups, BGI reduces support for pro-poor policies but only when WGI is low. When WGI is
elevated, however, BGI has no effect. Among poor groups, BGI increases support for
redistribution and again, the relationship only holds when WGI is low. Houle et al.’s (2017)
findings provide strong evidence in favor of the second mechanism since they show that, when
BGI is high and WGI is low, members of different ethnic groups have different policy
preferences.
Section 1 of the online appendix reports an additional test of this mechanism that uses
data from the Afrobarometer. We measure respondents’ preferences for redistribution using a
methodology similar to that of Lieberman and McClendon (2013), who employ a question asking
respondents to list the three policy issues that they think are the most important. Our measure
ranges from 0 to 3 and indicates the number of policy issues named by the respondent that relate
to redistribution or other pro-poor policies. Table A3 tests the effect of BGI on preferences for
redistribution by including interaction terms between the variables capturing ethnic inequality
(BGI, WGI, BGI*WGI), on the one hand, and a dummy variable that takes the value one if the
group is poorer than the average citizen of its country.
Consistent with our argument, we find that, at low levels of WGI, BGI increases the gap
between the preferences of poor and rich ethnic groups. Among poor groups, BGI increases
support for pro-poor policies and its effect weakens as WGI increases.12 Its effect among rich
12 See Figure A3.
11
groups, although in the expected direction, is not significant. In any event, our argument is about
the effect of BGI/WGI on the difference in policy preferences between groups, not necessarily its
effect on rich groups in particular. Our estimations do show that BGI creates a gap in policy
preferences: the interaction terms between BGI and BGI*WGI and the dummy variable for poor
groups are highly significant. If BGI strongly increases support for redistribution among poor
groups and weakly reduces it among rich groups, then it does widen the gap in preferences
between poor and rich ethnic groups.13 In fact, as discussed above, Houle et al. (2017) do find
that BGI and WGI affect support for redistribution in the way expected by our argument for both
poor and rich groups.14
Although scholars have long suggested that ethnic inequality activates ethnic identities
(Hechter 1975; Bates 1974), to our knowledge, there is no large-N cross-national analysis of the
effect of ethnic inequality on the strength of ethnic identities. Solt (2011) and Ray (Forthcoming)
are among the few studies that employ survey data to examine the effect of inequality on national
and ethnic identities. Using the World Values Survey, Solt (2011) finds that economic inequality
(measured with Gini coefficients) fosters nationalism. However, unlike us, he focuses on general
income inequality, not ethnic inequality. Ray (Forthcoming) examines the implications of
political and economic inequalities between ethnic groups. He finds that, although between-
13 Moreover, respondents may be reluctant to openly state to an interviewer that they do not
support helping the poor. This would reduce the estimated effect of BGI on hostility toward pro-
poor policies, and could explain why the magnitude of the relationship is weaker for members of
rich groups (who are more likely to oppose such policies both according to our argument and the
empirical findings).
14 Also, we find no evidence that the effect of BGI on the strength of ethnic identities is stronger
among poor groups (model 1 of Table A7, online appendix).
12
group political inequality is negatively associated with national pride, between-group economic
inequality has little effect. His research, however, does not consider the possibility that the
impact of between-group economic inequality is conditional on the distribution of wealth within
groups. As our theory and empirics show, the effect of between-group inequality on the strength
of ethnic identities varies across within-group inequality levels.
Finally, while this is the first study to look at the effect of ethnic inequality on the
strength of ethnic identities, there are a number of other studies that have examined the effect of
ethnic inequality on ethnic voting. Huber and Suryanarayan (2016), who focus on India, and
Kolev and Wang (2010) find that ethnic inequality fosters ethnic voting. However, they do not
look at whether the effect is conditional on the level of inequality within groups. In addition,
Houle et al. (2017), in a clear parallel to us, find that between-ethnic group inequality increases
ethnic voting and that its effect weakens as within-ethnic group inequality increases. However,
the questions of the effects of ethnic inequality on ethnic voting and the strength of ethnic
identities are two fundamentally different questions. It is not because co-ethnics vote for the
same political parties that they necessarily identify with their ethnicity rather than their
nationality (Eifert et al. 2010). Moreover, these three studies employ the country or the ethnic
group as the unit-of-analysis. By contrast, in this paper, we look directly at the effect of ethnic
inequality on the strength of ethnic identities at the individual-level.
4. Data and Testing Strategy
We test our hypothesis with survey data from rounds 3, 4 and 5 of the Afrobarometer. The unit-
of-analysis is the individual (respondent) and the sample covers around 50,000 respondents. It
covers 21 sub-Saharan African countries and 85 ethnic groups.15 Our dependent variable (the
15 The countries are listed in Table A5 of the online appendix.
13
strength of ethnic identities) and independent variables (BGI and WGI) are always constructed
using the same survey.
The indicators of BGI and WGI are ethnic group-level variables. This is important
because our argument is primarily about how the economic situation of a given ethnic group
affects the identity of members of that particular group rather than of all groups in a country.
Moreover, there is considerable variation across ethnic groups of the same country in both BGI
and WGI. For example, in Senegal, while the Diola have an average BGI level at the 99 th
percentile of the distribution, that of the Mandingues is below the 34th percentile. Therefore,
country-level indicators would be poor proxies for group-level indicators. In fact, our analysis
uses country fixed-effects and thus controls for country-specific factors.
We identify ethnic groups using the Ethnic Power Relations (EPR) dataset, which only
includes ethnic groups that are deemed politically relevant. We omit some of the countries
covered by the Afrobarometer because they are coded as ethnically homogenous in the EPR
(e.g., Lesotho). We cannot calculate indicators of inequality between and within ethnic groups
for such countries. Moreover, the question of the strength of ethnic identities is less relevant for
them.
We have omitted South Africa from the sample.16 Groups in South Africa are races
whereas in other countries they are linguistic groups or tribes. Respondents, especially White
respondents, may feel uncomfortable reporting that they identify with their race rather than their
nation, which creates a strong social desirability bias. For example, in round 3 of the South
African survey, only 4 White respondents (1 English-Speaker and 3 Afrikaners) answered that
they only identify with their racial group. We observe a similar pattern for Black groups. This is
16 However, results are unchanged when we include data from all three rounds of the South
Africa surveys (Table A19, online appendix).
14
especially striking given that ethnic identities are known to play a central role in South African
elections (Ferree 2006). In fact, South African elections have been called ‘racial censuses.’17
4.1 Dependent Variable and Testing Strategy
Our dependent variable, Strength of Ethnic Identities, is a categorical variable ranging from 1 to
5. It is based on the following question from the Afrobarometer, which is also used in previous
research to measure ethnic identification (Gibler et al. 2012):
Let us suppose that you had to choose between being a national ID and being a [R’s Ethnic Group]. Which of the following best expresses your feelings?1= I feel only (R’s ethnic group),2= I feel more (R’s ethnic group) than national ID3= I feel equally national ID and (R’s ethnic group)4=I feel more national ID than (R’s ethnic group)5= I feel only national ID
We reverse the index such that higher values on Strength of Ethnic Identities indicate that the
respondent identifies more closely with his/her ethnic group as oppose to his/her national
identity.
Since our dependent variable is categorical, we employ ordered logit models. We include
survey round and country fixed-effects to control for temporal and country-level heterogeneity.
Our empirical strategy is thus similar to that of Eifert et al. (2010), although they use logit
models (rather than ordered logit models) because their dependent variable is binary. We also
redo the analysis using ethnic group fixed-effects (rather than country fixed-effects) and survey
round fixed-effects to deal with the possibility that ethnic inequality is correlated with group-
level unobserved factors.
4.2 Independent Variables
Our indicators of BGI and WGI are ethnic group-level indicators that, for each of the 85 ethnic
groups included in the analysis, measure the level of inequality between an average member of
17 Summary statistics for all variables are available in Table A4 of the online appendix.
15
the group and an average citizen of the country, and the level of inequality among members of
the ethnic group, respectively. Our methodology is similar to that of Houle (2015), Houle and
Bodea (2017) and Houle et al. (2017). The Afrobarometer asks the respondents to identify their
ethnicity. We construct our measures of BGI and WGI by matching the ethnic groups reported
by the respondents in the Afrobarometer with those identified by the EPR.
Unfortunately, the Afrobarometer has no question on the respondents’ income. One of the
reasons is that a large proportion of the population in sub-Saharan Africa are subsistence farmers
who have little access to monetized income (Baldwin and Huber 2010; Bratton 2008). However,
the Afrobarometer does ask questions that are meant to capture the wealth of the respondents.
The previous literature that relies on the Afrobarometer has used these questions to construct
indicators of asset-based wealth (ABW) (e.g., Dionne et al. 2014; Houle 2015; Houle and Bodea
2017; Østby 2008). We follow this approach. The Afrobarometer asks questions on the
ownership of a television, a radio and a motor vehicle. We use the answers to these questions to
construct an indicator that takes the value 0 if the respondent has none of these goods and 3 if
he/she owns all three goods (we then normalize the index such that it ranges from 0 to 1).
One possible problem with this approach is that the ABW tends to underestimate
inequality because it does not differentiate between respondents that own all three assets and that
are well-off without being rich, and those that own the three assets and that are rich (Huber and
Mayoral 2014). In other words, it does not distinguish between the well-off and the very rich at
the top of the income/wealth distribution. We do not believe that this is a major problem for our
analysis for two main reasons. First, only about eight percent of the respondents in our sample
have all three goods, which limits the potential impact of this issue on our indicators. Second, the
main problem with using ABW arises when one also uses other surveys that rely on other types
16
of questions (e.g., questions that directly ask the income of the respondents). In those instances,
inequality would be underestimated for some countries (or groups) but not for others, which
would introduce bias. In our case, however, inequality is always calculated using the ABW.
Between-group inequality (BGI) of ethnic group l of country v is measured as follow:
BG I l ,v=[ log( gl , v
G v)]
2
where gl , vrefers to the average ABW score of members of group l of country v, and Gvto the
average ABW score of country v. BGI captures the difference in asset-based wealth between an
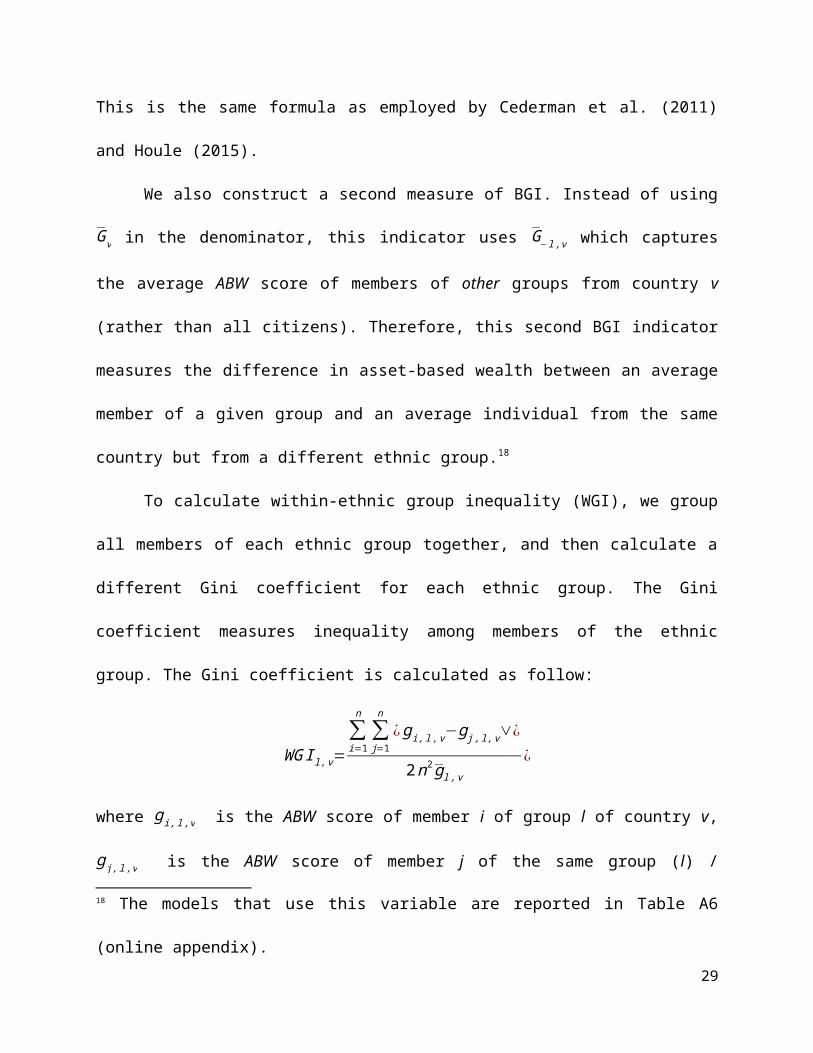
average member of a given group and an average citizen of the country. This is the same formula
as employed by Cederman et al. (2011) and Houle (2015).
We also construct a second measure of BGI. Instead of using Gv in the denominator, this
indicator uses G−l , v which captures the average ABW score of members of other groups from
country v (rather than all citizens). Therefore, this second BGI indicator measures the difference
in asset-based wealth between an average member of a given group and an average individual
from the same country but from a different ethnic group.18
To calculate within-ethnic group inequality (WGI), we group all members of each ethnic
group together, and then calculate a different Gini coefficient for each ethnic group. The Gini
coefficient measures inequality among members of the ethnic group. The Gini coefficient is
calculated as follow:
WG I l ,v=∑i=1
n
∑j=1
n
¿ gi , l ,v−g j ,l , v∨¿
2n2 g l , v
¿
18 The models that use this variable are reported in Table A6 (online appendix).
17
where gi ,l , v is the ABW score of member i of group l of country v, g j ,l , v is the ABW score of
member j of the same group (l) / country (v), and n is the total number of individuals in group l.19
Our analysis, however, could be affected by reverse causality. Groups that identify most
strongly with their ethnicity may vote along ethnic lines and adopt policies that are only
beneficial to their co-ethnics. This, in turn, would increase inequality between groups.
Unfortunately, we are not aware of any exogeneous group-level instruments for ethnic inequality
that we could use to conduct an instrumental variable analysis. However, we do not believe that
reverse causation drives our results. Evidence suggests that ethnic inequality significantly
predates the creation of states. Yet it is only within the context of a multiethnic state that
individuals can use political power to favor their co-ethnics. For example, Alesina et al. (2016:
428) examine “the roots of ethnic inequality and establish that differences in geographic
endowments across ethnic homelands explain a sizable fraction of the observed variation in
economic disparities across groups.” They find that variation in geographic endowments across
groups explains about 55 percent of the variation in ethnic inequality across countries. This
suggests that our results are primarily driven by the effect of ethnic inequality on the strength of
ethnic identities rather than the opposite. However, we concede that reverse causality potentially
remains an important limitation with our analysis.
19 The distributions of BGI and WGI are shown in Figures A4 and A5 (online appendix),
respectively. Since there are a number of outliers with high BGI values, we redo the analysis
without BGI values above the 90th, 95th and 99th percentiles of the distribution and without
observations with a Cook’s distance above 4/n in the online appendix. Figures A11 and A12
show the variation in BGI and WGI within groups over time, respectively (they only include
groups for which there is more than one survey).
18
There are two alternative group-level measures of BGI and WGI that warrant discussion:
Houle (2015) and Kuhn and Weidmann (2015). Our indicators of BGI and WGI are constructed
using a similar methodology to Houle (2015). However, apart from the Afrobarometer, he also
uses data from five additional survey sources. In addition, he only covers democracies. Since
there are few consolidated democracies in sub-Saharan Africa, we could not use his data. In any
event, we believe it is preferable to use the same survey to construct our measures of the strength
of ethnic identities and ethnic inequality.20
Kuhn and Weidmann (2015) also construct group-level indicators of BGI and WGI.
Rather than using survey data, however, they rely on data on nightlight emissions along with
maps on ethnic group settlement. Cederman et al. (2011) and Alesina et al. (2016) employ a
similar methodology to calculate measures of BGI (but not WGI), although Cederman et al.
(2011) use data on the spatial dispersion of wealth rather than nightlight emissions.
Despite its advantages, this approach also has a number of drawbacks (Huber and
Mayoral 2014). In particular, whenever people from different ethnic groups live in the same area,
it is difficult to differentiate between inequality across and within groups. Authors that employ
these methods have to assume either that the area is ethnically homogeneous or that WGI and
BGI are the same in the area (Huber and Mayoral 2014). Both assumptions are problematic,
especially since our aim is to distinguish between BGI and WGI. Indicators based on survey data
do not suffer from these problems because we can identify the ethnicity of each respondent.21
20 The indicators used by Houle and Bodea (2017) and Houle et al. (2017) are also similar to
those developed by Houle (2015) (and ours). The main difference is that they use slightly
different survey data sources.
21 Table A20 (online appendix) shows that our results are robust when we employ the indicators
of Kuhn and Weidmann (2015). We cannot redo the models that employ ethnic group fixed-
19
Cederman et al. (2011) provide another group-level dataset of BGI, but they do not have
a measure of WGI. In addition to these group-level datasets, a number of scholars have
developed country-level measures of BGI (but not WGI) (e.g., Alesina et al. 2016; Baldwin and
Huber 2010; Østby 2008). Finally, Selway (2011) has constructed an indicator of the level of
cross-cuttingness of ethnic and economic cleavages (i.e. the degree to which people from
different ethnic groups share the same class affiliations). Again, this indicator captures cross-
cuttingness at the country-level, not the group-level.
4.3 Control Variables
We include individual-level, group-level and country-level control variables. We take individual-
level variables from the Afrobarometer: the age of the respondents, dummy variables for female
respondents, employed respondents and respondents living in urban areas, and a variable
capturing the respondents’ level of education. We also include ABW, which, as explained above,
captures the wealth of the respondents.
Our analysis also controls for a number of group-level variables. We control for the size
of the ethnic group (EPR) because it may be related to the salience of ethnicity (Posner 2004).
Moreover, the effect of ethnic inequality may depend on whether an ethnic group is rich or poor.
It is possible, for example, that ethnic inequality creates more grievances among poor groups.
We thus include a dummy variable that indicates whether the average ABW score of the ethnic
group is lower than the average ABW score of the country. It is possible that ethnic exclusion
incites individuals to identify with their ethnic groups. Therefore, we include a dummy variable
that takes the value one if an ethnic group is coded as being politically excluded according to the
EPR (Wimmer et al. 2009).
effects because the indicators of Kuhn and Weidmann (2015) do not vary within ethnic groups
over time.
20
At the country-level, we control for GDP per capita logged as well as the growth rate
(World Development Indicators). According to the modernization theory, individuals should be
less likely to identify with their ethnicity in richer countries. Individuals may be particularly
likely to identify with their ethnicity in partial democracies. Such countries often have weak
political parties. Weak party labels create incentives both for voters to use ethnicity as an
information cue and for political entrepreneurs to appeal to ethnicity (Birnir 2007). We thus
include the Polity score along with its square.
As explained above, Eifert et al. (2010) find that electoral competitiveness increases
ethnic identification in Africa. We control for electoral competitiveness by calculating the
difference in vote shares of the two top candidates in the most recent presidential election in
presidential systems, and the difference between the two parties with the most votes in the most
recent election in parliamentary systems (Electoral Margin). Additional control variables
included in robustness tests are discussed in Section 5.2 below.
5. Empirical Results
5.1 Main Analysis
Models 1 and 2 of Table 1 test the effect of BGI on the strength of ethnic identities with country
and survey round fixed-effects. All models employ ordered logit. In order to test our hypothesis
that the effect of BGI is conditional on WGI, we include an interaction term between BGI and
WGI. Our hypothesis would be supported if the coefficient on BGI is positive and that on
BGI*WGI is negative. Under such conditions, BGI would strengthens ethnic identification but its
effect weakens as WGI increases.
[Table 1 about here]
21
Model 1 estimates the relationship without control variables. The coefficients on BGI and
BGI*WGI are of the expected signs and statistically significant at the 0.001 level. Model 1 of
Table A9 (online appendix) redoes model 1 of Table 1 without the interaction term between BGI
and WGI. BGI strengthens ethnic identification but its effect is not statistically significant.
Moreover, we run a Wald test of whether adding BGI*WGI in model 1 of Table 1 increases the
fit of the model, and we find that it does (chi-square= 33.94, p-value<.0001).22 These findings are
consistent with those of Ray (Forthcoming), who finds that economic inequality between ethnic
groups has little effect on the strength of national identities. Contrary to us, however, he does not
account for the possibility that the effect of BGI is conditional on WGI.
[Figure 1 about here]
Model 2 of Table 1 adds the control variables. Results are unchanged. Figure 1 estimates the
marginal effect of BGI on the likelihood that a respondent identifies only (left panel) or mostly
(right panel) with his/her ethnic group at different levels of WGI (values 5 and 4 on the Strength
of Ethnic Identities variable, respectively). The shaded areas represent 95 percent confidence
intervals. The control variables are set at their means. The marginal effect of BGI weakens as
WGI increases. In both panels, when WGI attains about 0.45, the effect of BGI is no longer
statistically significant at the five percent level. When WGI is above 0.53 the effect of BGI even
becomes negative and significant. However, less than two percent of observations have WGI
values above 0.53, so this is largely an out-of-sample result.23
[Figure 2 about here]
22 BGI is significant in other models of Table A9. However, in all models reported in Table 1
adding the interaction term increases the fit of the model: model 2 (chi-square=65.69, p-
value<.0001); model 3 (chi-square= 29.34, p-value<.0001); and model 4 (chi-square= 49.59, p-
value<.0001).
22
Figure 2 shows the effect of BGI on the predicted probability that a respondent only identifies
with his/her ethnicity among ethnic groups with low WGI (10th percentile of the distribution) and
high WGI (90th percentile). Again, control variables are set at their means. While BGI strongly
increases the likelihood that an individual only identifies with his/her ethnicity in groups with
low WGI, it has virtually no effect in those with high BGI.24
Models 3 and 4 redo the analysis using ethnic group fixed-effects rather than country
fixed-effects (survey round fixed-effects are still included). Variables that are constant within
groups over time (Size and Poor) are not included in model 4. Our findings are unchanged.25
Results on most control variables are consistent with the findings of the previous
literature. Individuals that are richer (as captured by ABW), more educated and that are employed
are more likely to identify with their nationality rather than their ethnicity. Respondents are more
likely to identify with their ethnicity in partial democracies, when elections are highly
competitive and when a country is experiencing an economic crisis. Consistent with Huber
(2012), who finds that ethnic voting is more elevated in rich countries, our results suggest that
individuals identify more closely with their ethnicity in African countries with relatively high
income per capita. Like Elkins and Sides (2007), we find that members of small groups are more
23 Figures A6-A8 (online appendix) redo Figure 1 separately for the three other values of the
Strength of Ethnic Identities variable. As expected, BGI reduces the likelihood that an individual
identifies more with his/her nationality than his/her ethnicity when WGI is low.
24 Figure A9 (online appendix) shows the effect of BGI on the predicted probability that a
respondent mostly identifies with ethnicity at low and high WGI levels. The relationship follows
a similar pattern as in Figure 2.
25 Figure A10 (online appendix) redoes Figure 1 based on model 4.
23
likely to identify with their ethnicity. Finally, members of poor ethnic groups identify more
strongly with their ethnicity.
5.2 Robustness Tests
The online appendix shows that our results are robust to a large number of additional tests. Our
indicators of BGI and WGI are constructed from the Afrobarometer surveys. Some ethnic groups
are relatively small and so our measures for these groups rely on a small number of respondents.
We thus omit groups that account for less than five percent of the population of the country.26
There are a number of observations with very large BGI values.27 We redo the analysis
without observations with BGI levels above the 90th, 95th and 99th percentile of the distribution.
We also exclude observations with a Cook’s distance above 4/n.28
We include additional control variables:29 a dummy variable for whether the respondent
is poorer than an average member of his/her ethnic group (Poor Respondent); number of years
between the survey and the nearest election (Electoral Distance);30 a dummy variable for
whether there is an ongoing civil war (PRIO; Gleditsch et al. 2001), the time since the last civil
war, a dummy variable for whether there is a militarized interstate dispute (Correlates of War);
26 See Table A10.
27 See Figure A4.
28 See Tables A8 and A21, respectively.
29 See Tables A11-A18.
30 The variable Electoral Distance takes the value 0 if there is an election in the same year as the
survey, 1 if there were an election the year before the survey or the year after the survey, and so
on. Since Eifert et al. (2010) argue that the effect of electoral distance is conditional on electoral
competitiveness, we rerun the analysis with an interaction term between Electoral Margin and
Electoral Distance (Table A12).
24
dummy variables for whether a group is regionally-based, urban- and regionally-based or
dispersed (Geo-EPR); a variable capturing the proportion of members of the group that live in
urban areas (constructed from the Afrobarometer); a group’s presence in commerce, farming and
the military (constructed from the Afrobarometer); a group’s historical access to power
(constructed from the EPR); a group’s history of conflict (constructed from the EPR).31
It is possible that the effect of ethnic inequality depends on whether an ethnic group is
rich or poor. Model 1 of Table A7 includes interaction terms between Poor Group, on the one
hand, and BGI, WGI and BGI*WGI, on the other hand. We find that the effect of ethnic
inequality is stronger among rich groups. These results suggest that the effect of BGI is not
completely driven by feelings of economic deprivation. We also estimate whether the
relationship differs depending on whether the respondent is rich or poor using two tests. First, we
interact Poor Respondent with BGI, WGI and BGI*WGI (model 2). In the second test, we
interact ABW with BGI, WGI and BGI*WGI (model 3). Both tests suggest that the effect of BGI
does not depend on whether the respondent is rich or poor.
Finally, we make sure that there is no multicollinearity between BGI and WGI (the
correlation between the two variables is 0.0648). We rerun model 2 of Table 1 (without the fixed
effects and BGI*WGI) using OLS and calculate the variance inflation factor (VIF) for all
variables included in the model. No variable has a VIF above ten, which is the threshold used to
detect multicollinearity. The VIFs of BGI and WGI are 1.27 and 1.76, respectively.
6. Conclusion
In this paper, we argue that BGI strengthens ethnic identities and that its effect weakens as WGI
increases. We test this hypothesis by conducting the first large-N test of the effect of ethnic 31 See the notes below the tables for more information on how the variables have been
constructed.
25
inequality on the strength of ethnic identities at the individual-level. We find strong evidence that
members of ethnic groups with high BGI levels identify more strongly with their ethnicity and
that the effect is stronger among ethnic groups with low WGI levels.
This paper contributes to the literature on identity politics in at least three ways. First, we
provide robust evidence linking ethnic inequality and the intensity of ethnic identification.
Previous research has found that high ethnic inequality leads to civil war, democratic breakdown,
and ethnic voting, among other things. This research relies on the implicit assumption that ethnic
inequality strengthens ethnic identifications. Our findings complement this literature by
providing the first direct test of this assumption. We find that ethnic inequality does activate
ethnic identities.
Second, our analysis suggests that the effect of between-group inequality is contingent on
the level of inequality within ethnic groups: BGI’s effect is strongest when WGI is low. This
finding implies that patterns of social cleavages constrain people’s repertoire of identity: in
societies in which ethnic cleavages are reinforced by inequality, people tend to identify with their
ethnicity. However, in societies with cross-cutting cleavages, people are more likely to identify
with their nationality. This finding also contributes to the debate on the effect of WGI on the
strength of ethnic identities. While a number of authors suggest that WGI weakens ethnic
identities (e.g., Houle 2015; Stewart 2000), others argue that this effect is weak and that WGI
may actually foster civil wars, for example (e.g., Esteban and Ray 2008; Kuhn and Weidmann
2015). Our results are consistent with the view of the first group of authors.
Third, we provide empirical evidence for the two causal mechanisms we propose. First,
we show that as BGI increases, individuals are indeed more likely to perceive BGI as elevated,
especially when WGI is low. Second, BGI decreases trust toward members of other ethnic
26
groups and again its effect weakens as WGI increases. Finally, when WGI is low, BGI increases
the gap between the preferences over economic policies of poor and rich ethnic groups.
Our result suggests that, instead of looking at each social cleavage in isolation, the
literature ought to focus on the political implications of the structure of social cleavages (Lipset
1960). The mere presence of multiple ethnic groups does not imply that individuals necessarily
identify mostly as members of their ethnicity. Other factors are needed to explain why in some
cases people identify with their ethnicity rather than their nationality. Our findings suggest that
how ethnicity interacts with economic cleavages is one of these factors: ethnicity is likely to
have more influence when it is reinforced by inequality. In the future, the literature on the effect
of between-group inequality on civil war, democratic consolidation and public good provision,
among other subjects, should account for the conditioning effect of within-group differences.
One caveat with our analysis is that the sample is restricted to sub-Saharan Africa. As
explained above, this choice is primarily practical: questions on the strength of ethnic identities
from the Afrobarometer better capture the concept of interest. However, we do not believe that
our argument only applies to Africa. Many of the authors that assume that ethnic inequality
reinforces ethnic identities – for example, Cederman et al. (2011), Houle (2015), and Huber and
Suryanarayan (2016) – argue that the relationship holds worldwide or focus on non-African
countries (e.g., India in the case of Huber and Suryanarayan 2016). Whether or not the structure
of ethnic inequality has the same effect on the strength of ethnic identities outside sub-Saharan
Africa, however, is ultimately an empirical question. Extending this research to other regions is a
promising avenue for future research.
7. References
27
Acemoglu, Daron, and James Robinson (2006) Economic Origins of Dictatorship and
Democracy. New York: Cambridge University Press.
Alesina, Alberto, Stelios Michalopoulos, and Elias Papaioannou (2016) ‘Ethnic Inequality.’
Journal of Political Economy 124-2: 428-488.
Baldwin, Kate, and John Huber (2010) ‘Economic versus Cultural Differences.’ American
Political Science Review 104 (4): 644-662.
Bates, Robert H. (1974) ‘Ethnic Competition and Modernization in Contemporary Africa.’
Comparative Political Studies 6: 457-484.
Birnir, Johanna Kristin (2007) Ethnicity and Electoral Politics. New York: Cambridge
University Press.
Boix, Carles (2003) Democracy and Redistribution. New York: Cambridge University Press.
Bormann, Nils-Christian, and Matt Golder (2013) ‘Democratic Electoral Systems around the
World, 1946–2011.’ Electoral Studies 32 (2): 360-369.
Bratton, Michael (2008) ‘Poor people and democratic citizenship in Africa.’ In: Anirudh Krishna
(ed.) Poverty, Participation and Democracy. New York: Cambridge University Press.
Cederman, Lars-Erik, Nils B. Weidmann and Kristian Skrede Gleditsch (2011) ‘Horizontal
Inequalities and Ethno-Nationalist Civil War.’ American Political Science Review 105-3:
478-495.
Chandra, Kanchan (2004) Why Ethnic Parties Succeed. New York: Cambridge University Press.
Chandra, Kanchan ed. (2012) Constructivist Theories of Ethnic Politics, Oxford University
Press.
Conroy-Krutz, Jeffrey (2012) ‘Information and Ethnic Politics in Africa.’ British Journal of
Political Science 43-2: 345-373.
28
Deutsch, Karl (1953) Nationalism and Social Communication. Cambridge, Massachusetts: MIT
Press.
Dionne, Kim, Kris Inman, and Gabriella Montinola (2014) ‘Another Resource Curse? The
Impact of Remittances on Political Participation.’ Afrobarometer Working Paper No. 145.
Dunning, Thad and Lauren Harrison (2010) ‘Cross-Cutting Cleavages and Ethnic Voting.’
American Political Science Review 104-1: 21-39.
Eifert, Benn, Edward Miguel and Daniel N. Posner (2010) ‘Political Competition and Ethnic
Identification in Africa.’ American Journal of Political Science 54: 494-510.
Elkins, Zachary and John Sides (2007) ‘Can Institutions Build Unity in Multiethnic States?’
American Political Science Review 101-4: 693-708.
Esteban, Joan and Debraj Ray (2008) ‘On the Salience of Ethnic Conflict.’ American Economic
Review 98-5: 2185-2202.
Fearon, James and David Laitin (2000) ‘Violence and the Social Construction of Ethnic
Identity.’ International Organization 54: 845-877.
Ferree, Karen (2006) ‘Explaining South Africa’s Racial Census.’ The Journal of Politics 68-4:
803-815.
Gates, Scott (2002) ‘Recruitment and Allegiance.’ Journal of Conflict Resolution 46-1: 111-130.
Gelner, Ernst (1983) Nations and Nationalism. Ithaca: Cornell University Press.
Gibler, Douglas, Marc Hutchison, and Steven Miller (2012) ‘Individual Identity Attachments and
International Conflict’ Comparative Political Studies 45-12: 1655-1683.
Gleditsch, Nils Petter; Peter Wallensteen, Mikael Eriksson, Margareta Sollenberg and Håvard
Strand (2002) ‘Armed Conflict 1946–2001.’ Journal of Peace Research 39-5: 615–637.
29
Gubler, Joshua, and Joel Selway (2012) ‘Horizontal Inequality, Crosscutting Cleavages and Civil
War.’ Journal of Conflict Resolution 56(2): 206-232.
Hechter, Michael (1975) Internal Colonialism. Berkeley: University of California Press.
Higashijima, Masaaki and Ryo Nakai (2016) ‘Elections, Ethnic Parties, and Ethnic Identification
in New Democracies.’ Studies in Comparative International Development 51-2: 124-146.
Horowitz, Donald (1971) ‘Three Dimensions of Ethnic Politics.’ World Politics 23-2: 232-244.
Horowitz, Donald (1985) Ethnic Groups in Conflict. University of California Press.
Houle, Christian (2015) ‘Ethnic Inequality and the Dismantling of Democracy.” World Politics
67-3: 469-505.
Houle, Christian and Cristina Bodea (2017) ‘Ethnic Inequality and Coups in Sub-Saharan
Africa.” Journal of Peace Research 54-3: 382-396.
Houle, Christian, Paul Kenny, and Chunho Park (2017) ‘Does Ethnic Inequality Promote Ethnic
Voting?’ Working paper.
Huber, John (2012) ‘Measuring Ethnic Voting: Do Proportional Electoral Laws Politicize
Ethnicity?’ American Journal of Political Science 56(4): 986-1001.
Huber, John, and Laura Mayoral (2014) ‘Inequality, Ethnicity and Civil Conflict.’ Unpublished
Manuscript, Department of Political Science, Columbia University.
Huber, John and Pavithra Suryanarayan. (2016) ‘Ethnic Inequality and the Ethnification of
Political Parties.’ World Politics 68-1: 149-188.
Kolev, Kiril and Yi-Ting Wang (2010) ‘Ethnic Group Divisions and Clienterism.’ Paper
presented at the 2010 Annual Meeting of the American Political Science Association.
Kuhn, Patrick, and Nils Weidmann (2015) ‘Unequal We Fight: Between- and Within-group
Inequality and Ethnic Civil War.’ Political Science Research and Methods 3-3: 543-568.
30
Laitin, David (1998) Identity in Formation. Ithaca: Cornell University Press.
Lieberman, Evan and Gwyneth McClendon (2013) ‘The Ethnicity-Policy Preferences Link in
Sub-Saharan Africa.’ Comparative Political Studies 46-5: 574-602.
Lipset. Seymour Martin (1960) Political Man: The Social Bases of Politics. NY: Doubleday.
Østby, Gudrun (2008) ‘Polarization, Horizontal Inequalities, and Violent Civil Conflict.’ Journal
of Peace Research 45-2: 143-162.
Posner, Daniel (2005) Institutions and Ethnic Politics in Africa. New York: Cambridge
University Press.
Posner, Daniel (2004) ‘The Political Salience of Cultural Difference.’ American Political Science
Review 98-4:529-545.
Przeworski, Adam, Michael Alvarez, Jose Antonio Cheibub, Fernando Limongi (2000)
Democracy and Development. Cambridge: Cambridge University Press.
Rae, Douglas and Michael Taylor (1970) The Analysis of Political Cleavages. Yale University
Press.
Ray, Subhasish (2016) ‘Ethnic Inequality and National Pride.” Forthcoming in Political
Psychology.
Sambanis, Nicholas and Branko Milanovic. 2011. ‘Explaining the Demand for Sovereignty.’
Policy Research Working Paper Series, 5888. The World Bank.
Sambanis, Nicholas and Moses Shayo (2013) ‘Social Identification and Ethnic Conflict.’
American Political Science Review 107-2: 294-325.
Selway. Joel Sawat (2011) ‘The Measurement of Cross-Cutting Cleavages and Other
Multidimensional Cleavage Structures.’ Political Analysis 19-1: 48-65.
31
Shayo, Moses and Asaf Zussman (2011) ‘Judicial Ingroup Bias in the Shadow of Terrorism.’
The Quarterly Journal of Economics 126: 1447-1484.
Solt, Frederik (2011) ‘Diversionary Nationalism.’ The Journal of Politics 73-3: 821-830.
Stewart, Frances (2000) ‘Crisis Prevention: Tackling Horizontal Inequalities.’ Oxford
Development Studies 28-3: 245-242.
Wimmer, Andreas, Lars-Erik Cederman and Brian Min (2009) ‘Ethnic Politics and Armed
Conflict.’ American Sociological Review 74(2): 316-337.
World Bank. World Development Indicators (http://data.worldbank.org/data-catalog/world-
development-indicators).
32


![Milanovic Global Inequality.sg1[1] - World Bank€¦ · Global inequality and the global inequality extraction ratio: The story of the past two centuries Branko Milanovic1 World Bank](https://img.pdfslide.net/doc/110x75/5af38f967f8b9a5b1e8b4c87/milanovic-global-1-world-bank-global-inequality-and-the-global-inequality.jpg)