Embed Size (px)
Citation preview

CIT FINANCIAL SECTION
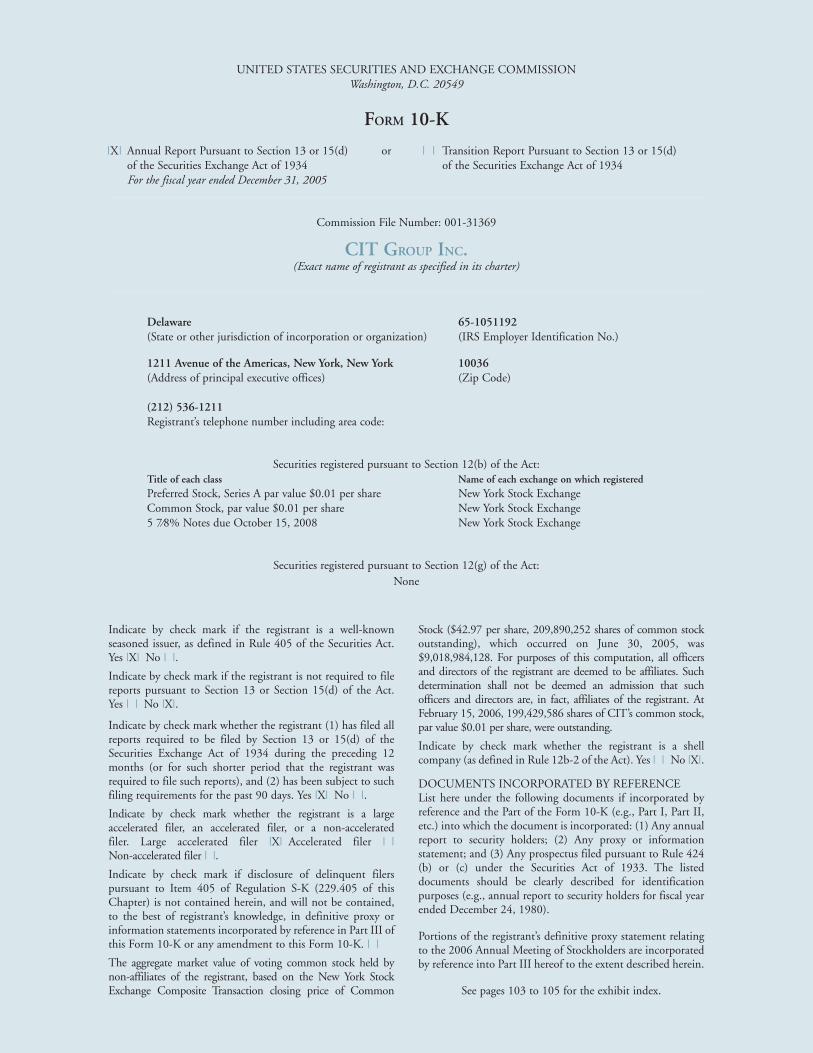
UNITED STATES SECURITIES AND EXCHANGE COMMISSIONWashington, D.C. 20549
FORM 10-K
|X| Annual Report Pursuant to Section 13 or 15(d) or | | Transition Report Pursuant to Section 13 or 15(d)of the Securities Exchange Act of 1934 of the Securities Exchange Act of 1934For the fiscal year ended December 31, 2005
Commission File Number: 001-31369
CIT GROUP INC.(Exact name of registrant as specified in its charter)
Delaware 65-1051192(State or other jurisdiction of incorporation or organization) (IRS Employer Identification No.)
1211 Avenue of the Americas, New York, New York 10036(Address of principal executive offices) (Zip Code)
(212) 536-1211Registrant’s telephone number including area code:
Securities registered pursuant to Section 12(b) of the Act:Title of each class Name of each exchange on which registeredPreferred Stock, Series A par value $0.01 per share New York Stock ExchangeCommon Stock, par value $0.01 per share New York Stock Exchange5 7⁄8% Notes due October 15, 2008 New York Stock Exchange
Securities registered pursuant to Section 12(g) of the Act:None
Indicate by check mark if the registrant is a well-knownseasoned issuer, as defined in Rule 405 of the Securities Act.Yes |X| No | |.
Indicate by check mark if the registrant is not required to filereports pursuant to Section 13 or Section 15(d) of the Act.Yes | | No |X|.
Indicate by check mark whether the registrant (1) has filed allreports required to be filed by Section 13 or 15(d) of theSecurities Exchange Act of 1934 during the preceding 12months (or for such shorter period that the registrant wasrequired to file such reports), and (2) has been subject to suchfiling requirements for the past 90 days. Yes |X| No | |.
Indicate by check mark whether the registrant is a largeaccelerated filer, an accelerated filer, or a non-acceleratedfiler. Large accelerated filer |X| Accelerated filer | |Non-accelerated filer | |.
Indicate by check mark if disclosure of delinquent filerspursuant to Item 405 of Regulation S-K (229.405 of thisChapter) is not contained herein, and will not be contained,to the best of registrant’s knowledge, in definitive proxy orinformation statements incorporated by reference in Part III ofthis Form 10-K or any amendment to this Form 10-K. | |
The aggregate market value of voting common stock held bynon-affiliates of the registrant, based on the New York StockExchange Composite Transaction closing price of Common
Stock ($42.97 per share, 209,890,252 shares of common stockoutstanding), which occurred on June 30, 2005, was$9,018,984,128. For purposes of this computation, all officersand directors of the registrant are deemed to be affiliates. Suchdetermination shall not be deemed an admission that suchofficers and directors are, in fact, affiliates of the registrant. AtFebruary 15, 2006, 199,429,586 shares of CIT’s common stock,par value $0.01 per share, were outstanding.
Indicate by check mark whether the registrant is a shellcompany (as defined in Rule 12b-2 of the Act). Yes | | No |X|.
DOCUMENTS INCORPORATED BY REFERENCEList here under the following documents if incorporated byreference and the Part of the Form 10-K (e.g., Part I, Part II,etc.) into which the document is incorporated: (1) Any annualreport to security holders; (2) Any proxy or informationstatement; and (3) Any prospectus filed pursuant to Rule 424(b) or (c) under the Securities Act of 1933. The listeddocuments should be clearly described for identificationpurposes (e.g., annual report to security holders for fiscal yearended December 24, 1980).
Portions of the registrant’s definitive proxy statement relatingto the 2006 Annual Meeting of Stockholders are incorporatedby reference into Part III hereof to the extent described herein.
See pages 103 to 105 for the exhibit index.

Table of Contents 1
Part One
ITEM 1. Business . . . . . . . . . . . . . . . . . . . . . . . . . . . . . . . . . . . . . . . . . 2
ITEM 1A. Risk Factors . . . . . . . . . . . . . . . . . . . . . . . . . . . . . . . . . . . . 10
ITEM 1B. Unresolved Staff Comments . . . . . . . . . . . . . . . . . . . . . . . 12
ITEM 2. Properties . . . . . . . . . . . . . . . . . . . . . . . . . . . . . . . . . . . . . . . .12
ITEM 3. Legal Proceedings . . . . . . . . . . . . . . . . . . . . . . . . . . . . . . . . .12
ITEM 4. Submission of Matters to a Vote of Security Holders . . . . .12
Part Two
ITEM 5. Market for Registrant’s Common Equity and Related
Stockholder Matters and Issuer Purchases of
Equity Securities . . . . . . . . . . . . . . . . . . . . . . . . . . . . . . . . . .13
ITEM 6. Selected Financial Data . . . . . . . . . . . . . . . . . . . . . . . . . . . . .15
ITEM 7. Management’s Discussion and Analysis of
Financial Condition and Results of Operations . . . . . . . . . .16
ITEM 7A. Quantitative and Qualitative Disclosure
about Market Risk . . . . . . . . . . . . . . . . . . . . . . . . . . . . . . . .16
ITEM 8. Financial Statements and Supplementary Data . . . . . . . . . 51
ITEM 9. Changes in and Disagreements with Accountants
on Accounting and Financial Disclosure. . . . . . . . . . . . . . . 100
ITEM 9A. Controls and Procedures. . . . . . . . . . . . . . . . . . . . . . . . . . 100
ITEM 9B. Other Information . . . . . . . . . . . . . . . . . . . . . . . . . . . . . . . 101
Part Three
ITEM 10. Directors and Executive Officers of the Registrant . . . . .102
ITEM 11. Executive Compensation . . . . . . . . . . . . . . . . . . . . . . . . . .102
ITEM 12. Security Ownership of Certain Beneficial Owners
and Management and Related Stockholder Matters . . .102
ITEM 13. Certain Relationships and Related Transactions . . . . . . .102
ITEM 14. Principal Accountant Fees and Services . . . . . . . . . . . . . .102
Part Four
ITEM 15. Exhibits and Financial Statement Schedules . . . . . . . . . .103
Signatures . . . . . . . . . . . . . . . . . . . . . . . . . . . . . . . . . . . . . . . . . . . . .106
Where You Can Find More Information . . . . . . . . . . . . . . . . . . . . . .107
CONTENTS

2 CIT GROUP INC 2005
BUSINESS DESCRIPTION
CIT Group Inc., a Delaware corporation (“we,” “CIT” or the“Company”), is a leading global commercial and consumerfinance company with a focus on middle-market companies.Founded in 1908, we provide financing and leasing capital forconsumers and companies in a wide variety of industries. Weoffer vendor, equipment and commercial finance products, fac-toring, home lending, small business lending, student lending,structured financing products, and commercial real estate financ-ing, as well as mergers and acquisitions and management advi-sory services. We manage $62.9 billion in assets, including $7.3billion in securitized assets. Our owned financing and leasingassets were $55.6 billion and common stockholders’ equity was$6.5 billion at December 31, 2005.
We have broad access to customers and markets through ourdiverse businesses. Each business has industry alignment and focuses on specific sectors, products, and markets, with portfo-lios diversified by client and geography. The majority of ourbusinesses focus on commercial clients ranging from small tolarger companies with particular emphasis on the middle-mar-ket. We serve a wide variety of industries, including manufac-turing, transportation, retailing, wholesaling, construction,healthcare, communications and various service-related indus-tries. We also provide financing to consumers in the home andstudent loan markets.
Our commercial products include direct loans and leases, oper-ating leases, leveraged and single investor leases, secured revolv-ing lines of credit and term loans, credit protection, accountsreceivable collection, import and export financing, debtor-in-possession and turnaround financing, acquisition andexpansion financing and U.S. government-backed small busi-ness loans. Consumer products are primarily first mortgageloans and government-backed student loans. Our commercialand consumer offerings include both fixed and floating-interestrate products.
We also offer a wide variety of services to our commercial andconsumer clients, including capital markets structuring andsyndication, finance-based insurance, and advisory services inasset finance, balance sheet restructuring, merger and acquisi-tion and commercial real estate analysis.
We generate transactions through direct calling efforts withborrowers, lessees, equipment end-users, vendors, manufac-turers and distributors, and through referral sources and otherintermediaries. In addition, our business units work togetherboth in referring transactions among units (i.e. cross-selling)and by combining various products and structures to meet ourcustomers’ overall financing needs. We also buy and sell partici-pations in and syndications of finance receivables and lines ofcredit. From time to time, in the normal course of business, wepurchase finance receivables on a wholesale basis (commonlycalled bulk portfolio purchases).
We generate revenue by earning interest income on the loanswe hold on our balance sheet, collecting rentals on the equip-ment we lease and generating fee and other income from ourservice-based operations. We also sell certain finance receivablesand equipment to reduce our concentration risk, manage ourbalance sheet or improve profitability.
We fund our businesses in the capital markets. The primaryfunding sources are term debt (U.S., European, and other),commercial paper (U.S., Canada and Australia), and asset-backed securities (U.S. and Canada).
SEGMENT AND CONCENTRATION DATA
See the “Results by Business Segments” and “Concentrations”sections of Item 7. Management’s Discussion and Analysis ofFinancial Condition and Results of Operations and Item 7A.Quantitative and Qualitative Disclosures about Market Risk, andNotes 5 and 20 of Item 8. Financial Statements and Supplementary Data, for additional information. See page 9 for aglossary of key terms used by management in our business.
OVERVIEW
Consumer $14.8
Commercial Services $6.7
Equipment Finance $7.0
Capital Finance $10.5
Commercial $14.3 Corporate Finance $9.6
Specialty Finance Commercial Finance
Managed Assets by SegmentAt December 31, 2005 (dollars in billions)
Part One
ITEM 1. Business
Managed Assets by RegionAt December 31, 2005
U.S. 79.0%
Other 0.6%Latin America 1.7%
Asia/Pacific 3.8%
Europe 7.4%
Canada 7.5%

BUSINESS SEGMENTS
CIT meets customers’ financing needs through six business segments organized into two groups.
Commercial Finance GroupWe use our product acumen, industry expertise, structuringcapabilities and rapid decision making to build enduringrelationships by offering clients a full suite of products andservices through business cycles.
Commercial Services
Provides factoring and other trade products to companies in the retail supply chain, primarily in the US, but with increasing international focus.
Specialty Finance – Consumer
Provides secured and government-guaranteed loans to consumers and small businesses through broker and intermediary relationships. Units include:Home lending Student Loan Xpress CIT Bank
Corporate Finance
Provides lending, leasing and other banking services to middle-market companies with a focus on specific industries. Units include:pBusiness Capital pCommunications, Media and EntertainmentpEnergy & Infrastructure pHealthcare
Capital Finance
Provides longer-term, large-ticket equipment leases and other secured financing to companies in transportation industries.pAerospace pRail Resources
Equipment Finance
Provides secured financing and leasing products and services to manufacturers, dealers and end-users of small and mid-ticketindustrial equipment in a broad range of industries. Units include:
pConstruction pDiversified Industries
Specialty Finance – Commercial
Vendor Finance – Provides innovative financing and leasing solutions to manufacturers and distributors around the globe.Small Business Lending – Provides small business financing alternatives to entrepreneurs in a wide array of industries.
Specialty Finance GroupWe deliver significant value to vendor and consumer marketsthrough our core strengths in relationship management, riskand behavior scoring capabilities, and global servicing reach.
Item 1: Business 3

4 CIT GROUP INC 2005
SPECIALTY FINANCE GROUP
Specialty Finance – Commercial
Our Specialty Finance – Commercial segment includes financing and leasing assets in our vendor programs, small busi-ness lending operation and the remaining assets of our liquidat-ing portfolios (principally manufactured housing).
Through our global relationships with industry-leading equip-ment vendors, including manufacturers, dealers, and distribu-tors, we deliver customized financing solutions to bothcommercial and consumer customers of our vendor partners ina wide array of programs. These alliances allow our vendorpartners to focus on their core competencies, reduce capitalneeds, manage credit risk and drive incremental sales volume.As a part of these programs, we offer (1) credit financing to thecommercial and consumer end users for the purchase or lease ofproducts, and (2) enhanced sales tools, such as asset manage-ment services, efficient loan processing, and real-time creditadjudication.
Certain of these partnership programs provide integration withthe vendor’s business planning process and product offeringsystems to improve execution and reduce cycle times. We havesignificant vendor programs in information technology,telecommunications equipment, and healthcare, and we servemany other industries through our global network.
Our vendor alliances feature traditional vendor finance pro-grams, joint ventures, profit sharing, and other transactionstructures with large, sales-oriented vendor partners. In the caseof joint ventures, we and the vendor combine financing activi-ties through a distinct legal entity that is jointly owned. Gener-ally, we account for these arrangements on an equity basis, withprofits and losses distributed according to the joint ventureagreement, and we purchase qualified finance receivables origi-nated by the joint venture. We also use “virtual joint ventures,”by which the assets are originated on our balance sheet, whileprofits and losses are shared with the vendor. These strategicalliances are a key source of business for us.
Vendor finance also includes a small and mid-ticket commer-cial business which focuses on leasing office products, comput-ers, and other technology products primarily in the UnitedStates and Canada. We originate products through relationships with manufacturers, dealers, distributors, andother intermediaries as well as through direct calling.
Our small business lending unit is primarily focused on origi-nating and servicing loans under the U.S. government’s SmallBusiness Administration’s 7(a) loan program. Loans are grantedto qualifying clients in the retail, wholesale, manufacturing,and service sectors. CIT is an SBA preferred lender and hasbeen recognized as the nation’s #1 SBA Lender (based on vol-ume) in each of the last six years.
Specialty Finance – Commercial also houses our GlobalInsurance Services unit, through which we offer insuranceproducts to existing CIT clients. We offer various collateral
protection and credit insurance products that are underwrittenby third parties. Revenue from this operation is allocated to theunit with the underlying financing relationship.
Specialty Finance – Consumer
Specialty Finance – Consumer includes our home lending andstudent loan operations and CIT Bank, a Utah-based industrialbank with deposit-taking capabilities.
The home lending unit primarily originates, purchases andservices loans secured by first or second liens on detached,single-family, residential properties. Products include bothfixed and variable-rate, closed-end loans, and variable-rate linesof credit. Customers borrow to finance a home purchase, con-solidate debts, refinance an existing mortgage, pay educationexpenses, or for other purposes.
Loans are originated through brokers and correspondents witha high proportion of home lending applications processed elec-tronically over the Internet via BrokerEdgeSM, a proprietarysystem. Through experienced lending professionals andautomation, we provide rapid turnaround time from applica-tion to loan funding, which is critical to broker relationships.We also buy/sell individual loans and portfolios of loansfrom/to banks, thrifts, and other originators of consumer loansto maximize the value of our origination network, to managerisk and to improve overall profitability.
Our centralized consumer asset service center services and col-lects substantially all of our consumer receivables, other thanstudent loans, including loans retained in our portfolio andloans subsequently securitized or sold with servicing retained.We also service portfolios of loans owned by third parties for afee on a “contract” basis. These third-party portfolios totaled$3.0 billion at December 31, 2005.
In 2005, we broadened our consumer product offerings withthe acquisition of Education Lending Group. Our studentlending unit, which markets under the name Student LoanXpress, offers student loan products, services, and solutions tostudents, parents, schools, and alumni associations. Our busi-ness is focused on originating and purchasing government-guaranteed student loans made under the Federal FamilyEducation Loan Program, known as FFELP, which includesconsolidation loans, Stafford loans and Parent Loans forUndergraduate Students (PLUS). We also offer and purchasealternative supplemental loans that may be guaranteed by athird-party guarantor.
To date, the majority of the loans we have originated are con-solidation loans. We generally hold these loans on our balancesheet. Currently, we sell most of Stafford and PLUS loans weoriginate in the secondary market. The majority of our out-standing student loans are currently serviced by third parties, but we are shifting servicing in-house to Student Loan Xpress.
CIT Bank, with assets of $368 million and deposits of$273 million, is located in Salt Lake City, Utah and provides abenefit to us in the form of favorable funding rates for various
BUSINESS SEGMENTS

Item 1: Business 5
consumer and small business financing programs in both the localand national marketplace. CIT Bank also originates certain loansgenerated by bank affiliation programs with manufacturers anddistributors of consumer products. The Bank is chartered by thestate of Utah as an industrial bank and is subject to regulationand examination by the Federal Deposit Insurance Corporationand the Utah Department of Financial Institutions.
COMMERCIAL FINANCE GROUP
Commercial Services
Our Commercial Services segment provides factoring, receivableand collection management products, and secured financing tocompanies in apparel, textile, furniture, home furnishings, andother industries.
We offer a full range of domestic and international customizedcredit protection, lending, and outsourcing services thatinclude working capital and term loans, factoring, receivablemanagement outsourcing, bulk purchases of accounts receiv-able, import and export financing, and letter of credit programs.
We provide financing to clients through the purchase ofaccounts receivable owed to clients by their customers, as wellas by guaranteeing amounts due under letters of credit issued tothe clients’ suppliers, which are collateralized by accountsreceivable and other assets. The purchase of accounts receivableis traditionally known as “factoring” and results in the paymentby the client of a factoring fee that is commensurate with theunderlying degree of credit risk and recourse, and which is gen-erally a percentage of the factored receivables or sales volume.When we “factor” (i.e., purchase) a customer invoice from aclient, we record the customer receivable as an asset and alsoestablish a liability for the funds due to the client (“credit bal-ances of factoring clients”). We also may advance funds to ourclients before collecting the receivables, typically in an amountup to 80% of eligible accounts receivable (as defined for thattransaction), charging interest on advances (in addition to anyfactoring fees), and satisfying advances by the collection ofreceivables. We integrate our clients’ operating systems withours to facilitate the factoring relationship.
Clients use our products and services for various purposes,including improving cash flow, mitigating or reducing creditrisk, increasing sales, and improving management information.Further, with our TotalSourceSM product, our clients can out-source their bookkeeping, collection, and other receivable pro-cessing to us. These services are attractive to industries outsidethe traditional factoring markets. We generate business region-ally from a variety of sources, including direct calling effortsand referrals from existing clients and other referral sources. Wehave centralized our accounts receivable, operations, and otheradministrative functions.
Corporate Finance
Our Corporate Finance segment provides secured financing,including term and revolving loans based on asset values, as
well as cash flow and enterprise value, to a full range of borrow-ers from small to larger-sized companies, with emphasis on themiddle market. We service clients in a broad array of industrieswith focused industry specialized groups serving communica-tions, media and entertainment, energy and infrastructure,healthcare, commercial real estate and sponsor finance sectorsin the U.S. and abroad.
We offer loan structures ranging from asset-based revolving and term loans secured by accounts receivable, inventories, andfixed assets to loans based on earnings performance and enter-prise valuations to mid- and larger-sized companies. Ourclients use these loans primarily for working capital, assetgrowth, acquisitions, debtor-in-possession financing, and debtrestructurings. We sell and purchase participation interests inthese loans to and from other lenders.
We meet our customer financing needs through our variable rate,senior revolving and term loan products. We primarily structurefinancings on a secured basis, although we will periodicallyextend loans based on the sustainability of a customer’s operatingcash flow and ongoing enterprise valuations. We make revolvingand term loans on a variable interest-rate basis based on pub-lished indices such as LIBOR or the prime rate of interest.
We also offer clients an array of financial and advisory servicesthrough an investment banking unit. The unit offers capitalmarkets structuring and syndication capabilities as well asmerger and acquisition, commercial real estate and balancesheet restructuring advisory services.
We originate business regionally through solicitation focused onvarious types of intermediaries and referrals. We maintain long-term relationships with selected banks, finance companies, andother lenders both to obtain and to diversify our fundingsources.
Capital Finance
Our Capital Finance segment specializes in providing cus-tomized leasing and secured financing primarily to end-users of aircraft, locomotives, and railcars. Our services include oper-ating leases, single investor leases, equity portions of leveragedleases, and sale and leaseback arrangements, as well as loanssecured by equipment. Our typical customers are major andregional, domestic and international airlines, North Americanrailroad companies, and middle-market to larger-sized compa-nies. We generate new business through direct calling, supple-mented with transactions introduced by intermediaries andother referrals.
We have provided financing to commercial airlines for over30 years, and our commercial aerospace portfolio includes mostof the leading U.S. and foreign commercial airlines. As ofDecember 31, 2005, our commercial aerospace financing andleasing portfolio was $6.0 billion, consisting of 93 accountsand 215 aircraft with a weighted average age of approximately6 years. We have developed strong relationships with most
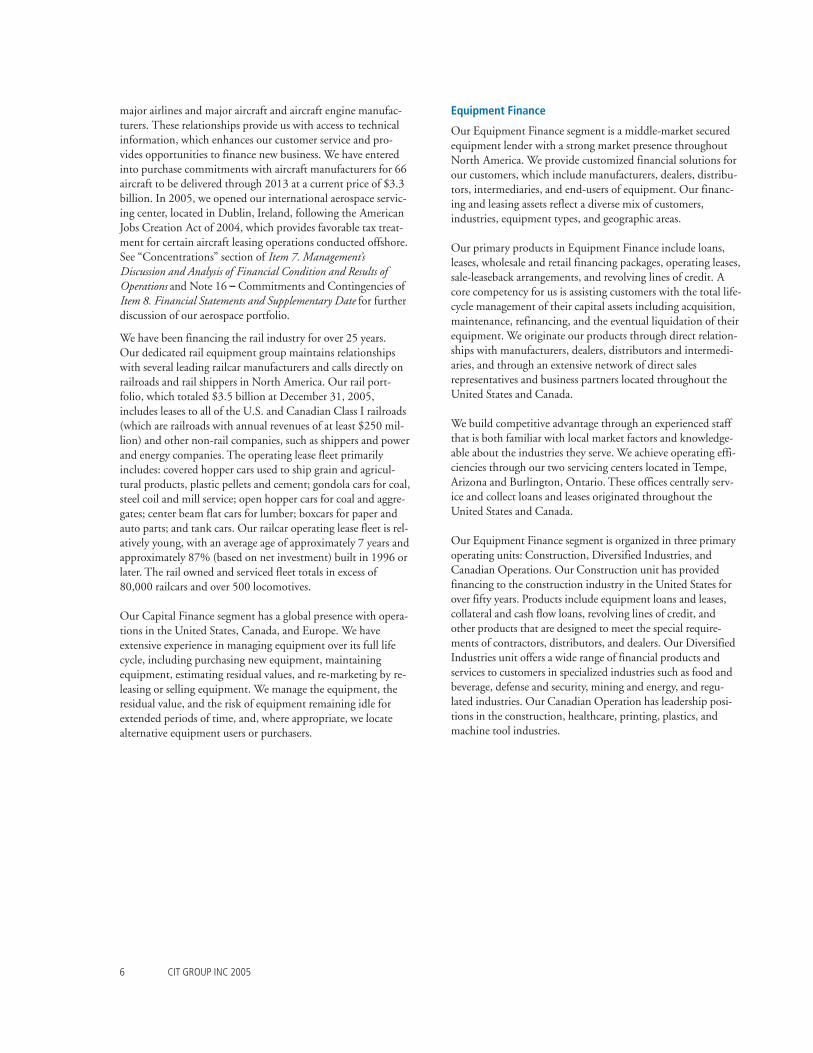
6 CIT GROUP INC 2005
major airlines and major aircraft and aircraft engine manufac-turers. These relationships provide us with access to technicalinformation, which enhances our customer service and pro-vides opportunities to finance new business. We have enteredinto purchase commitments with aircraft manufacturers for 66aircraft to be delivered through 2013 at a current price of $3.3billion. In 2005, we opened our international aerospace servic-ing center, located in Dublin, Ireland, following the AmericanJobs Creation Act of 2004, which provides favorable tax treat-ment for certain aircraft leasing operations conducted offshore. See “Concentrations” section of Item 7. Management’sDiscussion and Analysis of Financial Condition and Results ofOperations and Note 16 – Commitments and Contingencies ofItem 8. Financial Statements and Supplementary Date for furtherdiscussion of our aerospace portfolio.
We have been financing the rail industry for over 25 years. Our dedicated rail equipment group maintains relationshipswith several leading railcar manufacturers and calls directly onrailroads and rail shippers in North America. Our rail port-folio, which totaled $3.5 billion at December 31, 2005,includes leases to all of the U.S. and Canadian Class I railroads(which are railroads with annual revenues of at least $250 mil-lion) and other non-rail companies, such as shippers and powerand energy companies. The operating lease fleet primarilyincludes: covered hopper cars used to ship grain and agricul-tural products, plastic pellets and cement; gondola cars for coal,steel coil and mill service; open hopper cars for coal and aggre-gates; center beam flat cars for lumber; boxcars for paper andauto parts; and tank cars. Our railcar operating lease fleet is rel-atively young, with an average age of approximately 7 years andapproximately 87% (based on net investment) built in 1996 orlater. The rail owned and serviced fleet totals in excess of80,000 railcars and over 500 locomotives.
Our Capital Finance segment has a global presence with opera-tions in the United States, Canada, and Europe. We haveextensive experience in managing equipment over its full lifecycle, including purchasing new equipment, maintainingequipment, estimating residual values, and re-marketing by re-leasing or selling equipment. We manage the equipment, theresidual value, and the risk of equipment remaining idle forextended periods of time, and, where appropriate, we locatealternative equipment users or purchasers.
Equipment Finance
Our Equipment Finance segment is a middle-market securedequipment lender with a strong market presence throughoutNorth America. We provide customized financial solutions forour customers, which include manufacturers, dealers, distribu-tors, intermediaries, and end-users of equipment. Our financ-ing and leasing assets reflect a diverse mix of customers,industries, equipment types, and geographic areas.
Our primary products in Equipment Finance include loans,leases, wholesale and retail financing packages, operating leases,sale-leaseback arrangements, and revolving lines of credit. Acore competency for us is assisting customers with the total life-cycle management of their capital assets including acquisition,maintenance, refinancing, and the eventual liquidation of theirequipment. We originate our products through direct relation-ships with manufacturers, dealers, distributors and intermedi-aries, and through an extensive network of direct salesrepresentatives and business partners located throughout theUnited States and Canada.
We build competitive advantage through an experienced staffthat is both familiar with local market factors and knowledge-able about the industries they serve. We achieve operating effi-ciencies through our two servicing centers located in Tempe,Arizona and Burlington, Ontario. These offices centrally serv-ice and collect loans and leases originated throughout theUnited States and Canada.
Our Equipment Finance segment is organized in three primaryoperating units: Construction, Diversified Industries, andCanadian Operations. Our Construction unit has providedfinancing to the construction industry in the United States forover fifty years. Products include equipment loans and leases,collateral and cash flow loans, revolving lines of credit, andother products that are designed to meet the special require-ments of contractors, distributors, and dealers. Our DiversifiedIndustries unit offers a wide range of financial products andservices to customers in specialized industries such as food andbeverage, defense and security, mining and energy, and regu-lated industries. Our Canadian Operation has leadership posi-tions in the construction, healthcare, printing, plastics, andmachine tool industries.
Item 1: Business 7
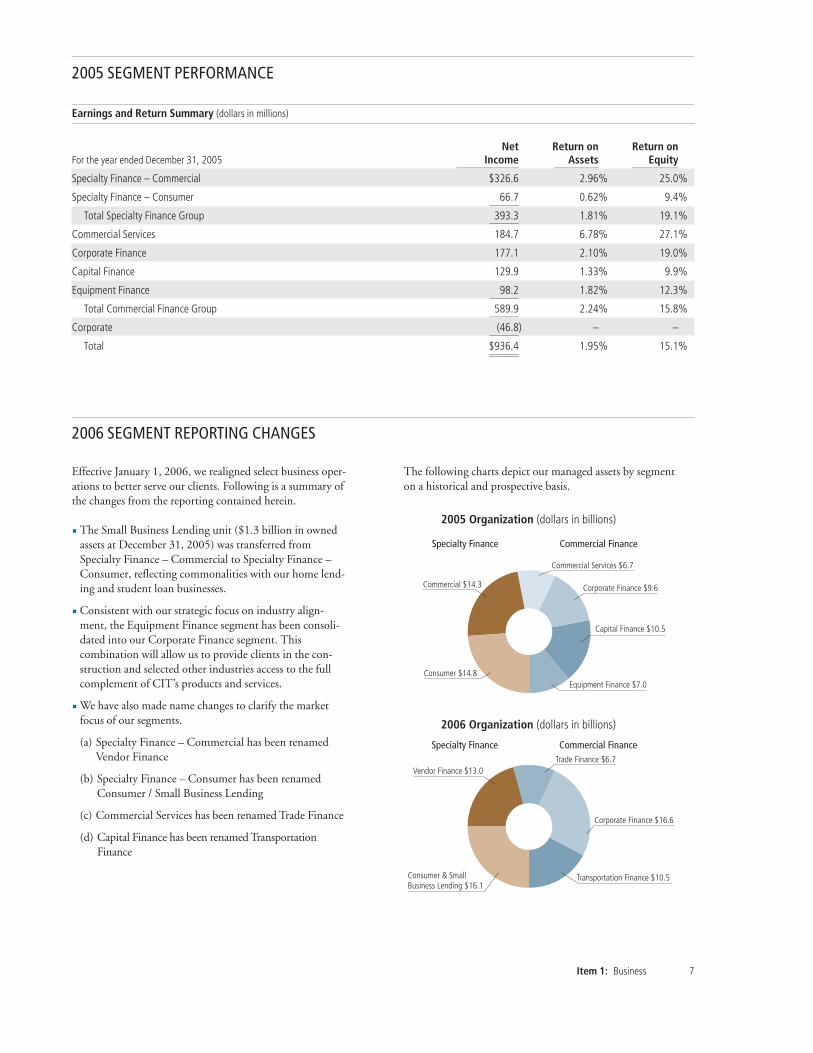
Earnings and Return Summary (dollars in millions)
Net Return on Return onFor the year ended December 31, 2005 Income Assets Equity
����������������������������������������������� ��������������������������������� �����������������������������������
Specialty Finance – Commercial $326.6 2.96% 25.0%
Specialty Finance – Consumer 66.7 0.62% 9.4%����������������������
Total Specialty Finance Group 393.3 1.81% 19.1%����������������������
Commercial Services 184.7 6.78% 27.1%
Corporate Finance 177.1 2.10% 19.0%
Capital Finance 129.9 1.33% 9.9%
Equipment Finance 98.2 1.82% 12.3%����������������������
Total Commercial Finance Group 589.9 2.24% 15.8%����������������������
Corporate (46.8) – –����������������������
Total $936.4 1.95% 15.1%��������������������������������������������
2005 Organization (dollars in billions)
Specialty Finance Commercial Finance
Consumer $14.8
Commercial Services $6.7
Equipment Finance $7.0
Capital Finance $10.5
Commercial $14.3 Corporate Finance $9.6 Effective January 1, 2006, we realigned select business oper-ations to better serve our clients. Following is a summary ofthe changes from the reporting contained herein.
p The Small Business Lending unit ($1.3 billion in ownedassets at December 31, 2005) was transferred fromSpecialty Finance – Commercial to Specialty Finance –Consumer, reflecting commonalities with our home lend-ing and student loan businesses.
p Consistent with our strategic focus on industry align-ment, the Equipment Finance segment has been consoli-dated into our Corporate Finance segment. Thiscombination will allow us to provide clients in the con-struction and selected other industries access to the fullcomplement of CIT’s products and services.
p We have also made name changes to clarify the marketfocus of our segments.
(a) Specialty Finance – Commercial has been renamedVendor Finance
(b) Specialty Finance – Consumer has been renamedConsumer / Small Business Lending
(c) Commercial Services has been renamed Trade Finance
(d) Capital Finance has been renamed TransportationFinance
The following charts depict our managed assets by segment on a historical and prospective basis.
2005 SEGMENT PERFORMANCE
2006 SEGMENT REPORTING CHANGES
Consumer & Small Business Lending $16.1
Trade Finance $6.7
Transportation Finance $10.5
Vendor Finance $13.0
Corporate Finance $16.6
2006 Organization (dollars in billions)
Specialty Finance Commercial Finance

Our markets are highly competitive, based on factors that varydepending upon product, customer, and geographic region.Our competitors include captive and independent financecompanies, commercial banks and thrift institutions, industrialbanks, leasing companies, insurance companies, hedge funds,manufacturers, and vendors. Many bank holding, leasing,finance, and insurance companies that compete with us haveformed substantial financial services operations with globalreach. On a local level, community banks and smaller inde-pendent finance and mortgage companies are competitive withsubstantial local market positions. Many of our competitors arelarge companies that have substantial capital, technological,and marketing resources. Some of these competitors are largerthan we are and may have access to capital at a lower cost thanwe do. The markets for most of our products have a large num-
ber of competitors, although the number of competitors hasfallen in recent years because of continued consolidation in theindustry.
We compete primarily on the basis of financing terms, struc-ture, client service, and price. From time to time, our competi-tors seek to compete aggressively on the basis of these factorsand we may lose market share to the extent we are unwilling tomatch competitor pricing and terms in order to maintain inter-est margins or credit standards, or both.
Other primary competitive factors include industry experience,equipment knowledge, and relationships. In addition, demandfor an industry’s services and products and industry regulationswill affect demand for our products in some industries.
8 CIT GROUP INC 2005
COMPETITION
REGULATION
EMPLOYEES
In some instances, our operations are subject to supervisionand regulation by federal, state, and various foreign govern-mental authorities. Additionally, our operations may be subjectto various laws and judicial and administrative decisions impos-ing various requirements and restrictions. This oversight mayserve to:
p regulate credit granting activities, including establishinglicensing requirements, if any, in various jurisdictions,
p establish maximum interest rates, finance charges andother charges,
p regulate customers’ insurance coverages,
p require disclosures to customers,
p govern secured transactions,
p set collection, foreclosure, repossession and claims handlingprocedures and other trade practices,
p prohibit discrimination in the extension of credit and admin-istration of loans, and
p regulate the use and reporting of information related to a bor-rower’s credit experience and other data collection.
In addition, CIT Bank, a Utah industrial bank wholly ownedby CIT, is subject to regulation and examination by the FederalDeposit Insurance Corporation and the Utah Department ofFinancial Institutions. CIT Small Business LendingCorporation, a Delaware corporation, is licensed by and sub-ject to regulation and examination by the U.S. Small BusinessAdministration. CIT Capital Securities L.L.C., a Delaware lim-ited liability company, is a broker-dealer licensed by theNational Association of Securities Dealers, and is subject toregulation by the NASD and the Securities and ExchangeCommission. CIT Bank Limited, an English corporation, islicensed as a bank and subject to regulation and examination bythe Financial Service Authority of the United Kingdom.
Our insurance operations are conducted through the Equipment Insurance Company, a Vermont corporation, andHighlands Insurance Company Limited, a Barbados company.Each company is licensed to enter into insurance contracts.They are regulated by the local regulators in Vermont andBarbados. In addition, we have various banking corporations inFrance, Italy, Belgium, Sweden, and the Netherlands, andbroker-dealer entities in Canada and the United Kingdom,each of which is subject to regulation and examination bybanking regulators and securities regulators in their homecountry.
CIT employed approximately 6,340 people at December 31, 2005, of which approximately 4,865 were employed in the United Statesand approximately 1,475 were outside the United States.

Item 1: Business 9
Average Earning Assets (AEA) is the average during the report-ing period of finance receivables, operating lease equipment,financing and leasing assets held for sale, and some invest-ments, less the credit balances of factoring clients. We use thisaverage for certain key profitability ratios, including return onAEA and margins as a percentage of AEA.
Average Finance Receivables (AFR) is the average during thereporting period of finance receivables and includes loans andfinance leases. It excludes operating lease equipment. We usethis average to measure the rate of net charge-offs on an ownedbasis for the period.
Average Managed Assets (AMA) is the average earning assetsplus the average of finance receivables previously securitized andstill managed by us. We use this average to measure the rate ofnet charge-offs on a managed basis for the period, to monitoroverall credit performance, and to monitor expense control.
Capital is the sum of common equity, preferred stock, and pre-ferred capital securities.
Derivative Contract is a contract whose value is derived from aspecified asset or an index, such as interest rates or foreign cur-rency exchange rates. As the value of that asset or index changes, so does the value of the derivative contract. We usederivatives to reduce interest rate, foreign currency or creditrisks. The derivative contracts we use include interest-rateswaps, cross-currency swaps, foreign exchange forward con-tracts, and credit default swaps.
Efficiency Ratio is the percentage of salaries and general operat-ing expenses (including provision for restructuring) to operat-ing margin, excluding the provision for credit losses. We usethe efficiency ratio to measure the level of expenses in relationto revenue earned.
Finance Income includes both interest income on financereceivables and rental income on operating leases.
Financing and Leasing Assets include loans, capital and financeleases, leveraged leases, operating leases, assets held for sale, andother investments.
Lease – capital and finance is an agreement in which the partywho owns the property (lessor) permits another party (lessee) touse the property with substantially all of the economic benefitsand risks of ownership passed to the lessee.
Lease – leveraged is a lease in which a third party, a long-termcreditor, provides non-recourse debt financing. We are party tothese lease types as creditor or as lessor.
Leases – tax-optimized leveraged lease is a lease in which we arethe lessor and a third-party creditor has a priority claim to theleased equipment. We have an increased risk of loss in the eventof default in comparison to other leveraged leases, because theytypically feature higher leverage to increase tax benefits.
Lease – operating is a lease in which we retain beneficial owner-ship of the asset, collect rental payments, recognize deprecia-
tion on the asset, and retain the risks of ownership, includingobsolescence.
Managed Assets are comprised of finance receivables, operatinglease equipment, finance receivables held for sale, some invest-ments, and receivables securitized and still managed by us. Thechange in managed assets during a reporting period is one ofour measurements of asset growth.
Net Revenue is the sum of net finance margin and otherrevenue.
Non-GAAP Financial Measures are balances, amounts or ratiosthat do not readily agree to balances disclosed in financial state-ments presented in accordance with accounting principles gen-erally accepted in the U.S. We use non-GAAP measures toprovide additional information and insight into how currentoperating results and financial position of the business compareto historical operating results and the financial position of thebusiness and trends, after adjusting for certain nonrecurring, orunusual, transactions.
Non-performing Assets include loans placed on non-accrual sta-tus, due to doubt of collectibility of principal and interest, andrepossessed assets.
Non-spread Revenue includes syndication fees, gains from dis-positions of receivables and equipment, factoring commissions,loan servicing and other fees and is reported in Other Revenue.
Operating Margin is the total of net finance margin after provi-sion for credit losses (risk adjusted margin) and other revenue.
Retained Interest is the portion of the interest in assets we retain when we sell assets in a securitization transaction.
Residual Values represent the estimated value of equipment atthe end of the lease term. For operating leases, it is the value towhich the asset is depreciated at the end of its useful economiclife (i.e., “salvage” or “scrap value”).
Return on Equity or Tangible Equity is net income expressed asa percentage of average common equity or average common tangible equity. These are key measurements of profitability.
Risk Adjusted Margin is net finance margin after provision forcredit losses.
Special Purpose Entity (SPE) is a distinct legal entity createdfor a specific purpose in order to isolate the risks and rewards ofowning its assets and incurring its liabilities. We typically useSPEs in securitization transactions, joint venture relationships,and certain structured leasing transactions.
Tangible Metrics exclude goodwill, other intangible assets, andsome comprehensive income items. We use tangible metrics inmeasuring capitalization and returns.
Yield-related Fees In addition to interest income, in certaintransactions we collect yield-related fees in connection with ourassumption of underwriting risk. We report yield-related fees,which include prepayment fees and certain origination fees andare recognized over the life of the lending transaction, inFinance Income.
GLOSSARY OF TERMS

10 CIT GROUP INC 2005
You should carefully consider the following discussion ofrisks, and the other information provided in this AnnualReport on Form 10-K. The risks described below are not theonly ones facing us. Additional risks that are presentlyunknown to us or that we currently deem immaterial mayalso impact our business.
WE MAY BE ADVERSELY AFFECTED BY A GENERALDETERIORATION IN ECONOMIC CONDITIONS.
A general recession or downturn in the economy could makeit difficult for us to originate new business, given the resultantreduced demand for consumer or commercial credit. In addi-tion, a downturn in certain industries may result in a reduceddemand for the products we finance in that industry.
Credit quality may also be impacted during an economicslowdown or recession as borrowers may fail to meet theirdebt payment obligations. While we maintain a reserve forpotential credit losses, this allowance could be insufficientdepending upon the severity of the economic downturn. Adverse economic conditions may also result in declines incollateral values. As a result, higher credit and collateralrelated losses could impact our financial position or operatingresults.
OUR LIQUIDITY OR ABILITY TO RAISE CAPITAL MAY BELIMITED.
We rely upon access to the capital markets to fund assetgrowth and to provide sources of liquidity. We actively man-age and mitigate liquidity risk by: 1) maintaining diversifiedsources of funding; 2) maintaining committed alternatesources of funding; 3) maintaining a contingency fundingplan to be implemented in the event of market disruption;and 4) issuing debt with maturity schedules designed to miti-gate refinancing risk. Although we believe that we will main-tain sufficient access to the capital markets, adverse changesin the economy, deterioration in our business performance orchanges in our credit ratings could limit our access to thesemarkets.
WE MAY BE ADVERSELY AFFECTED BY SIGNIFICANT CHANGES IN INTEREST RATES.
Although we generally employ a matched funding approachto managing our interest rate risk, including matching therepricing characteristics of our assets with our liabilities, sig-nificant increases in market interest rates, or the perceptionthat an increase may occur, could adversely affect both ourability to originate new finance receivables and our ability togrow. Conversely, a decrease in interest rates could result inaccelerated prepayments of owned and managed financereceivables.
WE MAY NOT BE ABLE TO REALIZE OUR ENTIREINVESTMENT IN THE EQUIPMENT WE LEASE.
The realization of equipment values (residual values) at theend of the term of a lease is an important element in the leas-ing business. At the inception of each lease, we record a resid-ual value for the leased equipment based on our estimate ofthe future value of the equipment at the expected dispositiondate. Residual values are determined by experienced internalequipment management specialists, as well as external con-sultants.
A decrease in the market value of leased equipment at a rategreater than the rate we projected, whether due to rapid tech-nological or economic obsolescence, unusual wear and tearon, or use of, the equipment or other factors, would adverselyaffect the residual values of such equipment. Consequently,there can be no assurance that our estimated residual valuesfor equipment will be realized.
The degree of residual realization risk varies by transactiontype. Capital leases bear the least risk because contractualpayments cover approximately 90% of the equipment’s costat the inception of the lease. Operating leases have a higherdegree of risk because a smaller percentage of the equipment’svalue is covered by contractual cashflows at lease inception.We record periodic depreciation expense on operating leaseequipment based upon estimates of the equipment’s usefullife and the estimated future value of the equipment at theend of its useful life. Leveraged leases bear the highest levelof risk as third parties have a priority claim on equipmentcashflows.
OUR RESERVE FOR CREDIT LOSSES MAY PROVEINADEQUATE.Our business depends on the creditworthiness of our cus-tomers. We believe that our credit risk management systemsare adequate to limit our credit losses to a manageable level.We attempt to mitigate credit risks through the use of a cor-porate credit risk management group, formal credit manage-ment processes implemented by each business unit andautomated credit scoring capabilities for small ticket business.
We maintain a consolidated reserve for credit losses onfinance receivables that reflects management’s judgment oflosses inherent in the portfolio. We periodically review ourconsolidated reserve for adequacy considering economic con-ditions and trends, collateral values and credit quality indica-tors, including past charge-off experience and levels of pastdue loans and non-performing assets. We cannot be certainthat our consolidated reserve for credit losses will be adequateover time to cover credit losses in our portfolio because ofunanticipated adverse changes in the economy or eventsadversely affecting specific customers, industries or markets.If the credit quality of our customer base materially decreases,or if our reserves for credit losses are not adequate, our busi-ness, financial condition and results of operations may suffer.
ITEM 1A. Risk Factors

Item 1: Business 11
WE MAY BE ADVERSELY AFFECTED BY THE REGULATEDENVIRONMENT IN WHICH WE OPERATE.
Our domestic operations are subject, in certain instances, tosupervision and regulation by state and federal authoritiesand may be subject to various laws and judicial and adminis-trative decisions imposing various requirements and restric-tions. Noncompliance with applicable statutes or regulationscould result in the suspension or revocation of any license orregistration at issue, as well as the imposition of civil fines andcriminal penalties.
The financial services industry is heavily regulated in manyjurisdictions outside the United States. As a result, growingour international operations may be challenged by the varyingrequirements of these jurisdictions. Given the evolving natureof regulations in many of these jurisdictions, it may be diffi-cult for us to meet these requirements even after we establishoperations and receive regulatory approvals. Our inability toremain in compliance with regulatory requirements in a par-ticular jurisdiction could have a material adverse effect on ouroperations in that market and on our reputation generally.
WE COMPETE WITH A VARIETY OF FINANCING SOURCESFOR OUR CUSTOMERS.
Our markets are highly competitive and are characterized bycompetitive factors that vary based upon product and geo-graphic region. Our competitors are varied and include cap-tive and independent finance companies, commercial banksand thrift institutions, industrial banks, community banks,leasing companies, insurance companies, mortgage compa-nies, manufacturers and vendors.
Competition from both traditional competitors and newmarket entrants has intensified in recent years due to a strongeconomy, growing marketplace liquidity and increasingrecognition of the attractiveness of the commercial financemarkets. In addition, the rapid expansion of the securitizationmarkets is dramatically reducing the difficulty in obtainingaccess to capital, which is the principal barrier to entry intothese markets.
We compete primarily on the basis of pricing, terms andstructure. To the extent that our competitors compete aggres-sively on any combination of those factors, we could losemarket share. Should we match competitors’ terms, it is pos-sible that we could experience some margin compressionand/or increased losses.
OUR ACQUISITION OR DISPOSITION OF BUSINESSES ORASSET PORTFOLIOS MAY ADVERSELY AFFECT OURBUSINESS.
As part of our long-term business strategy, we may pursueacquisitions of other companies or asset portfolios as well asdispose of non-strategic businesses or asset portfolios. Futureacquisitions may result in potentially dilutive issuances ofequity securities and the incurrence of additional debt,
which could have a material adverse effect on our business,financial condition and results of operations. Such acquisi-tions may involve numerous other risks, including: difficul-ties in integrating the operations, services, products andpersonnel of the acquired company; the diversion of manage-ment’s attention from other business concerns; entering mar-kets in which we have little or no direct prior experience; andthe potential loss of key employees of the acquired company.In addition, acquired businesses and asset portfolios may havecredit-related risks arising from substantially different under-writing standards associated with those businesses or assets.
In the event of future dispositions of our businesses or assetportfolios, there can be no assurance that we will receive ade-quate consideration for those businesses or assets at the timeof their disposition or will be able to adequately replace thevolume associated with the businesses or asset portfolios thatwe dispose of with higher-yielding businesses or asset portfo-lios having acceptable risk characteristics. As a result, ourfuture disposition of businesses or asset portfolios could havea material adverse effect on our business, financial conditionand results of operations.
INVESTMENT IN AND REVENUES FROM OUR FOREIGNOPERATIONS ARE SUBJECT TO THE RISKS ASSOCIATEDWITH TRANSACTIONS INVOLVING FOREIGN CURRENCIES.
While we do attempt to hedge our translation and transactionexposures, foreign currency exchange rate fluctuations canhave a material adverse effect on the investment in interna-tional operations and the level of international revenuesthat we generate from international asset based financingand leasing. Reported results from our operations inforeign countries may fluctuate from period to period dueto exchange rate movements in relation to the U.S.dollar, particularly exchange rate movements in the Canadiandollar, which is our largest non-U.S. exposure. In addition,an economic recession or downturn or increased competitionin the international markets in which we operate couldadversely affect us.
OUR BUSINESS INITIATIVES HAVE POTENTIAL EXECUTIONRISK.
Our ability to improve our levels of asset and revenue genera-tion depends on our initiatives to align our businesses aroundcustomers and industry sectors, and to expand our sales andmarketing platforms. These initiatives involve asset transfers,changes in management accountabilities, as well as thestreamlining and realignment of related infrastructure,including information technology and personnel. Our failureto implement these initiatives successfully, or the failure ofsuch initiatives to result in increased asset and revenue levels,could adversely affect our financial position and results ofoperations.

12 CIT GROUP INC 2005
CIT operates in the United States, Canada, Europe, LatinAmerica, Australia and the Asia-Pacific region. CIT occupiesapproximately 2.2 million square feet of office space, substan-
tially all of which is leased. Such office space is suitable andadequate for our needs and we utilize, or plan to utilize, sub-stantially all of our leased office space.
ITEM 2. Properties
ITEM 3. Legal Proceedings
NORVERGENCE RELATED LITIGATION
On September 9, 2004, Exquisite Caterers Inc., et al. v.Popular Leasing Inc., et al. ("Exquisite Caterers"), a putativenational class action, was filed in the Superior Court of NewJersey against 13 financial institutions, including CIT, whichhad acquired equipment leases ("NorVergence Leases") fromNorVergence, Inc., a reseller of telecommunications andInternet services to businesses. The complaint alleged thatNorVergence misrepresented the capabilities of, and over-charged for, the equipment leased to its customers and thatthe NorVergence Leases are unenforceable. Plaintiffs seekrescission, punitive damages, treble damages and attorneys’fees. In addition, putative class action suits in Illinois andTexas, all based upon the same core allegations and seekingthe same relief, were filed by NorVergence customers againstCIT and other financial institutions. The Court in ExquisiteCaterers certified a New Jersey-only class, and a motion fordecertification is pending.
On July 14, 2004, the U.S. Bankruptcy Court ordered theliquidation of NorVergence under Chapter 7 of theBankruptcy Code. Thereafter, the Attorneys General of sev-eral states commenced investigations of NorVergence and thefinancial institutions, including CIT, that purchased
NorVergence Leases. CIT has entered into settlement agree-ments with the Attorneys General in each of these states,except for Texas. Under those settlements, lessees in thosestates have had an opportunity to resolve all claims by andagainst CIT by paying a percentage of the remaining balanceon their leases. CIT has also produced documents for transac-tions related to NorVergence at the request of the FederalTrade Commission ("FTC") and pursuant to a subpoena in agrand jury proceeding being conducted by the U.S. Attorneyfor the Southern District of New York in connection with aninvestigation of transactions related to NorVergence. CIT hasentered into a settlement agreement with respect to theExquisite Caterers case and the Texas putative class action. Such settlement is subject to Court approval and is notexpected to have a material adverse financial effect on CIT.
OTHER LITIGATION
In addition, there are various proceedings that have beenbrought against CIT in the ordinary course of business.While the outcomes of the ordinary course legal proceedings,and the related activities, are not certain, based on presentassessments, management does not believe that they will havea material adverse financial effect on CIT.
We did not submit any matters to a vote of security holdersduring the three months ended December 31, 2005.
ITEM 4. Submission of Matters to a Vote of Security Holders
ITEM 1B. Unresolved Staff Comments
There are no unresolved SEC staff comments.

Item 5: Market for Registrant’s Common Equity 13
Our common stock is listed on the New York StockExchange. The following table sets forth the high and lowreported closing prices for CIT’s common stock for each of thequarterly periods in the two years ended December 31, 2005.
2005 2004_______________ ______________
Common Stock Prices HIGH LOW HIGH LOW______ ______ ______ ______First Quarter $46.07 $37.40 $39.91 $35.83
Second Quarter $43.17 $35.45 $38.73 $33.28
Third Quarter $46.80 $42.60 $38.48 $34.53
Fourth Quarter $52.62 $43.62 $45.82 $36.51
During the year ended December 31, 2005, we paid a dividend of$0.13 per common share for the first quarter and $0.16 for each ofthe following three quarters for a total of $0.61 per share. Duringthe year ended December 31, 2004, for each of the four quarters,we paid a dividend of $0.13 per share for a total of $0.52 per share.On January 17, 2006, the Board of Directors approved a $0.04 pershare increase to the quarterly dividend to $0.20 per share.
Our dividend practice is to pay a dividend while retaining astrong capital base. The declaration and payment of futuredividends are subject to the discretion of our Board ofDirectors. Any determination as to the payment of dividends,including the level of dividends, will depend on, among otherthings, general economic and business conditions, our strate-gic and operational plans, our financial results and condition,contractual, legal and regulatory restrictions on the paymentof dividends by us, and such other factors as the Board ofDirectors may consider to be relevant.
As of February 15, 2006, there were 96,761 beneficial ownersof CIT common stock.
All equity compensation plans in effect during 2005 wereapproved by our shareholders, and are summarized in thefollowing table.
Part Two
ITEM 5. Market for Registrant’s Common Equity and RelatedStockholder Matters and Issuer Purchases ofEquity Securities
NUMBER OF SECURITIESREMAINING AVAILABLE FOR
NUMBER OF SECURITIES FUTURE ISSUANCE UNDERTO BE ISSUED WEIGHTED-AVERAGE EQUITY COMPENSATION PLANS
UPON EXERCISE OF EXERCISE PRICE OF (EXCLUDING SECURITIESOUTSTANDING OPTIONS(1) OUTSTANDING OPTIONS REFLECTED IN COLUMN (A))_______________________ _____________________ ___________________________
(A) (B) (C)
EQUITY COMPENSATION PLANS APPROVED BY SECURITY HOLDERS 17,470,879 $37.80 5,191,152
(1) Excludes 1,278,099 unvested restricted shares and 1,876,193 unvested performance shares outstanding under the Long-Term Equity CompensationPlan.
We had no equity compensation plans that were not approved by shareholders. For further information on our equity compensationplans, including the weighted average exercise price, see Item 8. Financial Statements and Supplementary Data, Note 15.

14 CIT GROUP INC 2005
The following table details the repurchase activity of CIT common stock during the quarter ended December 31, 2005.
TOTAL NUMBER OF MAXIMUM NUMBERTOTAL AVERAGE SHARES PURCHASED OF SHARES THAT MAY
NUMBER OF PRICE AS PART OF PUBLICLY YET BE PURCHASED SHARES PAID ANNOUNCED PLANS UNDER THE PLANS
PURCHASED PER SHARE OR PROGRAMS OR PROGRAMS___________ __________ __________________ __________________
BALANCE AT SEPTEMBER 30, 2005 12,015,244 2,425,997_________
OCTOBER 1 - 31, 2005 606,900 $ 44.83 606,900 1,819,097
NOVEMBER 1 - 30, 2005 533,900 $ 48.68 533,900 1,285,197
DECEMBER 1 - 31, 2005 274,700 $ 52.06 274,700 1,010,497
ACCELERATED STOCK BUYBACK 844,669 $ 51.92 844,669 (1)_________
TOTAL PURCHASES 2,260,169_________
REISSUANCES(2) (1,070,056 )_________
BALANCE DECEMBER 31, 2005 13,205,357__________________
(1) On July 28, 2005, the Company paid $500 million and received an initial delivery of 8,232,655 shares. The Company received an additional1,830,812 shares in August and a final delivery of 844,669 shares in December.
(2) Includes the issuance of common stock held in treasury upon exercise of stock options, payment of employee stock purchase plan obligations and the vestingof restricted stock.
On January 17, 2006, our Board of Directors approved acontinuation of the common stock repurchase program toacquire up to an additional 5 million shares of our outstand-ing common stock in conjunction with employee equitycompensation programs. These are in addition to the1,010,497 shares remaining from the previous program thatwas approved on October 20, 2004. The program authorizesthe company to purchase shares on the open market fromtime to time over a two-year period beginning January 18,
2006. The repurchased common stock is held as treasuryshares and may be used for the issuance of shares under CIT’semployee stock plans. Acquisitions under the share repur-chase program will be made from time to time at prevailingprices as permitted by applicable laws, and subject to marketconditions and other factors. The program may be discontin-ued at any time and is not expected to have a significantimpact on our capitalization.

Item 6: Selected Financial Data 15
ITEM 6. Selected Financial Data
The following tables set forth selected consolidated financial information regarding our results of operations and balance sheets. Thedata presented below should be read in conjunction with Item 7. Management’s Discussion and Analysis of Financial Condition andResults of Operations and Item 7A. Quantitative and Qualitative Disclosures about Market Risk and Item 8. Financial Statements andSupplementary Data.
At or for At or forthe Three At or for the the Nine
Months Ended Year Ended Months EndedAt or for the Years Ended December 31, December 31, September 30, September 30,
(dollars in millions, except per share data) 2005 2004 2003 2002 2002 2001___________ ___________ ___________ ____________ ____________ ____________
Results of OperationsNet finance margin $ 1,635.2 $ 1,535.3 $ 1,303.1 $ 339.8 $ 1,619.4 $ 1,291.8
Provision for credit losses 217.0 214.2 387.3 133.4 788.3 332.5Operating margin 2,555.6 2,208.2 1,775.1 463.5 1,763.4 1,531.9
Salaries and general operating expenses 1,113.8 1,012.0 888.2 227.5 903.3 767.5Net income (loss) 936.4 753.6 566.9 141.3 (6,698.7)(2) 263.3
Net income (loss) per share — diluted 4.44 3.50 2.66 0.67 (31.66 ) 1.24Dividends per share(1) 0.61 0.52 0.48 0.12 — 0.25
Balance Sheet DataTotal finance receivables $ 44,294.5 $ 35,048.2 $ 31,300.2 $ 27,621.3 $ 28,459.0 $ 31,879.4
Reserve for credit losses 621.7 617.2 643.7 760.8 777.8 492.9Operating lease equipment, net 9,635.7 8,290.9 7,615.5 6,704.6 6,567.4 6,402.8
Total assets 63,386.6 51,111.3 46,342.8 41,932.4 42,710.5 51,349.3Commercial paper 5,225.0 4,210.9 4,173.9 4,974.6 4,654.2 8,869.2
Variable-rate senior notes 15,485.1 11,545.0 9,408.4 4,906.9 5,379.0 9,614.6Fixed-rate senior notes 22,853.6 21,715.1 19,830.8 19,681.8 18,385.4 17,113.9
Non-recourse, secured borrowings — student lending 4,048.8 — — — — —
Total stockholders’ equity 6,962.7 6,055.1 5,394.2 4,870.7 4,757.8 5,947.6
Selected Profitability RatiosNet income (loss) as a percentage of AEA 1.95% 1.93% 1.58% 1.73% (18.71)% 0.87%
Net income (loss) as a percentage of average tangible common stockholders’ equity 17.6% 14.5% 11.8% 12.5% (160.0)% 8.5%
Net finance margin as a percentage of AEA 3.40% 3.94% 3.64% 4.22% 4.57% 4.29%
Efficiency ratio 41.1% 41.8% 41.1% 38.1% 35.4% 41.2%Salaries and general operating expenses
as a percentage of AMA 2.05% 2.13% 1.94% 2.05% 1.91% 2.02%Credit Quality60+ days contractual delinquency as
a percentage of finance receivables 1.71% 1.73% 2.16% 3.63% 3.76% 3.46%
Non-accrual loans as a percentage of finance receivables 1.04% 1.31% 1.81% 3.43% 3.43% 2.67%
Net credit losses as a percentage of AFR 0.60% 0.91% 1.77% 2.32% 1.67% 1.20%
Reserve for credit losses as apercentage of finance receivables 1.40% 1.76% 2.06% 2.75% 2.73% 1.55%
Other
Total managed assets $ 62,866.4 $ 53,470.6 $ 49,735.6 $ 46,357.1 $ 47,622.3 $ 50,877.1Tangible stockholders’ equity
to managed assets 9.8% 10.7% 10.4% 10.4% 9.9% 8.6%
Employees 6,340 5,860 5,800 5,835 5,850 6,785
(1) Net income (loss) and dividend per share calculations for the periods preceding September 30, 2002 assume that common shares outstanding as a result ofthe July 2002 IPO (basic and diluted of 211.6 million and 211.7 million) were outstanding during such historical periods.
(2) Includes goodwill impairment charge of $6,511.7 million.

16 CIT GROUP INC 2005
In the following discussion we use financial terms that are rele-vant to our business. You can find a glossary of other key termsused in our business in Part I Item 1. Business section.
This Management’s Discussion and Analysis of FinancialCondition and Results of Operations and Quantitative and
Qualitative Disclosure about Market Risk contains certainnon-GAAP financial measures. See “Non-GAAP FinancialMeasurements” for additional information. In the sections thatfollow, we analyze our results.
INTRODUCTION
Part Two
ITEM 7. Management’s Discussion and Analysis of Financial Condition and Results of Operations
and
ITEM 7A. Quantitative and Qualitative Disclosures aboutMarket Risk
KEY PERFORMANCE METRICS AND MEASUREMENTS
Profitability Our ability to generate income on investments togenerate returns to our shareholders and build our capital base tosupport future growth. We measure our performance in this areawith:
Asset Generation Our ability to originate new business and buildour earning assets. We measure our performance in these areaswith:
Revenue Generation Our ability to lend money at rates in excessof our cost of borrowing and to generate non-spread revenue.We measure our performance in this area with:
Liquidity and Market Rate Risk Management Our liquidity riskmanagement pertains to our ability to obtain funding at compet-itive rates, which depends on maintaining high quality assets,strong capital ratios, and high credit ratings. Market rate riskmanagement pertains to our ability to manage our interest rateand currency rate risk, where our goal is to substantially insulateour interest margins and profits from movements in marketinterest rates and foreign currency exchange rates. We measureour liquidity and market rate risk management with:
p Net income per common share (EPS);p Net income as a percentage of average tangible com-
mon equity (ROTE);p Net income as a percentage of average common equity
(ROE); andp Net income as a percentage of average earning
assets (ROA).
p Origination volumes by channel;p Customer retention;p Sales force productivity; andp Levels of financing and leasing assets, and managed
assets (including securitized finance receivables that wecontinue to manage).
p Levels of net finance margin;p Levels of non-spread and other revenue;p Finance income as a percentage of AEA;p Net finance margin as a percentage of AEA; andp Operating lease margin as a percentage of average leased
equipment (“AOL”).
p Interest expense as a percentage of AEA;p Net finance margin as a percentage of AEA; andp Various interest sensitivity and liquidity measurements,
which we discuss in “Risk Management”.

Item 7: Management’s Discussion and Analysis 17
KEY PERFORMANCE METRICS AND MEASUREMENTS (continued)
Equipment and Residual Risk Management Our ability to eval-uate collateral risk in leasing and lending transactions and toremarket equipment at lease termination. We measure theseactivities with:
Credit Risk Management Our ability to evaluate the credit-worthiness of our customers, both during the credit grantingprocess and after the advancement of funds, and to maintainhigh-quality assets while balancing income potential with ade-quate credit loss reserve levels. We assess our credit risk manage-ment with:
Expense Management Our ability to maintain efficient operat-ing platforms and infrastructure in order to run our business atcompetitive cost levels. We track our efficiency with:
Capital Management Our ability to maintain a strong capitalbase. We measure our performance in this area with:
p Gains and losses on equipment sales; andp Equipment utilization and value of equipment off
lease.
p Net charge-offs as a percentage of average financereceivables;
p Delinquent assets as a percentage of finance receiv-ables;
p Non-performing assets as a percentage of financereceivables;
p Reserve for credit losses as a percentage of financereceivables, of delinquent assets, and of non-perform-ing assets; and
p Concentration risk by geographic region, industry andby customer.
p Efficiency ratio, which is the ratio of operatingexpenses to net revenue; and
p Operating expenses as a percentage of average man-aged assets (“AMA”).
p Tangible capital base; p Tangible capital to managed assets ratio; andp Tangible book value per common share.

18 CIT GROUP INC 2005
PROFITABILITY AND KEY BUSINESS TRENDS
0
200
400
600
800
$1,000
200520042003
Net Income (dollars in millions)
$566.9
$753.6
$936.4
Income Metrics
Return Metrics
Return on assets and return on equity improved in both 2005and 2004 reflecting improved earnings in all segments.
Average earning assets grew 23% and 9%, and ending managedassets grew 18% and 8% during 2005 and 2004. Our focusduring both 2005 and 2004 was on prudent growth, as we con-tinued to supplement organic growth with strategic acquisi-tions, offset by the liquidation of non-strategic portfolios.
Earnings for 2005 reflected strong non-spread revenue, thecontinuation of low charge-offs, and reduced tax expense, inpart due to the offshore relocation of certain aircraft leasingoperations. Net finance margin, while stable during 2005,
declined from 2004 due to growth in the lower risk and lowermargin – U.S. government guaranteed – student lending busi-ness, longer-term debt financing and competitive market pric-ing. We also made investments in sales and marketinginitiatives in 2005, which increased operating expenses.
The earnings improvement in 2004 from 2003 was driven pri-marily by improved finance margin and a considerable reduc-tion in charge-offs.
Other significant items in the 2005 and 2004 trends are dis-cussed further in the segment results discussion that follows.
0
5
10
15
20%
200520042003
Return on Equity
10.9%
13.2%
15.1%
0
1
2
3
4
$5
200520042003
Diluted Earnings per Share
$2.66
$3.50
$4.44
0
1
2
3%
200520042003
Return on Assets
1.58%
1.93% 1.95%
Diluted earnings per share and net income growthapproximated 25% in 2005 and 30% in 2004. Theimproved earnings reflect strong operating fundamentals,
asset growth and improved capital discipline. 2005 EPSgrowth also benefitted from a reduction in share countresulting from capital initiatives.

Item 7: Management’s Discussion and Analysis 19
We measure segment performance using risk-adjusted capital,applying different leverage ratios to each business to allocatecapital based on market criteria and inherent differences in risklevels. The capital allocations reflect the relative risk of individ-ual asset classes within the segments and range from approxi-mately 2% of managed assets for U.S. government guaranteededucation loans to approximately 15% of managed assets forlonger-term assets such as aerospace. The targeted risk-adjusted
capital allocations by segment (as a percentage of average man-aged assets) are as follows: Specialty Finance – Commercial,9%, Specialty Finance – Consumer, 5%, Commercial Services,Corporate Finance and Equipment Finance, 10% and CapitalFinance, 14%. See Note 20– Business Segment Information ofItem 8. Financial Statements and Supplementary Data for detailson our 2005 realignment initiatives and measuring segmentperformance using risk-adjusted capital.
RESULTS BY BUSINESS SEGMENT
Results by Business Segment (dollars in millions)
For the years ended December 31, 2005 2004 2003(1)����������������������� ����������������������� �����������������������������
Net Income (Loss)
Specialty Finance – Commercial $326.6 $268.3 $225.3
Specialty Finance – Consumer 66.7 46.3 35.6����������������������� ����������������������� �����������������������
Total Specialty Finance Group 393.3 314.6 260.9����������������������� ����������������������� �����������������������
Commercial Services 184.7 161.1 127.6
Corporate Finance 177.1 148.6 147.7
Capital Finance 129.9 87.0 42.3
Equipment Finance 98.2 81.5 38.5����������������������� ����������������������� �����������������������
Total Commercial Finance 589.9 478.2 356.1����������������������� ����������������������� �����������������������
Corporate and Other (46.8) (39.2) (50.1)����������������������� ����������������������� �����������������������
Total $936.4 $753.6 $566.9����������������������� ����������������������� ���������������������������������������������� ����������������������� �����������������������
Return on Assets Return on Equity����������������������������������������������������������������������������������������������������������������������������������������������� ������������������������������������������������������������������������������������������������������������������������������������������������
For the years ended December 31, 2005 2004 2003(1) 2005 2004 2003(1)����������������������� ����������������������� ����������������������������� ����������������������� ����������������������� �����������������������������
Specialty Finance – Commercial 2.96% 2.56% 2.21% 25.0% 21.0% 18.1%
Specialty Finance – Consumer 0.62% 1.20% 1.73% 9.4% 14.9% 21.5%
Total Specialty Finance 1.81% 2.19% 2.13% 19.1% 19.8% 19.3%
Commercial Services 6.78% 6.05% 5.43% 27.1% 25.7% 23.1%
Corporate Finance 2.10% 2.25% 2.32% 19.0% 22.2% 22.9%
Capital Finance 1.33% 1.06% 0.56% 9.9% 10.5% 5.5%
Equipment Finance 1.82% 1.18% 0.56% 12.3% 8.0% 3.8%
Total Commercial Finance 2.24% 1.96% 1.53% 15.8% 15.4% 12.0%
Total 1.95% 1.93% 1.58% 15.1% 13.2% 10.9%
(1) 2003 results reflect a uniform leverage ratio among the segments.

20 CIT GROUP INC 2005
Results by segment were as follows:
2005 versus 2004
p Specialty Finance – Commercial reflected improved profit-ability in the vendor programs and international operations aswell as a $26.8 million after tax gain on the sale of the micro-ticket leasing point of sale unit, offset by the loss ($11.9 mil-lion after tax) on the disposition of manufactured housingreceivables.
p Specialty Finance – Consumer results reflected higherearnings in the home lending unit as well as earnings fromthe student lending business acquired in the first quarter of2005. Returns both as a percentage of average earning assetsand equity declined from the prior year. The decline in returnon average earning assets was due to the lower margins in theU.S. government guaranteed student lending business. Thedecline in return on average equity was due to the allocation of capital related to goodwill associated with the studentlending acquisition.
p Commercial Services earnings improvement was driven byhigher interest margin. Factoring commissions were up 4%from the prior year as increased volume was mitigated bylower commission rates.
p Corporate Finance earnings reflected strong results across vir-tually all industry groups and increased non-spread revenue,offset by increased operating expenses, as we continue toinvest in sales initiatives.
p Capital Finance net income includes a $52.8 million after-taxloss relating to the disposition of certain aircraft assets. Thisamount was offset by a significant reduction in tax expense($34.6 million after tax) due to the transfer of certain aero-space leasing operations offshore and the resolution of a taxliability in our international operations. Excluding the air-
Corporate (dollars in millions)
For the years ended December 31, 2005 2004 2003����������������������� ����������������������� �����������������������
Unallocated expenses $(93.9) $(75.6) $ (3.3)
Real estate investment sale gain 69.7 – –
Mark-to-market on non-accounting hedge derivatives(1) 24.4 – –
Hurricane charges (25.6) – –
Specific Argentine and telecommunication provisions – 26.4 –
Preferred stock dividends (12.7) – –
Restructuring charges (15.4) – –
Gain on debt redemption – 25.5 30.8
Venture capital operating income/(losses)(2) 6.7 (15.5) (77.6)����������������������� ����������������������� �����������������������
Total $(46.8) $(39.2) $(50.1)����������������������� ����������������������� ���������������������������������������������� ����������������������� �����������������������
(1) See description in Other Revenue.(2) Venture capital operating losses include realized and unrealized gains and losses related to venture capital investments as well as interest costs and other oper-
ating expenses associated with these portfolios.
craft disposition loss, pretax income was up modestly from2004, reflecting improved rentals in both aerospace and rail.
p Equipment Finance net income improvement was driven bylower charge-offs and a $14.4 million after-tax gain on thestrategic sale of certain business aircraft.
2004 versus 2003
p Specialty Finance – Commercial reflected improved prof-itability in the small and mid-ticket leasing business and thecontinuation of strong returns in the vendor programs, whichwere offset in part by the loss related to the accelerated liqui-dation via sale of the manufactured housing portfolio.
p Specialty Finance – Consumer results reflected higher netincome and the continuation of good returns in the homelending unit. Home lending profitability also reflected lowersecuritization gains in 2004.
p Commercial Services earnings reflected continued highreturns in our factoring operations as well as the benefit fromacquisitions completed in the latter part of 2003.
p Corporate Finance earnings were essentially flat with 2003.
p Capital Finance returns rebounded from disappointingresults in 2003, reflecting some improvement in aerospacerentals and continued strong rail rentals, as well as increasednon-spread revenue.
p Equipment Finance returns improved from the low 2003level, reflecting sharply lower charge-offs and higher equip-ment gains. Profitability improvement was broad, across busi-ness lines in both the U.S. and Canada.
Corporate included after tax amounts as shown in the tablebelow:
The increase in unallocated corporate operating expense inboth years was due primarily to increased performance-based
compensation, professional services, and other compliance-related costs as well as higher unallocated funding costs.

Item 7: Management’s Discussion and Analysis 21
NET FINANCE MARGIN
Net Finance Margin (dollars in millions)
For the years ended December 31, 2005 2004 2003���������������������������������� ����������������������� �����������������������
Finance income – loans and capital leases $ 3,018.7 $ 2,363.8 $ 2,249.2
Rental income on operating leases 1,496.5 1,397.0 1,460.1
Interest expense 1,912.0 1,260.1 1,348.7���������������������������������� ���������������������������������� ����������������������������������
Net finance income 2,603.2 2,500.7 2,360.6
Depreciation on operating lease equipment 968.0 965.4 1,057.5���������������������������������� ���������������������������������� ����������������������������������
Net finance margin $ 1,635.2 $ 1,535.3 $ 1,303.1���������������������������������� ���������������������������������� �������������������������������������������������������������������� ���������������������������������� ����������������������������������
Average Earnings Assets (“AEA”) $48,128.2 $39,011.3 $35.813.4���������������������������������� ���������������������������������� �������������������������������������������������������������������� ���������������������������������� ����������������������������������
As a % of AEA:
Finance income – loans and capital leases 6.27% 6.06% 6.28%
Rental income on operating leases 3.11% 3.58% 4.08%
Interest expense 3.97% 3.23% 3.77%���������������������������������� ���������������������������������� ����������������������������������
Net finance income 5.41% 6.41% 6.59%
Depreciation on operating lease equipment 2.01% 2.47% 2.95%���������������������������������� ���������������������������������� ����������������������������������
Net finance margin 3.40% 3.94% 3.64%���������������������������������� ���������������������������������� �������������������������������������������������������������������� ���������������������������������� ����������������������������������
As a % of AOL:
Rental income on operating leases 17.03% 17.86% 20.16%
Depreciation on operating lease equipment 11.02% 12.34% 14.60%���������������������������������� ���������������������������������� ����������������������������������
Net operating lease margin 6.01% 5.52% 5.56%���������������������������������� ���������������������������������� �������������������������������������������������������������������� ���������������������������������� ����������������������������������
Average Operating Lease Equipment (“AOL”) $ 8,788.5 $ 7,821.2 $ 7,241.1���������������������������������� ���������������������������������� �������������������������������������������������������������������� ���������������������������������� ����������������������������������
REVENUE
0
500
1,000
1,500
2,000
2,500
$3,000
20062006200520042003
$2,162.4
$859.3
$1,303.1
$2,422.4
$887.1
$1,535.3
$2,772.6
$1,137.4
$1,635.2
Other Revenue (Non-Spread Revenue)
Net Finance Margin
Revenue (dollars in millions)
The trend in our revenues (total net revenues) from 2003 to2005 reflects both asset growth and a focus on non-spreadrevenue growth. Non-spread revenue accounted for 41% ofnet revenue in 2005, up from 37% in 2004 and 40% in2003. Increasing non-spread revenue continues to be astrategic focus.

22 CIT GROUP INC 2005
The amount of net finance income increased during 2005 and2004, reflecting the higher asset levels. As a percentage of aver-age earning assets, net finance income declined in both yearsdue to: 1) the blending of the lower rate, U.S. governmentguaranteed student lending portfolio in 2005 (net financeincome as a percentage of AEA excluding student lending was5.84% in 2005); 2) pricing pressure, reflecting liquidity inmany of our lending businesses; and 3) an increasingly moreconservative liquidity profile during the periods, includinghigher cash balances, the continued maturity extension of thedebt portfolio and other increased alternative liquidity facili-ties. Yield related fees also declined in 2005. Market interestrates increased in both 2005 and 2004. Though we continu-ously manage our interest rate sensitivity with essentially amatched asset /liability position, we do fund a modest amountof fixed-rate assets with variable rate debt. As a result, the risingmarket interest rate environment also put modest pressure onour margins.
In both 2005 and 2004, the proportion of longer-lived aero-space and rail assets in Capital Finance increased from the pre-ceding year. These longer-lived assets have lower rental ratesand lower annual depreciation rates as a percentage of the oper-ating lease assets than small to mid-ticket leasing assets inSpecialty Finance – Commercial and Equipment Finance. As aresult operating lease rentals and depreciation expense declinedas a percentage of operating lease assets during both years. Theincrease in net operating lease margin as a percentage of operat-ing lease assets reflected strengthening rental rates in both aero-space and rail, including the impact of higher interest rates. See“Concentrations – Operating Leases” for additional informa-tion regarding our operating lease assets.
NET FINANCE MARGIN AFTER PROVISION FOR CREDIT LOSSES (RISK ADJUSTED MARGIN)
The growth in risk adjusted margin from 2003 to 2005 largelyreflects the variances in net finance margin as discussed previ-ously, as well as a benefit from lower charge-offs, which we dis-cuss further in “Credit Metrics”.
During 2005, we recorded a $34.6 million provision for creditlosses related to estimated hurricane losses, which is discussed
Net Finance Margin after Provision for Credit Losses (Risk Adjusted Margin) (dollars in millions)
For the years ended December 31, 2005 2004 2003����������������������������� ����������������������������� �����������������������������
Net finance margin $ 1,635.2 $ 1,535.3 $ 1,303.1
Provision for credit losses 217.0 214.2 387.3��������������������������������� ��������������������������������� ���������������������������������
Net finance margin after provision for credit losses (risk adjusted margin) $ 1,418.2 $ 1,321.1 $ 915.8��������������������������������� ��������������������������������� ������������������������������������������������������������������ ��������������������������������� ���������������������������������
As a % of AEA:
Net finance margin 3.40% 3.94% 3.64%
Provision for credit losses 0.45% 0.55% 1.08%��������������������������������� ��������������������������������� ���������������������������������
Net finance margin after provision for credit losses (risk adjusted margin) 2.95% 3.39% 2.56%��������������������������������� ��������������������������������� ������������������������������������������������������������������ ��������������������������������� ���������������������������������
Average Earnings Asset (“AEA”) $48,128.2 $39,011.3 $35,813.4��������������������������������� ��������������������������������� ������������������������������������������������������������������ ��������������������������������� ���������������������������������
further in “Reserve for Credit Losses”. Excluding this item,adjusted margin as a percentage of AEA was 3.02% for 2005.During 2004, we reduced previously established specificreserves by $43.3 million relating to telecommunications assets.Excluding this provision reduction, risk adjusted margin as apercentage of AEA was 3.28%.

Item 7: Management’s Discussion and Analysis 23
We continue to emphasize growth and diversification of otherrevenues to improve our overall profitability.
Fees and other income include securitization-related servicingfees and accretion, syndication fees, miscellaneous fees, and gainsfrom asset sales. Securitization-related fees (net of impairmentcharges) were essentially flat in 2005 due to reduced impairmentcharges, following a decline in 2004, corresponding to a 14%decline in securitized assets. Our emphasis on funding homelending receivables on-balance sheet resulted in a reduction insecuritization-related revenues and an increase in both interestmargin and provision for credit losses in both years. Strong feesand other income in Capital Finance and Corporate Financemore than offset this factor. Gains on sales of receivables were upfrom 2005 due to sales of student lending receivables.
Higher factoring commissions reflect strong volumes, includingincremental volume from acquisitions, though commissionrates were down modestly from 2004. The increased commis-sions in 2004 reflected two large acquisitions completed duringthe latter part of 2003.
Gains on sales of equipment remained strong in 2005, but weredown from 2004, largely in Capital Finance. The increase in2004 resulted from firming of equipment prices and highergains across virtually all leasing businesses, most notably inEquipment Finance and in the international unit of SpecialtyFinance-Commercial.
Securitization gains decreased in 2005 and 2004 from the pre-ceding years, due to both a lower volume of receivables securi-tized and reduced gains on the amounts securitized. In 2005and 2004, we funded home lending growth entirely on-balancesheet, versus $489 million of home lending assets that weresecuritized in 2003. The lower gains as a percentage of volumein both 2005 and 2004 were primarily due to a higher proportionof, and tighter spreads on, vendor receivables sold.
Securitization gains were 2.8% of pretax income in 2005, downfrom 4.8% and 10.8% in the preceding two years.
The following items of note, the majority of which were theresult of capital allocation activities, also impacted other rev-enue. Excluding these amounts and venture capital investmentgains and losses, other revenue was 2.09%, 2.32% and 2.65%of AEA and 38.0%, 37.1% and 42.1% of net revenues for2005, 2004 and 2003.
Gain on real estate investment resulted from the sale of an inter-est in Waterside Plaza, a residential complex in New York City.
Charge related to aircraft held for sale resulted from manage-ment’s strategic decision to actively market certain older, out ofproduction commercial, regional and business aircraft in thethird quarter of 2005 with a carrying value of approximately$190 million. As of December 31, 2005, approximately $15.0million have been sold at amounts approximating the written-down values. The remainder of the portfolio remains classifiedas assets held for sale.
Gain on sale of micro-ticket leasing business is the fourth quar-ter 2005 sale of the micro-ticket leasing point-of-sale unit inSpecialty Finance – Commercial.
Gain on sale of business aircraft reflects the strategic sale of themajority of the Equipment Finance business aircraft portfolio(approximately $900 million). The remainder of this portfolio(approximately $600 million) was transferred to Capital Financefollowing the completion of the sale in the second half of 2005.
Gain on derivatives relates to the mark-to-market of certaincompound cross-currency swaps that did not qualify for hedgeaccounting treatment. All of the swaps were either terminated or had matured as of December 31, 2005. See Item 9A.Controls and Procedures for a discussion of internal controlsrelating to derivative hedge accounting.
OTHER REVENUE
Other Revenue (dollars in millions)
For the years ended December 31, 2005 2004 2003����������������������� ����������������������� �����������������������
Fees and other income $637.0 $518.6 $586.2
Factoring commissions 235.7 227.0 189.8
Gains on sales of leasing equipment 91.9 101.6 70.7
Gains on securitizations 39.1 59.1 100.9
Gain on real estate investment sale 115.0 – –
Charge related to aircraft accelerated liquidation (86.6) – –
Gain on sale of micro-ticket leasing business unit 44.3 – –
Gain on strategic sale of business aircraft 22.0 – –
Gain on derivatives 43.1 – –
Charges related to sale of manufactured housing loans (20.0) (15.7) –
Net gain (loss) on venture capital investments 15.9 (3.5) (88.3)���������������������������� ������������������������ ������������������������
Total other revenue $1,137.4 $887.1 $859.3���������������������������� ������������������������ ���������������������������������������������������� ������������������������ ������������������������
Other revenue as a percentage of AEA 2.36% 2.27% 2.40%���������������������������� ������������������������ ���������������������������������������������������� ������������������������ ������������������������
Other revenue as a percentage of net revenues 41.0% 36.6% 39.7%���������������������������� ������������������������ ���������������������������������������������������� ������������������������ ������������������������

24 CIT GROUP INC 2005
RESERVE FOR CREDIT LOSSES
Reserve for Credit Losses (dollars in millions)
For the years ended December 31, 2005 2004 2003����������������������� ����������������������� �����������������������
Balance beginning of period $617.2 $643.7 $760.8����������������������� ����������������������� �����������������������
Provision for credit losses – finance receivables (by segment)
Specialty Finance – Commercial 93.2 109.2 132.8
Specialty Finance – Consumer 34.6 32.7 26.5
Commercial Services 22.9 23.4 27.6
Corporate Finance 3.2 24.5 46.5
Capital Finance 4.6 7.3 12.3
Equipment Finance 21.1 53.2 125.7
Corporate and Other, including specific reserving actions 37.4 (36.1) 15.9����������������������� ����������������������� �����������������������
Total provision for credit loss 217.0 214.2 387.3
Reserves relating to acquisitions, other movements 38.6 60.5 17.5����������������������� ����������������������� �����������������������
Additions to reserve for credit losses, net 255.6 274.7 404.8����������������������� ����������������������� �����������������������
Net credit losses – excluding telecommunications and Argentina:
Specialty Finance – Commercial 95.3 111.0 138.8
Specialty Finance – Consumer 53.2 41.0 27.2
Commercial Services 22.9 23.3 27.6
Corporate Finance 0.5 26.0 44.6
Capital Finance 53.6 6.6 10.0
Equipment Finance 25.6 53.2 125.7����������������������� ����������������������� �����������������������
Net credit losses – prior to telecommunication/Argentine chargeoffs 251.1 261.1 373.9
Telecommunications – 40.1 47.0
Argentine – – 101.0����������������������� ����������������������� �����������������������
Total net credit losses 251.1 301.2 521.9����������������������� ����������������������� �����������������������
Balance end of period $621.7 $617.2 $643.7����������������������� ����������������������� ���������������������������������������������� ����������������������� �����������������������
Reserve for credit losses as a percentage of finance receivables 1.40% 1.76% 2.06%
Reserve for credit losses as a percentage of past due receivables (60 days or more) 82.0% 101.5% 95.2%
Reserve for credit losses as a percentage of non-performing assets 119.3% 114.4% 95.2%
Charges related to the sales of manufactured housing loansreflect the accelerated liquidation of approximately $125 mil-lion and $300 million in manufactured housing loans in 2005
and 2004. These assets were reclassified as held for sale on thefinancial statements and marked to estimated fair value, result-ing in the above charges.

Item 7: Management’s Discussion and Analysis 25
The lower level of reserve for credit losses in the years presentedabove reflects the improvements in our credit metrics, specifi-cally the decline in charge-offs over the same periods. Thiscredit quality improvement, along with the addition of$5.1 billion of U.S. government guaranteed student lendingreceivables, drove the decline in the percentage of reserve tofinance receivables over the periods shown. Corporate andOther includes specific amounts provided for estimated hurri-cane losses in 2005 and the reversal of previously establishedspecific telecommunications reserves in 2004. See CreditMetrics for further discussion.
We determine the reserve for credit losses using three key com-ponents: (1) specific reserves for collateral and cash flowdependent loans that are impaired under SFAS 114, (2)reserves for estimated losses inherent in the portfolio basedupon historical and projected credit risk, and (3) reserves foreconomic environment risk and other factors.
The reserve included specific reserves, excluding telecommuni-cation accounts, relating to impaired loans of $61.7 million,$87.1 million and $66.4 million at December 31, 2005, 2004and 2003. The 2005 balance includes amounts for a power gen-eration facility subject to bankruptcy proceedings andHurricanes Katrina and Rita, while the 2004 balance includesamounts related to U.S. commercial airline hub carriers. Theportion of the reserve related to inherent estimated loss and esti-mation risk reflects our evaluation of trends in our key creditmetrics, as well as our assessment of risk in specific industry sectors.
In managing the consolidated reserve for credit losses to providefor losses inherent in the portfolio, we estimate the ultimate out-come of collection efforts and realization of collateral values,among other things. Therefore, we may make additions orreductions to the consolidated reserve for credit losses depend-ing on changes in economic conditions or credit metrics,including past due and non-performing accounts, or otherevents affecting specific obligors or industries. We continue tobelieve that the credit risk characteristics of the portfolio are welldiversified by geography, industry, borrower, and collateral type.See “Concentrations” for more information.
During the third quarter of 2005, we established a $34.6 mil-lion reserve for credit losses related to Hurricanes Katrina andRita. This amount reflects management’s best estimate of lossbased on available, relevant information. Total business seg-
ment owned and securitized receivables in the three mostimpacted states (Louisiana, Alabama and Mississippi) wereapproximately $925 million and $200 million. Of theseamounts, exposure to commercial and consumer customerslocated in the Federal Emergency Management Agency(“FEMA”) designated disaster areas and other areas that man-agement determined were significantly impacted were approxi-mately $600 million and $50 million respectively, includingapproximately $250 million in the FEMA designated disasterareas relating principally to equipment and vendor financeassets and home mortgages. For commercial loans, manage-ment performed a loan-by-loan assessment of estimated loss.For equipment and vendor assets and home mortgages in theFEMA designated disaster areas, management performed ananalysis of exposure by zip code, including flood versus non-flood designated locations, supplemented with a range of cor-responding estimated damage assessments. This estimate ofloss involves considerable judgment and assumptions aboutuncertain matters, including the existence of insurance inforce with respect to damages incurred, insurance claims andproceeds and the extent of property damage. Our currentexpectation is for related charge-offs to be realized in the latterpart of 2006 and into 2007. Management will continue toassess the financial impact of the hurricanes as more informa-tion becomes available.
While the Hurricane reserves were provisioned throughCorporate, a summary of the estimated incurred hurricanecharges by segment is as follows:
Reserve for(dollars in millions) Credit Losses
����������������������������������������������
Specialty Finance – Commercial $ 4.2
Specialty Finance – Consumer 16.9��������������������
Total Specialty Finance Group 21.1��������������������
Commercial Services 3.0
Corporate Finance 6.5
Equipment Finance 4.0��������������������
Total Commercial Finance Group 13.5��������������������
Total $34.6����������������������������������������
Based on currently available information and our portfolio riskassessment, we believe that our total reserve for credit losses isadequate.

26 CIT GROUP INC 2005
The trends in the tables above are positive, as charge-offs on anowned and managed basis, both in amount and as a percentageof assets, declined in 2005 and 2004 across virtually every seg-ment. Capital Finance was the only notable exception, as 2005amounts included $48.5 million in airline receivable charge-offs on two bankrupt U.S. hub carriers. The improvement incharge-offs was largely in the owned portfolio, as the decline insecuritized portfolio charge-offs during the two years was more
modest, particularly as a percentage of securitized assets givenour emphasis on balance sheet funding during 2005 and 2004.Total securitized portfolio charge-offs were 1.12%, 1.28% and1.58% as a percentage of securitized assets in 2005, 2004 and2003, reflecting the higher proportion of vendor assets sold (forwhich CIT has loss recourse) and improvement in theEquipment Finance portfolios. Consumer home lendingsecuritization-related charge-offs increased approximately
NET CHARGE-OFFS
Net Charge-offs (dollars in millions)
For the years ended December 31, 2005 2004 2003����������������������������������������������������������������������� ����������������������������������������������������������������������� �����������������������������������������������������������������������
Owned
Specialty Finance – Commercial $ 95.3 1.08% $111.0 1.32% $239.8 2.96%
Specialty Finance – Consumer 53.2 0.52% 41.0 1.11% 27.2 1.53%����������������������� ����������������������� �����������������������
Total Specialty Finance 148.5 0.78% 152.0 1.26% 267.0 2.71%����������������������� ����������������������� �����������������������
Commercial Services 22.9 0.34% 23.3 0.37% 27.6 0.54%
Corporate Finance 0.5 0.01% 66.1 1.00% 91.6 1.44%
Capital Finance 53.6 2.34% 6.6 0.37% 10.0 0.53%
Equipment Finance 25.6 0.51% 53.2 0.84% 125.7 2.03%����������������������� ����������������������� �����������������������
Total Commercial Finance 102.6 0.46% 149.2 0.71% 254.9 1.30%����������������������� ����������������������� �����������������������
Total $251.1 0.60% $301.2 0.91% $521.9 1.77%����������������������� ����������������������� ���������������������������������������������� ����������������������� �����������������������
Managed
Specialty Finance – Commercial $133.8 1.06% $155.4 1.25% $299.5 2.44%
Specialty Finance – Consumer 80.8 0.72% 60.8 1.17% 40.6 1.02%����������������������� ����������������������� �����������������������
Total Specialty Finance 214.6 0.90% 216.2 1.22% 340.1 2.09%����������������������� ����������������������� �����������������������
Commercial Services 22.9 0.34% 23.3 0.37% 27.6 0.54%
Corporate Finance 1.4 0.02% 66.1 1.00% 91.6 1.44%
Capital Finance 53.6 2.34% 6.6 0.37% 10.0 0.53%
Equipment Finance 42.1 0.56% 97.7 1.06% 210.8 2.14%����������������������� ����������������������� �����������������������
Total Commercial Finance 120.0 0.48% 193.7 0.81% 340.0 1.47%����������������������� ����������������������� �����������������������
Total $334.6 0.68% $409.9 0.99% $680.1 1.72%����������������������� ����������������������� ���������������������������������������������� ����������������������� �����������������������
CREDIT METRICS
0
1
2%
200520042003
0.60%
0.91%
1.77%
Owned Charge-Offs (as a percentage of average finance receivables)
0
1
2%
200520042003
0.68%
0.99%
1.72%
Managed Charge-Offs (as a percentage of average managed receivables)

Item 7: Management’s Discussion and Analysis 27
$8 million or 139 basis points as a percentage of securitizedassets from 2004, due to seasoning in these portfolios and theswitch to on-balance sheet funding in this business.
Specialty Finance - Commercial charge-offs improved in 2005due to improved credit in the vendor programs, the internationalunit and small business lending. Charge-offs in 2003 included a$101.0 million write-off of owned assets in Argentina, whichreflected the substantial progress of collection and work out effortsin the Argentine portfolio. Excluding Argentina and liquidatingportfolios, Specialty Finance - Commercial charge-offs were1.56% as a percentage of average finance receivables for 2003.
Specialty Finance - Consumer charge-offs in 2005 were up inamount from the prior year, but were down as a percentage ofaverage finance receivables, reflecting portfolio growth,improved credit performance and the addition of the studentlending assets.
Corporate Finance trends between 2003 and 2005 were drivenlargely by charge-offs in the telecommunications portfolio thatwere taken against a specific reserve established in 2002.Approximately $40 million of these telecommunicationcharge-offs were taken in both 2003 and 2004, versus negligi-ble amounts in 2005, as the current period benefited fromrecoveries in this portfolio.
Capital Finance 2005 charge-offs included the above-men-tioned charge-offs on two bankrupt U.S. hub carriers.
Equipment Finance charge-off reductions in both 2005 and2004 were across product lines in both the U.S. and Canada,reflecting improved underwriting standards, lower non-per-forming assets and strengthening collateral values.
PAST DUE LOANS AND NON-PERFORMING ASSETS
Like charge-off trends, the trend in our delinquency and non-performing metrics were favorable for the three-year period andended 2005 at levels that are low in relation to our historicalmeasures. Non-performing assets declined in both 2005 and2004 from the preceding years, both in amount and as a per-centage of assets, with broad-based improvement, particularly
in the commercial businesses. Delinquencies increased in 2005,primarily due to the student lending acquisition, as delin-quency in this business is high in relation to our other portfo-lios, yet is not indicative of ultimate loss due to the U.S.government guarantee. Excluding these assets, owned delin-quency was $625.5 million (1.59%) at December 31, 2005.
Past Due Loans (60 days or more) (dollars in millions, % as a percentage of finance receivables)
As of December 31, 2005 2004 2003��������������������������������������������������������������������� ��������������������������������������������������������������������� ����������������������������������������������������������������������������
Owned Past Due
Specialty Finance – Commercial $296.8 3.49% $283.3 3.22% $ 287.3 3.59%
Specialty Finance – Consumer 318.2 2.35% 116.4 2.27% 88.7 3.33%����������������������� ����������������������� ����������������������������
Total Specialty Finance 615.0 2.79% 399.7 2.87% 376.0 3.53%����������������������� ����������������������� ����������������������������
Commercial Services 39.3 0.59% 88.0 1.42% 35.5 0.56%
Corporate Finance 43.4 0.46% 43.3 0.65% 109.5 1.73%
Capital Finance 17.0 0.90% 26.9 1.47% 17.4 1.03%
Equipment Finance 43.5 1.01% 50.1 0.79% 137.9 2.18%����������������������� ����������������������� ����������������������������
Total Commercial Finance 143.2 0.64% 208.3 0.99% 300.3 1.45%����������������������� ����������������������� ����������������������������
Total $758.2 1.71% $608.0 1.73% $ 676.3 2.16%����������������������� ����������������������� ��������������������������������������������������� ����������������������� ����������������������������
Managed Past Due
Specialty Finance – Commercial $402.6 3.04% $402.1 2.82% $ 418.4 3.19%
Specialty Finance – Consumer 401.0 2.71% 227.8 3.45% 197.6 4.22%����������������������� ����������������������� ����������������������������
Total Specialty Finance 803.6 2.87% 629.9 3.02% 616.0 3.46%����������������������� ����������������������� ����������������������������
Commercial Services 39.3 0.59% 88.0 1.42% 35.5 0.56%
Corporate Finance 43.4 0.46% 43.3 0.65% 109.5 1.73%
Capital Finance 17.0 0.83% 26.9 1.47% 17.4 1.03%
Equipment Finance 62.1 0.90% 90.3 0.96% 243.6 2.49%����������������������� ����������������������� ����������������������������
Total Commercial Finance 161.8 0.64% 248.5 1.03% 406.0 1.69%����������������������� ����������������������� ����������������������������
Total $965.4 1.81% $878.4 1.95% $1,022.0 2.44%����������������������� ����������������������� ��������������������������������������������������� ����������������������� ����������������������������

SALARIES AND GENERAL OPERATING EXPENSES
Salaries and General Operating Expenses (dollars in millions)
For the years ended December 31, 2005 2004 2003��������������������������������� ��������������������������������� ���������������������������������
Salaries and employee benefits $ 695.8 $ 612.2 $ 529.6
Other general operating expenses 418.0 399.9 358.6��������������������������������� ��������������������������������� ���������������������������������
Salaries and general operating expenses $ 1,113.8 $ 1,012.1 $ 888.2��������������������������������� ��������������������������������� ������������������������������������������������������������������ ��������������������������������� ���������������������������������
Efficiency ratio(1) 41.1% 41.8% 41.1%
Salaries and general operating expenses (including the restructuring charge)as a percentage of AMA 2.05% 2.13% 1.94%
Average Managed Assets $55,553.7 $47,519.3 $45,809.3��������������������������������� ��������������������������������� ������������������������������������������������������������������ ��������������������������������� ���������������������������������
(1) Excluding various “non-recurring” gains and losses (including real estate investment gains, derivative mark to market adjustments, venture capital gains andlosses and other items) in other revenue and the 2005 restructuring charge, the efficiency ratio was 42.2%, 41.5% and 39.5% for 2005, 2004 and 2003.
28 CIT GROUP INC 2005
Specialty Finance – Commercial delinquency increased in2005, reflecting higher delinquency levels in the vendor financeand international portfolios.
Specialty Finance – Consumer delinquency increased in 2005, primarily due to the student lending acquisition. Excluding stu-dent lending receivables, delinquencies were $185.5 million(2.18%), versus $116.4 million (2.27%) last year-end, reflectingthe home lending portfolio growth.
Commercial Services delinquency was down in 2005 due to thework-out of one significant account.
Corporate Finance, Capital Finance, and Equipment Financedelinquencies remained at the relatively low year-end 2004 levels.
Non-performing Assets (dollars in millions, % as a percentage of finance receivables)
As of December 31, 2005 2004 2003������������������������������������������������������������������������� ������������������������������������������������������������������������ ������������������������������������������������������������������������
Specialty Finance – Commercial $155.2 1.83% $165.9 1.88% $179.7 2.25%
Specialty Finance – Consumer 173.0 1.28% 119.3 2.32% 96.3 3.61%������������������������� ������������������������� �������������������������
Total Specialty Finance 328.2 1.49% 285.2 2.05% 276.0 2.59%������������������������� ������������������������� �������������������������
Commercial Services 5.3 0.08% 56.8 0.92% 5.2 0.08%
Corporate Finance 114.5 1.22% 61.8 0.92% 164.8 2.61%
Capital Finance 22.3 1.18% 4.6 0.25% 12.2 0.73%
Equipment Finance 50.9 1.18% 131.2 2.06% 218.3 3.46%������������������������� ������������������������� �������������������������
Total Commercial Finance 193.0 0.87% 254.4 1.21% 400.5 1.94%������������������������� ������������������������� �������������������������
Total $521.2 1.18% $539.6 1.54% $676.5 2.16%������������������������� ������������������������� �������������������������������������������������� ������������������������� �������������������������
Non-accrual loans $460.7 $458.4 $566.5
Repossessed assets 60.5 81.2 110.0������������������������� ������������������������� �������������������������
Total non-performing assets $521.2 $539.6 $676.5������������������������� ������������������������� �������������������������������������������������� ������������������������� �������������������������
Non-performing assets decreased in both amount and per-centage in 2005 and 2004. Improvements during 2005 inCommercial Services, Equipment Finance and the vendorfinance business of Specialty Finance – Commercial wereoffset by increased non-accrual assets in Corporate Finance($60 million lease on a power generation facility), CapitalFinance (aerospace) and the home lending business of
Specialty Finance – Consumer. The decline in percentagefrom 2004 also reflects the impact of acquired student lend-ing receivables. The improvement in Corporate Financeduring 2004 reflects the return to accrual status of a waste-to-energy project. Repossessed asset inventory declinedreflecting lower inventory levels primarily in EquipmentFinance.

Item 7: Management’s Discussion and Analysis 29
Salaries and general operating expenses in 2005 increased,largely due to incremental operating expenses associated withcurrent year acquisitions (student lending in Specialty Finance– Consumer and healthcare in Corporate Finance), invest-ments made in our sales and marketing functions and higherincentive-based compensation. The 2005 expense also includes$10.5 million in charges relating to the combination of an earlytermination of a portion of our New York City building leaseand for a legal settlement.
The 2004 increase from 2003 was driven primarily by higherincentive-based compensation (including restricted stockawards), increased professional fees, including higher compli-ance-costs related to the Sarbanes-Oxley Act and increasedbenefit expenses.
The efficiency ratio, excluding non-recurring items, deterioratedfor 2005 and 2004 as the rate of expense increase outpaced rev-enue growth in both years, particularly given our investment insales and marketing initiatives. Both the Specialty Finance andCommercial Finance efficiency ratios deteriorated modestly from2004. Personnel totaled 6,340 at December 31, 2005, versus5,860 and 5,800 at the end of the prior two years.
Both the business unit and corporate management monitorexpenses closely, and actual results are reviewed monthly in com-parison to business plan and forecast. We have an approval andreview procedure for major capital expenditures, such as com-puter equipment and software, including post-implementationevaluations.
INCOME TAXES
Provision for Income Taxes (dollars in millions)
For the Years ended December 31, 2005 2004 2003����������������������� ����������������������� �����������������������
Provision for income taxes $464.2 $483.2 $365.0
Effective tax rate 32.8% 39.0% 39.0%
The effective tax rate differs from the U.S. federal tax rate of35% primarily due to state and local income taxes, the domes-tic and international geographic distribution of taxable incomeand corresponding foreign income taxes, as well as differencesbetween book and tax treatment of certain items. The 2004and 2003 effective tax rates exceed the U.S. federal rate prima-rily due to state and local income taxes.
The reduction in the 2005 effective tax rate reflects: (1)improved profitability in our international operations, resultingfrom better platform efficiency coupled with asset growth; (2)the relocation of certain aerospace assets to Ireland with off-shore funding, as provisions of the American Jobs Creation Actof 2004 provide favorable tax treatment for certain aircraft leas-ing operations conducted offshore; (3) the release of a $17.0million deferred tax liability associated with the Irish aerospaceinitiative; and (4) the release of a tax liability of $17.6 millionrelating to our international operations, as we finalized a tax fil-ing position based on a favorable opinion received from thelocal tax authorities.
We have U.S. federal net operating losses (“NOL’s”) of approxi-mately $850 million at December 31, 2005, which expire invarious years beginning in 2011. In addition, we have variousstate NOL’s that will expire in various years beginning in 2006.Federal and state operating losses may be subject to annual uselimitations under section 382 of the Internal Revenue Code of1986, as amended, and other limitations under certain statelaws. Management believes that CIT will have sufficient tax-able income in future years and can avail itself of tax planningstrategies in order to utilize these federal losses fully.Accordingly, we do not believe a valuation allowance is requiredwith respect to these federal NOL’s. Based on management’sassessment as to realizability, the net deferred tax liabilityincludes a valuation allowance of approximately $19.0 millionand $7.4 million as of December 31, 2005 and December 31,2004 relating to state NOL’s.
We have open tax years in the U.S., Canada and other juris-dictions that are currently under examination by the applicabletaxing authorities, and certain tax years that may in the futurebe subject to examination. Management periodically evaluatesthe adequacy of our related tax reserves, taking into accountour open tax return positions, tax assessments received, tax lawchanges and third-party indemnifications. We believe that ourtax reserves are appropriate. The final determination of taxaudits could affect our tax reserves.
See Item 9A. Controls and Procedures for a discussion of internalcontrols relating to income taxes.

30 CIT GROUP INC 2005
Financing and Leasing Assets by Segment (dollars in millions)
% change������������������������������������������������������������������
As of December 31, 2005 2004 2003 05 vs 04 04 vs 03��������������������������������� ��������������������������������� ��������������������������������� ������������������������������ ������������������������������
Specialty Finance Group
Specialty Finance – Commercial
Finance receivables $ 8,503.0 $ 8,805.7 $ 7,996.5 (3.4)% 10.1%
Operating lease equipment, net 1,049.5 1,078.7 959.5 (2.7)% 12.4%
Financing and leasing assets held for sale 826.3 1,288.4 548.1 (35.9)% 135.1%��������������������������������� ��������������������������������� ���������������������������������
Owned assets 10,378.8 11,172.8 9,504.1 (7.1)% 17.6%
Finance receivables securitized and managed by CIT 3,921.6 4,165.5 4,557.9 (5.9)% (8.6)%��������������������������������� ��������������������������������� ���������������������������������
Managed assets 14,300.4 15,338.3 14,062.0 (6.8)% 9.1%��������������������������������� ��������������������������������� ���������������������������������
Specialty Finance – Consumer
Finance receivables – home lending 8,199.7 4,896.8 2,513.1 67.5% 94.9%
Finance receivables – student lending 5,051.0 – –
Finance receivables – other 302.9 236.0 151.2 28.3% 56.1%
Financing and leasing assets held for sale 390.2 241.7 150.0 61.4% 61.1%��������������������������������� ��������������������������������� ���������������������������������
Owned assets 13,943.8 5,374.5 2,814.3 159.4% 91.0%
Home lending finance receivables securitized and managed by CIT 838.8 1,228.7 1,867.6 (31.7)% (34.2)%��������������������������������� ��������������������������������� ���������������������������������
Managed assets 14,782.6 6,603.2 4,681.9 123.9% 41.0%��������������������������������� ��������������������������������� ���������������������������������
Commercial Finance Group
Commercial Services
Finance receivables 6,690.0 6,204.1 6,325.8 7.8% (1.9)%��������������������������������� ��������������������������������� ���������������������������������
Corporate Finance
Finance receivables 9,348.3 6,702.8 6,314.1 39.5% 6.2%
Operating lease equipment, net 73.3 35.1 – 108.8% –
Financing and leasing assets held for sale 127.9 – –�������������������������������� �������������������������������� ��������������������������������
Owned assets 9,549.5 6,737.9 6,314.1 41.7% 6.7%
Finance receivables securitized and managed by CIT 41.2 – –�������������������������������� �������������������������������� ��������������������������������
Managed assets 9,590.7 6,737.9 6,314.1 42.3% 6.7%��������������������������������� ��������������������������������� ���������������������������������
Capital Finance
Finance receivables 1,895.4 1,829.7 1,681.6 3.6% 8.8%
Operating lease equipment, net 8,408.5 6,736.5 6,236.4 24.8% 8.0%
Financing and leasing assets held for sale 150.3 – –��������������������������������� ��������������������������������� ���������������������������������
Owned assets 10,454.2 8,566.2 7,918.0 22.0% 8.2%��������������������������������� ��������������������������������� ���������������������������������
Equipment Finance
Finance receivables 4,304.2 6,373.1 6,317.9 (32.5)% 0.9%
Operating lease equipment, net 104.4 440.6 419.6 (76.3)% 5.0%
Financing and leasing assets held for sale 125.6 110.7 220.2 13.5% (49.7)%��������������������������������� ��������������������������������� ���������������������������������
Owned assets 4,534.2 6,924.4 6,957.7 (34.5)% (0.5)%
Finance receivables securitized and managed by CIT 2,484.1 2,915.5 3,226.2 (14.8)% (9.6)%��������������������������������� ��������������������������������� ���������������������������������
Managed assets 7,018.3 9,839.9 10,183.9 (28.7)% (3.4)%��������������������������������� ��������������������������������� ���������������������������������
Other – Equity Investments 30.2 181.0 249.9 (83.3)% (27.6)%��������������������������������� ��������������������������������� ���������������������������������
Managed assets $62,866.4 $53,470.6 $49,735.6 17.6% 7.5%��������������������������������� ��������������������������������� ������������������������������������������������������������������ ��������������������������������� ���������������������������������
FINANCING AND LEASING ASSETS
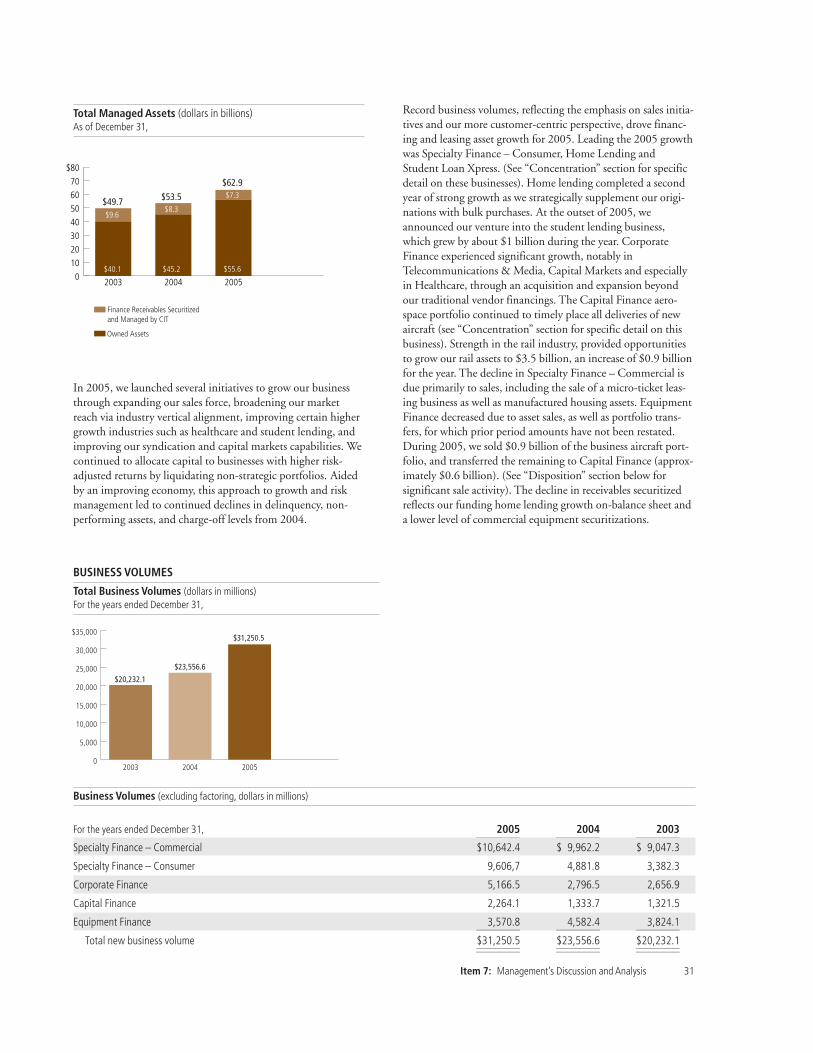
Item 7: Management’s Discussion and Analysis 31
Business Volumes (excluding factoring, dollars in millions)
For the years ended December 31, 2005 2004 2003��������������������������������� ��������������������������������� ���������������������������������
Specialty Finance – Commercial $10,642.4 $ 9,962.2 $ 9,047.3
Specialty Finance – Consumer 9,606,7 4,881.8 3,382.3
Corporate Finance 5,166.5 2,796.5 2,656.9
Capital Finance 2,264.1 1,333.7 1,321.5
Equipment Finance 3,570.8 4,582.4 3,824.1��������������������������������� ��������������������������������� ���������������������������������
Total new business volume $31,250.5 $23,556.6 $20,232.1��������������������������������� ��������������������������������� ������������������������������������������������������������������ ��������������������������������� ���������������������������������
BUSINESS VOLUMES
Total Business Volumes (dollars in millions)For the years ended December 31,
In 2005, we launched several initiatives to grow our businessthrough expanding our sales force, broadening our marketreach via industry vertical alignment, improving certain highergrowth industries such as healthcare and student lending, andimproving our syndication and capital markets capabilities. Wecontinued to allocate capital to businesses with higher risk-adjusted returns by liquidating non-strategic portfolios. Aidedby an improving economy, this approach to growth and riskmanagement led to continued declines in delinquency, non-performing assets, and charge-off levels from 2004.
Record business volumes, reflecting the emphasis on sales initia-tives and our more customer-centric perspective, drove financ-ing and leasing asset growth for 2005. Leading the 2005 growthwas Specialty Finance – Consumer, Home Lending andStudent Loan Xpress. (See “Concentration” section for specificdetail on these businesses). Home lending completed a secondyear of strong growth as we strategically supplement our origi-nations with bulk purchases. At the outset of 2005, weannounced our venture into the student lending business,which grew by about $1 billion during the year. CorporateFinance experienced significant growth, notably inTelecommunications & Media, Capital Markets and especiallyin Healthcare, through an acquisition and expansion beyondour traditional vendor financings. The Capital Finance aero-space portfolio continued to timely place all deliveries of newaircraft (see “Concentration” section for specific detail on thisbusiness). Strength in the rail industry, provided opportunitiesto grow our rail assets to $3.5 billion, an increase of $0.9 billionfor the year. The decline in Specialty Finance – Commercial isdue primarily to sales, including the sale of a micro-ticket leas-ing business as well as manufactured housing assets. EquipmentFinance decreased due to asset sales, as well as portfolio trans-fers, for which prior period amounts have not been restated.During 2005, we sold $0.9 billion of the business aircraft port-folio, and transferred the remaining to Capital Finance (approx-imately $0.6 billion). (See “Disposition” section below forsignificant sale activity). The decline in receivables securitizedreflects our funding home lending growth on-balance sheet anda lower level of commercial equipment securitizations.
0
10
20
30
40
50
60
70
$80
200520042003
$49.7$9.6
$40.1
$53.5 $8.3
$45.2
$62.9$7.3
$55.6
Owned Assets
Finance Receivables Securitizedand Managed by CIT
Total Managed Assets (dollars in billions)As of December 31,
0
5,000
10,000
15,000
20,000
25,000
30,000
$35,000
200520042003
$31,250.5
$20,232.1
$23,556.6

32 CIT GROUP INC 2005
Disposition Summary (dollars in millions)
Asset Type Assets Closing Segment������������������������������������� ������������������������ ��������������������������� ��������������������������������
Micro-ticket leasing $ 300 4th quarter 2005 Specialty Finance – Commercial
Manufactured housing 400 1st/4th quarters 2005 Specialty Finance – Commercial
Business aircraft 920 2nd quarter 2005 Equipment Finance
Venture capital 150 1st /2nd quarters 2005 Corporate and Other
Non-strategic portfolios (includingrecreational marine and vehicle, franchisefinance and owner-operator trucking) 300 Various 2004 Specialty Finance – Commercial / Equipment Finance
Venture capital 70 2nd quarter 2004 Corporate and Other
ACQUISITIONS
DISPOSITIONS
Periodically during 2004 and 2005, we continued our dispositionof assets that we determined did not meet our risk-adjusted returncriteria or did not fit in with our strategic direction, includinggrowth and scale characteristics. This guided the scale and liquida-
In January 2005, we announced our purchase of EducationLending Group, a student lending company, which providedCIT with a new product line with good growth opportunities,and we have grown this portfolio by about $1 billion duringthe year by expanding the business sales reach. The factoring
acquisition was an add-on to our established businesses. Weacquired a healthcare business to quickly grow this strategicproduct line, which offers high growth opportunities coupledwith strong returns.
tion initiatives above, thereby freeing up the corresponding capitalfor redeployment. We also targeted in the third quarter of 2005approximately $200 million of Capital Finance commercial air-craft assets for sale and wrote them down to estimated fair value.We anticipate these assets will be sold in the first half of 2006.
Acquisition Summary (dollars in millions)
Asset Type Assets Closing Segment������������������������������������� ������������������������ ��������������������������� ��������������������������������
Healthcare $ 500 3rd quarter 2005 Corporate Finance
Factoring 860 1st quarter 2005 Commercial Services
Student loans 4,300 1st quarter 2005 Specialty Finance – Consumer
Vendor finance 700 3rd quarter 2004 Specialty Finance – Commercial
Technology 520 2nd quarter 2004 Specialty Finance – Commercial
We had record business volume in all but one of our segmentsin 2005. Specialty Finance – Consumer volumes doubled as therelatively low interest rate environment resulted in strong pro-duction from our home lending broker origination channel,while softness with respect to liquidity and pricing in the homelending securitization markets afforded us the opportunity topurchase newly originated portfolios in bulk from other home
lending originators. Specialty Finance – Commercial continuedto generate strong new business strong volumes as increasedvolumes during 2004 were followed by higher 2005 levels mostnotably in the vendor and international units. Capital Financevolumes increased over the two years on aircraft deliveries andrail growth. The decrease in Equipment Finance volumesreflects related business transfers.

Item 7: Management’s Discussion and Analysis 33
LEVERAGED LEASES
The major components of net investments in leveragedleases include: 1) commercial aerospace transactions,including tax-optimized leveraged leases, which generallyhave increased risk of loss in default for lessors in relation toconventional lease structures due to additional leverage andthe third-party lender priority recourse to the equipment in
these transactions; 2) project finance transactions, primarily in the power and utility sectors; and 3) rail transactions.The decline in the aerospace balances during 2005 reflectsthe reclassification to operating leases of aircraft leased toairlines that filed for bankruptcy.
Leveraged Lease Portfolio (dollars in millions)
As of December 31, 2005 2004 2003����������������������������� ����������������������������� �����������������������������
Commercial aerospace – non-tax optimized $ 232.1 $ 336.6 $ 232.5
Commercial aerospace – tax optimized 135.2 221.0 217.9
Project finance 360.1 334.9 325.0
Rail 260.8 233.9 225.4
Other 32.5 115.4 122.1����������������������������� ����������������������������� �����������������������������
Total leveraged lease transactions $1,020.7 $1,241.8 $1,122.9����������������������������� ����������������������������� ���������������������������������������������������������� ����������������������������� �����������������������������
As a percentage of finance receivables 2.3% 3.5% 3.6%����������������������������� ����������������������������� ���������������������������������������������������������� ����������������������������� �����������������������������
OPERATING LEASES
We strive to maximize the profitability of the lease equipmentportfolio by balancing equipment utilization levels with mar-ket rental rates and lease terms.
The year over year increases in the Capital Finance aerospaceportfolio reflect deliveries of new commercial aircraft. Theincreases in Capital Finance rail and other was due to strongrail volumes, including bulk portfolio purchases, and utiliza-tion, which allowed us to expand our owned railcar portfoliofrom approximately 55,000 at the end of 2003 to in excess of80,000 at December 31, 2005.
The decline in Specialty Finance – Commercial operatinglease portfolio reflects a general market trend toward financ-ing equipment through finance leases and loans, rather thanoperating leases. The increase in 2004 was due to a technol-ogy financing business acquisition.
The decline in Equipment Finance operating leases is pri-marily due to the sale of the business aircraft portfolio.
Operating Leases (dollars in millions)
As of December 31, 2005 2004 2003����������������������������� ����������������������������� �����������������������������
Capital Finance – Aerospace $5,327.1 $4,461.0 $4,141.1
Capital Finance – Rail and Other 3,081.4 2,275.5 2,095.3
Specialty Finance – Commercial 1,049.5 1,078.7 959.5
Corporate Finance 73.3 35.1 –
Equipment Finance 104.4 440.6 419.6 ����������������������������� ����������������������������� �����������������������������
Total $9,635.7 $8,290.9 $7,615.5 ����������������������������� ����������������������������� ���������������������������������������������������������� ����������������������������� �����������������������������
Ten Largest Accounts
Our ten largest financing and leasing asset accounts in theaggregate represented 4.5% of our total financing and leasing
assets at December 31, 2005 (the largest account being lessthan 1.0%), 5.3% at December 31, 2004, and 5.7% atDecember 31, 2003. The decline is due to our consumer port-folio growth during the year.
CONCENTRATIONS

34 CIT GROUP INC 2005
JOINT VENTURE RELATIONSHIPS
Our strategic relationships with industry-leading equipmentvendors are a significant origination channel for our financingand leasing activities. These vendor alliances include traditionalvendor finance programs, joint ventures and profit sharingstructures. Our vendor programs with Dell, Snap-on and Avayaare among our largest alliances. We have multiple programagreements with Dell, the largest of which is Dell FinancialServices (“DFS”), covering originations in the U.S. The agree-ments provide Dell with the option to purchase CIT’s 30%interest in DFS in February 2008 and extends CIT’s right topurchase a percentage of DFS finance receivables throughJanuary 2010. The joint venture agreement with Snap-on wasrecently extended until January 2009, pursuant to an automaticrenewal provision in the agreement. The Avaya agreement,which relates to profit-sharing on a CIT direct origination pro-gram, extends through September 2006.
Our financing and leasing assets include amounts related to the Dell, Snap-on, and Avaya joint venture programs. Theseamounts include receivables originated directly by CIT as wellas receivables purchased from joint venture entities.
Returns relating to the joint venture relationships (i.e., netincome as a percentage of average managed assets) for 2005were somewhat in excess of our consolidated returns. A signifi-cant reduction in origination volumes from any of thesealliances could have a material impact on our asset and netincome levels. For additional information regarding certain ofour joint venture activities, see Note 19 – CertainRelationships and Related Transactions.
Joint Venture Relationships (dollars in millions)
As of December 31, 2005 2004 2003����������������������������� ����������������������������� �����������������������������
Owned Financing and Leasing Assets
Dell U.S. $1,986.3 $1,980.7 $1,408.1
Dell – International 1,528.3 1,408.7 1,170.1
Snap-on 1,035.7 1,114.7 1,093.4
Avaya Inc. 563.0 620.7 828.6
Securitized Financing and Leasing Assets
Dell U.S. $2,526.1 $2,484.1 $2,471.6
Dell – International 34.2 5.1 17.0
Snap-on 55.4 64.8 68.2
Avaya Inc. 460.5 599.6 781.0

Item 7: Management’s Discussion and Analysis 35
GEOGRAPHIC COMPOSITION
The table summarizes significant state concentrationsgreater than 5.0% and foreign concentrations in excess of1.0% of our owned financing and leasing portfolio assets.International assets increased in amount from 2004, butwere lower as a percentage of owned financing and leasing
portfolio assets due to the size of the U.S. student lendingacquisition. For each period presented, our managed assetgeographic composition did not differ significantly fromour owned asset geographic composition.
Geographic Concentrations by Obligor (dollars in millions)
As of December 31, 2005 2004 2003������������������ ������������������ ������������������
State
California 9.8% 10.3% 10.2%
Texas 7.5% 7.8% 7.7%
New York 6.7% 6.8% 7.4%
All other states 54.9% 52.8% 54.0%��������������� ��������������� ���������������
Total U.S. 78.9% 77.7% 79.3%��������������� ��������������� ������������������������������ ��������������� ���������������
Country
Canada 6.1% 5.5% 5.1%
England 3.5% 3.9% 2.8%
Australia 1.1% 1.3% 1.3%
France 1.0% 1.4% 1.1%
China 1.0% 1.2% 0.9%
Germany 0.8% 1.2% 1.0%
Mexico 0.9% 1.1% 1.0%
All other countries 6.7% 6.7% 7.5%��������������� ��������������� ���������������
Total Outside U.S. 21.1% 22.3% 20.7%��������������� ��������������� ������������������������������ ��������������� ���������������

36 CIT GROUP INC 2005
INDUSTRY COMPOSITION
Our industry composition is detailed in Note 5 – Concentrations. We believe the following discussions, covering certain industries, areof interest to investors.
Aerospace
Aerospace (dollars in millions)
As of December 31, 2005 2004 2003��������������������������������������������������������������������������������� ��������������������������������������������������������������������������������� ����������������������������������������������������������������������������������������
Net Net NetInvestment Number Investment Number Investment Number���������������������������������������� ���������������������������� ���������������������������������������� ���������������������������� ���������������������������������������� ����������������������������
By Region:
Europe $2,348.4 75 $2,160.0 72 $1,991.0 65
North America 1,243.6 62 1,057.7 66 1,029.7 72
Asia Pacific 1,569.0 52 1,242.4 46 1,013.6 40
Latin America 533.7 20 611.3 25 612.7 28
Africa / Middle East 257.2 6 54.2 3 69.1 4����������������������������� ������������� ����������������������������� ������������� ����������������������������� �������������
Total $5,951.9 215 $5,125.6 212 $4,716.1 209����������������������������� ������������� ����������������������������� ������������� ����������������������������� ������������������������������������������ ������������� ����������������������������� ������������� ����������������������������� �������������
By Manufacturer:
Boeing $2,644.6 124 $2,558.8 133 $2,581.7 140
Airbus 3,269.0 84 2,536.9 70 2,114.6 57
Other 38.3 7 29.9 9 19.8 12����������������������������� ������������� ����������������������������� ������������� ����������������������������� �������������
Total $5,951.9 215 $5,125.6 212 $4,716.1 209����������������������������� ������������� ����������������������������� ������������� ����������������������������� ������������������������������������������ ������������� ����������������������������� ������������� ����������������������������� �������������
By Body Type:(1)
Narrow body $4,331.0 165 $3,894.9 168 $3,415.7 159
Intermediate 1,347.2 27 842.7 18 877.0 18
Wide Body 235.4 16 358.1 17 403.6 20
Other 38.3 7 29.9 9 19.8 12����������������������������� ������������� ����������������������������� ������������� ����������������������������� �������������
Total $5,951.9 215 $5,125.6 212 $4,716.1 209����������������������������� ������������� ����������������������������� ������������� ����������������������������� ������������������������������������������ ������������� ����������������������������� ������������� ����������������������������� �������������
By Product:
Operating lease $5,327.1 182 $4,324.6 167 $4,011.7 159
Leverage lease (other)(2) 232.1 10 336.6 12 232.5 12
Leverage lease (tax optimized)(2) 135.2 7 221.0 9 217.9 9
Capital lease 67.7 3 137.4 6 135.6 7
Loan 189.8 13 106.0 18 118.4 22����������������������������� ������������� ����������������������������� ������������� ����������������������������� �������������
Total $5,951.9 215 $5,125.6 212 $4,716.1 209����������������������������� ������������� ����������������������������� ������������� ����������������������������� ������������������������������������������ ������������� ����������������������������� ������������� ����������������������������� �������������
Other Data:
Number of accounts 93 92 84
Largest customer net investment $ 277.3 $ 286.4 $ 268.6
Weighted average age of fleet (years)(3) 6 6 6
Off-lease aircraft 10 2 5
(1) Narrow body are single-aisle design and consist primarily of Boeing 737 and 757 series and Airbus A320 series aircraft. Intermediate body are smaller twin-aisle design and consist primarily of Boeing 767 series and Airbus A330 series aircraft. Wide body are large twin-aisle design and consist primarily of Boeing747 and 777 series and McDonnell Douglas DC10 series aircraft.
(2) In general, the use of leverage increases the risk of a loss in the event of a default, with the greatest risk incurred in tax-optimization leveraged leases.(3) Based on dollar value weighted assets.

Item 7: Management’s Discussion and Analysis 37
Our commercial and regional aerospace portfolios are in theCapital Finance segment. The commercial aircraft all complywith Stage III noise regulations. The increase in the portfolio was due to new aircraft deliveries from both Airbus andBoeing.
Our top five commercial aerospace exposures totaled$1,073.5 million at December 31, 2005. All top five are to car-riers outside of the U.S. The largest exposure to a U.S. carrierat December 31, 2005 was $156.6 million.
The regional aircraft portfolio at December 31, 2005 consistedof 104 planes and a net investment of $275.3 million. The car-riers are primarily located in North America and Europe. Loansmake up approximately 63% of the portfolio, operating leasesaccount for about 32% of the portfolio, and the remainder arecapital leases. At December 31, 2004 the portfolio consisted of121 planes and a net investment of $302.6 million.
The following is a list of our exposure to aerospace carriers thathave filed for bankruptcy protection and the current status ofour aircraft at December 31, 2005:
p UAL Corp. – United Airlines leases two CIT-owned narrowbody aircraft (Boeing 757 aircraft) with a net investment of$44.3 million. We hold Senior A tranche EnhancedEquipment Trust Certificates (“EETCs”) issued by UnitedAirlines, which are debt instruments collateralized by aircraftoperated by the airline, with a fair value of $12.1 million.Further, we have an outstanding balance of $9.5 million (with a commitment of $31.2 million) relating to a debtor-in-possession facility in connection with United Airlines’ fil-ing under Chapter 11. On February 1, 2006, UAL Corp.formally exited bankruptcy, following confirmation of thecompany’s Plan of Reorganization by the United StatesBankruptcy Court.
p Delta Air Lines – On September 14, 2005, Delta Air Linesannounced that it had filed for reorganization under Chapter11 of the U.S. Bankruptcy Code. During the fourth quarterof 2005, we charged off $13.2 million. Currently we havethree loans totaling $33.9 million and one operating lease for$25.0 million secured by four Boeing aircraft. In addition,we have an outstanding balance of $10.0 million (with acommitment of $15.0 million) relating to a debtor-in-posses-sion facility.
p Northwest Airlines – On September 14, 2005, NorthwestAirlines announced that it had filed for reorganization underChapter 11 of the U.S. Bankruptcy Code. During the fourthquarter of 2005, we charged off $35.3 million. As ofDecember 31, 2005, our Northwest Airlines exposures
include $130.8 million in finance receivables on two Airbusaircraft and one operating lease for $10.0 million for a Boeingaircraft.
Our aerospace assets include both operating leases and capitalleases. Management considers current lease rentals as well asrelevant and available market information (including third-party sales for similar equipment, published appraisal data andother marketplace information) both in determining undis-counted future cash flows when testing for the existence ofimpairment and in determining estimated fair value in measur-ing impairment. We adjust the depreciation schedules of com-mercial aerospace equipment on operating leases or residualvalues underlying capital leases when projected fair value at theend of the lease term is less than the projected book value at theend of the lease term. We review aerospace assets for impair-ment annually, or more often should events or circumstanceswarrant. Aerospace equipment is defined as impaired when theexpected undiscounted cash flow over its expected remaininglife is less than its book value. We factor historical information,current economic trends and independent appraisal data intothe assumptions and analyses we use when determining theexpected undiscounted cash flow. Included among theseassumptions are the following:
p Lease terms
p Remaining life of the asset
p Lease rates
p Remarketing prospects
p Maintenance costs
Aerospace depreciation expense for the years ended December 31,2005, 2004 and 2003 totaled $248.4 million, $215.8 million(including a $14.8 million impairment charge) and$165.4 million.
At December 31, 2005, 10 commercial aircraft were off-leasedue to bankruptcy repossessions and late-year returns. Subsequent to year end, we signed one to a lease and have let-ters of intent for all the other aircraft. Generally, we write leasesfor terms between three and five years. Within the regional air-craft portfolio at December 31, 2005, there were 5 aircraft off-lease.
See Item 8. Financial Statements and Supplementary Data, Note 16 – Commitments and Contingencies for additionalinformation regarding commitments to purchase additionalaircraft and Note 5 – Concentrations for further discussion ongeographic and industry concentrations.

38 CIT GROUP INC 2005
Home Lending
Selected statistics for our managed home lending portfolio areas follows:
(dollars in millions)As of or for the years ended December 31, 2005 2004___________________ ___________________Portfolio assets $8,335.7 $5,069.8
Managed assets $9,174.5 $6,298.5
Portfolio as a % of owned total assets 15% 9%
Managed as a % of total managed assets 15% 12%
% of first mortgages 92% 92%
Average loan size $ 118.3 $ 101.0
Top state concentrations California CaliforniaFlorida Florida
Texas, Illinois Texas, OhioNew York Pennsylvania
Top state concentrations as a % of managed portfolio 42% 45%
Fixed-rate mortgage % 43% 56%
Average loan-to-value 81% 80%
Average FICO score 633 631
Delinquencies (sixty days or more) 2.89% 3.59%
Net charge-offs 0.98% 1.11%
The Specialty Finance-consumer home lending business islargely originated through a broker network. As part of origi-nating business through this core channel, we employ an activeportfolio management approach, whereby we target desiredportfolio mix / risk attributes in terms of product type, lienposition, and geographic concentrations, among other factors,resulting in sales of a portion of our originations from time totime. We supplement business with opportunistic purchases inthe secondary market when market conditions are favorablefrom a credit and price perspective.
Student Lending (Student Loan Xpress)
The Consumer Finance student lending portfolio, which ismarketed as Student Loan Xpress, totaled $5.3 billion atDecember 31, 2005, representing 9.5% of owned and 8.4% ofmanaged assets. Loan origination volumes were $2.4 billion forthe period of CIT ownership (beginning in February 2005).Student Loan Xpress has arrangements with certain financialinstitutions to sell selected loans and works jointly with thesefinancial institutions to promote these relationships.
Finance receivables by product type for our student lendingportfolio are as follows:
December 31, March 31,(dollars in millions) 2005 2005
������������������������������������������������� ����������������������������
Consolidation loans $4,668.7 $3,996.9
Other U.S. Government guaranteed loans 568.7 424.6
Private (nonguaranteed)loans and other 30.4 13.4
����������������������������� ����������������������������
Total $5,267.8 $4,434.9 ����������������������������� ��������������������������������������������������������� ����������������������������
Delinquencies (sixty days or more) were $132.7 million,2.52% of finance receivables at December 31, 2005 and$112.6 million, 2.60% at March 31, 2005.
Top 5 state concentrations (California, New York,Pennsylvania, Texas, and Ohio) represented an aggregate37.5% of the portfolio.

Item 7: Management’s Discussion and Analysis 39
Our business activities involve various elements of risk. Weconsider the principal types of risk to be credit risk (includingcredit, collateral and equipment risk) and market risk (includ-ing interest rate, foreign currency and liquidity risk). Managingrisks is essential to conducting our businesses and to our prof-itability. Accordingly, our risk management systems and proce-dures are designed to identify and analyze key business risks, toset appropriate policies and limits, and to continually monitorthese risks and limits by means of reliable administrative andinformation systems, along with other policies and programs.The position of Vice Chairman and Chief Lending Officerwithin the Office of the Chairman was established to overseerisk management across the businesses.
We review and monitor credit exposures, both owned andmanaged, on an ongoing basis to identify, as early as possible,customers that may be experiencing declining creditworthinessor financial difficulty, and periodically evaluate the perform-ance of our finance receivables across the entire organization.We monitor concentrations by borrower, industry, geographicregion and equipment type, and we set or modify exposurelimits as conditions warrant, to minimize credit concentrationsand the risk of substantial credit loss. We have maintained astandard practice of reviewing our aerospace portfolio regularlyand, in accordance with SFAS No. 13 and SFAS No. 144, wetest for asset impairment based upon projected cash flows andrelevant market data with any impairment in value charged toearnings. Given the developments in the aerospace sector post2001, performance, profitability and residual values relating toaerospace assets have been reviewed more frequently with theExecutive Credit Committee. In conjunction with our capitalallocation initiatives, we are in the process of enhancing ourcredit risk management practices, including portfolio model-ing, probability of default analysis, further development ofrisk-based pricing tools, and reserve for credit loss analysis.
Our Asset Quality Review Committee is comprised of mem-bers of senior management, including the Vice Chairman andChief Lending Officer, the Vice Chairman and Chief FinancialOfficer, the Chief Credit Officer, the Controller and theDirector of Credit Audit. Periodically, this committee meetswith senior executives of our business units and corporatecredit risk management group to review portfolio performance,including the status of individual financing and leasing assets,owned and managed, to obligors with higher risk profiles. Inaddition, this committee periodically meets with the ChiefExecutive Officer of CIT to review overall credit risk, includinggeographic, industry and customer concentrations, and thereserve for credit losses.
CREDIT RISK MANAGEMENT
We have developed systems specifically designed to managecredit risk in each of our business segments. We evaluatefinancing and leasing assets for credit and collateral risk duringthe credit granting process and periodically after the advance-ment of funds. The Corporate Credit Risk Managementgroup, which reports to the Vice Chairman and Chief LendingOfficer, oversees and manages credit risk throughout CIT. This
group includes senior credit executives in each of the businessunits. Our Executive Credit Committee includes the ChiefExecutive Officer, the Chief Lending Officer and members ofthe Corporate Credit Risk Management group. The committeeapproves transactions which are outside of established targetmarket definitions and risk acceptance criteria, corporateexceptions as delineated within the individual business unitcredit authority and transactions that exceed the strategic busi-ness units’ credit authority. The Corporate Credit RiskManagement group also includes an independent credit auditfunction.
Each of our strategic business units has developed and imple-mented a formal credit management process in accordancewith formal uniform guidelines established by the credit riskmanagement group. These guidelines set forth risk acceptancecriteria for:
p acceptable maximum credit lines;
p selected target markets and products;
p creditworthiness of borrowers, including credit history, finan-cial condition, adequacy of cash flow, financial performanceand quality of management; and
p the type and value of underlying collateral and guarantees(including recourse from dealers and manufacturers).
Compliance with established corporate policies and proce-dures, along with the credit management processes at eachstrategic business unit are reviewed by the credit audit group.The credit audit group examines adherence with establishedcredit policies and procedures and tests for inappropriate creditpractices, including whether potential problem accounts arebeing detected and reported on a timely basis.
In a limited number of instances, with the approval ofCorporate Credit Risk Management, CIT has entered intocredit default swaps. These derivative contracts are designed toeconomically hedge certain credit exposures to customers.
Commercial Credit Risk Management – The commercial creditmanagement process (other than small ticket leasing transac-tions) begins with the initial evaluation of credit risk andunderlying collateral at the time of origination and continuesover the life of the finance receivable or operating lease, includ-ing collecting past due balances and liquidating underlying col-lateral.
Credit personnel review a potential borrower’s financial condi-tion, results of operations, management, industry, customerbase, operations, collateral and other data, such as third partycredit reports, to thoroughly evaluate the customer’s borrowingand repayment ability. Borrowers are graded according tocredit quality based upon our uniform credit grading system,which considers both the borrower’s financial condition andthe underlying collateral. Credit facilities are subject toapproval within our overall credit approval and underwritingguidelines and are issued commensurate with the credit evalua-tion performed on each borrower.
RISK MANAGEMENT

40 CIT GROUP INC 2005
Consumer and Small Ticket Leasing/Lending – For consumertransactions and certain small-ticket leasing/lending transac-tions, we employ proprietary automated credit scoring modelsby loan type that include customer demographics and creditbureau characteristics. The profiles emphasize, among otherthings, occupancy status, length of residence, employment, debtto income ratio (ratio of total installment debt and housingexpenses to gross monthly income), bank account references,credit bureau information, combined loan to value ratio, lengthof time in business, industry category and geographic location.The models are used to assess a potential borrower’s credit stand-ing and repayment ability considering the value or adequacy ofproperty offered as collateral. Our credit criteria include relianceon credit scores, including those based upon both our propri-etary internal credit scoring model and external credit bureauscoring, combined with judgment. The credit scoring models areregularly reviewed for effectiveness utilizing statistical tools.
We regularly evaluate the consumer loan portfolio and thesmall ticket leasing portfolio using past due, vintage curve andother statistical tools to analyze trends and credit performanceby loan type, including analysis of specific credit characteristicsand other selected subsets of the portfolios. Adjustments tocredit scorecards and lending programs are made when deemedappropriate. Individual underwriters are assigned creditauthority based upon their experience, performance andunderstanding of the underwriting policies and procedures ofour consumer and small-ticket leasing operations. A creditapproval hierarchy also exists to ensure that an underwriterwith the appropriate level of authority reviews all applications.
EQUIPMENT/RESIDUAL RISK MANAGEMENT
We have developed systems, processes and expertise to managethe equipment and residual risk in our commercial segments.Our process consists of the following: 1) setting residual valueat transaction inception; 2) systematic residual reviews; and 3)monitoring of residual realizations. Reviews for impairment areperformed at least annually. Residual realizations, by businessunit and product, are reviewed as part of our ongoing financialand asset quality review, both within the business units and bysenior management.
MARKET RISK MANAGEMENT
Market risk is the risk of loss arising from changes in values offinancial instruments, and includes interest rate risk, foreignexchange risk, derivative counterparty credit risk and liquidityrisk. We engage in transactions in the normal course of busi-ness that expose us to market risks. We conduct what webelieve are appropriate management practices and maintainpolicies designed to effectively mitigate such risks. The objec-tives of our market risk management efforts are to preserve theeconomic and accounting returns of our assets by matching therepricing and maturity characteristics of our assets with that ofour liabilities. Strategies for managing market risks associatedwith changes in interest rates and foreign exchange rates are anintegral part of the process, because those strategies affect ourfuture expected cash flows as well as our cost of capital.
Our Capital Committee sets policies, oversees and guides theinterest rate and currency risk management process, includingthe establishment and monitoring of risk metrics, and ensuresthe implementation of those policies. Other risks monitored bythe Capital Committee include derivative counterparty creditrisk and liquidity risk. The Capital Committee meets periodi-cally and includes the Chief Executive Officer, Vice Chairmanand Chief Financial Officer, Vice Chairman and ChiefLending Officer, Vice Chairman – Specialty Finance, ViceChairman – Commercial Finance, Treasurer, and Controller,with business unit executives serving on a rotating basis.
INTEREST RATE AND FOREIGN EXCHANGE RISKMANAGEMENT
Interest Rate Risk Management – We monitor our interest ratesensitivity on a regular basis by analyzing the impact of interestrate changes upon the financial performance of the business.We also consider factors such as the strength of the economy,customer prepayment behavior and re-pricing characteristics ofour assets and liabilities.
We evaluate and monitor risk through two primary metrics:
p Margin at Risk (MAR), which measures the impact of chang-ing interest rates upon interest income over the subsequenttwelve months.
p Value at Risk (VAR), which measures the net economic valueof assets by assessing the market value of assets, liabilities andderivatives.
We regularly monitor and simulate our degree of interest ratesensitivity by measuring the characteristics of interest-sensitiveassets, liabilities, and derivatives. The Capital Committeereviews the results of this modeling periodically.
The first interest rate sensitivity modeling technique (MAR)that we employ includes the creation of prospective twelve-month baseline and rate shocked net interest income simula-tions. At the date that we model interest rate sensitivity, wederive the baseline net interest income considering the currentlevel of interest-sensitive assets, the current level of interest-sen-sitive liabilities, and the current level of derivatives. Our base-line simulation assumes that, over the next successive twelvemonths, market interest rates (as of the date of our simulation)are held constant and that no new loans or leases are extended.Once we calculate the baseline net interest income, we instan-taneously raise market interest rates, which we previously heldconstant, 100 basis points across the entire yield curve, and arate shocked simulation is run in which all interest rate sensitiveassets, liabilities and derivatives are immediately reset. We thenmeasure interest rate sensitivity as the difference between thecalculated baseline and the rate shocked net interest income.
An immediate hypothetical 100 basis point increase in theyield curve on January 1, 2006 would reduce our net incomeby an estimated $14 million after-tax over the next twelvemonths. A corresponding decrease in the yield curve would

Item 7: Management’s Discussion and Analysis 41
cause an increase in our net income of a like amount. A 100basis point increase in the yield curve on January 1, 2005would have reduced our net income by an estimated $20 mil-lion after tax, while a corresponding decrease in the yield curvewould have increased our net income by a like amount.
The second interest rate modeling technique (VAR) we employis focused on the net economic value of the firm by modelingthe current market value of assets, liabilities and derivatives, todetermine our market value baseline. Once the baseline marketvalue is calculated, we raise market interest rates 100 basispoints across the entire yield curve, and new market values areestimated. By modeling the economic value of the portfolio weare able to understand how the economic value of the balancesheet would change under specific interest rate scenarios.
An immediate hypothetical 100 basis point increase in theyield curve on January 1, 2006 would increase our economic
value by $51 million. A 100 basis point increase in the yieldcurve on January 1, 2005 would have increased our economicvalue by $37 million.
Although we believe that these measurements provide an esti-mate of our interest rate sensitivity, they do not account forpotential changes in the credit quality, size, composition, andprepayment characteristics of our balance sheet, nor do theyaccount for other business developments that could affect ournet income or for management actions that could be taken.Accordingly, we can give no assurance that actual results wouldnot differ materially from the estimated outcomes of our simu-lations. Further, such simulations do not represent our currentview of future market interest rate movements.
A comparative analysis of the weighted average principal out-standing and interest rates on our debt before and after theeffect of interest rate swaps is shown on the following table.
(dollars in millions) Before Swaps After Swaps_______________ _______________For the year ended December 31, 2005
Commercial paper and variable-rate senior notes $17,238.8 3.55% $20,640.3 3.91%
Fixed-rate senior and subordinated notes 25,947.5 5.10% 22,546.0 4.90%________ ________Composite $43,186.3 4.48% $43,186.3 4.43%________ ________________ ________
For the year ended December 31, 2004
Commercial paper and variable-rate senior notes $15,138.8 1.88% $18,337.9 2.59%
Fixed-rate senior and subordinated notes 19,755.6 5.64% 16,556.5 5.08%________ ________
Composite $34,894.4 4.01% $34,894.4 3.77%________ ________________ ________
For the year ended December 31, 2003
Commercial paper, variable-rate senior notes and bank credit facilities $12,352.1 1.83% $15,942.0 2.63%
Fixed-rate senior and subordinated notes 20,002.0 6.06% 16,412.1 5.82%________ ________Composite $32,354.1 4.45% $32,354.1 4.25%________ ________________ ________The weighted average interest rates before swaps do not neces-sarily reflect the interest expense that we would have incurredover the life of the borrowings had we managed the interestrate risk without the use of such swaps.
We offer a variety of financing products to our customers,including fixed and floating-rate loans of various maturitiesand currency denominations, and a variety of leases, includingoperating leases. Changes in market interest rates, relationshipsbetween short-term and long-term market interest rates, orrelationships between different interest rate indices (i.e., basisrisk) can affect the interest rates charged on interest-earningassets differently than the interest rates paid on interest-bearingliabilities, and can result in an increase in interest expense rela-tive to finance income. We measure our asset/liability positionin economic terms through duration measures and sensitivityanalysis, and we measure the effect on earnings using maturitygap analysis. Our asset portfolio is generally comprised of loansand leases of short to intermediate term. As such, the durationof our asset portfolio is generally less than three years. We tar-get to closely match the duration of our liability portfolio withthat of our asset portfolio. As of December 31, 2005, our lia-bility portfolio duration was slightly longer than our asset port-folio duration.
A matched asset/liability position is generally achieved througha combination of financial instruments, including commercialpaper, medium-term notes, long-term debt, interest rate andcurrency swaps, foreign exchange contracts, and through secu-ritization. We do not speculate on interest rates or foreignexchange rates, but rather seek to mitigate the possible impactof such rate fluctuations encountered in the normal course ofbusiness. This process is ongoing due to prepayments, refinanc-ings and actual payments varying from contractual terms, aswell as other portfolio dynamics.
We periodically enter into structured financings (involving theissuance of both debt and an interest rate swap with correspon-ding notional principal amount and maturity) to manage liq-uidity and reduce interest rate risk at a lower overall fundingcost than could be achieved by solely issuing debt.
As part of managing exposure to interest rate, foreign currency,and, in limited instances, credit risk, CIT, as an end-user,enters into various derivative transactions, all of which aretransacted in over-the-counter markets with other financialinstitutions acting as principal counterparties. Derivatives areutilized to eliminate or mitigate economic risk only, and our

42 CIT GROUP INC 2005
policy prohibits entering into derivative financial instrumentsfor trading or speculative purposes. To ensure both appropriateuse as a hedge and to achieve hedge accounting treatment,whenever possible, substantially all derivatives entered into aredesignated according to a hedge objective against a specific orforecasted liability or, in limited instances, assets. The notionalamounts, rates, indices, and maturities of our derivativesclosely match the related terms of the underlying hedged items.
CIT utilizes interest rate swaps to exchange variable-rate interestunderlying forecasted issuances of commercial paper, specificvariable-rate debt instruments, and, in limited instances, vari-able-rate assets for fixed-rate amounts. These interest rate swaps
are designated as cash flow hedges and changes in fair value ofthese swaps, to the extent they are effective as a hedge, arerecorded in other comprehensive income. Ineffective amountsare recorded in interest expense. Interest rate swaps are also uti-lized to convert fixed-rate interest on specific debt instrumentsto variable-rate amounts. These interest rate swaps are desig-nated as fair value hedges and changes in fair value of theseswaps are effectively recorded as an adjustment to the carryingvalue of the hedged item, as the offsetting changes in fair valueof the swaps and the hedged items are recorded in earnings.
The following table summarizes the composition of our inter-est rate sensitive assets and liabilities before and after swaps:
Before Swaps After Swaps__________________________ __________________________Fixed rate Floating rate Fixed rate Floating rate_________ ___________ _________ ___________
December 31, 2005
Assets 49% 51% 49% 51%
Liabilities 50% 50% 44% 56%
December 31, 2004
Assets 55% 45% 55% 45%
Liabilities 60% 40% 46% 54%
Total interest sensitive assets were $51.9 billion and $41.7 bil-lion at December 31, 2005 and 2004. Total interest sensitiveliabilities were $45.6 billion and $35.9 billion at December 31,2005 and 2004.
Foreign Exchange Risk Management – To the extent local foreigncurrency borrowings are not raised, CIT utilizes foreign cur-rency exchange forward contracts to hedge or mitigate currencyrisk underlying foreign currency loans to subsidiaries and thenet investments in foreign operations. These contracts are des-ignated as foreign currency cash flow hedges or net investmenthedges and changes in fair value of these contracts are recordedin other comprehensive income along with the translationgains and losses on the underlying hedged items. Translationgains and losses of the underlying foreign net investment, aswell as offsetting derivative gains and losses on designatedhedges, are reflected in other comprehensive income in theConsolidated Balance Sheet.
CIT also utilizes cross-currency swaps to hedge currency riskunderlying foreign currency debt and selected foreign currencyassets. The swaps that meet hedge accounting criteria are desig-nated as foreign currency cash flow hedges or foreign currencyfair value hedges and changes in fair value of these contracts arerecorded in other comprehensive income (for cash flowhedges), or effectively as a basis adjustment (including theimpact of the offsetting adjustment to the carrying value of thehedged item) to the hedged item (for fair value hedges) alongwith the transaction gains and losses on the underlying hedgeditems. CIT also has certain cross-currency swaps that economi-cally hedge exposures, but do not qualify for hedge accountingtreatment.
Other Market Risk Management – CIT has entered into creditdefault swaps to economically hedge certain CIT credit expo-sures. These swaps do not meet the requirements for hedge
accounting treatment and therefore are recorded at fair value,with both realized and unrealized gains or losses recorded inother revenue in the consolidated statement of income. SeeNote 9 – Derivative Financial Instruments for further discus-sion, including notional principal balances of interest rateswaps, foreign currency exchange forward contracts, cross cur-rency swaps, Treasury locks, and credit default swaps.
DERIVATIVE RISK MANAGEMENT
We enter into interest rate and currency swaps,foreign exchangeforward contracts, and in limited instances, credit default swapsand commodity swaps as part of our overall risk managementpractices. We assess and manage the external and internal risksassociated with these derivative instruments in accordance withthe overall operating goals established by our CapitalCommittee. External risk is defined as those risks outside of ourdirect control, including counterparty credit risk, liquidity risk,systemic risk, legal risk and market risk. Internal risk relates tothose operational risks within the management oversight struc-ture and includes actions taken in contravention of CIT policy.
The primary external risk of derivative instruments is counter-party credit exposure, which is defined as the ability of a coun-terparty to perform its financial obligations under a derivativecontract. We control the credit risk of our derivative agree-ments through counterparty credit approvals, pre-establishedexposure limits and monitoring procedures.
The Capital Committee, in conjunction with Corporate RiskManagement, approves each counterparty and establishesexposure limits based on credit analysis and market value. Allderivative agreements are entered into with major money cen-ter financial institutions rated investment grade by nationallyrecognized rating agencies, with the majority of our counter-

Item 7: Management’s Discussion and Analysis 43
parties rated “AA” or better. Credit exposures are measuredbased on the current market value and potential future expo-sure of outstanding derivative instruments. Exposures are cal-culated for each derivative contract and are aggregated bycounterparty to monitor credit exposure.
See Item 9A. Control and Procedures for discussion related toderivative and hedge accounting.
LIQUIDITY RISK MANAGEMENT
Liquidity risk refers to the risk of being unable to meet poten-tial cash outflows promptly and cost-effectively. Factors thatcould cause such a risk to arise might be a disruption of a secu-rities market or other source of funds. We actively manage andmitigate liquidity risk by maintaining diversified sources offunding and committed alternate sources of funding, and wemaintain and periodically review a contingency funding planto be implemented in the event of any form of market disrup-tion. Additionally, we target our debt issuance strategy toachieve a maturity pattern designed to reduce refinancing risk.The primary funding sources are commercial paper (U.S.,Canada and Australia), long-term debt (U.S. andInternational) and asset-backed securities (U.S. and Canada).Additional sources of liquidity are loan and lease paymentsfrom customers, whole-loan asset sales and loan syndications.
Outstanding commercial paper totaled $5.2 billion atDecember 31, 2005, compared with $4.2 billion at bothDecember 31, 2004 and 2003. Our targeted U.S. program sizeremains at $5.0 billion with modest programs aggregating$500 million to be maintained in Canada and Australia. Ourgoal is to maintain committed bank lines in excess of aggregateoutstanding commercial paper. We have aggregate bank facili-ties of $6.3 billion in multi-year facilities. We also maintaincommitted bank lines of credit to provide backstop support ofcommercial paper borrowings and local bank lines to supportour international operations.
We maintain registration statements with the Securities andExchange Commission (“SEC”) covering debt securities thatwe may sell in the future. At December 31, 2005, we had $0.8billion of registered, but unissued, debt securities availableunder which we may issue debt securities and other capitalmarket securities. Subsequent to year end, we filed a new shelfregistration statement that became effective. Our Board ofDirectors has approved up to $18 billion of debt fundingunder the statement for 2006. Term-debt issued during 2005totaled $13.3 billion: $7.1 billion in variable-rate medium-term notes and $6.2 billion in fixed-rate notes. Consistent withour strategy of managing debt refinancing risk, the weightedaverage maturity of term-debt issued in 2005 was approxi-mately five years. Included with the fixed rate notes areissuances under a retail note program in which we offer fixed-rate senior, unsecured notes utilizing numerous broker-dealersfor placement to retail accounts. During the year, we issued$0.4 billion under this program having maturities of between 2and 10 years. As part of our strategy to further diversify ourfunding sources, $1.4 billion of foreign currency denominateddebt was issued during 2005. We plan on continuing to utilizediversified sources of debt funding to meet our strategic globalgrowth initiatives.
To further strengthen our funding capabilities, we maintaincommitted asset backed facilities and shelf registration state-ments, which cover a range of assets from equipment to con-sumer home lending receivables and trade accounts receivable.While these are predominately in the U.S., we also maintainfacilities for Canadian domiciled assets. As of December 31,2005, we had approximately $4.8 billion of availability in ourcommitted asset-backed facilities and $5.0 billion of registered,but unissued, securities available under public shelf registrationstatements relating to our asset-backed securitization program.
We also target and monitor certain liquidity metrics to ensureboth a balanced liability profile and adequate alternate liquid-ity availability as outlined in the following table:
Current December 31, December 31, December 31,Liquidity Measurement Target 2005 2004 2003___________________ ____________ ____________ ____________ ____________Commercial paper to total debt Maximum of 15% 11% 11% 13%
Short-term debt to total debt Maximum of 35% 29% 31% 36%
Bank lines to commercial paper Minimum of 100% 131% 150% 149%
Aggregate alternative liquidity to short-term debt Minimum of 100% 110% 108% 93%
Our credit ratings are an important factor in meeting our earn-ings and margin targets as better ratings generally correlate tolower cost of funds (see Net Finance Margin, interest expense
discussion). The following credit ratings have been in placesince September 30, 2002:
Short-Term Long-Term Outlook__________ _________ _______Moody’s P-1 A2 Stable
Standard & Poor’s A-1 A Stable
Fitch F1 A Stable
DBRS R-1L A Stable
The credit ratings stated above are not a recommendation to buy, sell or hold securities and may be subject to revision or with-drawal by the assigning rating organization. Each rating should be evaluated independently of any other rating.

44 CIT GROUP INC 2005
We have certain covenants contained in our legal documentsthat govern our funding structures. The most significantcovenant in CIT’s indentures and credit agreements is a nega-tive pledge provision, which limits granting or permitting lienson our assets, but provides for exceptions for certain ordinarycourse liens needed to operate our business. In addition, our
credit agreements also contain a minimum net worth require-ment of $4.0 billion.
The following tables summarize significant contractual obliga-tions and projected cash receipts, and contractual commit-ments at December 31, 2005 :
___________________________________________________________________________________________________________Payments and Collections by Year (dollars in millions)(3)___________________________________________________________________________________________________________
Total 2006 2007 2008 2009 2010+_______ _______ _______ _______ _______ _______Commercial paper $ 5,225.0 $ 5,225.0 $ – $ – $ – $ –
Variable-rate senior unsecured notes 15,485.1 6,154.7 5,318.6 2,053.7 751.1 1,207.0
Fixed-rate senior unsecured notes 22,853.6 3,017.3 3,994.0 2,574.8 1,400.1 11,867.4
Non-recourse, secured borrowings 4,048.8 504.3 – – – 3,544.5
Preferred capital security 252.0 – – – – 252.0
Lease rental expense 340.3 48.5 43.7 37.3 22.3 188.5________ ________ ________ _______ _______ ________Total contractual obligations 48,204.8 14,949.8 9,356.3 4,665.8 2,173.5 17,059.4________ ________ ________ _______ _______ ________
Finance receivables(1) 44,294.5 12,438.0 4,482.0 3,872.0 2,556.2 20,946.3
Operating lease rental income 4,074.8 1,164.0 1,017.6 713.5 482.3 697.4
Finance receivables held for sale(2) 1,620.3 1,620.3 – – – –
Cash – current balance 3,658.6 3,658.6 – – – –
Retained interest in securitizations and other investments 1,152.7 603.2 254.4 129.5 52.2 113.4________ ________ ________ _______ _______ ________Total projected cash receipts 54,800.9 19,484.1 5,754.0 4,715.0 3,090.7 21,757.1________ ________ ________ _______ _______ ________
Net projected cash inflow (outflow) $ 6,596.1 $ 4,534.3 $(3,602.3) $ 49.2 $ 917.2 $ 4,697.7________ ________ ________ _______ _______ ________________ ________ ________ _______ _______ ________
(1) Based upon contractual cash flows; amount could differ due to prepayments, extensions of credit, charge-offs and other factors.
(2) Based upon management’s intent to sell rather than contractual maturities of underlying assets.
(3) Projected proceeds from the sale of operating lease equipment, interest revenue from finance receivables, debt interest expense and other items are excluded.Obligations relating to postretirement programs are also excluded.
___________________________________________________________________________________________________________Commitment Expiration by Year (dollars in millions)___________________________________________________________________________________________________________
Total 2006 2007 2008 2009 2010+_______ _______ _______ _______ _______ _______Credit extensions $ 10,432.0 $ 1,907.8 $ 1,148.1 $ 1,187.0 $ 1,125.3 $ 5,063.8
Aircraft purchases 3,316.5 923.8 1,001.6 830.6 – 560.5
Letters of credit 1,047.6 927.7 26.3 39.1 24.7 29.8
Sale-leaseback payments 590.7 41.2 41.2 41.2 41.2 425.9
Manufacturer purchase commitments 696.2 668.1 28.1 – – –
Guarantees 206.5 194.6 – 10.5 1.4 –
Acceptances 20.1 20.1 – – – – ________ _______ _______ _______ _______ _______Total contractual commitments $ 16,309.6 $ 4,683.3 $ 2,245.3 $ 2,108.4 $ 1,192.6 $ 6,080.0________ _______ _______ _______ _______ _______________ _______ _______ _______ _______ _______

Item 7: Management’s Discussion and Analysis 45
INTERNAL CONTROLS
The Internal Controls Committee is responsible for monitor-ing and improving internal controls and overseeing the internalcontrols attestation mandated by Section 404 of the Sarbanes-Oxley Act of 2002 (“SARBOX”). The committee, which ischaired by the Controller, includes the CFO, the Director ofInternal Audit and other senior executives in finance, legal, riskmanagement and information technology.
See Item 9A. Controls and Procedures for Management’s Reporton Internal Control over Financial Reporting.
OFF-BALANCE SHEET ARRANGEMENTS
Securitization Program
We fund asset originations on our balance sheet by accessingvarious sectors of the capital markets, including the term debtand commercial paper markets. In an effort to broaden fundingsources and provide an additional source of liquidity, we use anarray of securitization programs, including both asset-backedcommercial paper and term structures, to access both the publicand private asset-backed securitization markets. Current prod-ucts in these programs include receivables and leases secured byequipment as well as consumer loans secured by residential realestate. The following table summarizes data relating to our secu-ritization programs.
___________________________________________________________________________________________________________Securitized Assets (dollars in millions)___________________________________________________________________________________________________________At or for the Years Ended December 31, 2005 2004 2003_____ _____ _____Securitized Assets:
Specialty Finance – Commercial $3,921.6 $4,165.5 $4,557.9
Specialty Finance – Consumer (home lending) 838.8 1,228.7 1,867.6
Equipment Finance 2,484.1 2,915.5 3,226.2
Corporate Finance 41.2 – –_______ _______ _______
Total securitized assets $7,285.7 $8,309.7 $9,651.7_______ _______ ______________ _______ _______
Securitized assets as a % of managed assets 11.6% 15.5% 19.4%
Volume Securitized:
Specialty Finance – Commercial $3,230.9 $3,153.8 $3,416.2
Specialty Finance – Consumer (home lending) – – 489.2
Equipment Finance 1,089.6 1,280.7 1,414.8 _______ _______ _______
Total volume securitized $4,320.5 $4,434.5 $5,320.2_______ _______ ______________ _______ _______
Under our typical asset-backed securitization, we sell a “pool”of secured loans or leases to a special-purpose entity (“SPE”),typically a trust. SPEs are used to achieve “true sale” require-ments for these transactions in accordance with SFAS No. 140,“Accounting for Transfers and Servicing of Financial Assets andExtinguishment of Liabilities.” The special-purpose entity, inturn, issues certificates and/or notes that are collateralized bythe pool and entitle the holders thereof to participate in certainpool cash flows.
Accordingly, CIT has no legal obligations to repay the securitiesin the event of a default by the SPE. CIT retains the servicingrights of the securitized contracts, for which we earn a servicingfee. We also participate in certain “residual” cash flows (cashflows after payment of principal and interest to certificateand/or note holders, servicing fees and other credit-related dis-bursements). At the date of securitization, we estimate the“residual” cash flows to be received over the life of the securiti-zation, record the present value of these cash flows as a retainedinterest in the securitization (retained interests can includebonds issued by the special-purpose entity, cash reserve
accounts on deposit in the special-purpose entity or interestonly receivables) and typically recognize a gain. Assets securi-tized are shown in our managed assets and our capitalizationratios on a managed basis.
In estimating residual cash flows and the value of the retainedinterests, we make a variety of financial assumptions, includingpool credit losses, prepayment speeds and discount rates. Theseassumptions are supported by both our historical experienceand anticipated trends relative to the particular products secu-ritized. Subsequent to recording the retained interests, wereview them quarterly for impairment based on estimated fairvalue. These reviews are performed on a disaggregated basis.Fair values of retained interests are estimated utilizing currentpool demographics, actual note/certificate outstandings, cur-rent and anticipated credit losses, prepayment speeds anddiscount rates.
Our retained interests had a carrying value at December 31,2005 of $1,136.4 million. Retained interests are subject tocredit and prepayment risk. As of December 31, 2005,approximately 50% of our outstanding securitization pool bal-
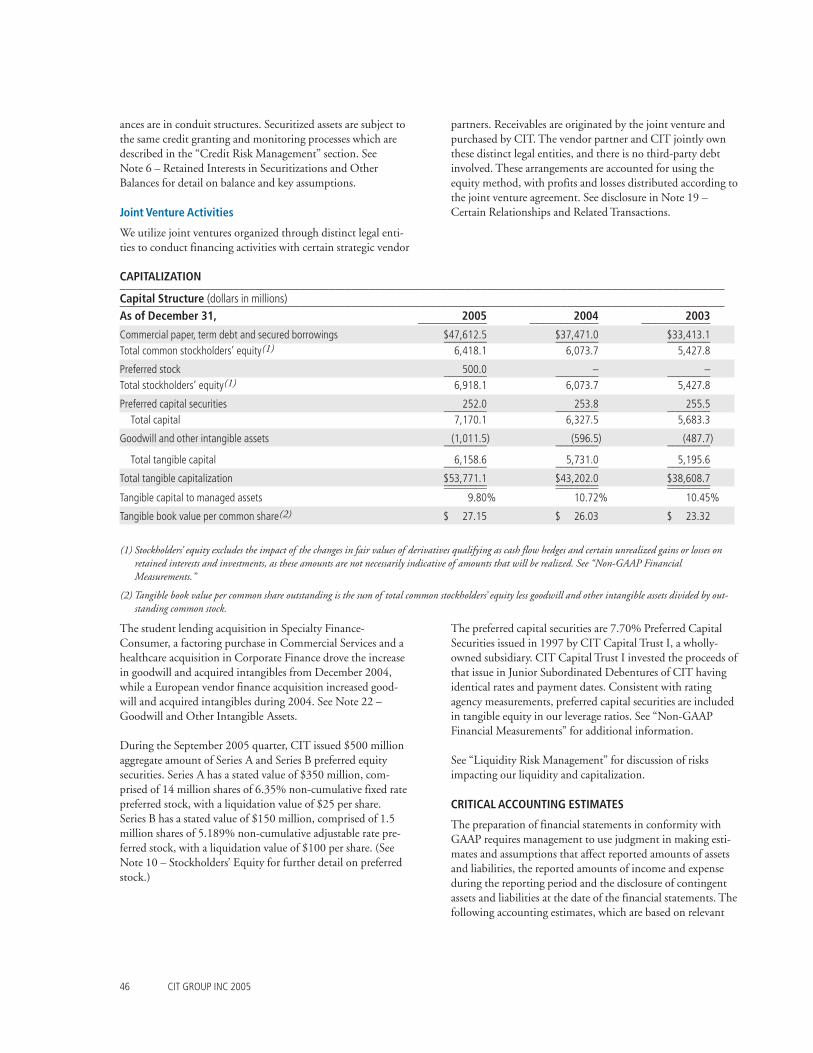
46 CIT GROUP INC 2005
ances are in conduit structures. Securitized assets are subject tothe same credit granting and monitoring processes which aredescribed in the “Credit Risk Management” section. SeeNote 6 – Retained Interests in Securitizations and OtherBalances for detail on balance and key assumptions.
Joint Venture Activities
We utilize joint ventures organized through distinct legal enti-ties to conduct financing activities with certain strategic vendor
partners. Receivables are originated by the joint venture andpurchased by CIT. The vendor partner and CIT jointly ownthese distinct legal entities, and there is no third-party debtinvolved. These arrangements are accounted for using theequity method, with profits and losses distributed according tothe joint venture agreement. See disclosure in Note 19 –Certain Relationships and Related Transactions.
CAPITALIZATION___________________________________________________________________________________________________________Capital Structure (dollars in millions)___________________________________________________________________________________________________________As of December 31, 2005 2004 2003_______________________ _______________________ _______________________Commercial paper, term debt and secured borrowings $47,612.5 $37,471.0 $33,413.1________ ________ ________Total common stockholders’ equity(1) 6,418.1 6,073.7 5,427.8
Preferred stock 500.0 – –________ ________ ________Total stockholders’ equity(1) 6,918.1 6,073.7 5,427.8
Preferred capital securities 252.0 253.8 255.5________ ________ ________Total capital 7,170.1 6,327.5 5,683.3
Goodwill and other intangible assets (1,011.5) (596.5) (487.7)________ ________ ________
Total tangible capital 6,158.6 5,731.0 5,195.6________ ________ ________Total tangible capitalization $53,771.1 $43,202.0 $38,608.7________ ________ ________________ ________ ________Tangible capital to managed assets 9.80% 10.72% 10.45%
Tangible book value per common share(2) $ 27.15 $ 26.03 $ 23.32
(1) Stockholders’ equity excludes the impact of the changes in fair values of derivatives qualifying as cash flow hedges and certain unrealized gains or losses onretained interests and investments, as these amounts are not necessarily indicative of amounts that will be realized. See “Non-GAAP FinancialMeasurements.”
(2) Tangible book value per common share outstanding is the sum of total common stockholders’ equity less goodwill and other intangible assets divided by out-standing common stock.
The student lending acquisition in Specialty Finance-Consumer, a factoring purchase in Commercial Services and ahealthcare acquisition in Corporate Finance drove the increasein goodwill and acquired intangibles from December 2004,while a European vendor finance acquisition increased good-will and acquired intangibles during 2004. See Note 22 – Goodwill and Other Intangible Assets.
During the September 2005 quarter, CIT issued $500 millionaggregate amount of Series A and Series B preferred equitysecurities. Series A has a stated value of $350 million, com-prised of 14 million shares of 6.35% non-cumulative fixed ratepreferred stock, with a liquidation value of $25 per share.Series B has a stated value of $150 million, comprised of 1.5million shares of 5.189% non-cumulative adjustable rate pre-ferred stock, with a liquidation value of $100 per share. (SeeNote 10 – Stockholders’ Equity for further detail on preferredstock.)
The preferred capital securities are 7.70% Preferred CapitalSecurities issued in 1997 by CIT Capital Trust I, a wholly-owned subsidiary. CIT Capital Trust I invested the proceeds ofthat issue in Junior Subordinated Debentures of CIT havingidentical rates and payment dates. Consistent with ratingagency measurements, preferred capital securities are includedin tangible equity in our leverage ratios. See “Non-GAAPFinancial Measurements” for additional information.
See “Liquidity Risk Management” for discussion of risksimpacting our liquidity and capitalization.
CRITICAL ACCOUNTING ESTIMATES
The preparation of financial statements in conformity withGAAP requires management to use judgment in making esti-mates and assumptions that affect reported amounts of assetsand liabilities, the reported amounts of income and expenseduring the reporting period and the disclosure of contingentassets and liabilities at the date of the financial statements. Thefollowing accounting estimates, which are based on relevant

Item 7: Management’s Discussion and Analysis 47
information available at the end of each period, include inher-ent risks and uncertainties related to judgments and assump-tions made by management. We consider the followingaccounting estimates to be critical in applying our accountingpolicies due to the existence of uncertainty at the time the esti-mate is made, the likelihood of changes in estimates fromperiod to period and the potential impact that these estimatescan have on the financial statements.
Charge-off of Finance Receivables – Finance receivables arereviewed periodically to determine the probability of loss.Charge-offs are taken after substantial collection efforts areconducted, considering such factors as the borrower’s financialcondition and the value of underlying collateral and guarantees(including recourse to dealers and manufacturers). Net charge-offs for the year ended December 31, 2005 were $251.1 mil-lion.
Impaired Loans – Loan impairment is measured as any shortfallbetween the estimated value and the recorded investment forthose loans defined as impaired loans in the application ofSFAS 114. The estimated value is determined using the fairvalue of the collateral or other cash flows, if the loan is collat-eral dependent, or the present value of expected future cashflows discounted at the loan’s effective interest rate. The deter-mination of impairment involves management’s judgment andthe use of market and third party estimates regarding collateralvalues. Valuations in the level of impaired loans and correspon-ding impairment as defined under SFAS 114 affect the level ofthe reserve for credit losses. At December 31, 2005, the reservefor credit losses includes a $76.5 million impairment valuationcomponent. A 10% fluctuation in this valuation equates to$0.02 in diluted earnings per share.
Reserve for Credit Losses – The reserve for credit losses isintended to provide for losses inherent in the portfolio, whichrequires the application of estimates and significant judgmentas to the ultimate outcome of collection efforts and realizationof collateral values, among other things. Therefore, changes ineconomic conditions or credit metrics, including past due andnon-performing accounts, or other events affecting specificobligors or industries may necessitate additions or reductionsto the reserve for credit losses.
The reserve for credit losses is reviewed for adequacy based onportfolio collateral values and credit quality indicators, includ-ing charge-off experience, levels of past due loans and non-per-forming assets, evaluation of portfolio diversification andconcentration as well as economic conditions. We reviewfinance receivables periodically to determine the probability ofloss, and record charge-offs after considering such factors asdelinquencies, the financial condition of obligors, the value ofunderlying collateral, as well as third party credit enhance-ments such as guarantees and recourse from manufacturers.This information is reviewed formally on a quarterly basis withsenior management, including the CEO, CFO, Chief Lending
Officer and Controller, among others, in conjunction with set-ting the reserve for credit losses.
The reserve for credit losses is determined based on three keycomponents: (1) specific reserves for collateral dependent loanswhich are impaired, based upon the value of underlying collat-eral or projected cash flows (2) reserves for estimated lossesinherent in the portfolio based upon historical and projectedcredit trends and (3) reserves for economic environment andother factors. Historical loss rates are based on one to three-year averages, which are consistent with our portfolio life andprovides what we believe to be appropriate weighting to cur-rent loss rates. The process involves the use of estimates and ahigh degree of management judgment. As of December 31,2005, the reserve for credit losses was $621.7 million or 1.40%of finance receivables. A hypothetical 5% change to the his-toric loss rates utilized in our reserve determination atDecember 31, 2005 equates to the variance of $22.3 million,or 5 basis points (0.05%) in the percentage of reserves tofinance receivables, and $0.07 in diluted earnings per share.
Retained Interests in Securitizations – Significant financialassumptions, including loan pool credit losses, prepaymentspeeds and discount rates, are utilized to determine the fair val-ues of retained interests, both at the date of the securitizationand in the subsequent quarterly valuations of retained interests.These assumptions reflect both the historical experience andanticipated trends relative to the products securitized. Anyresulting losses, representing the excess of carrying value overestimated fair value, are recorded in current earnings. However,unrealized gains are reflected in stockholders’ equity as part ofother comprehensive income. See Note 6 – Retained Interestsin Securitizations and Other Investments for additional infor-mation regarding securitization retained interests and relatedsensitivity analysis.
Lease Residual Values – Operating lease equipment is carried atcost less accumulated depreciation and is depreciated to esti-mated residual value using the straight-line method over thelease term or projected economic life of the asset. Directfinancing leases are recorded at the aggregated future minimumlease payments plus estimated residual values less unearnedfinance income. We generally bear greater risk in operatinglease transactions (versus finance lease transactions) as theduration of an operating lease is shorter relative to the equip-ment useful life than a finance lease. Management performsperiodic reviews of the estimated residual values, with non-temporary impairment recognized in the current period as anincrease to depreciation expense for operating lease residualimpairment, or as an adjustment to yield for residual valueadjustments on finance leases. Data regarding equipment val-ues, including appraisals, and our historical residual realizationexperience are among the factors considered in evaluating esti-mated residual values. As of December 31, 2005, our directfinancing lease residual balance was $2.1 billion and our oper-ating lease equipment balance was $9.6 billion. A hypothetical

48 CIT GROUP INC 2005
10 basis points (0.1%) fluctuation in the total of theseamounts equates to $0.03 in diluted earnings per share.
Goodwill and Intangible Assets – CIT adopted SFAS No. 142,“Goodwill and Other Intangible Assets,” effective October 1,2001. The Company determined at October 1, 2001 that therewas no impact of adopting this new standard under the transi-tion provisions of SFAS No. 142. Since adoption, goodwill isno longer amortized, but instead is assessed for impairment atleast annually. During this assessment, management relies on anumber of factors, including operating results, business plans,economic projections, anticipated future cash flows, and mar-ket place data. See “Note 22 – Goodwill and Intangible Assets”for additional information.
Intangible assets consist primarily of customer relationshipsacquired with acquisitions, with amortization lives up to 20years, and computer software and related transaction processes,which are being amortized over a 5-year life. An evaluation ofthe remaining useful lives and the amortization methodologyof the intangible assets is performed periodically to determineif any change is warranted. Goodwill and Intangibles Assetswas $1,011.5 million at December 31, 2005. A hypothetical5% fluctuation in the value equates to $0.24 in diluted earn-ings per share.
Income Tax Reserves and Deferred Income Taxes –We have opentax years in the U.S. and Canada and other jurisdictions thatare currently under examination by the applicable taxingauthorities, and certain later tax years that may in the future besubject to examination. We periodically evaluate the adequacyof our related tax reserves, taking into account our open taxreturn positions, tax assessments received, tax law changes andthird party indemnifications. The process of evaluating taxreserves involves the use of estimates and a high degree of man-agement judgment. The final determination of tax audits couldaffect our tax reserves.
Deferred tax assets and liabilities are recognized for the futuretax consequences of transactions that have been reflected in theConsolidated Financial Statements. Our ability to realizedeferred tax assets is dependent on prospectively generatingtaxable income by corresponding tax jurisdiction, and in somecases on the timing and amount of specific types of futuretransactions. Management’s judgment, regarding uncertainties
and the use of estimates and projections, is required in assess-ing our ability to realize net operating loss (“NOL’s”) and othertax benefit carry-forwards, as these assets expire at various datesbeginning in 2006, and they may be subject to annual use limi-tations under the Internal Revenue Code and other limitationsunder certain state laws. Management utilizes historical andprojected data, budgets and business plans in making theseestimates and assessments. Deferred tax assets relating to NOL’swere $428 million at December 31, 2005. A hypothetical 1%fluctuation in the value of deferred tax assets relating to NOL’sequates to $0.02 in diluted earnings per share.
See Item 9A. Controls and Procedures for discussion regardinginternal controls related to income tax accounting andreporting.
NON-GAAP FINANCIAL MEASUREMENTS
The SEC adopted regulations that apply to any public disclo-sure or release of material information that includes a non-GAAP financial measure. The accompanying Management’sDiscussion and Analysis of Financial Condition and Results ofOperations and Quantitative and Qualitative Disclosure aboutMarket Risk contain certain non-GAAP financial measures.The SEC defines a non-GAAP financial measure as a numeri-cal measure of a company’s historical or future financial per-formance, financial position, or cash flows that excludesamounts, or is subject to adjustments that have the effect ofexcluding amounts, that are included in the most directly com-parable measure calculated and presented in accordance withGAAP in the financial statements or includes amounts, or issubject to adjustments that have the effect of includingamounts, that are excluded from the most directly comparablemeasure so calculated and presented.
Non-GAAP financial measures disclosed in this report aremeant to provide additional information and insight regardingthe historical operating results and financial position of thebusiness and in certain cases to provide financial informationthat is presented to rating agencies and other users of financialinformation. These measures are not in accordance with, or asubstitute for, GAAP and may be different from or inconsistentwith non-GAAP financial measures used by other companies.
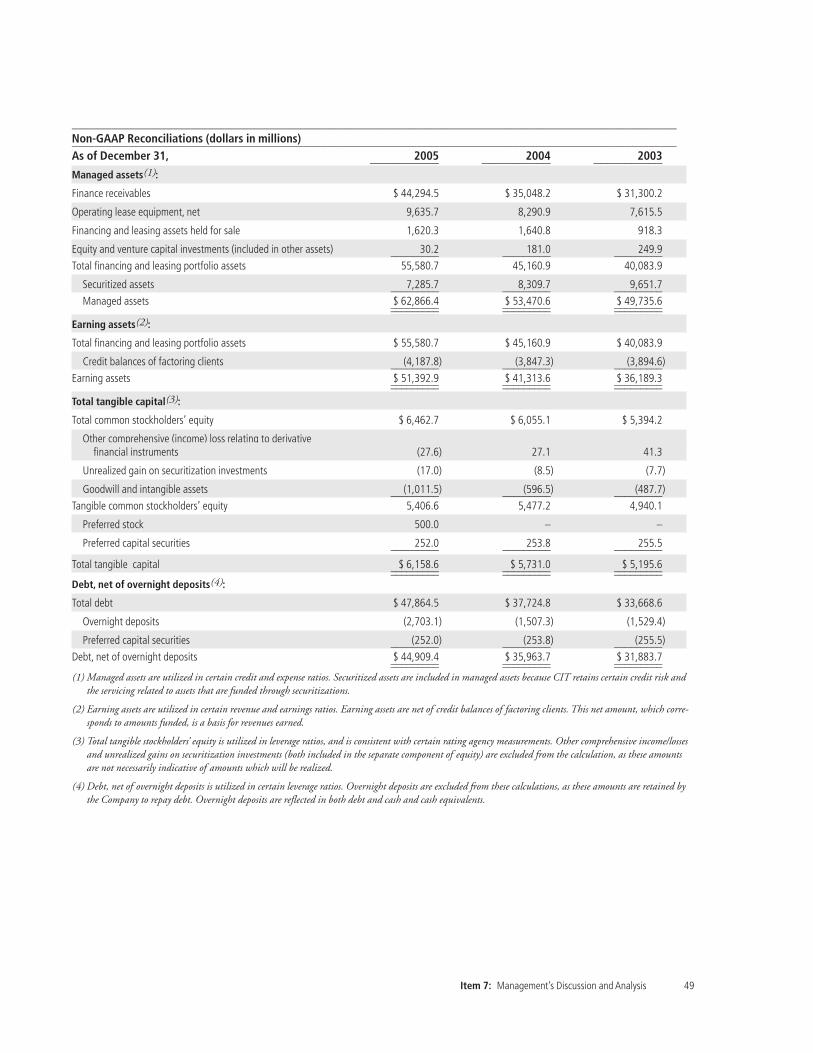
Item 7: Management’s Discussion and Analysis 49
___________________________________________________________________________________________________________Non-GAAP Reconciliations (dollars in millions)___________________________________________________________________________________________________________As of December 31, 2005 2004 2003_______________________ _______________________ _______________________Managed assets(1):
Finance receivables $ 44,294.5 $ 35,048.2 $ 31,300.2
Operating lease equipment, net 9,635.7 8,290.9 7,615.5
Financing and leasing assets held for sale 1,620.3 1,640.8 918.3
Equity and venture capital investments (included in other assets) 30.2 181.0 249.9_________ _________ _________Total financing and leasing portfolio assets 55,580.7 45,160.9 40,083.9
Securitized assets 7,285.7 8,309.7 9,651.7_________ _________ _________Managed assets $ 62,866.4 $ 53,470.6 $ 49,735.6_________ _________ __________________ _________ __________________ _________ _________
Earning assets(2):
Total financing and leasing portfolio assets $ 55,580.7 $ 45,160.9 $ 40,083.9
Credit balances of factoring clients (4,187.8) (3,847.3) (3,894.6)_________ _________ _________Earning assets $ 51,392.9 $ 41,313.6 $ 36,189.3_________ _________ __________________ _________ __________________ _________ _________Total tangible capital(3):
Total common stockholders’ equity $ 6,462.7 $ 6,055.1 $ 5,394.2
Other comprehensive (income) loss relating to derivative financial instruments (27.6) 27.1 41.3
Unrealized gain on securitization investments (17.0) (8.5) (7.7)
Goodwill and intangible assets (1,011.5) (596.5) (487.7)_________ _________ _________Tangible common stockholders’ equity 5,406.6 5,477.2 4,940.1
Preferred stock 500.0 – –
Preferred capital securities 252.0 253.8 255.5_________ _________ _________
Total tangible capital $ 6,158.6 $ 5,731.0 $ 5,195.6_________ _________ __________________ _________ _________Debt, net of overnight deposits(4):
Total debt $ 47,864.5 $ 37,724.8 $ 33,668.6
Overnight deposits (2,703.1) (1,507.3) (1,529.4)
Preferred capital securities (252.0) (253.8) (255.5)_________ _________ _________Debt, net of overnight deposits $ 44,909.4 $ 35,963.7 $ 31,883.7_________ _________ __________________ _________ _________(1) Managed assets are utilized in certain credit and expense ratios. Securitized assets are included in managed assets because CIT retains certain credit risk and
the servicing related to assets that are funded through securitizations.
(2) Earning assets are utilized in certain revenue and earnings ratios. Earning assets are net of credit balances of factoring clients. This net amount, which corre-sponds to amounts funded, is a basis for revenues earned.
(3) Total tangible stockholders’ equity is utilized in leverage ratios, and is consistent with certain rating agency measurements. Other comprehensive income/lossesand unrealized gains on securitization investments (both included in the separate component of equity) are excluded from the calculation, as these amountsare not necessarily indicative of amounts which will be realized.
(4) Debt, net of overnight deposits is utilized in certain leverage ratios. Overnight deposits are excluded from these calculations, as these amounts are retained bythe Company to repay debt. Overnight deposits are reflected in both debt and cash and cash equivalents.

50 CIT GROUP INC 2005
FORWARD-LOOKING STATEMENTS
Certain statements contained in this document are “forward-looking statements” within the meaning of the U.S. PrivateSecurities Litigation Reform Act of 1995. All statements con-tained herein that are not clearly historical in nature are for-ward-looking and the words “anticipate,” “believe,” “expect,”“estimate,” “target” and similar expressions are generallyintended to identify forward-looking statements. Any forward-looking statements contained herein, in press releases, writtenstatements or other documents filed with the Securities andExchange Commission or in communications and discussionswith investors and analysts in the normal course of businessthrough meetings, webcasts, phone calls and conference calls,concerning our operations, economic performance and finan-cial condition are subject to known and unknown risks, uncer-tainties and contingencies. Forward-looking statements areincluded, for example, in the discussions about:
p our liquidity risk management,
p our credit risk management,
p our asset/liability risk management,
p our funding, borrowing costs and net finance margin,
p our capital, leverage and credit ratings,
p our operational and legal risks,
p our growth rates,
p our commitments to extend credit or purchase equipment,and
p how we may be affected by legal proceedings.
All forward-looking statements involve risks and uncertainties,many of which are beyond our control, which may cause actualresults, performance or achievements to differ materially fromanticipated results, performance or achievements. Also, for-ward-looking statements are based upon management’s esti-mates of fair values and of future costs, using currentlyavailable information. Therefore, actual results may differmaterially from those expressed or implied in those statements.Factors that could cause such differences include, but are notlimited to:
p risks of economic slowdown, downturn or recession,
p industry cycles and trends,
p demographic trends,
p risks inherent in changes in market interest rates and qualityspreads,
p funding opportunities and borrowing costs,
p changes in funding markets, including commercial paper,term debt and the asset-backed securitization markets,
p uncertainties associated with risk management, includingcredit, prepayment, asset/liability, interest rate and currencyrisks,
p adequacy of reserves for credit losses, including amountsrelated to hurricane losses,
p risks associated with the value and recoverability of leasedequipment and lease residual values,
p changes in laws or regulations governing our business andoperations,
p changes in competitive factors, and
p future acquisitions and dispositions of businesses or assetportfolios.

Item 8: Financial Statements and Supplementary Data 51
To the Board of Directors and Stockholders ofCIT Group Inc.:
We have completed integrated audits of CIT Group Inc.’s2005 and 2004 consolidated financial statements and of itsinternal control over financial reporting as of December 31,2005, and an audit of its 2003 consolidated financial state-ments in accordance with the standards of the Public CompanyAccounting Oversight Board (United States). Our opinions,based on our audits, are presented below.
CONSOLIDATED FINANCIAL STATEMENTS
In our opinion, the consolidated financial statements listed inthe index appearing under Item 15(a)(1) present fairly, in allmaterial respects, the financial position of CIT Group Inc.and its subsidiaries at December 31, 2005 and 2004, and theresults of their operations and their cash flows for each of thethree years in the period ended December 31, 2005 in con-formity with accounting principles generally accepted in theUnited States of America. These financial statements are theresponsibility of the Company’s management. Our responsi-bility is to express an opinion on these financial statementsbased on our audits. We conducted our audits of these state-ments in accordance with the standards of the PublicCompany Accounting Oversight Board (United States).Those standards require that we plan and perform the auditto obtain reasonable assurance about whether the financialstatements are free of material misstatement. An audit offinancial statements includes examining, on a test basis,evidence supporting the amounts and disclosures in thefinancial statements, assessing the accounting principlesused and significant estimates made by management, andevaluating the overall financial statement presentation.We believe that our audits provide a reasonable basis for ouropinion.
INTERNAL CONTROL OVER FINANCIAL REPORTING
Also, in our opinion, management’s assessment, included inManagement’s Report on Internal Control Over Financial
Reporting appearing under Item 9A, that CIT Group Inc.maintained effective internal control over financial reportingas of December 31, 2005 based on criteria established inInternal Control - Integrated Framework issued by theCommittee of Sponsoring Organizations of the TreadwayCommission (COSO), is fairly stated, in all material respects,based on those criteria. Furthermore, in our opinion, theCompany maintained, in all material respects, effective inter-nal control over financial reporting as of December 31, 2005,based on criteria established in Internal Control – IntegratedFramework issued by the COSO. The Company’s manage-ment is responsible for maintaining effective internal controlover financial reporting and for its assessment of the effective-ness of internal control over financial reporting. Our respon-sibility is to express opinions on management’s assessmentand on the effectiveness of the Company’s internal controlover financial reporting based on our audit. We conductedour audit of internal control over financial reporting inaccordance with the standards of the Public CompanyAccounting Oversight Board (United States). Thosestandards require that we plan and perform the audit toobtain reasonable assurance about whether effective internalcontrol over financial reporting was maintained in allmaterial respects. An audit of internal control over financialreporting includes obtaining an understanding of internalcontrol over financial reporting, evaluating management’sassessment, testing and evaluating the design and operatingeffectiveness of internal control, and performing such otherprocedures as we consider necessary in the circumstances.We believe that our audit provides a reasonable basis for ouropinions.
A company’s internal control over financial reporting is aprocess designed to provide reasonable assurance regardingthe reliability of financial reporting and the preparation offinancial statements for external purposes in accordancewith generally accepted accounting principles. A company’sinternal control over financial reporting includes thosepolicies and procedures that (i) pertain to the maintenance of
ITEM 8. Financial Statements and Supplementary Data
REPORT OF INDEPENDENT REGISTERED PUBLIC ACCOUNTING FIRM
52 CIT GROUP INC 2005
records that, in reasonable detail, accurately and fairly reflectthe transactions and dispositions of the assets of the company;(ii) provide reasonable assurance that transactions are recordedas necessary to permit preparation of financial statements inaccordance with generally accepted accounting principles, andthat receipts and expenditures of the company are being madeonly in accordance with authorizations of management anddirectors of the company; and (iii) provide reasonable assur-ance regarding prevention or timely detection of unauthorizedacquisition, use, or disposition of the company’s assets thatcould have a material effect on the financial statements.
Because of its inherent limitations, internal control over finan-cial reporting may not prevent or detect misstatements. Also,projections of any evaluation of effectiveness to future periodsare subject to the risk that controls may become inadequatebecause of changes in conditions, or that the degree of compli-ance with the policies or procedures may deteriorate.
PricewaterhouseCoopers LLPNew York, New YorkMarch 2, 2006

Item 8: Financial Statements and Supplementary Data 53
CIT GROUP INC. AND SUBSIDIARIES
CONSOLIDATED BALANCE SHEETS – Assets (dollars in millions – except share data)
December 31, 2005 2004_______________ _______________Financing and leasing assets:
Finance receivables $39,243.5 $35,048.2
Student lending receivables pledged 5,051.0 –
Reserve for credit losses (621.7) (617.2)________________ ________________Net finance receivables 43,672.8 34,431.0
Operating lease equipment, net 9,635.7 8,290.9
Financing and leasing assets held for sale 1,620.3 1,640.8
Cash and cash equivalents, including $311.1 and $0.0 restricted 3,658.6 2,210.2
Retained interest in securitizations and other investments 1,152.7 1,228.2
Goodwill and intangible assets, net 1,011.5 596.5
Other assets 2,635.0 2,713.7________________ ________________Total Assets $63,386.6 $51,111.3________________ ________________________________ ________________
CONSOLIDATED BALANCE SHEETS – Liabilities and Stockholders’ Equity
Debt:
Commercial paper $ 5,225.0 $ 4,210.9
Variable-rate senior unsecured notes 15,485.1 11,545.0
Fixed-rate senior unsecured notes 22,853.6 21,715.1
Non-recourse, secured borrowings – student lending 4,048.8 –
Preferred capital securities 252.0 253.8_______________ _______________Total debt 47,864.5 37,724.8
Credit balances of factoring clients 4,187.8 3,847.3
Accrued liabilities and payables 4,321.8 3,443.7________________ ________________Total Liabilities 56,374.1 45,015.8
Commitments and Contingencies (Note 16)
Minority interest 49.8 40.4
Stockholders’ Equity:
Preferred stock: $0.01 par value, 100,000,000 authorized, Issued and outstanding:
Series A 14,000,000 with a liquidation preference of $25 per share 350.0 –
Series B 1,500,000 with a liquidation preference of $100 per share 150.0 –
Common stock: $0.01 par value, 600,000,000 authorized,
Issued: 212,315,498 and 212,112,203 2.1 2.1
Outstanding: 199,110,141 and 210,440,170
Paid-in capital, net of deferred compensation of $49.5 and $39.3 10,632.9 10,674.3
Accumulated deficit (3,691.4) (4,499.1)
Accumulated other comprehensive income/(loss) 115.2 (58.4)
Less: treasury stock, 13,205,357 and 1,672,033 shares, at cost (596.1) (63.8)________________ ________________Total Common Stockholders’ Equity 6,462.7 6,055.1________________ ________________
Total Stockholders’ Equity 6,962.7 6,055.1________________ ________________Total Liabilities and Stockholders’ Equity $63,386.6 $51,111.3________________ ________________________________ ________________

CONSOLIDATED STATEMENTS OF INCOME (dollars in millions – except per share data)
Years Ended December 31, 2005 2004 2003_______________ _______________ _______________Finance income $ 4,515.2 $ 3,760.8 $ 3,709.3
Interest expense 1,912.0 1,260.1 1,348.7_________ _________ _________Net finance income 2,603.2 2,500.7 2,360.6
Depreciation on operating lease equipment 968.0 965.4 1,057.5_________ _________ _________Net finance margin 1,635.2 1,535.3 1,303.1
Provision for credit losses 217.0 214.2 387.3_________ _________ _________Net finance margin after provision for credit losses 1,418.2 1,321.1 915.8
Other revenue 1,137.4 887.1 859.3_________ _________ _________Operating margin 2,555.6 2,208.2 1,775.1
Salaries and general operating expenses 1,113.8 1,012.1 888.2
Provision for restructuring 25.2 – –
Gain on redemption of debt – 41.8 50.4_________ _________ _________Income before provision for income taxes 1,416.6 1,237.9 937.3
Provision for income taxes (464.2) (483.2) (365.0)
Minority interest, after tax (3.3) (1.1) –
Dividends on preferred capital securities, after tax – – (5.4)_________ _________ _________Net income before preferred stock dividends 949.1 753.6 566.9
Preferred stock dividends (12.7) – –_________ _________ _________Net income available to common stockholders $ 936.4 $ 753.6 $ 566.9_________ _________ __________________ _________ _________Per common share data
Basic earnings per share $ 4.54 $ 3.57 $ 2.68
Diluted earnings per share $ 4.44 $ 3.50 $ 2.66
Weighted average number of shares – basic (thousands) 206,059 211,017 211,681
Weighted average number of shares – diluted (thousands) 210,734 215,054 213,143
Dividends per share $ 0.61 $ 0.52 $ 0.48
54 CIT GROUP INC 2005
CIT GROUP INC. AND SUBSIDIARIES

CIT GROUP INC. AND SUBSIDIARIES
CONSOLIDATED STATEMENTS OF STOCKHOLDERS’ EQUITY (dollars in millions)
AccumulatedAccumulated Other Total
Preferred Common Paid-in Earnings/ Comprehensive Treasury Stockholders’Stock Stock Capital (Deficit) (Loss) / Income Stock Equity
December 31, 2002 $ – $ 2.1 $10,676.2 $(5,606.9) $(200.7) $ – $4,870.7Net income 566.9 566.9Foreign currency translation adjustments (30.2) (30.2)Change in fair values of derivatives
qualifying as cash flow hedges 77.0 77.0Unrealized loss on equity and
securitization investments (7.4) (7.4)Minimum pension liability adjustment 19.7 19.7
Total comprehensive income 626.0Cash dividends (101.8) (101.8)Restricted common stock grants 8.8 8.8Treasury stock purchased, at cost (28.9) (28.9)Exercise of stock option awards (7.3) 27.4 20.1Employee stock purchase plan participation (0.7) (0.7)
December 31, 2003 – 2.1 10,677.0 (5,141.8) (141.6) (1.5) 5,394.2Net income 753.6 753.6Foreign currency translation adjustments 68.6 68.6Change in fair values of derivatives
qualifying as cash flow hedges 14.2 14.2Unrealized gain on equity and
securitization investments 2.3 2.3Minimum pension liability adjustment (1.9) (1.9)
Total comprehensive income 836.8Cash dividends (110.9) (110.9)Restricted common stock grants 23.5 23.5Treasury stock purchased, at cost (174.8) (174.8)Exercise of stock option awards (25.6) 111.6 86.0Employee stock purchase plan participation (0.6) 0.9 0.3
December 31, 2004 – 2.1 10,674.3 (4,499.1) (58.4) (63.8) 6,055.1Net income 936.4 936.4Foreign currency translation adjustments 110.7 110.7Change in fair values of derivatives
qualifying as cash flow hedges 54.7 54.7Unrealized gain on equity and
securitization investments 8.7 8.7Minimum pension liability adjustment (0.5) (0.5)
Total comprehensive income 1,110.0Issuance of Series A and B preferred stock 500.0 (10.1) 489.9Stock repurchase agreement (8.5) (491.5) (500.0)Cash dividends (128.7) (128.7)Restricted common stock grants amortization 43.3 43.3Treasury stock purchased, at cost (276.3) (276.3)Exercise of stock option awards (65.5) 231.1 165.6Employee stock purchase plan participation (0.6) 4.4 3.8
December 31, 2005 $ 500.0 $ 2.1 $10,632.9 $(3,691.4) $ 115.2 $(596.1) $6,962.7
Item 8: Financial Statements and Supplementary Data 55

CONSOLIDATED STATEMENTS OF CASH FLOWS (dollars in millions)
Years Ended December 31, 2005 2004 2003_______________ _______________ _______________Cash Flows From Operations
Net income $ 936.4 $ 753.6 $ 566.9
Adjustments to reconcile net income to net cash flows from operations:
Depreciation and amortization 1,001.2 998.8 1,086.6
Provision for deferred federal income taxes 295.7 321.0 265.1
Provision for credit losses 217.0 214.2 387.3
Gains on equipment, receivable and investment sales (242.4) (208.8) (164.7)
Gain on debt redemption – (41.8) (50.4)
Decrease/(increase) in other assets 339.0 (282.2) (174.2)
Decrease/(increase) in finance receivables held for sale 199.3 (394.5) 295.1
Increase in accrued liabilities and payables 294.3 328.9 279.2
Other (127.2) (71.5) (8.7)_________ _________ _________Net cash flows provided by operations 2,913.3 1,617.7 2,482.2_________ _________ _________Cash Flows From Investing Activities
Loans extended (57,596.2) (57,062.0) (53,157.8)
Collections on loans 53,986.5 48,944.1 45,123.9
Proceeds from asset and receivable sales 6,351.9 8,491.4 7,419.0
Purchase of finance receivable portfolios (4,633.1) (3,180.0) (1,097.5)
Purchases of assets to be leased (2,359.1) (1,489.2) (2,096.3)
Acquisitions, net of cash acquired (548.9) (726.8) –
Goodwill and intangibles assets acquired (436.5) (122.1) (92.6)
Net decrease (increase) in short-term factoring receivables 96.5 48.3 (396.1)
Other 154.0 41.6 14.8_________ _________ _________Net cash flows (used for) investing activities (4,984.9) (5,054.7) (4,282.6)_________ _________ _________Cash Flows From Financing Activities
Proceeds from the issuance of variable and fixed-rate notes 13,869.3 13,005.6 13,034.6
Repayments of variable and fixed-rate notes (9,133.8) (8,824.1) (10,265.6)
Net loans extended – pledged in conjunction with secured borrowings (1,708.1) – –
Net increase (decrease) in commercial paper 1,014.1 37.0 (800.7)
Treasury stock repurchases (584.7) – –
Proceeds from issuance of preferred stock 489.9 – –
Net repayments of non-recourse leveraged lease debt (630.0) (367.2) (125.4)
Cash dividends paid (128.7) (110.9) (101.8)
Other 20.9 (66.9) (3.6)_________ _________ _________Net cash flows provided by financing activities 3,208.9 3,673.5 1,737.5_________ _________ _________Net increase (decrease) in cash and cash equivalents 1,137.3 236.5 (62.9)
Unrestricted cash and cash equivalents, beginning of period 2,210.2 1,973.7 2,036.6_________ _________ _________Unrestricted cash and cash equivalents, end of period $ 3,347.5 $ 2,210.2 $ 1,973.7_________ _________ __________________ _________ _________Supplementary Cash Flow Disclosure
Interest paid $ 1,651.5 $ 1,241.5 $ 1,517.6
Federal, foreign, state and local income taxes paid, net $ 115.6 $ 115.0 $ 80.6
56 CIT GROUP INC 2005
CIT GROUP INC. AND SUBSIDIARIES
CIT GROUP INC. AND SUBSIDIARIES – NOTES TO CONSOLIDATED FINANCIAL STATEMENTS
Item 8: Financial Statements and Supplementary Data 57
NOTE 1 – BUSINESS AND SUMMARY OFSIGNIFICANT ACCOUNTING POLICIES
CIT Group Inc., a Delaware corporation (“we,” “CIT” or the“Company”), is a global commercial and consumer finance com-pany that was founded in 1908. CIT provides financing and leas-ing capital for consumers and companies in a wide variety ofindustries, offering vendor, equipment, commercial, factoring,home lending, student lending and structured financing prod-ucts as well as offering management advisory services. CIT oper-ates primarily in North America, with locations in Europe, LatinAmerica, Australia and the Asia-Pacific region.
Basis of Presentation
The Consolidated Financial Statements include the results ofCIT and its subsidiaries and have been prepared in U.S. dollarsin accordance with accounting principles generally accepted inthe United States. Inter-company transactions have been elimi-nated. Certain prior period amounts have been reclassified toconform to the current presentation, including certain rail and aerospace maintenance costs related to equipment under operat-ing leases that were previously included in salaries and generaloperating expenses and reclassified to net finance margin.
In accordance with the provisions of FASB Interpretation No.46R (“FIN 46”), “Consolidation of Variable Interest Entities,”CIT consolidates variable interest entities for which managementhas concluded that CIT is the primary beneficiary. Entities thatdo not meet the definition of a variable interest entity are subjectto the provisions of Accounting Research Bulletin No. 51 (“ARB51”), “Consolidated Financial Statements” and are consolidatedwhen management has determined that it has the controllingfinancial interest. Entities which do not meet the consolidationcriteria in either FIN 46 or ARB 51 but which are significantlyinfluenced by the Company, generally those entities that aretwenty to fifty percent owned by CIT, are included in otherassets at cost for securities not readily marketable and presentedat the corresponding share of equity plus loans and advances.Investments in entities which management does not have signifi-cant influence over are included in other assets at cost, lessdeclines in value that are other than temporary. In accordancewith Statement of Financial Accounting Standards (“SFAS”) No.140, “Accounting for Transfers and Servicing of Financial Assetsand Extinguishment of Liabilities”, qualifying special purposeentities utilized in securitizations are not consolidated.
Financing and Leasing Assets
CIT provides funding through a variety of financing arrange-ments, including term loans, lease financing and operating leases.The amounts outstanding on loans and direct financing leases arereferred to as finance receivables and, when combined withfinance receivables held for sale, net book value of operating leaseequipment, and certain investments, represent financing andleasing assets.
At the time of designation for sale, securitization or syndicationby management, assets are classified as finance receivables heldfor sale. These assets are carried at lower of cost or fair value.
Income Recognition
Finance income includes interest on loans, the accretion ofincome on direct financing leases, and rents on operating leases.Related origination and other nonrefundable fees and direct orig-ination costs are deferred and amortized as an adjustment offinance income over the contractual life of the transactions.Income on finance receivables other than leveraged leases is rec-ognized on an accrual basis commencing in the month of origi-nation. Leveraged lease income is recognized on a basis calculatedto achieve a constant after-tax rate of return for periods in whichCIT has a positive investment in the transaction, net of relateddeferred tax liabilities. Rental income on operating leases is rec-ognized on an accrual basis.
The accrual of finance income on commercial finance receivablesis generally suspended and an account is placed on non-accrualstatus when payment of principal or interest is contractuallydelinquent for 90 days or more, or earlier when, in the opinionof management, full collection of all principal and interest due isdoubtful. To the extent the estimated fair value of collateral doesnot satisfy both the principal and accrued interest outstanding,accrued but uncollected interest at the date an account is placedon non-accrual status is reversed and charged against income.Subsequent interest received is applied to the outstanding princi-pal balance until such time as the account is collected, charged-off or returned to accrual status. The accrual of finance incomeon consumer loans is suspended, and all previously accrued butuncollected income is reversed, when payment of principaland/or interest is contractually delinquent for 90 days or more.
Other revenue includes the following: (1) factoring commissions,(2) commitment, facility, letters of credit, advisory and syndica-tion fees, (3) servicing fees, including servicing of securitizedloans, (4) gains and losses from sales of leasing equipment andsales of finance receivables, (5) gains from and fees related tosecuritizations including accretion related to retained interests(net of impairment), (6) equity in earnings of joint ventures andunconsolidated subsidiaries and (7) gains and losses related tocertain derivative transactions.
Lease Financing
Direct financing leases are recorded at the aggregate future mini-mum lease payments plus estimated residual values less unearnedfinance income. Operating lease equipment is carried at cost lessaccumulated depreciation and is depreciated to estimated resid-ual value using the straight-line method over the lease term orprojected economic life of the asset. Equipment acquired in satis-faction of loans is recorded at the lower of carrying value or esti-mated fair value when acquired. Lease receivables includeleveraged leases, for which a major portion of the funding is pro-vided by third party lenders on a nonrecourse basis, with CITproviding the balance and acquiring title to the property.Leveraged leases are recorded at the aggregate value of futureminimum lease payments plus estimated residual value, less non-recourse third party debt and unearned finance income.Management performs periodic reviews of estimated residual val-ues with other than temporary impairment recognized in currentperiod earnings.
Reserve for Credit Losses on Finance Receivables
The reserve for credit losses is intended to provide for lossesinherent in the portfolio and is periodically reviewed for ade-quacy considering economic conditions, collateral values andcredit quality indicators, including historical and expectedcharge-off experience and levels of and trends in past due loans,non-performing assets and impaired loans. Changes in economicconditions or other events affecting specific obligors or industriesmay necessitate additions or deductions to the reserve for creditlosses.
The reserve for credit losses is determined based on three keycomponents: (1) specific reserves for loans that are impairedunder SFAS 114, based upon the value of underlying collateral orprojected cash flows, (2) reserves for estimated losses inherent inthe portfolio based upon historical and projected credit risk and(3) reserves for economic environment risk and other factors. Inmanagement’s judgment, the reserve for credit losses is adequateto provide for credit losses inherent in the portfolio.
Charge-off of Finance Receivables
Finance receivables are reviewed periodically to determine theprobability of loss. Charge-offs are taken after considering suchfactors as the borrower’s financial condition and the value ofunderlying collateral and guarantees (including recourse to deal-ers and manufacturers). Such charge-offs are deducted from thecarrying value of the related finance receivables. To the extentthat an unrecovered balance remains due, a final charge-off istaken at the time collection efforts are deemed no longer useful.Charge-offs are recorded on consumer and certain small ticketcommercial finance receivables beginning at 180 days of contrac-tual delinquency based upon historical loss severity. Collectionson accounts previously charged off are recorded as recoveries.
Impaired Finance Receivables
Impaired finance receivables include any loans or capital leases of$500 thousand or greater that are placed on non-accrual statusand are subject to periodic individual review by CIT’s AssetQuality Review Committee (“AQR”). The AQR, which is com-prised of members of senior management, reviews overall portfo-lio performance, as well as individual accounts meeting certaincredit risk grading parameters. Excluded from impaired financereceivables are: 1) certain individual commercial non-accrualfinance receivables for which the collateral value supports the out-standing balance and the continuation of earning status, 2) homelending and other homogeneous pools of loans, which are subjectto automatic charge-off procedures, and 3) short-term factoringcustomer finance receivables, generally having terms of no morethan 30 days. Impairment occurs when, based on current infor-mation and events, it is probable that CIT will be unable to col-lect all amounts due according to the contractual terms of thefinancing agreement. Impairment is measured as any shortfallbetween the estimated value and the recorded investment in thefinance receivable, with the estimated value determined using thefair value of the collateral and other cash flows if the financereceivable is collateralized, or the present value of expected futurecash flows discounted at the contract’s effective interest rate.
Long-Lived Assets
A review for impairment of long-lived assets, such as certainoperating lease equipment, is performed at least annually andwhenever events or changes in circumstances indicate that thecarrying amount of long-lived assets may not be recoverable.Impairment of assets is determined by comparing the carryingamount of an asset to future undiscounted net cash flowsexpected to be generated by the asset. If an asset is considered tobe impaired, the impairment is the amount by which the carry-ing amount of the asset exceeds the fair value of the asset. Fairvalue is based upon discounted cash flow analysis and availablemarket data. Current lease rentals, as well as relevant and avail-able market information (including third party sales for similarequipment, published appraisal data and other marketplaceinformation), is considered, both in determining undiscountedfuture cash flows when testing for the existence of impairmentand in determining estimated fair value in measuring impair-ment. Depreciation expense is adjusted when projected fair valueat the end of the lease term is below the projected book value atthe end of the lease term. Assets to be disposed of are reported atthe lower of the carrying amount or fair value less costs todispose.
Goodwill and Other Identified Intangibles
SFAS No. 141 “Business Combinations” requires that businesscombinations be accounted for using the purchase method. Thepurchase method of accounting requires that the cost of anacquired entity be allocated to the assets acquired and liabilitiesassumed based on their estimated fair values at the date of acqui-sition. The difference between the fair values and the purchaseprice is recorded to goodwill. Also under SFAS 141, identifiedintangible assets acquired in a business combination must be sep-arately valued and recognized on the balance sheet if they meetcertain requirements.
Goodwill represents the excess of the purchase price over the fairvalue of identifiable assets acquired, less the fair value of liabilitiesassumed from business combinations. CIT adopted SFAS No.142, “Goodwill and Other Intangible Assets” effectiveOctober 1, 2001. Since adoption, goodwill is no longer amor-tized, but instead is assessed for impairment at least annually.During this assessment, management relies on a number of fac-tors, including operating results, business plans, economic pro-jections, anticipated future cash flows and market place data.
Intangible assets consist primarily of customer relationshipsacquired, which have amortizable lives up to 20 years, and com-puter software and related transactions processes, which are beingamortized over a 5-year life. An evaluation of the remaining use-ful lives and the amortization methodology of the intangibleassets is performed periodically to determine if any change iswarranted.
58 CIT GROUP INC 2005
CIT GROUP INC. AND SUBSIDIARIES – NOTES TO CONSOLIDATED FINANCIAL STATEMENTS

CIT GROUP INC. AND SUBSIDIARIES – NOTES TO CONSOLIDATED FINANCIAL STATEMENTS
Student Lending Acquisition
In February 2005, CIT acquired Education Lending Group, Inc.(“EDLG”), a specialty finance company principally engaged inproviding education loans (primarily U.S. government guaran-teed), products and services to students, parents, schools andalumni associations. The acquisition was accounted for under thepurchase method, with the acquired assets and liabilities recordedat their estimated fair values as of the February 17, 2005 acquisi-tion date. The assets acquired included approximately $4.4 bil-lion of finance receivables and $300 million of goodwill andintangible assets. This business is largely funded with “EducationLoan Backed Notes,” which are accounted for under SFAS No.140 “Accounting for Transfers and Servicing of Financial Assetsand Extinguishments of Liabilities.” The assets related to theseborrowings are owned by a special purpose entity that is consoli-dated in the CIT financial statements, and the creditors of thatspecial purpose entity have received ownership and / or securityinterests in the assets. As EDLG retains certain call features withrespect to these borrowings, the transactions do not meet theSFAS 140 requirements for sales treatment and are thereforerecorded as secured borrowings and are reflected in theConsolidated Balance Sheet as “student lending receivablespledged” and “non-recourse, secured borrowings – student lend-ing.” Certain cash balances, included in cash and cash equiva-lents, are restricted in conjunction with these borrowings.
Other Assets
Assets received in satisfaction of loans are carried at the lower ofcarrying value or estimated fair value less selling costs, with write-downs generally reflected in provision for credit losses.
Realized and unrealized gains (losses) on marketable equity secu-rities included in CIT’s venture capital portfolios are recognizedcurrently in operations. Unrealized gains and losses, representingthe difference between carrying value and estimated current fairmarket value, for other debt and equity securities are recorded inother accumulated comprehensive income, a separate componentof equity.
Investments in joint ventures are accounted for using the equitymethod, whereby the investment balance is carried at cost andadjusted for the proportionate share of undistributed earnings orlosses. Unrealized intercompany profits and losses are eliminateduntil realized, as if the joint venture were consolidated.
Investments in debt and equity securities of non-public compa-nies are carried at fair value. Gains and losses are recognized uponsale or write-down of these investments as a component of oper-ating margin.
Securitization Sales
Pools of assets are originated and sold to special purpose entitieswhich, in turn, issue debt securities backed by the asset pools orsell individual interests in the assets to investors. CIT retains theservicing rights and participates in certain cash flows from thepools. For transactions meeting accounting sale criteria, the pres-ent value of expected net cash flows (after payment of principal
and interest to certificate and/or note holders and credit-relateddisbursements) that exceeds the estimated cost of servicing isrecorded at the time of sale as a “retained interest.” Retainedinterests in securitized assets are classified as available-for-salesecurities under SFAS No. 115. CIT, in its estimation of thosenet cash flows and retained interests, employs a variety of finan-cial assumptions, including loan pool credit losses, prepaymentspeeds and discount rates. These assumptions are supported byboth CIT’s historical experience, market trends and anticipatedperformance relative to the particular assets securitized.Subsequent to the recording of retained interests, estimated cashflows underlying retained interests are periodically updated basedupon current information and events that management believes amarket participant would use in determining the current fairvalue of the retained interest. If the analysis indicates that anadverse change in estimated cash flows has occurred, an “other-than temporary” impairment is recorded and included in netincome to write down the retained interest to estimated fairvalue. Unrealized gains are not credited to current earnings, butare reflected in stockholders’ equity as part of other comprehen-sive income.
Servicing assets or liabilities are established when the fees for serv-icing securitized assets are more or less than adequate compensa-tion to CIT for servicing the assets. CIT securitizationtransactions generally do not result in servicing assets or liabilities,as typically the contractual fees are adequate compensation inrelation to the associated servicing costs. To the extent applicable,servicing assets or liabilities are recognized in earnings over theservicing period and are periodically evaluated for impairment.
Derivative Financial Instruments
As part of managing economic risk and exposure to interest rate,foreign currency, and, in limited instances, credit risk, CIT, as anend-user, enters into various derivative transactions, which aretransacted in over-the-counter markets with other financial insti-tutions. To ensure both appropriate use as a hedge and to achievehedge accounting treatment, whenever possible, derivativesentered into are designated according to a hedge objective againsta specific liability, forecasted transaction or, in limited instances,assets. The critical terms of the derivatives, including notionalamounts, rates, indices, and maturities, match the related termsof the underlying hedged items. CIT does not enter into deriva-tive financial instruments for trading or speculative purposes. Derivative instruments are transacted as economic hedges,though certain derivative instruments do not qualify for hedgeaccounting. In these limited instances, related activity is reflectedin current earnings.
Major hedge strategies include: (1) Interest rate risk manage-ment to match fund asset portfolio growth. Interest rate swaps,whereby CIT pays a fixed interest rate and receives a variableinterest rate, are utilized to hedge either forecasted commercialpaper issuances or specific variable-rate debt instruments. Thesetransactions are classified as cash flow hedges and effectively con-vert variable-rate debt to fixed-rate debt. Interest rate swaps,whereby CIT pays a variable interest rate and receives a fixed
Item 8: Financial Statements and Supplementary Data 59

interest rate, are utilized to hedge specific fixed-rate debt. Thesetransactions are classified as fair value hedges and effectively con-vert fixed-rate debt to a variable-rate debt. (2) Currency riskmanagement to hedge foreign funding sources. Cross-currencyswaps, whereby CIT pays U.S. dollars and receives various for-eign currencies, are utilized to effectively convert foreign-denom-inated debt to U.S. dollar debt. These transactions are classifiedas either foreign currency cash flow or foreign currency fair valuehedges. (3) Currency risk management to hedge investments inforeign operations. Cross-currency swaps and foreign currencyforward contracts, whereby CIT pays various foreign currenciesand receives U.S. dollars, are utilized to effectively convert U.S.dollar denominated debt to foreign currency denominated debt.These transactions are classified as foreign currency net invest-ment hedges, or foreign currency cash flow hedges, with resultinggains and losses reflected in accumulated other comprehensiveincome as a separate component of equity.
Derivative instruments are recognized in the balance sheet attheir fair values in other assets and accrued liabilities andpayables, and changes in fair values are recognized immediatelyin earnings, unless the derivatives qualify as cash flow hedges. Forderivatives qualifying as hedges of future cash flows, the effectiveportion of changes in fair value is recorded temporarily in accu-mulated other comprehensive income as a separate component ofequity, and contractual cash flows, along with the related impactof the hedged items, continue to be recognized in earnings. Anyineffective portion of a hedge is reported in current earnings.Amounts accumulated in other comprehensive income are reclas-sified to earnings in the same period that the hedged transactionimpacts earnings.
Hedge effectiveness is assessed both at the inception of the hedgeand on an on-going basis, at least every quarter. Hedge ineffec-tiveness is measured in accordance with contemporaneous hedgedocumentation as of each financial statement period.
The net interest differential, including premiums paid orreceived, if any, on interest rate swaps, is recognized on an accrualbasis as an adjustment to finance income or as interest expenseto correspond with the hedged position. In the event of earlytermination of derivative instruments, the gain or loss isreflected in earnings as the hedged transaction is recognizedin earnings.
CIT is exposed to credit risk to the extent that the counterpartyfails to perform under the terms of a derivative instrument. Thisrisk is measured as the market value of derivative transactions witha positive fair value, reduced by the effects of master netting agree-ments. We manage this credit risk by requiring that all derivativetransactions be conducted with counterparties rated investmentgrade by nationally recognized rating agencies, with the majorityof the counterparties rated “AA” or higher, and by setting limitson the exposure with any individual counterparty. Accordingly,counterparty credit risk is not considered significant.
Foreign Currency Translation
CIT has operations in Canada, Europe and other countries out-side the United States. The functional currency for these foreignoperations is generally the local currency. The value of the assetsand liabilities of these operations is translated into U.S. dollars atthe rate of exchange in effect at the balance sheet date. Revenueand expense items are translated at the average exchange rateseffective during the year. The resulting foreign currency transla-tion gains and losses, as well as offsetting gains and losses onhedges of net investments in foreign operations, are reflected inaccumulated other comprehensive income. Transaction gains andlosses resulting from exchange rate changes on transactionsdenominated in currencies other than the functional currency areincluded in net income.
Income Taxes
Deferred tax assets and liabilities are recognized for the expectedfuture taxation of events that have been reflected in theConsolidated Financial Statements. Deferred tax liabilities andassets are determined based on the differences between the bookvalues and the tax basis of particular assets and liabilities, usingtax rates in effect for the years in which the differences areexpected to reverse. A valuation allowance is provided to offsetany net deferred tax assets if, based upon the available evidence,it is more likely than not that some or all of the deferred taxassets will not be realized. U.S. income taxes are generally notprovided on undistributed earnings of foreign operations as suchearnings are permanently invested. Income tax reserves reflectopen tax return positions, tax assessments received, tax lawchanges and third party indemnifications, and are included incurrent taxes payable, which is reflected in accrued liabilities andpayables.
Accounting for Costs Associated with Exit or DisposalActivities
A liability for costs associated with exit or disposal activities,other than in a business combination, is recognized when the lia-bility is incurred. The liability is measured at fair value, withadjustments for changes in estimated cash flows recognized inearnings.
Other Comprehensive Income/Loss
Other comprehensive income/loss includes unrealized gains onsecuritization retained interests and other investments, foreigncurrency translation adjustments pertaining to both the netinvestment in foreign operations and the related derivatives des-ignated as hedges of such investments, the changes in fair valuesof derivative instruments designated as hedges of future cashflows and minimum pension liability adjustments.
Consolidated Statements of Cash Flows
Cash and cash equivalents includes cash and interest-bearingdeposits, which generally represent overnight money marketinvestments of excess cash maintained for liquidity purposes.Cash inflows and outflows from commercial paper borrowings
60 CIT GROUP INC 2005
CIT GROUP INC. AND SUBSIDIARIES – NOTES TO CONSOLIDATED FINANCIAL STATEMENTS
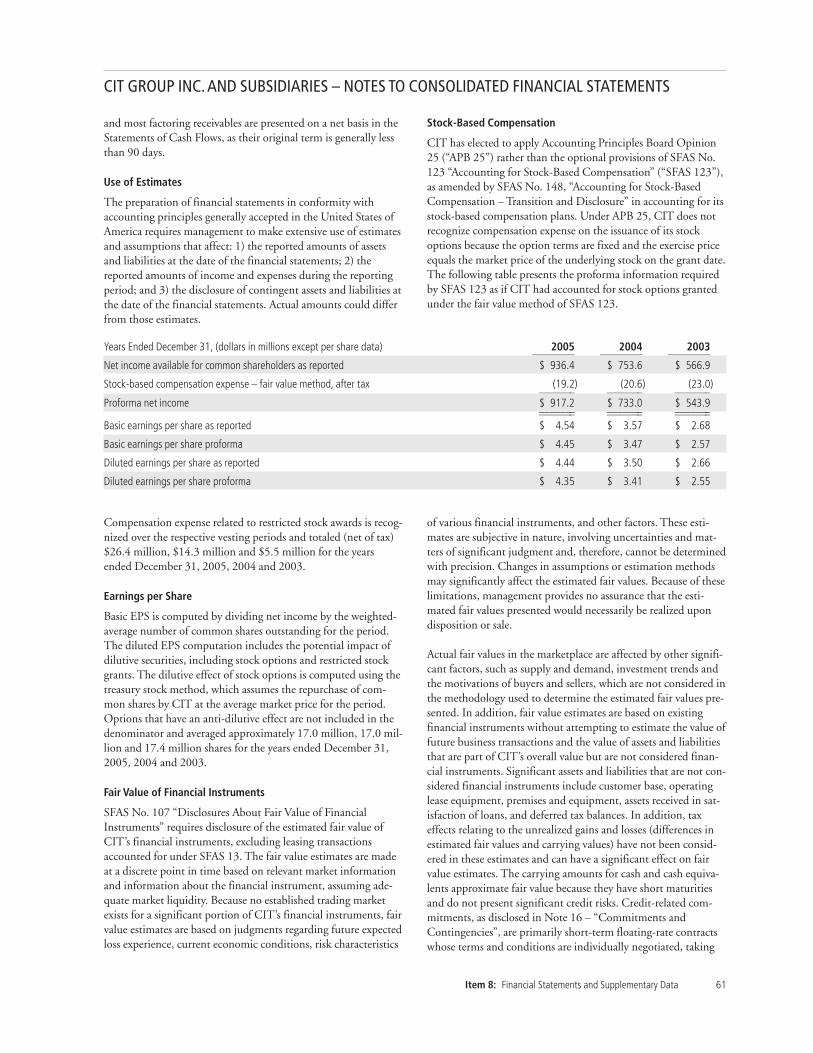
CIT GROUP INC. AND SUBSIDIARIES – NOTES TO CONSOLIDATED FINANCIAL STATEMENTS
and most factoring receivables are presented on a net basis in theStatements of Cash Flows, as their original term is generally lessthan 90 days.
Use of Estimates
The preparation of financial statements in conformity withaccounting principles generally accepted in the United States ofAmerica requires management to make extensive use of estimatesand assumptions that affect: 1) the reported amounts of assetsand liabilities at the date of the financial statements; 2) thereported amounts of income and expenses during the reportingperiod; and 3) the disclosure of contingent assets and liabilities atthe date of the financial statements. Actual amounts could differfrom those estimates.
Stock-Based Compensation
CIT has elected to apply Accounting Principles Board Opinion25 (“APB 25”) rather than the optional provisions of SFAS No.123 “Accounting for Stock-Based Compensation” (“SFAS 123”),as amended by SFAS No. 148, “Accounting for Stock-BasedCompensation – Transition and Disclosure” in accounting for itsstock-based compensation plans. Under APB 25, CIT does notrecognize compensation expense on the issuance of its stockoptions because the option terms are fixed and the exercise priceequals the market price of the underlying stock on the grant date.The following table presents the proforma information requiredby SFAS 123 as if CIT had accounted for stock options grantedunder the fair value method of SFAS 123.
Item 8: Financial Statements and Supplementary Data 61
Compensation expense related to restricted stock awards is recog-nized over the respective vesting periods and totaled (net of tax)$26.4 million, $14.3 million and $5.5 million for the yearsended December 31, 2005, 2004 and 2003.
Earnings per Share
Basic EPS is computed by dividing net income by the weighted-average number of common shares outstanding for the period.The diluted EPS computation includes the potential impact ofdilutive securities, including stock options and restricted stockgrants. The dilutive effect of stock options is computed using thetreasury stock method, which assumes the repurchase of com-mon shares by CIT at the average market price for the period.Options that have an anti-dilutive effect are not included in thedenominator and averaged approximately 17.0 million, 17.0 mil-lion and 17.4 million shares for the years ended December 31,2005, 2004 and 2003.
Fair Value of Financial Instruments
SFAS No. 107 “Disclosures About Fair Value of FinancialInstruments” requires disclosure of the estimated fair value ofCIT’s financial instruments, excluding leasing transactionsaccounted for under SFAS 13. The fair value estimates are madeat a discrete point in time based on relevant market informationand information about the financial instrument, assuming ade-quate market liquidity. Because no established trading marketexists for a significant portion of CIT’s financial instruments, fairvalue estimates are based on judgments regarding future expectedloss experience, current economic conditions, risk characteristics
of various financial instruments, and other factors. These esti-mates are subjective in nature, involving uncertainties and mat-ters of significant judgment and, therefore, cannot be determinedwith precision. Changes in assumptions or estimation methodsmay significantly affect the estimated fair values. Because of theselimitations, management provides no assurance that the esti-mated fair values presented would necessarily be realized upondisposition or sale.
Actual fair values in the marketplace are affected by other signifi-cant factors, such as supply and demand, investment trends andthe motivations of buyers and sellers, which are not considered inthe methodology used to determine the estimated fair values pre-sented. In addition, fair value estimates are based on existingfinancial instruments without attempting to estimate the value offuture business transactions and the value of assets and liabilitiesthat are part of CIT’s overall value but are not considered finan-cial instruments. Significant assets and liabilities that are not con-sidered financial instruments include customer base, operatinglease equipment, premises and equipment, assets received in sat-isfaction of loans, and deferred tax balances. In addition, taxeffects relating to the unrealized gains and losses (differences inestimated fair values and carrying values) have not been consid-ered in these estimates and can have a significant effect on fairvalue estimates. The carrying amounts for cash and cash equiva-lents approximate fair value because they have short maturitiesand do not present significant credit risks. Credit-related com-mitments, as disclosed in Note 16 – “Commitments andContingencies”, are primarily short-term floating-rate contractswhose terms and conditions are individually negotiated, taking
Years Ended December 31, (dollars in millions except per share data) 2005 2004 2003_______________ _______________ _______________Net income available for common shareholders as reported $ 936.4 $ 753.6 $ 566.9
Stock-based compensation expense – fair value method, after tax (19.2) (20.6) (23.0)_______ _______ _______Proforma net income $ 917.2 $ 733.0 $ 543.9_______ _______ ______________ _______ _______Basic earnings per share as reported $ 4.54 $ 3.57 $ 2.68
Basic earnings per share proforma $ 4.45 $ 3.47 $ 2.57
Diluted earnings per share as reported $ 4.44 $ 3.50 $ 2.66
Diluted earnings per share proforma $ 4.35 $ 3.41 $ 2.55

into account the creditworthiness of the customer and thenature, accessibility and quality of the collateral and guarantees.Therefore, the fair value of credit-related commitments, if exer-cised, would approximate their contractual amounts.
Accounting Pronouncements
On January 1, 2005, the Company adopted Statement ofPosition No. 03-3, “Accounting for Certain Loans or DebtSecurities Acquired in a Transfer” (“SOP 03-3”). SOP 03-3requires acquired loans to be carried at fair value and prohibitsthe establishment of credit loss valuation reserves at acquisitionfor loans that have evidence of credit deterioration since origina-tion. The implementation of SOP 03-3 did not have a materialfinancial statement impact.
In December 2004, the FASB issued a revision to SFAS No. 123,“Share-Based Payment” (“FAS 123R”). FAS 123R requires therecognition of compensation expense for all stock-based com-pensation plans as of the beginning of the first annual reportingperiod that begins after June 15, 2005. The current accountingfor employee stock options is most impacted by this new stan-dard, as costs associated with the Company’s restricted stockawards are already recognized in net income and amounts associ-ated with employee stock purchase plans are not significant.Similar to the proforma amounts disclosed historically, the com-pensation cost relating to options will be based upon the grant-date fair value of the award and will be recognized over thevesting period. FAS 123R will be adopted as of January 1, 2006,utilizing the modified prospective application method, wherebythe expense relating to post-adoption grants and unvested grants asof the adoption date will be recognized in earnings. The estimatedimpact for the year 2006 is approximately $0.10 diluted EPS.
In December 2004, the FASB issued FASB Staff Position No.FAS 109-2, “Accounting and Disclosure Guidance for theForeign Earnings Repatriation Provision within the AmericanJobs Creation Act of 2004” (“FSP 109-2”). The implementationof FSP 109-2 is not expected to have a material financial state-ment impact on the Company, as there are no present plans torepatriate foreign earnings.
In May 2003, the FASB issued SFAS No. 150, “Accounting forCertain Financial Instruments with Characteristics of bothLiabilities and Equity.” On November 7, 2003, certain measure-ment and classification provisions of SFAS 150, relating to cer-tain mandatorily redeemable non-controlling interests, weredeferred indefinitely. The implementation of these delayed provi-sions, which relate primarily to minority interests associated withfinite-lived entities, is not expected to have a material financialstatement impact on the Company.
The FASB has issued FASB Staff Position (“FSP”) No. 13-a“Accounting for a Change or Projected Change in the Timing ofCash Flows Related to Income Taxes Generated by a LeveragedLease Transaction.” As CIT does not participate in “lease in leaseout” transactions, the adoption of the FSP as proposed is notexpected to have a material financial statement impact.
NOTE 2 – FINANCE RECEIVABLES
The following table presents finance receivables by loans andlease receivables, as well as finance receivables previously securi-tized and still serviced by CIT.
December 31, (dollars in millions) 2005 2004_______________________ ______________________Loans $37,410.3 $27,566.2
Leases 6,884.2 7,482.0_______________ _______________Finance receivables $44,294.5 $35,048.2_______________ ______________________________ _______________Finance receivables securitized and
serviced by CIT $ 7,285.7 $ 8,309.7_______________ ______________________________ _______________
Finance receivables include the following:
December 31, (dollars in millions) 2005 2004_______________________ ______________________Unearned income $(3,436.3) $(3,242.8)
Equipment residual values $ 2,064.7 $ 2,389.7
Leveraged leases, net $ 1,020.7 $ 1,241.8
Leveraged leases exclude the portion funded by third party non-recourse debt payable of $2,311.4 million and $2,941.5 millionat December 31, 2005 and 2004.
The following table sets forth the contractual maturities offinance receivables by respective fiscal period.
December 31, (dollars in millions) 2005 2004______________________________ _____________________________Due Within Year:
1 $12,438.0 28.1% $11,799.5 33.7%
2 4,482.0 10.1% 4,827.0 13.8%
3 3,872.0 8.7% 3,720.8 10.6%
4 2,556.2 5.8% 2,465.3 7.0%
5 2,494.9 5.6% 2,066.8 5.9%
Thereafter 18,451.4 41.7% 10,168.8 29.0%________ ______ ________ ______Total $44,294.5 100.0% $35,048.2 100.0%________ ______ ________ ______________ ______ ________ ______
Non-performing assets reflect both finance receivables on non-accrual status (primarily finance receivables that are ninety daysor more delinquent) and assets received in satisfaction of loans(repossessed assets). The following table sets forth certain infor-mation regarding total non-performing assets.
December 31, (dollars in millions) 2005 2004__________________ __________________Non-accrual finance receivables $460.7 $458.4
Assets received in satisfaction offinance receivables 60.5 81.2__________ __________Total non-performing assets $521.2 $539.6__________ ____________________ __________
Percentage of finance receivables 1.18% 1.54%__________ ____________________ __________
62 CIT GROUP INC 2005
CIT GROUP INC. AND SUBSIDIARIES – NOTES TO CONSOLIDATED FINANCIAL STATEMENTS
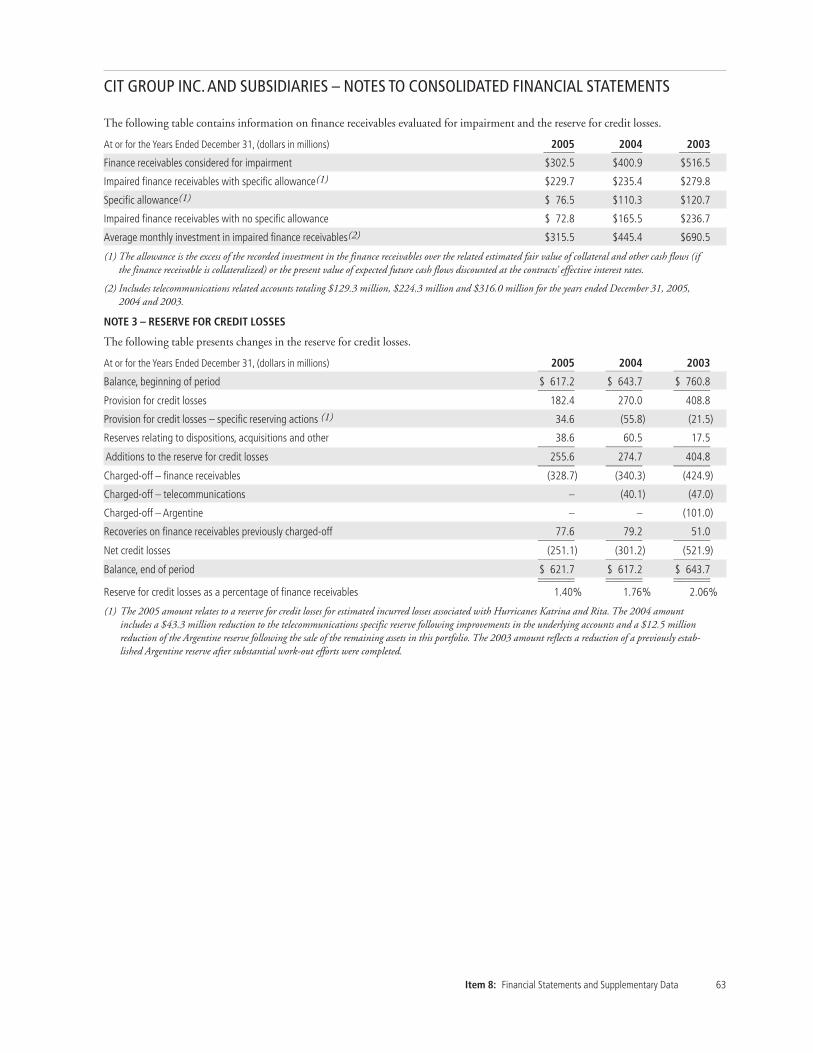
CIT GROUP INC. AND SUBSIDIARIES – NOTES TO CONSOLIDATED FINANCIAL STATEMENTS
Item 8: Financial Statements and Supplementary Data 63
The following table contains information on finance receivables evaluated for impairment and the reserve for credit losses.
At or for the Years Ended December 31, (dollars in millions) 2005 2004 2003___________ ___________ ___________Finance receivables considered for impairment $302.5 $400.9 $516.5
Impaired finance receivables with specific allowance(1) $229.7 $235.4 $279.8
Specific allowance(1) $ 76.5 $110.3 $120.7
Impaired finance receivables with no specific allowance $ 72.8 $165.5 $236.7
Average monthly investment in impaired finance receivables(2) $315.5 $445.4 $690.5
(1) The allowance is the excess of the recorded investment in the finance receivables over the related estimated fair value of collateral and other cash flows (ifthe finance receivable is collateralized) or the present value of expected future cash flows discounted at the contracts’ effective interest rates.
(2) Includes telecommunications related accounts totaling $129.3 million, $224.3 million and $316.0 million for the years ended December 31, 2005,2004 and 2003.
NOTE 3 – RESERVE FOR CREDIT LOSSES
The following table presents changes in the reserve for credit losses.
At or for the Years Ended December 31, (dollars in millions) 2005 2004 2003_____________ _____________ _____________Balance, beginning of period $ 617.2 $ 643.7 $ 760.8_____________ _____________ _____________Provision for credit losses 182.4 270.0 408.8
Provision for credit losses – specific reserving actions (1) 34.6 (55.8) (21.5)
Reserves relating to dispositions, acquisitions and other 38.6 60.5 17.5_____________ _____________ _____________Additions to the reserve for credit losses 255.6 274.7 404.8_____________ _____________ _____________Charged-off – finance receivables (328.7) (340.3) (424.9)
Charged-off – telecommunications – (40.1) (47.0)
Charged-off – Argentine – – (101.0)
Recoveries on finance receivables previously charged-off 77.6 79.2 51.0_____________ _____________ _____________Net credit losses (251.1) (301.2) (521.9)_____________ _____________ _____________Balance, end of period $ 621.7 $ 617.2 $ 643.7_____________ _____________ __________________________ _____________ _____________Reserve for credit losses as a percentage of finance receivables 1.40% 1.76% 2.06%
(1) The 2005 amount relates to a reserve for credit losses for estimated incurred losses associated with Hurricanes Katrina and Rita. The 2004 amountincludes a $43.3 million reduction to the telecommunications specific reserve following improvements in the underlying accounts and a $12.5 million reduction of the Argentine reserve following the sale of the remaining assets in this portfolio. The 2003 amount reflects a reduction of a previously estab-lished Argentine reserve after substantial work-out efforts were completed.
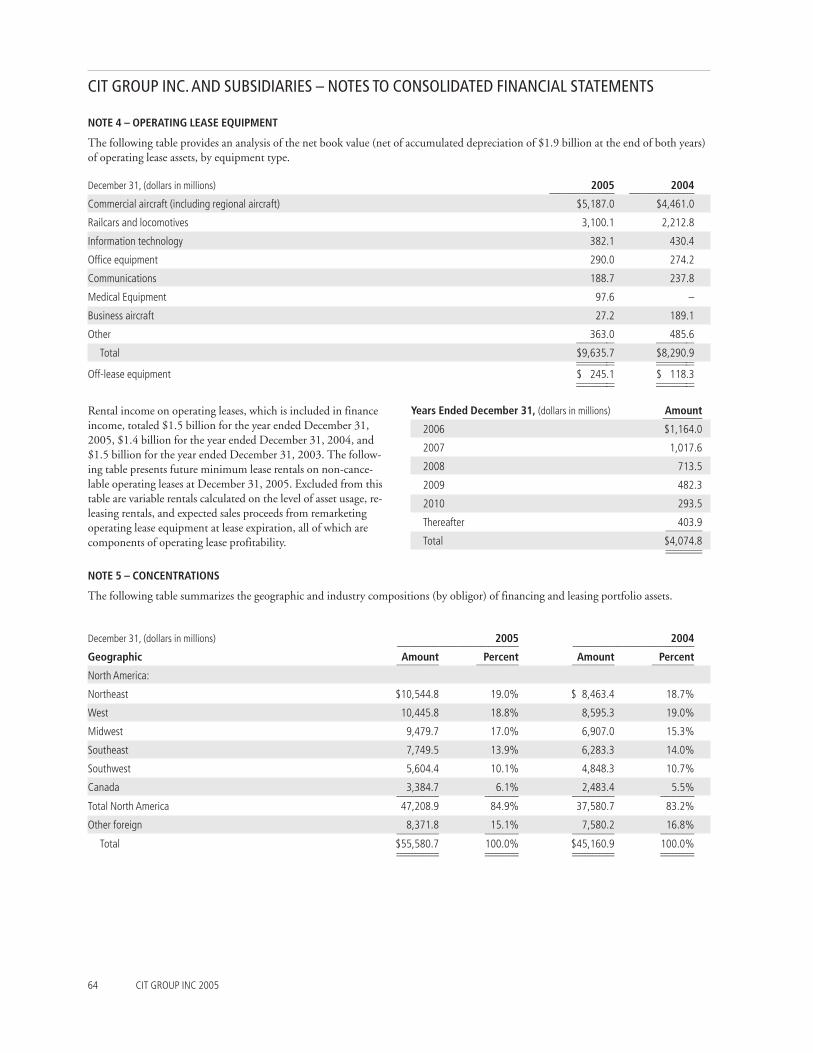
NOTE 4 – OPERATING LEASE EQUIPMENT
The following table provides an analysis of the net book value (net of accumulated depreciation of $1.9 billion at the end of both years)of operating lease assets, by equipment type.
December 31, (dollars in millions) 2005 2004_______________________ _______________________Commercial aircraft (including regional aircraft) $5,187.0 $4,461.0
Railcars and locomotives 3,100.1 2,212.8
Information technology 382.1 430.4
Office equipment 290.0 274.2
Communications 188.7 237.8
Medical Equipment 97.6 –
Business aircraft 27.2 189.1
Other 363.0 485.6______________ ______________Total $9,635.7 $8,290.9______________ ____________________________ ______________
Off-lease equipment $ 245.1 $ 118.3______________ ____________________________ ______________
64 CIT GROUP INC 2005
CIT GROUP INC. AND SUBSIDIARIES – NOTES TO CONSOLIDATED FINANCIAL STATEMENTS
Rental income on operating leases, which is included in financeincome, totaled $1.5 billion for the year ended December 31,2005, $1.4 billion for the year ended December 31, 2004, and$1.5 billion for the year ended December 31, 2003. The follow-ing table presents future minimum lease rentals on non-cance-lable operating leases at December 31, 2005. Excluded from thistable are variable rentals calculated on the level of asset usage, re-leasing rentals, and expected sales proceeds from remarketingoperating lease equipment at lease expiration, all of which arecomponents of operating lease profitability.
Years Ended December 31, (dollars in millions) Amount______________2006 $1,164.0
2007 1,017.6
2008 713.5
2009 482.3
2010 293.5
Thereafter 403.9_____________Total $4,074.8__________________________
NOTE 5 – CONCENTRATIONS
The following table summarizes the geographic and industry compositions (by obligor) of financing and leasing portfolio assets.
December 31, (dollars in millions) 2005 2004___________________________________________ ___________________________________________Geographic Amount Percent Amount Percent_______________ _______________ _______________ _______________North America:
Northeast $10,544.8 19.0% $ 8,463.4 18.7%
West 10,445.8 18.8% 8,595.3 19.0%
Midwest 9,479.7 17.0% 6,907.0 15.3%
Southeast 7,749.5 13.9% 6,283.3 14.0%
Southwest 5,604.4 10.1% 4,848.3 10.7%
Canada 3,384.7 6.1% 2,483.4 5.5%_______________ ____________ _______________ ____________Total North America 47,208.9 84.9% 37,580.7 83.2%
Other foreign 8,371.8 15.1% 7,580.2 16.8%_______________ ____________ _______________ ____________Total $55,580.7 100.0% $45,160.9 100.0%_______________ ____________ _______________ ___________________________ ____________ _______________ ____________

CIT GROUP INC. AND SUBSIDIARIES – NOTES TO CONSOLIDATED FINANCIAL STATEMENTS
Item 8: Financial Statements and Supplementary Data 65
December 31, (dollars in millions) 2005 2004___________________________________________ ___________________________________________Industry Amount Percent Amount Percent_______________ _______________ _______________ _______________Consumer based lending – home mortgage $ 8,335.7 15.0% $ 5,069.8 11.2%
Manufacturing(1)(6) 7,185.3 12.9% 6,932.0 15.4%
Commercial airlines (including regional airlines) 6,426.9 11.6% 5,512.4 12.2%
Retail(2) 6,322.3 11.4% 5,859.4 13.0%
Consumer based lending – student lending 5,267.8 9.5% – –
Service industries 3,096.5 5.6% 2,854.5 6.3%
Transportation(3) 2,543.6 4.6% 2,969.6 6.6%
Healthcare 2,123.7 3.8% 992.5 2.2%
Consumer based lending – non-real estate(4) 1,878.7 3.4% 2,480.1 5.5%
Wholesaling 1,834.4 3.3% 1,727.5 3.8%
Construction equipment 1,451.1 2.6% 1,603.1 3.5%
Other (no industry greater than 3.0%)(5)(6) 9,114.7 16.3% 9,160.0 20.3%_______________ ____________ _______________ ____________Total $55,580.7 100.0% $45,160.9 100.0%_______________ ____________ _______________ ___________________________ ____________ _______________ ____________
(1) Includes manufacturers of apparel (2.2%), followed by food and kindred products, chemical and allied products, rubber and plastics, industrial machin-ery and equipment, textiles, transportation equipment, and other industries.
(2) Includes retailers of apparel (4.8%) and general merchandise (3.7%).
(3) Includes rail, bus, over-the-road trucking and business aircraft.
(4) Includes receivables from consumers for products in various industries such as manufactured housing, recreational vehicles, marine and computers andrelated equipment.
(5) Included in “Other” above are financing and leasing assets in the energy, power and utilities sectors, which totaled $1.4 billion, or 2.5% of total financ-ing and leasing assets at December 31, 2005. This amount includes approximately $853.5 million in project financing and $382.5 million in rail carson lease.
(6) Total exposure to manufacturers of automobile and related suppliers included in Manufacturing and Other was less than 1% of total financing and leas-ing assets at December 31, 2005.
NOTE 6 – RETAINED INTERESTS IN SECURITIZATIONS AND OTHER INVESTMENTS
Both retained interests in securitizations and other investments are designated as available for sale and shown in the following table.
December 31, (dollars in millions) 2005 2004_______________________ _______________________Retained interests in commercial loans:
Retained subordinated securities $ 426.8 $ 446.2
Interest-only strips 387.2 292.4
Cash reserve accounts 276.8 323.4______________ ______________Total retained interests in commercial loans 1,090.8 1,062.0______________ ______________
Retained interests in home lending consumer loans:
Retained subordinated securities 45.6 76.6
Interest-only strips – 17.0______________ ______________Total retained interests in consumer loans 45.6 93.6______________ ______________
Total retained interests in securitizations 1,136.4 1,155.6
Aerospace equipment trust certificates and other(1) 16.3 72.6______________ ______________Total $1,152.7 $1,228.2______________ ____________________________ ______________
(1) At December 31, 2004 other includes a $4.7 million investment in common stock received as part of a loan work-out of an aerospace account.

66 CIT GROUP INC 2005
CIT GROUP INC. AND SUBSIDIARIES – NOTES TO CONSOLIDATED FINANCIAL STATEMENTS
The following table summarizes the net accretion recognized in pretax earnings, the related impairment charges, and unrealized after-tax gains, reflected as a part of accumulated other comprehensive income.
Years Ended December 31, (dollars in millions) 2005 2004 2003_____________ _____________ _____________Net accretion in pre-tax earnings $62.5 $44.2 $81.5
Impairment charges, included in net accretion $39.4 $62.4 $66.6
Unrealized after tax gains $17.0 $ 8.4 $ 7.7
The prepayment speed, in the tables below, is based on ConstantPrepayment Rate, which expresses payments as a function of thedeclining amount of loans at a compound annual rate. Weightedaverage expected credit losses are expressed as annual loss rates.
The key assumptions used in measuring the retained interests atthe date of securitization for transactions completed during 2005(there were no consumer transactions during 2005) were as fol-lows:
Commercial Equipment____________________________________________Specialty Equipment
Finance Finance_______________ __________________Weighted average prepayment speed 39.19% 12.66%
Weighted average expected credit losses 0.34% 0.73%
Weighted average discount rate 7.88% 9.00%
Weighted average life (in years) 1.26 2.03
Key assumptions used in calculating the fair value of the retained interests in securitized assets by product type at December 31, 2005were as follows:
Commercial Equipment Consumer___________________________________________ ___________________________________________________Manufactured Recreational
Specialty Equipment Housing and Vehicle andFinance Finance Home Equity Boat_______________ __________________ _______________________ _____________________
Weighted average prepayment speed 22.09% 11.79% 28.09% 21.53%
Weighted average expected credit losses 0.94% 1.36% 2.14% 1.20%
Weighted average discount rate 7.71% 9.26% 13.10% 15.00%
Weighted average life (in years) 1.08 1.49 2.81 2.61
The impact of adverse changes to the key assumptions on the fair value of retained interests as of December 31, 2005 is shown in thefollowing table.
Consumer_____________________________________________Manufactured Recreational
Commercial Housing and Vehicle and(dollars in millions) Equipment Home Equity Boat_______________________ _____________________ ___________________Prepayment speed:
10 percent adverse change $ (14.8) $ (3.4) $ –
20 percent adverse change (28.4) (6.4) 0.1
Expected credit losses:
10 percent adverse change (7.1) (4.1) (0.1)
20 percent adverse change (14.2) (8.1) (0.2)
Weighted average discount rate:
10 percent adverse change (10.4) (1.1) (0.1)
20 percent adverse change (20.6) (2.1) (0.2)

CIT GROUP INC. AND SUBSIDIARIES – NOTES TO CONSOLIDATED FINANCIAL STATEMENTS
These sensitivities are hypothetical and should be used with cau-tion. Changes in fair value based on a 10 percent or 20 percentvariation in assumptions generally cannot be extrapolatedbecause the relationship of the change in assumptions to thechange in fair value may not be linear. Also, in this table, theeffect of a variation in a particular assumption on the fair value ofthe retained interest is calculated without changing any otherassumption. In reality, changes in one factor may result in
changes in another (for example, increases in market interestrates may result in lower prepayments and increased creditlosses), which might magnify or counteract the sensitivities.
The following table summarizes static pool credit losses, whichrepresent the sum of actual losses (life to date) and projectedfuture credit losses, divided by the original balance of each poolof the respective assets for the securitizations during the period.
Item 8: Financial Statements and Supplementary Data 67
Commercial Equipment Home EquitySecuritizations During: Securitizations During:____________________________________________________________ ____________________________________________________________
2005 2004 2003 2005 2004 2003____________ ____________ ____________ ____________ ____________ ____________Actual and projected losses at:
December 31, 2005 1.54% 1.08% 1.34% (1) (1) 3.00%
December 31, 2004 1.25% 1.52% (1) 2.78%
December 31, 2003 1.74% 3.07%
(1) There were no home equity securitizations during 2004 and 2005, because all home equity finance receivables were funded on balance sheet.
The table that follows summarizes the roll-forward of retained interest balances and certain cash flows received from and paid to securi-tization trusts.
Year Ended December 31, (dollars in millions) 2005 2004 2003_______________________ _______________________ _______________________Retained Interests
Retained interest at beginning of period $1,155.6 $1,309.3 $1,355.9
New sales 683.0 499.5 640.9
Distributions from trusts (797.6) (682.5) (728.6)
Change in fair value 13.7 1.2 (21.1)
Other, including net accretion, and clean-up calls 81.7 28.1 62.2_____________ ______________ ______________Retained interest at end of period $1,136.4 $1,155.6 $1,309.3_____________ ______________ ___________________________ ______________ ______________Cash Flows During the Periods
Proceeds from new securitizations $3,543.9 $3,870.4 $4,589.5
Other cash flows received on retained interests 788.4 719.0 688.2
Servicing fees received 67.8 80.3 80.2
Reimbursable servicing advances, net 12.9 (6.0) 7.3
Repurchases of delinquent or foreclosed assets and ineligible contracts (11.6) (16.1) (63.0)
Purchases of contracts through clean-up calls (320.5) (164.5) (439.8)
Guarantee draws (2.2) (3.2) (2.1)_____________ ______________ ______________Total, net $4,078.7 $4,479.9 $4,860.3_____________ ______________ ___________________________ ______________ ______________

The following table presents net charge-offs and accounts past due 60 days or more, on both an owned portfolio basis and managedreceivable basis.
At or for the Year Ended December 31, (dollars in millions) 2005 2004 2003_________________________________ _________________________________ ___________________________________Net Charge-offs of Average Finance Receivables
Commercial $ 197.9 0.63% $ 260.2 0.88% $ 494.7 1.79%
Consumer 53.2 0.52% 41.0 1.11% 27.2 1.53%___________ ___________ _____________Total $ 251.1 0.60% $ 301.2 0.91% $ 521.9 1.77%___________ ___________ ________________________ ___________ _____________
Net Charge-offs of Average Managed Receivables
Commercial $ 253.8 0.67% $ 349.2 0.96% $ 639.5 1.80%
Consumer 80.8 0.72% 60.7 1.17% 40.6 1.02%___________ ___________ _____________Total $ 334.6 0.68% $ 409.9 0.99% $ 680.1 1.72%___________ ___________ ________________________ ___________ _____________
Finance Receivables Past Due 60 Days or More
Commercial $ 440.0 1.43% $ 491.6 1.64% $ 587.6 2.05%
Consumer(1) 318.2 2.35% 116.4 2.27% 88.7 3.33%___________ ___________ _____________Total(1) $ 758.2 1.71% $ 608.0 1.73% $ 676.3 2.16%___________ ___________ ________________________ ___________ _____________
Managed Receivables Past Due 60 Days or More
Commercial $ 564.4 1.47% $ 650.6 1.69% $ 824.4 2.22%
Consumer(1) 401.0 2.71% 227.8 3.45% 197.6 4.22%___________ ___________ _____________Total(1) $ 965.4 1.81% $ 878.4 1.95% $1,022.0 2.44%___________ ___________ ________________________ ___________ _____________
(1) Excluding student lending, consumer finance receivables past due would have been $185.5 million (2.18%) while total finance receivables past duewould have been $625.5 million (1.59%) and consumer managed receivables past due would have been $268.3 million (2.82%) while total managedreceivables past due would have been $832.7 million (1.73%).
NOTE 7 – OTHER ASSETS
The following table presents the primary components of other assets.
December 31, (dollars in millions) 2005 2004______________________ ______________________Accrued interest and receivables from derivative counterparties $ 350.2 $ 390.0
Investments in and receivables from non-consolidated subsidiaries 549.8 719.5
Deposits on commercial aerospace flight equipment 317.4 333.1
Direct and private fund equity investments 30.2 181.0
Prepaid expenses 145.9 105.3
Repossessed assets and off-lease equipment 80.7 98.9
Furniture and fixtures, miscellaneous receivables and other assets 1,160.8 885.9_______________ ______________________$2,635.0 $2,713.7_______________ _____________________________________ ______________________
NOTE 8 – DEBT
The following table presents data on commercial paper borrowings.
December 31, (dollars in millions) 2005 2004______________________ ______________________Borrowings outstanding $5,225.0 $4,210.9
Weighted average interest rate 3.70% 2.55%
Weighted average number of days to maturity 47 days 45 days
68 CIT GROUP INC 2005
CIT GROUP INC. AND SUBSIDIARIES – NOTES TO CONSOLIDATED FINANCIAL STATEMENTS

CIT GROUP INC. AND SUBSIDIARIES – NOTES TO CONSOLIDATED FINANCIAL STATEMENTS
Item 8: Financial Statements and Supplementary Data 69
Year Ended December 31, (dollars in millions) 2005 2004 2003______________________ ______________________ ______________________Daily average borrowings $4,693.2 $4,831.3 $4,648.2
Maximum amount outstanding $5,914.0 $5,326.1 $4,999.1
Weighted average interest rate 3.45% 1.68% 1.25%
The consolidated weighted average interest rates on variable-ratesenior notes at December 31, 2005 and December 31, 2004were 4.43% and 2.63%, respectively. Fixed-rate senior debt out-standing at December 31, 2005 matures at various datesthrough 2015. The consolidated weighted-average interest rateson fixed-rate senior debt at December 31, 2005 and December31, 2004 were 5.16% and 5.53%, respectively. Foreign cur-rency-denominated debt (stated in U.S. Dollars) totaled$4,787.9 million at December 31, 2005, of which $4,025.7
million was fixed-rate and $762.2 million was variable-rate. Foreign currency-denominated debt (stated in U.S. Dollars)totaled $5,017.5 million at December 31, 2004, of which$4,335.4 million was fixed-rate and $682.1 million wasvariable-rate.
The following tables present total variable-rate and fixed-ratedebt.
(dollars in millions) Commercial Variable-rate December 31, December 31,Variable-Rate Debt Paper Senior Notes 2005 2004________________________________ ____________________ ______________________ _______________________ _______________________Due in 2005 $ – $ – $ – $ 7,566.3
Due in 2006 5,225.0 6,154.7 11,379.7 3,946.3
Due in 2007 – 5,318.6 5,318.6 3,169.0
Due in 2008 – 2,053.7 2,053.7 50.9
Due in 2009 – 751.2 751.2 836.0
Due in 2010 – 714.5 714.5 –
Due after 2010 – 492.4 492.4 187.4_______________ _________________ _________________ _________________Total $5,225.0 $15,485.1 $20,710.1 $15,755.9_______________ _________________ _________________ ________________________________ _________________ _________________ _________________
Fixed-Rate Term Debt____________________________________Due in 2005 $ – $ 4,589.4
Due in 2006 (rates ranging from 1.70% to 6.50%) 3,017.3 2,723.6
Due in 2007 (rates ranging from 2.35% to 7.38%) 3,994.0 3,907.6
Due in 2008 (rates ranging from 2.70% to 5.88%) 2,574.8 1,959.0
Due in 2009 (rates ranging from 3.35% to 6.88%) 1,400.1 1,378.3
Due in 2010 (rates ranging from 4.05% to 6.80%) 3,041.6 763.1
Due after 2010 (rates ranging from 3.80% to 7.75%) 8,825.8 6,394.1________________ ________________Total $22,853.6 $21,715.1________________ ________________________________ ________________
At December 31, 2005, $0.8 billion of unissued debt securitiesremained under a shelf registration statement. The followingtable represents information on unsecured committed lines of
credit at December 31, 2005, that can be drawn upon to sup-port U.S. commercial paper borrowings.
(dollars in millions)Expiration Total Drawn Available_________________ ________ ___________ ________________October 14, 2008(1) $2,100.0 $ – $2,100.0
April 14, 2009 2,100.0 – 2,100.0
April 13, 2010 2,100.0 – 2,100.0_______ ______ _______Total credit lines $6,300.0 $ – $6,300.0_______ ______ ______________ ______ _______(1) CIT has the ability to issue up to $400 million of letters of credit under the $2.1 billion facility expiring in 2008, which, if utilized, reduces available
borrowings under this facility.

70 CIT GROUP INC 2005
CIT GROUP INC. AND SUBSIDIARIES – NOTES TO CONSOLIDATED FINANCIAL STATEMENTS
The credit line agreements contain clauses that permit extensionsbeyond the expiration dates upon written consent from the par-ticipating lenders. In addition to the above lines, CIT hasundrawn, unsecured committed lines of credit of $146.5 million,which supports the Australia commercial paper program. Certainforeign operations utilize local financial institutions to fundoperations. At December 31, 2005, local credit facilities totaled$128.7 million, of which $58.4 million was undrawn and avail-able. During 2005 CIT also entered into a $750 million, fiveyear letter of credit facility, primarily in conjunction with the fac-toring business. As of December 31, 2005, $397 million wasundrawn and available under this facility.
Non-recourse secured borrowings – student lending
In February 2005, CIT acquired a student lending business(“Student Loan Xpress”), which is funded largely with EducationLoan Backed Notes. As Student Loan Xpress retains certain callfeatures with respect to the related assets (collateral), the transac-tions do not meet the SFAS 140 requirements for sales treatmentand are therefore recorded as secured borrowings. The outstand-ing non-recourse secured borrowings totaled $4.0 billion atDecember 31, 2005, of which $0.5 billion was due in 2006 andthe remaining due in 2011 and thereafter. The consolidatedweighted average interest rates on these secured borrowings atDecember 31, 2005 was 4.52%.
Preferred Capital Securities
In February 1997, CIT Capital Trust I (the “Trust”), a wholly-owned subsidiary of CIT, issued in a private offering $250.0million liquidation value of 7.70% Preferred Capital Securities(the “Capital Securities”), which were subsequently registeredwith the Securities and Exchange Commission pursuant to anexchange offer. Each capital security was recorded at the liquida-tion value of $1,000. The Trust subsequently invested the offer-ing proceeds in $250.0 million principal amount of JuniorSubordinated Debentures (the “Debentures”) of CIT, havingidentical rates and payment dates. The Debentures of CIT repre-sent the sole assets of the Trust. Holders of the Capital Securitiesare entitled to receive cumulative distributions at an annual rateof 7.70% through either the redemption date or maturity of theDebentures (February 15, 2027). Both the Capital Securitiesissued by the Trust and the Debentures of CIT owned by theTrust are redeemable in whole or in part on or after February 15,2007 or at any time in whole upon changes in specific tax legisla-tion, bank regulatory guidelines or securities law at the option ofCIT at their liquidation value or principal amount. The securi-ties are redeemable at a specified premium through February 15,2017, at which time the redemption price will be at par, plusaccrued interest. Distributions by the Trust are guaranteed byCIT to the extent that the Trust has funds available fordistribution.
(dollars in millions)
December 31, Hedge2005 2004 Hedged Item Classification_________ _________ _____________________________________________________________________________________ ______________________
Variable-rate to fixed-rate swaps
$3,260.2 $3,054.1 Cash flow variability related to forecasted commercial paper issuances Cash flow
4,935.2 479.5 Cash flow variability associated with specific variable-rate debt Cash flow_______ _______$8,195.4 $3,533.6_______ ______________ _______
CIT pays a fixed rate of interest and receives a variable rate of interest. These swaps hedge the cash flow variability associated with forecasted commercialpaper issuances and specific variable-rate debt.
Fixed-rate to variable-rate swaps
$10,320.1 $7,223.9 Specific fixed-rate debt Fair value
– 418.7 Cash flow variability associated with specific variable-rate assets Cash flow________ _______$10,320.1 $7,642.6________ _______________ _______
CIT pays a variable rate of interest and receives a fixed rate of interest. These swaps hedge specific fixed-rate debt instruments and the interest rate vari-ability associated with specific variable-rate assets.
In addition to the swaps in the table above, CIT had $2.0 bil-lion in notional amount of interest rate swaps outstanding withsecuritization trusts at December 31, 2005 to protect the trustsagainst interest rate risk. CIT entered into offsetting swap trans-
actions with third parties totaling $2.0 billion in notionalamount at December 31, 2005 to insulate the Company from the related interest rate risk.
NOTE 9 – DERIVATIVE FINANCIAL INSTRUMENTS
The following table presents the notional principal amounts of interest rate swaps by class and the corresponding hedged positions.

CIT GROUP INC. AND SUBSIDIARIES – NOTES TO CONSOLIDATED FINANCIAL STATEMENTS
Item 8: Financial Statements and Supplementary Data 71
The following table presents the maturity, notional principal amounts and the weighted average interest rates received or paid on U.S.dollar denominated interest rate swaps at December 31, 2005.
(dollars in millions)Maturity Floating to Fixed-rate Fixed to Floating-rateYears Ending Notional Receive Pay Notional Receive PayDecember 31, Amount Rate Rate Amount Rate Rate______________ _____________ ________ ______________ _____________ ________2006 $3,298.5 4.50% 4.61% $ 40.8 5.18% 6.83%
2007 1,956.3 4.52% 4.76% 637.7 5.53% 6.36%
2008 1,480.2 4.53% 4.71% 797.9 4.79% 5.08%
2009 172.7 4.50% 5.65% 1,300.0 4.47% 5.22%
2010 666.2 4.51% 5.24% 1,750.0 4.75% 4.64%
2011 – Thereafter 459.7 4.85% 5.87% 2,476.6 6.65% 5.83%_____________ _____________Total $8,033.6 $7,003.0_____________ __________________________ _____________
The following table presents the maturity, notional principal amounts and the weighted average interest rates received or paid, of for-eign currency denominated interest rate swaps at December 31, 2005.
Floating to Fixed-rate Fixed to Floating-rate(dollars in millions) Notional Receive Pay Notional Receive Pay MaturityForeign Currency Amount Rate Rate Amount Rate Rate Range______________ _____________ ________ ______________ _____________ ________ ______________Euro $ – – – $2,396.9 4.33% 3.28% 2011-2015
British Pound – – – 894.8 5.51% 5.20% 2008-2014
Japanese Yen – – – 25.4 3.25% 3.19% 2006
Canadian Dollar 94.5 3.33% 3.92% – – – 2009-2010
Australian Dollar 67.3 5.62% 5.49% – – – 2006-2009___________ _____________$161.8 $3,317.1___________ ________________________ _____________

72 CIT GROUP INC 2005
CIT GROUP INC. AND SUBSIDIARIES – NOTES TO CONSOLIDATED FINANCIAL STATEMENTS
Variable rates are based on the contractually determined rate orother market rate indices and may change significantly, affectingfuture cash flows.
The following table presents the notional principal amounts ofcross-currency swaps by class and the corresponding hedged positions.
(dollars in millions)December 31, Hedge
2005 2004 Hedged Item Classification Description________ ________ _____________________ ______________________ ___________________$2,623.0 $ 603.4 Foreign denominated Foreign currency CIT pays a U.S. variable rate of interest and receives a variable
debt fair value foreign rate of interest. These swaps hedge the fair valuechanges in foreign currency associated with specific foreigndenominated debt and are designated as foreign currency fairvalue hedges.
249.5 631.6 Foreign denominated Foreign currency CIT pays a U.S. fixed rate of interest and receives a fixed foreignfixed-rate debt cash flow rate of interest. These swaps hedge the currency cash flow vari-
ability associated with payments on specific foreign denomi-nated fixed-rate debt and are designated as foreign currencycash flow hedges.
100.0 157.6 Foreign currency Foreign currency CIT receives a U.S. fixed rate of interest and pays a fixed foreignloans to subsidiaries cash flow rate of interest. These swaps hedge the currency cash flow vari-
ability associated with payments on specific fixed-rate foreigndenominated inter-company receivables and are designated asforeign currency cash flow hedges.
5.3 36.5 Foreign currency Foreign currency CIT receives a U.S. variable rate of interest and pays a variableloans to subsidiaries fair value foreign rate of interest. These swaps hedge the fair value cur-
rency changes associated with specific foreign denominatedvariable-rate inter-company receivables and are designated asforeign currency fair value hedges.
– 418.7 Foreign currency Foreign currency CIT receives a U.S. fixed rate of interest and pays a fixed foreign equity investments net investment rate of interest. These swaps designated as net investmentin subsidiaries hedges of foreign denominated investments in subsidiaries._______ _______
$2,977.8 $1,847.8_______ ______________ _______
Foreign currency forward exchange contracts
CIT sells various foreign currencies forward. These contracts aredesignated as either cash flow hedges of specific foreign denomi-nated inter-company receivables or as net investment hedges offoreign denominated investments in subsidiaries. The followingtable presents the notional principal amounts of foreign cur-rency forward exchange contracts and the corresponding hedgedpositions.
(dollars in millions)December 31, Hedge
2005 2004 Hedged Item Classification________ ________ _____________________ ______________________$1,579.6 $1,611.7 Foreign currency Foreign currency
loans to subsidiaries cash flow
2,844.9 1,207.4 Foreign currency Foreign currency equity investments net investmentin subsidiaries
_______ _______$4,424.5 $2,819.1_______ ______________ _______
The following table presents the maturity and notional principalamounts of foreign currency hedges at December 31, 2005.
(dollars in millions)MaturityYears Ending Foreign Currency Cross-CurrencyDecember 31, Exchange Forwards Swaps_______________________ ________________________________ ___________2006 $1,745.1 $ 24.9
2007 2,174.0 16.5
2008 505.4 185.7
2009 – 603.4
2010 – 171.6
2011 – Thereafter – 1,975.7______________ ______________Total $4,424.5 $2,977.8______________ ____________________________ ______________
During the fourth quarter of 2005, CIT executed a variable tofixed-rate natural gas commodity swap. This swap hedges fore-casted cash flows associated with a specific energy investmentand is accounted for as a cash flow hedge. The mark-to-marketof this swap was a decrease in value of $2.62 million atDecember 31, 2005 with the effective portion of $2.57 millionrecorded in accumulated other comprehensive income.

CIT GROUP INC. AND SUBSIDIARIES – NOTES TO CONSOLIDATED FINANCIAL STATEMENTS
Item 8: Financial Statements and Supplementary Data 73
The table that follows summarizes economic hedges that do notqualify for hedge accounting under SFAS 133.
(dollars in millions)
December 31,2005 2004 Type of Swaps/Caps________ _________ _________________________________$ 118.0 $ 98.0 Credit default swaps
246.5 1,045.4 Compound cross-currency swaps
936.4 – U.S. dollar Interest rate swaps
6.8 24.3 Interest rate caps______________ ______________$1,307.7 $1,167.7______________ ___________________________ _____________
During 2005 and 2004, CIT entered into credit default swaps, with terms of 5 years, to economically hedge certain CIT creditexposures. The change in the fair value adjustment for the yearended December 31, 2005 amounted to a $6.1 million pretaxgain. CIT also has certain cross-currency swaps, certain U.S. dol-lar interest rate swaps, and interest rate caps that are economichedges of certain interest rate and foreign currency exposures.The mark-to-market adjustment relating to these derivatives forthe year ended December 31, 2005 including the gain on certaincompound cross-currency swaps that were terminated in 2005amounted to a $41.7 million pretax increase to earnings. SeeNote 25 – Selected Quarterly Financial Data and Item 9A.Controls and Procedures.
The components of the adjustment to Accumulated Other Comprehensive Income/Loss for derivatives qualifying as hedges of futurecash flows are presented in the following table.
Fair Value Income Tax Total Unrealized(dollars in millions) of Derivatives Effects Gain (Loss)________________________ ___________________ ___________________________Balance at December 31, 2003 – unrealized loss $(64.6) $ 23.3 $(41.3)
Changes in values of derivatives qualifying as cash flow hedges 23.3 (9.1) 14.2__________ _________ __________Balance at December 31, 2004 – unrealized loss (41.3) 14.2 (27.1)
Changes in values of derivatives qualifying as cash flow hedges 89.7 (35.0) 54.7__________ _________ __________Balance at December 31, 2005 – unrealized gain $ 48.4 $(20.8) $ 27.6__________ _________ ____________________ _________ __________
The unrealized gain as of and for the year ended December 31,2005 reflects higher market interest rates since the inception ofthe hedges. The Accumulated Other Comprehensive Income(along with the corresponding swap asset or liability) will beadjusted as market interest rates change over the remaining livesof the swaps. Assuming no change in interest rates, approxi-mately $3.8 million, net of tax, of the Accumulated OtherComprehensive Income as of December 31, 2005 is expected tobe reclassified to earnings over the next twelve months as con-tractual cash payments are made.
Hedge ineffectiveness occurs in certain cash flow hedges, and isrecorded as either an increase or decrease to interest expense aspresented in the following table.
Increase/Decrease to
(dollars in millions) Ineffectiveness Interest Expense_________________________ ____________________________Year ended December 31, 2005 $1.5 Increase
Year ended December 31, 2004 $1.4 Decrease
Year ended December 31, 2003 $0.2 Decrease
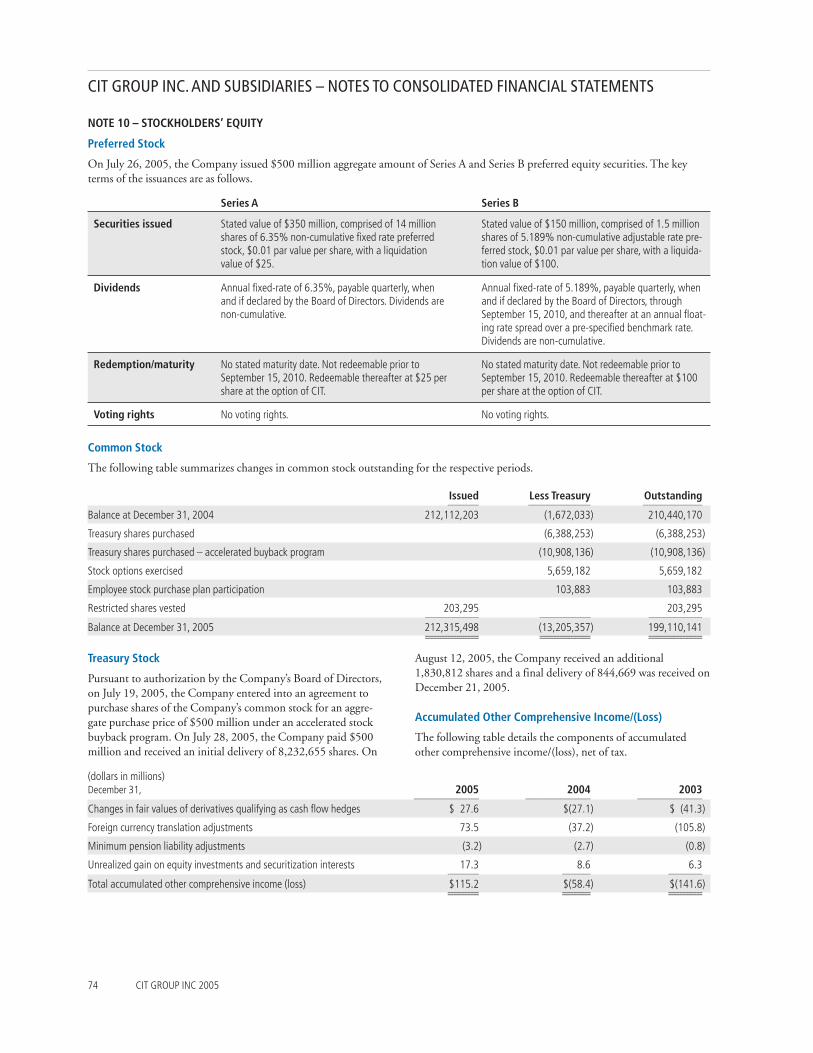
74 CIT GROUP INC 2005
CIT GROUP INC. AND SUBSIDIARIES – NOTES TO CONSOLIDATED FINANCIAL STATEMENTS
NOTE 10 – STOCKHOLDERS’ EQUITY
Preferred Stock
On July 26, 2005, the Company issued $500 million aggregate amount of Series A and Series B preferred equity securities. The keyterms of the issuances are as follows.
Series A Series B
Securities issued Stated value of $350 million, comprised of 14 millionshares of 6.35% non-cumulative fixed rate preferredstock, $0.01 par value per share, with a liquidationvalue of $25.
Stated value of $150 million, comprised of 1.5 millionshares of 5.189% non-cumulative adjustable rate pre-ferred stock, $0.01 par value per share, with a liquida-tion value of $100.
Dividends Annual fixed-rate of 6.35%, payable quarterly, whenand if declared by the Board of Directors. Dividends arenon-cumulative.
Annual fixed-rate of 5.189%, payable quarterly, whenand if declared by the Board of Directors, throughSeptember 15, 2010, and thereafter at an annual float-ing rate spread over a pre-specified benchmark rate.Dividends are non-cumulative.
Redemption/maturity No stated maturity date. Not redeemable prior toSeptember 15, 2010. Redeemable thereafter at $25 pershare at the option of CIT.
No stated maturity date. Not redeemable prior toSeptember 15, 2010. Redeemable thereafter at $100per share at the option of CIT.
Voting rights No voting rights. No voting rights.
Common Stock
The following table summarizes changes in common stock outstanding for the respective periods.
Issued Less Treasury Outstanding___________ ______________________ _____________________Balance at December 31, 2004 212,112,203 (1,672,033) 210,440,170
Treasury shares purchased (6,388,253) (6,388,253)
Treasury shares purchased – accelerated buyback program (10,908,136) (10,908,136)
Stock options exercised 5,659,182 5,659,182
Employee stock purchase plan participation 103,883 103,883
Restricted shares vested 203,295 203,295___________________ __________________ ___________________Balance at December 31, 2005 212,315,498 (13,205,357) 199,110,141___________________ __________________ ______________________________________ __________________ ___________________
Treasury Stock
Pursuant to authorization by the Company’s Board of Directors,on July 19, 2005, the Company entered into an agreement topurchase shares of the Company’s common stock for an aggre-gate purchase price of $500 million under an accelerated stockbuyback program. On July 28, 2005, the Company paid $500million and received an initial delivery of 8,232,655 shares. On
August 12, 2005, the Company received an additional1,830,812 shares and a final delivery of 844,669 was received onDecember 21, 2005.
Accumulated Other Comprehensive Income/(Loss)
The following table details the components of accumulatedother comprehensive income/(loss), net of tax.
(dollars in millions)December 31, 2005 2004 2003_______________________ _______________________ _______________________Changes in fair values of derivatives qualifying as cash flow hedges $ 27.6 $(27.1) $ (41.3)
Foreign currency translation adjustments 73.5 (37.2) (105.8)
Minimum pension liability adjustments (3.2) (2.7) (0.8)
Unrealized gain on equity investments and securitization interests 17.3 8.6 6.3___________ __________ ____________Total accumulated other comprehensive income (loss) $115.2 $(58.4) $(141.6)___________ __________ _______________________ __________ ____________

CIT GROUP INC. AND SUBSIDIARIES – NOTES TO CONSOLIDATED FINANCIAL STATEMENTS
(dollars in millions, except per share amounts, Income Shares Per Sharewhich are in whole dollars, shares in thousands) (Numerator) (Denominator) Amount____________________ ________________________ ______________Year Ended December 31, 2005
Basic EPS:
Income available to common stockholders $936.4 206,059 $4.54
Effect of Dilutive Securities:
Restricted shares – 1,706
Stock options – 2,969___________ _____________Diluted EPS $936.4 210,734 $4.44___________ ________________________ _____________Year Ended December 31, 2004
Basic EPS:
Income available to common stockholders $753.6 211,017 $3.57
Effect of Dilutive Securities:
Restricted shares – 764
Stock options – 3,273___________ _____________Diluted EPS $753.6 215,054 $3.50___________ ________________________ _____________Year Ended December 31, 2003
Basic EPS:
Income available to common stockholders $566.9 211,681 $2.68
Effect of Dilutive Securities:
Restricted shares – 396
Stock options – 1,066___________ _____________Diluted EPS $566.9 213,143 $2.66___________ ________________________ _____________
Item 8: Financial Statements and Supplementary Data 75
During the year ended December 31, 2005, $87.4 million oftax benefits, net of foreign currency translation losses relatingto foreign currency net investments and related hedging trans-actions, were recorded in the foreign currency translationcomponent of equity, with offsetting amounts recorded inother assets and liabilities. These adjustments followed thecompletion of remediation and enhancements in internal con-
trols, including additional proof and control procedures, withrespect to income tax and foreign currency accounting.
NOTE 11 – EARNINGS PER SHARE
The reconciliation of the numerator and denominator of basicEPS with that of diluted EPS is presented.

NOTE 12 – OTHER REVENUE
The following table sets forth the components of other revenue.
(dollars in millions)Years Ended December 31, 2005 2004 2003______________ ___________ ___________Fees and other income $ 637.0 $518.6 $586.2
Factoring commissions 235.7 227.0 189.8
Gains on sales of equipment 91.9 101.6 70.7
Gains on securitizations 39.1 59.1 100.9
Gain on sale of real estate investment (1) 115.0 – –
Gain on sale of business aircraft (2) 22.0 – –
Gain on sale of micro-ticket leasing business unit (3) 44.3 – –
Charge related to aircraft held for sale (4) (86.6) – –
Charges related to manufactured housing assets held for sale (5) (20.0) (15.7) –
Gain on derivatives (6) 43.1 – –
Gain (loss) on venture capital investments 15.9 (3.5) (88.3)______________ ___________ ___________Total other revenue $1,137.4 $887.1 $859.3______________ ___________ _________________________ ___________ ___________
(1) The gain resulted from the sale of an interest in Waterside Plaza, a residential complex in New York City.(2) The gain resulted from the sale of approximately $900 million of the business aircraft portfolio.
(3) The gain resulted from the sale of the micro-ticket leasing point-of-sale unit, which included approximately $295 million of equipment leases.
(4) The charge resulted from placing approximately $190 million of certain older, out-of- production commercial, regional and business aircraft as held forsale and marking the assets to an estimated fair value.
(5) The charges resulted from classifying approximately $125 million and $300 million of manufactured housing loans as held for sale in 2005 and 2004and marking the loans to an estimated fair value. The $300 million in loans were sold in the first quarter of 2005 while $91 million of the $125 millionwas sold during the fourth quarter of 2005.
(6) The gain on derivatives relates to the mark-to-market of specific cross-currency swaps that did not qualify for hedge accounting treatment.
NOTE 13 – SALARIES AND GENERAL OPERATING EXPENSES
The following table sets forth the components of salaries and general operating expenses.
(dollars in millions)Years Ended December 31, 2005 2004 2003______________ _____________ ___________Salaries and employee benefits $ 695.8 $ 612.2 $529.6
Other operating expenses 418.0 399.9 358.6______________ _____________ ___________Total $1,113.8 $1,012.1 $888.2______________ _____________ _________________________ _____________ ___________
NOTE 14 – INCOME TAXES
The effective tax rate varied from the statutory federal corporate income tax rate as follows:
Percentage of Pretax IncomeYears Ended December 31, 2005 2004 2003______________ ___________ ___________Federal income tax rate 35.0% 35.0% 35.0%
Increase (decrease) due to:State and local income taxes, net offederal income tax benefit 3.1 3.2 3.7
Tax on global operations (2.1) 1.4 1.0
Other (3.2) (0.6) (0.7)__________ __________ __________Effective tax rate 32.8% 39.0% 39.0%__________ __________ ____________________ __________ __________
76 CIT GROUP INC 2005
CIT GROUP INC. AND SUBSIDIARIES – NOTES TO CONSOLIDATED FINANCIAL STATEMENTS

CIT GROUP INC. AND SUBSIDIARIES – NOTES TO CONSOLIDATED FINANCIAL STATEMENTS
Item 8: Financial Statements and Supplementary Data 77
The provision for income taxes is comprised of the following.
Years Ended December 31, (dollars in millions) 2005 2004 2003___________ ___________ ___________Current federal income tax provision $ 20.4 $ 1.5 $ –
Deferred federal income tax provision 295.7 321.0 265.1___________ ___________ ___________Total federal income taxes 316.1 322.5 265.1
State and local income taxes 69.7 69.1 53.5
Foreign income taxes 78.4 91.6 46.4___________ ___________ ___________Total provision for income taxes $464.2 $483.2 $365.0___________ ___________ ______________________ ___________ ___________
The tax effects of temporary differences that give rise to significant portions of the deferred income tax assets and liabilities are pre-sented below. Certain 2004 balances have been conformed to the current period presentation.
December 31, (dollars in millions) 2005 2004______________________ _______________________Assets:
Net operating loss carryforwards $ 428.2 $ 712.8
Provision for credit losses 216.8 208.5
Alternative minimum tax credits 162.0 142.0
Accrued liabilities and reserves 89.8 80.2
Other 171.4 177.7______________ ______________Total deferred tax assets 1,068.2 1,321.2______________ ______________
Liabilities:
Operating leases (968.4) (930.0)
Leveraged leases (483.7) (501.2)
Loans and direct financing leases (287.5) (327.6)
Securitizations (173.4) (259.4)
Joint ventures (74.1) (72.4)
Other (57.1) (33.1)______________ ______________Total deferred tax liabilities (2,044.2) (2,123.7)______________ ______________
Net deferred tax (liability) $ (976.0) $ (802.5)______________ ____________________________ ______________
At December 31, 2005, CIT had U.S. federal net operatinglosses of approximately $850 million, which expire in variousyears beginning in 2011. In addition, CIT has a deferred taxasset of approximately $131.5 million related to various statenet operating losses that will expire in various years beginning in2006. Federal and state operating losses may be subject toannual use limitations under section 382 of the InternalRevenue Code of 1986, as amended, and other limitationsunder certain state laws. Management believes that CIT will
have sufficient taxable income in future years and can avail itselfof tax planning strategies in order to fully utilize the federallosses. Accordingly, CIT does not believe a valuation allowanceis required with respect to these federal net operating losses.Based on management’s assessment as to realizability, the netdeferred tax liability includes a valuation allowance of approxi-mately $19.0 million and $7.4 million relating to state net oper-ating losses at December 31, 2005 and 2004.

78 CIT GROUP INC 2005
CIT GROUP INC. AND SUBSIDIARIES – NOTES TO CONSOLIDATED FINANCIAL STATEMENTS
NOTE 15 – RETIREMENT, OTHER POSTRETIREMENT ANDOTHER BENEFIT PLANS
Retirement and Postretirement Medical and LifeInsurance Benefit Plans
CIT has a number of funded and unfunded noncontributorydefined benefit pension plans covering certain of its U.S. andnon-U.S. employees, each of which is designed in accordancewith the practices and regulations in the countries concerned.Retirement benefits under the defined benefit pension plans arebased on the employee’s age, years of service and qualifying com-pensation. CIT’s funding policy is to make contributions to theextent such contributions are not less than the minimumrequired by applicable laws and regulations, are consistent withour long-term objective of ensuring sufficient funds to financefuture retirement benefits, and are tax deductible as actuariallydetermined. Contributions are charged to the salaries andemployee benefits expense on a systematic basis over the expectedaverage remaining service period of employees expected toreceive benefits.
The largest plan is the CIT Group Inc. Retirement Plan (the“Plan”), which accounts for 78% of the total benefit obligation atDecember 31, 2005. The Plan covers U.S. employees of CITwho have completed one year of service and have attained the ageof 21. The Company also maintains a Supplemental RetirementPlan for employees whose benefit in the Plan is subject toInternal Revenue Code limitations.
The Plan has a “cash balance” formula that became effectiveJanuary 1, 2001, at which time certain eligible members had theoption of remaining under the Plan formula as in effect prior toJanuary 1, 2001. Under the cash balance formula, each member’saccrued benefits as of December 31, 2000 were converted to alump sum amount, and every year thereafter, the balance is cred-ited with a percentage (5% to 8% depending on years of service)of the member’s “Benefits Pay” (comprised of base salary, pluscertain annual bonuses, sales incentives and commissions). Thesebalances also receive annual interest credits, subject to certaingovernment limits. The interest credit was 4.88%, 5.11%, and
5.01% for the plan years ended December 31, 2005, 2004, and2003, respectively. Upon termination or retirement after fiveyears of employment, the amount credited to a member is to bepaid in a lump sum or converted into an annuity at the option ofthe member.
CIT also provides certain healthcare and life insurance benefitsto eligible retired U.S. employees. For most eligible retirees, thehealthcare benefit is contributory and the life insurance benefit isnoncontributory. Salaried participants generally become eligiblefor retiree healthcare benefits upon completion of ten years ofcontinuous service after attaining age 50. Individuals hired priorto November 1999 become eligible for postretirement benefitsafter 11 years of continuous CIT service after age 44. Generally,the medical plan pays a stated percentage of most medicalexpenses, reduced by a deductible as well as by payments madeby government programs and other group coverage. The retireehealth care benefit includes a limit on CIT’s share of costs for allemployees who retired after January 31, 2002. The plans arefunded on a pay as you go basis.
The discount rate assumptions used for pension and postretire-ment benefit plan accounting reflect the prevailing rates availableon high-quality, fixed-income debt instruments with maturitiesthat match the benefit obligation. The rate of compensation usedin the actuarial model for pension accounting is based upon theCompany’s long-term plans for such increases, taking intoaccount both market data and historical pay increases.
The disclosure and measurement dates included in this report forthe Retirement and Postretirement Medical and Life InsurancePlans are December 31, 2005, 2004, and 2003.
The following tables set forth the change in benefit obligation,plan assets and funded status of the retirement plans as well asthe net periodic benefit cost. All periods presented includeamounts and assumptions relating to the Plan, the SupplementalRetirement Plan, an Executive Retirement Plan and variousinternational plans.

CIT GROUP INC. AND SUBSIDIARIES – NOTES TO CONSOLIDATED FINANCIAL STATEMENTS
Item 8: Financial Statements and Supplementary Data 79
Retirement Benefits (dollars in millions)
For the years ended December 31, 2005 2004 2003___________ ___________ ___________Change in Benefit Obligation
Benefit obligation at beginning of period $314.5 $273.0 $225.2
Service cost 19.6 17.7 15.6
Interest cost 17.1 15.6 14.4
Actuarial loss 3.3 18.0 23.9
Benefits paid (5.9) (5.1) (4.6)
Plan settlements and curtailments (18.2) (6.2) (4.5)
Termination benefits 2.3 – –
Currency translation adjustment (2.2) 1.5 2.2
Other – – 0.8 ___________ ___________ ___________Benefit obligation at end of period $330.5 $314.5 $273.0 ___________ ___________ ______________________ ___________ ___________Change in Plan Assets
Fair value of plan assets at beginning of period $250.6 $212.8 $123.1
Actual return on plan assets 20.5 25.5 28.7
Employer contributions 26.1 23.0 69.4
Plan settlements (18.0) (6.2) (4.5)
Benefits paid (5.9) (5.1) (4.6)
Currency translation adjustment (1.2) 0.6 0.7 ___________ ___________ ___________Fair value of plan assets at end of period $272.1 $250.6 $212.8 ___________ ___________ ______________________ ___________ ___________Reconciliation of Funded Status
Funded status $ (58.4) $ (63.9) $ (60.2)
Unrecognized net actuarial loss 62.0 63.9 57.8
Unrecognized prior service cost – – – ___________ ___________ ___________Net amount recognized $ 3.6 $ – $ (2.4)___________ ___________ ______________________ ___________ ___________Amounts Recognized in the Consolidated Balance Sheets
Prepaid benefit cost $ 52.9 $ 51.3 $ 45.2
Accrued benefit liability (53.8) (55.1) (48.9)
Intangible asset – – –
Accumulated other comprehensive income 4.5 3.8 1.3 ___________ ___________ ___________Net amount recognized $ 3.6 $ – $ (2.4)___________ ___________ ______________________ ___________ ___________Weighted-average Assumptions Used to Determine Benefit Obligations at Period End
Discount rate 5.67% 5.70% 5.96%
Rate of compensation increase 4.25% 4.25% 4.26%
Weighted-average Assumptions Used to Determine Net Periodic Pension Cost for Periods
Discount rate 5.69% 5.96% 6.45%
Rate of compensation increase 4.25% 4.26% 4.24%
Expected long-term return on plan assets 7.93% 7.95% 7.92%
Components of Net Periodic Benefit CostService cost $ 19.6 $ 17.7 $ 15.6
Interest cost 17.1 15.6 14.4
Expected return on plan assets (19.2) (16.2) (9.4)
Amortization of net loss 2.8 2.8 3.5
Amortization of prior service cost – – –
Settlement and Curtailment loss 0.4 – –
Termination benefits 2.3 – – ___________ ___________ ___________Total net periodic expense $ 23.0 $ 19.9 $ 24.1 ___________ ___________ ______________________ ___________ ___________

80 CIT GROUP INC 2005
CIT GROUP INC. AND SUBSIDIARIES – NOTES TO CONSOLIDATED FINANCIAL STATEMENTS
Expected long-term rate of return assumptions for pension assetsare based on projected asset allocation and historical andexpected future returns for each asset class. Independent analysisof historical and projected asset class returns, inflation and inter-est rates are provided by our investment consultants andreviewed as part of the process to develop our assumptions.
The accumulated benefit obligation for all defined benefit pen-sion plans was $286.8 million, $271.2 million, and $232.4 mil-
lion, at December 31, 2005, 2004, and 2003, respectively. Planswith accumulated benefit obligations in excess of plan assetsrelate primarily to non-qualified U.S. plans and certain interna-tional plans. The Company decided not to fund certain of itsnon-US plans that had unfunded positions to the AccumulatedBenefit Obligation (“ABO”) level, and as a result, recorded anAML (additional minimum liability) adjustment of $0.7 million,in accordance with FAS 87.
Retirement Benefits (dollars in millions)
For the years ended December 31, 2005 2004 2003___________ ___________ ___________Expected Future Cashflows
Expected Company Contributions in the following fiscal year $ 3.5 $ 4.0
Expected Benefit Payments
1st Year following the disclosure date $ 24.2 $ 22.7
2nd Year following the disclosure date $ 14.4 $ 13.5
3rd Year following the disclosure date $ 14.2 $ 18.7
4th Year following the disclosure date $ 16.0 $ 14.0
5th Year following the disclosure date $ 16.4 $ 16.6
Years 6 thru 10 following the disclosure date $120.3 $106.6
Pension Plan Weighted-average Asset Allocations
Equity securities 65.7% 59.7% 67.6%
Debt securities 28.3% 36.0% 32.1%
Real estate – – –
Other 6.0% 4.3% 0.3%___________ ___________ ___________Total pension assets 100.0% 100.0% 100.0%___________ ___________ ______________________ ___________ ___________Information for Pension Plans with an Accumulated Benefit Obligation in Excess of Plan Assets
Projected benefit obligation $ 71.6 $ 74.2 $ 61.2
Accumulated benefit obligation 57.0 59.0 47.4
Fair value of plan assets 10.9 9.9 7.1
Additional Information
(Decrease) increase in Minimum Liability Included in Other Comprehensive Income $ 0.7 $ 2.5 $ (32.3)
CIT maintains a “Statement of Investment Policies andObjectives” which specifies investment guidelines pertaining tothe investment, supervision and monitoring of pension assets soas to ensure consistency with the long-term objective of ensuringsufficient funds to finance future retirement benefits. The policyasset allocation guidelines allow for assets to be invested between50% to 70% in Equities and 30% to 50% in Fixed-Incomeinvestments. The policy provides specific guidance related toasset class objectives, fund manager guidelines and identificationof both prohibited and restricted transactions, and is reviewed ona periodic basis by both the Employee Benefits Plans Committee
of CIT and the Plans’ external investment consultants to ensurethe long-term investment objectives are achieved. Members ofthe Committee are appointed by the Chief Executive Officer ofCIT and include the Chief Executive Officer, Chief FinancialOfficer, General Counsel, and other senior executives.
There were no direct investment in equity securities of CIT or itssubsidiaries included in the pension plan assets at December 31,2005, 2004, and 2003, respectively. CIT expects to contribute$3.5 million to its pension plans and $4.7 million to its otherpostretirement benefit plans in 2006.

CIT GROUP INC. AND SUBSIDIARIES – NOTES TO CONSOLIDATED FINANCIAL STATEMENTS
Item 8: Financial Statements and Supplementary Data 81
The following tables set forth data relating to postretirement plans.
Postretirement Benefits (dollars in millions)
For the years ended December 31, 2005 2004 2003___________ ___________ ___________Change in Benefit Obligation
Benefit obligation at beginning of period $ 59.9 $ 58.0 $ 48.1
Service cost 2.2 1.9 1.5
Interest cost 3.2 3.2 3.0
Actuarial loss 3.7 0.7 9.6
Employee contributions 1.0 0.8 –
Benefits paid (6.8) (4.7) (4.2)
Plan amendments (0.8) – – ___________ ___________ ___________Benefit obligation at end of period $ 62.4 $ 59.9 $ 58.0 ___________ ___________ ______________________ ___________ ___________Change in Plan Assets
Fair value of plan assets at beginning of period $ – $ – $ –
Benefits paid (6.8) (4.7) (4.2)
Employee contributions 1.0 0.8 –
Employer contributions 5.8 3.9 4.2 ___________ ___________ ___________Fair value of plan assets at end of period $ – $ – $ – ___________ ___________ ______________________ ___________ ___________Reconciliation of Funded Status
Funded status $ (62.4) $ (59.9) $ (58.0)
Unrecognized prior service cost (0.8) – –
Unrecognized net actuarial loss 18.4 15.6 15.5 ___________ ___________ ___________Accrued cost $ (44.8) $ (44.3) $ (42.5)___________ ___________ ______________________ ___________ ___________Amounts Recognized in the Consolidated Balance Sheets
Prepaid benefit cost $ – $ – $ –
Accrued benefit liability (44.8) (44.3) (42.5)
Intangible asset – – –
Accumulated other comprehensive income – – – ___________ ___________ ___________Net amount recognized $ (44.8) $ (44.3) $ (42.5)___________ ___________ ______________________ ___________ ___________Weighted-average Assumptions Used to Determine Benefit Obligations at Period End
Discount rate 5.50% 5.50% 6.00%
Rate of compensation increase 4.25% 4.25% 4.25%
Weighted-average Assumptions Used to Determine Net Periodic Benefit Cost for periods
Discount rate 5.50% 6.00% 6.50%
Rate of compensation increase 4.25% 4.25% 4.25%
Components of Net Periodic Benefit Cost
Service cost $ 2.2 $ 1.9 $ 1.5
Interest cost 3.2 3.2 3.0
Amortization of prior service cost – – –
Amortization of net loss 0.9 0.6 0.1 ___________ ___________ ___________Total net periodic expense $ 6.3 $ 5.7 $ 4.6 ___________ ___________ ______________________ ___________ ___________Assumed Health Care Trend Rates at Period End
Health care cost trend rate assumed for next year Pre-65 11.50% 12.00% 12.00%
Post-65 9.75% 10.00% 12.00%
Rate to which the cost trend rate is assumed to decline (the ultimate trend rate) 5.00% 5.00% 5.00%
Year that the rate reaches the ultimate trend rate 2018 2018 2018

82 CIT GROUP INC 2005
CIT GROUP INC. AND SUBSIDIARIES – NOTES TO CONSOLIDATED FINANCIAL STATEMENTS
Assumed healthcare cost trend rates have a significant effect onthe amounts reported for the healthcare plans. The Companyrelies on both external and historical data to determine health-
care trend rates. A one-percentage point change in assumedhealthcare cost trend rates would have the following estimatedeffects.
Postretirement Benefits (dollars in millions)
For the years ended December 31, 2005 2004 2003___________ ___________ ___________Effect of One-percentage Point Increase on:
Period end postretirement benefit obligation $ 2.6 $ 2.8 $ 2.7
Total of service and interest cost components $ 0.2 $ 0.2 $ 0.1
Effect of One-percentage Point Decrease on:
Period end postretirement benefit obligation $(2.3) $(2.7) $(2.6)
Total of service and interest cost components $(0.1) $(0.2) $(0.1)
The Medicare Prescription Drug, Improvement andModernization Act of 2003 introduced a prescription drug ben-efit under Medicare (Medicare Part D) as well as a federal subsidyto sponsors of retiree healthcare benefit plans that provide a ben-efit that is at least actuarially equivalent to Medicare Part D. Inaccordance with FASB Staff Position No. FAS 106-2,
“Accounting and Disclosure Requirements related to theMedicare Prescription Drug, Improvement and ModernizationAct of 2003”, CIT began prospective recognition of the effects ofthe subsidy in the third quarter 2004. Projected benefit paymentsand the effects of the Medicare Rx subsidy recognition are asfollows:
For the years ended December 31, 2005 2004___________ ___________Expected Future Cashflows:
Expected company contributions in the following fiscal year $ 4.7 $ 4.0
Expected Benefit Payments:
Gross
In the first year following the disclosure date $ 4.7 $ 4.0
In the second year following the disclosure date 4.9 4.2
In the third year following the disclosure date 5.0 4.5
In the fourth year following the disclosure date 5.2 4.7
In the fifth year following the disclosure date 5.2 4.8
In years six through ten following the disclosure date 27.6 24.2
Medicare Rx Subsidy
In the first year following the disclosure date $ – $ –
In the second year following the disclosure date 0.4 0.3
In the third year following the disclosure date 0.5 0.4
In the fourth year following the disclosure date 0.5 0.4
In the fifth year following the disclosure date 0.6 0.4
In years six through ten following the disclosure date 3.2 1.8
Net
In the first year following the disclosure date $ 4.7 $ 4.0
In the second year following the disclosure date 4.5 3.9
In the third year following the disclosure date 4.5 4.1
In the fourth year following the disclosure date 4.7 4.3
In the fifth year following the disclosure date 4.6 4.4
In years six through ten following the disclosure date 24.4 22.4
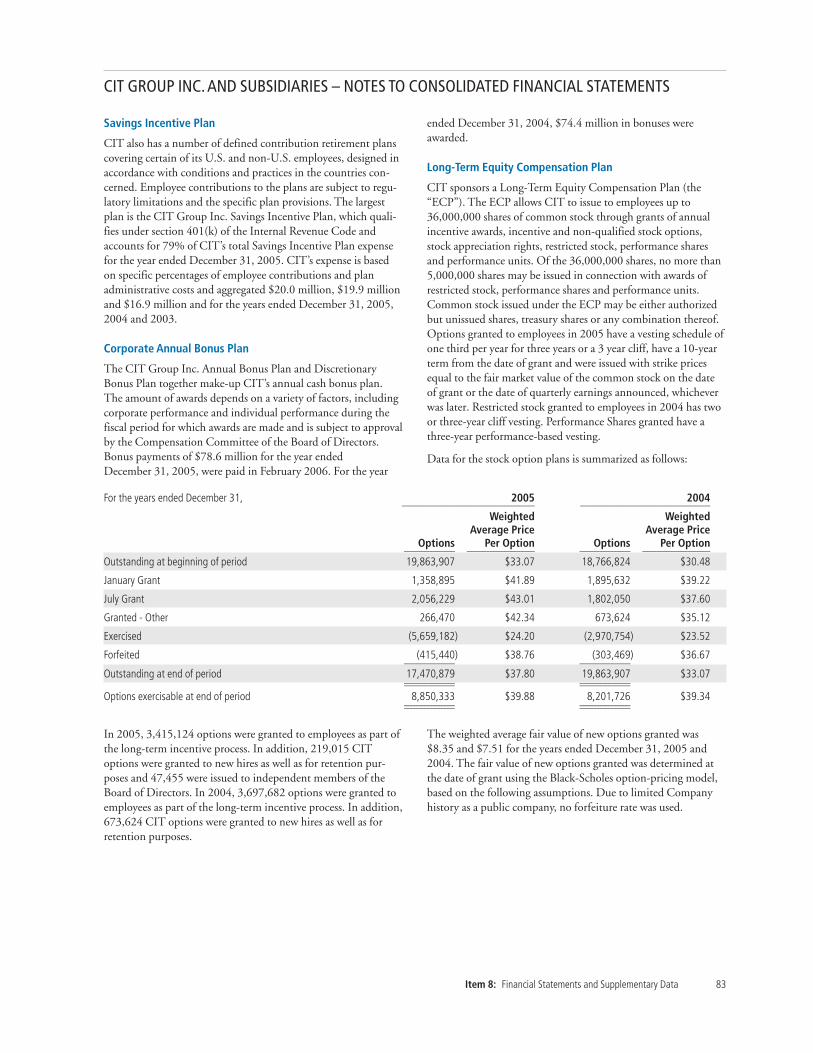
CIT GROUP INC. AND SUBSIDIARIES – NOTES TO CONSOLIDATED FINANCIAL STATEMENTS
Item 8: Financial Statements and Supplementary Data 83
For the years ended December 31, 2005 2004_______________________________________________ ______________________________________________Weighted Weighted
Average Price Average Price Options Per Option Options Per Option__________________ ________________________ __________________ ________________________
Outstanding at beginning of period 19,863,907 $33.07 18,766,824 $30.48
January Grant 1,358,895 $41.89 1,895,632 $39.22
July Grant 2,056,229 $43.01 1,802,050 $37.60
Granted - Other 266,470 $42.34 673,624 $35.12
Exercised (5,659,182) $24.20 (2,970,754) $23.52
Forfeited (415,440) $38.76 (303,469) $36.67__________________ __________________Outstanding at end of period 17,470,879 $37.80 19,863,907 $33.07__________________ ____________________________________ __________________Options exercisable at end of period 8,850,333 $39.88 8,201,726 $39.34__________________ ____________________________________ __________________
In 2005, 3,415,124 options were granted to employees as part ofthe long-term incentive process. In addition, 219,015 CIToptions were granted to new hires as well as for retention pur-poses and 47,455 were issued to independent members of theBoard of Directors. In 2004, 3,697,682 options were granted toemployees as part of the long-term incentive process. In addition,673,624 CIT options were granted to new hires as well as forretention purposes.
The weighted average fair value of new options granted was$8.35 and $7.51 for the years ended December 31, 2005 and2004. The fair value of new options granted was determined atthe date of grant using the Black-Scholes option-pricing model,based on the following assumptions. Due to limited Companyhistory as a public company, no forfeiture rate was used.
Savings Incentive Plan
CIT also has a number of defined contribution retirement planscovering certain of its U.S. and non-U.S. employees, designed inaccordance with conditions and practices in the countries con-cerned. Employee contributions to the plans are subject to regu-latory limitations and the specific plan provisions. The largestplan is the CIT Group Inc. Savings Incentive Plan, which quali-fies under section 401(k) of the Internal Revenue Code andaccounts for 79% of CIT’s total Savings Incentive Plan expensefor the year ended December 31, 2005. CIT’s expense is basedon specific percentages of employee contributions and planadministrative costs and aggregated $20.0 million, $19.9 millionand $16.9 million and for the years ended December 31, 2005,2004 and 2003.
Corporate Annual Bonus Plan
The CIT Group Inc. Annual Bonus Plan and DiscretionaryBonus Plan together make-up CIT’s annual cash bonus plan.The amount of awards depends on a variety of factors, includingcorporate performance and individual performance during thefiscal period for which awards are made and is subject to approvalby the Compensation Committee of the Board of Directors.Bonus payments of $78.6 million for the year endedDecember 31, 2005, were paid in February 2006. For the year
ended December 31, 2004, $74.4 million in bonuses wereawarded.
Long-Term Equity Compensation Plan
CIT sponsors a Long-Term Equity Compensation Plan (the“ECP”). The ECP allows CIT to issue to employees up to36,000,000 shares of common stock through grants of annualincentive awards, incentive and non-qualified stock options,stock appreciation rights, restricted stock, performance sharesand performance units. Of the 36,000,000 shares, no more than5,000,000 shares may be issued in connection with awards ofrestricted stock, performance shares and performance units.Common stock issued under the ECP may be either authorizedbut unissued shares, treasury shares or any combination thereof.Options granted to employees in 2005 have a vesting schedule ofone third per year for three years or a 3 year cliff, have a 10-yearterm from the date of grant and were issued with strike pricesequal to the fair market value of the common stock on the dateof grant or the date of quarterly earnings announced, whicheverwas later. Restricted stock granted to employees in 2004 has twoor three-year cliff vesting. Performance Shares granted have athree-year performance-based vesting.
Data for the stock option plans is summarized as follows:

84 CIT GROUP INC 2005
CIT GROUP INC. AND SUBSIDIARIES – NOTES TO CONSOLIDATED FINANCIAL STATEMENTS
Risk FreeExpected Average Expected Interest
Option Issuance Option Life Range Dividend Yield Volatility Range Rate Range______________________________ ________________________ _____________________________ _______________________2005
January, 2005 3-5 Years 1.53% 18.0% – 20.6% 3.42% – 3.72%
January, 2005 — Director Grant 10 Years 1.53% 21.5% 4.21%
January, 2005 — Section 16b (named officers) 5.5-6.5 Years 1.53% 21.4% – 22.1% 3.78% – 3.91%
February, 2005 3-5 Years 1.58% 18.0% – 20.6% 3.63% – 3.87%
March, 2005 — Section 16b (named officers) 5.5-6.5 Years 1.53% 21.4% – 22.1% 4.09% – 4.18%
April, 2005 3-5 Years 1.61% 17.9% – 20.3% 3.64% – 3.85%
May, 2005 3-5 Years 1.60% 17.9% – 20.3% 3.78% – 3.91%
May, 2005 — Director Grant 10 Years 1.60% 21.5% 4.21%
July, 2005 3-5 Years 1.49% 17.5% – 19.5% 3.93% – 3.99%
July, 2005 — Director Grant 10 Years 1.49% 21.40% 4.20%
July, 2005 — Section 16b (named officers) 5.5-6.5 Years 1.49% 19.9% – 21.2% 4.01% – 4.05%
October, 2005 3-5 Years 1.76% 15.6% – 19.2% 4.30% – 4.34%
October, 2005 — Director Grant 10 Years 1.76% 21.8% 4.49%
December, 2005 — Director Grant 10 Years 1.57% 21.8% 4.56%
2004
January, 2004 3-5 Years 1.22% 21.5% – 23.4% 2.20% – 3.02%
February, 2004 3-5 Years 1.33% 21.5% – 23.4% 2.16% – 2.98%
February, 2004 — Director Grant 10 Years 1.33% 22.4% 4.02%
April, 2004 5 Years 1.48% 23.3% 3.52%
May, 2004 5 Years 1.51% 23.3% 3.96%
May, 2004 — Director Grant 10 Years 1.51% 22.4% 4.83%
July, 2004 3-5 Years 1.38% 20.5% – 23.0% 3.10% – 3.72%
September, 2004 3-5 Years 1.41% 20.5% – 23.0% 2.83% – 3.38%
October, 2004 3-5 Years 1.42% 18.4% – 22.6% 2.78% – 3.26%
The following table summarizes information about stock options outstanding and options exercisable at December 31, 2005 and 2004.
Options Outstanding Options Exercisable_____________________________________________________________________ ___________________________________________Weighted Weighted Weighted
Average Average AverageNumber Contractual Exercise Number Exercise
Range of Exercise Price Outstanding Life Price Exercisable Price______________________ ____________________ ____________________ ____________________ ____________________
2005
$ 18.14 – $ 27.21 5,430,088 6.7 $ 22.31 3,442,824 $ 22.61
$ 27.22 – $ 40.83 5,924,823 7.7 $ 36.26 2,718,383 $ 35.66
$ 40.84 – $ 61.26 4,265,520 8.4 $ 44.26 838,678 $ 50.78
$ 61.27 – $ 91.91 1,720,626 2.3 $ 68.91 1,720,626 $ 68.91
$ 91.92 – $137.87 128,232 2.1 $130.89 128,232 $130.89
$137.88 – $206.82 1,590 2.4 $160.99 1,590 $160.99_________________ ________________17,470,879 8,850,333_________________ _________________________________ ________________
2004
$ 18.14 – $ 27.21 10,503,846 7.7 $ 22.35 4,076,055 $ 22.62
$ 27.22 – $ 40.83 6,608,016 8.7 $ 36.20 1,373,626 $ 34.66
$ 40.84 – $ 61.26 858,846 4.9 $ 51.24 858,846 $ 51.24
$ 61.27 – $ 91.91 1,758,648 3.3 $ 68.89 1,758,648 $ 68.89
$ 91.92 – $137.87 132,961 3.1 $131.01 132,961 $131.01
$137.88 – $206.82 1,590 3.4 $160.99 1,590 $160.99__________________ __________________19,863,907 8,201,726__________________ ____________________________________ __________________

CIT GROUP INC. AND SUBSIDIARIES – NOTES TO CONSOLIDATED FINANCIAL STATEMENTS
Item 8: Financial Statements and Supplementary Data 85
NOTE 16 – COMMITMENTS AND CONTINGENCIES
The accompanying table summarizes the contractual amounts of credit-related commitments and purchase and funding commitments.
December 31, 2005 2004_____________________________________________________________________________ ______________________Due to Expire___________________________________________
Within After Total Total(dollars in millions) One Year One Year Outstanding Outstanding_______________ ________________ ______________________ ______________________Credit Related Commitments
Financing and leasing assets $1,907.8 $8,524.2 $10,432.0 $8,428.3
Letters of credit and acceptances:
Standby letters of credit 452.8 117.5 570.3 618.3
Other letters of credit 474.9 2.4 477.3 588.3
Acceptances 20.1 – 20.1 16.4
Guarantees 194.6 11.9 206.5 133.1
Purchase and Funding Commitments
Aerospace purchase commitments 923.8 2,392.7 3,316.5 2,168.0
Other manufacturer purchase commitments 668.1 28.1 696.2 397.0
Sale-leaseback payments 41.2 549.5 590.7 495.4
Venture capital fund commitments – – – 79.8
In addition to the amounts shown in the table above, unused,cancelable lines of credit to consumers in connection with a third-party vendor program, which may be used to finance additionaltechnology product purchases, amounted to approximately $18.4billion and $9.8 billion at December 31, 2005 and 2004. Theseuncommitted vendor-related lines of credit can be reduced or can-celed by CIT at any time without notice. Our experience withthis program indicates that customers typically will not exercisetheir entire available line of credit at any point in time.
In the normal course of meeting the needs of its customers, CITalso enters into commitments to provide financing, letters of creditand guarantees. Standby letters of credit obligate CIT to pay thebeneficiary of the letter of credit in the event that a CIT client towhom the letter of credit was issued does not meet its related obli-gation to the beneficiary. These financial instruments generate feesand involve, to varying degrees, elements of credit risk in excess ofthe amounts recognized in the consolidated balance sheets. To
Employee Stock Purchase Plan
Changes were made to the Employee Stock Purchase Plan (“ESPP”) which will be effective January 1, 2006. Eligibility for participation inthe ESPP includes all employees of CIT and its participating sub-sidiaries who are customarily employed for at least 20 hours per week,with the exception of those employees designated as highly compen-sated. The ESPP is available to employees in the United States and tocertain international employees. Under the ESPP, CIT is authorizedto issue up to 1,000,000 shares of common stock to eligible employ-ees. Eligible employees can choose to have between 1% and 10% oftheir base salary withheld to purchase shares quarterly, at a purchaseprice equal to 85% of the fair market value of CIT common stock onthe last business day of the quarterly offering period. Previously, CITgave employees 85% of the lower of the fair market value of CITcommon stock on the first or last business day of the offering period.The amount of common stock that may be purchased by a partici-pant through the plan is generally limited to $25,000 per year. A totalof 103,883 shares were purchased under the plan in 2005 and 87,551shares were purchased under the plan in 2004.
Restricted Stock
A new Performance Shares program was launched in February2004 under the Long-Term Compensation Plan. Performance
shares awarded totaled 761,635 and 693,328 for 2005 and 2004.These shares have a three-year performance-based vesting period.The performance targets are based upon a combination of con-solidated return on tangible equity measurements and com-pounded annual EPS growth rates.
During 2005 and 2004, 143,236 and 59,163 restricted shareswere awarded to employees under the Long-Term EquityCompensation Plan. These shares were awarded at the fair mar-ket value on the date of the grant and have a two or three-yearcliff-vest period. In addition, 9,369 and 10,481 shares weregranted during 2005 and 2004 to independent members of theBoard of Directors, who elected to receive shares in lieu of cashcompensation for their retainer. The restricted shares issued todirectors in lieu of cash compensation vest on the first anniver-sary of the grant.
For the year ended December 31, 2005, 2004 and 2003, $43.3million, $23.5 million and $8.8 million, respectively, of expensesare included in salaries and general operating expenses related torestricted stock.

86 CIT GROUP INC 2005
CIT GROUP INC. AND SUBSIDIARIES – NOTES TO CONSOLIDATED FINANCIAL STATEMENTS
minimize potential credit risk, CIT generally requires collateraland other forms of credit support from the customer.
Guarantees are issued primarily in conjunction with CIT’s fac-toring business, whereby CIT provides the client with credit pro-tection for its trade receivables without actually purchasing thereceivables. The trade terms are generally sixty days or less. If thecustomer is unable to pay according to the contractual terms,then CIT purchases the receivables from the client. As ofDecember 31, 2005, there were no outstanding liabilities relatingto these credit-related commitments or guarantees, as amountsare generally billed and collected on a monthly basis.
CIT’s firm purchase commitments relate predominantly to pur-chases of rail equipment and commercial aircraft. The aerospaceequipment purchases are contracted for a specific model aircraft,using a baseline aircraft specification at fixed prices, which reflectdiscounts from fair market purchase prices prevailing at the timeof commitment. These purchase commitments are fixed price, but are subject to customary price increases for future changes in inflation and manufacturing components. The delivery price ofan aircraft may also change depending on the final specificationsof the aircraft, including engine thrust, aircraft weight and seat-ing configuration.
Equipment purchases are recorded at delivery date at the finalpurchase price paid, which includes purchase price discounts,price changes relating to specification changes and price increasesrelating to inflation and manufacturing components.Accordingly, the commitment amounts detailed in the precedingtable are based on estimated values.
Pursuant to existing contractual commitments, 66 aircraft will bepurchased (19 in 2006), with lease commitments in place forfourteen of the 2006 deliveries. The order amount excludesCIT’s options to purchase additional aircraft. During 2005, CITentered into a purchase commitment with Airbus Industrie for 29 aircraft to be delivered between 2007 and 2013 and withDelta Air Lines for ten Boeing 737 aircraft to be delivered in2007 and 2008, all of which are included in the preceding table.
Outstanding commitments to purchase equipment to be leasedto customers, other than aircraft, relates primarily to rail equip-ment. Rail equipment purchase commitments are at fixed pricessubject to price increases for inflation and manufacturing com-ponents. The time period between commitment and purchasefor rail equipment is generally less than 18 months. Additionally,CIT is party to railcar sale-leaseback transactions under which itis obligated to pay a remaining total of $590.7 million, orapproximately $41 million per year through 2010 and decliningthereafter through 2024. These lease payments are expected to bemore than offset by rental income associated with re-leasing theassets, subject to actual railcar utilization and rentals. In conjunc-tion with this sale-leaseback transaction, CIT has guaranteed allobligations of the related consolidated lessee entity.
CIT has guaranteed the public and private debt securities of anumber of its wholly-owned, consolidated subsidiaries, includingthose disclosed in Note 24 – Summarized Financial Informationof Subsidiaries. In the normal course of business, various consoli-dated CIT subsidiaries have entered into other credit agreementsand certain derivative transactions with financial institutions thatare guaranteed by CIT. These transactions are generally used byCIT’s subsidiaries outside of the U.S. to allow the local sub-sidiary to borrow funds in local currencies.
The following table presents future minimum rentals under non-cancellable long-term lease agreements for premises and equip-ment at December 31, 2005.
For the years ended December 31, (dollars in millions) Amount_______________2006 $ 48.5
2007 43.7
2008 37.3
2009 22.3
2010 18.3
Thereafter 170.2___________Total $340.3______________________
In addition to fixed lease rentals, leases generally require paymentof maintenance expenses and real estate taxes, both of which aresubject to rent escalation provisions. Minimum payments havenot been reduced by minimum sublease rentals of $17.0 milliondue in the future under noncancellable subleases.
NOTE 17 – LEASE COMMITMENTS
Rental expense, net of sublease income on premises and equipment, was as follows.
For the years ended December 31, (dollars in millions) 2005 2004 2003_________ _________ _________
Premises $34.6 $31.8 $34.0
Equipment 8.3 8.4 9.3
Less sublease income (7.1) (9.1) (9.4)_____ _____ _____Total $35.8 $31.1 $33.9_____ _____ __________ _____ _____

CIT GROUP INC. AND SUBSIDIARIES – NOTES TO CONSOLIDATED FINANCIAL STATEMENTS
NOTE 18 – FAIR VALUES OF FINANCIAL INSTRUMENTS
Estimated fair values, recorded carrying values and various assumptions used in valuing CIT’s financial instruments are set forth below.
December 31, 2005 2004Asset/(Liability) Asset/(Liability)_____________________________________________ _____________________________________________
Carrying Estimated Carrying Estimated(dollars in millions) Value Fair Value Value Fair Value_________________ ___________________ _________________ ___________________Net finance receivables-loans(1) $36,885.2 $36,689.1 $27,080.8 $27,186.5
Finance receivables-held for sale 1,620.3 1,620.3 1,640.8 1,640.8
Retained interest in securitizations and other investments(2) 1,152.7 1,152.7 1,228.2 1,228.2
Other assets(3) 1,160.7 1,160.7 1,133.5 1,133.5
Commercial paper(4) (5,225.0) (5,225.0) (4,210.9) (4,210.9)
Variable-rate senior notes (including accrued interest payable)(5) (15,555.9) (15,558.8) (11,576.2) (11,635.3)
Fixed-rate senior notes (including accrued interest payable)(5) (23,148.2) (23,332.8) (22,037.2) (22,659.1)
Non-recourse, secured borrowings – student lending(including accrued interest payable) (4,087.9) (4,087.9) – –
Preferred capital securities (including accrued interest payable)(6) (257.5) (277.9) (261.3) (280.3)
Credit balances of factoring clients and other liabilities(7) (6,960.3) (6,960.3) (6,025.1) (6,025.1)
Derivative financial instruments(8):
Interest rate swaps, net (109.4) (109.4) (17.2) (17.2)
Cross-currency swaps, net (29.2) (29.2) 369.9 369.9
Foreign exchange forwards, net (74.7) (74.7) (161.8) (161.8)
Natural gas commodity swap (2.6) (2.6) – –
Credit default swaps, net (0.8) (0.8) 5.4 5.4
Interest rate caps – – 0.2 0.2
(1) The fair value of performing fixed-rate loans was estimated based upon a present value discounted cash flow analysis, using interest rates that were beingoffered at the end of the year for loans with similar terms to borrowers of similar credit quality. Discount rates used in the present value calculation rangefrom 5.35% to 10.24% for December 31, 2005 and 3.90% to 8.65% for December 31, 2004. The maturities used represent the average contractualmaturities adjusted for prepayments. For floating-rate loans that reprice frequently and have no significant change in credit quality, fair value approxi-mates carrying value. The net carrying value of lease finance receivables not subject to fair value disclosure totaled $6.8 billion at December 31, 2005and $7.4 billion at December 31, 2004.
(2) Fair values of retained interests in securitizations are calculated utilizing current and anticipated credit losses, prepayment speeds and discount rates.Other investment securities actively traded in a secondary market were valued using quoted available market prices.
(3) Other assets subject to fair value disclosure include accrued interest receivable, certain investment securities and miscellaneous other assets. The carryingamount of accrued interest receivable approximates fair value. The carrying value of other assets not subject to fair value disclosure totaled $1.5 billion atDecember 31, 2005 and $1.6 billion at December 31, 2004.
(4) The estimated fair value of commercial paper approximates carrying value due to the relatively short maturities.
(5) The difference between the carrying value of fixed-rate senior notes, variable-rate senior notes and preferred capital securities and the corresponding bal-ances reflected in the consolidated balance sheets is accrued interest payable. These amounts are excluded from the other liabilities balances in this table.Fixed-rate notes were valued using a present value discounted cash flow analysis with a discount rate approximating current market rates for issuances byCIT of similar term debt at the end of the year. Discount rates used in the present value calculation ranged from 4.33% to 5.84% at December 31,2005 and 2.74% to 6.03% at December 31, 2004.
(6) Preferred capital securities were valued using a present value discounted cash flow analysis with a discount rate approximating current market rates ofsimilar issuances at the end of the year.
(7) The estimated fair value of credit balances of factoring clients approximates carrying value due to their short settlement terms. Other liabilities includeaccrued liabilities and deferred federal income taxes. Accrued liabilities and payables with no stated maturities have an estimated fair value that approx-imates carrying value. The carrying value of other liabilities not subject to fair value disclosure totaled $1.1 billion and $0.9 billion December 31, 2005and 2004. Letters of credit and guarantees are generally billed and collected on a monthly basis and therefore have no recorded value and zero net fairvalue.
(8) CIT enters into derivative financial instruments for hedging purposes only. The estimated fair values are calculated internally using independent marketdata, or in limited instances, market values obtained from counterparties, and represent the net amount receivable or payable to terminate the agreement,taking into account current market rates. See Note 9 — “Derivative Financial Instruments” for notional principal amounts associated with theinstruments.
Item 8: Financial Statements and Supplementary Data 87

88 CIT GROUP INC 2005
CIT GROUP INC. AND SUBSIDIARIES – NOTES TO CONSOLIDATED FINANCIAL STATEMENTS
CIT is a partner with Dell Inc. (“Dell”) in Dell Financial ServicesL.P. (“DFS”), a joint venture that offers financing to Dell’s cus-tomers. The joint venture provides Dell with financing and leas-ing capabilities that are complementary to its product offeringsand provides CIT with a source of new financings. The jointventure agreement provides Dell with the option to purchaseCIT’s 30% interest in DFS in February 2008 based on a formulatied to DFS profitability, within a range of $100 million to $345million. CIT has the right to purchase a minimum percentage ofDFS’s finance receivables on a declining scale throughJanuary 2010.
CIT regularly purchases finance receivables from DFS at a pre-mium, portions of which are typically securitized within 90 daysof purchase from DFS. CIT has limited recourse to DFS ondefaulted contracts. In accordance with the joint venture agree-ment, net income and losses generated by DFS as determinedunder GAAP are allocated 70% to Dell and 30% to CIT. TheDFS board of directors voting representation is equally weightedbetween designees of CIT and Dell, with one independent direc-tor. DFS is not consolidated in CIT’s financial statements and isaccounted for under the equity method. At both December 31,2005 and 2004, financing and leasing assets related to the DFSprogram included in the CIT Consolidated Balance Sheet (butexcluding certain related international receivables originateddirectly by CIT) were approximately $2.0 billion and securitizedassets included in managed assets were approximately $2.5 bil-lion. CIT’s equity investment in and loans to the joint venturewas approximately $214 million and $267 million atDecember 31, 2005 and 2004.
CIT also has a joint venture arrangement with Snap-onIncorporated (“Snap-on”) that has a similar business purpose andmodel to the DFS arrangement described above, including lim-ited credit recourse on defaulted receivables. The agreement withSnap-on was recently extended until January 2009. CIT and
Snap-on have 50% ownership interests, 50% board of directors’representation, and share income and losses equally. The Snap-onjoint venture is accounted for under the equity method and isnot consolidated in CIT’s financial statements. At December 31,2005 and 2004, financing and leasing assets were approximately$1.0 billion and $1.1 billion. Securitized assets included in man-aged assets were $0.1 billion at both December 31, 2005 and2004. In addition to the owned and securitized assets purchasedfrom the Snap-on joint venture, CIT’s equity investment in andloans to the joint venture were approximately $14 million and$16 million at December 31, 2005 and 2004.
Since December 2000, CIT has been a joint venture partner withCanadian Imperial Bank of Commerce (“CIBC”) in an entitythat is engaged in asset-based lending in Canada. Both CIT andCIBC have a 50% ownership interest in the joint venture, andshare income and losses equally. This entity is not consolidated inCIT’s financial statements and is accounted for under the equitymethod. CIT’s investment in and loans to the joint venture wereapproximately $280 million and $191 million at December 31,2005 and 2004.
CIT invests in various trusts, partnerships, and limited liabilitycorporations established in conjunction with structured financ-ing transactions of equipment, power and infrastructure projects.CIT’s interests in certain of these entities were acquired by CITin a 1999 acquisition, and others were subsequently entered intoin the normal course of business. Other assets included approxi-mately $18 million and $19 million of investments in non-con-solidated entities relating to such transactions that are accountedfor under the equity or cost methods at December 31, 2005 and2004.
Certain shareholders of CIT provide investment management,banking and investment banking services in the normal course ofbusiness.
NOTE 19 – CERTAIN RELATIONSHIPS AND RELATED TRANSACTIONS
NOTE 20 – BUSINESS SEGMENT INFORMATION
Management’s Policy in Identifying ReportableSegments
CIT’s reportable segments are comprised of strategic businessunits or “verticals” that are aggregated into segments primarilybased upon industry categories and to a lesser extent, the corecompetencies relating to product origination, distribution meth-ods, operations and servicing, and the nature of their regulatoryenvironment. This segment reporting is consistent with the pres-entation to management.
The following segment reporting changes were made during2005: a) the former Commercial Finance segment was separatedinto Commercial Services, primarily factoring, and CorporateFinance, which offers asset based lending, b) transferred thepower, energy and infrastructure businesses from Capital Financeto Corporate Finance, c) transferred the healthcare portfolio
from Equipment Finance to Corporate Finance, and d) trans-ferred the remaining business aircraft portfolio from EquipmentFinance to Capital Finance. Prior periods have been restated forthe separation for Commercial Finance and the transfer of thepower, energy and infrastructure businesses, but not the portfoliotransfers. This updated presentation is consistent with the report-ing to management.
Types of Products and Services
CIT has six reportable segments: Specialty Finance –Commercial, Specialty Finance – Consumer, CommercialServices, Corporate Finance, Capital Finance and EquipmentFinance. Specialty Finance – Commercial, Capital Finance andEquipment Finance offer secured lending and leasing products tomidsize and larger companies across a variety of industries,
CIT GROUP INC. AND SUBSIDIARIES – NOTES TO CONSOLIDATED FINANCIAL STATEMENTS
Item 8: Financial Statements and Supplementary Data 89
including aerospace, construction, rail, machine tool, businessaircraft, technology, manufacturing and transportation.Commercial Services and Corporate Finance offer secured lend-ing and receivables collection as well as other financial productsand services to small and midsize companies. These includesecured revolving lines of credit and term loans, credit protec-tion, accounts receivable collection, import and export financingand factoring, debtor-in-possession and turnaround financingand management advisory services. The Specialty Finance –Consumer segment offers home lending products to consumersprimarily through a network of brokers and correspondents andstudent lending through Student Loan Xpress.
Segment Profit and Assets
The selected financial information by business segment pre-sented below is based upon the allocation of most corporateexpenses. For the 2005 and 2004 periods, capital is allocated tothe segments by applying different leverage ratios to each busi-ness unit using market capitalization and risk criteria. The capitalallocations reflect the relative risk of individual asset classeswithin segments and range from approximately 2% of managedassets for U.S. government guaranteed loans to approximately15% of managed assets for longer-term assets such as aerospace
and rail. For 2003, capital was allocated using a uniform leverageratio among the segments.
Corporate and Other results for 2005 include a reserve for creditlosses of $34.6 million and a $6.8 million pretax securitizationretained interest impairment charge relating to estimatedHurricanes Katrina and Rita losses. Also included is a pre-taxgain of $115.0 million on a sale of a real estate investment. Corporate and Other for 2004 included the reduction to the spe-cific telecommunications reserve for credit losses and the firstquarter gain on the call of debt. For 2003, Corporate and Otherincluded an after-tax charge of $38.4 million related to the write-down of equity investments, an after-tax benefit of $30.8 millionfrom a gain on a call of debt as well as unallocated expenses. Forall periods shown, Corporate and Other includes the results ofthe venture capital business.
The business segments’ net finance income and net income forthe year ended December 31, 2003 include the allocation (fromCorporate and Other) of additional borrowing costs stemmingfrom the 2002 disruption to the Company’s funding base andincreased liquidity levels.

90 CIT GROUP INC 2005
CIT GROUP INC. AND SUBSIDIARIES – NOTES TO CONSOLIDATED FINANCIAL STATEMENTS
The following table presents reportable segment information and the reconciliation of segment balances to the consolidated financialstatement totals and the consolidated managed assets. The selected financial information by business segment presented below reflectsthe allocation of most corporate expenses.
Specialty Specialty CorporateFinance – Finance – Commercial Corporate Capital Equipment Total and
(dollars in millions) Commercial Consumer Services Finance Finance Finance Segments Other Consolidated__________ _________ __________ _________ _______ _________ ________ ________ ___________Year Ended December 31, 2005
Net finance income $ 1,158.3 $ 200.9 $ 143.6 $ 309.2 $ 580.1 $ 168.3 $ 2,560.4 $ 42.8 $ 2,603.2
Depreciation on operating lease equipment 567.3 – – 11.3 354.9 34.5 968.0 – 968.0
Provision for credit losses 93.2 34.6 22.9 3.2 4.6 21.1 179.6 37.4 217.0
Other revenue 385.7 72.1 290.9 138.9 (50.1) 116.4 953.9 183.5 1,137.4
Income taxes (196.6) (41.7) (112.0) (108.9) 41.2 (58.6) (476.6) 12.4 (464.2)
Net income (loss) 326.6 66.7 184.7 177.1 129.9 98.2 983.2 (46.8) 936.4
Total financing and leasing assets 10,378.8 13,943.8 6,690.0 9,549.5 10,484.4 4,534.2 55,580.7 – 55,580.7
Total managed assets 14,300.4 14,782.6 6,690.0 9,590.7 10,484.4 7,018.3 62,866.4 – 62,866.4
Year Ended December 31, 2004
Net finance income $ 1,200.2 $ 132.5 $ 111.6 $ 266.2 $ 485.1 $ 217.2 $ 2,412.8 $ 87.9 $ 2,500.7
Depreciation on operating lease equipment 589.9 – – 4.3 319.1 52.1 965.4 – 965.4
Provision for credit losses 109.2 32.7 23.4 24.5 7.3 53.2 250.3 (36.1) 214.2
Other revenue 290.9 43.6 284.9 119.9 34.2 111.3 884.8 2.3 887.1
Income taxes (158.9) (30.3) (103.8) (102.3) (35.4) (49.5) (480.2) (3.0) (483.2)
Net income (loss) 268.3 46.3 161.1 148.6 87.0 81.5 792.8 (39.2) 753.6
Total financing and leasing assets 11,172.8 5,374.5 6,204.1 6,737.9 8,747.2 6,924.4 45,160.9 – 45,160.9
Total managed assets 15,338.3 6,603.2 6,204.1 6,737.9 8,747.2 9,839.9 53,470.6 – 53,470.6
Year Ended December 31, 2003
Net finance income $ 1,222.2 $ 65.1 $ 99.3 $ 254.6 $ 378.4 $ 228.4 $ 2,248.0 $ 112.6 $ 2,360.6
Depreciation on operating lease equipment 718.2 – – – 268.8 70.5 1,057.5 – 1,057.5
Provision for credit losses 132.8 26.5 27.6 46.5 12.3 125.7 371.4 15.9 387.3
Other revenue 350.7 82.0 237.2 120.8 33.4 115.8 939.9 (80.6) 859.3
Income taxes (146.8) (20.0) (81.5) (94.7) (27.0) (24.6) (394.6) 29.6 (365.0)
Net income (loss) 225.3 35.6 127.6 147.7 42.3 38.5 617.0 (50.1) 566.9
Total financing and leasing assets 9,504.1 2,814.3 6,325.8 6,314.1 8,167.9 6,957.7 40,083.9 – 40,083.9
Total managed assets 14,062.0 4,681.9 6,325.8 6,314.1 8,167.9 10,183.9 49,735.6 – 49,735.6
Finance income and other revenues derived from United Statesbased financing and leasing assets were $4,617.6 million,$3,864.4 million and $3,695.2 million for the years endedDecember 31, 2005, 2004 and 2003. Finance income and otherrevenues derived from foreign based financing and leasing assets,were $1,055.6 million, $850.2 million and $944.0 million forthe years ended December 31, 2005, 2004 and 2003.
During the third quarter of 2005, management initiated actionsto sell $190 million of older, out-of-production aircraft and
$125 million in manufactured housing receivables. These assetswere reclassified to Financing and Leasing Assets Held for Saleand marked to estimated fair value, which resulted in pretaxlosses recorded in other revenue of $86.6 million in CapitalFinance related to aircraft and $20.0 million in Specialty Finance– Commercial related to the manufactured housing receivables.The estimated fair values were developed from relevant marketinformation, including third party sales for similar equipment,published appraisal data and other relevant market place data.

CIT GROUP INC. AND SUBSIDIARIES – NOTES TO CONSOLIDATED FINANCIAL STATEMENTS
Item 8: Financial Statements and Supplementary Data 91
NOTE 21 – LEGAL PROCEEDINGS
NorVergence Related Litigation
On September 9, 2004, Exquisite Caterers Inc. et al. v. PopularLeasing Inc. et al. (“Exquisite Caterers”), a putative national classaction, was filed against 13 financial institutions, including CIT,which had acquired equipment leases (“NorVergence Leases”)from NorVergence, Inc., a reseller of telecommunications andInternet services to businesses. The complaint alleged thatNorVergence misrepresented the capabilities of the equipmentleased to its customers and overcharged for the equipment, andthat the NorVergence Leases are unenforceable. Plaintiffs seekrescission, punitive damages, treble damages and attorneys’ fees.In addition, putative class action suits in Illinois and Texas, allbased upon the same core allegations and seeking the same relief,were filed by NorVergence customers against CIT and otherfinancial institutions. The Court in Exquisite Caterers certified aNew Jersey-only class, and a motion for decertification is pending.
On July 14, 2004, the U.S. Bankruptcy Court ordered the liqui-dation of NorVergence under Chapter 7 of the BankruptcyCode. Thereafter, the Attorneys General of several states com-menced investigations of NorVergence and the financial institu-
tions, including CIT, that purchased NorVergence Leases. CIThas entered into settlement agreements with the AttorneysGeneral in each of these states, except for Texas. Under those set-tlements, lessees in those states have had an opportunity toresolve all claims by and against CIT by paying a percentage ofthe remaining balance on their leases. CIT has also produceddocuments for transactions related to NorVergence at the requestof the Federal Trade Commission ("FTC") and pursuant to asubpoena in a grand jury proceeding being conducted by theU.S. Attorney for the Southern District of New York in connec-tion with an investigation of transactions related to NorVergence.CIT has entered into a settlement agreement with respect to theExquisite Caterers case and the Texas putative class action. Suchsettlement is subject to Court approval and is not expected tohave a material adverse financial effect on CIT.
Other Litigation
In addition, there are various legal proceedings against CIT,which have arisen in the ordinary course of business. While theoutcomes of the ordinary course legal proceedings and the relatedactivities are not certain, based on present assessments, manage-ment does not believe that they will have a material adversefinancial effect on CIT.

92 CIT GROUP INC 2005
CIT GROUP INC. AND SUBSIDIARIES – NOTES TO CONSOLIDATED FINANCIAL STATEMENTS
NOTE 22 – GOODWILL AND INTANGIBLE ASSETS
The following tables summarize goodwill and intangible assets, net balances by segment.
(dollars in millions): Specialty SpecialtyFinance – Finance – Commercial Corporate
Commercial Consumer Services Finance Total____________________ ____________________ ____________________ ____________________ ____________________Goodwill
Balance at December 31, 2003 $ 12.7 $ – $261.6 $108.8 $383.1
Acquisitions, other 49.6 – – – 49.6__________ ___________ ___________ ___________ ___________Balance at December 31, 2004 62.3 – 261.6 108.8 432.7
Acquisitions, other (8.0) 270.7 (0.1) 99.8 362.4__________ ___________ ___________ ___________ ___________Balance at December 31, 2005 $ 54.3 $270.7 $261.5 $208.6 $795.1__________ ___________ ___________ ___________ _____________________ ___________ ___________ ___________ ___________Intangible Assets
Balance at December 31, 2003 $ – $ – $104.6 $ – $104.6
Additions 72.1 – 0.4 – 72.5
Amortization (4.1) – (9.2) – (13.3)__________ ___________ ___________ ___________ ___________Balance at December 31, 2004 68.0 – 95.8 – 163.8
Additions (13.3) 29.4 30.3 27.4 73.8
Amortization (9.2) (0.5) (10.6) (0.9) (21.2)__________ ___________ ___________ ___________ ___________Balance at December 31, 2005 $ 45.5 $ 28.9 $115.5 $ 26.5 $216.4__________ ___________ ___________ ___________ _____________________ ___________ ___________ ___________ ___________
In accordance with SFAS No. 142, “Goodwill and OtherIntangible Assets” (“SFAS 142”), goodwill is no longer amortizedbut instead is assessed periodically for impairment. TheCompany periodically reviews and evaluates its goodwill andintangible assets for potential impairment at a minimum annu-ally, or more frequently if circumstances indicate that impair-ment is possible. The most recent goodwill and intangible assetimpairment analyses as of October 1, 2005 indicated that the fairvalues of each were in excess of the carrying values. The increasein Specialty Finance – Consumer goodwill during 2005 was dueto the Student Lending Xpress business acquisition while theincrease in Corporate Finance was due to the HealthcareBusiness Credit Corporation acquisition. The increase inSpecialty Finance – Commercial goodwill during 2004 was pri-marily due to a Western European vendor finance and leasingbusiness acquisition. Certain fair value adjustments relating tothis acquisition were modified during 2005, resulting in thereduction to goodwill in 2005.
Other intangible assets, net, are comprised primarily of acquiredcustomer relationships (Specialty Finance and CommercialServices), as well as proprietary computer software and relatedtransaction processes (Commercial Services). The increase wasprimarily related to acquisitions: a student lending acquisition inSpecialty Finance – Consumer, a healthcare acquisition inCorporate Finance and a factoring acquisition in CommercialServices. Other intangible assets are being amortized over theircorresponding lives ranging from five to twenty years in relationto the related cash flows, where applicable. Amortization expensetotaled $21.2 million, $13.3 million and $4.9 million for theyears ended December 31, 2005, 2004 and 2003. Accumulated
amortization totaled $44.9 million and $23.7 million atDecember 31, 2005 and 2004. The projected amortization forthe years ended December 31, 2006 through December 31,2010 is: $21.6 million for 2006; $18.5 million for 2007; $18.8million for 2008 $19.1 million for 2009 and $19.3 million for2010. The increase in other intangible assets during 2004 wasdue primarily to customer relationships acquired in the WesternEuropean vendor finance and leasing business acquisition and ina purchase of a technology leasing business. Certain fair valueadjustments relating to this acquisition were modified during2005, resulting in the reduction to intangible assets in 2005.
Healthcare Acquisition
In July 2005, CIT acquired, for cash, Healthcare Business CreditCorporation (“HBCC”), a full service health care financing com-pany that specializes in asset-based and cash flow financing toU.S. healthcare providers. The HBCC acquisition was accountedfor under the purchase method, with the acquired assets and lia-bilities recorded at their estimated fair values as of the acquisitiondate. The assets acquired included approximately $500 million offinance receivables and $127 million of goodwill and intangibleassets.
Student Lending Acquisition
In February 2005, CIT acquired Education Lending Group, Inc.(“EDLG”), a specialty finance company principally engaged inproviding education loans (primarily U.S. government guaran-teed), products and services to students, parents, schools andalumni associations. The shareholders of EDLG received $19.05per share or approximately $383 million in cash. The acquisition

CIT GROUP INC. AND SUBSIDIARIES – NOTES TO CONSOLIDATED FINANCIAL STATEMENTS
Item 8: Financial Statements and Supplementary Data 93
was accounted for under the purchase method, with the acquiredassets and liabilities recorded at their estimated fair values as ofthe February 17, 2005 acquisition date. The assets acquiredincluded approximately $4.4 billion of finance receivables and$300 million of goodwill and intangible assets.
During 2005, segment reporting was modified in conjunctionwith various business realignments. The December 31, 2004 bal-ances have been conformed to the current presentation. See Note20 – Business Segment Information for additional information.
NOTE 23 – SEVERANCE AND FACILITY RESTRUCTURING RESERVES
The following table summarizes previously established purchase accounting liabilities (pre-tax) related to severance of employees andclosing facilities, as well as 2004 and 2005 restructuring activities:
Severance Facilities__________________________________________ __________________________________________
Number of Number of Total(dollars in millions) Employees Reserve Facilities Reserve Reserves__________________ __________________ __________________ __________________ __________________
Balance December 31, 2003 43 $ 2.3 12 $ 7.2 $ 9.5
2004 additions 175 15.2 6 4.5 19.7
2004 utilization (89) (5.3) (3) (6.0) (11.3)________ __________ ______ ________ __________Balance December 31, 2004 129 12.2 15 5.7 17.9
2005 additions 191 21.6 – 2.0 23.6
2005 utilization (297) (25.7) (6) (2.6) (28.3)________ __________ ______ ________ __________Balance December 31, 2005 23 $ 8.1 9 $ 5.1 $ 13.2________ __________ ______ ________ __________________ __________ ______ ________ __________
The additions during 2005 are largely employee terminationbenefits related to the realignment of the Commercial FinanceGroup business segments and other business streamlining activi-ties ($20.3 million, which was recorded in the quarter endedJune 30, 2005 as part of the $25.2 million restructuring charge recorded in Corporate and Other). The 2005 addition alsoincluded facility exit plan refinements relating to the acquiredWestern European vendor finance and leasing business, whichwere recorded as fair value adjustments to purchased liabilities /adjustments to goodwill. The employee termination benefitswere largely paid during the quarter ended September 30, 2005.The facility reserves relate primarily to shortfalls in subleasetransactions and will be utilized over the remaining lease terms,generally 6 years.
The additions to restructuring reserves in 2004 relate to two ini-tiatives: (1) the second quarter combination of the formerStructured Finance with Capital Finance and a back-officerestructuring in Commercial Finance ($4.1 million) and (2) thethird quarter acquisition of a Western European vendor financeand leasing business ($15.6 million). Costs related to the CapitalFinance combination were included in current period earnings,while restructuring liabilities related to the vendor finance and
leasing business acquisition were established under purchaseaccounting in conjunction with fair value adjustments to pur-chased assets and liabilities.
NOTE 24 – SUMMARIZED FINANCIAL INFORMATION OFSUBSIDIARIES (UNAUDITED)The following presents condensed consolidating financial infor-mation for CIT Holdings LLC. CIT has guaranteed on a full andunconditional basis the existing debt securities that were regis-tered under the Securities Act of 1933 and certain other indebt-edness of this subsidiary. CIT has not presented related financialstatements or other information for this subsidiary on a stand-alone basis. The remaining debt associated with CapitaCorporation (formerly AT&T Capital Corporation), a subsidiarypreviously disclosed, matured in 2005 and prior period amountsassociated with this subsidiary are included in the “OtherSubsidiaries” column in the tables that follow. Also includedunder “Other Subsidiaries” is a 100%-owned finance subsidiaryof CIT Group Inc., Canadian Funding Company LLC, forwhich CIT has fully and unconditionally guaranteed the debtsecurities.

CONSOLIDATING BALANCE SHEETS
CITCIT Holdings Other
(dollars in millions) Group Inc. LLC Subsidiaries Eliminations Total__________ __________ __________ __________ __________
December 31, 2005
ASSETS
Net finance receivables $ 1,041.7 $ 2,360.3 $40,270.8 $ – $43,672.8
Operating lease equipment, net – 175.4 9,460.3 – 9,635.7
Finance receivables held for sale – 75.3 1,545.0 – 1,620.3
Cash and cash equivalents 2,502.9 129.6 1,026.1 – 3,658.6
Other assets 10,293.1 272.1 1,196.7 (6,962.7) 4,799.2_________________ _______________ ________________ ________________ ________________Total Assets $ 13,837.7 $ 3,012.7 $53,498.9 $ (6,962.7) $63,386.6_________________ _______________ ________________ ________________ _________________________________ _______________ ________________ ________________ ________________LIABILITIES AND STOCKHOLDERS’ EQUITY
Debt $ 35,701.2 $ 4,336.4 $ 7,826.9 $ – $47,864.5
Credit balances of factoring clients – – 4,187.8 – 4,187.8
Accrued liabilities and payables (28,826.2) (1,773.5) 34,921.5 – 4,321.8_________________ _______________ ________________ ________________ ________________Total Liabilities 6,875.0 2,562.9 46,936.2 – 56,374.1
Minority interest – – 49.8 – 49.8
Total Stockholders’ Equity 6,962.7 449.8 6,512.9 (6,962.7) 6,962.7_________________ _______________ ________________ ________________ ________________Total Liabilities and Stockholders’ Equity $ 13,837.7 $ 3,012.7 $53,498.9 $ (6,962.7) $63,386.6_________________ _______________ ________________ ________________ _________________________________ _______________ ________________ ________________ ________________December 31, 2004
ASSETS
Net finance receivables $ 1,121.1 $ 1,682.7 $31,627.2 $ – $ 34,431.0
Operating lease equipment, net – 130.8 8,160.1 – 8,290.9
Finance receivables held for sale – 72.0 1,568.8 – 1,640.8
Cash and cash equivalents 1,311.4 127.5 771.3 – 2,210.2
Other assets 9,536.8 316.2 740.5 (6,055.1) 4,538.4_________________ _______________ ________________ ________________ ________________Total Assets $ 11,969.3 $ 2,329.2 $42,867.9 $ (6,055.1) $51,111.3_________________ _______________ ________________ ________________ _________________________________ _______________ ________________ ________________ ________________LIABILITIES AND STOCKHOLDERS’ EQUITY
Debt $ 34,699.1 $ 1,383.8 $ 1,641.9 $ – $37,724.8
Credit balances of factoring clients – – 3,847.3 – 3,847.3
Accrued liabilities and payables (28,784.9) (591.3) 32,819.9 – 3,443.7_________________ _______________ ________________ ________________ ________________Total Liabilities 5,914.2 792.5 38,309.1 – 45,015.8
Minority interest – – 40.4 – 40.4
Total Stockholders’ Equity 6,055.1 1,536.7 4,518.4 (6,055.1) 6,055.1_________________ _______________ ________________ ________________ ________________Total Liabilities and Stockholders’ Equity $ 11,969.3 $ 2,329.2 $42,867.9 $ (6,055.1) $51,111.3_________________ _______________ ________________ ________________ _________________________________ _______________ ________________ ________________ ________________
94 CIT GROUP INC 2005
CIT GROUP INC. AND SUBSIDIARIES – NOTES TO CONSOLIDATED FINANCIAL STATEMENTS

CIT GROUP INC. AND SUBSIDIARIES – NOTES TO CONSOLIDATED FINANCIAL STATEMENTS
CONSOLIDATING STATEMENTS OF INCOME
CITCIT Holdings Other
(dollars in millions) Group Inc. LLC Subsidiaries Eliminations Total__________ __________ __________ __________ __________
Year Ended December 31, 2005
Finance income $ 41.0 $242.5 $4,231.7 $ – $4,515.2
Interest expense (56.1) 82.6 1,885.5 – 1,912.0______________ ___________ ______________ _____________ ______________Net finance income 97.1 159.9 2,346.2 – 2,603.2
Depreciation on operating lease equipment – 48.2 919.8 – 968.0______________ ___________ ______________ _____________ ______________Net finance margin 97.1 111.7 1,426.4 – 1,635.2
Provision for credit losses 18.1 13.7 185.2 – 217.0______________ ___________ ______________ _____________ ______________Net finance margin, after provision for credit losses 79.0 98.0 1,241.2 – 1,418.2
Equity in net income of subsidiaries 973.3 – – (973.3) –
Other revenue 38.2 109.8 989.4 – 1,137.4______________ ___________ ______________ _____________ ______________Operating margin 1,090.5 207.8 2,230.6 (973.3) 2,555.6
Operating expenses 154.4 79.9 879.5 – 1,113.8
Provision for restructuring – – 25.2 – 25.2______________ ___________ ______________ _____________ ______________Income (loss) before provision for income taxes 936.1 127.9 1,325.9 (973.3) 1,416.6
Benefit (provision) for income taxes 13.0 (46.6) (430.6) – (464.2)
Minority interest, after tax – – (3.3) – (3.3)
Dividends on preferred capital securities, after tax (12.7) – – – (12.7)______________ ___________ ______________ _____________ ______________Net income $ 936.4 $ 81.3 $ 892.0 $(973.3) $ 936.4______________ ___________ ______________ _____________ ____________________________ ___________ ______________ _____________ ______________Year Ended December 31, 2004
Finance income $ 38.3 $187.5 $3,535.0 $ – $3,760.8
Interest expense (150.3) 10.9 1,399.5 – 1,260.1______________ ___________ ______________ _____________ ______________Net finance income 188.6 176.6 2,135.5 – 2,500.7
Depreciation on operating lease equipment – 43.8 921.6 – 965.4______________ ___________ ______________ _____________ ______________Net finance margin 188.6 132.8 1,213.9 – 1,535.3
Provision for credit losses 27.5 12.0 174.7 – 214.2______________ ___________ ______________ _____________ ______________Net finance margin, after provision for credit losses 161.1 120.8 1,039.2 – 1,321.1
Equity in net income of subsidiaries 691.7 – – (691.7) –
Other revenue 65.6 86.9 734.6 – 887.1______________ ___________ ______________ _____________ ______________Operating margin 918.4 207.7 1,773.8 (691.7) 2,208.2
Operating expenses 167.1 67.7 777.3 – 1,012.1
Gain on redemption of debt 41.8 – – – 41.8______________ ___________ ______________ _____________ ______________Income (loss) before provision for income taxes 793.1 140.0 996.5 (691.7) 1,237.9
Provision for income taxes (39.5) (54.6) (389.1) – (483.2)
Minority interest, after tax – – (1.1) – (1.1)______________ ___________ ______________ _____________ ______________Net income $ 753.6 $ 85.4 $ 606.3 $(691.7) $ 753.6______________ ___________ ______________ _____________ ____________________________ ___________ ______________ _____________ ______________
Item 8: Financial Statements and Supplementary Data 95

CONSOLIDATING STATEMENTS OF INCOME (continued)
CITCIT Holdings Other
(dollars in millions) Group Inc. LLC Subsidiaries Eliminations Total__________ __________ __________ __________ __________
Year Ended December 31, 2003
Finance income $ 89.0 $195.0 $3,425.3 $ – $3,709.3
Interest expense (23.3) 6.6 1,365.4 – 1,348.7______________ ___________ ______________ _____________ ______________Net finance income 112.3 188.4 2,059.9 – 2,360.6
Depreciation on operating lease equipment – 68.5 989.0 – 1,057.5______________ ___________ ______________ _____________ ______________Net finance margin 112.3 119.9 1,070.9 – 1,303.1
Provision for credit losses 36.7 14.6 336.0 – 387.3______________ ___________ ______________ _____________ ______________Net finance margin, after provision for credit losses 75.6 105.3 734.9 – 915.8
Equity in net income of subsidiaries 481.3 – – (481.3) –
Other revenue 10.0 95.7 753.6 – 859.3______________ ___________ ______________ _____________ ______________Operating margin 566.9 201.0 1,488.5 (481.3) 1,775.1
Operating expenses 28.0 90.3 769.9 – 888.2
Gain on redemption of debt 50.4 – – – 50.4______________ ___________ ______________ _____________ ______________Income (loss) before provision for income taxes 589.3 110.7 718.6 (481.3) 937.3
Provision for income taxes (22.4) (43.2) (299.4) – (365.0)
Minority interest, after tax – – (5.4) – (5.4)______________ ___________ ______________ _____________ ______________Net income $ 566.9 $ 67.5 $ 413.8 $(481.3) $ 566.9______________ ___________ ______________ _____________ ____________________________ ___________ ______________ _____________ ______________
96 CIT GROUP INC 2005
CIT GROUP INC. AND SUBSIDIARIES – NOTES TO CONSOLIDATED FINANCIAL STATEMENTS

CIT GROUP INC. AND SUBSIDIARIES – NOTES TO CONSOLIDATED FINANCIAL STATEMENTS
CONSOLIDATING STATEMENTS OF CASH FLOWS
CITCIT Holdings Other
(dollars in millions) Group Inc. LLC Subsidiaries Eliminations Total__________ __________ __________ __________ __________
Year Ended December 31, 2005
Cash Flows From Operating Activities:
Net cash flows provided by (used for) operations $ 8,027.2 $ 385.0 $(5,498.9) $ – $ 2,913.3________________ ________________ ________________ _______________ ________________Cash Flows From Investing Activities:
Net increase (decrease) in financing and leasing assets 61.1 (760.8) (4,439.2) – (5,138.9)
Decrease in inter-company loans and investments (7,675.4) – – 7,675.4 –
Other – – 154.0 – 154.0________________ ________________ ________________ _______________ ________________Net cash flows (used for) provided by investing activities (7,614.3) (760.8) (4,285.2) 7,675.4 (4,984.9)________________ ________________ ________________ _______________ ________________Cash Flows From Financing Activities:
Net increase (decrease) in debt 1,002.1 2,952.6 1,070.1 – 5,024.8
Net loans extended – pledged in conjunction with secured borrowings – – (1,708.1) – (1,708.1)
Inter-company financing – (2,574.7) 10,250.1 (7,675.4) –
Cash dividends paid (128.7) – – – (128.7)
Other (94.8) – 115.7 – 20.9________________ ________________ ________________ _______________ ________________Net cash flows provided by (used for) financing activities 778.6 377.9 9,727.8 (7,675.4) 3,208.9________________ ________________ ________________ _______________ ________________Net increase (decrease) in cash and cash equivalents 1,191.5 2.1 (56.3) – 1,137.3
Unrestricted cash and cash equivalents, beginning of period 1,311.4 127.5 771.3 – 2,210.2________________ ________________ ________________ _______________ ________________Unrestricted cash and cash equivalents, end of period $ 2,502.9 $ 129.6 $ 715.0 $ – $ 3,347.5________________ ________________ ________________ _______________ ________________________________ ________________ ________________ _______________ ________________Year Ended December 31, 2004
Cash Flows From Operating Activities:
Net cash flows provided by (used for) operations $(1,110.9) $ 116.1 $ 2,612.5 $ – $ 1,617.7________________ ________________ ________________ _______________ ________________Cash Flows From Investing Activities:
Net increase (decrease) in financing and leasing assets 433.0 (389.4) (5,139.9) – (5,096.3)
Decrease in inter-company loans and investments (3,527.0) – – 3,527.0 –
Other – – 41.6 – 41.6________________ ________________ ________________ _______________ ________________Net cash flows (used for) provided by investing activities (3,094.0) (389.4) (5,098.3) 3,527.0 (5,054.7)________________ ________________ ________________ _______________ ________________Cash Flows From Financing Activities:
Net increase (decrease) in debt 4,147.3 177.7 (473.7) – 3,851.3
Inter-company financing – (4.4) 3,531.4 (3,527.0) –
Cash dividends paid (110.9) – – – (110.9)
Other – – (66.9) – (66.9)________________ ________________ ________________ _______________ ________________Net cash flows provided by (used for) financing activities 4,036.4 173.3 2,990.8 (3,527.0) 3,673.5________________ ________________ ________________ _______________ ________________
Net (decrease) increase in cash and cash equivalents (168.5) (100.0) 505.0 – 236.5
Cash and cash equivalents, beginning of period 1,479.9 227.5 266.3 – 1,973.7________________ ________________ ________________ _______________ ________________Cash and cash equivalents, end of period $ 1,311.4 $ 127.5 $ 771.3 $ – $ 2,210.2________________ ________________ ________________ _______________ ________________________________ ________________ ________________ _______________ ________________
Item 8: Financial Statements and Supplementary Data 97

CONSOLIDATING STATEMENTS OF CASH FLOWS (continued)
CITCIT Holdings Other
(dollars in millions) Group Inc. LLC Subsidiaries Eliminations Total__________ __________ __________ __________ __________
Year Ended December 31, 2003
Cash Flows From Operating Activities:
Net cash flows provided by operations $ 979.0 $ 275.3 $ 1,227.9 $ – $ 2,482.2________________ ________________ ________________ _______________ ________________Cash Flows From Investing Activities:
Net increase (decrease) in financing and leasing assets (986.6) (366.6) (2,944.2) – (4,297.4)
Decrease in inter-company loans and investments (2,775.7) – – 2,775.7 –
Other – – 14.8 – 14.8________________ ________________ ________________ _______________ ________________Net cash flows (used for) provided by investing activities (3,762.3) (366.6) (2,929.4) 2,775.7 (4,282.6)________________ ________________ ________________ _______________ ________________Cash Flows From Financing Activities:
Net increase (decrease) in debt 3,054.1 (910.8) (300.4) – 1,842.9
Inter-company financing – 935.9 1,839.8 (2,775.7) –
Cash dividends paid (101.8) – – – (101.8)
Other – – (3.6) – (3.6)________________ ________________ ________________ _______________ ________________Net cash flows provided by (used for) financing activities 2,952.3 25.1 1,535.8 (2,775.7) 1,737.5________________ ________________ ________________ _______________ ________________Net (decrease) increase in cash and cash equivalents 169.0 (66.2) (165.7) – (62.9)
Cash and cash equivalents, beginning of period 1,310.9 293.7 432.0 – 2,036.6________________ ________________ ________________ _______________ ________________Cash and cash equivalents, end of period $ 1,479.9 $ 227.5 $ 266.3 $ – $ 1,973.7________________ ________________ ________________ _______________ ________________________________ ________________ ________________ _______________ ________________
98 CIT GROUP INC 2005
CIT GROUP INC. AND SUBSIDIARIES – NOTES TO CONSOLIDATED FINANCIAL STATEMENTS

CIT GROUP INC. AND SUBSIDIARIES – NOTES TO CONSOLIDATED FINANCIAL STATEMENTS
Item 8: Financial Statements and Supplementary Data 99
NOTE 25 – SELECTED QUARTERLY FINANCIAL DATA (UNAUDITED)
Summarized quarterly financial data are presented below.
Year Ended December 31, 2005_________________________________________________________________________________________________________First Second Third Fourth
(dollars in millions, except per share data) Quarter Quarter Quarter Quarter_______________ _______________ _______________ _______________Net finance margin $ 398.9 $ 391.7 $ 415.7 $ 428.9
Provision for credit losses 45.3 47.2 69.9 54.6
Other revenue 276.5 332.6 239.5 288.8
Salaries and general operating expenses 264.0 268.8 281.1 299.9
Provision for restructuring – 25.2 – –
Provision for income taxes (137.6) (132.9) (86.8) (106.9)
Minority interest after tax (0.9) (1.1) (0.8) (0.5)
Preferred stock dividends – – (5.2) (7.5)
Net income available to common stockholders $ 227.6 $ 249.1 $ 211.4 $ 248.3
Net income per diluted common share $ 1.06 $ 1.16 $ 1.02 $ 1.21
The 2005 first, second and third quarter information reflectsamendments from originally filed Form 10-Q reports, primarilyrelated to certain derivative transactions that did not qualify forhedge accounting. The amendments largely impacted other rev-enue and amounted to an increase in diluted earnings per share
(EPS) of $0.08 and $0.13 for the first and second quarters and adecrease of $0.04 EPS for the third quarter. These derivativetransactions decreased fourth quarter EPS by $0.06. Year-to-dateEPS increased by $0.11 as a result of these adjustments. SeeItem 9A. Controls and Procedures.
Year Ended December 31, 2004_________________________________________________________________________________________________________First Second Third Fourth
Quarter Quarter Quarter Quarter_______________ _______________ _______________ _______________Net finance margin $ 363.1 $ 371.0 $ 393.4 $ 407.8
Provision for credit losses 85.6 65.7 60.2 2.7
Other revenue 231.1 236.5 216.7 202.8
Salaries and general operating expenses 240.0 252.4 248.1 271.6
Gain on debt call 41.8 – – –
Provision for income taxes (121.1) (112.8) (117.7) (131.6)
Minority interest after tax – – (0.2) (0.9)
Net income available to common stockholders $ 189.3 $ 176.6 $ 183.9 $ 203.8
Net income per diluted common share $ 0.88 $ 0.82 $ 0.86 $ 0.95
Year Ended December 31, 2003_________________________________________________________________________________________________________First Second Third Fourth
Quarter Quarter Quarter Quarter_______________ _______________ _______________ _______________Net finance margin $ 300.5 $ 326.5 $ 329.0 $ 347.1
Provision for credit losses 103.0 100.6 82.9 100.8
Other revenue 235.5 217.6 220.7 185.5
Salaries and general operating expenses 220.4 214.5 224.2 229.1
Gain on debt call – – – 50.4
Provision for income taxes (82.9) (89.3) (94.6) (98.2)
Dividends on preferred capital securities, after tax (2.7) (2.7) – –
Minority interest after tax – (0.1) (0.2) 0.3
Net income available to common stockholders $ 127.0 $ 136.9 $ 147.8 $ 155.2
Net income per diluted common share $ 0.60 $ 0.65 $ 0.69 $ 0.72

100 CIT GROUP INC 2005
ITEM 9. Changes in and Disagreements with Accountants on Accounting and Financial Disclosure
None
ITEM 9A. Controls and ProceduresCONCLUSION REGARDING THE EFFECTIVENESS OFDISCLOSURE CONTROLS AND PROCEDURES
Under the supervision and with the participation of our man-agement, including our principal executive officer and principalfinancial officer, we conducted an evaluation of our disclosurecontrols and procedures, as such term is defined under Rule13a-15(e) promulgated under the Securities Exchange Act of1934, as amended (the Exchange Act). Based on this evaluation,our principal executive officer and our principal financial officerconcluded that our disclosure controls and procedures wereeffective as of the end of the period covered by this annualreport.
MANAGEMENT’S REPORT ON INTERNAL CONTROL OVERFINANCIAL REPORTING
Management of CIT is responsible for establishing and main-taining adequate internal control over financial reporting, assuch term is identified in Exchange Act Rules 13a-15(f ).Internal control over financial reporting is a process designed toprovide reasonable assurance regarding the reliability of financialreporting and the preparation of financial statements for exter-nal purposes in accordance with generally accepted accountingprinciples. A company’s internal control over financial reportingincludes those policies and procedures that (i) pertain to themaintenance of records that, in reasonable detail, accurately andfairly reflect the transactions and dispositions of the assets of thecompany; (ii) provide reasonable assurance that transactions arerecorded as necessary to permit preparation of financial state-ments in accordance with generally accepted accounting princi-ples, and that receipts and expenditures of the company arebeing made only in accordance with authorizations of manage-ment and directors of the company; and (iii) provide reasonableassurance regarding prevention or timely detection of unautho-rized acquisition, use, or disposition of the company’s assets thatcould have a material effect on the financial statements.
Because of its inherent limitations, internal control over finan-cial reporting may not prevent or detect misstatements. Also,projections of any evaluation of effectiveness to future periodsare subject to the risk that controls may become inadequatebecause of changes in conditions, or that the degree of compli-ance with the policies or procedures may deteriorate.
Management of CIT, including our principal executive officerand principal financial officer, conducted an evaluation of theeffectiveness of the Company’s internal control over financialreporting as of December 31, 2005 using the criteria set forth bythe Committee of Sponsoring Organizations of the Treadway
Commission in Internal Control – Integrated Framework. Webelieve that this evaluation provides a reasonable basis for ouropinion.
Based on the assessment performed, management concludedthat as of December 31, 2005 the Company’s internal controlover financial reporting was effective.
Management’s assessment of the effectiveness of the Company’sinternal control over financial reporting as of December 31,2005 has been audited by PricewaterhouseCoopers LLP, anindependent registered public accounting firm, as stated in theirreport which appears on pages 51 through 52.
CHANGES IN INTERNAL CONTROL OVER FINANCIALREPORTING
Income Tax Accounting
As of the end of the period covered by this report, we have reme-diated the material weakness in the Company’s internal controlover income tax deferred assets and liabilities that existed as ofDecember 31, 2004. Our remediation during 2005 focused ondeveloping a reconciliation between the tax basis and book basisof each component of the Company’s balance sheet with thedeferred tax asset and liability accounts. Key elements of ourremediation actions included the following:
p Hired and trained additional tax personnel;
p Enhanced tax reporting systems and implemented processes and controls with respect to income tax reporting and com-pliance;
p Computed the book to tax basis differences on an asset andliability transactional level and further automated the relatedcalculations and controls;
p Documented and tested remediated tax reporting internalcontrols; and
p Updated and formalized tax accounting policies and proce-dures.
With respect to our 2004 financial statements, managementperformed alternative analyses and reconciliations of theincome tax balance sheet and income statement accountsand based thereon concluded that no material adjustment tothe Company’s reported balance sheet or net income as of orfor the year ended December 31, 2004 was required.

101
Derivative Hedge Accounting
As of the end of the period covered by this report, we have reme-diated the material weakness relating to derivative documenta-tion and hedge accounting treatment that is described below.Our remediation actions included the following:
p All of the subject compound swaps have been replaced withcorresponding stand alone replacement swaps (a cross-cur-rency basis swap and an interest rate swap, both with zero fairvalue at inception), which qualify for hedge accounting treat-ment under SFAS 133.
p We do not intend to transact compound swaps prospectivelyand have communicated a formal prohibition against suchtransactions to the appropriate treasury, accounting, and legalpersonnel.
p We have updated our derivative policy manual to specificallyprohibit the use of compound swaps.
p We have conducted training sessions with the appropriatetreasury, accounting, legal and internal audit personnel withrespect to the above to ensure that we evaluate and documentderivative transactions in compliance with SFAS 133.
A material weakness is a control deficiency, or combination ofcontrol deficiencies, that results in more than a remote likelihoodthat a material misstatement of the annual or interim financialstatements will not be prevented or detected.
During the fourth quarter of 2005, we learned of an interpreta-tion with respect to applying the “matched terms” approach inhedge accounting under Statement of Financial AccountingStandards No. 133, “Accounting for Derivative Instruments andHedging Activities,” as amended (“SFAS 133”). We reviewed ouraccounting for certain cross-currency interest rate swaps (“com-pound swaps” or “compound derivatives”) under SFAS 133.
We determined that certain compound swaps were not appropri-ately accounted for, even though these swaps were highly effec-tive economic hedges of the interest rate and currency exchangerisks associated with corresponding foreign denominated debt.We documented these swaps originally as “matched terms”hedges, which assumes no hedge ineffectiveness. The swapswould have qualified for “long-haul” hedge accounting, withineffectiveness reflected in current earnings. However, the swapsdid not qualify for hedge accounting treatment from their incep-tion, as SFAS 133 does not allow for retroactive documentationmodifications.
The elimination of hedge accounting from inception of the com-pound swaps resulted in the restatement of previously-issuedfinancial statements in each of the first three quarterly periods of2005 to reflect the elimination of adjustments to the correspon-ding debt under SFAS 133 fair value hedge accounting forchanges in interest rates during each period. These adjustmentsto earnings which amounted to $26.7 million after tax, willreduce future earnings by an equal amount through 2015.
In connection with the restatement as filed on December 13,2005, under the direction of our principal executive officer andour principal financial officer, we determined that the above con-dition constituted a material weakness in internal control withrespect to our accounting treatment and related hedge documen-tation for certain cross-currency swaps as of December 31, 2004.
Other than the changes discussed above, there have been nochanges to the Company’s internal control over financial report-ing that occurred since the beginning of the Company’s fourthquarter of 2005 that have materially affected, or are reasonablylikely to materially affect, the Company’s internal control overfinancial reporting.
ITEM 9B. Other InformationNone

102 CIT GROUP INC 2005
The information called for by Item 10 is incorporated by refer-ence from the information under the caption “Election of
Directors” and “Election of Directors – Executive Officers” in ourProxy Statement for our 2006 annual meeting of stockholders.
Part Three
ITEM 10. Directors and Executive Officers of the Registrant
ITEM 11. Executive CompensationThe information called for by Item 11 is incorporated by refer-ence from the information under the caption “Compensation of
Directors and Executive Officers” in our Proxy Statement forour 2006 annual meeting of stockholders.
ITEM 12. Security Ownership of Certain Beneficial Ownersand Management and Related Stockholder Matters
The information called for by Item 12 is incorporated by refer-ence from the information under the caption “Principal
Shareholders” in our Proxy Statement for our 2006 annualmeeting of stockholders.
ITEM 13. Certain Relationships and Related TransactionsThe information called for by Item 13 is incorporated by refer-ence from the information under the caption “Certain
Relationships and Related Transactions” in our Proxy Statementfor our 2006 annual meeting of stockholders.
ITEM 14. Principal Accountant Fees and ServicesThe information called for by Item 14 is incorporated by refer-ence from the information under the caption “Appointment of
Independent Accountants” in our Proxy Statement for our 2006annual meeting of stockholders.

103
Part Four
ITEM 15. Exhibits and Financial Statement Schedules
(a) The following documents are filed with the Securities andExchange Commission as part of this report (see Item 8):
1. The following financial statements of CIT andSubsidiaries:
Report of Independent Registered Public Accounting Firm
Consolidated Balance Sheets at December 31, 2005 andDecember 31, 2004.
Consolidated Statements of Income for the years endedDecember 31, 2005, 2004 and 2003.
Consolidated Statements of Stockholders’ Equity for theyears ended December 31, 2005, 2004 and 2003.
Consolidated Statements of Cash Flows for the years endedDecember 31, 2005, 2004 and 2003.
Notes to Consolidated Financial Statements
2. All schedules are omitted because they are not applicable orbecause the required information appears in theConsolidated Financial Statements or the notes thereto.
(b) Exhibits
3.1 Second Restated Certificate of Incorporation of theCompany (incorporated by reference to Form 10-Qfiled by CIT on August 12, 2003).
3.2 Amended and Restated By-laws of the Company(incorporated by reference to Form 10-Q filed by CITon August 12, 2003).
3.3 Certificate of Designations relating to the Company’s6.350% Non-Cumulative Preferred Stock, Series A(incorporated by reference to Exhibit 3 to Form 8-Afiled by CIT on July 29, 2005).
3.4 Certificate of Designations relating to the Company’sNon-Cumulative Preferred Stock, Series B (incorpo-rated by reference to Exhibit 3 to Form 8-A filed byCIT on July 29, 2005).
4.1 Form of Certificate of Common Stock of CIT (incor-porated by reference to Exhibit 4.1 to AmendmentNo. 3 to the Registration Statement on Form S-3 filedJune 26, 2002).
4.2 Indenture dated as of August 26, 2002 by and amongCIT Group Inc., J.P. Morgan Trust Company,National Association (as successor to Bank One TrustCompany, N.A.), as Trustee and Bank One NA,London Branch, as London Paying Agent and LondonCalculation Agent, for the issuance of unsecured andunsubordinated debt securities (Incorporated by refer-ence to Exhibit 4.18 to Form 10-K filed by CIT onFebruary 26, 2003).
4.3 Form of Indenture dated as of October 29, 2004between CIT Group Inc. and J.P. Morgan TrustCompany, National Association for the issuance ofsenior debt securities (Incorporated by reference toExhibit 4.4 to Form S-3/A filed by CIT on October28, 2004).
4.4 Form of Indenture dated as of October 29, 2004between CIT Group Inc. and J.P. Morgan TrustCompany, National Association for the issuance ofsubordinated debt securities (Incorporated by refer-ence to Exhibit 4.5 to Form S-3/A filed by CIT onOctober 28, 2004).
4.5 Certain instruments defining the rights of holders ofCIT’s long-term debt, none of which authorize a totalamount of indebtedness in excess of 10% of the totalamounts outstanding of CIT and its subsidiaries on aconsolidated basis have not been filed as exhibits. CITagrees to furnish a copy of these agreements to theCommission upon request.
4.6 5-Year Credit Agreement, dated as of October 10,2003 among J.P. Morgan Securities Inc., a joint leadarranger and bookrunner, Citigroup Global MarketsInc., as joint lead arranger and bookrunner, JPMorgan Chase Bank as administrative agent, Bank ofAmerica, N.A. as syndication agent, and Barclays BankPLC, as documentation agent (Incorporated by refer-ence to Exhibit 4.2 to Form 10-Q filed by CIT onNovember 7, 2003).
4.7 364-Day Credit Agreement, dated as of April 14,2004, among CIT Group Inc., the several banks andfinancial institutions named therein, J.P. MorganSecurities, Inc., and Banc of America Securities LLC,as joint lead arrangers and bookrunners, JP MorganChase Bank, as administrative agent, and Bank ofAmerica, N.A. and Citibank N.A., as syndication

104 CIT GROUP INC 2005
agents and Barclays Bank PLC, as documentationagent (Incorporated by reference to Exhibit 4.2 toForm 10-Q filed by CIT on May 7, 2004).
4.8 5-Year Credit Agreement, dated as of April 14, 2004,among CIT Group Inc., the several banks and finan-cial institutions named therein, J.P. Morgan SecuritiesInc. and Citigroup Global Markets Inc., as joint leadarrangers and bookrunners, JP Morgan Chase Bank, asadministrative agent, Bank of America, N.A., as syndi-cation agents and Barclays Bank PLC, as documenta-tion agent (Incorporated by reference to Exhibit 4.3 toForm 10-Q filed by CIT on May 7, 2004).
10.1 Agreement dated as of June 1, 2001 between CITHoldings (NV) Inc., a wholly-owned subsidiary ofTyco International Ltd., and CIT (formerly known asTyco Capital Corporation and Tyco Acquisition Corp.XX (NV) and successor to The CIT Group, Inc.), aNevada corporation, regarding transactions betweenCIT Holdings and CIT (incorporated by reference toExhibit 10.1 to Amendment No. 3 to the RegistrationStatement on Form S-3 filed June 7, 2002).
10.2 Form of Separation Agreement by and between TycoInternational Ltd. and CIT (incorporated by referenceto Exhibit 10.2 to Amendment No. 3 to theRegistration Statement on Form S-3 filed June 26,2002).
10.3 Form of Financial Services Cooperation Agreement byand between Tyco International Ltd. and CIT (incor-porated by reference to Exhibit [10.3] to AmendmentNo. 3 to the Registration Statement on Form S-3 filedJune 12, 2002).
10.4* Employment Agreement for Joseph M. Leone dated asof August 1, 2004 (incorporated by reference toExhibit 10.3 to Form 10-Q filed by CIT onNovember 9, 2004).
10.5* Employment Agreement for Thomas B. Hallmandated as of August 1, 2004 (incorporated by referenceto Exhibit 10.2 to Form 10-Q filed by CIT onNovember 9, 2004).
10.6* Employment Agreement for Lawrence A. Marsiellodated as of August 1, 2004 (incorporated by referenceto Exhibit 10.4 to Form 10-Q filed by CIT onNovember 9, 2004).
10.7* Employment Agreement for Jeffrey M. Peek dated asof July 22, 2003 (incorporated by reference to Form10-Q filed by CIT on November 7, 2003).
10.8* Amendment to Employment Agreement by andamong CIT Group Inc. and Jeffrey M. Peek dated asof July 22, 2004 (Incorporated by reference to Exhibit10.1 to Form 10-Q filed by CIT on November 9,2004).
10.9* Employment Agreement by and among CIT GroupInc. and Frederick E. Wolfert dated as of August 1,2004 (Incorporated by reference to Exhibit 10.5 toForm 10-Q filed by CIT on November 9, 2004).
10.10* 2004 Extension and Funding Agreement datedSeptember 8, 2004, by and among Dell FinancialServices L.P., Dell Credit Company L.L.C., DFS-SPVL.P., DFS-GP, Inc., Dell Inc., Dell Gen. P. Corp., DellDFS Corporation, CIT Group Inc., CIT FinancialUSA, Inc., CIT DCC Inc., CIT DFS Inc., CITCommunications Finance Corporation, and CITCredit Group USA Inc. (Incorporated by reference toForm 8-K filed by CIT on September 9, 2004).
10.11* Executive Severance Plan (incorporated by reference toExhibit 10.24 to Amendment No. 3 to theRegistration Statement on Form S-3 filed June 26,2002).
10.12* Long-Term Equity Compensation Plan (incorporatedby reference to Form DEF-14A filed April 23, 2003).
10.13 Form of Indemnification Agreement (incorporated byreference to Exhibit 10.26 to Amendment No. 3 to theRegistration Statement on Form S-3 filed June 26,2002).
10.14 Form of Tax Agreement by and between TycoInternational Ltd. and CIT (incorporated by referenceto Exhibit 10.27 to Amendment No. 3 to theRegistration Statement on Form S-3 filed June 26,2002).
10.15 Master Confirmation Agreement and the relatedSupplemental Confirmation dated as of July 19, 2005between Goldman, Sachs and Co. and CIT GroupInc. relating to CIT’s accelerated stock repurchase pro-gram (incorporated by reference to Exhibit 10.1 toForm 10-Q filed by CIT on August 5, 2005).
10.16 Agreement and Plan of Merger, dated as of January 4,2005, among Education Lending Group, Inc. CITGroup Inc. and CIT ELG Corporation (incorporatedby reference to Exhibit 99.2 to the Form 8-K filed byCIT on January 6, 2005).
12.1 CIT Group Inc. and Subsidiaries Computation ofEarnings to Fixed Charges.

21.1 Subsidiaries of CIT.
23.1 Consent of PricewaterhouseCoopers LLP.
24.1 Powers of Attorney.
31.1 Certification of Jeffrey M. Peek pursuant to Rules 13a-15(e) and 15d-15(f ) of the Securities ExchangeCommission, as promulgated pursuant to Section13(a) of the Securities Exchange Act and Section 302of the Sarbanes-Oxley Act of 2002.
31.2 Certification of Joseph M. Leone pursuant to Rules13a-15(e) and 15d-15(f ) of the Securities ExchangeCommission, as promulgated pursuant to Section13(a) of the Securities Exchange Act and Section 302of the Sarbanes-Oxley Act of 2002.
32.1 Certification of Jeffrey M. Peek pursuant to 18 U.S.C.Section 1350, as adopted pursuant to Section 906 ofthe Sarbanes-Oxley Act of 2002.
32.2 Certification of Joseph M. Leone pursuant to 18U.S.C. Section 1350, as adopted pursuant to Section906 of the Sarbanes-Oxley Act of 2002.
105
* Indicates a management contract or compensatory plan or arrangement.
SIGNATURES
Pursuant to the requirements of Section 13 or 15(d) of the Securities Exchange Act of 1934, the Registrant has duly caused this reportto be signed on its behalf by the undersigned, thereunto duly authorized.
CIT GROUP INC.
By: /s/ ROBERT J. INGATO_______________________________March 6, 2006 Robert J. Ingato
Executive Vice President, General Counseland Secretary
Pursuant to the requirements of the Securities Exchange Act of 1934, this report has been signed below by the following persons onMarch 6, 2006 in the capacities indicated below.
Name_____/S/ JEFFREY M. PEEK_____________________________________________________________
Jeffrey M. PeekChairman and Chief Executive Officer
and Director
GARY C. BUTLER*_____________________________________________________________Gary C. Butler
Director
WILLIAM FREEMAN*_____________________________________________________________William Freeman
Director
THOMAS H. KEAN*_____________________________________________________________Thomas H. Kean
Director
MARIANNE MILLER PARRS*_____________________________________________________________Marianne Miller Parrs
Director
TIMOTHY M. RING*_____________________________________________________________Timothy M. Ring
Director
_____________________________________________________________John R. Ryan
Director
SEYMOUR STERNBERG *_____________________________________________________________Seymour Sternberg
Director
PETER J. TOBIN*_____________________________________________________________Peter J. Tobin
Director
LOIS M.VAN DEUSEN*_____________________________________________________________Lois M. Van Deusen
Director
/S/ JOSEPH M. LEONE_____________________________________________________________Joseph M. Leone
Vice Chairman andChief Financial Officer
/S/ WILLIAM J. TAYLOR_____________________________________________________________William J. Taylor
Executive Vice President, Controller andPrincipal Accounting Officer
*BY: /S/ ROBERT J. INGATO_____________________________________________________________Robert J. Ingato
Executive Vice President, General Counseland Secretary
* Original powers of attorney authorizing Robert J. Ingato, and James P. Shanahan and each of them to sign on behalf of the above-mentioned directors areheld by the Corporation and available for examination by the Securities and Exchange Commission pursuant to Item 302(b) of Regulation S-T.
106 CIT GROUP INC 2005

Where You Can Find More Information
A copy of the Annual Report on Form 10-K, including theexhibits and schedules thereto, may be read and copied at theSEC’s Public Reference Room at 450 Fifth Street, N.W.,Washington D.C. 20549. Information on the Public ReferenceRoom may be obtained by calling the SEC at 1-800-SEC-0330.In addition, the SEC maintains an Internet site athttp://www.sec.gov, from which interested parties can electroni-cally access the Annual Report on Form 10-K, including theexhibits and schedules thereto.
The Annual Report on Form 10-K, including the exhibits andschedules thereto, and other SEC filings, are available free ofcharge on the Company’s Internet site at http://www.cit.com assoon as reasonably practicable after such material is electronicallyfiled with the SEC. Copies of our Corporate GovernanceGuidelines, the Charters of the Audit Committee, theCompensation Committee, and the Nominating andGovernance Committee, and our Code of Business Conduct areavailable, free of charge, on our internet site athttp://www.cit.com, and printed copies are available by contact-ing Investor Relations, 1 CIT Drive, Livingston, NJ 07039 or bytelephone at (973) 740-5000.
107

EXHIBIT 12.1
CIT Group Inc. and SubsidiariesComputation of Ratio of Earnings to Fixed Charges
Three Months Nine MonthsYear Ended Year Ended Year Ended Ended Year Ended Ended
December 31, December 31, December 31, December 31, September 30, September 30,2005 2004 2003 2002 2002 2001_______________________ _______________________ _______________________ _______________________ ________________________ ________________________
Net income $ 936.4 $ 753.6 $ 566.9 $141.3 $(6,698.7) $ 263.3
Provision for income taxes 464.2 483.3 361.6 90.3 367.6 236.3______________ ______________ ______________ __________ ______________ ` ______________Earnings before provision
for income taxes 1,400.6 1,236.9 928.5 231.6 (6,331.1) 499.6______________ ______________ ______________ __________ ______________ ` ______________Fixed charges:
Interest and debt expenses on indebtedness 1,894.3 1,242.6 1,348.7 349.5 1,464.6 1,636.9
Minority interest in subsidiary trust holding
Solely debentures of the Company, before tax 17.7 17.5 8.8 4.4 16.9 14.4
Interest factor-one-third of rentals on real andpersonal properties 14.3 13.4 14.4 3.8 15.6 13.5______________ ______________ ______________ __________ ______________ ` ______________
Total fixed charges 1,926.3 1,273.5 1,371.9 357.7 1,497.1 1,664.8______________ ______________ ______________ __________ ______________ ` ______________Total earnings before
provisions for income taxes and fixed charges $3,326.9 $2,510.4 $2,300.4 $589.3 $(4,834.0) $2,164.4______________ ______________ ______________ __________ ______________ ` ____________________________ ______________ ______________ __________ ______________ ` ______________
Ratios of earnings to fixed charges 1.73x 1.97x 1.68x 1.65x (1) 1.30x
(1) Earnings were insufficient to cover fixed charges by $6,331.1 million in the year ended September 30, 2002. Earnings for the year ended September 30,2002 included a goodwill impairment charge of $6,511.7 million in accordance with SFAS 142, “Goodwill and Other Intangible Assets.”

EXHIBIT 31.1
CERTIFICATIONS
I, Jeffrey M. Peek, certify that:
1. I have reviewed this annual report on Form 10-K of CIT Group Inc.;
2. Based on my knowledge, this report does not contain any untrue statement of a material fact or omit to state a material factnecessary to make the statements made, in light of the circumstances under which such statements were made, not misleading withrespect to the period covered by this report;
3. Based on my knowledge, the financial statements, and other financial information included in this report, fairly present in allmaterial respects the financial condition, results of operations and cash flows of the registrant as of, and for, the periods presented in thisreport;
4. The registrant’s other certifying officer and I are responsible for establishing and maintaining disclosure controls and proce-dures (as defined in Exchange Act Rules 13a-15(e) and 15d-15(e)) and internal control over financial reporting (as defined in ExchangeAct Rules 13a-15(f ) and 15d-15(f )) for the registrant and have:
(a) designed such disclosure controls and procedures, or caused such disclosure controls and procedures to bedesigned under our supervision, to ensure that material information relating to the registrant, including its consolidated sub-sidiaries, is made known to us by others within those entities, particularly during the period in which this report is being pre-pared;
(b) designed such internal control over financial reporting, or caused such internal control over financial reporting tobe designed under our supervision, to provide reasonable assurance regarding the reliability of financial reporting and the prepara-tion of financial statements for external purposes in accordance with generally accepted accounting principals;
(c) evaluated the effectiveness of the registrant’s disclosure controls and procedures and presented in this report ourconclusions about the effectiveness of the disclosure controls and procedures, as of the end of the period covered by this reportbased on such evaluation; and
(d) disclosed in this report any change in the registrant’s internal control over financial reporting that occurred duringthe registrant’s fourth fiscal quarter that has materially affected, or is reasonably likely to materially affect, the registrant’s internalcontrol over financial reporting; and
5. The registrant’s other certifying officer and I have disclosed, based on our most recent evaluation of internal control over finan-cial reporting, to the registrant’s auditors and the audit committee of registrant’s board of directors (or persons performing the equiva-lent functions):
a) all significant deficiencies and material weaknesses in the design or operation of internal controls over financialreporting which are reasonably likely to adversely affect the registrant’s ability to record, process, summarize and report financialinformation; and
b) any fraud, whether or not material, that involves management or other employees who have a significant role inthe registrant’s internal control over financial reporting.
Date: March 6, 2006
/S/ JEFFREY M. PEEK______________________________Jeffrey M. Peek
Chairman and Chief Executive Officer

EXHIBIT 31.2
CERTIFICATIONS
I, Joseph M. Leone, certify that:
1. I have reviewed this annual report on Form 10-K of CIT Group Inc.;
2. Based on my knowledge, this report does not contain any untrue statement of a material fact or omit to state a material factnecessary to make the statements made, in light of the circumstances under which such statements were made, not misleading withrespect to the period covered by this report;
3. Based on my knowledge, the financial statements, and other financial information included in this report, fairly present in allmaterial respects the financial condition, results of operations and cash flows of the registrant as of, and for, the periods presented in thisreport;
4. The registrant’s other certifying officer and I are responsible for establishing and maintaining disclosure controls and proce-dures (as defined in Exchange Act Rules 13a-15(e) and 15d-15(e)) and internal control over financial reporting (as defined in ExchangeAct Rules 13a-15(f ) and 15d-15(f )) for the registrant and have:
(a) designed such disclosure controls and procedures, or caused such disclosure controls and procedures to bedesigned under our supervision, to ensure that material information relating to the registrant, including its consolidated sub-sidiaries, is made known to us by others within those entities, particularly during the period in which this report is being pre-pared;
(b) designed such internal control over financial reporting, or caused such internal control over financial reporting tobe designed under our supervision, to provide reasonable assurance regarding the reliability of financial reporting and the prepara-tion of financial statements for external purposes in accordance with generally accepted accounting principals;
(c) evaluated the effectiveness of the registrant’s disclosure controls and procedures and presented in this report ourconclusions about the effectiveness of the disclosure controls and procedures, as of the end of the period covered by this reportbased on such evaluation; and
(d) disclosed in this report any change in the registrant’s internal control over financial reporting that occurred duringthe registrant’s fourth fiscal quarter that has materially affected, or is reasonably likely to materially affect, the registrant’s internalcontrol over financial reporting; and
5. The registrant’s other certifying officer and I have disclosed, based on our most recent evaluation of internal control over finan-cial reporting, to the registrant’s auditors and the audit committee of registrant’s board of directors (or persons performing the equiva-lent functions):
a) all significant deficiencies and material weaknesses in the design or operation of internal controls over financialreporting which are reasonably likely to adversely affect the registrant’s ability to record, process, summarize and report financialinformation; and
b) any fraud, whether or not material, that involves management or other employees who have a significant role inthe registrant’s internal control over financial reporting.
Date: March 6, 2006
/S/ JOSEPH M. LEONE______________________________Joseph M. Leone
Vice Chairman and Chief Financial Officer

EXHIBIT 32.1
Certification Pursuant toSection 18 U.S.C. Section 1350,
As Adopted Pursuant toSection 906 of the Sarbanes-Oxley Act of 2002
In connection with the Annual Report of CIT Group Inc. (“CIT”) on Form 10-K for the year ended December 31, 2005, as filedwith the Securities and Exchange Commission on the date hereof (the “Report”), I, Jeffrey M. Peek, the Chief Executive Officer of CIT,certify, pursuant to 18 U.S.C. §1350, as adopted pursuant to Section 906 of the Sarbanes-Oxley Act of 2002, that;
(i) The Report fully complies with the requirements of Section 13(a) or 15(d), as applicable, of the Securities Exchange Act of1934; and
(ii) The information contained in the Report fairly presents, in all material respects, the financial condition and results of opera-tions of CIT.
/S/ JEFFREY M. PEEK___________________Jeffrey M. PeekChairman andChief Executive OfficerCIT Group Inc.
Dated: March 6, 2006

EXHIBIT 32.2
Certification Pursuant toSection 18 U.S.C. Section 1350,
As Adopted Pursuant toSection 906 of the Sarbanes-Oxley Act of 2002
In connection with the Annual Report of CIT Group Inc. (“CIT”) on Form 10-K for the year ended December 31, 2005, as filedwith the Securities and Exchange Commission on the date hereof (the “Report”), I, Joseph M. Leone, the Chief Financial Officer ofCIT, certify, pursuant to 18 U.S.C. §1350, as adopted pursuant to Section 906 of the Sarbanes-Oxley Act of 2002, that;
(i) The Report fully complies with the requirements of Section 13(a) or 15(d), as applicable, of the Securities Exchange Act of1934; and
(ii) The information contained in the Report fairly presents, in all material respects, the financial condition and results of opera-tions of CIT.
/S/ JOSEPH M. LEONE______________________________Joseph M. LeoneVice Chairman and Chief Financial OfficerCIT Group Inc.
Dated: March 6, 2006