Embed Size (px)
Citation preview
Citizen based monitoring and the charismatic megafauna of Wisconsin
Timothy Van Deelen
David MacFarland
University of Wisconsin at Madison
ALLposters.com
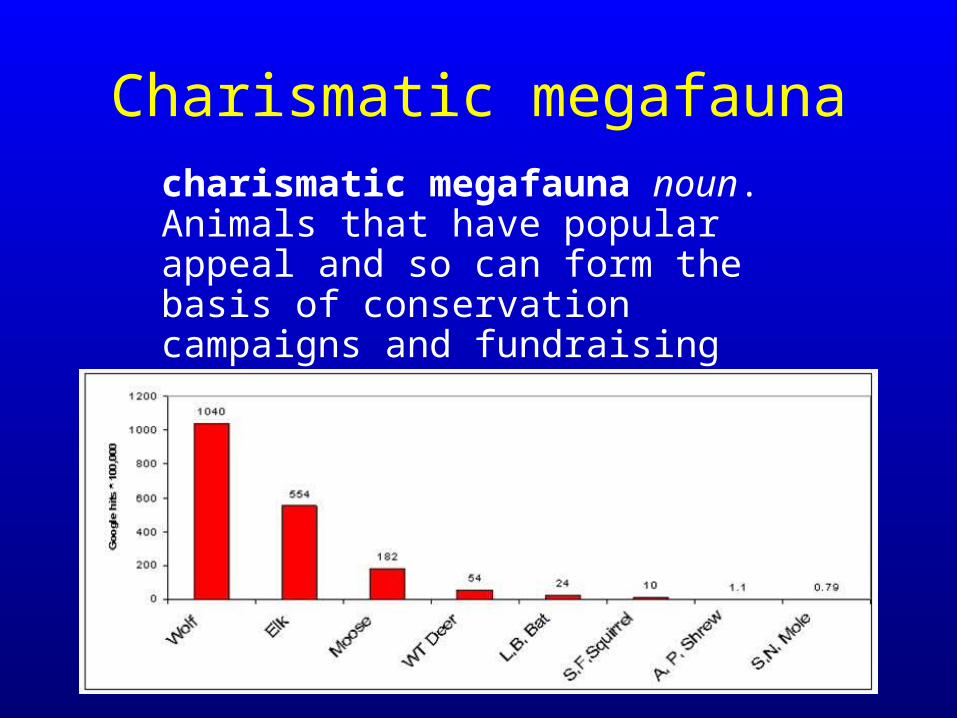
Charismatic megafaunacharismatic megafauna noun. Animals that have popular appeal and so can form the basis of conservation campaigns and fundraising drives.
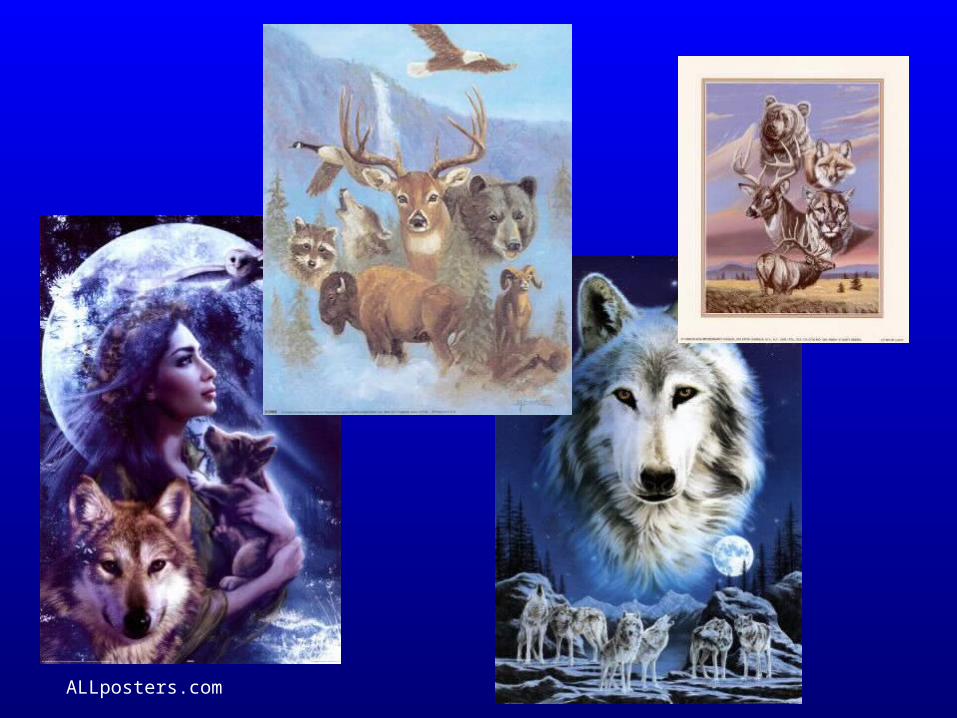
ALLposters.com
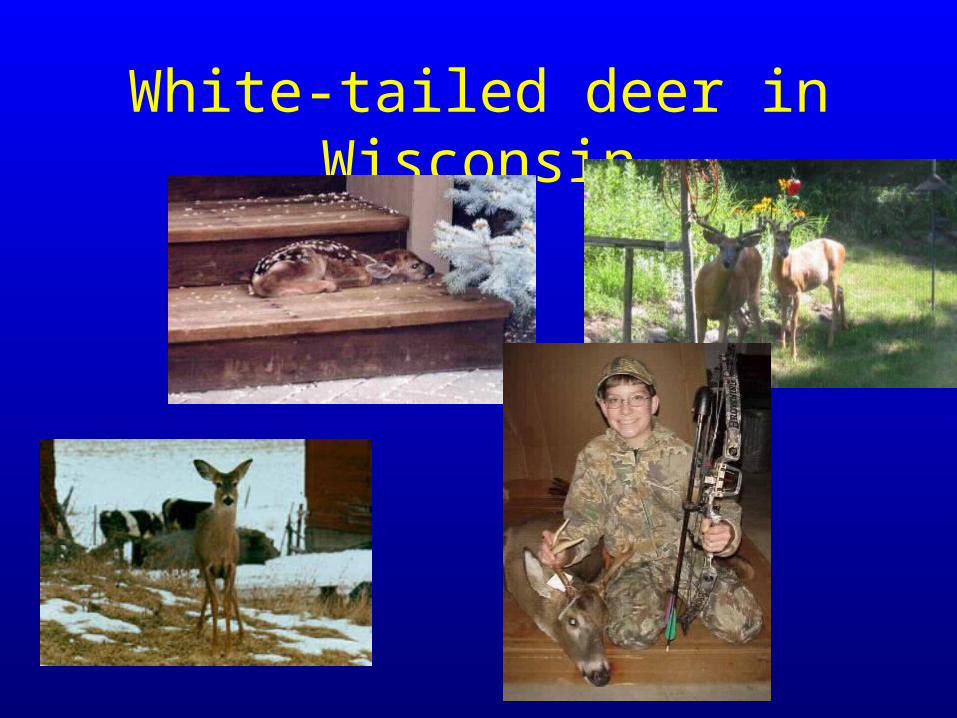
White-tailed deer in Wisconsin

Early population influences
• Native American hunting
• Fur trade• Logging• Settlement• Market hunting
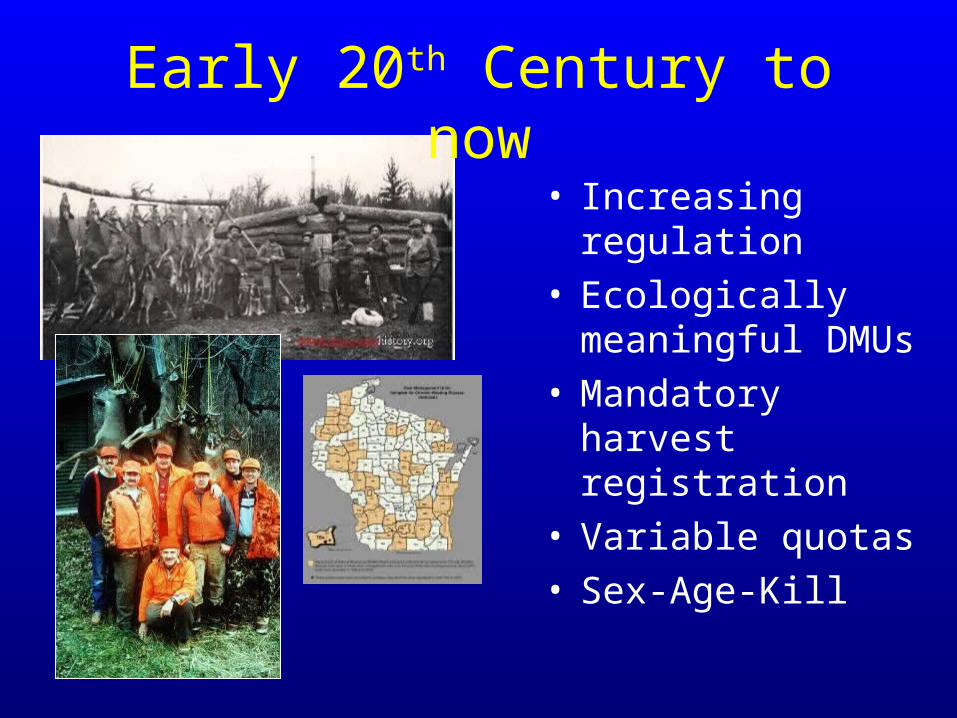
Early 20th Century to now
• Increasing regulation• Ecologically meaningful
DMUs• Mandatory harvest
registration• Variable quotas• Sex-Age-Kill
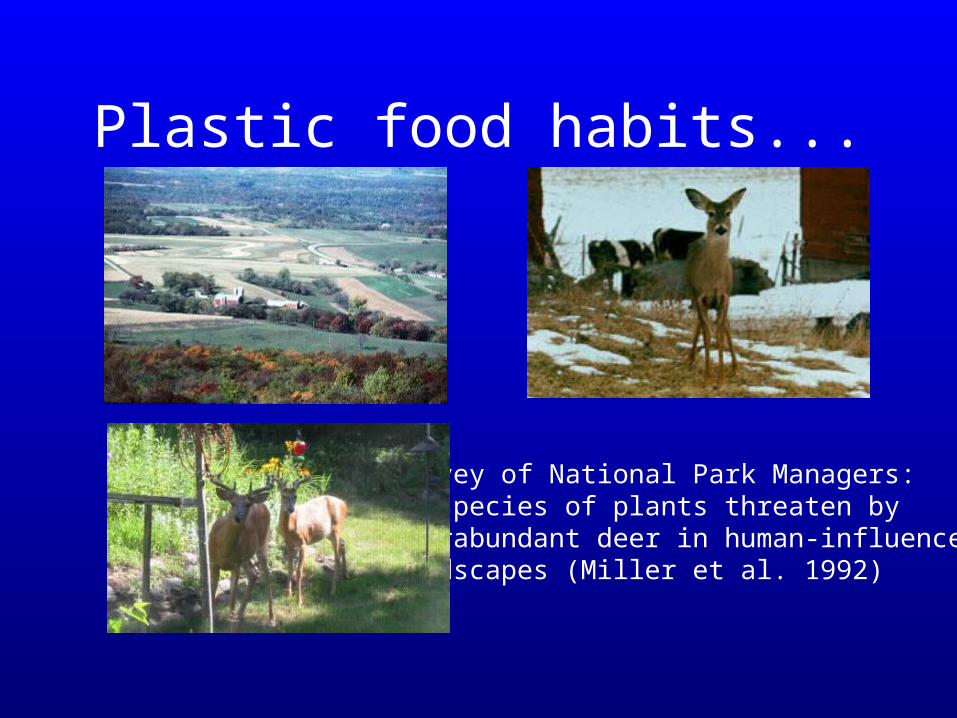
Plastic food habits...
Survey of National Park Managers:98 species of plants threaten by overabundant deer in human-influencedlandscapes (Miller et al. 1992)
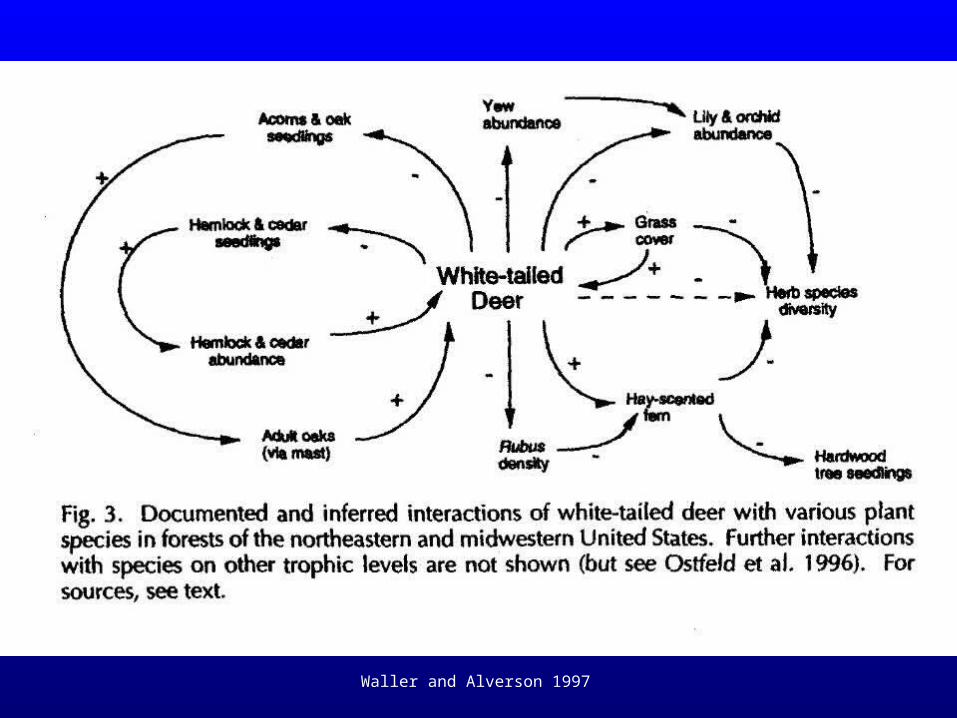
Waller and Alverson 1997
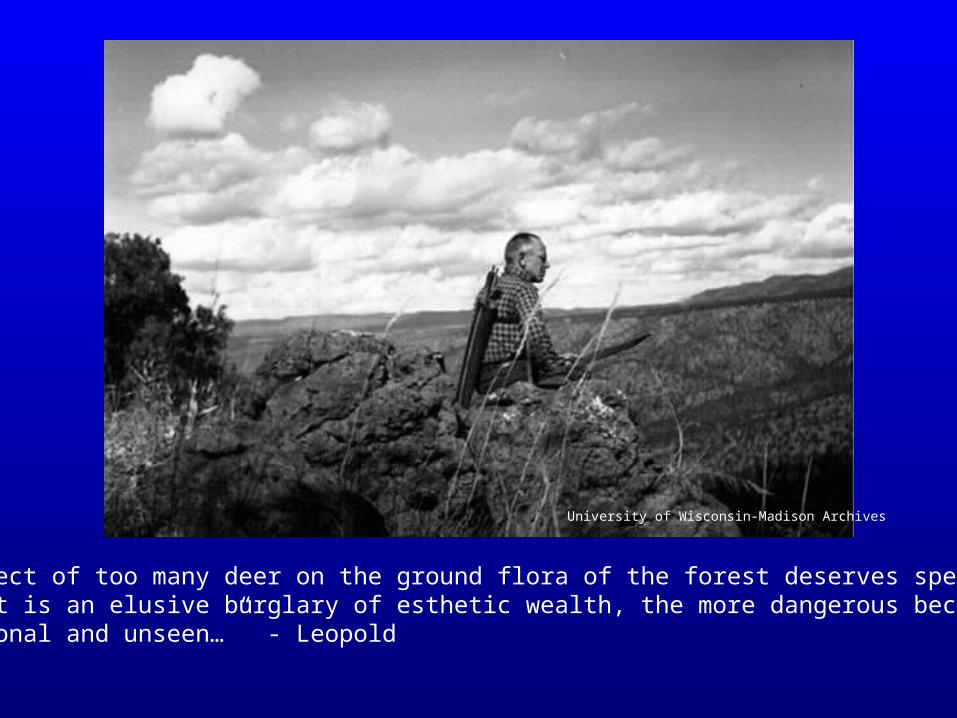
“This effect of too many deer on the ground flora of the forest deserves special mentionbecause it is an elusive burglary of esthetic wealth, the more dangerous because unintentional and unseen…” - Leopold
University of Wisconsin-Madison Archives
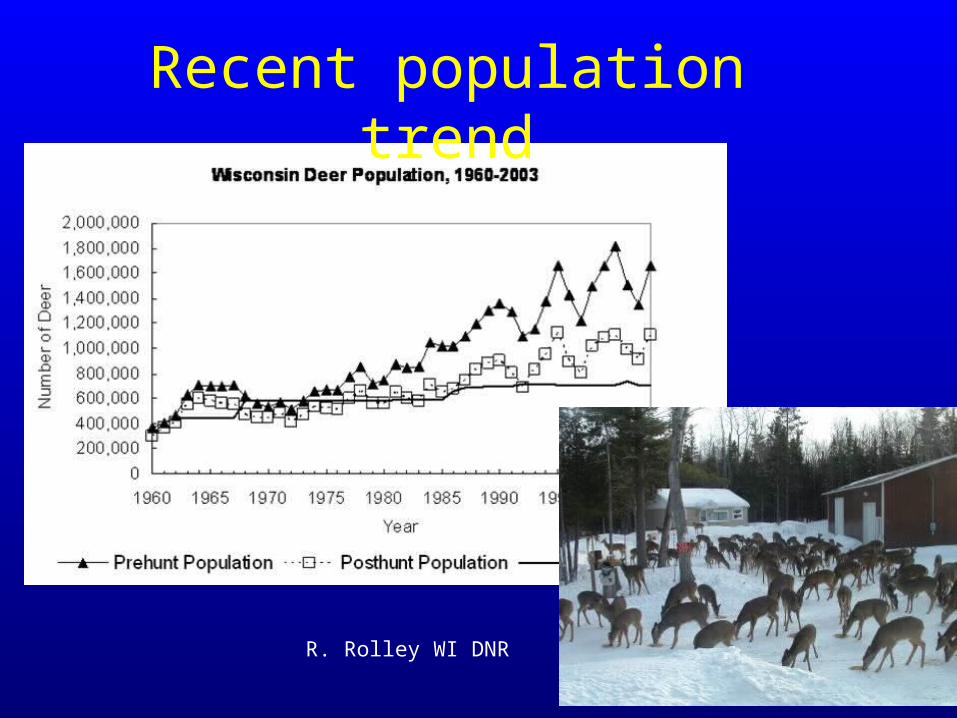
Recent population trend
R. Rolley WI DNR
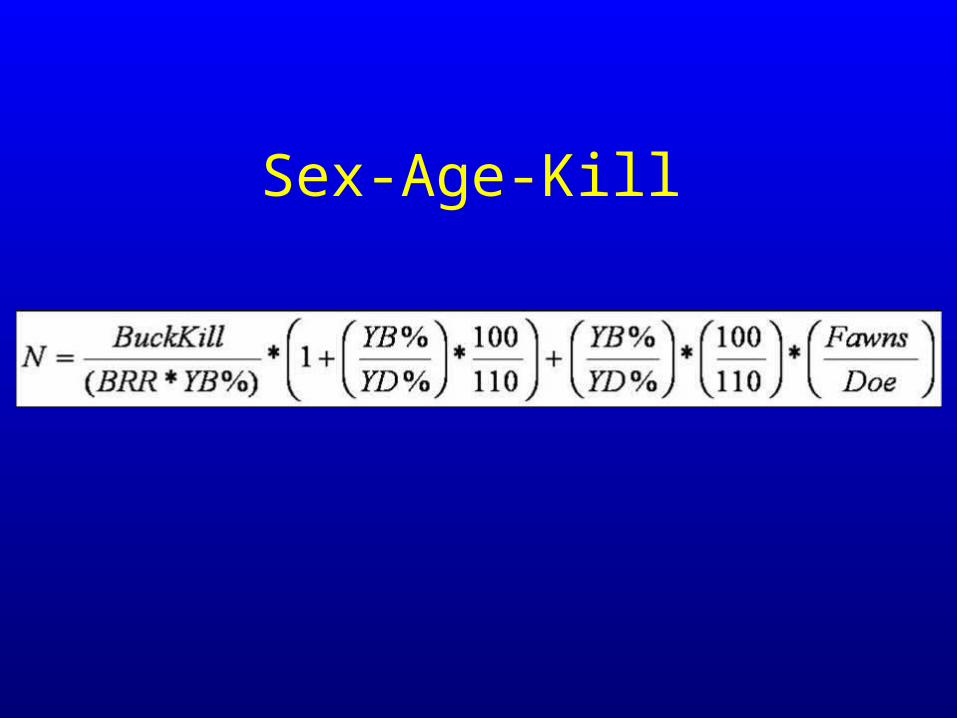
Sex-Age-Kill
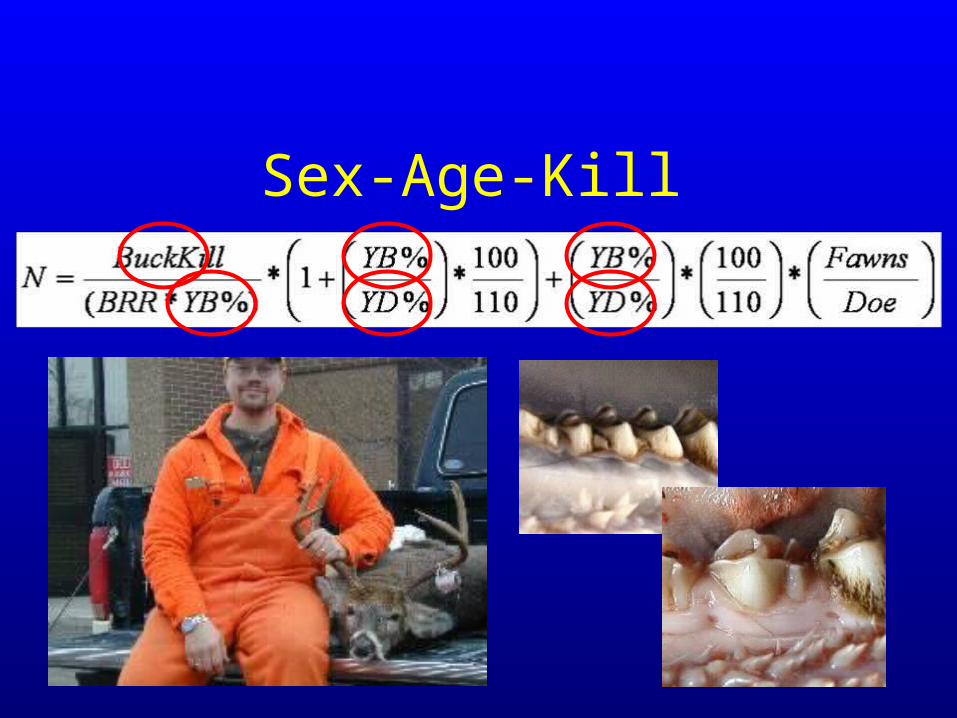
Sex-Age-Kill
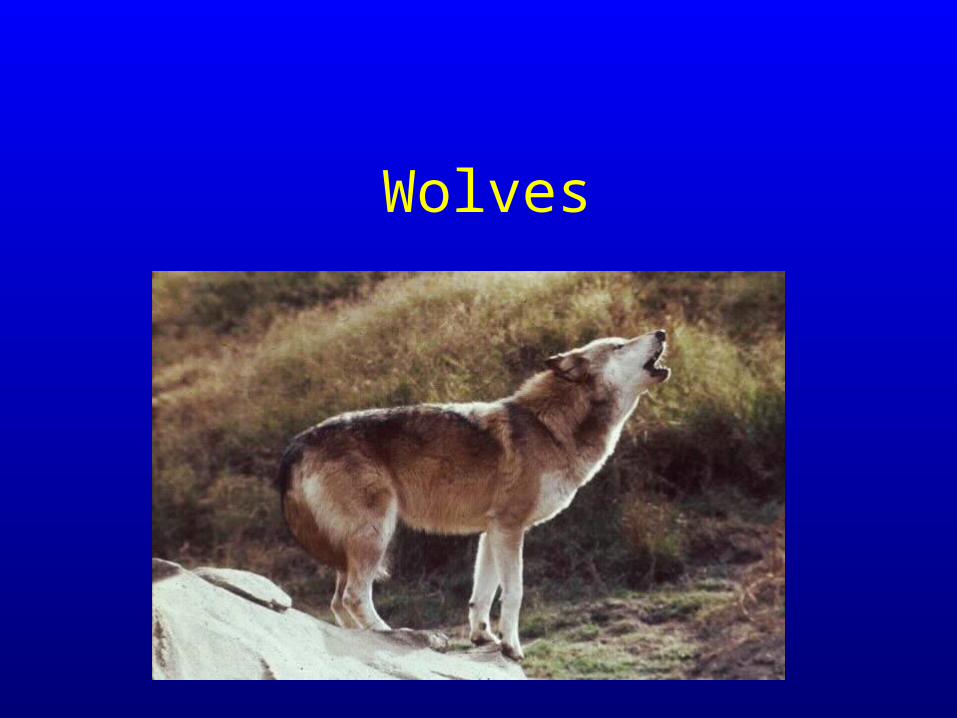
Wolves
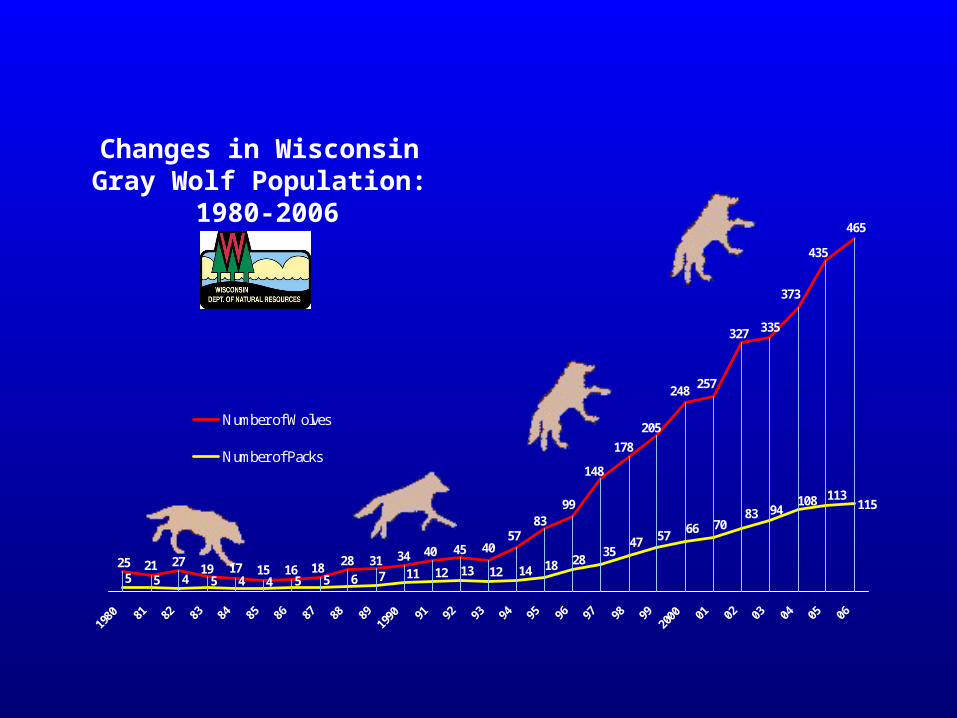
Changes in Wisconsin Gray Wolf Population:
1980-2006
115
465
435
373
335327
257248
205
178
148
9983
57404540343128
1816151719272125
1131089483
70665747
35281814121312117655445455
1980 81 82 83 84 85 86 87 88 89
1990 91 92 93 94 95 96 97 98 99
2000 01 02 03 04 05 06
Number of Wolves
Number of Packs

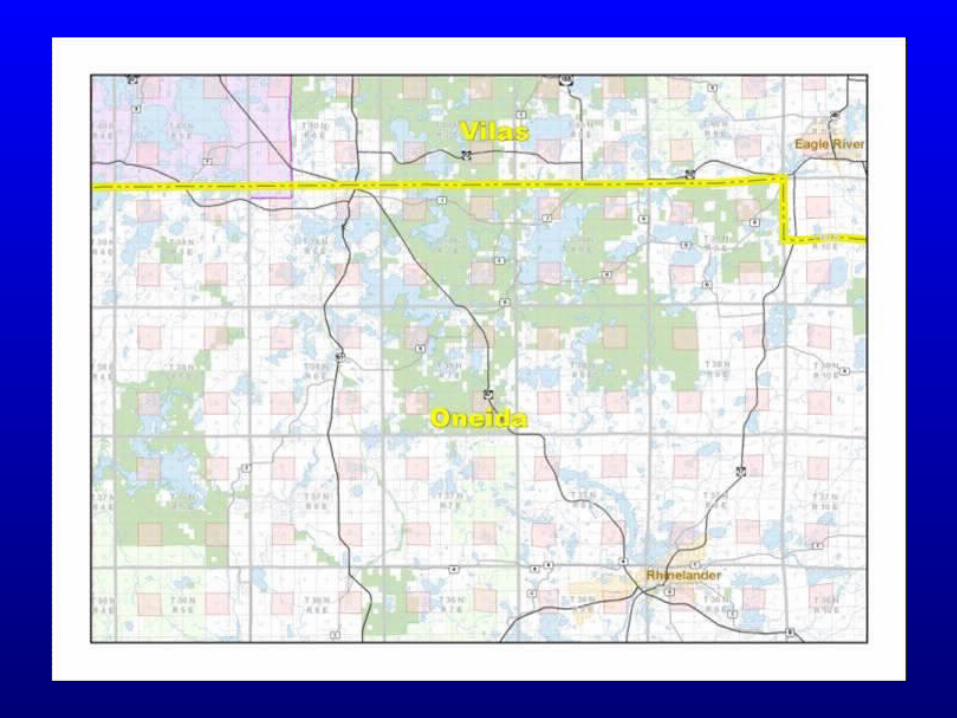
2005 – 2006 Wolf Packs
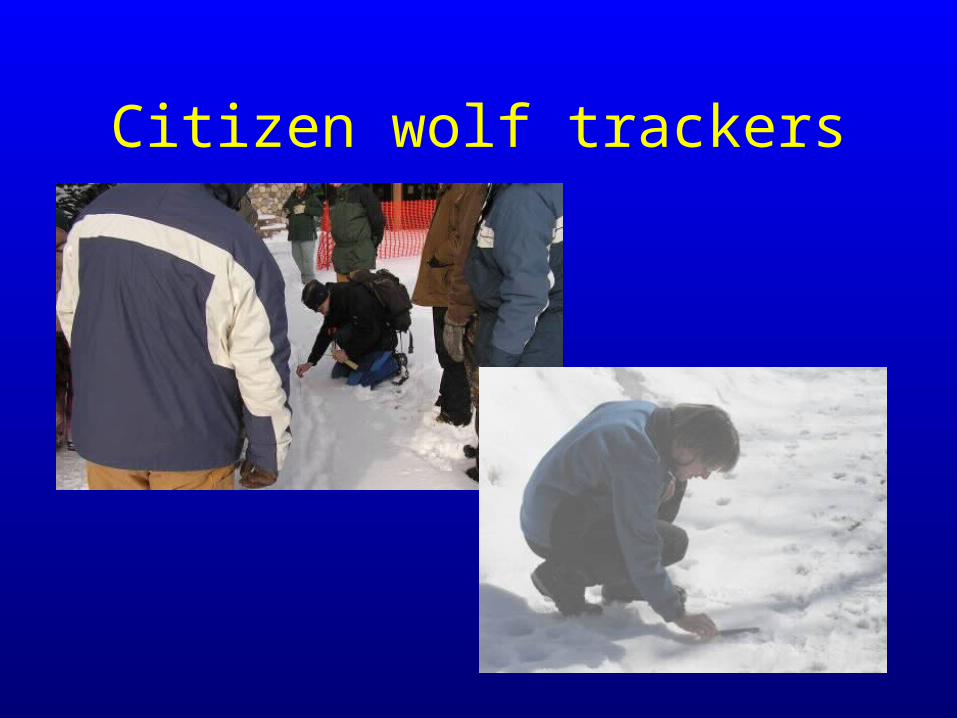
Citizen wolf trackers
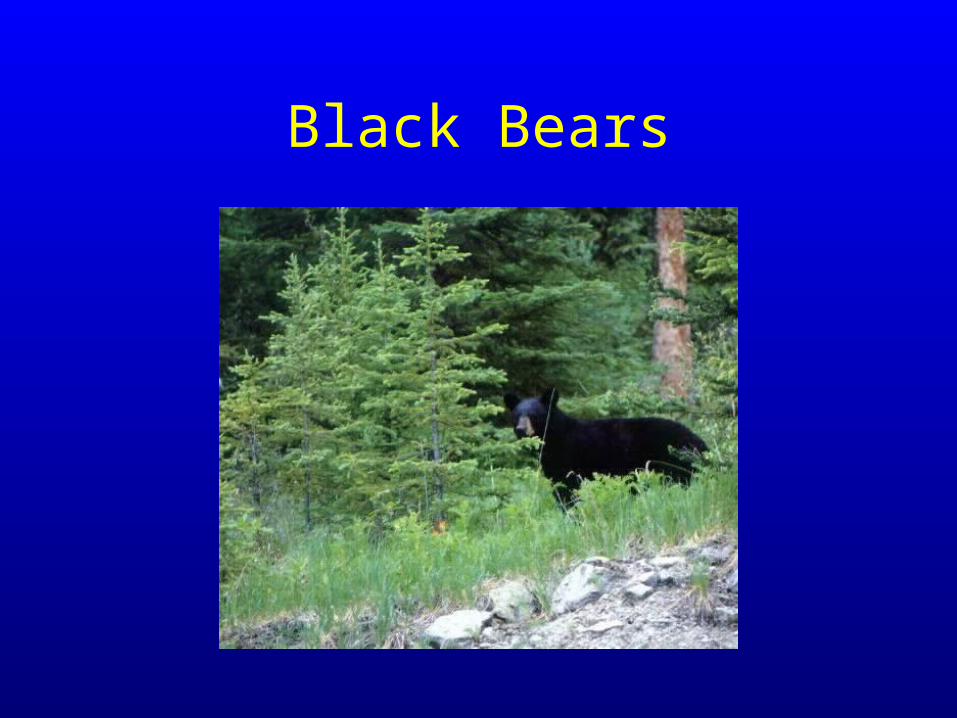
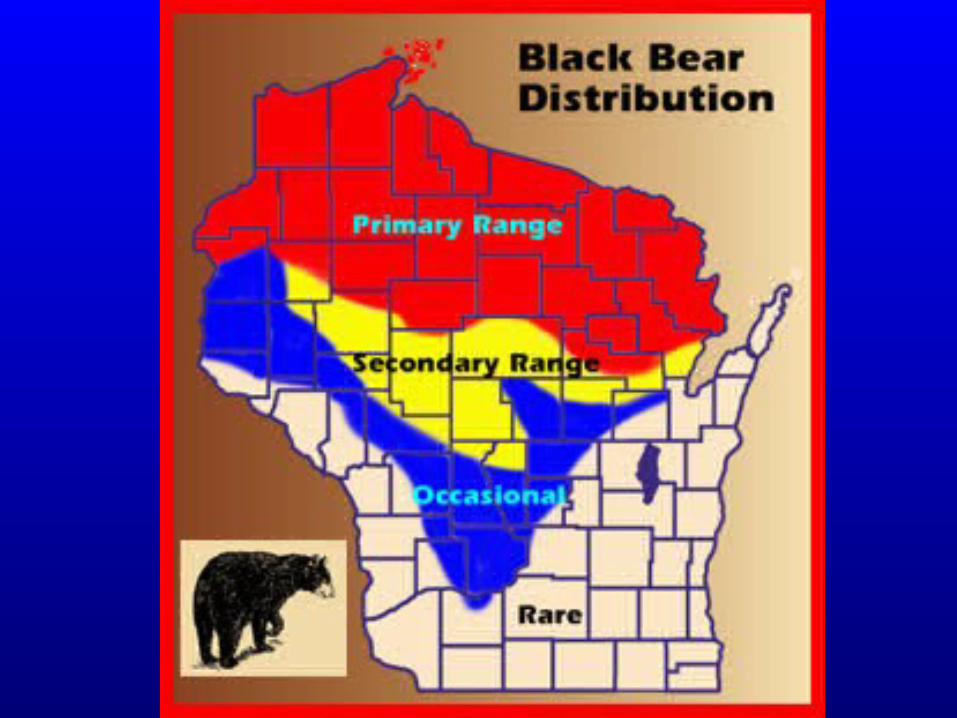
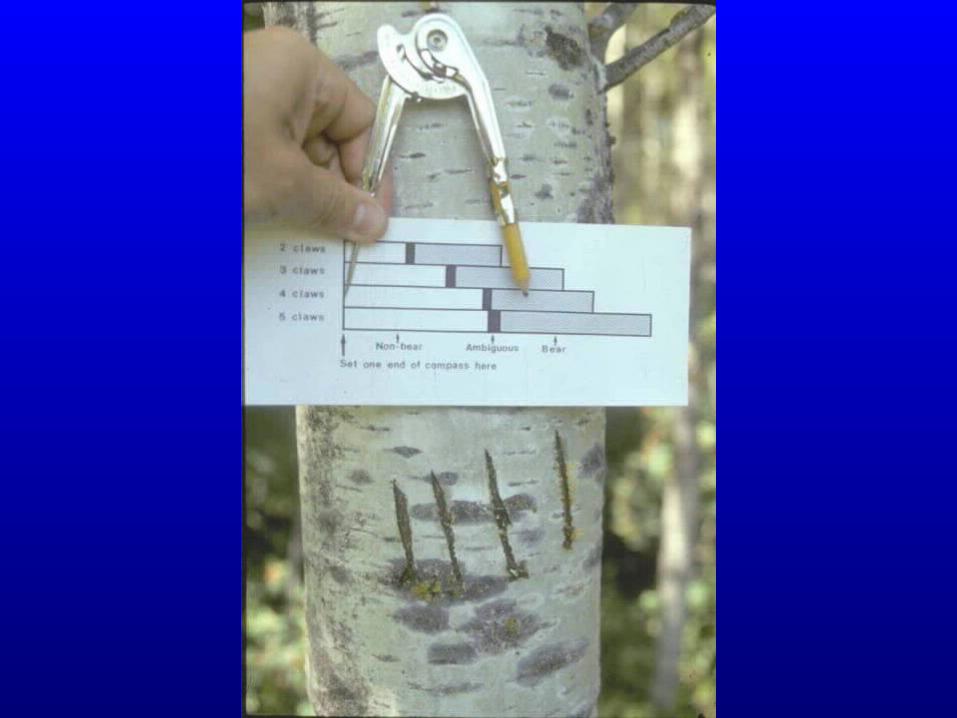
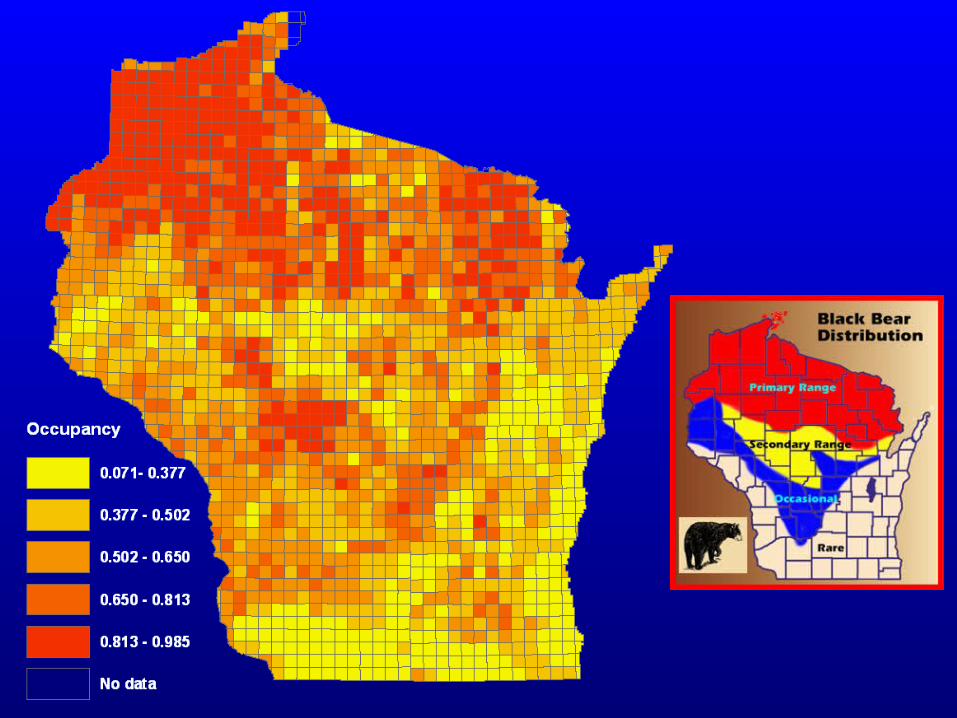
Black Bears
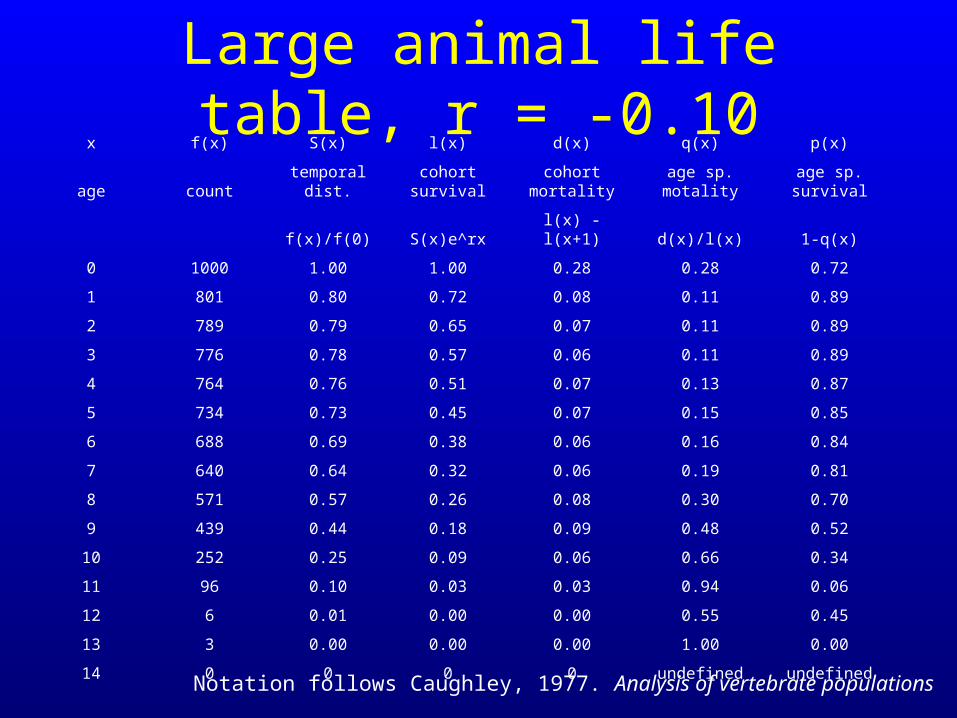
Large animal life table, r = -0.10x f(x) S(x) l(x) d(x) q(x) p(x)
age count temporal dist. cohort survival cohort mortality age sp. motality age sp. survival
f(x)/f(0) S(x)e^rx l(x) - l(x+1) d(x)/l(x) 1-q(x)
0 1000 1.00 1.00 0.28 0.28 0.72
1 801 0.80 0.72 0.08 0.11 0.89
2 789 0.79 0.65 0.07 0.11 0.89
3 776 0.78 0.57 0.06 0.11 0.89
4 764 0.76 0.51 0.07 0.13 0.87
5 734 0.73 0.45 0.07 0.15 0.85
6 688 0.69 0.38 0.06 0.16 0.84
7 640 0.64 0.32 0.06 0.19 0.81
8 571 0.57 0.26 0.08 0.30 0.70
9 439 0.44 0.18 0.09 0.48 0.52
10 252 0.25 0.09 0.06 0.66 0.34
11 96 0.10 0.03 0.03 0.94 0.06
12 6 0.01 0.00 0.00 0.55 0.45
13 3 0.00 0.00 0.00 1.00 0.00
14 0 0 0 0 undefined undefined
Notation follows Caughley, 1977. Analysis of vertebrate populations
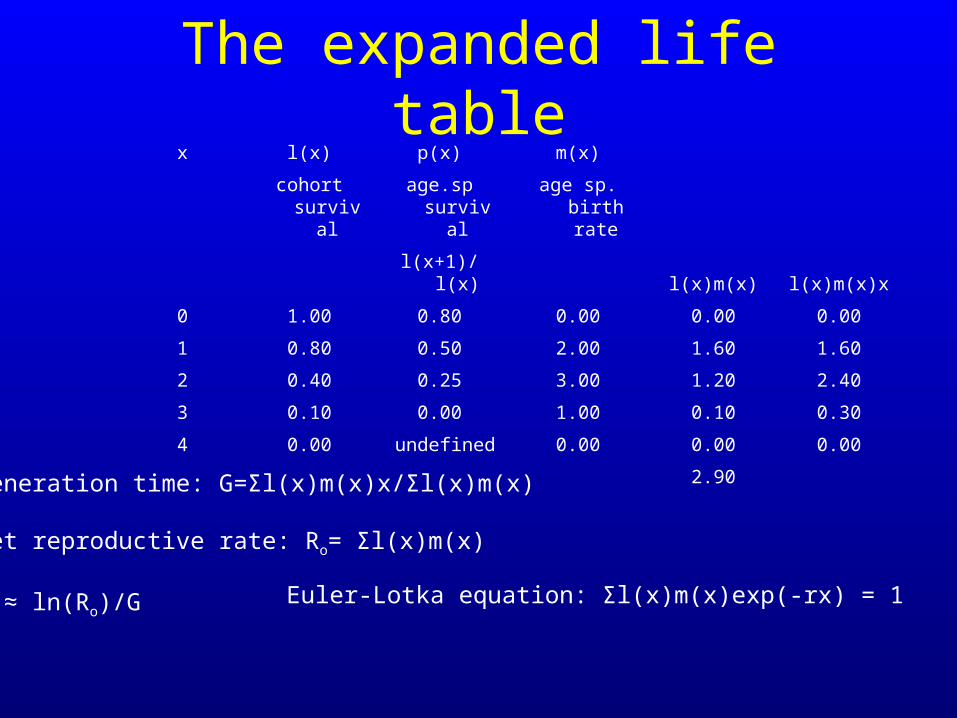
The expanded life tablex l(x) p(x) m(x)
cohort survival age.sp survival age sp. birth rate
l(x+1)/l(x) l(x)m(x) l(x)m(x)x
0 1.00 0.80 0.00 0.00 0.00
1 0.80 0.50 2.00 1.60 1.60
2 0.40 0.25 3.00 1.20 2.40
3 0.10 0.00 1.00 0.10 0.30
4 0.00 undefined 0.00 0.00 0.00
2.90
Generation time: G=Σl(x)m(x)x/Σl(x)m(x)
Net reproductive rate: Ro= Σl(x)m(x)
r ≈ ln(Ro)/G Euler-Lotka equation: Σl(x)m(x)exp(-rx) = 1
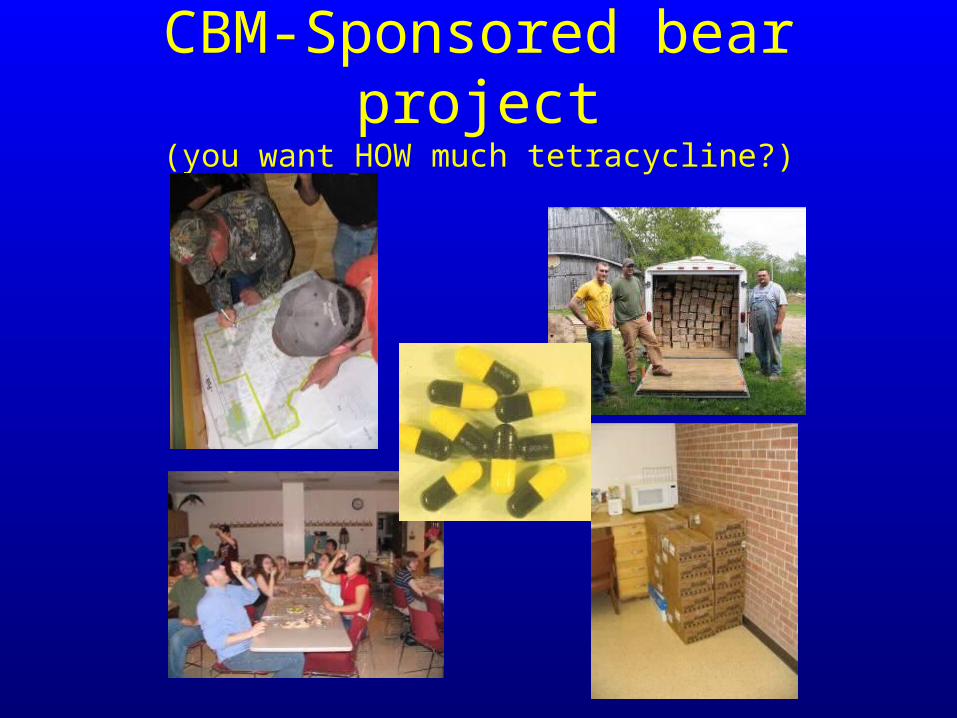
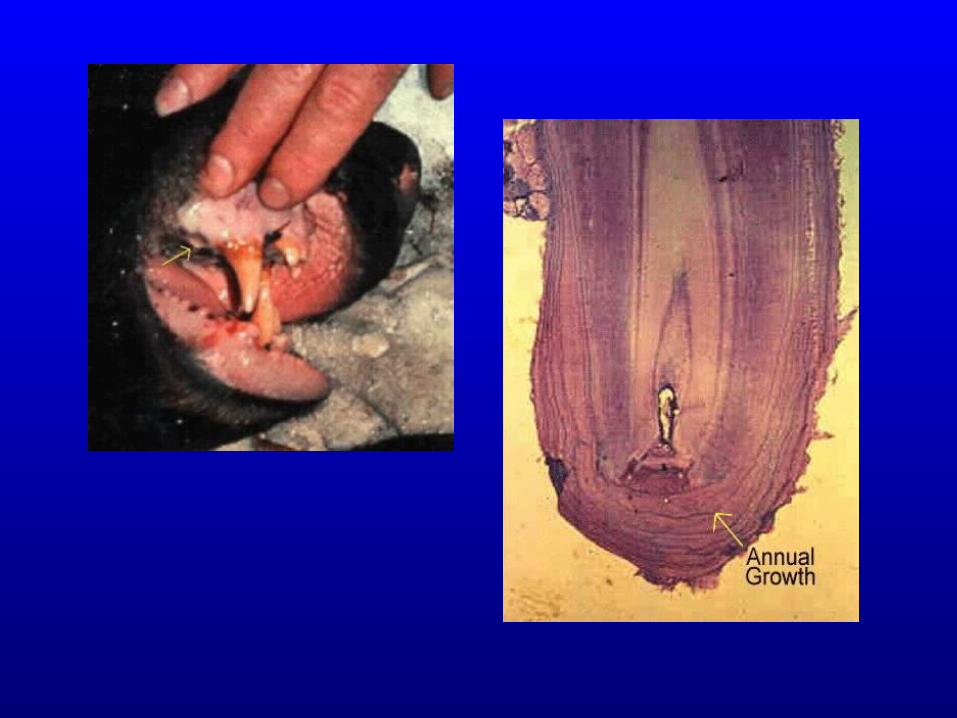
CBM-Sponsored bear project(you want HOW much tetracycline?)
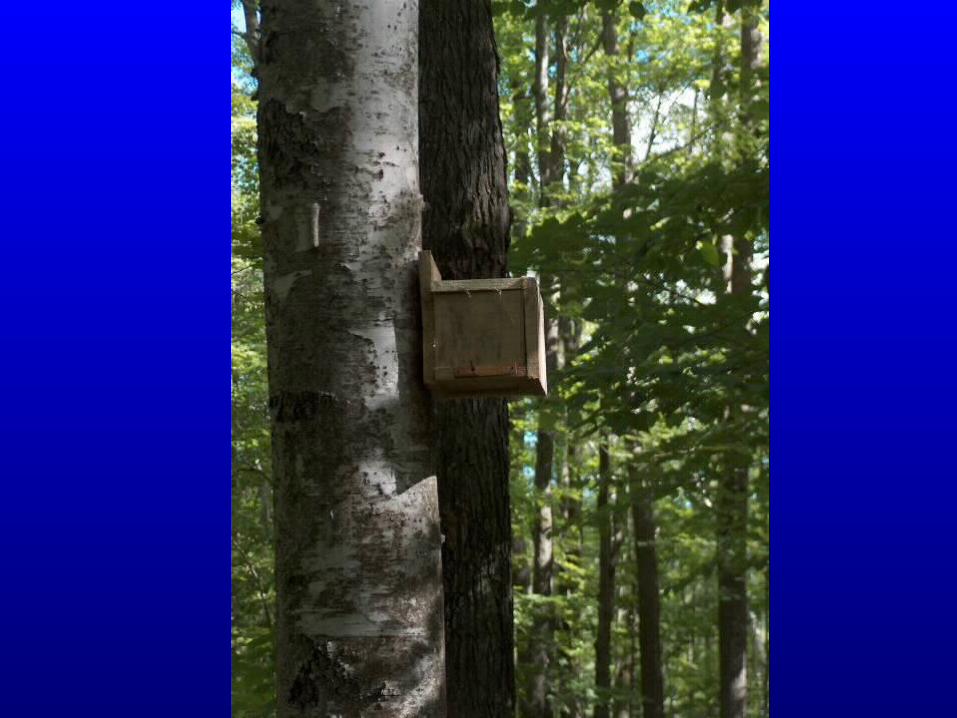
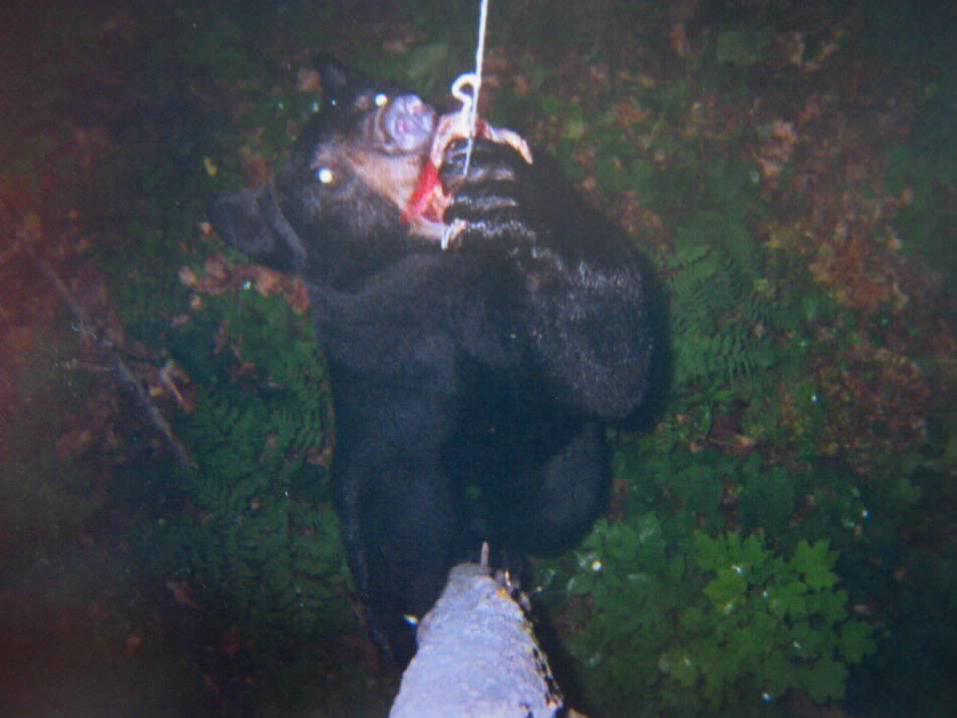

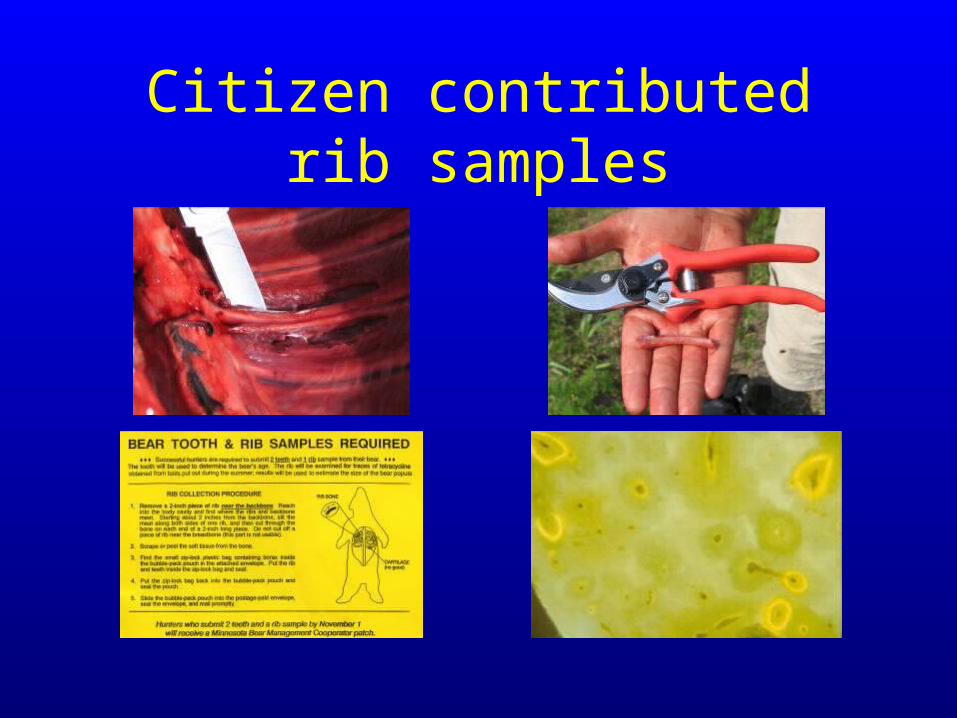
Citizen contributed rib samples
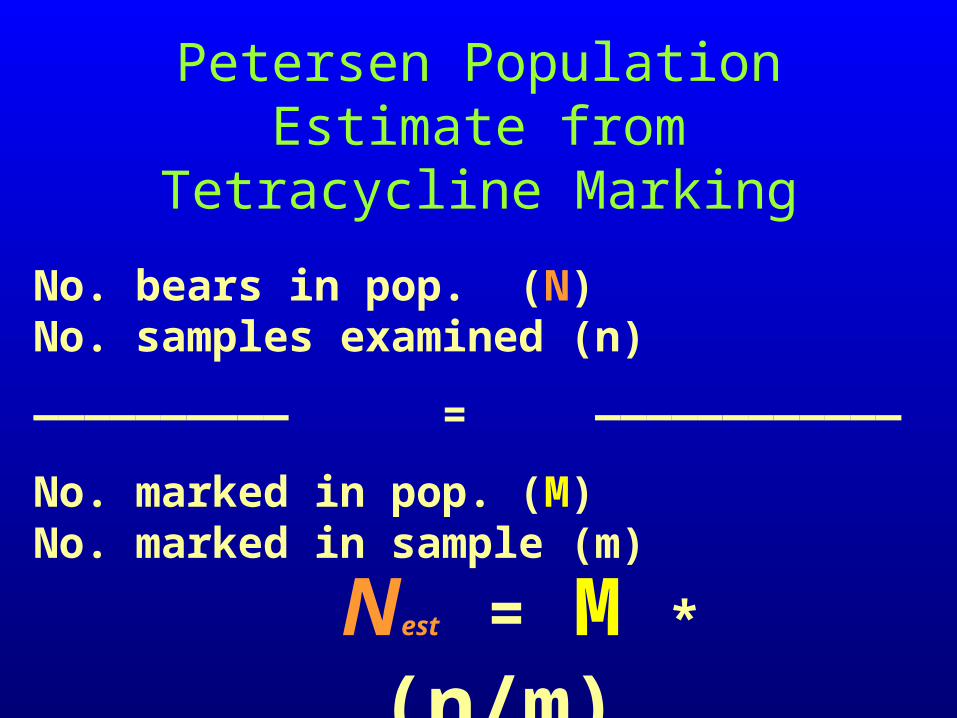
Petersen Population Estimate from Tetracycline Marking
No. bears in pop. (N) No. samples examined (n)
—————————— = ————————————
No. marked in pop. (M) No. marked in sample (m)
Nest = M * (n/m)

Increasing management problem: bears and agriculture

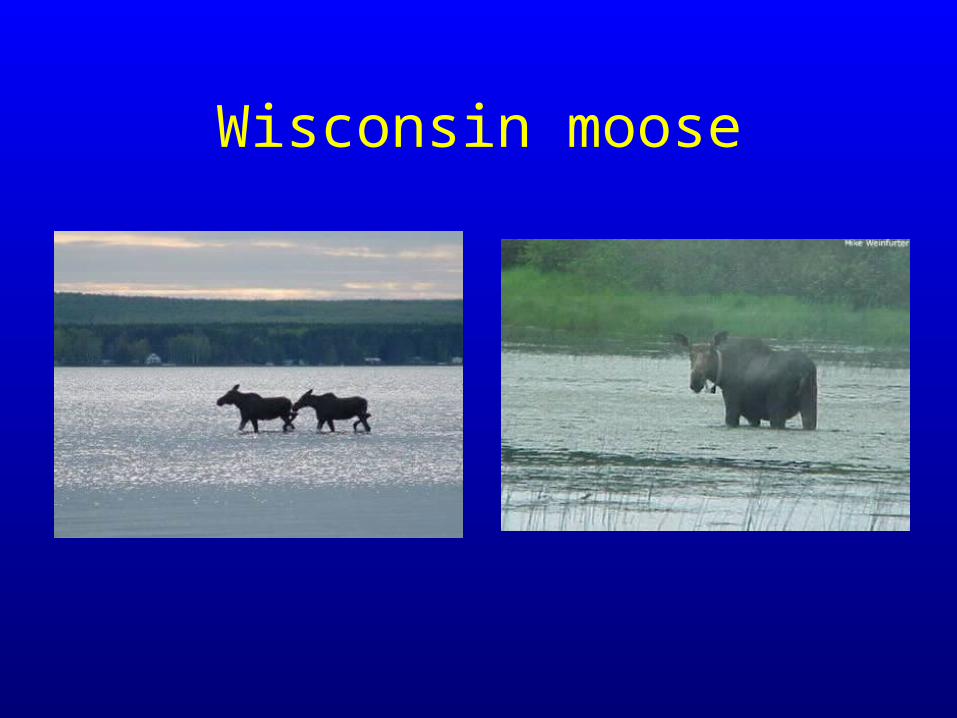
Wisconsin moose
Wisconsin cougar

Next generation payoffs of Citizen-Based MonitoringSome examples

What’s more effective baiting or T-zones?
Baiting T-zone
Cha
nge
in h
arve
st
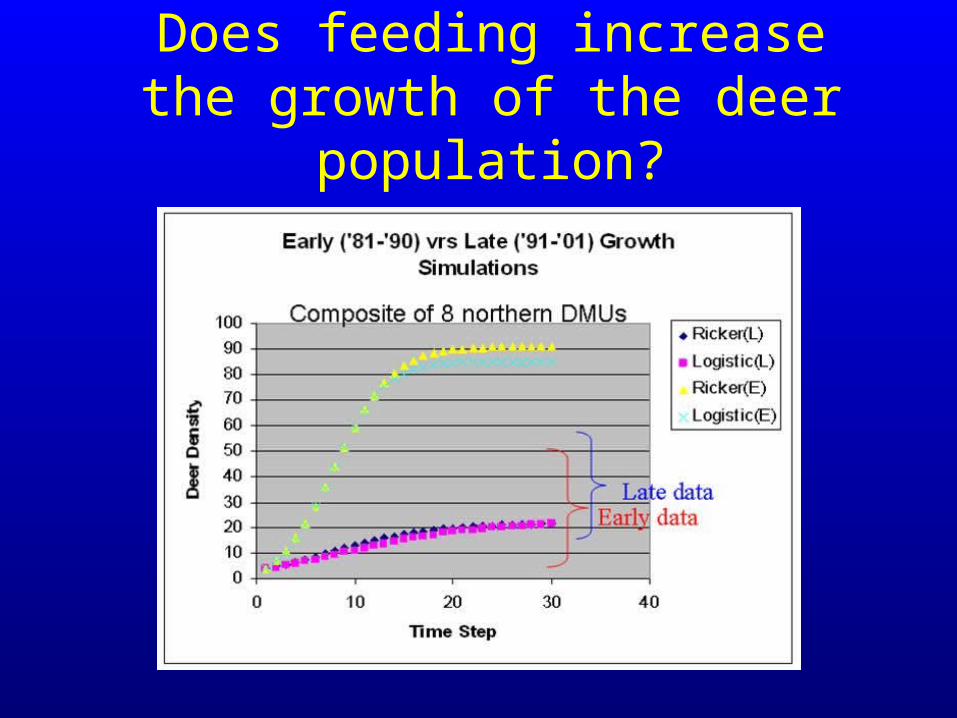
Does feeding increase the growth of the deer population?
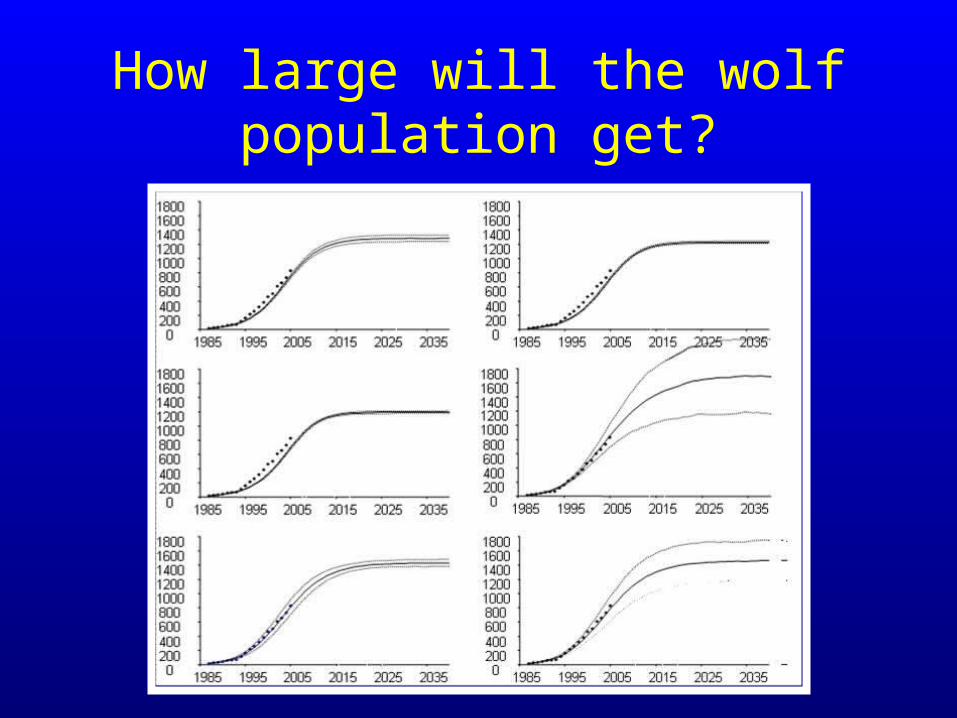
How large will the wolf population get?

How do wolves impact the growth of the deer population?
(± 1 SE)
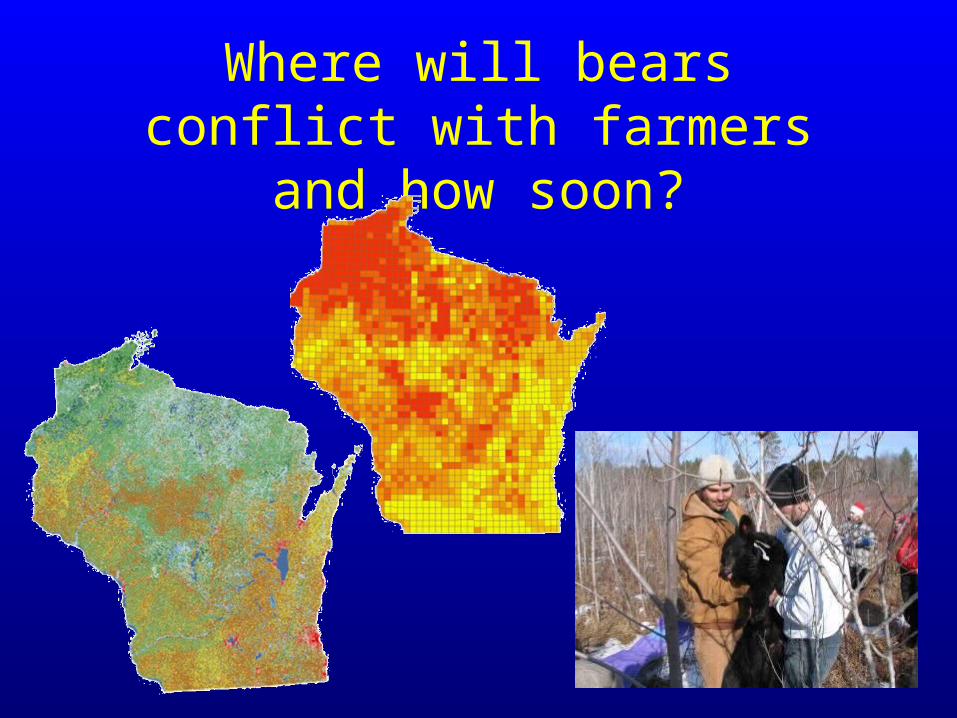
Where will bears conflict with farmers and how soon?
Thank you.