Embed Size (px)
Citation preview
CITY of BEVERLY HILLS STATE of CALIFORNIA
COMPREHENSIVE ANNUAL FINANCIAL REPORT
Year Ended June 30, 2013
Prepared by the Staff of the Administrative Services Department Under the Direction of Don Rhoads, Director of Administrative Services, Chief Financial Officer

CITY OF BEVERLY HILLS, CALIFORNIA Comprehensive Annual Financial Report
Year Ended June 30, 2013 Table of Contents
Statement/ Exhibit Page
i
INTRODUCTORY SECTION Letter of Transmittal .................................................................................................................................................................................... 1 Principal City Officials ................................................................................................................................................................................ 11 City Organizational Chart ............................................................................................................................................................................ 12 Administrative Services Department Organizational Chart ......................................................................................................................... 12 Government Finance Officers Association Certificate of Achievement for Excellence in Financial Reporting ......................................... 13
FINANCIAL SECTION Independent Auditors’ Report ...................................................................................................................................................................... 14 Management’s Discussion and Analysis (Required Supplementary Information - Unaudited) ................................................................... 17 Basic Financial Statements:
Government-wide Financial Statements: Statement of Net Position ..................................................................................................................................................................... A-1 28 Statement of Activities .......................................................................................................................................................................... A-2 30
Fund Financial Statements: Balance Sheet – Governmental Funds .................................................................................................................................................. A-3 31 Reconciliation of Total Governmental Fund Balances to Net Position of Governmental Activities
in the Statement of Net Position ........................................................................................................................................................ A-4 32 Statement of Revenues, Expenditures and Changes in Fund Balances – Governmental Funds ........................................................... A-5 33 Reconciliation of the Statement of Revenues, Expenditures and Changes in Fund Balances of
Governmental Funds to the Statement of Activities .......................................................................................................................... A-6 34 Statement of Revenues, Expenditures and Changes in Fund Balances – Budget and Actual – General Fund ..................................... A-7 35 Statement of Net Position – Proprietary Funds ..................................................................................................................................... A-8 37 Statement of Revenues, Expenses and Changes in Fund Net Position – Proprietary Funds ................................................................. A-9 39 Statement of Cash Flows – Proprietary Funds ...................................................................................................................................... A-10 40 Statement of Fiduciary Net Position ..................................................................................................................................................... A-11 42
Notes to Basic Financial Statements: (1) Summary of Significant Accounting Policies .............................................................................................................................. 43 (2) Reconciliation of Government-wide and Fund Financial Statements .......................................................................................... 50 (3) Stewardship, Compliance and Accountability ............................................................................................................................. 55 (4) Cash and Investments .................................................................................................................................................................. 56 (5) Receivables and Unearned Revenues ........................................................................................................................................... 61 (6) Interfund Receivables/Payables ................................................................................................................................................... 63 (7) Transfers ...................................................................................................................................................................................... 64 (8) Capital Assets .............................................................................................................................................................................. 65 (9) Long-Term Liabilities .................................................................................................................................................................. 70
CITY OF BEVERLY HILLS, CALIFORNIA Comprehensive Annual Financial Report
Year Ended June 30, 2013 Table of Contents, Continued
Statement/ Exhibit Page
ii
(10) Employee Retirement Systems and Deferred Compensation Plans ............................................................................................. 78 (11) Related Party Transaction – Sale/Leaseback ............................................................................................................................... 81 (12) Postemployment Health Care Benefits ........................................................................................................................................ 81 (13) Commitments and Contingencies ................................................................................................................................................ 85 (14) Separation of the Parking Authority of the City of Beverly Hills ................................................................................................ 87 (15) Fund Balance ............................................................................................................................................................................... 90
Required Supplementary Information – Schedule of Funding Progress of the City’s Defined Benefit Pension Plans (Unaudited) ........... 92
Required Supplementary Information – Schedule of Funding Progress of the City’s Other Postemployment Benefits Plan (Unaudited).. 93
Supplementary Information – Statement of Changes in Assets and Liabilities of Fiduciary Funds ............................................................ 94
Additional Financial Information: Combining and Individual Fund Statements and Schedules:
Nonmajor Governmental Funds: Combining Balance Sheet ................................................................................................................................................................. B-1 95 Combining Statement of Revenues, Expenditures and Changes in Fund Balances .......................................................................... B-2 98 Combining Schedule of Revenues, Expenditures and Changes in Fund Balances – Budget and Actual ........................................... B-3 101
Infrastructure Capital Projects Fund –Schedule of Revenues, Expenditures and Changes in Fund Balance – Budget and Actual ................................................................................................................................................... C-1 112
Internal Service Funds: Combining Statement of Net Position ............................................................................................................................................... D-1 113 Combining Statement of Revenues, Expenses and Changes in Fund Net Position ........................................................................... D-2 115 Combining Statement of Cash Flows ................................................................................................................................................ D-3 116
Capital Assets Used in the Operation of Governmental Funds: Comparative Schedule by Source ...................................................................................................................................................... E-1 118 Schedule by Function and Activity ................................................................................................................................................... E-2 119 Schedule of Changes by Function and Activity ................................................................................................................................. E-3 120
STATISTICAL SECTION (Unaudited) Narrative........................................................................................................................................................................................................ 121
CITY OF BEVERLY HILLS, CALIFORNIA Comprehensive Annual Financial Report
Year Ended June 30, 2013 Table of Contents, Continued
Statement/ Exhibit Page
iii
Financial Trends Information: Net Position by Component ...................................................................................................................................................................... S-1 122 Changes in Net Position ........................................................................................................................................................................... S-2 123 Fund Balances of Governmental Funds .................................................................................................................................................... S-3 126 Changes in Fund Balances of Governmental Funds ................................................................................................................................. S-4 127
Revenue Capacity Information: Revenue Bases and Rates of Business Tax ............................................................................................................................................... S-5 128 Principal Business Tax Payers .................................................................................................................................................................. S-6 136 Property Tax Levies and Collections ........................................................................................................................................................ S-7 137 Assessed and Estimated Actual Value of Taxable Property ..................................................................................................................... S-8 138
Property Tax Rates for Direct and Overlapping Governments ................................................................................................................. S-9 139 Property Tax Levies for All Overlapping Governments ........................................................................................................................... S-10 140 Principal Property Taxpayers ................................................................................................................................................................... S-11 141
Debt Capacity Information: Ratios of Outstanding Debt by Type ........................................................................................................................................................ S-12 142
Computation of Direct and Overlapping Debt .......................................................................................................................................... S-13 143 Legal Debt Margin Information ................................................................................................................................................................ S-14 144 Ratio of Annual Debt Service Expenditures of Governmental Funds to Total Governmental Fund Expenditures and Ratio of Total Debt Service Expenditures to Total Governmental Activities Expenses .............................................................................................. S-15 145 Ratios of Debt Service per Capita ............................................................................................................................................................ S-16 146 Water Enterprise Fund Long-Term Debt Coverage .................................................................................................................................. S-17 147 Wastewater Enterprise Fund Long-Term Debt Coverage ......................................................................................................................... S-18 148
Demographic and Economic Information: Demographic and Economic Statistics ..................................................................................................................................................... S-19 149 Demographic Statistical Data ................................................................................................................................................................... S-20 150 Principal Employers ................................................................................................................................................................................. S-21 151 Operating Information: Full-time Equivalent City Government Employees by Function.............................................................................................................. S-22 152 Operating Indicators ................................................................................................................................................................................. S-23 153 Capital Asset Statistics by Function ........................................................................................................................................................ S-24 154

ADMINISTRATIVE SERVICES DEPARTMENT DON RHOADS, CPA 455 N. Rexford Drive, Room 250 Chief Financial Officer Beverly Hills, California 90210-4817 (310) 285-2411 FAX: (310) 285-2441
1
February 15, 2014
Honorable Mayor, City Council and Citizens of the City of Beverly Hills:
State law requires that all general-purpose local governments publish within six months of the close of each fiscal year a complete set of financial statements presented in conformity with generally accepted accounting principles (GAAP) and audited in accordance with generally accepted auditing standards by a firm of licensed certified public accountants. Pursuant to that requirement, we hereby submit the comprehensive annual financial report (CAFR) of the City of Beverly Hills, California (City) for the fiscal year ended June 30, 2013.
This report consists of management’s representations concerning the finances of the City of Beverly Hills, California. Consequently, management assumes full responsibility for the completeness and reliability of all of the information presented in this report. To provide a reasonable basis for making these representations, management of the City has established a comprehensive internal control framework that is designed both to protect the City’s assets from loss, theft or misuse and to compile sufficient reliable information for the preparation of the City’s financial statements in conformity with GAAP. Because the cost of internal controls should not outweigh their benefits, the City’s comprehensive framework of internal controls has been designed to provide reasonable rather than absolute assurance that the financial statements will be free from material misstatement. As management, we assert that, to the best of our knowledge and belief, this financial report is complete and reliable in all material respects.
The City’s financial statements have been audited by White Nelson Diehl Evans, a public accounting firm fully licensed and qualified to perform audits of the State and local governments within the State of California. The goal of the independent audit was to provide reasonable assurance that the financial statements of the City of Beverly Hills, California for the fiscal
year ended June 30, 2013, are free of material misstatement. The independent audit involved examining, on a test basis, evidence supporting the amounts and disclosures in the financial statements; assessing the accounting principles used and significant estimates made by management; and evaluating the overall financial statement presentation. The independent auditors concluded, based upon the audit, that there was a reasonable basis for rendering an unqualified opinion that the City of Beverly Hills, California’s financial statements for the fiscal year ended June 30, 2013, are fairly presented in conformity with accounting principles generally accepted in the United States. The independent auditors’ report is presented as the first component of the financial section of this report.
GAAP requires that management provide a narrative introduction, overview and analysis to accompany the basic financial statements in the form of Management’s Discussion and Analysis (MD&A). This letter of transmittal is designed to complement MD&A and should be read in conjunction with it. The City’s MD&A can be found immediately following the report of the independent auditors in the financial section of the CAFR.
Profile of the City of Beverly Hills. The City of Beverly Hills, incorporated in 1914 under the general laws of the State of California, is a long-established residential city and commercial center located within Los Angeles County in Southern California. The City, located approximately 10 miles west of the Los Angeles City Hall, occupies a land area of approximately 5.7 square miles and serves a residential population of 34,2911. The City estimates that services are provided to a daytime population of 100,000 to 150,000 persons during the day.
The City operates under a Council-Manager form of government. The City Council consists of five members elected at large for overlapping four-year terms. The Mayor is selected from the City Council members and serves a one-year term. The City’s only other elected official is the City Treasurer whose term of office is four years. The City Council is responsible, among
1 Estimate – State of California Dept. of Finance.
The Honorable Mayor, City Council and Citizens of the City of Beverly Hills, California
Letter of Transmittal February 15, 2014
2
other things, for passing ordinances, adopting the budget, appointing committees, and appointing a City Manager, City Attorney and City Clerk. In addition, the City Council appoints the members of the following advisory Commissions and Boards:
Architectural Commission Charitable Solicitations Commission Cultural Heritage Commission Design Review Commission Fine Art Commission Health & Safety Commission Human Relations Commission Planning Commission Public Works Commission Recreation & Parks Commission Traffic & Parking Commission
In addition to sitting as the governing body of the City, the City Council also acts as the Board of Directors of two component units: the Parking Authority of the City of Beverly Hills and the Beverly Hills Public Financing Authority. The Parking Authority of the City of Beverly Hills continues as a blended component unit under the criteria of board appointment and financial burden on the primary government. On September 30, 2011, the majority of the assets of the City’s Parking Enterprise Fund were transferred to the Parking Authority in order to show a total separation between the Parking Authority and the City. The Beverly Hills Public Financing Authority continues to remain a blended component unit. The City Manager is responsible for carrying out the policies and ordinances of the City Council, for overseeing the day-to-day operations of the City, and for appointing the heads of the City’s various departments and offices.
The City provides the full range of municipal services as contemplated by statute. Services provided include public safety (police and fire), street construction and maintenance, sanitation, refuse collection, water and sewer utilities, culture-recreation, public improvements, planning and zoning, and general administrative and support services.
The annual budget serves as the foundation for the City’s financial planning and control. The City Council is required to adopt an annual budget resolution by July 1 of each fiscal year for the General Fund, special revenue funds and permanent funds. These budgets are adopted and presented for reporting purposes on a basis consistent with generally accepted accounting principles.
The City Council also adopts annual financial plans for the enterprise and internal service funds and five-year capital budget plans for capital expenditures accounted for primarily in proprietary funds. All proprietary fund types are accounted for on an economic resources measurement focus. The City is not legally mandated to report the results of operations and capital expenditures for these proprietary fund types on a budget comparison basis; therefore, budgetary data related to these funds have not been presented.
The level of appropriated budgetary control is the total adopted budget which is defined as the total budget for all funds and divisions and includes all revisions and amendments approved by the City Council subsequent to the initial budget adoption. The City Manager may authorize transfers of appropriations within the adopted budget. Supplemental appropriations during the year must be approved by the City Council. These appropriations, representing amendments to the budget during the year, were significant in relationship to the original budget as adopted. Unexpended or unencumbered appropriations lapse at the end of the fiscal year. Encumbered appropriations are reappropriated in the ensuing year’s budget by action of the City Council. The City utilizes an encumbrance system, whereby commitments such as purchase orders and unperformed contracts are recorded as reserved fund balances at year-end.
Budget-to-actual comparisons are provided in this report for each individual governmental fund for which an appropriated annual budget has been adopted. This comparison, beginning on page 36, is presented as part of the basic financial statements for the General Fund. The budget-to-actual comparisons for nonmajor governmental funds with appropriated annual budgets are presented in the Nonmajor Governmental Funds section of this report, and begin on page 101. The budget-to-actual comparison for the Infrastructure Capital Projects Fund, a Major governmental fund of the City, can be found on page 112.
Factors Affecting Financial Condition. From the beginning when the City was planned as a subdivision in 1906, Beverly Hills was designed as a special place. In subsequent years, much has changed, but not the desire to keep it special. As a result, the City has established a tradition of providing residents, business and visitors with a superior level of public safety
The Honorable Mayor, City Council and Citizens of the City of Beverly Hills, California
Letter of Transmittal February 15, 2014
3
services, premium life enrichment opportunities and a renowned physical environment.
This year’s budget comes with a great deal of good news, forecasting continued growth in the City’s micro-economy but also some significant challenges that the City must address. The budget contrasts considerably with budgets of recent years. Despite transfers from the General Fund to the Parking Authority, Clean Water Fund, and the Capital Improvement Program the budget has no cuts or one-time measures to achieve balance. In contrast with recent years, one-time cost-cutting measures were not necessary to allow these transfers without utilizing General Fund reserves.
Nearly five years ago the housing bubble burst and vast numbers of subprime mortgage-holders defaulted, which resulted in a fiscal crisis and severe recession. In Beverly Hills this was manifest by a 28% decline in sales tax revenue and a 19% decline in transient occupancy tax revenue between FY 2007/08 and FY 2009/10. Property tax revenue showed the first decline since 1996. Over the next four years, the City eliminated 84 full-time equivalent positions. The General Fund expenditures were reduced by $4.8 million in FY 2008/09, $18.4 million in FY 2009/10 and $9.3 million in FY 2010/11. In addition, various one-time measures to reduce the budget were utilized in FY 2011/12 and FY 2012/13 to achieve balance after transfers to other funds. These measures were utilized because they had the least impact on service levels to the community.
In the FY 2012/13 budget, one time reduction measures provided about $5.7 million in savings, much of which would need to be restored to the operating budget in FY 2013/14. As the City’s year-end actual fiscal performances for FY 2010/11 and FY 2011/12 were better than budgeted, the City Council was able to restore many of the one-time cuts, which included funds for the future purchase of vehicles, computers and other equipment. At no time were General Fund reserves used to close the gap and balance the budget. In some instances, when the General Fund ended a fiscal year with a significant surplus, those surplus funds were used to reduce unfunded liabilities.
The City Council directed staff to work towards a pattern of budgets which require no one-time measures to balance after General Fund transfers. The City Council acknowledged that achieving this would likely require a few years, but that staff should work toward reducing ongoing costs and maximize revenues within the existing revenue structure for future budgets.
City staff approaches budgeting conservatively: Revenues are projected at the low end of expectations and expenditures are projected at potential full cost. This approach to budgeting frequently results in a year-end surplus and has yet to result in a deficit.
The FY 2013/14 adopted budget includes no one-time reductions or ongoing cuts and thus no reduction in service levels. Rather this budget restored staffing in areas with inadequate resources. For example, the growing economy has increased the demand for development services and increases in occupation of City-owned building space have increased maintenance requirements. The City Council also increased spending in areas where it would result in future cost savings, such as the repair of uneven sidewalks, and removal and replacement of street trees causing damage to sidewalks.
Economic Outlook
The economy continues to move in the right direction, albeit slowly. One economist has referred to the current economy as the “plow horse” economy, one which moves slowly but moves nonetheless and creates opportunity. This steady growth has given the economy momentum and the City has benefitted. GDP, personal income, consumer spending, home values and construction have all improved since 2009. From the end of 2009 to the end of 2012, GDP increased by 5.4%, consumer spending increased by 6.2%, the annual valuation of building permits in Los Angeles County increased by 9.9%, the median home price in Los Angeles County increased by 10.6% and personal income increased by 15.2%.
Over the past year, California economists have pointed to low vacancy rates, low inventories of homes for sale, and relatively high affordability of homes. Economists report that construction activity has increased to meet
The Honorable Mayor, City Council and Citizens of the City of Beverly Hills, California
Letter of Transmittal February 15, 2014
4
the demand. In support of this, at the national level, the Commerce Department reported in mid-April that seasonally adjusted housing starts came to 1,036,000 in March, the first time this measure has topped 1 million since June 2008. This construction momentum has been positively influenced by continued low interest rates and a low inflation rate, though there have been slight increases in each. It is anticipated that the Federal Reserve will maintain low interest rates at least until 2015.
An improving economy results in greater hotel revenues, retail sales, auto sales and property valuations. These drive the General Fund revenues and suggest continued growth for the City’s economic base.
Budget Summary
The City Council adopted the budget with General Fund revenues of $184.7 million, General Fund expenditures of $169.5 million, and net transfers of $13.9 million. This is an increase in revenue of 8.1% and of expenditures of 4.2% compared to the FY 2012/13 budget. The combined operating budget for all funds provides for revenues of $389.5 million, expenditures of $362.2 million and total transfers out of $14.5 million. This represents an increase of 4.6% in revenue and an increase of 0.7% in expenditures when compared to last year’s budget.
Cost Containment Efforts
Continuing cost containment efforts include memoranda of understanding (MOU) between the City and public safety bargaining groups (police and fire), which take significant steps toward reducing future growth by implementing a lower tier of pension for newly hired employees with current membership in PERS and a phase-in of employees sharing pension costs. Similar terms are expected when new agreements are reached with the City’s non-safety employee bargaining groups over the next year. In recent years, the City has contained the growth of health benefit costs through the implementation of defined contributions for retiree health benefits for newly hired employees, cafeteria plans in which employees
share the cost of rising health insurance costs and lower cafeteria benefit levels for newly hired employees.
Other efforts to reduce City expenses include the refunding of City issued bonds when lower rates and better terms would provide savings to the City and when bond covenants allow for early retirement. When the City refinances its debt, it does not increase the term nor the underlying obligations, so that the City enjoys savings in current debt service cost without increasing long-term obligations.
At the end of FY 2012/13, the inter-fund loan from the Capital Assets Fund to the Information Technology Fund for radio replacement was fully paid off. Retirement of this internal loan will save the General Fund about $1.2 million in radio charges annually. The City has also made regular contributions to convert previously unfunded liabilities for other post-employment benefits (OPEB) into funded liabilities. In addition, as directed by the City Council, our Finance and Budget staff continues to work with the City Treasurer’s Citizen’s Budget Review Committee to explore cost cutting and revenue opportunities for the Parking Authority, Parking Fund and the Clean Water Fund. These areas have required General Fund subsidies of $18.3 million in the past two years.
By taking the above actions, the City is better able to serve the community and provide for continued investment in infrastructure and facilities using the revenue sources available to the City.
City Council Priorities
In December 2012, the City Council met to establish its priorities for FY 2013/14. Typically, a substantial portion of the budget enhancement requests are designed to address City Council priorities: either new priorities or full implementation of programs established in prior years. A complete list of the City Council priorities for FY 2013/14 is included in the Supplemental Information Section of this budget. Below are City Council “A” priorities for FY 2013/14:
The Honorable Mayor, City Council and Citizens of the City of Beverly Hills, California
Letter of Transmittal February 15, 2014
5
Revenues
Fiscal Year 2012/13 General Fund revenues performed well. This is largely the result of increases over budget of 8.9% in property tax, 13.2% in sales tax, 5.5% in transient occupancy tax and 4.5% in business tax. It is projected that total FY 2013/14 General Fund revenue will increase by about 4% as detailed below.
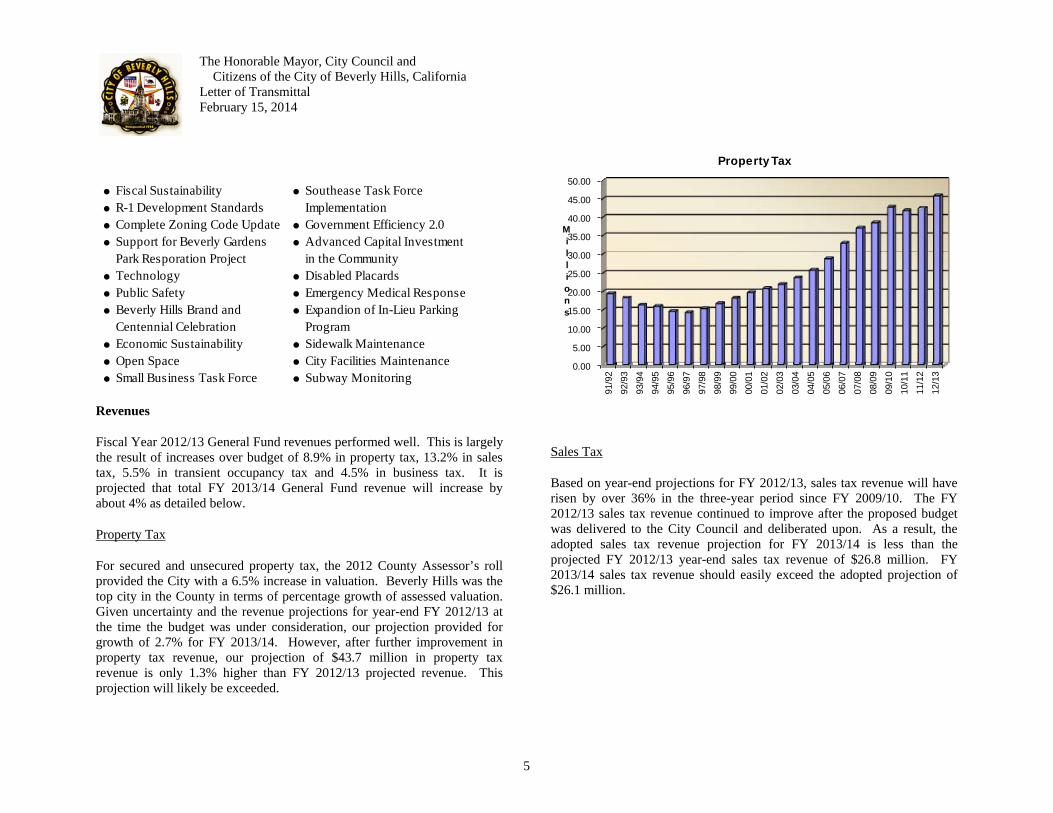
Property Tax
For secured and unsecured property tax, the 2012 County Assessor’s roll provided the City with a 6.5% increase in valuation. Beverly Hills was the top city in the County in terms of percentage growth of assessed valuation. Given uncertainty and the revenue projections for year-end FY 2012/13 at the time the budget was under consideration, our projection provided for growth of 2.7% for FY 2013/14. However, after further improvement in property tax revenue, our projection of $43.7 million in property tax revenue is only 1.3% higher than FY 2012/13 projected revenue. This projection will likely be exceeded.
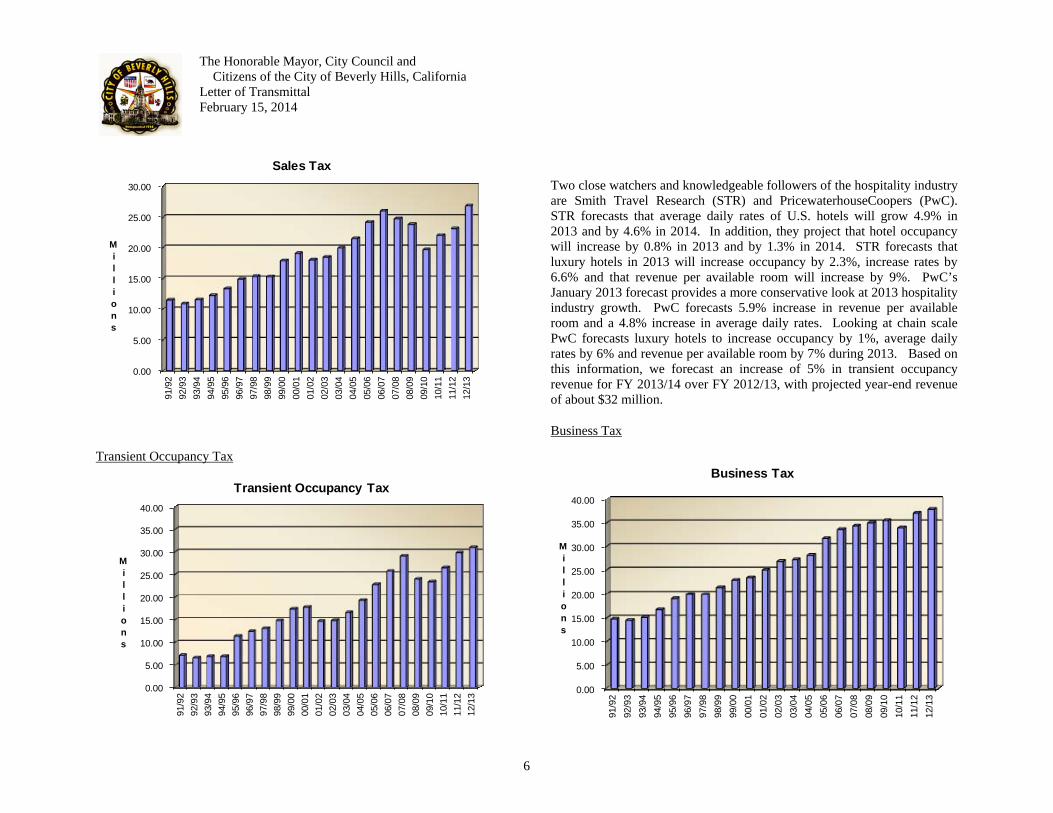
Sales Tax
Based on year-end projections for FY 2012/13, sales tax revenue will have risen by over 36% in the three-year period since FY 2009/10. The FY 2012/13 sales tax revenue continued to improve after the proposed budget was delivered to the City Council and deliberated upon. As a result, the adopted sales tax revenue projection for FY 2013/14 is less than the projected FY 2012/13 year-end sales tax revenue of $26.8 million. FY 2013/14 sales tax revenue should easily exceed the adopted projection of $26.1 million.
0.00
5.00
10.00
15.00
20.00
25.00
30.00
35.00
40.00
45.00
50.00
91/9
2
92/9
3
93/9
4
94/9
5
95/9
6
96/9
7
97/9
8
98/9
9
99/0
0
00/0
1
01/0
2
02/0
3
03/0
4
04/0
5
05/0
6
06/0
7
07/0
8
08/0
9
09/1
0
10/1
1
11/1
2
12/1
3
Millions
Property Tax
●●
Fiscal SustainabilityR-1 Development Standards
● Southease Task Force Implementation
● Complete Zoning Code Update ● Government Efficiency 2.0● Support for Beverly Gardens
Park Resporation Project● Advanced Capital Investment
in the Community● Technology ● Disabled Placards● Public Safety ● Emergency Medical Response● Beverly Hills Brand and
Centennial Celebration ● Expandion of In-Lieu Parking
Program● Economic Sustainability ● Sidewalk Maintenance● Open Space ● City Facilities Maintenance● Small Business Task Force ● Subway Monitoring
The Honorable Mayor, City Council and Citizens of the City of Beverly Hills, California
Letter of Transmittal February 15, 2014
6
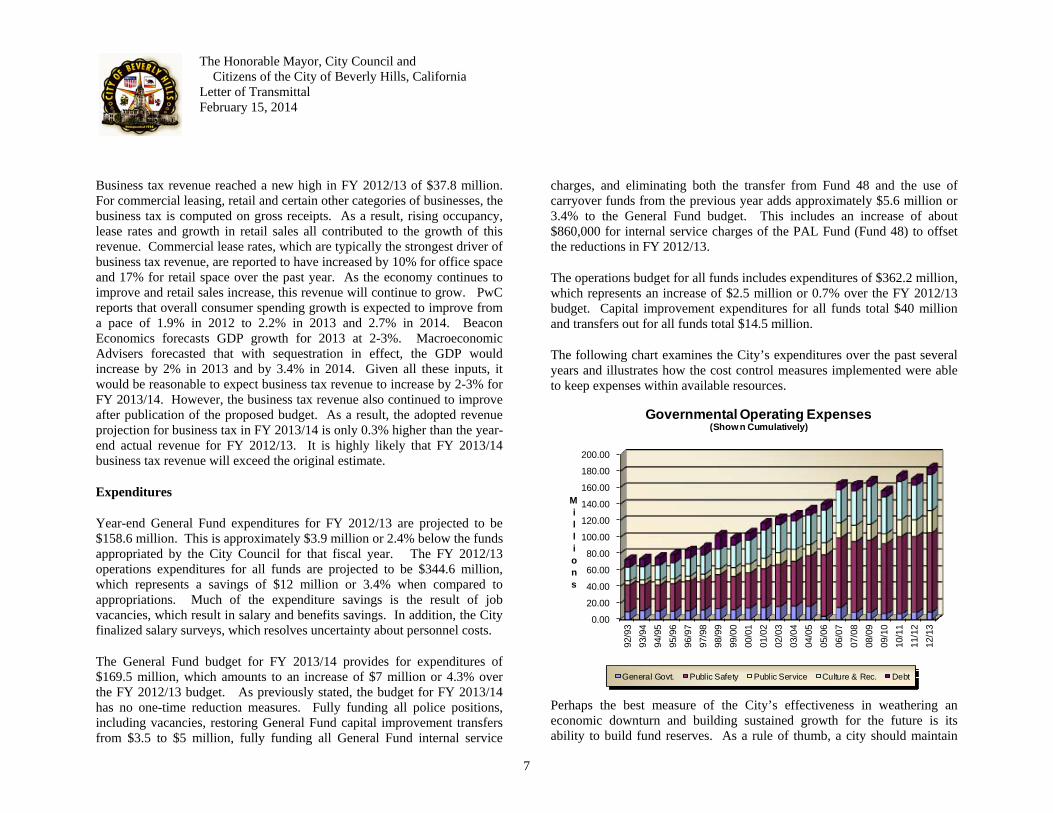
Transient Occupancy Tax
Two close watchers and knowledgeable followers of the hospitality industry are Smith Travel Research (STR) and PricewaterhouseCoopers (PwC). STR forecasts that average daily rates of U.S. hotels will grow 4.9% in 2013 and by 4.6% in 2014. In addition, they project that hotel occupancy will increase by 0.8% in 2013 and by 1.3% in 2014. STR forecasts that luxury hotels in 2013 will increase occupancy by 2.3%, increase rates by 6.6% and that revenue per available room will increase by 9%. PwC’s January 2013 forecast provides a more conservative look at 2013 hospitality industry growth. PwC forecasts 5.9% increase in revenue per available room and a 4.8% increase in average daily rates. Looking at chain scale PwC forecasts luxury hotels to increase occupancy by 1%, average daily rates by 6% and revenue per available room by 7% during 2013. Based on this information, we forecast an increase of 5% in transient occupancy revenue for FY 2013/14 over FY 2012/13, with projected year-end revenue of about $32 million.
Business Tax
0.00
5.00
10.00
15.00
20.00
25.00
30.00
91/9
292
/93
93/9
494
/95
95/9
696
/97
97/9
898
/99
99/0
000
/01
01/0
202
/03
03/0
404
/05
05/0
606
/07
07/0
808
/09
09/1
010
/11
11/1
212
/13
Millions
Sales Tax
0.00
5.00
10.00
15.00
20.00
25.00
30.00
35.00
40.00
91/9
292
/93
93/9
494
/95
95/9
696
/97
97/9
898
/99
99/0
000
/01
01/0
202
/03
03/0
404
/05
05/0
606
/07
07/0
808
/09
09/1
010
/11
11/1
212
/13
Millions
Transient Occupancy Tax
0.00
5.00
10.00
15.00
20.00
25.00
30.00
35.00
40.00
91/9
292
/93
93/9
494
/95
95/9
696
/97
97/9
898
/99
99/0
000
/01
01/0
202
/03
03/0
404
/05
05/0
606
/07
07/0
808
/09
09/1
010
/11
11/1
212
/13
Millions
Business Tax
The Honorable Mayor, City Council and Citizens of the City of Beverly Hills, California
Letter of Transmittal February 15, 2014
7
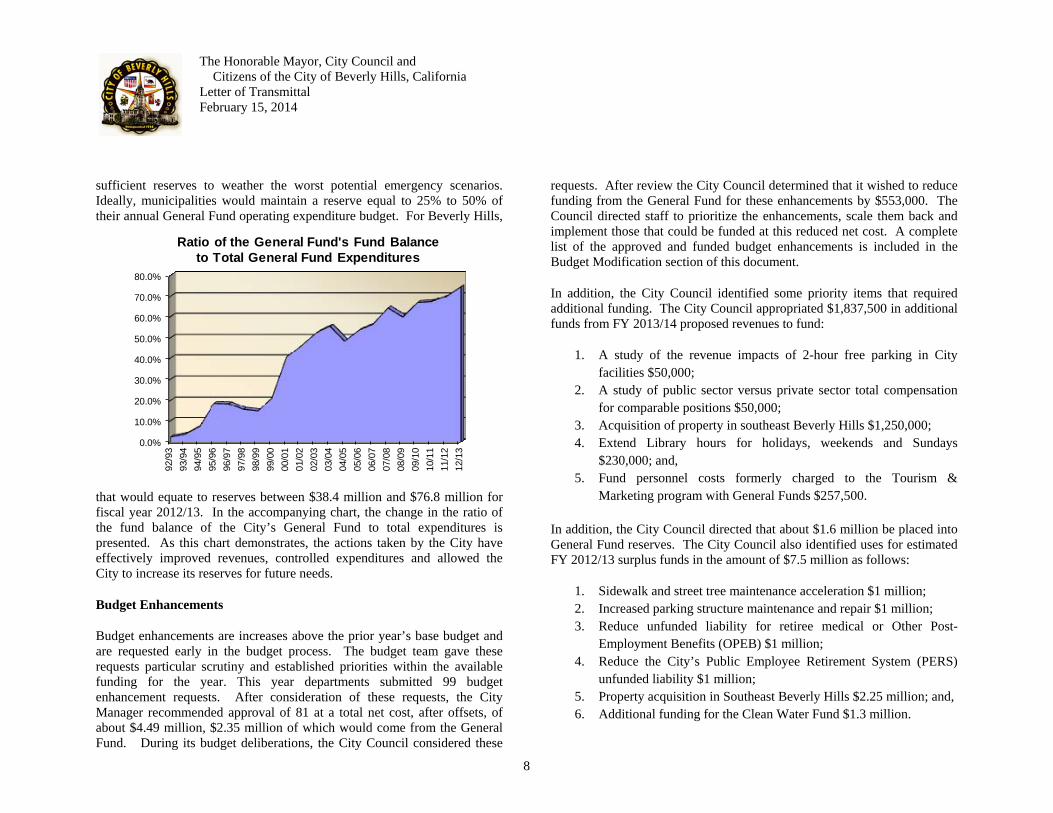
Business tax revenue reached a new high in FY 2012/13 of $37.8 million. For commercial leasing, retail and certain other categories of businesses, the business tax is computed on gross receipts. As a result, rising occupancy, lease rates and growth in retail sales all contributed to the growth of this revenue. Commercial lease rates, which are typically the strongest driver of business tax revenue, are reported to have increased by 10% for office space and 17% for retail space over the past year. As the economy continues to improve and retail sales increase, this revenue will continue to grow. PwC reports that overall consumer spending growth is expected to improve from a pace of 1.9% in 2012 to 2.2% in 2013 and 2.7% in 2014. Beacon Economics forecasts GDP growth for 2013 at 2-3%. Macroeconomic Advisers forecasted that with sequestration in effect, the GDP would increase by 2% in 2013 and by 3.4% in 2014. Given all these inputs, it would be reasonable to expect business tax revenue to increase by 2-3% for FY 2013/14. However, the business tax revenue also continued to improve after publication of the proposed budget. As a result, the adopted revenue projection for business tax in FY 2013/14 is only 0.3% higher than the year-end actual revenue for FY 2012/13. It is highly likely that FY 2013/14 business tax revenue will exceed the original estimate.
Expenditures
Year-end General Fund expenditures for FY 2012/13 are projected to be $158.6 million. This is approximately $3.9 million or 2.4% below the funds appropriated by the City Council for that fiscal year. The FY 2012/13 operations expenditures for all funds are projected to be $344.6 million, which represents a savings of $12 million or 3.4% when compared to appropriations. Much of the expenditure savings is the result of job vacancies, which result in salary and benefits savings. In addition, the City finalized salary surveys, which resolves uncertainty about personnel costs.
The General Fund budget for FY 2013/14 provides for expenditures of $169.5 million, which amounts to an increase of $7 million or 4.3% over the FY 2012/13 budget. As previously stated, the budget for FY 2013/14 has no one-time reduction measures. Fully funding all police positions, including vacancies, restoring General Fund capital improvement transfers from $3.5 to $5 million, fully funding all General Fund internal service
charges, and eliminating both the transfer from Fund 48 and the use of carryover funds from the previous year adds approximately $5.6 million or 3.4% to the General Fund budget. This includes an increase of about $860,000 for internal service charges of the PAL Fund (Fund 48) to offset the reductions in FY 2012/13.
The operations budget for all funds includes expenditures of $362.2 million, which represents an increase of $2.5 million or 0.7% over the FY 2012/13 budget. Capital improvement expenditures for all funds total $40 million and transfers out for all funds total $14.5 million.
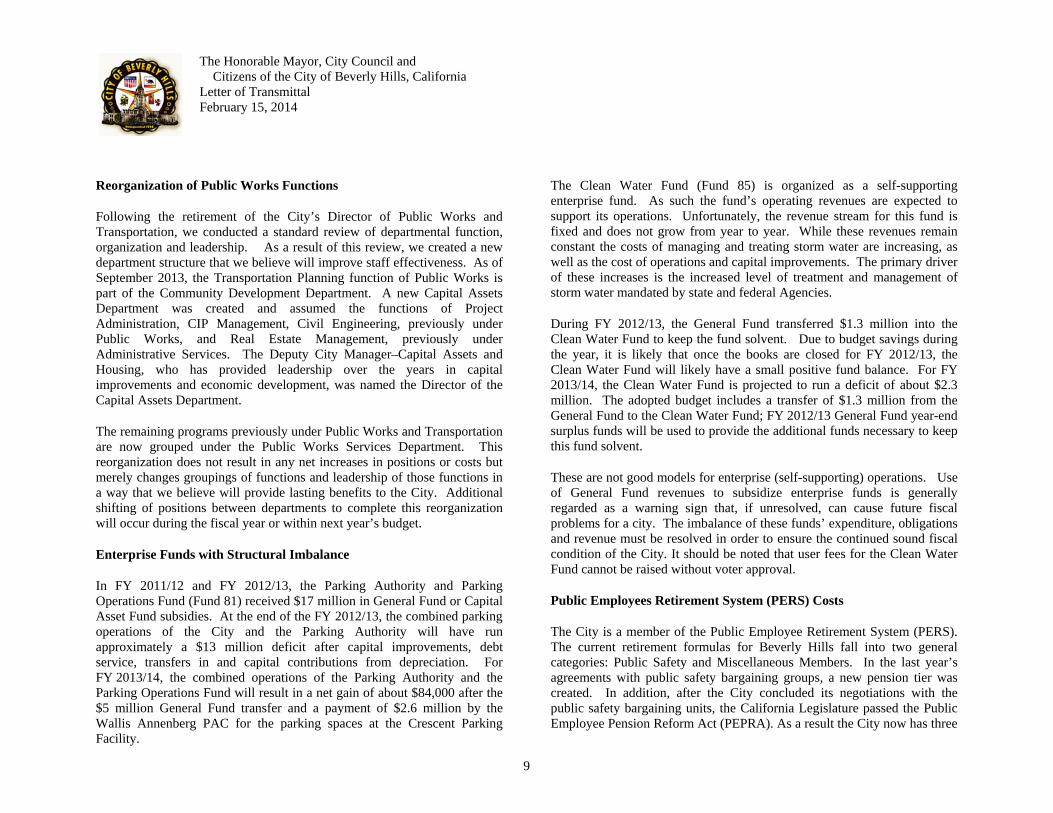
The following chart examines the City’s expenditures over the past several years and illustrates how the cost control measures implemented were able to keep expenses within available resources.
Perhaps the best measure of the City’s effectiveness in weathering an economic downturn and building sustained growth for the future is its ability to build fund reserves. As a rule of thumb, a city should maintain
0.00
20.00
40.00
60.00
80.00
100.00
120.00
140.00
160.00
180.00
200.00
92/9
393
/94
94/9
595
/96
96/9
797
/98
98/9
999
/00
00/0
101
/02
02/0
303
/04
04/0
505
/06
06/0
707
/08
08/0
909
/10
10/1
111
/12
12/1
3
Millions
Governmental Operating Expenses(Shown Cumulatively)
General Govt. Public Safety Public Service Culture & Rec. Debt
The Honorable Mayor, City Council and Citizens of the City of Beverly Hills, California
Letter of Transmittal February 15, 2014
8
sufficient reserves to weather the worst potential emergency scenarios. Ideally, municipalities would maintain a reserve equal to 25% to 50% of their annual General Fund operating expenditure budget. For Beverly Hills,
that would equate to reserves between $38.4 million and $76.8 million for fiscal year 2012/13. In the accompanying chart, the change in the ratio of the fund balance of the City’s General Fund to total expenditures is presented. As this chart demonstrates, the actions taken by the City have effectively improved revenues, controlled expenditures and allowed the City to increase its reserves for future needs.
Budget Enhancements
Budget enhancements are increases above the prior year’s base budget and are requested early in the budget process. The budget team gave these requests particular scrutiny and established priorities within the available funding for the year. This year departments submitted 99 budget enhancement requests. After consideration of these requests, the City Manager recommended approval of 81 at a total net cost, after offsets, of about $4.49 million, $2.35 million of which would come from the General Fund. During its budget deliberations, the City Council considered these
requests. After review the City Council determined that it wished to reduce funding from the General Fund for these enhancements by $553,000. The Council directed staff to prioritize the enhancements, scale them back and implement those that could be funded at this reduced net cost. A complete list of the approved and funded budget enhancements is included in the Budget Modification section of this document.
In addition, the City Council identified some priority items that required additional funding. The City Council appropriated $1,837,500 in additional funds from FY 2013/14 proposed revenues to fund:
1. A study of the revenue impacts of 2-hour free parking in City facilities $50,000;
2. A study of public sector versus private sector total compensation for comparable positions $50,000;
3. Acquisition of property in southeast Beverly Hills $1,250,000; 4. Extend Library hours for holidays, weekends and Sundays
$230,000; and, 5. Fund personnel costs formerly charged to the Tourism &
Marketing program with General Funds $257,500.
In addition, the City Council directed that about $1.6 million be placed into General Fund reserves. The City Council also identified uses for estimated FY 2012/13 surplus funds in the amount of $7.5 million as follows:
1. Sidewalk and street tree maintenance acceleration $1 million; 2. Increased parking structure maintenance and repair $1 million; 3. Reduce unfunded liability for retiree medical or Other Post-
Employment Benefits (OPEB) $1 million; 4. Reduce the City’s Public Employee Retirement System (PERS)
unfunded liability $1 million; 5. Property acquisition in Southeast Beverly Hills $2.25 million; and, 6. Additional funding for the Clean Water Fund $1.3 million.
0.0%
10.0%
20.0%
30.0%
40.0%
50.0%
60.0%
70.0%
80.0%
92/9
393
/94
94/9
595
/96
96/9
797
/98
98/9
999
/00
00/0
101
/02
02/0
303
/04
04/0
505
/06
06/0
707
/08
08/0
909
/10
10/1
111
/12
12/1
3
Ratio of the General Fund's Fund Balanceto Total General Fund Expenditures
The Honorable Mayor, City Council and Citizens of the City of Beverly Hills, California
Letter of Transmittal February 15, 2014
9
Reorganization of Public Works Functions
Following the retirement of the City’s Director of Public Works and Transportation, we conducted a standard review of departmental function, organization and leadership. As a result of this review, we created a new department structure that we believe will improve staff effectiveness. As of September 2013, the Transportation Planning function of Public Works is part of the Community Development Department. A new Capital Assets Department was created and assumed the functions of Project Administration, CIP Management, Civil Engineering, previously under Public Works, and Real Estate Management, previously under Administrative Services. The Deputy City Manager–Capital Assets and Housing, who has provided leadership over the years in capital improvements and economic development, was named the Director of the Capital Assets Department.
The remaining programs previously under Public Works and Transportation are now grouped under the Public Works Services Department. This reorganization does not result in any net increases in positions or costs but merely changes groupings of functions and leadership of those functions in a way that we believe will provide lasting benefits to the City. Additional shifting of positions between departments to complete this reorganization will occur during the fiscal year or within next year’s budget.
Enterprise Funds with Structural Imbalance
In FY 2011/12 and FY 2012/13, the Parking Authority and Parking Operations Fund (Fund 81) received $17 million in General Fund or Capital Asset Fund subsidies. At the end of the FY 2012/13, the combined parking operations of the City and the Parking Authority will have run approximately a $13 million deficit after capital improvements, debt service, transfers in and capital contributions from depreciation. For FY 2013/14, the combined operations of the Parking Authority and the Parking Operations Fund will result in a net gain of about $84,000 after the $5 million General Fund transfer and a payment of $2.6 million by the Wallis Annenberg PAC for the parking spaces at the Crescent Parking Facility.
The Clean Water Fund (Fund 85) is organized as a self-supporting enterprise fund. As such the fund’s operating revenues are expected to support its operations. Unfortunately, the revenue stream for this fund is fixed and does not grow from year to year. While these revenues remain constant the costs of managing and treating storm water are increasing, as well as the cost of operations and capital improvements. The primary driver of these increases is the increased level of treatment and management of storm water mandated by state and federal Agencies.
During FY 2012/13, the General Fund transferred $1.3 million into the Clean Water Fund to keep the fund solvent. Due to budget savings during the year, it is likely that once the books are closed for FY 2012/13, the Clean Water Fund will likely have a small positive fund balance. For FY 2013/14, the Clean Water Fund is projected to run a deficit of about $2.3 million. The adopted budget includes a transfer of $1.3 million from the General Fund to the Clean Water Fund; FY 2012/13 General Fund year-end surplus funds will be used to provide the additional funds necessary to keep this fund solvent.
These are not good models for enterprise (self-supporting) operations. Use of General Fund revenues to subsidize enterprise funds is generally regarded as a warning sign that, if unresolved, can cause future fiscal problems for a city. The imbalance of these funds’ expenditure, obligations and revenue must be resolved in order to ensure the continued sound fiscal condition of the City. It should be noted that user fees for the Clean Water Fund cannot be raised without voter approval.
Public Employees Retirement System (PERS) Costs
The City is a member of the Public Employee Retirement System (PERS). The current retirement formulas for Beverly Hills fall into two general categories: Public Safety and Miscellaneous Members. In the last year’s agreements with public safety bargaining groups, a new pension tier was created. In addition, after the City concluded its negotiations with the public safety bargaining units, the California Legislature passed the Public Employee Pension Reform Act (PEPRA). As a result the City now has three
The Honorable Mayor, City Council andCitizens of the City of Beverly Hills, California
Letter of TransmittalFebruary 15, 2014
tiers of pensions for Public Safety employees: 3% @ 50, 3% @ 55, and2.7% @57.
For Miscellaneous employees (non-safety) the City currently provides apension plan with a formula of 2.5% @ 55. Under PEPRA, newly hiredemployees who have not worked in a PERS participating or reciprocalagency within the past six months before hire will be placed in the new tierof 2% @ 62. These new tiers will provide long-term cost savings to theCity. But since they only apply to newly hired employees, these savingswill be realized over a long period of time. Employer contributions for FY2013 14 increased by 1.532°c for safety employees to 33.161°c, and by2.OO2°~ for miscellaneous employees to l6.676°o. The rates are stated asthe percent of applicable salary.
The PERS Board recently adopted new policies to provide for bettermanagement of the system and to prevent the deferral and possiblecompounding of obligations through smoothing plans which stretch outpayments on liability. The changes are quite likely to further increase therates.
Capital Improvement Plan (CIP)
The Capital Improvement Plan is designated as Volume 2 of the budget.FY 2013 14 funding includes $10 million of general capital funding, whichincludes $5 million transfer to the Infrastructure Fund (Fund 06) from theGeneral Fund and $5 million in Capital Assets (Fund 08) replacementinternal service charges. Capital improvement investments from all fundsthis year total about $40 million. Initiatives for the coming year includestreet resurfacing, sidewalk improvements, southeast area enhancementssuch as acquisition of land and development of parking, the reconstructionof North Santa Monica Boulevard, water main and hydrant replacements,and improvements to the water treatment plant.
Awards. The Government Finance Officers Association (GFOA) awardeda Certificate of Achievement for Excellence in Financial Reporting to theCity for its comprehensive annual financial report for the fiscal year endedJune 30, 2012. In order to be awarded a Certificate of Achievement, theCity published an easily readable and efficiently organized comprehensiveannual financial report. The report satisfied both generally acceptedaccounting principles and applicable legal requirements.
The California Society of Municipal Finance Officers (CSMFO) no longerreviews or issues a Certificate of Award for Excellence in PublicCommunication to cities that receive the GFOA award.
The Certificate of Achievement from the GFOA is valid for a period of oneyear. We believe that our current comprehensive annual financial reportcontinues to meet the Certificate of Achievement requirements and we aresubmitting it to the GFOA to determine its eligibility for another certificate.
Acknowledgments. The preparation of the comprehensive annual financialreport was made possible by the dedicated service of the entire staff of theAdministrative Services department. Each member of the department hasour sincere appreciation for the contribution made in the preparation of thisreport.
In closing, without the leadership and support of the City Council of theCity, preparation of this report, as well as the favorable financial results ofthe past year, would not have been possible.
,‘,‘
,flJ1 1: .~
Sincerely,
City Manager ChiefFinancial Qfficer
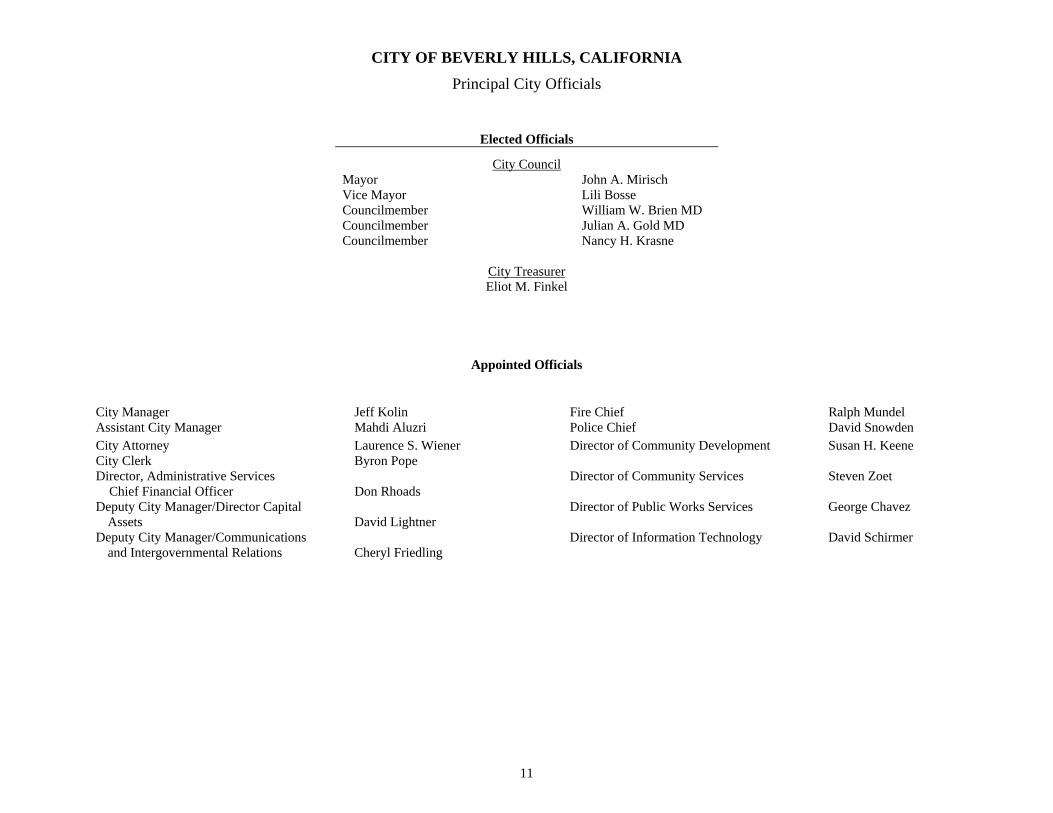
CITY OF BEVERLY HILLS, CALIFORNIA Principal City Officials
11
Elected Officials
City Council Mayor John A. Mirisch Vice Mayor Lili Bosse Councilmember William W. Brien MD Councilmember Julian A. Gold MD Councilmember Nancy H. Krasne
City Treasurer Eliot M. Finkel
Appointed Officials
City Manager Jeff Kolin Fire Chief Ralph Mundel Assistant City Manager Mahdi Aluzri Police Chief David Snowden City Attorney Laurence S. Wiener Director of Community Development Susan H. Keene City Clerk Byron Pope Director, Administrative Services Director of Community Services Steven Zoet Chief Financial Officer Don Rhoads Deputy City Manager/Director Capital
Assets
David Lightner Director of Public Works Services George Chavez
Deputy City Manager/Communications and Intergovernmental Relations
Cheryl Friedling
Director of Information Technology David Schirmer
12
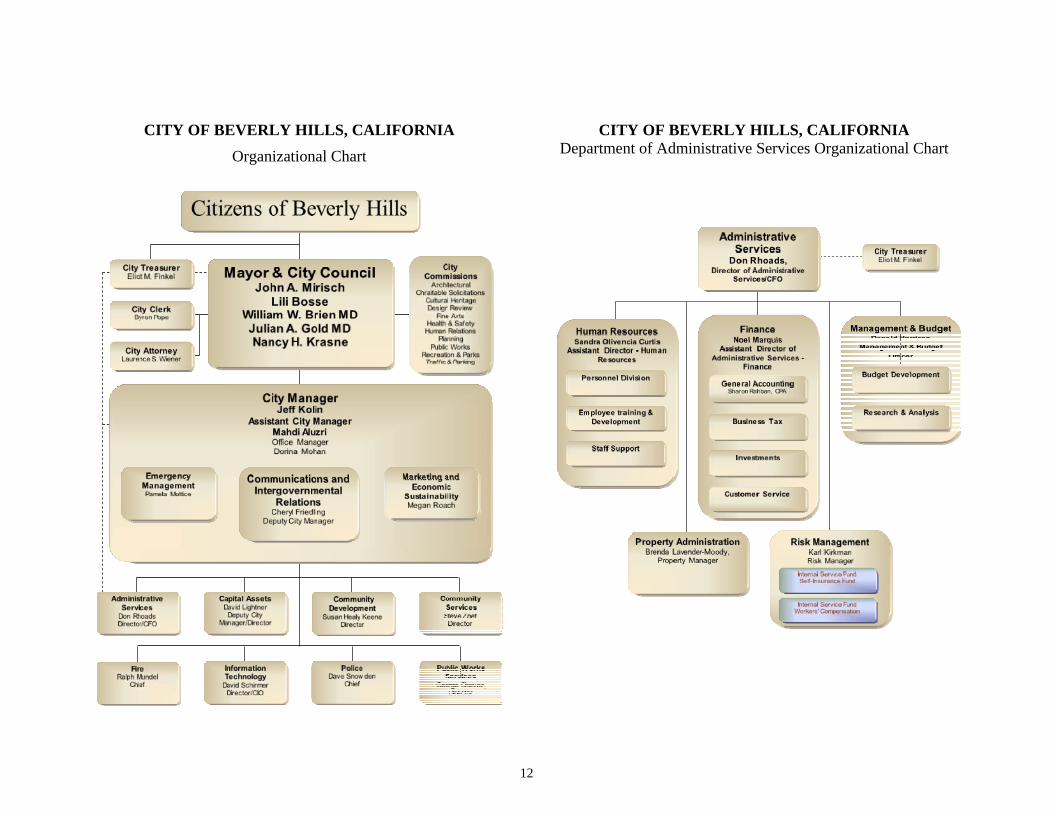
CITY OF BEVERLY HILLS, CALIFORNIA Organizational Chart
CITY OF BEVERLY HILLS, CALIFORNIA Department of Administrative Services Organizational Chart
13
The Government Finance Officers Association of the United States and Canada (GFOA) awarded a Certificate of Achievement for Excellence in Financial Reporting to the City of Beverly Hills for its Comprehensive Annual Financial Report for the fiscal year ended June 30, 2012. This was the twenty-fifth consecutive year that the City has achieved this prestigious award. In order to be awarded a Certificate of Achievement, a government must publish an easily readable and efficiently organized comprehensive annual financial report. This report must satisfy both generally accepted accounting principles and applicable legal requirements.
A Certificate of Achievement is valid for a period of one year only. We believe that our current comprehensive annual financial report continues to meet the Certificate of Achievement Program's requirements, and we are submitting it to the GFOA to determine its eligibility for another certificate.

14
2875 Michelle Drive, Suite 300, Irvine, CA 92606 • Tel: 714.978.1300 • Fax: 714.978.7893
Offices located in Orange and San Diego Counties
INDEPENDENT AUDITORS’ REPORT
To the Honorable Mayor and Members of the City Council City of Beverly Hills Beverly Hills, California Report on the Financial Statements We have audited the accompanying financial statements of the governmental activities, the business-type activities, each major fund, and the aggregate remaining fund information of the City of Beverly Hills, California, as of and for the year ended June 30, 2013, and the related notes to the financial statements, which collectively comprise the City’s basic financial statements as listed in the table of contents. Management’s Responsibility for the Financial Statements Management is responsible for the preparation and fair presentation of these financial statements in accordance with accounting principles generally accepted in the United States of America; this includes the design, implementation, and maintenance of internal control relevant to the preparation and fair presentation of financial statements that are free from material misstatement, whether due to fraud or error. Auditors’ Responsibility Our responsibility is to express opinions on these financial statements based on our audit. We conducted our audit in accordance with auditing standards generally accepted in the United States of America and the standards applicable to financial audits contained in Government Auditing Standards issued by the Comptroller General of the United States. Those standards require that we plan and perform the audit to obtain reasonable assurance about whether the financial statements are free from material misstatement. An audit involves performing procedures to obtain audit evidence about the amounts and disclosures in the financial statements. The procedures selected depend on the auditors’ judgment, including the assessment of the risks of material misstatement of the financial statements, whether due to fraud or error. In making those risk assessments, the auditors consider internal control relevant to the City’s preparation and fair presentation of the financial statements in order to design audit procedures that are appropriate in the circumstances, but not for the purpose of expressing an opinion on the effectiveness of the City’s internal control. Accordingly, we express no such opinion. An audit also includes evaluating the appropriateness of accounting policies used and the reasonableness of significant accounting estimates made by management, as well as evaluating the overall presentation of the financial statements. We believe that the audit evidence we have obtained is sufficient and appropriate to provide a basis for our opinions.
The Honorable Mayor and Members of City Council City of Beverly Hills Beverly Hills, California
15
Opinions In our opinion, the financial statements referred to above present fairly, in all material respects, the respective financial position of the governmental activities, the business-type activities, each major fund, and the aggregate remaining fund information of the City of Beverly Hills, California, as of June 30, 2013, and the respective changes in financial position and, where applicable, cash flows thereof and the respective budgetary comparison information for the general fund for the year then ended in accordance with accounting principles generally accepted in the United States of America. Other Matters Required Supplementary Information Accounting principles generally accepted in the United States of America require that the management’s discussion and analysis and schedules of funding progress, identified as required supplementary information in the table of contents, be presented to supplement the basic financial statements. Such information, although not a part of the basic financial statements, is required by the Governmental Accounting Standards Board, who considers it to be an essential part of financial reporting for placing the basic financial statement in an appropriate operational, economic, or historical context. We have applied certain limited procedures to the management’s discussion and analysis and the schedules of funding progress in accordance with auditing standards generally accepted in the United States of America, which consisted of inquiries of management about the methods of preparing the information and comparing the information for consistency with management’s responses to our inquiries, the basic financial statements, and other knowledge we obtained during the audit of the basic financial statements. We do not express an opinion or provide any assurance on the management’s discussion and analysis and the schedules of funding progress because the limited procedures do not provide us with sufficient evidence to express an opinion or provide any assurance on them. Other Information Our audit was conducted for the purpose of forming opinions on the financial statements that collectively comprise the City’s basic financial statements. The introductory section, combining statements and individual non-major fund schedules, and statistical section are presented for purposes of additional analysis and are not a required part of the basic financial statements. The combining and individual non-major fund financial statements are the responsibility of management and were derived from and relate directly to the underlying accounting and other records used to prepare the basic financial statements. Such information has been subjected to the auditing procedures applied in the audit of the basic financial statements and certain additional procedures, including comparing and reconciling such information directly to the underlying accounting and other records used to prepare the basic financial statements or to the basic financial statements themselves, and other additional procedures in accordance with auditing standards generally accepted in the United States of America. In our opinion, the information is fairly stated in all material respects in relation to the basic financial statements taken as a whole.
The Honorable Mayor and Members of City Council City of Beverly Hills Beverly Hills, California
16
Other Matters (Continued) Other Information (Continued) The introductory and statistical sections have not been subjected to the auditing procedures applied in the audit of the basic financial statements and, accordingly, we do not express an opinion or provide any assurance on them. Other Reporting Required by Government Auditing Standards In accordance with Government Auditing Standards, we have also issued our report dated February 14, 2014 on our consideration of the City of Beverly Hills, California’s internal control over financial reporting and on our tests of its compliance with certain provisions of laws, regulations, contracts and grant agreements and other matters. The purpose of that report is to describe the scope of our testing of internal control over financial reporting and compliance and the results of that testing, and not to provide an opinion on the internal control over financial reporting or on compliance. That report is an integral part of an audit performed in accordance with Government Auditing Standards in considering the City’s internal control over financial reporting and compliance. Irvine, California February 14, 2014

CITY OF BEVERLY HILLS, CALIFORNIA
Management’s Discussion and Analysis
June 30, 2013
17
As management of the City of Beverly Hills, California (City), we offer readers of the City’s financial statements this narrative overview and analy-sis of the financial activities of the City for the fiscal year ended June 30, 2013. We encourage readers to consider the information presented here in conjunction with additional information that we have furnished in our letter of transmittal, which can be found on pages 1 - 10 of this report. (A) Financial Highlights
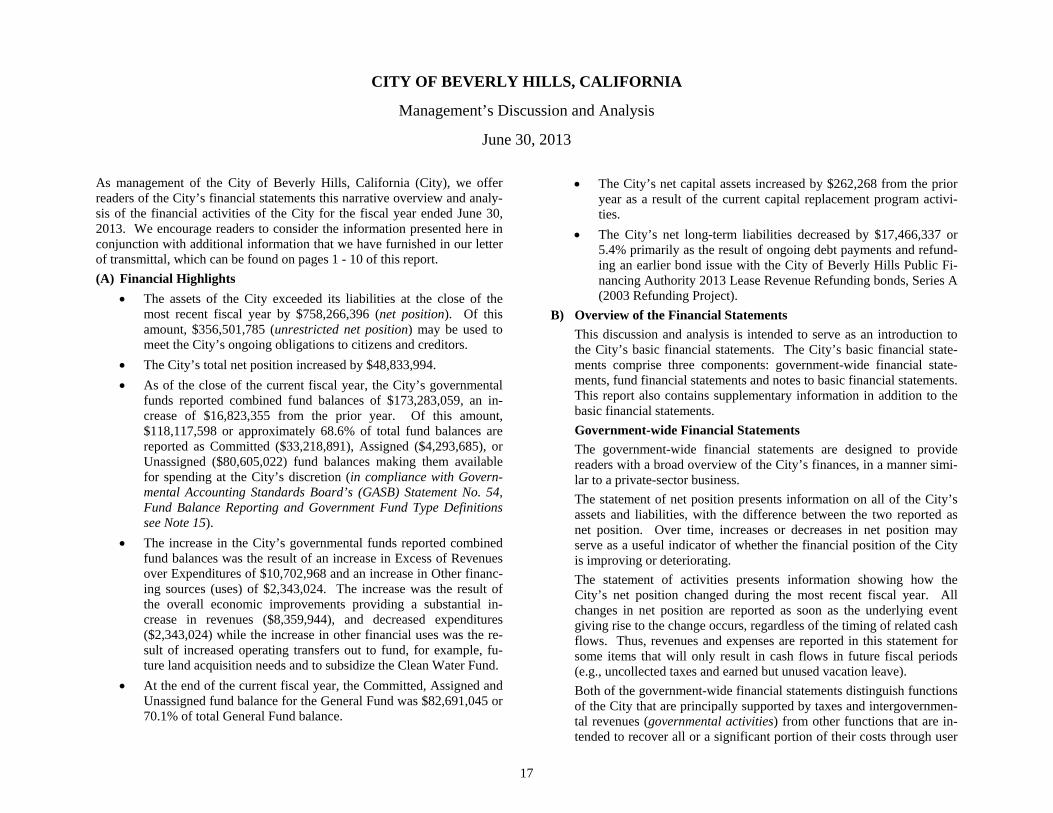
The assets of the City exceeded its liabilities at the close of the most recent fiscal year by $758,266,396 (net position). Of this amount, $356,501,785 (unrestricted net position) may be used to meet the City’s ongoing obligations to citizens and creditors.
The City’s total net position increased by $48,833,994. As of the close of the current fiscal year, the City’s governmental
funds reported combined fund balances of $173,283,059, an in-crease of $16,823,355 from the prior year. Of this amount, $118,117,598 or approximately 68.6% of total fund balances are reported as Committed ($33,218,891), Assigned ($4,293,685), or Unassigned ($80,605,022) fund balances making them available for spending at the City’s discretion (in compliance with Govern-mental Accounting Standards Board’s (GASB) Statement No. 54, Fund Balance Reporting and Government Fund Type Definitions see Note 15).
The increase in the City’s governmental funds reported combined fund balances was the result of an increase in Excess of Revenues over Expenditures of $10,702,968 and an increase in Other financ-ing sources (uses) of $2,343,024. The increase was the result of the overall economic improvements providing a substantial in-crease in revenues ($8,359,944), and decreased expenditures ($2,343,024) while the increase in other financial uses was the re-sult of increased operating transfers out to fund, for example, fu-ture land acquisition needs and to subsidize the Clean Water Fund.
At the end of the current fiscal year, the Committed, Assigned and Unassigned fund balance for the General Fund was $82,691,045 or 70.1% of total General Fund balance.
The City’s net capital assets increased by $262,268 from the prior year as a result of the current capital replacement program activi-ties.
The City’s net long-term liabilities decreased by $17,466,337 or 5.4% primarily as the result of ongoing debt payments and refund-ing an earlier bond issue with the City of Beverly Hills Public Fi-nancing Authority 2013 Lease Revenue Refunding bonds, Series A (2003 Refunding Project).
B) Overview of the Financial Statements This discussion and analysis is intended to serve as an introduction to the City’s basic financial statements. The City’s basic financial state-ments comprise three components: government-wide financial state-ments, fund financial statements and notes to basic financial statements. This report also contains supplementary information in addition to the basic financial statements. Government-wide Financial Statements The government-wide financial statements are designed to provide readers with a broad overview of the City’s finances, in a manner simi-lar to a private-sector business. The statement of net position presents information on all of the City’s assets and liabilities, with the difference between the two reported as net position. Over time, increases or decreases in net position may serve as a useful indicator of whether the financial position of the City is improving or deteriorating. The statement of activities presents information showing how the City’s net position changed during the most recent fiscal year. All changes in net position are reported as soon as the underlying event giving rise to the change occurs, regardless of the timing of related cash flows. Thus, revenues and expenses are reported in this statement for some items that will only result in cash flows in future fiscal periods (e.g., uncollected taxes and earned but unused vacation leave). Both of the government-wide financial statements distinguish functions of the City that are principally supported by taxes and intergovernmen-tal revenues (governmental activities) from other functions that are in-tended to recover all or a significant portion of their costs through user
CITY OF BEVERLY HILLS, CALIFORNIA
Management’s Discussion and Analysis, Continued
June 30, 2013
18
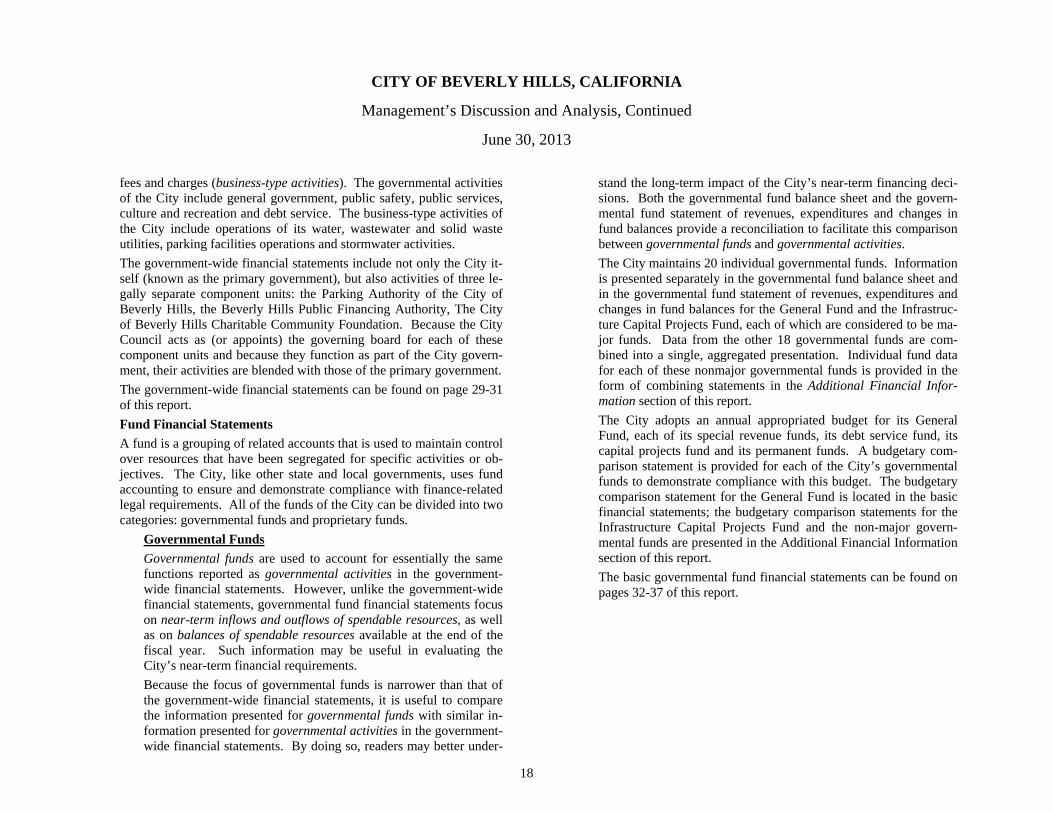
fees and charges (business-type activities). The governmental activities of the City include general government, public safety, public services, culture and recreation and debt service. The business-type activities of the City include operations of its water, wastewater and solid waste utilities, parking facilities operations and stormwater activities. The government-wide financial statements include not only the City it-self (known as the primary government), but also activities of three le-gally separate component units: the Parking Authority of the City of Beverly Hills, the Beverly Hills Public Financing Authority, The City of Beverly Hills Charitable Community Foundation. Because the City Council acts as (or appoints) the governing board for each of these component units and because they function as part of the City govern-ment, their activities are blended with those of the primary government. The government-wide financial statements can be found on page 29-31 of this report. Fund Financial Statements A fund is a grouping of related accounts that is used to maintain control over resources that have been segregated for specific activities or ob-jectives. The City, like other state and local governments, uses fund accounting to ensure and demonstrate compliance with finance-related legal requirements. All of the funds of the City can be divided into two categories: governmental funds and proprietary funds.
Governmental Funds Governmental funds are used to account for essentially the same functions reported as governmental activities in the government-wide financial statements. However, unlike the government-wide financial statements, governmental fund financial statements focus on near-term inflows and outflows of spendable resources, as well as on balances of spendable resources available at the end of the fiscal year. Such information may be useful in evaluating the City’s near-term financial requirements. Because the focus of governmental funds is narrower than that of the government-wide financial statements, it is useful to compare the information presented for governmental funds with similar in-formation presented for governmental activities in the government-wide financial statements. By doing so, readers may better under-
stand the long-term impact of the City’s near-term financing deci-sions. Both the governmental fund balance sheet and the govern-mental fund statement of revenues, expenditures and changes in fund balances provide a reconciliation to facilitate this comparison between governmental funds and governmental activities. The City maintains 20 individual governmental funds. Information is presented separately in the governmental fund balance sheet and in the governmental fund statement of revenues, expenditures and changes in fund balances for the General Fund and the Infrastruc-ture Capital Projects Fund, each of which are considered to be ma-jor funds. Data from the other 18 governmental funds are com-bined into a single, aggregated presentation. Individual fund data for each of these nonmajor governmental funds is provided in the form of combining statements in the Additional Financial Infor-mation section of this report. The City adopts an annual appropriated budget for its General Fund, each of its special revenue funds, its debt service fund, its capital projects fund and its permanent funds. A budgetary com-parison statement is provided for each of the City’s governmental funds to demonstrate compliance with this budget. The budgetary comparison statement for the General Fund is located in the basic financial statements; the budgetary comparison statements for the Infrastructure Capital Projects Fund and the non-major govern-mental funds are presented in the Additional Financial Information section of this report. The basic governmental fund financial statements can be found on pages 32-37 of this report.
CITY OF BEVERLY HILLS, CALIFORNIA
Management’s Discussion and Analysis, Continued
June 30, 2013
19
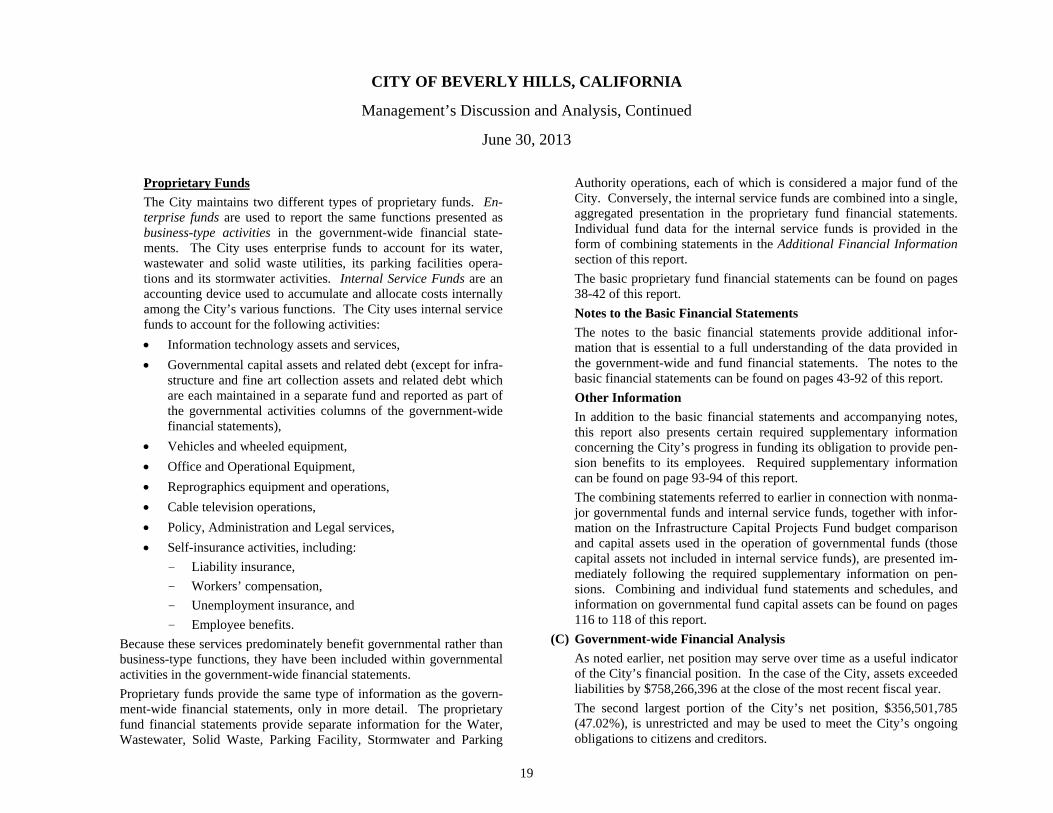
Proprietary Funds The City maintains two different types of proprietary funds. En-terprise funds are used to report the same functions presented as business-type activities in the government-wide financial state-ments. The City uses enterprise funds to account for its water, wastewater and solid waste utilities, its parking facilities opera-tions and its stormwater activities. Internal Service Funds are an accounting device used to accumulate and allocate costs internally among the City’s various functions. The City uses internal service funds to account for the following activities: Information technology assets and services, Governmental capital assets and related debt (except for infra-
structure and fine art collection assets and related debt which are each maintained in a separate fund and reported as part of the governmental activities columns of the government-wide financial statements),
Vehicles and wheeled equipment, Office and Operational Equipment, Reprographics equipment and operations, Cable television operations, Policy, Administration and Legal services, Self-insurance activities, including:
- Liability insurance, - Workers’ compensation, - Unemployment insurance, and - Employee benefits.
Because these services predominately benefit governmental rather than business-type functions, they have been included within governmental activities in the government-wide financial statements. Proprietary funds provide the same type of information as the govern-ment-wide financial statements, only in more detail. The proprietary fund financial statements provide separate information for the Water, Wastewater, Solid Waste, Parking Facility, Stormwater and Parking
Authority operations, each of which is considered a major fund of the City. Conversely, the internal service funds are combined into a single, aggregated presentation in the proprietary fund financial statements. Individual fund data for the internal service funds is provided in the form of combining statements in the Additional Financial Information section of this report. The basic proprietary fund financial statements can be found on pages 38-42 of this report. Notes to the Basic Financial Statements The notes to the basic financial statements provide additional infor-mation that is essential to a full understanding of the data provided in the government-wide and fund financial statements. The notes to the basic financial statements can be found on pages 43-92 of this report. Other Information In addition to the basic financial statements and accompanying notes, this report also presents certain required supplementary information concerning the City’s progress in funding its obligation to provide pen-sion benefits to its employees. Required supplementary information can be found on page 93-94 of this report. The combining statements referred to earlier in connection with nonma-jor governmental funds and internal service funds, together with infor-mation on the Infrastructure Capital Projects Fund budget comparison and capital assets used in the operation of governmental funds (those capital assets not included in internal service funds), are presented im-mediately following the required supplementary information on pen-sions. Combining and individual fund statements and schedules, and information on governmental fund capital assets can be found on pages 116 to 118 of this report.
(C) Government-wide Financial Analysis As noted earlier, net position may serve over time as a useful indicator of the City’s financial position. In the case of the City, assets exceeded liabilities by $758,266,396 at the close of the most recent fiscal year. The second largest portion of the City’s net position, $356,501,785 (47.02%), is unrestricted and may be used to meet the City’s ongoing obligations to citizens and creditors.
CITY OF BEVERLY HILLS, CALIFORNIA
Management’s Discussion and Analysis, Continued
June 30, 2013
20
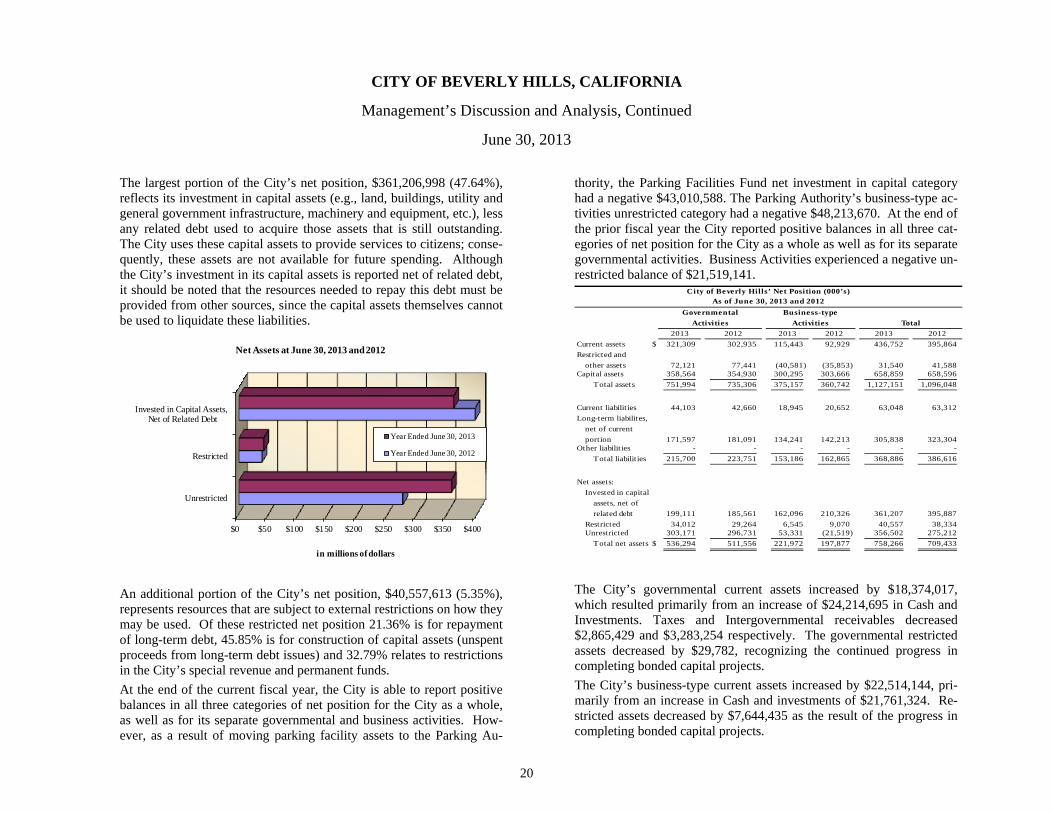
The largest portion of the City’s net position, $361,206,998 (47.64%), reflects its investment in capital assets (e.g., land, buildings, utility and general government infrastructure, machinery and equipment, etc.), less any related debt used to acquire those assets that is still outstanding. The City uses these capital assets to provide services to citizens; conse-quently, these assets are not available for future spending. Although the City’s investment in its capital assets is reported net of related debt, it should be noted that the resources needed to repay this debt must be provided from other sources, since the capital assets themselves cannot be used to liquidate these liabilities.
An additional portion of the City’s net position, $40,557,613 (5.35%), represents resources that are subject to external restrictions on how they may be used. Of these restricted net position 21.36% is for repayment of long-term debt, 45.85% is for construction of capital assets (unspent proceeds from long-term debt issues) and 32.79% relates to restrictions in the City’s special revenue and permanent funds. At the end of the current fiscal year, the City is able to report positive balances in all three categories of net position for the City as a whole, as well as for its separate governmental and business activities. How-ever, as a result of moving parking facility assets to the Parking Au-
thority, the Parking Facilities Fund net investment in capital category had a negative $43,010,588. The Parking Authority’s business-type ac-tivities unrestricted category had a negative $48,213,670. At the end of the prior fiscal year the City reported positive balances in all three cat-egories of net position for the City as a whole as well as for its separate governmental activities. Business Activities experienced a negative un-restricted balance of $21,519,141.
2013 2012 2013 2012 2013 2012Current assets $ 321,309 302,935 115,443 92,929 436,752 395,864 Restricted and
other assets 72,121 77,441 (40,581) (35,853) 31,540 41,588 Capital assets 358,564 354,930 300,295 303,666 658,859 658,596
Total assets 751,994 735,306 375,157 360,742 1,127,151 1,096,048
Current liabilities 44,103 42,660 18,945 20,652 63,048 63,312 Long-term liabilites,
net of currentportion 171,597 181,091 134,241 142,213 305,838 323,304
Other liabilit ies - - - - - - Total liabilit ies 215,700 223,751 153,186 162,865 368,886 386,616
Net assets:Invested in capital
assets, net ofrelated debt 199,111 185,561 162,096 210,326 361,207 395,887
Restricted 34,012 29,264 6,545 9,070 40,557 38,334 Unrestricted 303,171 296,731 53,331 (21,519) 356,502 275,212
Total net assets $ 536,294 511,556 221,972 197,877 758,266 709,433
City of Beverly Hills’ Net Position (000’s)As of June 30, 2013 and 2012
TotalGovernmental
ActivitiesBusiness-type
Activities
The City’s governmental current assets increased by $18,374,017, which resulted primarily from an increase of $24,214,695 in Cash and Investments. Taxes and Intergovernmental receivables decreased $2,865,429 and $3,283,254 respectively. The governmental restricted assets decreased by $29,782, recognizing the continued progress in completing bonded capital projects. The City’s business-type current assets increased by $22,514,144, pri-marily from an increase in Cash and investments of $21,761,324. Re-stricted assets decreased by $7,644,435 as the result of the progress in completing bonded capital projects.
$0 $50 $100 $150 $200 $250 $300 $350 $400
Unrestricted
Restricted
Invested in Capital Assets, Net of Related Debt
in millions of dollars
Net Assets at June 30, 2013 and 2012
Year Ended June 30, 2013
Year Ended June 30, 2012
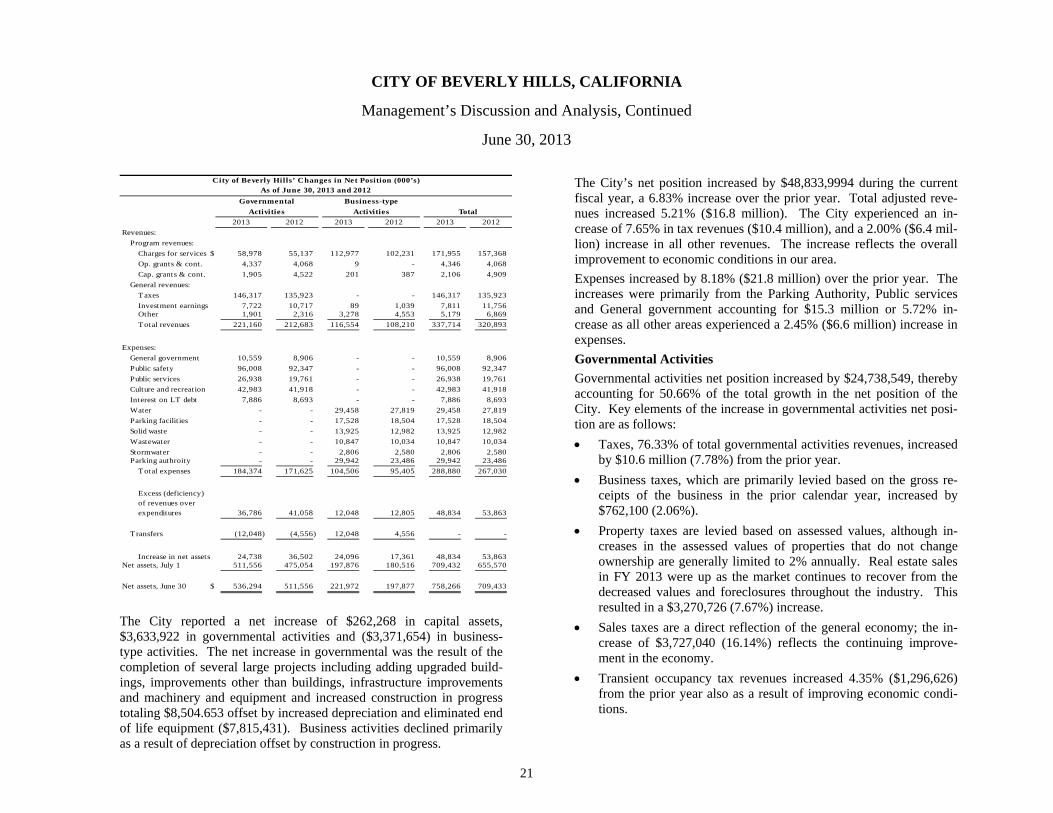
CITY OF BEVERLY HILLS, CALIFORNIA
Management’s Discussion and Analysis, Continued
June 30, 2013
21
2013 2012 2013 2012 2013 2012Revenues:
Program revenues:Charges for services $ 58,978 55,137 112,977 102,231 171,955 157,368 Op. grants & cont. 4,337 4,068 9 - 4,346 4,068 Cap. grants & cont. 1,905 4,522 201 387 2,106 4,909
General revenues:Taxes 146,317 135,923 - - 146,317 135,923 Investment earnings 7,722 10,717 89 1,039 7,811 11,756 Other 1,901 2,316 3,278 4,553 5,179 6,869 Total revenues 221,160 212,683 116,554 108,210 337,714 320,893
Expenses:General government 10,559 8,906 - - 10,559 8,906 Public safety 96,008 92,347 - - 96,008 92,347 Public services 26,938 19,761 - - 26,938 19,761 Culture and recreation 42,983 41,918 - - 42,983 41,918 Interest on LT debt 7,886 8,693 - - 7,886 8,693 Water - - 29,458 27,819 29,458 27,819 Parking facilit ies - - 17,528 18,504 17,528 18,504 Solid waste - - 13,925 12,982 13,925 12,982 Wastewater - - 10,847 10,034 10,847 10,034 Stormwater - - 2,806 2,580 2,806 2,580 Parking authroity - - 29,942 23,486 29,942 23,486
Total expenses 184,374 171,625 104,506 95,405 288,880 267,030
36,786 41,058 12,048 12,805 48,834 53,863
T ransfers (12,048) (4,556) 12,048 4,556 - -
Increase in net assets 24,738 36,502 24,096 17,361 48,834 53,863 Net assets, July 1 511,556 475,054 197,876 180,516 709,432 655,570
Net assets, June 30 $ 536,294 511,556 221,972 197,877 758,266 709,433
Excess (deficiency) of revenues over expenditures
City of Beverly Hills’ Changes in Net Position (000’s)As of June 30, 2013 and 2012
Governmental Business-typeActivities Activities Total
The City reported a net increase of $262,268 in capital assets, $3,633,922 in governmental activities and ($3,371,654) in business-type activities. The net increase in governmental was the result of the completion of several large projects including adding upgraded build-ings, improvements other than buildings, infrastructure improvements and machinery and equipment and increased construction in progress totaling $8,504.653 offset by increased depreciation and eliminated end of life equipment ($7,815,431). Business activities declined primarily as a result of depreciation offset by construction in progress.
The City’s net position increased by $48,833,9994 during the current fiscal year, a 6.83% increase over the prior year. Total adjusted reve-nues increased 5.21% ($16.8 million). The City experienced an in-crease of 7.65% in tax revenues ($10.4 million), and a 2.00% ($6.4 mil-lion) increase in all other revenues. The increase reflects the overall improvement to economic conditions in our area. Expenses increased by 8.18% ($21.8 million) over the prior year. The increases were primarily from the Parking Authority, Public services and General government accounting for $15.3 million or 5.72% in-crease as all other areas experienced a 2.45% ($6.6 million) increase in expenses. Governmental Activities Governmental activities net position increased by $24,738,549, thereby accounting for 50.66% of the total growth in the net position of the City. Key elements of the increase in governmental activities net posi-tion are as follows: Taxes, 76.33% of total governmental activities revenues, increased
by $10.6 million (7.78%) from the prior year. Business taxes, which are primarily levied based on the gross re-
ceipts of the business in the prior calendar year, increased by $762,100 (2.06%).
Property taxes are levied based on assessed values, although in-creases in the assessed values of properties that do not change ownership are generally limited to 2% annually. Real estate sales in FY 2013 were up as the market continues to recover from the decreased values and foreclosures throughout the industry. This resulted in a $3,270,726 (7.67%) increase.
Sales taxes are a direct reflection of the general economy; the in-crease of $3,727,040 (16.14%) reflects the continuing improve-ment in the economy.
Transient occupancy tax revenues increased 4.35% ($1,296,626) from the prior year also as a result of improving economic condi-tions.
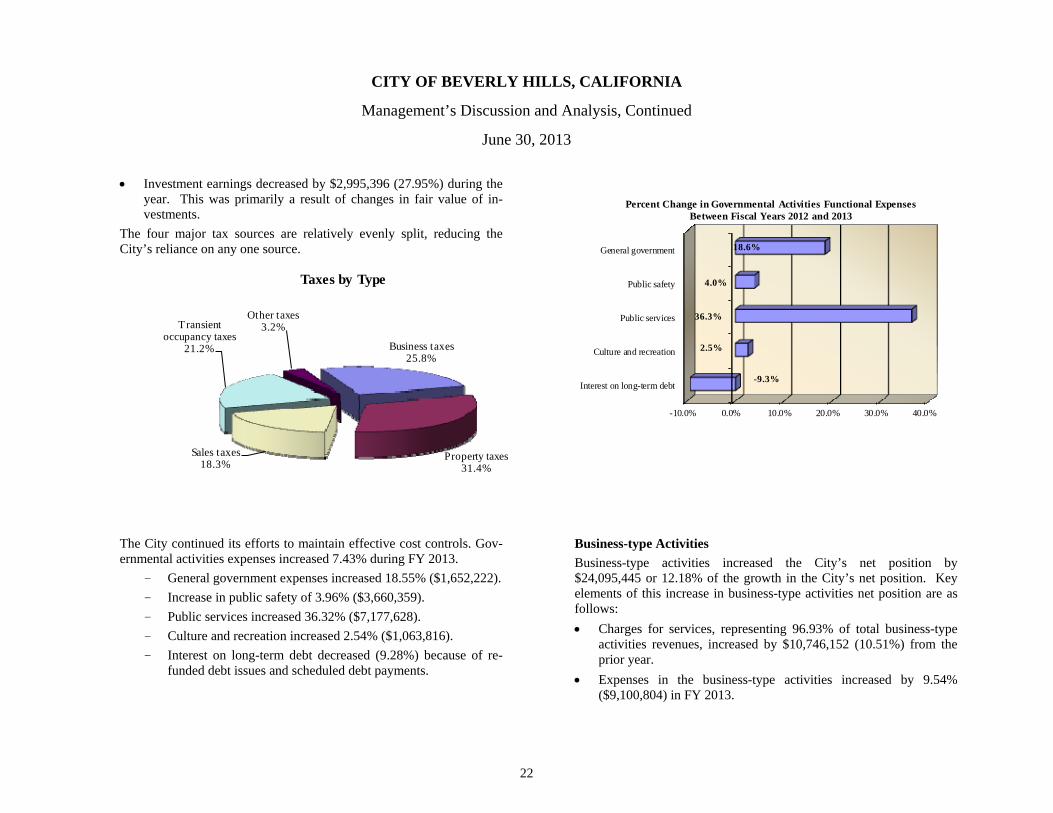
CITY OF BEVERLY HILLS, CALIFORNIA
Management’s Discussion and Analysis, Continued
June 30, 2013
22
Investment earnings decreased by $2,995,396 (27.95%) during the year. This was primarily a result of changes in fair value of in-vestments.
The four major tax sources are relatively evenly split, reducing the City’s reliance on any one source.
The City continued its efforts to maintain effective cost controls. Gov-ernmental activities expenses increased 7.43% during FY 2013.
- General government expenses increased 18.55% ($1,652,222). - Increase in public safety of 3.96% ($3,660,359). - Public services increased 36.32% ($7,177,628). - Culture and recreation increased 2.54% ($1,063,816). - Interest on long-term debt decreased (9.28%) because of re-
funded debt issues and scheduled debt payments.
Business-type Activities Business-type activities increased the City’s net position by $24,095,445 or 12.18% of the growth in the City’s net position. Key elements of this increase in business-type activities net position are as follows: Charges for services, representing 96.93% of total business-type
activities revenues, increased by $10,746,152 (10.51%) from the prior year.
Expenses in the business-type activities increased by 9.54% ($9,100,804) in FY 2013.
Business taxes25.8%
Property taxes31.4%
Sales taxes18.3%
Transient occupancy taxes
21.2%
Other taxes3.2%
Taxes by Type
-10.0% 0.0% 10.0% 20.0% 30.0% 40.0%
General government
Public safety
Public services
Culture and recreation
Interest on long-term debt
18.6%
4.0%
36.3%
2.5%
-9.3%
Percent Change in Governmental Activities Functional Expenses Between Fiscal Years 2012 and 2013
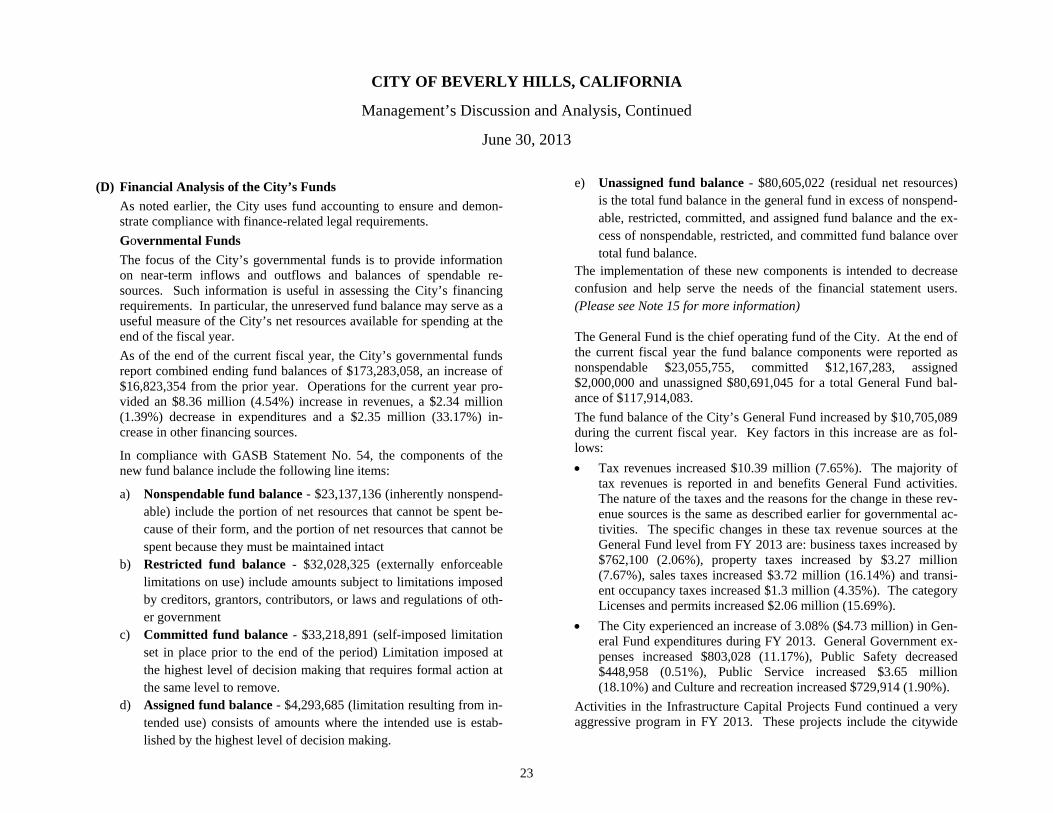
CITY OF BEVERLY HILLS, CALIFORNIA
Management’s Discussion and Analysis, Continued
June 30, 2013
23
(D) Financial Analysis of the City’s Funds As noted earlier, the City uses fund accounting to ensure and demon-strate compliance with finance-related legal requirements. Governmental Funds The focus of the City’s governmental funds is to provide information on near-term inflows and outflows and balances of spendable re-sources. Such information is useful in assessing the City’s financing requirements. In particular, the unreserved fund balance may serve as a useful measure of the City’s net resources available for spending at the end of the fiscal year. As of the end of the current fiscal year, the City’s governmental funds report combined ending fund balances of $173,283,058, an increase of $16,823,354 from the prior year. Operations for the current year pro-vided an $8.36 million (4.54%) increase in revenues, a $2.34 million (1.39%) decrease in expenditures and a $2.35 million (33.17%) in-crease in other financing sources.
In compliance with GASB Statement No. 54, the components of the new fund balance include the following line items:
a) Nonspendable fund balance - $23,137,136 (inherently nonspend-able) include the portion of net resources that cannot be spent be-cause of their form, and the portion of net resources that cannot be spent because they must be maintained intact
b) Restricted fund balance - $32,028,325 (externally enforceable limitations on use) include amounts subject to limitations imposed by creditors, grantors, contributors, or laws and regulations of oth-er government
c) Committed fund balance - $33,218,891 (self-imposed limitation set in place prior to the end of the period) Limitation imposed at the highest level of decision making that requires formal action at the same level to remove.
d) Assigned fund balance - $4,293,685 (limitation resulting from in-tended use) consists of amounts where the intended use is estab-lished by the highest level of decision making.
e) Unassigned fund balance - $80,605,022 (residual net resources) is the total fund balance in the general fund in excess of nonspend-able, restricted, committed, and assigned fund balance and the ex-cess of nonspendable, restricted, and committed fund balance over total fund balance.
The implementation of these new components is intended to decrease confusion and help serve the needs of the financial statement users. (Please see Note 15 for more information)
The General Fund is the chief operating fund of the City. At the end of the current fiscal year the fund balance components were reported as nonspendable $23,055,755, committed $12,167,283, assigned $2,000,000 and unassigned $80,691,045 for a total General Fund bal-ance of $117,914,083. The fund balance of the City’s General Fund increased by $10,705,089 during the current fiscal year. Key factors in this increase are as fol-lows: Tax revenues increased $10.39 million (7.65%). The majority of
tax revenues is reported in and benefits General Fund activities. The nature of the taxes and the reasons for the change in these rev-enue sources is the same as described earlier for governmental ac-tivities. The specific changes in these tax revenue sources at the General Fund level from FY 2013 are: business taxes increased by $762,100 (2.06%), property taxes increased by $3.27 million (7.67%), sales taxes increased $3.72 million (16.14%) and transi-ent occupancy taxes increased $1.3 million (4.35%). The category Licenses and permits increased $2.06 million (15.69%).
The City experienced an increase of 3.08% ($4.73 million) in Gen-eral Fund expenditures during FY 2013. General Government ex-penses increased $803,028 (11.17%), Public Safety decreased $448,958 (0.51%), Public Service increased $3.65 million (18.10%) and Culture and recreation increased $729,914 (1.90%).
Activities in the Infrastructure Capital Projects Fund continued a very aggressive program in FY 2013. These projects include the citywide
CITY OF BEVERLY HILLS, CALIFORNIA
Management’s Discussion and Analysis, Continued
June 30, 2013
24
streetlight replacement program, resurfacing of major streets, parks capital improvement projects and traffic signal upgrades. Nonmajor governmental funds’ fund balances increased $2.86 million (8.39%) during FY 2013. Enterprise Funds The City’s enterprise funds provide the same type of information found in the government-wide financial statements, but in more detail. Unre-stricted net position of the enterprise funds totaled $53.33 million, an increase of $74.85 million (347.83%). The improvement to unrestrict-ed net position is the result of improvements to the financial position of the Water, Solid Waste, Wastewater, Stormwater and Parking Facilities Enterprise funds. On September 30, 2011, the majority of the assets of the City’s Parking Enterprise Fund were transferred to the Parking Au-thority in order to show a total separation between the Parking Authori-ty and the City. As a result the unrestricted net position of the Parking Facilities are now shown in the Parking Facilities Enterprise Fund at $30,545,488 and the Parking Authority as a negative $48,213,670. Other factors concerning the finances of these funds are as follows: Operating revenue for the Water Enterprise increased $3.82 mil-
lion (12.27%), operating expenses increased $1.64 million (5.9%), operating income increased by $1.5 million (21.28%), income after non-operating items increased $1.78 million (49.84%) and change in net position increased by $1.45 million (37.15%).
Operating revenue for the Parking Facilities Enterprise decreased $991,908 (4.05%) operating expenses decreased $977,313 (5.3%), operating income decreased $401,685 (4.27%), income after non-operating items decreased $2.15 million (26.41%) an increase in change in net position of $67.31 million.
Operating revenue for the Solid Waste Enterprise increased $675,630 (4.58%) operating expenses increased $942,792 (7.3%), operating income decreased $267,162 (15.10%), income after non-operating items decreased $402,561 (20.96%) providing a decrease to change in net position of $336,461 (18.75%).
Operating revenues for the Wastewater Enterprise increased $509,405 (4.01%), expenses increased $813,686 (8.1%), operating
income decreased $333,318 (10.36%), income after non-operating items decreased $727,208 (16.19%) translating to a decrease in net assets of $700,408 (15.69%).
Operating revenues for the Stormwater Enterprise increased $46,156 (2.60%), expenses increased $226,830 (8.8%), operating income decreased by $180,674 (22.44%), income after non-operating items decreased by $193,172 (24.31%) and change in net assets increased $1.65 million.
Operating revenues for the Parking Authority increased $6.69 mil-lion (37.24%), expenses increased $6.46 million (27.50%), operat-ing losses decreased $120,013 (3.66%) and loss after non-operating improved by $935,662 and change in net assets was $750,928.
Internal Service Funds The City’s internal service funds are an accounting device used to ac-cumulate and allocate costs internally among the City’s various func-tions. The City uses internal service funds to account for its infor-mation technology assets and services, governmental capital assets and related debt (except for infrastructure and fine art collection assets and related debt), reprographics equipment and operations, cable television operations and the Policy, Administration and Legal services provided. The City also uses internal service funds to account for its self-insurance activities, including liability insurance, workers’ compensa-tion, unemployment insurance and employee benefits. Because these services predominately benefit governmental rather than business-type functions, they have been included within governmental activities in the government-wide financial statements. Factors concerning the finances of the internal service funds have al-ready been addressed in the discussion of the City’s governmental ac-tivities.
(E) Budgetary Highlights The City adopts annual appropriated operating budgets for its govern-mental funds (General Fund, special revenue funds, debt service fund, capital projects fund and permanent funds), and reports the results of operations on a budgetary comparison basis. The City also uses annual financial plans as a management tool for its enterprise and internal ser-
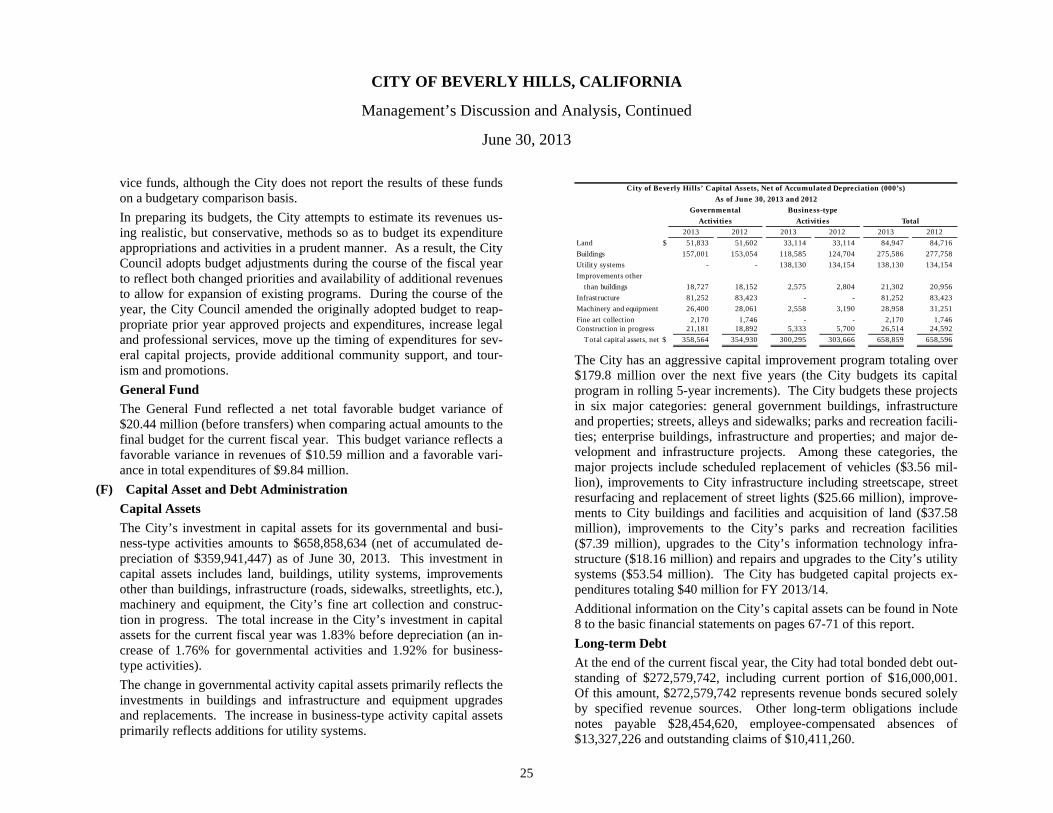
CITY OF BEVERLY HILLS, CALIFORNIA
Management’s Discussion and Analysis, Continued
June 30, 2013
25
vice funds, although the City does not report the results of these funds on a budgetary comparison basis. In preparing its budgets, the City attempts to estimate its revenues us-ing realistic, but conservative, methods so as to budget its expenditure appropriations and activities in a prudent manner. As a result, the City Council adopts budget adjustments during the course of the fiscal year to reflect both changed priorities and availability of additional revenues to allow for expansion of existing programs. During the course of the year, the City Council amended the originally adopted budget to reap-propriate prior year approved projects and expenditures, increase legal and professional services, move up the timing of expenditures for sev-eral capital projects, provide additional community support, and tour-ism and promotions. General Fund The General Fund reflected a net total favorable budget variance of $20.44 million (before transfers) when comparing actual amounts to the final budget for the current fiscal year. This budget variance reflects a favorable variance in revenues of $10.59 million and a favorable vari-ance in total expenditures of $9.84 million.
(F) Capital Asset and Debt Administration Capital Assets The City’s investment in capital assets for its governmental and busi-ness-type activities amounts to $658,858,634 (net of accumulated de-preciation of $359,941,447) as of June 30, 2013. This investment in capital assets includes land, buildings, utility systems, improvements other than buildings, infrastructure (roads, sidewalks, streetlights, etc.), machinery and equipment, the City’s fine art collection and construc-tion in progress. The total increase in the City’s investment in capital assets for the current fiscal year was 1.83% before depreciation (an in-crease of 1.76% for governmental activities and 1.92% for business-type activities). The change in governmental activity capital assets primarily reflects the investments in buildings and infrastructure and equipment upgrades and replacements. The increase in business-type activity capital assets primarily reflects additions for utility systems.
The City has an aggressive capital improvement program totaling over $179.8 million over the next five years (the City budgets its capital program in rolling 5-year increments). The City budgets these projects in six major categories: general government buildings, infrastructure and properties; streets, alleys and sidewalks; parks and recreation facili-ties; enterprise buildings, infrastructure and properties; and major de-velopment and infrastructure projects. Among these categories, the major projects include scheduled replacement of vehicles ($3.56 mil-lion), improvements to City infrastructure including streetscape, street resurfacing and replacement of street lights ($25.66 million), improve-ments to City buildings and facilities and acquisition of land ($37.58 million), improvements to the City’s parks and recreation facilities ($7.39 million), upgrades to the City’s information technology infra-structure ($18.16 million) and repairs and upgrades to the City’s utility systems ($53.54 million). The City has budgeted capital projects ex-penditures totaling $40 million for FY 2013/14. Additional information on the City’s capital assets can be found in Note 8 to the basic financial statements on pages 67-71 of this report. Long-term Debt At the end of the current fiscal year, the City had total bonded debt out-standing of $272,579,742, including current portion of $16,000,001. Of this amount, $272,579,742 represents revenue bonds secured solely by specified revenue sources. Other long-term obligations include notes payable $28,454,620, employee-compensated absences of $13,327,226 and outstanding claims of $10,411,260.
2013 2012 2013 2012 2013 2012Land $ 51,833 51,602 33,114 33,114 84,947 84,716 Buildings 157,001 153,054 118,585 124,704 275,586 277,758 Utility systems - - 138,130 134,154 138,130 134,154 Improvements other
than buildings 18,727 18,152 2,575 2,804 21,302 20,956 Infrastructure 81,252 83,423 - - 81,252 83,423 Machinery and equipment 26,400 28,061 2,558 3,190 28,958 31,251 Fine art collection 2,170 1,746 - - 2,170 1,746 Construction in progress 21,181 18,892 5,333 5,700 26,514 24,592
Total capital assets, net $ 358,564 354,930 300,295 303,666 658,859 658,596
City of Beverly Hills’ Capital Assets, Net of Accumulated Depreciation (000’s)
Governmental Business-typeActivities Activities Total
As of June 30, 2013 and 2012
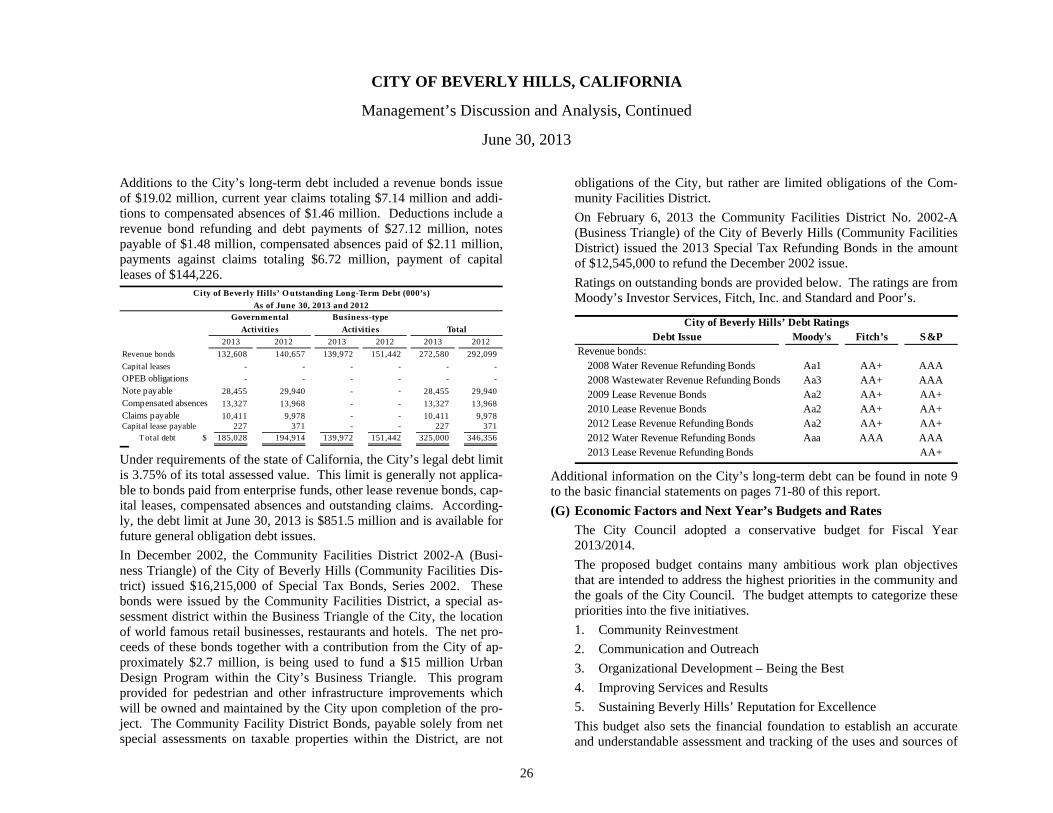
CITY OF BEVERLY HILLS, CALIFORNIA
Management’s Discussion and Analysis, Continued
June 30, 2013
26
Additions to the City’s long-term debt included a revenue bonds issue of $19.02 million, current year claims totaling $7.14 million and addi-tions to compensated absences of $1.46 million. Deductions include a revenue bond refunding and debt payments of $27.12 million, notes payable of $1.48 million, compensated absences paid of $2.11 million, payments against claims totaling $6.72 million, payment of capital leases of $144,226.
Under requirements of the state of California, the City’s legal debt limit is 3.75% of its total assessed value. This limit is generally not applica-ble to bonds paid from enterprise funds, other lease revenue bonds, cap-ital leases, compensated absences and outstanding claims. According-ly, the debt limit at June 30, 2013 is $851.5 million and is available for future general obligation debt issues. In December 2002, the Community Facilities District 2002-A (Busi-ness Triangle) of the City of Beverly Hills (Community Facilities Dis-trict) issued $16,215,000 of Special Tax Bonds, Series 2002. These bonds were issued by the Community Facilities District, a special as-sessment district within the Business Triangle of the City, the location of world famous retail businesses, restaurants and hotels. The net pro-ceeds of these bonds together with a contribution from the City of ap-proximately $2.7 million, is being used to fund a $15 million Urban Design Program within the City’s Business Triangle. This program provided for pedestrian and other infrastructure improvements which will be owned and maintained by the City upon completion of the pro-ject. The Community Facility District Bonds, payable solely from net special assessments on taxable properties within the District, are not
obligations of the City, but rather are limited obligations of the Com-munity Facilities District. On February 6, 2013 the Community Facilities District No. 2002-A (Business Triangle) of the City of Beverly Hills (Community Facilities District) issued the 2013 Special Tax Refunding Bonds in the amount of $12,545,000 to refund the December 2002 issue. Ratings on outstanding bonds are provided below. The ratings are from Moody’s Investor Services, Fitch, Inc. and Standard and Poor’s.
Additional information on the City’s long-term debt can be found in note 9 to the basic financial statements on pages 71-80 of this report. (G) Economic Factors and Next Year’s Budgets and Rates
The City Council adopted a conservative budget for Fiscal Year 2013/2014. The proposed budget contains many ambitious work plan objectives that are intended to address the highest priorities in the community and the goals of the City Council. The budget attempts to categorize these priorities into the five initiatives. 1. Community Reinvestment 2. Communication and Outreach 3. Organizational Development – Being the Best 4. Improving Services and Results 5. Sustaining Beverly Hills’ Reputation for Excellence This budget also sets the financial foundation to establish an accurate and understandable assessment and tracking of the uses and sources of
2013 2012 2013 2012 2013 2012Revenue bonds 132,608 140,657 139,972 151,442 272,580 292,099 Capital leases - - - - - - OPEB obligations - - - - - - Note payable 28,455 29,940 - - 28,455 29,940 Compensated absences 13,327 13,968 - - 13,327 13,968 Claims payable 10,411 9,978 - - 10,411 9,978 Capital lease payable 227 371 - - 227 371
Total debt $ 185,028 194,914 139,972 151,442 325,000 346,356
City of Beverly Hills’ O utstanding Long-Term Debt (000’s)
Governmental Business-typeActivities Activities Total
As of June 30, 2013 and 2012
Moody's Fitch’s S&PRevenue bonds:
2008 Water Revenue Refunding Bonds Aa1 AA+ AAA2008 Wastewater Revenue Refunding Bonds Aa3 AA+ AAA2009 Lease Revenue Bonds Aa2 AA+ AA+2010 Lease Revenue Bonds Aa2 AA+ AA+2012 Lease Revenue Refunding Bonds Aa2 AA+ AA+2012 Water Revenue Refunding Bonds Aaa AAA AAA2013 Lease Revenue Refunding Bonds AA+
Debt IssueCity of Beverly Hills’ Debt Ratings
CITY OF BEVERLY HILLS, CALIFORNIA
Management’s Discussion and Analysis, Continued
June 30, 2013
27
all funds. The 2013/2014 budget presents a number of opportunities and challenges to improve overall service to the community while deal-ing with an economic downturn. By any standard this is a very aggres-sive program of work that will challenge the capacity of staff and the City Council to accomplish under the revenue assumptions. The proposed General Fund budget for Fiscal Year 2013/2014 includes the following assumptions: Realization of slower growth in revenues as a result of current
economic conditions. Decreases in operating expenditures consistent with the revenue
forecasts. Maintenance of service levels and programs to the extent possible
and minimal reductions in service levels where appropriate.
(H) Requests for Information This financial report is designed to provide a general overview of the City’s finances for readers of the financial statements. Questions con-cerning any of the information provided in this report or requests for additional financial information should be addressed to Don Rhoades, Director of Administrative Services/Chief Financial Officer, City of Beverly Hills, 455 N. Rexford Drive, Room 350, Beverly Hills, Cali-fornia 90210-4817. Additional information, including the prior year’s CAFR and prior and current year budgets are available on the City’s web site at www.beverlyhills.org.

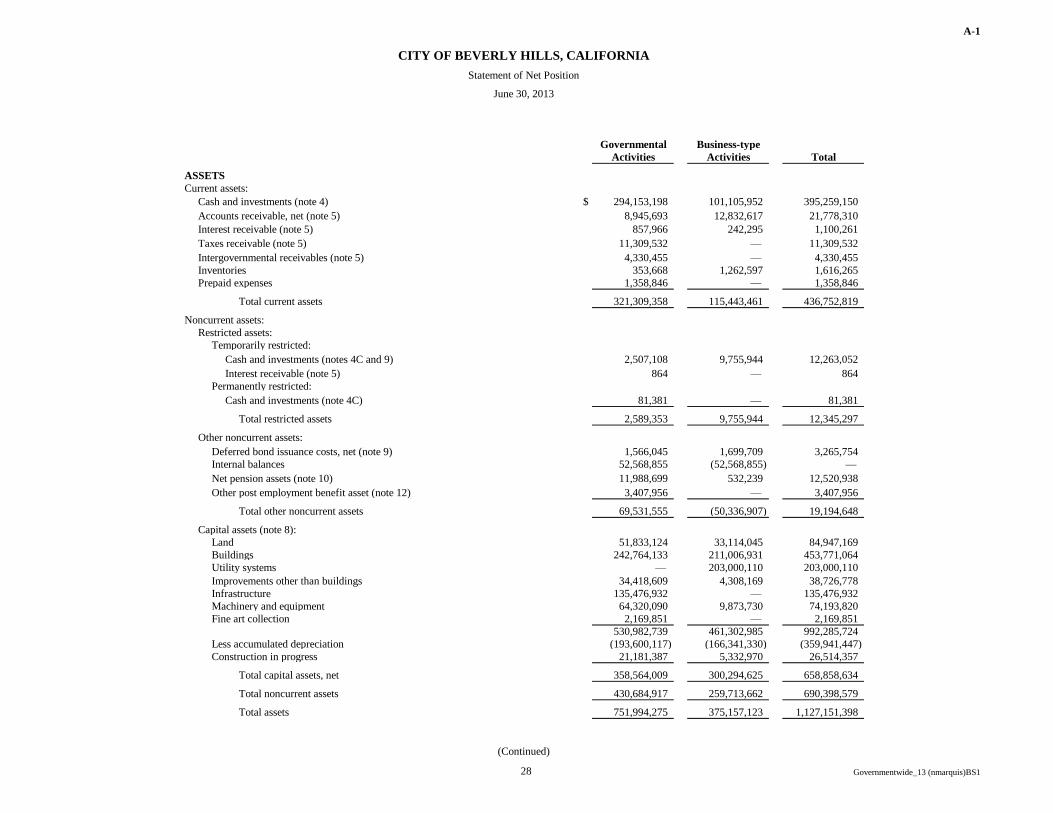
A-1
Governmental Business-type
Activities Activities Total
ASSETS
Current assets:
Cash and investments (note 4) $ 294,153,198 101,105,952 395,259,150
Accounts receivable, net (note 5) 8,945,693 12,832,617 21,778,310
Interest receivable (note 5) 857,966 242,295 1,100,261
Taxes receivable (note 5) 11,309,532 — 11,309,532
Intergovernmental receivables (note 5) 4,330,455 — 4,330,455
Inventories 353,668 1,262,597 1,616,265
Prepaid expenses 1,358,846 — 1,358,846
Total current assets 321,309,358 115,443,461 436,752,819
Noncurrent assets:
Restricted assets:
Temporarily restricted:
Cash and investments (notes 4C and 9) 2,507,108 9,755,944 12,263,052
Interest receivable (note 5) 864 — 864
Permanently restricted:
Cash and investments (note 4C) 81,381 — 81,381
Total restricted assets 2,589,353 9,755,944 12,345,297
Other noncurrent assets:
Deferred bond issuance costs, net (note 9) 1,566,045 1,699,709 3,265,754
Internal balances 52,568,855 (52,568,855) —
Net pension assets (note 10) 11,988,699 532,239 12,520,938
Other post employment benefit asset (note 12) 3,407,956 — 3,407,956
Total other noncurrent assets 69,531,555 (50,336,907) 19,194,648
Capital assets (note 8):
Land 51,833,124 33,114,045 84,947,169
Buildings 242,764,133 211,006,931 453,771,064
Utility systems — 203,000,110 203,000,110
Improvements other than buildings 34,418,609 4,308,169 38,726,778
Infrastructure 135,476,932 — 135,476,932
Machinery and equipment 64,320,090 9,873,730 74,193,820
Fine art collection 2,169,851 — 2,169,851
530,982,739 461,302,985 992,285,724
Less accumulated depreciation (193,600,117) (166,341,330) (359,941,447)
Construction in progress 21,181,387 5,332,970 26,514,357
Total capital assets, net 358,564,009 300,294,625 658,858,634
Total noncurrent assets 430,684,917 259,713,662 690,398,579
Total assets 751,994,275 375,157,123 1,127,151,398
(Continued)
CITY OF BEVERLY HILLS, CALIFORNIA
Statement of Net Position
June 30, 2013
28 Governmentwide_13 (nmarquis)BS1
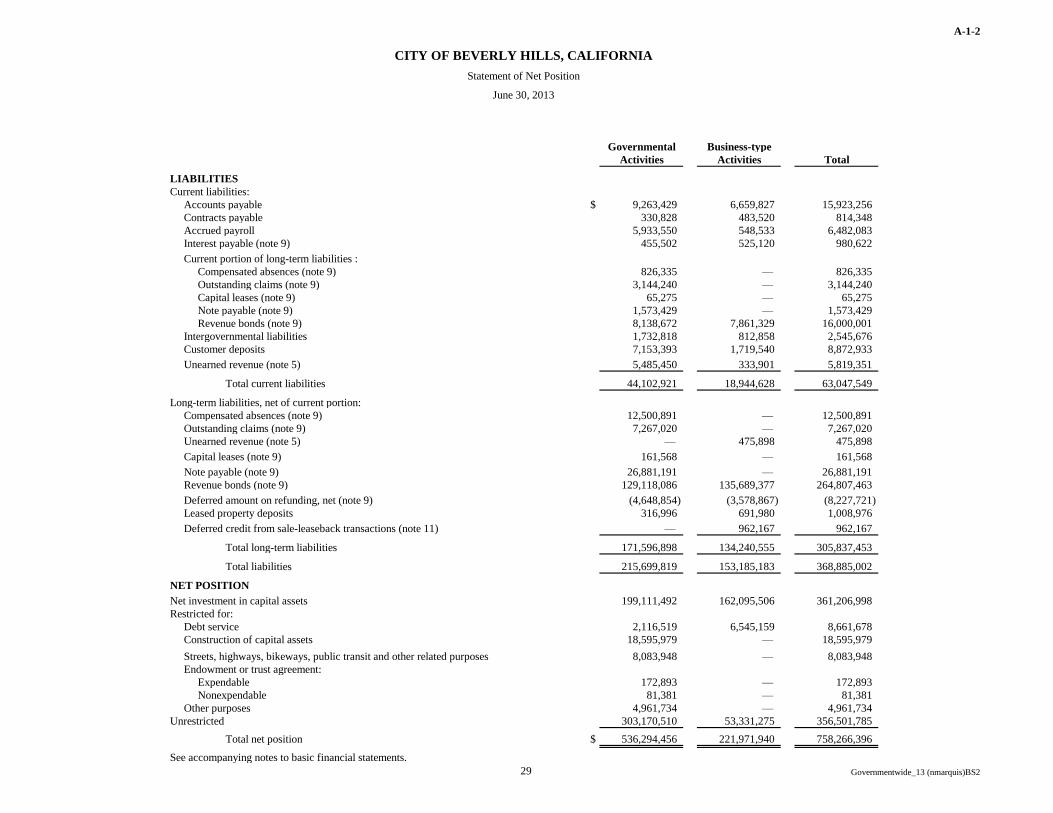
A-1-2
Governmental Business-type
Activities Activities Total
LIABILITIES
Current liabilities:
Accounts payable $ 9,263,429 6,659,827 15,923,256
Contracts payable 330,828 483,520 814,348
Accrued payroll 5,933,550 548,533 6,482,083
Interest payable (note 9) 455,502 525,120 980,622
Current portion of long-term liabilities :
Compensated absences (note 9) 826,335 — 826,335
Outstanding claims (note 9) 3,144,240 — 3,144,240
Capital leases (note 9) 65,275 — 65,275
Note payable (note 9) 1,573,429 — 1,573,429
Revenue bonds (note 9) 8,138,672 7,861,329 16,000,001
Intergovernmental liabilities 1,732,818 812,858 2,545,676
Customer deposits 7,153,393 1,719,540 8,872,933
Unearned revenue (note 5) 5,485,450 333,901 5,819,351
Total current liabilities 44,102,921 18,944,628 63,047,549
Long-term liabilities, net of current portion:
Compensated absences (note 9) 12,500,891 — 12,500,891
Outstanding claims (note 9) 7,267,020 — 7,267,020
Unearned revenue (note 5) — 475,898 475,898
Capital leases (note 9) 161,568 — 161,568
Note payable (note 9) 26,881,191 — 26,881,191
Revenue bonds (note 9) 129,118,086 135,689,377 264,807,463
Deferred amount on refunding, net (note 9) (4,648,854) (3,578,867) (8,227,721)
Leased property deposits 316,996 691,980 1,008,976
Deferred credit from sale-leaseback transactions (note 11) — 962,167 962,167
Total long-term liabilities 171,596,898 134,240,555 305,837,453
Total liabilities 215,699,819 153,185,183 368,885,002
NET POSITION
Net investment in capital assets 199,111,492 162,095,506 361,206,998
Restricted for:
Debt service 2,116,519 6,545,159 8,661,678
Construction of capital assets 18,595,979 — 18,595,979
Streets, highways, bikeways, public transit and other related purposes 8,083,948 — 8,083,948
Endowment or trust agreement:
Expendable 172,893 — 172,893
Nonexpendable 81,381 — 81,381
Other purposes 4,961,734 — 4,961,734
Unrestricted 303,170,510 53,331,275 356,501,785
Total net position $ 536,294,456 221,971,940 758,266,396
See accompanying notes to basic financial statements.
CITY OF BEVERLY HILLS, CALIFORNIA
Statement of Net Position
June 30, 2013
29 Governmentwide_13 (nmarquis)BS2
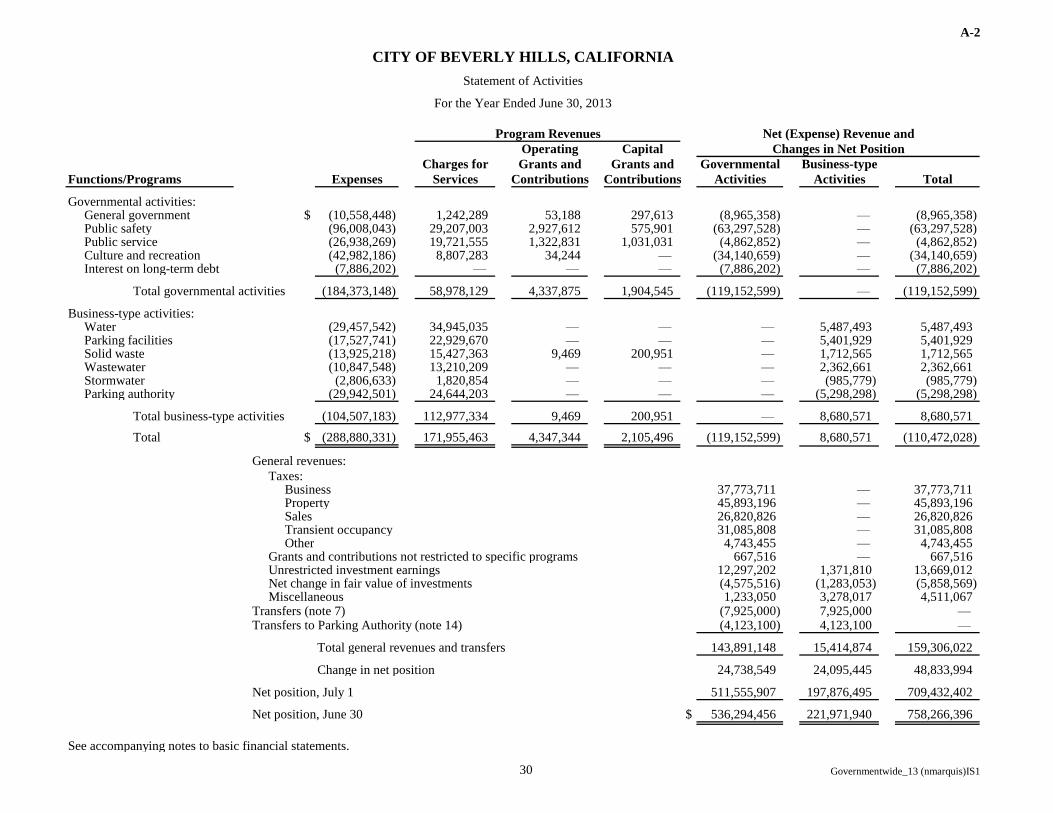
A-2
Operating Capital
Charges for Grants and Grants and Governmental Business-type
Functions/Programs Expenses Services Contributions Contributions Activities Activities Total
Governmental activities:General government $ (10,558,448) 1,242,289 53,188 297,613 (8,965,358) — (8,965,358)Public safety (96,008,043) 29,207,003 2,927,612 575,901 (63,297,528) — (63,297,528)Public service (26,938,269) 19,721,555 1,322,831 1,031,031 (4,862,852) — (4,862,852)Culture and recreation (42,982,186) 8,807,283 34,244 — (34,140,659) — (34,140,659)Interest on long-term debt (7,886,202) — — — (7,886,202) — (7,886,202)
Total governmental activities (184,373,148) 58,978,129 4,337,875 1,904,545 (119,152,599) — (119,152,599)
Business-type activities:Water (29,457,542) 34,945,035 — — — 5,487,493 5,487,493Parking facilities (17,527,741) 22,929,670 — — — 5,401,929 5,401,929Solid waste (13,925,218) 15,427,363 9,469 200,951 — 1,712,565 1,712,565Wastewater (10,847,548) 13,210,209 — — — 2,362,661 2,362,661Stormwater (2,806,633) 1,820,854 — — — (985,779) (985,779)Parking authority (29,942,501) 24,644,203 — — — (5,298,298) (5,298,298)
Total business-type activities (104,507,183) 112,977,334 9,469 200,951 — 8,680,571 8,680,571
Total $ (288,880,331) 171,955,463 4,347,344 2,105,496 (119,152,599) 8,680,571 (110,472,028)
General revenues:
Taxes:Business 37,773,711 — 37,773,711Property 45,893,196 — 45,893,196Sales 26,820,826 — 26,820,826Transient occupancy 31,085,808 — 31,085,808Other 4,743,455 — 4,743,455
Grants and contributions not restricted to specific programs 667,516 — 667,516Unrestricted investment earnings 12,297,202 1,371,810 13,669,012Net change in fair value of investments (4,575,516) (1,283,053) (5,858,569)Miscellaneous 1,233,050 3,278,017 4,511,067
Transfers (note 7) (7,925,000) 7,925,000 — Transfers to Parking Authority (note 14) (4,123,100) 4,123,100 —
Total general revenues and transfers 143,891,148 15,414,874 159,306,022
Change in net position 24,738,549 24,095,445 48,833,994
Net position, July 1 511,555,907 197,876,495 709,432,402
Net position, June 30 $ 536,294,456 221,971,940 758,266,396
See accompanying notes to basic financial statements.
Changes in Net Position
Net (Expense) Revenue and
CITY OF BEVERLY HILLS, CALIFORNIA
Statement of Activities
For the Year Ended June 30, 2013
Program Revenues
30 Governmentwide_13 (nmarquis)IS1
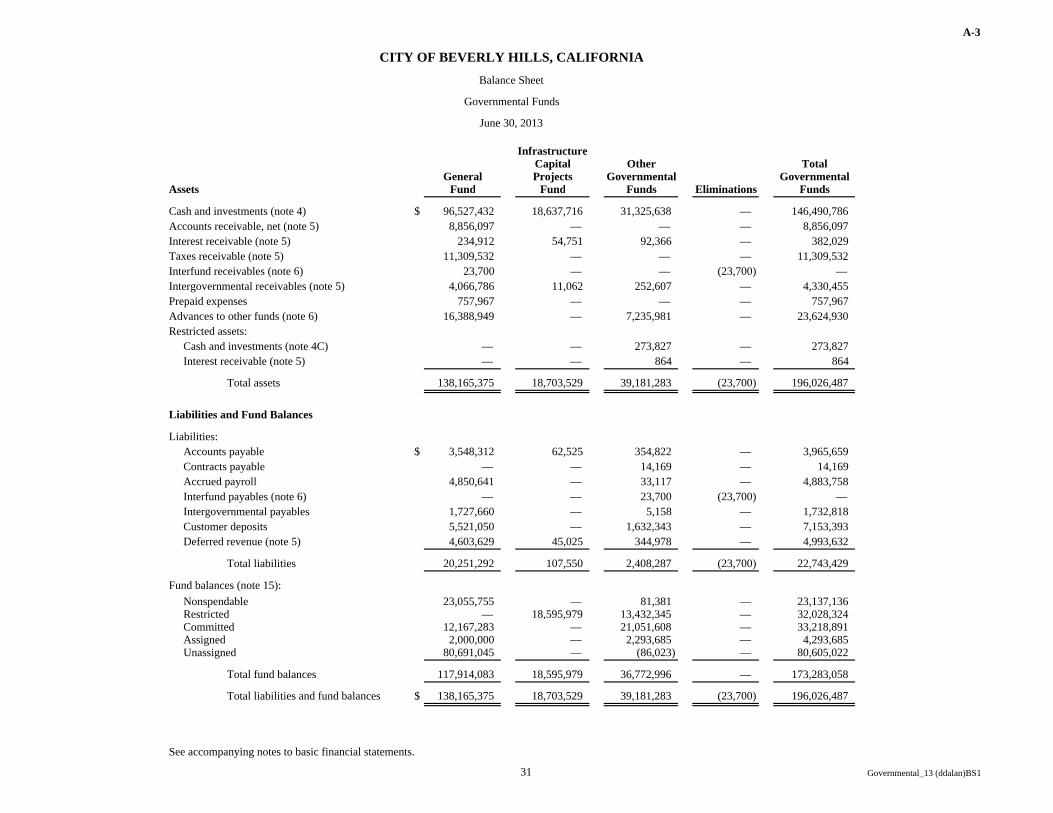
A-3
InfrastructureCapital Other Total
General Projects Governmental GovernmentalFund Fund Funds Eliminations Funds
$ 96,527,432 18,637,716 31,325,638 — 146,490,7868,856,097 — — — 8,856,097
234,912 54,751 92,366 — 382,02911,309,532 — — — 11,309,532
23,700 — — (23,700) — 4,066,786 11,062 252,607 — 4,330,455
757,967 — — — 757,96716,388,949 — 7,235,981 — 23,624,930
— — 273,827 — 273,827— — 864 — 864
138,165,375 18,703,529 39,181,283 (23,700) 196,026,487
$ 3,548,312 62,525 354,822 — 3,965,659— — 14,169 — 14,169
4,850,641 — 33,117 — 4,883,758— — 23,700 (23,700) —
1,727,660 — 5,158 — 1,732,8185,521,050 — 1,632,343 — 7,153,3934,603,629 45,025 344,978 — 4,993,632
20,251,292 107,550 2,408,287 (23,700) 22,743,429
Nonspendable 23,055,755 — 81,381 — 23,137,136Restricted — 18,595,979 13,432,345 — 32,028,324Committed 12,167,283 — 21,051,608 — 33,218,891Assigned 2,000,000 — 2,293,685 — 4,293,685Unassigned 80,691,045 — (86,023) — 80,605,022
117,914,083 18,595,979 36,772,996 — 173,283,058
$ 138,165,375 18,703,529 39,181,283 (23,700) 196,026,487
Restricted assets: Cash and investments (note 4C) Interest receivable (note 5)
Taxes receivable (note 5) Interfund receivables (note 6) Intergovernmental receivables (note 5) Prepaid expenses Advances to other funds (note 6)
CITY OF BEVERLY HILLS, CALIFORNIABalance Sheet
Governmental Funds
June 30, 2013
Cash and investments (note 4)
Total assets
Assets
Total liabilities
Liabilities:
Fund balances (note 15):
Interfund payables (note 6) Intergovernmental payables Customer deposits Deferred revenue (note 5)
Accounts payable Contracts payable Accrued payroll
Liabilities and Fund Balances
Accounts receivable, net (note 5) Interest receivable (note 5)
See accompanying notes to basic financial statements.
Total fund balances
Total liabilities and fund balances
31 Governmental_13 (ddalan)BS1
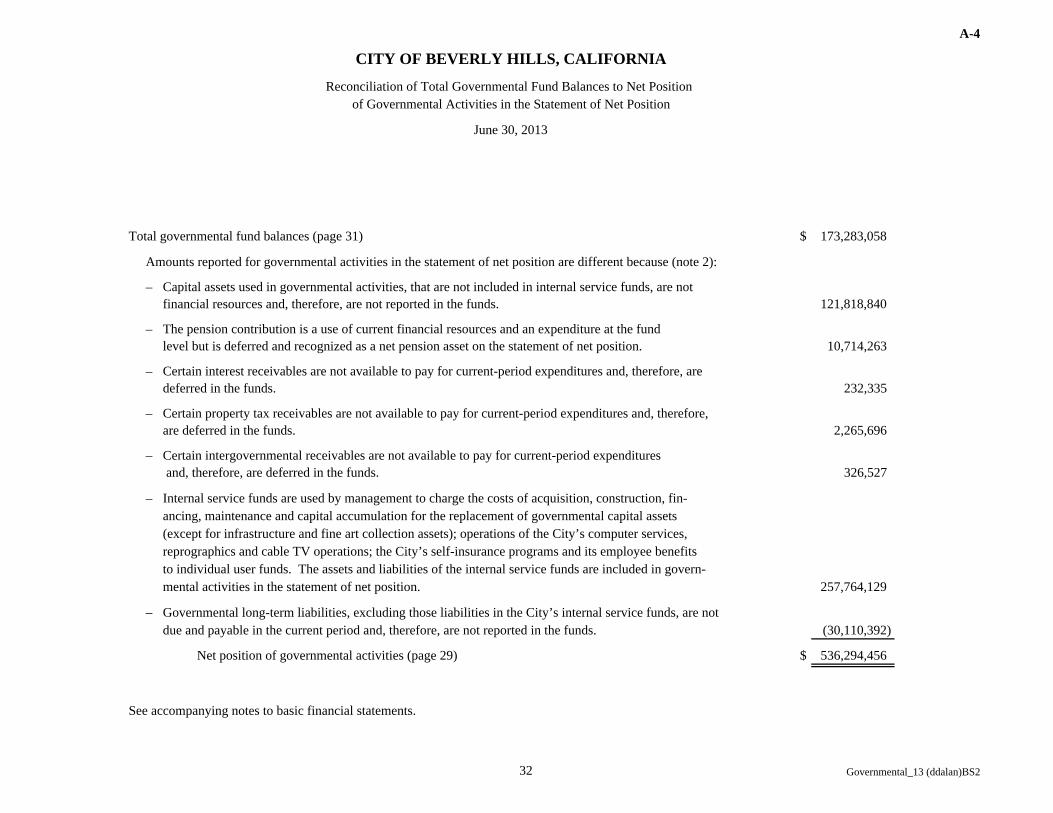
A-4
$ 173,283,058
–121,818,840
– The pension contribution is a use of current financial resources and an expenditure at the fundlevel but is deferred and recognized as a net pension asset on the statement of net position. 10,714,263
–232,335
–2,265,696
–326,527
–
257,764,129
–(30,110,392)
Net position of governmental activities (page 29) $ 536,294,456
to individual user funds. The assets and liabilities of the internal service funds are included in govern- reprographics and cable TV operations; the City’s self-insurance programs and its employee benefits
Certain intergovernmental receivables are not available to pay for current-period expenditures and, therefore, are deferred in the funds.
Certain property tax receivables are not available to pay for current-period expenditures and, therefore,
Internal service funds are used by management to charge the costs of acquisition, construction, fin- ancing, maintenance and capital accumulation for the replacement of governmental capital assets (except for infrastructure and fine art collection assets); operations of the City’s computer services,
CITY OF BEVERLY HILLS, CALIFORNIA
Reconciliation of Total Governmental Fund Balances to Net Position of Governmental Activities in the Statement of Net Position
June 30, 2013
See accompanying notes to basic financial statements.
Amounts reported for governmental activities in the statement of net position are different because (note 2):
Total governmental fund balances (page 31)
Governmental long-term liabilities, excluding those liabilities in the City’s internal service funds, are not due and payable in the current period and, therefore, are not reported in the funds.
Certain interest receivables are not available to pay for current-period expenditures and, therefore, are deferred in the funds.
financial resources and, therefore, are not reported in the funds. Capital assets used in governmental activities, that are not included in internal service funds, are not
mental activities in the statement of net position.
are deferred in the funds.
32 Governmental_13 (ddalan)BS2
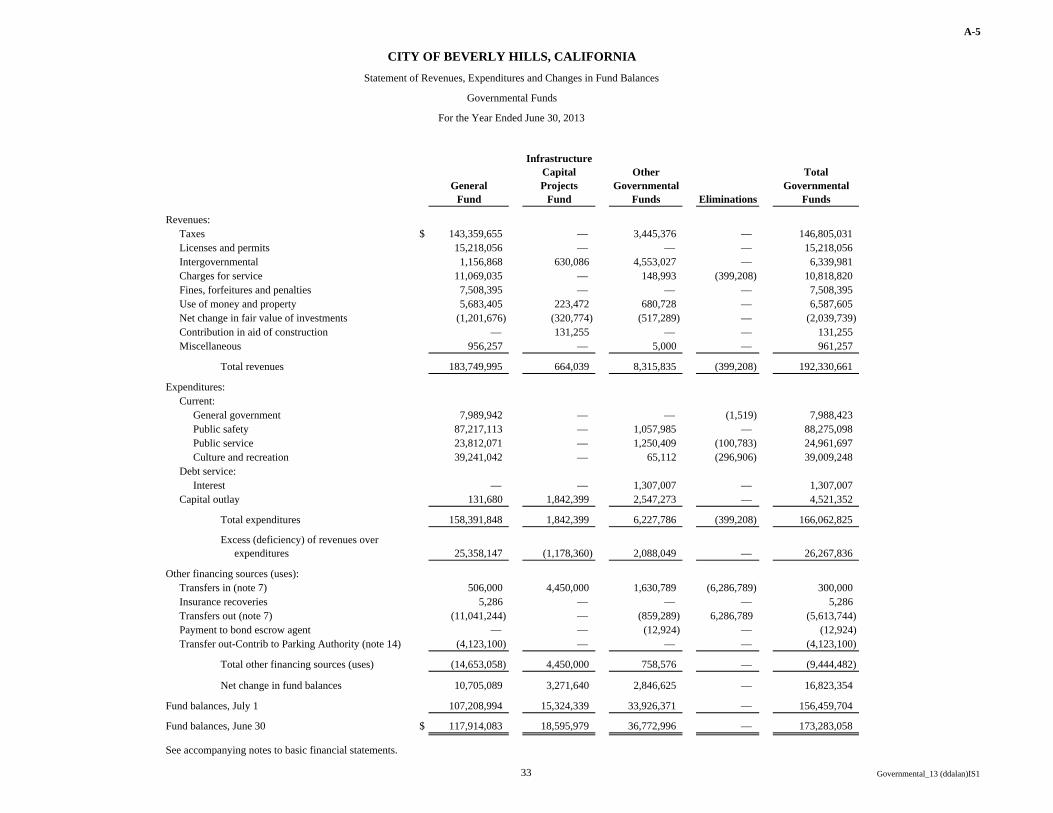
A-5
InfrastructureCapital Other Total
General Projects Governmental GovernmentalFund Fund Funds Eliminations Funds
$ 143,359,655 — 3,445,376 — 146,805,03115,218,056 — — — 15,218,056
1,156,868 630,086 4,553,027 — 6,339,98111,069,035 — 148,993 (399,208) 10,818,820
7,508,395 — — — 7,508,3955,683,405 223,472 680,728 — 6,587,605
(1,201,676) (320,774) (517,289) — (2,039,739)Contribution in aid of construction — 131,255 — — 131,255
956,257 — 5,000 — 961,257
183,749,995 664,039 8,315,835 (399,208) 192,330,661
7,989,942 — — (1,519) 7,988,42387,217,113 — 1,057,985 — 88,275,09823,812,071 — 1,250,409 (100,783) 24,961,69739,241,042 — 65,112 (296,906) 39,009,248
— — 1,307,007 — 1,307,007131,680 1,842,399 2,547,273 — 4,521,352
158,391,848 1,842,399 6,227,786 (399,208) 166,062,825
25,358,147 (1,178,360) 2,088,049 — 26,267,836
506,000 4,450,000 1,630,789 (6,286,789) 300,000Insurance recoveries 5,286 — — — 5,286
(11,041,244) — (859,289) 6,286,789 (5,613,744)Payment to bond escrow agent — — (12,924) — (12,924)Transfer out-Contrib to Parking Authority (note 14) (4,123,100) — — — (4,123,100)
(14,653,058) 4,450,000 758,576 — (9,444,482)
Net change in fund balances 10,705,089 3,271,640 2,846,625 — 16,823,354
107,208,994 15,324,339 33,926,371 — 156,459,704
$ 117,914,083 18,595,979 36,772,996 — 173,283,058
TaxesLicenses and permits Intergovernmental
CITY OF BEVERLY HILLS, CALIFORNIAStatement of Revenues, Expenditures and Changes in Fund Balances
Governmental Funds
For the Year Ended June 30, 2013
Revenues:
Culture and recreation
Charges for service Fines, forfeitures and penalties Use of money and property Net change in fair value of investments
Miscellaneous
Total revenues
Expenditures: Current:
General government Public safety Public service
See accompanying notes to basic financial statements.
Fund balances, July 1
Fund balances, June 30
Debt service: Interest
Capital outlay
Transfers in (note 7)
Transfers out (note 7)
Total other financing sources (uses)
Total expenditures
Excess (deficiency) of revenues over expenditures
Other financing sources (uses):
33 Governmental_13 (ddalan)IS1

A-6
$ 16,823,354
–•
2,265,696•
(2,753,731)•
326,527
–•
232,335•
(107,907)
–
9,584,763
– The pension contribution, is a use of current financial resources and an expenditure atthe fund level but is deferred and recognized as a net pension asset on the statement of net position (378,723)
–
(1,304,725)
–
50,960
Change in net position of governmental activities (page 30) $ 24,738,549
CITY OF BEVERLY HILLS, CALIFORNIA
Changes in Fund Balances of Governmental Funds to the Statement of Activities
Net change in fund balances – total governmental funds (page 33)
Reconciliation of the Statement of Revenues, Expenditures and
For the Year Ended June 30, 2013
therefore, are deferred in the funds.
Certain intergovernmental revenues in the statement of activities that do not provide current financial resources are not reported as revenues in the funds.
relate to prior years are not reported as revenues in the statement of activities.
Interest revenues: Certain interest receivables are not available to pay for current-period expenditures and,
Property tax revenues that become available and are recognized in the current year that
Amounts reported for governmental activities in the statement of activities are different because (note 2):
Tax revenues: Certain property tax revenues in the statement of activities that do not provide current financial resources are not reported as revenues in the funds.
mental funds, while the repayment of the principal of long-term debt consumes the current
Interest revenues that become available and are recognized in the current year that relate to prior years are not reported as revenues in the statement of activities
Internal service funds are used by management to charge the costs of certain services to individual funds. The net revenue (expense) of certain activities of internal service funds is reported as governmental activities.
Costs for infrastructure and fine art collection assets are reported as capital outlay expend- itures in the fund financial statements. However, in the statement of activities the cost of those assets is allocated over their estimated useful lives and reported as depreciation expense. This is the amount by which capital outlay expenditures exceed depreciation expense in the current period.
The issuance of long-term debt (e.g., bonds) provides current financial resources to govern-
financial resources of governmental funds. Neither transaction, however, has any effect on
See accompanying notes to basic financial statements.
on net position. Also, governmental funds report the effect of issuance costs, premiums, discounts, and similar items when debt is first issued, whereas these amounts are deferred and amortized in the statement of activities. This amount is the net effect of these differences in the treatment of certain long-term debt and related items.
34 Governmental_13 (ddalan)IS2
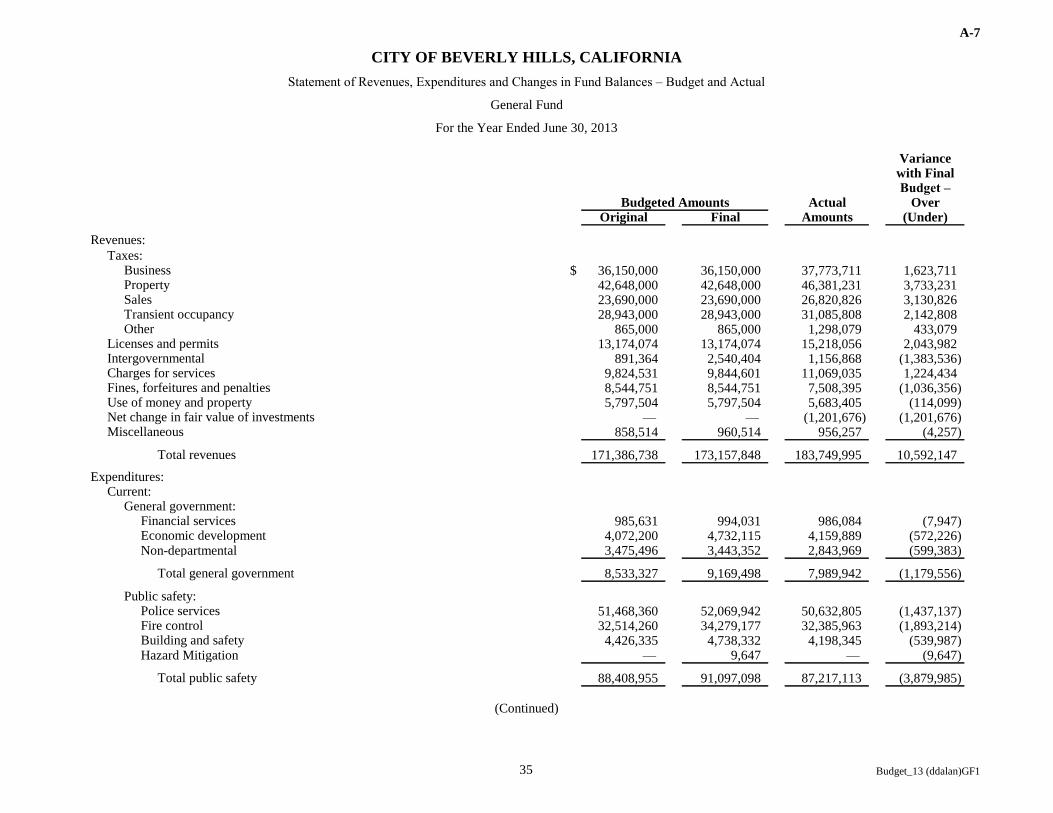
A-7
Variancewith FinalBudget –
Actual OverOriginal Final Amounts (Under)
$ 36,150,000 36,150,000 37,773,711 1,623,71142,648,000 42,648,000 46,381,231 3,733,23123,690,000 23,690,000 26,820,826 3,130,82628,943,000 28,943,000 31,085,808 2,142,808
865,000 865,000 1,298,079 433,07913,174,074 13,174,074 15,218,056 2,043,982
891,364 2,540,404 1,156,868 (1,383,536)9,824,531 9,844,601 11,069,035 1,224,4348,544,751 8,544,751 7,508,395 (1,036,356)5,797,504 5,797,504 5,683,405 (114,099)
— — (1,201,676) (1,201,676)858,514 960,514 956,257 (4,257)
171,386,738 173,157,848 183,749,995 10,592,147
985,631 994,031 986,084 (7,947)4,072,200 4,732,115 4,159,889 (572,226)
Non-departmental 3,475,496 3,443,352 2,843,969 (599,383)
8,533,327 9,169,498 7,989,942 (1,179,556)
51,468,360 52,069,942 50,632,805 (1,437,137)32,514,260 34,279,177 32,385,963 (1,893,214)
4,426,335 4,738,332 4,198,345 (539,987)Hazard Mitigation — 9,647 — (9,647)
88,408,955 91,097,098 87,217,113 (3,879,985)
Police services Fire control Building and safety
Total public safety
Financial services
Total general government
Public safety:
Economic development
Current: General government:
Total revenues
Expenditures:
Intergovernmental Charges for services Fines, forfeitures and penalties Use of money and property
Other Licenses and permits
(Continued)
CITY OF BEVERLY HILLS, CALIFORNIA
Statement of Revenues, Expenditures and Changes in Fund Balances – Budget and Actual
For the Year Ended June 30, 2013
Budgeted Amounts
General Fund
Net change in fair value of investments Miscellaneous
Revenues:
Taxes: Business Property Sales Transient occupancy
35 Budget_13 (ddalan)GF1
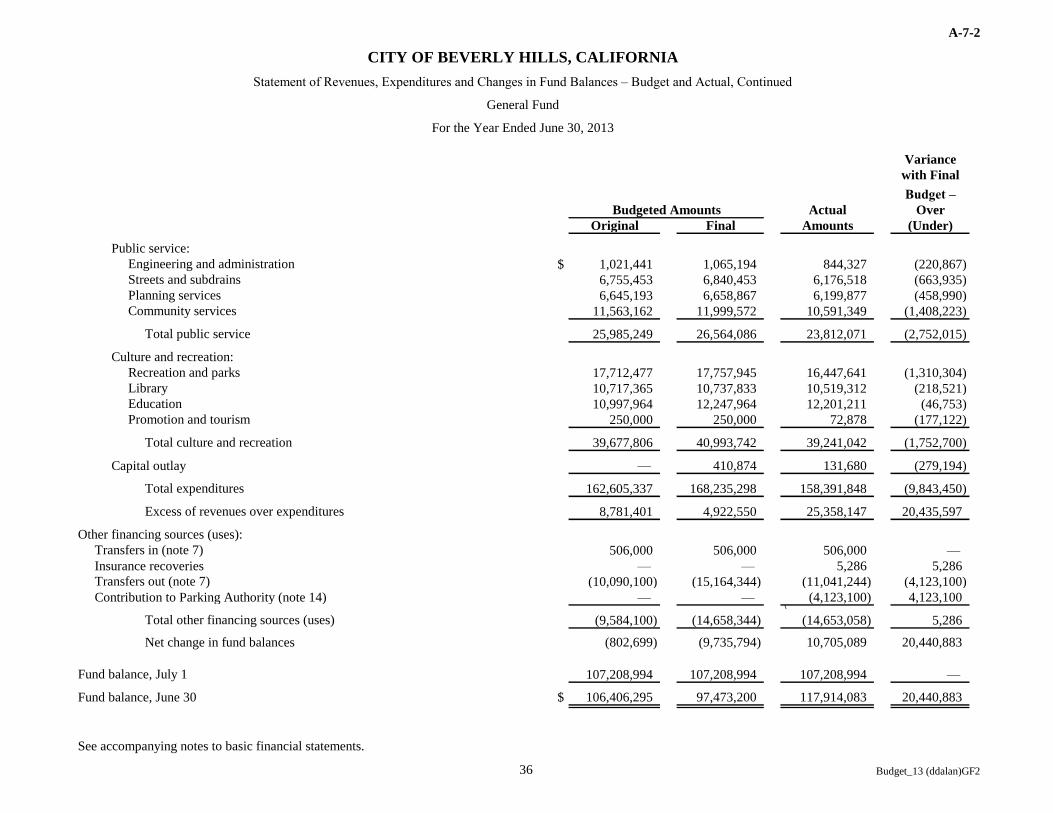
A-7-2
Variance
with Final
Budget –
Actual Over
Original Final Amounts (Under)
$ 1,021,441 1,065,194 844,327 (220,867)
6,755,453 6,840,453 6,176,518 (663,935)
6,645,193 6,658,867 6,199,877 (458,990)
11,563,162 11,999,572 10,591,349 (1,408,223)
25,985,249 26,564,086 23,812,071 (2,752,015)
17,712,477 17,757,945 16,447,641 (1,310,304)
10,717,365 10,737,833 10,519,312 (218,521)
10,997,964 12,247,964 12,201,211 (46,753)
250,000 250,000 72,878 (177,122)
39,677,806 40,993,742 39,241,042 (1,752,700)
Capital outlay — 410,874 131,680 (279,194)
162,605,337 168,235,298 158,391,848 (9,843,450)
8,781,401 4,922,550 25,358,147 20,435,597
506,000 506,000 506,000 —
Insurance recoveries — — 5,286 5,286
(10,090,100) (15,164,344) (11,041,244) (4,123,100)
Contribution to Parking Authority (note 14) — — (4,123,100) 4,123,100\
(9,584,100) (14,658,344) (14,653,058) 5,286
Net change in fund balances (802,699) (9,735,794) 10,705,089 20,440,883
107,208,994 107,208,994 107,208,994 —
$ 106,406,295 97,473,200 117,914,083 20,440,883Fund balance, June 30
See accompanying notes to basic financial statements.
Transfers in (note 7)
Transfers out (note 7)
Total other financing sources (uses)
Fund balance, July 1
Total culture and recreation
Total expenditures
Excess of revenues over expenditures
Other financing sources (uses):
Recreation and parks
Library
Education
Promotion and tourism
Total public service
Culture and recreation:
Public service:
Engineering and administration
Streets and subdrains
Planning services
Community services
Budgeted Amounts
CITY OF BEVERLY HILLS, CALIFORNIA
Statement of Revenues, Expenditures and Changes in Fund Balances – Budget and Actual, Continued
General Fund
For the Year Ended June 30, 2013
36 Budget_13 (ddalan)GF2
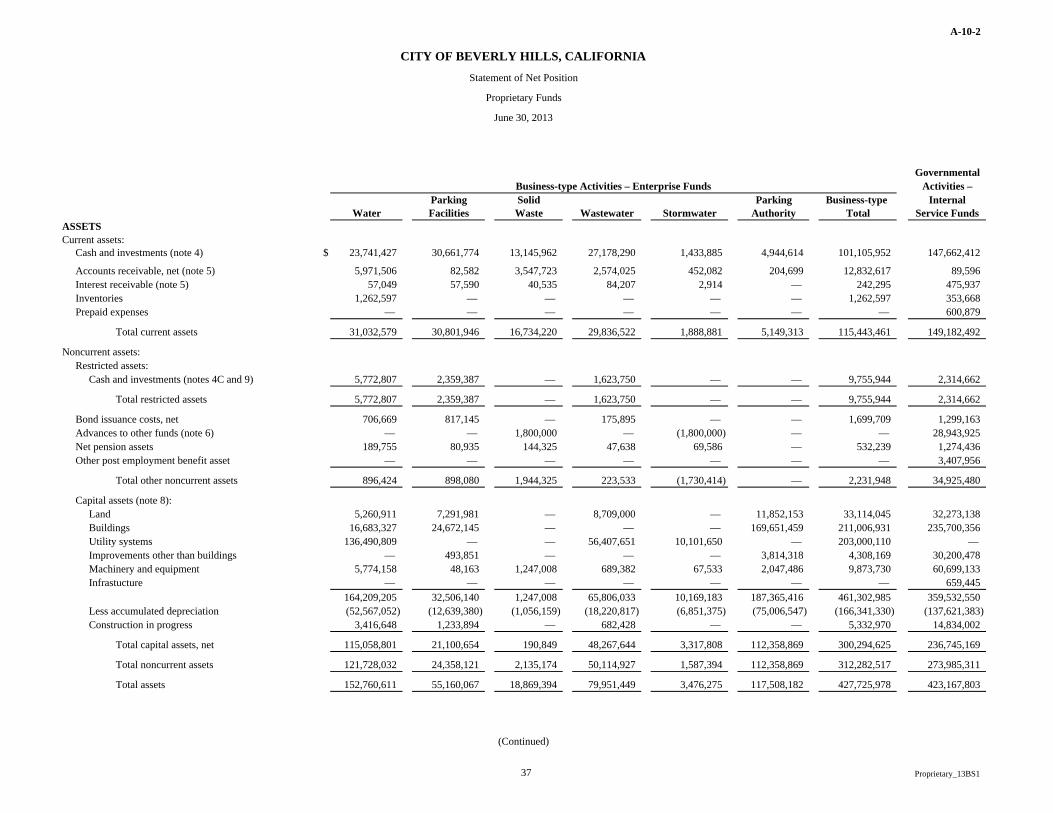
A-10-2
Governmental
Activities –Parking Solid Parking Business-type Internal
Water Facilities Waste Wastewater Stormwater Authority Total Service FundsASSETSCurrent assets:
Cash and investments (note 4) $ 23,741,427 30,661,774 13,145,962 27,178,290 1,433,885 4,944,614 101,105,952 147,662,412
Accounts receivable, net (note 5) 5,971,506 82,582 3,547,723 2,574,025 452,082 204,699 12,832,617 89,596Interest receivable (note 5) 57,049 57,590 40,535 84,207 2,914 — 242,295 475,937Inventories 1,262,597 — — — — — 1,262,597 353,668Prepaid expenses — — — — — — — 600,879
Total current assets 31,032,579 30,801,946 16,734,220 29,836,522 1,888,881 5,149,313 115,443,461 149,182,492
Noncurrent assets:Restricted assets:
Cash and investments (notes 4C and 9) 5,772,807 2,359,387 — 1,623,750 — — 9,755,944 2,314,662
Total restricted assets 5,772,807 2,359,387 — 1,623,750 — — 9,755,944 2,314,662
Bond issuance costs, net 706,669 817,145 — 175,895 — — 1,699,709 1,299,163Advances to other funds (note 6) — — 1,800,000 — (1,800,000) — — 28,943,925Net pension assets 189,755 80,935 144,325 47,638 69,586 — 532,239 1,274,436Other post employment benefit asset — — — — — — — 3,407,956
Total other noncurrent assets 896,424 898,080 1,944,325 223,533 (1,730,414) — 2,231,948 34,925,480
Capital assets (note 8):Land 5,260,911 7,291,981 — 8,709,000 — 11,852,153 33,114,045 32,273,138Buildings 16,683,327 24,672,145 — — — 169,651,459 211,006,931 235,700,356Utility systems 136,490,809 — — 56,407,651 10,101,650 — 203,000,110 — Improvements other than buildings — 493,851 — — — 3,814,318 4,308,169 30,200,478Machinery and equipment 5,774,158 48,163 1,247,008 689,382 67,533 2,047,486 9,873,730 60,699,133Infrastucture — — — — — — — 659,445
164,209,205 32,506,140 1,247,008 65,806,033 10,169,183 187,365,416 461,302,985 359,532,550Less accumulated depreciation (52,567,052) (12,639,380) (1,056,159) (18,220,817) (6,851,375) (75,006,547) (166,341,330) (137,621,383)Construction in progress 3,416,648 1,233,894 — 682,428 — — 5,332,970 14,834,002
Total capital assets, net 115,058,801 21,100,654 190,849 48,267,644 3,317,808 112,358,869 300,294,625 236,745,169
Total noncurrent assets 121,728,032 24,358,121 2,135,174 50,114,927 1,587,394 112,358,869 312,282,517 273,985,311
Total assets 152,760,611 55,160,067 18,869,394 79,951,449 3,476,275 117,508,182 427,725,978 423,167,803
CITY OF BEVERLY HILLS, CALIFORNIA
(Continued)
Statement of Net Position
Proprietary Funds
June 30, 2013
Business-type Activities – Enterprise Funds
37 Proprietary_13BS1
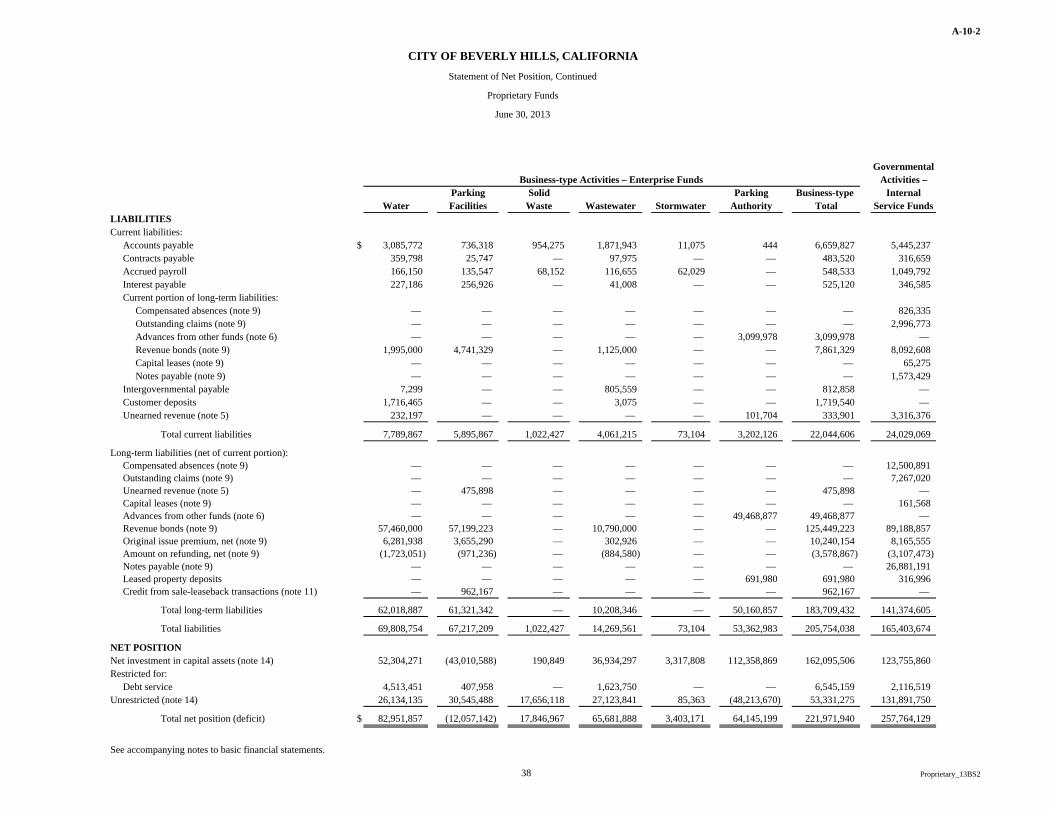
A-10-2
GovernmentalActivities –
Parking Solid Parking Business-type InternalWater Facilities Waste Wastewater Stormwater Authority Total Service Funds
LIABILITIESCurrent liabilities:
Accounts payable $ 3,085,772 736,318 954,275 1,871,943 11,075 444 6,659,827 5,445,237Contracts payable 359,798 25,747 — 97,975 — — 483,520 316,659Accrued payroll 166,150 135,547 68,152 116,655 62,029 — 548,533 1,049,792Interest payable 227,186 256,926 — 41,008 — — 525,120 346,585Current portion of long-term liabilities:
Compensated absences (note 9) — — — — — — — 826,335Outstanding claims (note 9) — — — — — — — 2,996,773Advances from other funds (note 6) — — — — — 3,099,978 3,099,978 — Revenue bonds (note 9) 1,995,000 4,741,329 — 1,125,000 — — 7,861,329 8,092,608Capital leases (note 9) — — — — — — — 65,275Notes payable (note 9) — — — — — — — 1,573,429
Intergovernmental payable 7,299 — — 805,559 — — 812,858 — Customer deposits 1,716,465 — — 3,075 — — 1,719,540 — Unearned revenue (note 5) 232,197 — — — — 101,704 333,901 3,316,376
Total current liabilities 7,789,867 5,895,867 1,022,427 4,061,215 73,104 3,202,126 22,044,606 24,029,069
Long-term liabilities (net of current portion):Compensated absences (note 9) — — — — — — — 12,500,891Outstanding claims (note 9) — — — — — — — 7,267,020Unearned revenue (note 5) — 475,898 — — — — 475,898 — Capital leases (note 9) — — — — — — — 161,568Advances from other funds (note 6) — — — — — 49,468,877 49,468,877 — Revenue bonds (note 9) 57,460,000 57,199,223 — 10,790,000 — — 125,449,223 89,188,857Original issue premium, net (note 9) 6,281,938 3,655,290 — 302,926 — — 10,240,154 8,165,555Amount on refunding, net (note 9) (1,723,051) (971,236) — (884,580) — — (3,578,867) (3,107,473)Notes payable (note 9) — — — — — — — 26,881,191Leased property deposits — — — — — 691,980 691,980 316,996Credit from sale-leaseback transactions (note 11) — 962,167 — — — — 962,167 —
Total long-term liabilities 62,018,887 61,321,342 — 10,208,346 — 50,160,857 183,709,432 141,374,605
Total liabilities 69,808,754 67,217,209 1,022,427 14,269,561 73,104 53,362,983 205,754,038 165,403,674
NET POSITIONNet investment in capital assets (note 14) 52,304,271 (43,010,588) 190,849 36,934,297 3,317,808 112,358,869 162,095,506 123,755,860Restricted for:
Debt service 4,513,451 407,958 — 1,623,750 — — 6,545,159 2,116,519Unrestricted (note 14) 26,134,135 30,545,488 17,656,118 27,123,841 85,363 (48,213,670) 53,331,275 131,891,750
Total net position (deficit) $ 82,951,857 (12,057,142) 17,846,967 65,681,888 3,403,171 64,145,199 221,971,940 257,764,129
See accompanying notes to basic financial statements.
Business-type Activities – Enterprise Funds
CITY OF BEVERLY HILLS, CALIFORNIA
Statement of Net Position, Continued
Proprietary Funds
June 30, 2013
38 Proprietary_13BS2
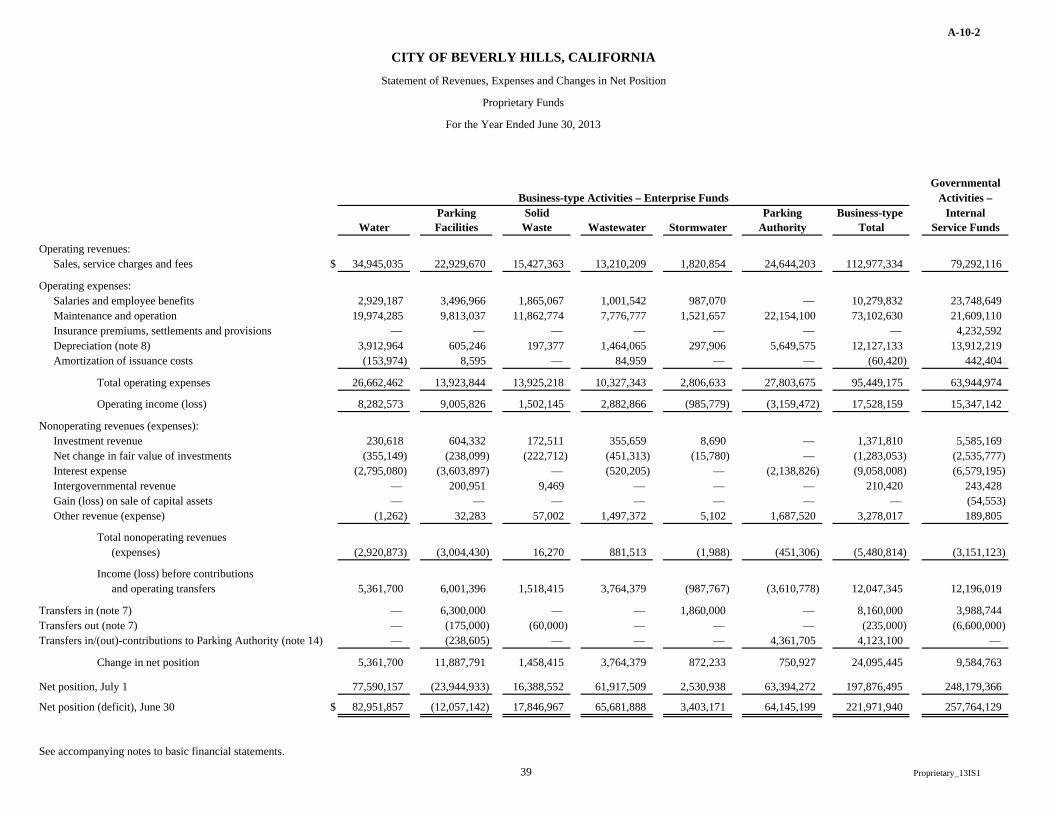
A-10-2
GovernmentalActivities –
Parking Solid Parking Business-type InternalWater Facilities Waste Wastewater Stormwater Authority Total Service Funds
Operating revenues:Sales, service charges and fees $ 34,945,035 22,929,670 15,427,363 13,210,209 1,820,854 24,644,203 112,977,334 79,292,116
Operating expenses:Salaries and employee benefits 2,929,187 3,496,966 1,865,067 1,001,542 987,070 — 10,279,832 23,748,649Maintenance and operation 19,974,285 9,813,037 11,862,774 7,776,777 1,521,657 22,154,100 73,102,630 21,609,110Insurance premiums, settlements and provisions — — — — — — — 4,232,592Depreciation (note 8) 3,912,964 605,246 197,377 1,464,065 297,906 5,649,575 12,127,133 13,912,219Amortization of issuance costs (153,974) 8,595 — 84,959 — — (60,420) 442,404
Total operating expenses 26,662,462 13,923,844 13,925,218 10,327,343 2,806,633 27,803,675 95,449,175 63,944,974
Operating income (loss) 8,282,573 9,005,826 1,502,145 2,882,866 (985,779) (3,159,472) 17,528,159 15,347,142
Nonoperating revenues (expenses):Investment revenue 230,618 604,332 172,511 355,659 8,690 — 1,371,810 5,585,169Net change in fair value of investments (355,149) (238,099) (222,712) (451,313) (15,780) — (1,283,053) (2,535,777)Interest expense (2,795,080) (3,603,897) — (520,205) — (2,138,826) (9,058,008) (6,579,195)Intergovernmental revenue — 200,951 9,469 — — — 210,420 243,428Gain (loss) on sale of capital assets — — — — — — — (54,553)Other revenue (expense) (1,262) 32,283 57,002 1,497,372 5,102 1,687,520 3,278,017 189,805
Total nonoperating revenues(expenses) (2,920,873) (3,004,430) 16,270 881,513 (1,988) (451,306) (5,480,814) (3,151,123)
Income (loss) before contributions and operating transfers 5,361,700 6,001,396 1,518,415 3,764,379 (987,767) (3,610,778) 12,047,345 12,196,019
Transfers in (note 7) — 6,300,000 — — 1,860,000 — 8,160,000 3,988,744Transfers out (note 7) — (175,000) (60,000) — — — (235,000) (6,600,000)Transfers in/(out)-contributions to Parking Authority (note 14) — (238,605) — — — 4,361,705 4,123,100 —
Change in net position 5,361,700 11,887,791 1,458,415 3,764,379 872,233 750,927 24,095,445 9,584,763
Net position, July 1 77,590,157 (23,944,933) 16,388,552 61,917,509 2,530,938 63,394,272 197,876,495 248,179,366
Net position (deficit), June 30 $ 82,951,857 (12,057,142) 17,846,967 65,681,888 3,403,171 64,145,199 221,971,940 257,764,129
See accompanying notes to basic financial statements.
Business-type Activities – Enterprise Funds
CITY OF BEVERLY HILLS, CALIFORNIA
Statement of Revenues, Expenses and Changes in Net Position
Proprietary Funds
For the Year Ended June 30, 2013
39 Proprietary_13IS1


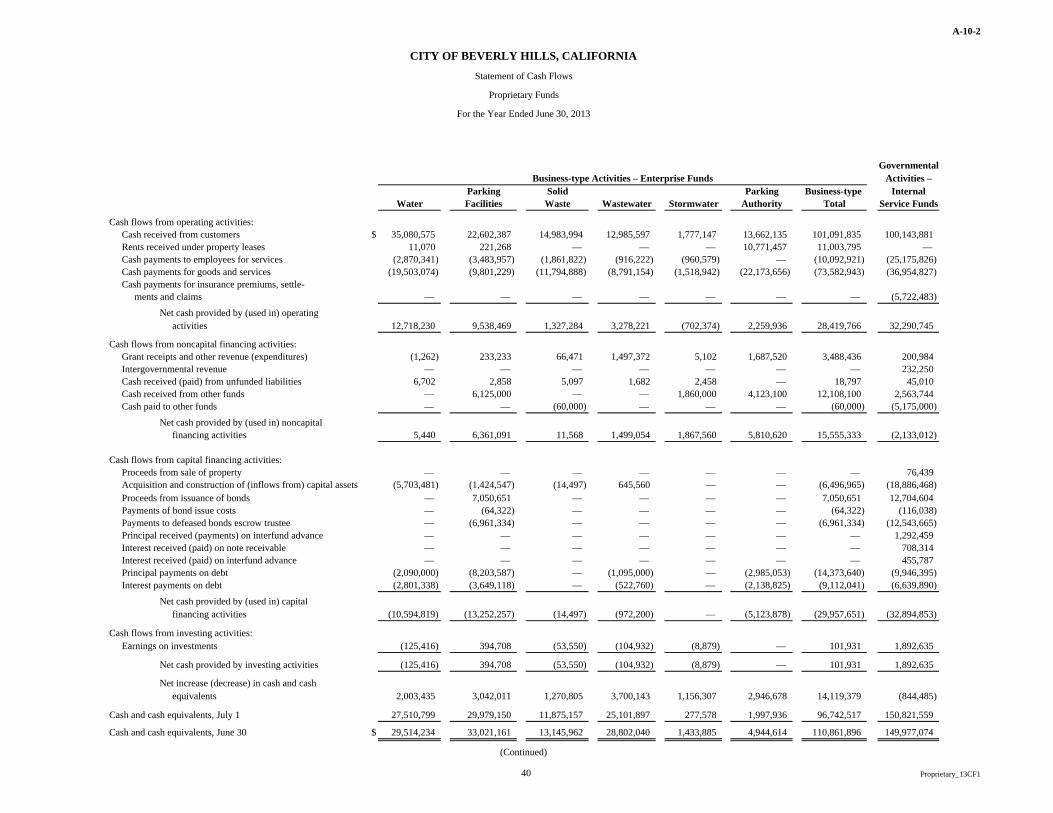
A-10-2
Governmental
Activities –Parking Solid Parking Business-type Internal
Water Facilities Waste Wastewater Stormwater Authority Total Service Funds
Cash flows from operating activities:Cash received from customers $ 35,080,575 22,602,387 14,983,994 12,985,597 1,777,147 13,662,135 101,091,835 100,143,881Rents received under property leases 11,070 221,268 — — — 10,771,457 11,003,795 — Cash payments to employees for services (2,870,341) (3,483,957) (1,861,822) (916,222) (960,579) — (10,092,921) (25,175,826)Cash payments for goods and services (19,503,074) (9,801,229) (11,794,888) (8,791,154) (1,518,942) (22,173,656) (73,582,943) (36,954,827)Cash payments for insurance premiums, settle-
ments and claims — — — — — — — (5,722,483)
Net cash provided by (used in) operatingactivities 12,718,230 9,538,469 1,327,284 3,278,221 (702,374) 2,259,936 28,419,766 32,290,745
Cash flows from noncapital financing activities:Grant receipts and other revenue (expenditures) (1,262) 233,233 66,471 1,497,372 5,102 1,687,520 3,488,436 200,984Intergovernmental revenue — — — — — — — 232,250Cash received (paid) from unfunded liabilities 6,702 2,858 5,097 1,682 2,458 — 18,797 45,010Cash received from other funds — 6,125,000 — — 1,860,000 4,123,100 12,108,100 2,563,744Cash paid to other funds — — (60,000) — — — (60,000) (5,175,000)
Net cash provided by (used in) noncapitalfinancing activities 5,440 6,361,091 11,568 1,499,054 1,867,560 5,810,620 15,555,333 (2,133,012)
Cash flows from capital financing activities:Proceeds from sale of property — — — — — — — 76,439Acquisition and construction of (inflows from) capital assets (5,703,481) (1,424,547) (14,497) 645,560 — — (6,496,965) (18,886,468)Proceeds from issuance of bonds — 7,050,651 — — — — 7,050,651 12,704,604Payments of bond issue costs — (64,322) — — — — (64,322) (116,038)Payments to defeased bonds escrow trustee — (6,961,334) — — — — (6,961,334) (12,543,665)Principal received (payments) on interfund advance — — — — — — — 1,292,459Interest received (paid) on note receivable — — — — — — — 708,314Interest received (paid) on interfund advance — — — — — — — 455,787Principal payments on debt (2,090,000) (8,203,587) — (1,095,000) — (2,985,053) (14,373,640) (9,946,395)Interest payments on debt (2,801,338) (3,649,118) — (522,760) — (2,138,825) (9,112,041) (6,639,890)
Net cash provided by (used in) capitalfinancing activities (10,594,819) (13,252,257) (14,497) (972,200) — (5,123,878) (29,957,651) (32,894,853)
Cash flows from investing activities:Earnings on investments (125,416) 394,708 (53,550) (104,932) (8,879) — 101,931 1,892,635
Net cash provided by investing activities (125,416) 394,708 (53,550) (104,932) (8,879) — 101,931 1,892,635
Net increase (decrease) in cash and cashequivalents 2,003,435 3,042,011 1,270,805 3,700,143 1,156,307 2,946,678 14,119,379 (844,485)
Cash and cash equivalents, July 1 27,510,799 29,979,150 11,875,157 25,101,897 277,578 1,997,936 96,742,517 150,821,559
Cash and cash equivalents, June 30 $ 29,514,234 33,021,161 13,145,962 28,802,040 1,433,885 4,944,614 110,861,896 149,977,074
Business-type Activities – Enterprise Funds
(Continued)
CITY OF BEVERLY HILLS, CALIFORNIA
Statement of Cash Flows
Proprietary Funds
For the Year Ended June 30, 2013
40 Proprietary_13CF1
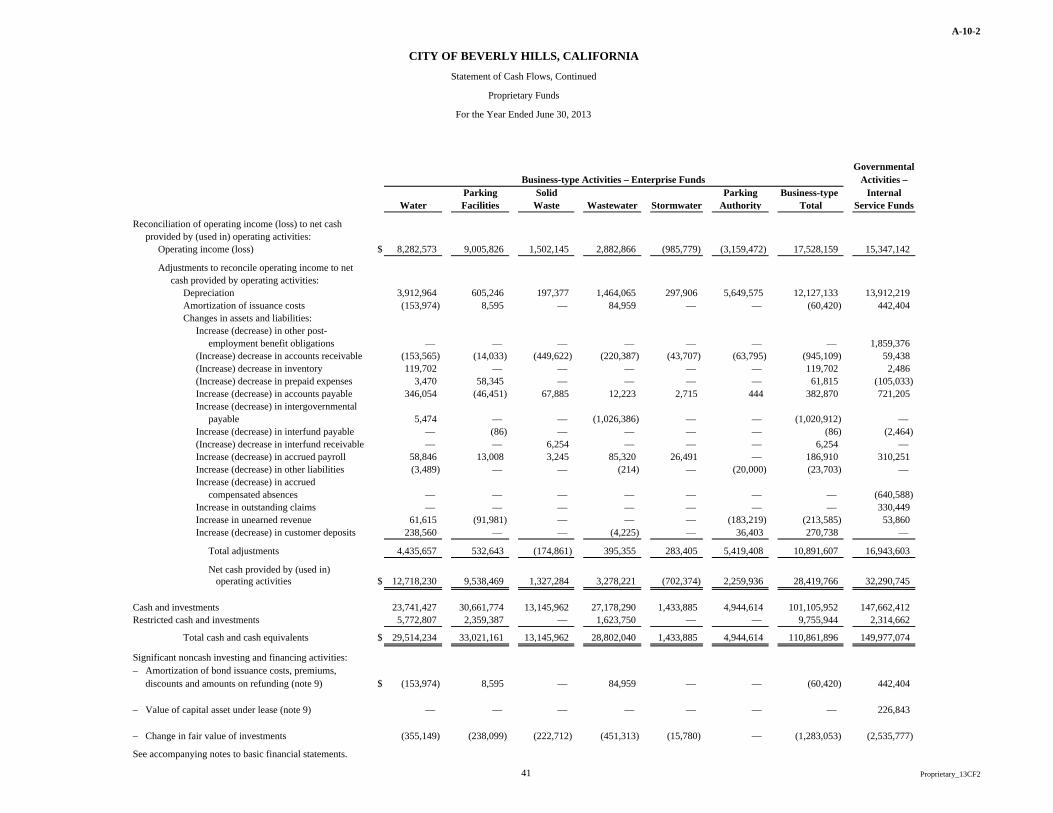
A-10-2
Governmental
Activities –Parking Solid Parking Business-type Internal
Water Facilities Waste Wastewater Stormwater Authority Total Service Funds
Reconciliation of operating income (loss) to net cashprovided by (used in) operating activities:
Operating income (loss) $ 8,282,573 9,005,826 1,502,145 2,882,866 (985,779) (3,159,472) 17,528,159 15,347,142
Adjustments to reconcile operating income to netcash provided by operating activities:
Depreciation 3,912,964 605,246 197,377 1,464,065 297,906 5,649,575 12,127,133 13,912,219Amortization of issuance costs (153,974) 8,595 — 84,959 — — (60,420) 442,404Changes in assets and liabilities:
Increase (decrease) in other post-employment benefit obligations — — — — — — — 1,859,376
(Increase) decrease in accounts receivable (153,565) (14,033) (449,622) (220,387) (43,707) (63,795) (945,109) 59,438(Increase) decrease in inventory 119,702 — — — — — 119,702 2,486(Increase) decrease in prepaid expenses 3,470 58,345 — — — — 61,815 (105,033)Increase (decrease) in accounts payable 346,054 (46,451) 67,885 12,223 2,715 444 382,870 721,205Increase (decrease) in intergovernmental
payable 5,474 — — (1,026,386) — — (1,020,912) — Increase (decrease) in interfund payable — (86) — — — — (86) (2,464)(Increase) decrease in interfund receivable — — 6,254 — — — 6,254 — Increase (decrease) in accrued payroll 58,846 13,008 3,245 85,320 26,491 — 186,910 310,251Increase (decrease) in other liabilities (3,489) — — (214) — (20,000) (23,703) — Increase (decrease) in accrued
compensated absences — — — — — — — (640,588)Increase in outstanding claims — — — — — — — 330,449Increase in unearned revenue 61,615 (91,981) — — — (183,219) (213,585) 53,860Increase (decrease) in customer deposits 238,560 — — (4,225) — 36,403 270,738 —
Total adjustments 4,435,657 532,643 (174,861) 395,355 283,405 5,419,408 10,891,607 16,943,603
Net cash provided by (used in) operating activities $ 12,718,230 9,538,469 1,327,284 3,278,221 (702,374) 2,259,936 28,419,766 32,290,745
Cash and investments 23,741,427 30,661,774 13,145,962 27,178,290 1,433,885 4,944,614 101,105,952 147,662,412Restricted cash and investments 5,772,807 2,359,387 — 1,623,750 — — 9,755,944 2,314,662
Total cash and cash equivalents $ 29,514,234 33,021,161 13,145,962 28,802,040 1,433,885 4,944,614 110,861,896 149,977,074
Significant noncash investing and financing activities:– Amortization of bond issuance costs, premiums,
discounts and amounts on refunding (note 9) $ (153,974) 8,595 — 84,959 — — (60,420) 442,404
– Value of capital asset under lease (note 9) — — — — — — — 226,843
– Change in fair value of investments (355,149) (238,099) (222,712) (451,313) (15,780) — (1,283,053) (2,535,777)
See accompanying notes to basic financial statements.
Business-type Activities – Enterprise Funds
CITY OF BEVERLY HILLS, CALIFORNIA
Statement of Cash Flows, Continued
Proprietary Funds
For the Year Ended June 30, 2013
41 Proprietary_13CF2


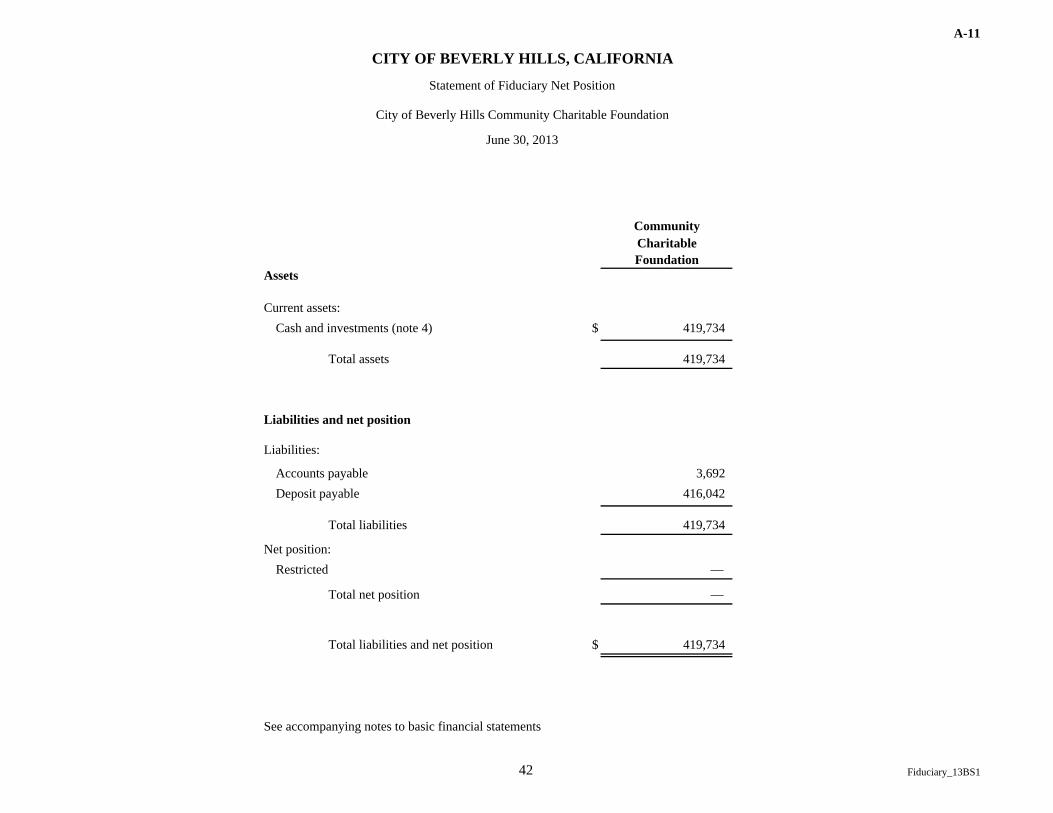
A-11
CommunityCharitableFoundation
Assets
Current assets:Cash and investments (note 4) $ 419,734
Total assets 419,734
Liabilities and net position
Liabilities:
Accounts payable 3,692Deposit payable 416,042
Total liabilities 419,734
Net position:Restricted —
Total net position —
Total liabilities and net position $ 419,734
See accompanying notes to basic financial statements
CITY OF BEVERLY HILLS, CALIFORNIA
Statement of Fiduciary Net Position
City of Beverly Hills Community Charitable Foundation
June 30, 2013
42 Fiduciary_13BS1

CITY OF BEVERLY HILLS, CALIFORNIA Notes to Basic Financial Statements
For the year ended June 30, 2013
43
(1) SUMMARY OF SIGNIFICANT ACCOUNTING POLICIES
The basic financial statements of the City of Beverly Hills, California (City) have been prepared in conformity with accounting principles generally ac-cepted in the United States of America (GAAP). The Governmental Ac-counting Standards Board (GASB) is the accepted standard-setting body for establishing governmental accounting and financial reporting principles. The more significant of the City’s accounting policies are described below.
A. Financial Reporting Entity
The accompanying basic financial statements present the financial ac-tivity of the City of Beverly Hills (primary government) and its com-ponent units, entities for which the primary government is considered to be financially accountable. A component unit is a legally separate organization that does not qualify as the primary government and which exhibits financial accountability. Financial accountability stems from specific subsets of the qualities of fiscal dependence, board ap-pointment, financial benefit, burden relationship, or ability to impose will. Blended component units, although separate legal entities, are, in substance, part of the government’s operations. Their funds are treated similarly to funds of the primary government (other than the general fund). Discretely presented component units represent other legally separate organizations for which the primary government is financially accountable or for which the nature and significance of their relation-ship to the primary government are such that exclusion would cause the City’s reporting entity to be misleading or incomplete. Discretely pre-sented component units do not function as an integral part of the prima-ry government, and its data would only be shown separately from the primary government. The City’s component units are blended; there are no discretely presented component units in the Financial Reporting En-tity.
City of Beverly Hills
The City (primary government) was incorporated in 1914 under the general laws of the State of California. The City provides the full range of municipal services as contemplated by statute. Services provided in-clude public safety (police and fire), street construction and mainte-nance, sanitation, refuse collection, water and sewer utilities, culture-recreation, public improvements, planning and zoning, and general ad-ministrative and support services.
The City operates under a Council-Manager form of government. The City Council consists of five members elected at large for overlapping four-year terms. The Mayor is selected from the City Council members and serves a one-year term. The City’s only other elected official is the City Treasurer whose term of office is four years. The City Council appoints a City Manager, City Attorney and City Clerk. In addition,
the City Council appoints the members of the following advisory Commissions and Boards: Architectural Commission Public Works Commission
Human Relations Commission Seismic Safety Appeals Board
Civil Service Commission Fine Art Commission
Recreation & Parks Commission Traffic & Parking Commission
Planning Commission R-1 Design Review Commission
Solicitations Advisory Commis-sion
In addition to sitting as the governing board of the City, the City Coun-cil also acts as the Board of Directors of two blended component units: The Parking Authority of the City of Beverly Hills and the Beverly Hills Public Financing Authority.
The Parking Authority of the City of Beverly Hills
The Parking Authority of the City of Beverly Hills (Parking Authority) is a public financing agency established by the City under the State of California Parking Law of 1949 to provide public parking facilities on a citywide basis. The Parking Authority provides for the acquisition and/or construction of parking facilities that are leased to the City for the general benefit of its citizens.
The Parking Authority is a blended component unit under the criteria of board appointment and financial burden on the primary government. In regards to board appointment, State law provides that the Mayor of the City, with the approval of the rest of the City Council, shall appoint 5 electors as the governing body. Alternatively, the City Council can de-clare itself as the governing body of The Parking Authority. If the Council is the governing body, the Council can at any time, by resolu-tion, determine that it is no longer the governing body of The Parking Authority, in which event the mayor, with the approval of the rest of the Council, shall appoint 5 electors. As of June 30, 2013, the City Council continues to act as the governing body of The Parking Authori-ty. In regards to financial burden, the City collateralizes the outstanding bonds payable that were used to construct many of The Parking Au-thority’s assets. During the fiscal year ended, the City also entered into a financial burden by contributing $4,123,100 to support the operations of The Parking Authority.
The history of The Parking Authority’s relationship to the City has in-cluded repetitive transitions. Prior to the fiscal year ended June 30, 1983, The Parking Authority was a discretely presented component unit of the City, as its data was shown separately from the City. As of June 30, 1983, as a result of the National Council on Governmental Ac-counting (NCGA) Statement No. 3, the City presented The Parking Au-thority as a blended component unit. During the year ended June 30, 1994, the assets of The Parking Authority were transferred to the Park-ing Facilities Enterprise
CITY OF BEVERLY HILLS, CALIFORNIA Notes to Basic Financial Statements
For the year ended June 30, 2013
44
(1) SUMMARY OF SIGNIFICANT ACCOUNTING POLICIES, CONTINUED
Fund and no Parking Authority financial transactions occurred in sub-sequent fiscal years. However, The Parking Authority still remained a legal entity. On September 30, 2011, the majority of the assets of the City’s Parking Enterprise Fund were transferred to The Parking Au-thority in order to show a total separation between The Parking Author-ity and the City. (See Note 14 for additional explanation.) The Parking Authority is blended as an Enterprise Fund of the City.
Beverly Hills Public Financing Authority
The City of Beverly Hills Public Financing Authority (Public Financ-ing Authority) is a joint powers authority, organized pursuant to a Joint Exercise of Powers Agreement, dated November 10, 1992 between the City and The Parking Authority. The Joint Powers Agreement was en-tered into pursuant to the provisions of Article 1 of Chapter 5 of the California Government Code (the Act). The Public Financing Authori-ty was created for the purpose of providing financing for public capital improvements for the City through the acquisition by the Public Fi-nancing Authority of such public capital improvements and/or the pur-chase by the Public Financing Authority of local obligations within the meaning of the Act. Under the Act, the Public Financing Authority has the power to issue bonds to pay the costs of public capital improve-ments.
Required lease payments between the City and the Public Financing Authority exactly match debt service requirements of the underlying debt. Accordingly, the leases between the City and the Public Financ-ing Authority are eliminated and the underlying debt is reported as debt of the City. Separate financial statements are not prepared for the Pub-lic Financing Authority. Activities of the Public Financing Authority are presented within the debt service fund, as well as within Long-Term Liabilities Note 9. Please contact the Director of Administrative Ser-vices/Chief Financial Officer for more information.
City of Beverly Hills Community Charitable Foundation
On January 20th, 2012, the Internal Revenue Service recognized the City’s newly formed 501(c)(3) not-for-profit corporation entitled, “City of Beverly Hills Community Charitable Foundation” (Foundation). This corporation is a nonprofit public benefit corporation and is not or-ganized for the private gain of any person. It is organized under the Nonprofit Public Benefit Corporation Law for public and charitable purposes. The specific purposes of the Foundation are to enhance the services and programs to the Beverly Hills community and its citizens, as well as augment the physical and cultural environment of the City of Beverly Hills.
The property of the Foundation is irrevocably dedicated to charitable purposes. No part of the net earnings or assets of this corporation shall inure to the benefit of any of its directors, trustees, officers, private shareholders or members, or to any private individual. There are five authorized directors of the Foundation and all must be residents of the City of Beverly Hills. Three of the five directors are comprised of the following: The Treasurer, Vice Mayor and a Councilmember of the City chosen by the Mayor and ratified by the City Council (collectively “Elected Official Directors”). The remaining two directors are selected by the City Council of the City (each, a “Resident Director”).
Upon the dissolution or winding up of the Foundation, its assets re-maining after payment, or provision for payment, of all debts and liabil-ities of the Foundation shall be distributed to the City of Beverly Hills for public purposes or to a nonprofit fund, foundation or corporation which is organized and operated exclusively for charitable or educa-tional purposes that benefit the residents of the City of Beverly Hills and which has established its tax exempt status under Internal Revenue Code Section 501(c)(3).
The City maintains a fiduciary fund for the City of Beverly Hills Community Charitable Foundation. A fiduciary fund is used to report the assets held by the City in trust for the Foundation because these as-sets cannot be used for the City’s own programs. Therefore, such funds are excluded from the government-wide financial statements. They are reported, however, as part of the basic financial statements to ensure fiscal accountability.
B. Government-wide and Fund Financial Statements
The government-wide financial statements (i.e., the statement of net position and the statement of activities) report information on all of the non-fiduciary activities of the primary government and its component units. For the most part, the effect of interfund activity has been re-moved from these statements. Governmental activities, which normal-ly are supported by taxes and intergovernmental revenues, are reported separately from business-type activities, which rely, to a significant ex-tent, on fees and charges for support.
The statement of activities demonstrates the degree to which the direct expenses of a given function or segment are offset by program reve-nues. Direct expenses are those that are clearly identifiable with a spe-cific function or segment. Program revenues include 1) charges to cus-tomers or applicants who purchase, use, or directly benefit from goods, services, or privileges provided by a given function or segment and 2) grants and contributions that are restricted to meeting the operational or capital requirements of a particular function or segment. Taxes and other items not properly included among program revenues are reported instead as general revenues.
CITY OF BEVERLY HILLS, CALIFORNIA Notes to Basic Financial Statements
For the year ended June 30, 2013
45
(1) SUMMARY OF SIGNIFICANT ACCOUNTING POLICIES, CONTINUED
Separate financial statements are provided for governmental funds, proprietary funds, and fiduciary funds even though the latter are ex-cluded from the government-wide financial statements (note that the City has one fiduciary fund, the City of Beverly Hills Community Charitable Foundation). Major individual governmental funds and ma-jor individual enterprise funds are reported as separate columns in the fund financial statements.
C. Measurement Focus, Basis of Accounting and Financial Statement Presentation
The accounting and financial reporting treatment is determined by the applicable measurement focus and basis of accounting. The measure-ment focus describes what type of information a given fund represents. The basis of accounting describes when changes are recognized. The government-wide financial statements are reported using the economic resources measurement focus and the accrual basis of accounting, as are the proprietary fund financial statements. Revenues are recorded when earned and expenses are recorded when a liability is incurred, re-gardless of the timing of related cash flows. Property taxes are recog-nized as revenues in the year for which they are levied. Grants and similar items are recognized as revenue when all eligibility require-ments have been met.
Governmental fund financial statements are reported using the current financial resources measurement focus and the modified accrual basis of accounting. Revenues are recognized as soon as they are both meas-urable and available. Revenues are considered to be available when they are collectible within the current period or soon enough thereafter to pay liabilities of the current period. For this purpose, the City con-siders revenues to be available if they are collected within 60 days of the end of the current fiscal period. Expenditures generally are record-ed when a liability is incurred, as under accrual accounting. However, debt service expenditures, as well as expenditures related to compen-sated absences, and claims and judgments, are recorded only when payment is due. General capital asset acquisitions are reported as ex-penditures in governmental funds. Issuance of long-term debt and ac-quisitions under capital lease are reported as other financing sources.
Property taxes and taxpayer-assessed tax revenues (e.g., franchise tax-es, sales taxes, motor vehicle fees, etc.), net of estimated refunds and uncollectible amounts, and interest associated with the current fiscal period are all considered susceptible to accrual and so have been recog-nized as revenues of the current fiscal period. Expenditure driven grants are recognized as revenue when the qualifying expenditures have been incurred and all other eligibility requirements have been met, and the
amount is received during the period or within the availability period for this revenue source (within 60 days of year-end). All other revenue items are considered to be measureable and available only when cash is received by the government.
The City reports the following major governmental funds:
The General Fund is the City’s primary operating fund. It accounts for all financial resources of the general government, except those required to be accounted for in another fund.
The Infrastructure Capital Projects Fund accounts for the construc-tion expenditures of certain public capital improvement projects, including, but not limited to, replacement of the City’s street light-ing system, street improvements and other infrastructure projects.
The City reports the following major proprietary funds:
The Water Enterprise Fund accounts for all financial aspects of the City’s water operations. The City currently obtains its water from the Metropolitan Water District of Southern California and distrib-utes it throughout the City and portions of the City of West Holly-wood. The City has completed construction of a water treatment facility through a lease-purchase-operate-finance arrangement to treat local well water that is anticipated to meet approximately 20% of its water needs. The acquisition and construction of water sys-tem facilities have primarily been financed through the issuance of general obligation and revenue bonds supported by water service charges established by City Council action.
The Parking Facilities Enterprise Fund accounts for the City’s parking operations. The acquisition and construction of parking fa-cilities have primarily been financed through the issuance of reve-nue bonds supported by parking fees charged to the public and lease payments from retail facilities located in the parking struc-tures.
The Solid Waste Enterprise Fund accounts for the collection and disposal of solid waste generated by commercial and residential us-ers in the City. Solid waste operations are primarily financed through user charges established by City Council action.
The Wastewater Enterprise Fund accounts for the collection and disposal of wastewater generated within the City. The acquisition and construction of wastewater facilities and capacity rights in the City of Los Angeles Hyperion Treatment Plant have primarily been financedthrough the issuance of revenue bonds supported by user charges established by City Council action.
CITY OF BEVERLY HILLS, CALIFORNIA Notes to Basic Financial Statements
For the year ended June 30, 2013
46
(1) SUMMARY OF SIGNIFICANT ACCOUNTING POLICIES, CONTINUED
The Stormwater Enterprise Fund accounts for the certain standards for street sweeping, storm drain maintenance and other environ-mental quality programs mandated under the Federal “Clean Up the Bay” program. Stormwater operations are financed through user charges established by City Council action.
The Parking Authority of the City of Beverly Hills (Parking Au-thority) is a public financing agency established by the City under the State of California Parking Law of 1949 to provide public park-ing facilities on a citywide basis. The Parking Authority provides for the acquisition and/or construction of parking facilities that are leased to the City for the general benefit of its citizens. The Parking Authority is a blended component unit. See Note 1, Section A for more information about The Parking Authority.
Additionally, the City reports the following fund type:
The Debt Service Fund accounts for the accumulation of resources that are restricted, committed, or assigned for the payment of prin-cipal and interest on long-term obligations of governmental funds.
The Special Revenue Funds are used to account for specific reve-nues that are legally restricted to expenditure for a particular pur-pose.
Internal service funds account for a variety of services provided to other departments or agencies of the City on a cost reimbursement basis. These services include information technology, capital assets (governmental capital assets excluding infrastructure assets and the City’s fine art collection) and related maintenance and financing, reprographics, cable television, liability insurance, workers’ com-pensation insurance, unemployment insurance and employee bene-fits. Rentals to user departments and divisions for internal service capital assets are based on 1) capital replacement, 2) repairs and maintenance costs and 3) fuel usage. The capital replacement charge, based on the estimated net replacement cost of the asset al-located over the asset’s estimated useful life, is used by the City to reduce budgetary swings in user departments for periodic capital replacement.
Fiduciary funds are used to report assets held in a trustee or agency capacity for others and therefore cannot be used to support the gov-ernment's own programs.
Permanent funds are used to account for and report resources that are restricted to the extent that only earnings, and not principal, may
be used for purposes that support the reporting government’s pro-grams—that is, for the benefit of the government or its citizenry.
Private-sector standards of accounting and financial reporting issued prior to December 1, 1989, generally are followed in both the govern-ment-wide and proprietary fund financial statements to the extent that those standards do not conflict with or contradict guidance of the GASB. The City also has the option of following subsequent private-sector guidance for its business-type activities and enterprise funds, subject to the same limitation. The City has elected not to follow sub-sequent private-sector guidance.
As a general rule, the effect of interfund activity has been eliminated from the government-wide financial statements. Exceptions to this general rule are internal service fund charges and charges for billing, legislative assistance and similar services to business-type activities, as well as certain other charges to business-type activities and various other functions of the City. Elimination of these charges would distort the direct costs and program revenues reported for the various functions concerned.
Amounts reported as program revenues include 1) charges to customers or applicants for goods, services or privileges provided, 2) operating grants and contributions and 3) capital grants and contributions. Inter-nally dedicated resources are reported as general revenues rather than as program revenues. Likewise, general revenues include all taxes.
Proprietary funds distinguish operating revenues and expenses from nonoperating items. Operating revenues and expenses generally result from providing goods and services and producing and delivering goods in connection with a proprietary fund’s principal ongoing operations. The principal operating revenues of the enterprise and internal service funds are charges for sales and services. Operating expenses for enter-prise and internal service funds include salaries and employee benefits, maintenance and operation of systems and facilities, administrative ex-penses and depreciation on capital assets. All revenues and expenses not meeting this definition are reported as non-operating revenues and expenses. When both restricted and unrestricted resources are available for use, it is the City’s policy to use restricted resources first, then unre-stricted resources, as they are needed.
D. Assets, Liabilities, Net Position or Equity
Cash and Investments
In order to maximize the flexibility of its investment program and to aid in cash budgeting, the City pools the cash of all funds, except for monies deposited with fiscal agents in accordance with related bond in-dentures. The cash and investments balance in each fund represents that fund’s equity share of the City’s cash and investment pool.
CITY OF BEVERLY HILLS, CALIFORNIA Notes to Basic Financial Statements
For the year ended June 30, 2013
47
(1) SUMMARY OF SIGNIFICANT ACCOUNTING POLICIES, CONTINUED
As the City places no restrictions on the deposit or withdrawal of a par-ticular fund’s equity in the pool, the pool operates like a demand depos-it account for the participating funds. Interest income earned on pooled cash and investments is allocated monthly to the various funds based on month-end balances. Interest income on restricted cash and invest-ments with fiscal agents is credited directly to the related fund.
The City’s investments are carried at fair value, except for certain short-term money market investments, which are carried at amortized cost. The fair value of equity and debt securities is determined based on sales prices or bid-and-asked quotations from SEC-registered securi-ties exchanges or NASDAQ dealers. Local Agency Investment Fund (LAIF) determines the fair value of its portfolio quarterly and reports a factor to the City; the City applies that factor to convert its share of LAIF from amortized cost to fair value. Changes in fair value are allo-cated to each participating fund on a quarterly basis. Based on man-agement decision, investment income of certain funds has been as-signed to the General Fund. Such assignments are included in transfers to the General Fund. For purposes of the statement of cash flows, the City has defined cash and cash equivalents to be petty cash funds, equi-ty in the City’s cash and investment pool, and restricted, non-pooled investments with initial maturities of three months or less. The City follows the disclosure requirements of GASB Statement No. 40, De-posit and Investment Risk Disclosures—an Amendment of GASB State-ment No. 3.
Receivables and Payables
Activity between funds that are representative of lending/borrowing ar-rangements outstanding at the end of the fiscal year is referred to as in-terfund receivables/interfund payables (i.e., the current portion of inter-fund loans) or advances to/from other funds (the noncurrent portion of interfund loans). All other outstanding balances between funds are re-ported as interfund receivables or interfund payables. Any residual balances outstanding between the governmental activities and the busi-ness-type activities are reported in the government-wide financial statements as internal balances.
Advances between funds, as reported in the fund financial statements, are offset by a fund balance non-spendable account in applicable gov-ernmental funds to indicate that they are not available for appropriation and are not expendable available financial resources.
All trade and tax receivables are shown net of an allowance for uncol-lectible accounts and estimated refunds due.
Assessed values for purposes of property taxes are determined on an annual basis for the period July 1 to June 30 by the Los Angeles Coun-ty Assessor as of March 1. Taxes are levied annually on July 1 and be-come a lien on real property at January 1. Taxes are due November 1 and February 1 and are delinquent if not paid by December 10 and April 10, respectively, at which time applicable penalties and interest are assessed.
Inventories and Prepaid Expenses
All materials and supplies inventories are valued at cost using the aver-age cost method. Inventories in governmental funds are recorded as expenditures when consumed rather than when purchased.
Certain payments to vendors reflect costs applicable to future account-ing periods and are recorded as prepaid expenses in both government-wide and fund financial statements.
Restricted Assets
Certain proceeds of the City’s revenue bonds, as well as certain re-sources set aside for their repayment, are classified as restricted assets on the balance sheet because they are maintained in separate bank ac-counts and their use is limited by applicable bond covenants. The pro-ceeds of certain endowments, together with cumulative unspent earn-ings thereon, are also classified as restricted assets on the balance sheet because their use is limited by the terms of the endowments.
In the absence of specific statutory provisions governing the issuance of bonds, certificates or leases, these bond monies may be invested in accordance with the ordinance, resolutions or indentures specifying the types of investments its trustees or fiscal agents may make. These or-dinances, resolutions and indentures are generally more restrictive than the City’s general investment policy. In no instance have additional types of investments been authorized that are not permitted by the City’s general investment policy.
Capital Assets
Capital assets, which include land, property, plant, equipment, fine art and infrastructure assets (e.g., roads, bridges, sidewalks, traffic lights and signals, street lights and similar items), are reported in the applica-ble governmental or business-type activities columns in the govern-ment-wide financial statements. Capital assets are defined by the City as assets with an initial, individual cost of $10,000 or more and an es-timated useful life in excess of one year. Such assets are recorded at historical cost or estimated historical cost if purchased or constructed. Donated capital assets are recorded at estimated fair market value at the date of donation. The cost of normal maintenance and repairs that do not add to the value of the asset or materially extend assets lives are not capitalized.
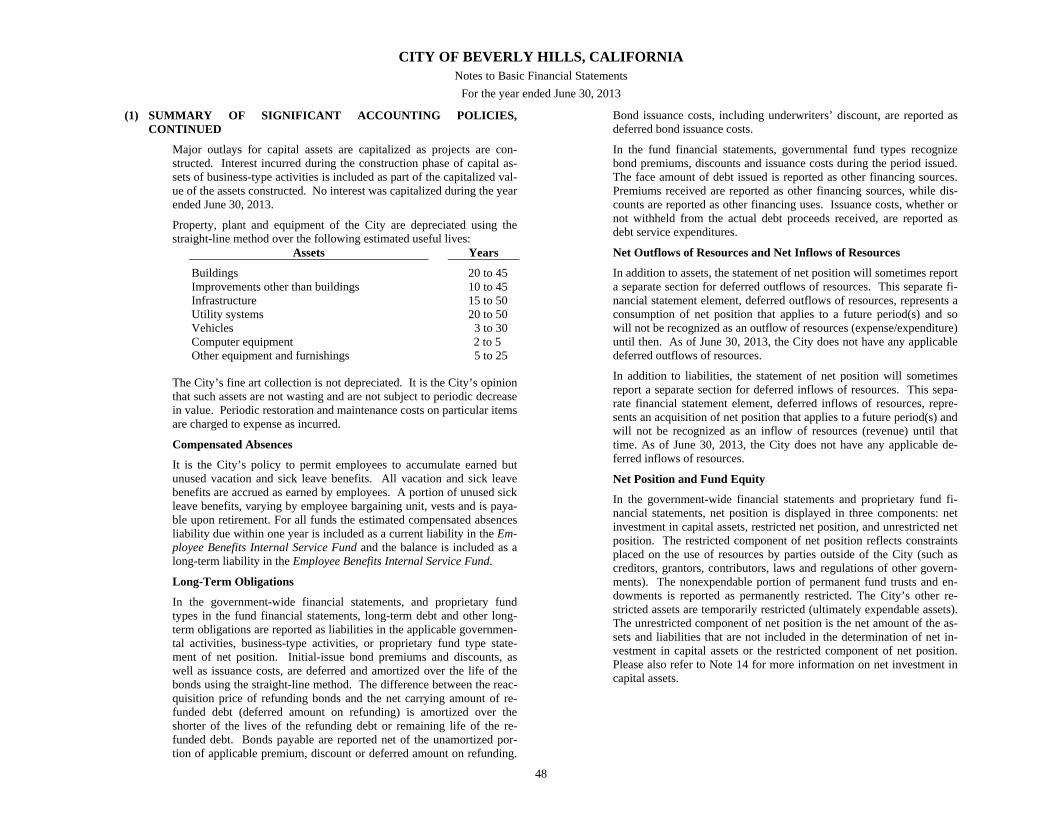
CITY OF BEVERLY HILLS, CALIFORNIA Notes to Basic Financial Statements
For the year ended June 30, 2013
48
(1) SUMMARY OF SIGNIFICANT ACCOUNTING POLICIES, CONTINUED
Major outlays for capital assets are capitalized as projects are con-structed. Interest incurred during the construction phase of capital as-sets of business-type activities is included as part of the capitalized val-ue of the assets constructed. No interest was capitalized during the year ended June 30, 2013.
Property, plant and equipment of the City are depreciated using the straight-line method over the following estimated useful lives:
Assets Years
Buildings 20 to 45 Improvements other than buildings 10 to 45 Infrastructure 15 to 50 Utility systems 20 to 50 Vehicles 3 to 30 Computer equipment 2 to 5 Other equipment and furnishings 5 to 25
The City’s fine art collection is not depreciated. It is the City’s opinion that such assets are not wasting and are not subject to periodic decrease in value. Periodic restoration and maintenance costs on particular items are charged to expense as incurred.
Compensated Absences
It is the City’s policy to permit employees to accumulate earned but unused vacation and sick leave benefits. All vacation and sick leave benefits are accrued as earned by employees. A portion of unused sick leave benefits, varying by employee bargaining unit, vests and is paya-ble upon retirement. For all funds the estimated compensated absences liability due within one year is included as a current liability in the Em-ployee Benefits Internal Service Fund and the balance is included as a long-term liability in the Employee Benefits Internal Service Fund.
Long-Term Obligations
In the government-wide financial statements, and proprietary fund types in the fund financial statements, long-term debt and other long-term obligations are reported as liabilities in the applicable governmen-tal activities, business-type activities, or proprietary fund type state-ment of net position. Initial-issue bond premiums and discounts, as well as issuance costs, are deferred and amortized over the life of the bonds using the straight-line method. The difference between the reac-quisition price of refunding bonds and the net carrying amount of re-funded debt (deferred amount on refunding) is amortized over the shorter of the lives of the refunding debt or remaining life of the re-funded debt. Bonds payable are reported net of the unamortized por-tion of applicable premium, discount or deferred amount on refunding.
Bond issuance costs, including underwriters’ discount, are reported as deferred bond issuance costs.
In the fund financial statements, governmental fund types recognize bond premiums, discounts and issuance costs during the period issued. The face amount of debt issued is reported as other financing sources. Premiums received are reported as other financing sources, while dis-counts are reported as other financing uses. Issuance costs, whether or not withheld from the actual debt proceeds received, are reported as debt service expenditures.
Net Outflows of Resources and Net Inflows of Resources
In addition to assets, the statement of net position will sometimes report a separate section for deferred outflows of resources. This separate fi-nancial statement element, deferred outflows of resources, represents a consumption of net position that applies to a future period(s) and so will not be recognized as an outflow of resources (expense/expenditure) until then. As of June 30, 2013, the City does not have any applicable deferred outflows of resources.
In addition to liabilities, the statement of net position will sometimes report a separate section for deferred inflows of resources. This sepa-rate financial statement element, deferred inflows of resources, repre-sents an acquisition of net position that applies to a future period(s) and will not be recognized as an inflow of resources (revenue) until that time. As of June 30, 2013, the City does not have any applicable de-ferred inflows of resources.
Net Position and Fund Equity
In the government-wide financial statements and proprietary fund fi-nancial statements, net position is displayed in three components: net investment in capital assets, restricted net position, and unrestricted net position. The restricted component of net position reflects constraints placed on the use of resources by parties outside of the City (such as creditors, grantors, contributors, laws and regulations of other govern-ments). The nonexpendable portion of permanent fund trusts and en-dowments is reported as permanently restricted. The City’s other re-stricted assets are temporarily restricted (ultimately expendable assets). The unrestricted component of net position is the net amount of the as-sets and liabilities that are not included in the determination of net in-vestment in capital assets or the restricted component of net position. Please also refer to Note 14 for more information on net investment in capital assets.
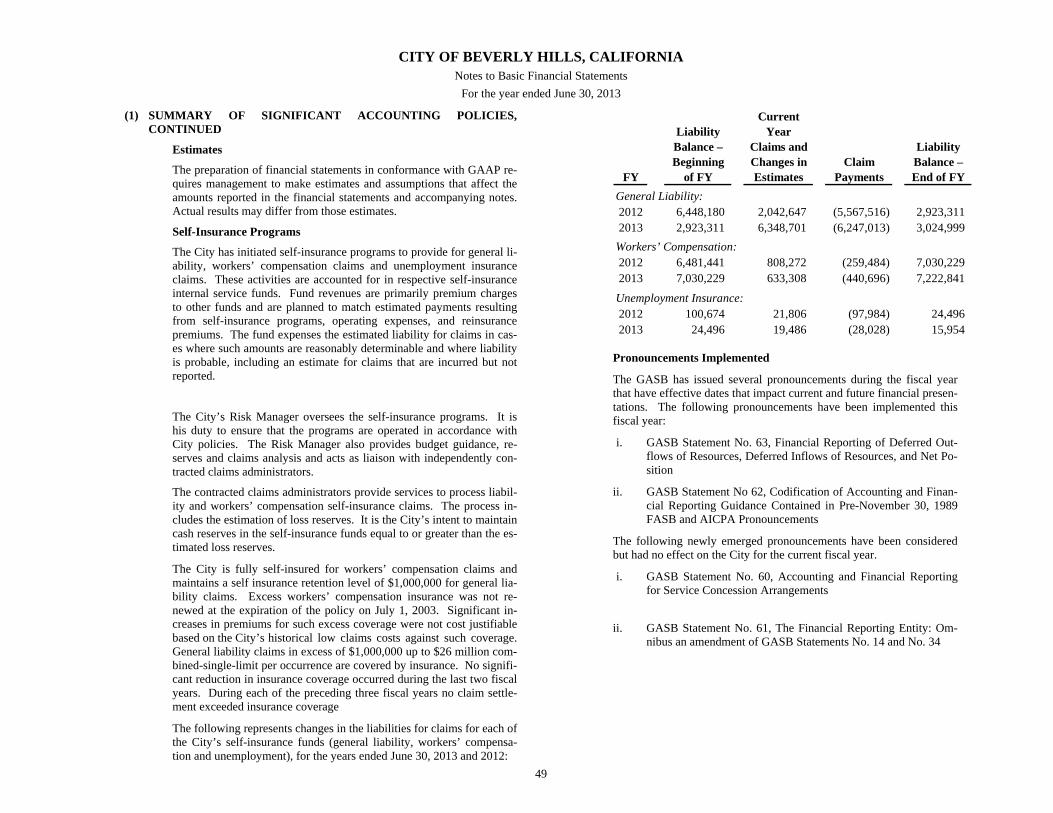
CITY OF BEVERLY HILLS, CALIFORNIA Notes to Basic Financial Statements
For the year ended June 30, 2013
49
(1) SUMMARY OF SIGNIFICANT ACCOUNTING POLICIES, CONTINUED
Estimates
The preparation of financial statements in conformance with GAAP re-quires management to make estimates and assumptions that affect the amounts reported in the financial statements and accompanying notes. Actual results may differ from those estimates.
Self-Insurance Programs
The City has initiated self-insurance programs to provide for general li-ability, workers’ compensation claims and unemployment insurance claims. These activities are accounted for in respective self-insurance internal service funds. Fund revenues are primarily premium charges to other funds and are planned to match estimated payments resulting from self-insurance programs, operating expenses, and reinsurance premiums. The fund expenses the estimated liability for claims in cas-es where such amounts are reasonably determinable and where liability is probable, including an estimate for claims that are incurred but not reported.
The City’s Risk Manager oversees the self-insurance programs. It is his duty to ensure that the programs are operated in accordance with City policies. The Risk Manager also provides budget guidance, re-serves and claims analysis and acts as liaison with independently con-tracted claims administrators.
The contracted claims administrators provide services to process liabil-ity and workers’ compensation self-insurance claims. The process in-cludes the estimation of loss reserves. It is the City’s intent to maintain cash reserves in the self-insurance funds equal to or greater than the es-timated loss reserves.
The City is fully self-insured for workers’ compensation claims and maintains a self insurance retention level of $1,000,000 for general lia-bility claims. Excess workers’ compensation insurance was not re-newed at the expiration of the policy on July 1, 2003. Significant in-creases in premiums for such excess coverage were not cost justifiable based on the City’s historical low claims costs against such coverage. General liability claims in excess of $1,000,000 up to $26 million com-bined-single-limit per occurrence are covered by insurance. No signifi-cant reduction in insurance coverage occurred during the last two fiscal years. During each of the preceding three fiscal years no claim settle-ment exceeded insurance coverage
The following represents changes in the liabilities for claims for each of the City’s self-insurance funds (general liability, workers’ compensa-tion and unemployment), for the years ended June 30, 2013 and 2012:
Pronouncements Implemented
The GASB has issued several pronouncements during the fiscal year that have effective dates that impact current and future financial presen-tations. The following pronouncements have been implemented this fiscal year:
i. GASB Statement No. 63, Financial Reporting of Deferred Out-flows of Resources, Deferred Inflows of Resources, and Net Po-sition
ii. GASB Statement No 62, Codification of Accounting and Finan-cial Reporting Guidance Contained in Pre-November 30, 1989 FASB and AICPA Pronouncements
The following newly emerged pronouncements have been considered but had no effect on the City for the current fiscal year.
i. GASB Statement No. 60, Accounting and Financial Reporting for Service Concession Arrangements
ii. GASB Statement No. 61, The Financial Reporting Entity: Om-nibus an amendment of GASB Statements No. 14 and No. 34
CurrentLiability YearBalance – Claims and LiabilityBeginning Changes in Claim Balance –
FY of FY Estimates Payments End of FYGeneral Liability:2012 6,448,180 2,042,647 (5,567,516) 2,923,3112013 2,923,311 6,348,701 (6,247,013) 3,024,999
Workers’ Compensation:2012 6,481,441 808,272 (259,484) 7,030,2292013 7,030,229 633,308 (440,696) 7,222,841
Unemployment Insurance:2012 100,674 21,806 (97,984) 24,4962013 24,496 19,486 (28,028) 15,954
CITY OF BEVERLY HILLS, CALIFORNIA Notes to Basic Financial Statements
For the year ended June 30, 2013
50
(1) SUMMARY OF SIGNIFICANT ACCOUNTING POLICIES, CONTINUED
Pending Accounting Standards
GASB has issued the following statements which may impact the City’s financial reporting requirements in the future:
GASB 65 - “Items Previously Reported as Assets and Liabilities”, effective for periods beginning after December 15, 2012.
GASB 66 - “Technical Corrections, an amendment of GASB Statement No. 10 and Statement No. 62”, effective for periods be-ginning after December 15, 2012.
GASB 67 - “Financial Reporting for Pension Plans, an amendment of GASB Statement No. 25”, effective for the fiscal years begin-ning after June 15, 2013.
GASB 68 - “Accounting and Financial Reporting for Pensions, an amendment of GASB Statement No. 27”, effective for the fiscal years beginning after June 15, 2014.
GASB 69 - “Government Combinations and Disposals of Gov-ernment Operations”, effective for periods beginning after De-cember 15, 2013.
GASB 70 - “Accounting and Financial Reporting for Nonex-change Financial Guarantees”, effective for the periods beginning after June 15, 2013.
(2) RECONCILIATION OF GOVERNMENT-WIDE AND FUND FINANCIAL STATEMENTS
Amounts reported in the government-wide financial statements are different from those reported in the fund financial statements due to differences in measurement focus, basis of accounting and composi-tion. The following reconciliations explain the significant differences between the fund financial statements and the corresponding column in the government-wide financial statements:
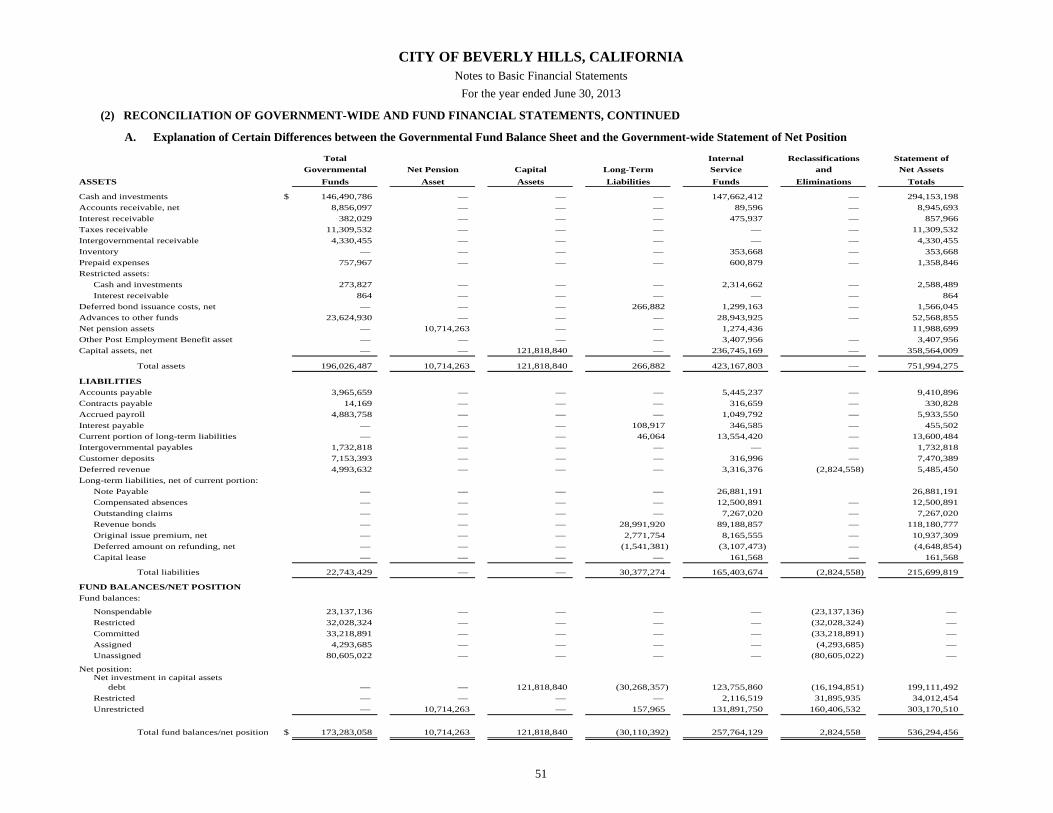
CITY OF BEVERLY HILLS, CALIFORNIA Notes to Basic Financial Statements
For the year ended June 30, 2013
51
(2) RECONCILIATION OF GOVERNMENT-WIDE AND FUND FINANCIAL STATEMENTS, CONTINUED
A. Explanation of Certain Differences between the Governmental Fund Balance Sheet and the Government-wide Statement of Net Position
Total Internal Reclassifications Statement ofGovernmental Net Pension Capital Long-Term Service and Net Assets
Funds Asset Assets Liabilities Funds Eliminations Totals
Cash and investments $ 146,490,786 — — — 147,662,412 — 294,153,198Accounts receivable, net 8,856,097 — — — 89,596 — 8,945,693Interest receivable 382,029 — — — 475,937 — 857,966Taxes receivable 11,309,532 — — — — — 11,309,532Intergovernmental receivable 4,330,455 — — — — — 4,330,455Inventory — — — — 353,668 — 353,668Prepaid expenses 757,967 — — — 600,879 — 1,358,846Restricted assets:
Cash and investments 273,827 — — — 2,314,662 — 2,588,489Interest receivable 864 — — — — — 864
Deferred bond issuance costs, net — — — 266,882 1,299,163 — 1,566,045Advances to other funds 23,624,930 — — — 28,943,925 — 52,568,855Net pension assets — 10,714,263 — — 1,274,436 11,988,699Other Post Employment Benefit asset — — — — 3,407,956 — 3,407,956Capital assets, net — — 121,818,840 — 236,745,169 — 358,564,009
Total assets 196,026,487 10,714,263 121,818,840 266,882 423,167,803 — 751,994,275
Accounts payable 3,965,659 — — — 5,445,237 — 9,410,896Contracts payable 14,169 — — — 316,659 — 330,828Accrued payroll 4,883,758 — — — 1,049,792 — 5,933,550Interest payable — — — 108,917 346,585 — 455,502Current portion of long-term liabilities — — — 46,064 13,554,420 — 13,600,484Intergovernmental payables 1,732,818 — — — — — 1,732,818Customer deposits 7,153,393 — — — 316,996 — 7,470,389Deferred revenue 4,993,632 — — — 3,316,376 (2,824,558) 5,485,450Long-term liabilities, net of current portion:
Note Payable — — — — 26,881,191 26,881,191Compensated absences — — — — 12,500,891 — 12,500,891Outstanding claims — — — — 7,267,020 — 7,267,020Revenue bonds — — — 28,991,920 89,188,857 — 118,180,777Original issue premium, net — — — 2,771,754 8,165,555 — 10,937,309Deferred amount on refunding, net — — — (1,541,381) (3,107,473) — (4,648,854)Capital lease — — — — 161,568 — 161,568
Total liabilities 22,743,429 — — 30,377,274 165,403,674 (2,824,558) 215,699,819
FUND BALANCES/NET POSITIONFund balances:
Nonspendable 23,137,136 — — — — (23,137,136) — Restricted 32,028,324 — — — — (32,028,324) — Committed 33,218,891 — — — — (33,218,891) — Assigned 4,293,685 — — — — (4,293,685) — Unassigned 80,605,022 — — — — (80,605,022) —
Net position:Net investment in capital assets
debt — — 121,818,840 (30,268,357) 123,755,860 (16,194,851) 199,111,492Restricted — — — — 2,116,519 31,895,935 34,012,454Unrestricted — 10,714,263 — 157,965 131,891,750 160,406,532 303,170,510
Total fund balances/net position $ 173,283,058 10,714,263 121,818,840 (30,110,392) 257,764,129 2,824,558 536,294,456
ASSETS
LIABILITIES
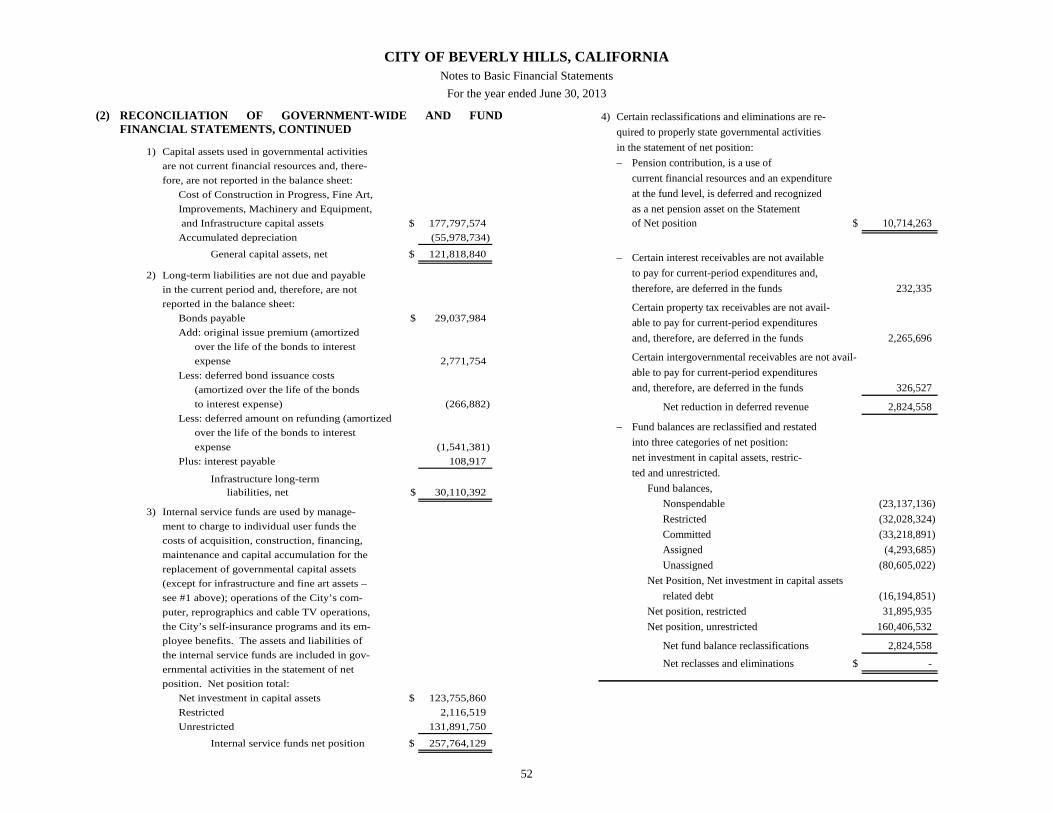
CITY OF BEVERLY HILLS, CALIFORNIA Notes to Basic Financial Statements
For the year ended June 30, 2013
52
(2) RECONCILIATION OF GOVERNMENT-WIDE AND FUND FINANCIAL STATEMENTS, CONTINUED
1) Capital assets used in governmental activitiesare not current financial resources and, there-fore, are not reported in the balance sheet:
Cost of Construction in Progress, Fine Art,Improvements, Machinery and Equipment, and Infrastructure capital assets $ 177,797,574 Accumulated depreciation (55,978,734)
General capital assets, net $ 121,818,840
2) Long-term liabilities are not due and payablein the current period and, therefore, are notreported in the balance sheet:
Bonds payable $ 29,037,984 Add: original issue premium (amortized
over the life of the bonds to interestexpense 2,771,754
Less: deferred bond issuance costs(amortized over the life of the bonds to interest expense) (266,882)
Less: deferred amount on refunding (amortizedover the life of the bonds to interestexpense (1,541,381)
Plus: interest payable 108,917
Infrastructure long-term liabilities, net $ 30,110,392
3) Internal service funds are used by manage-ment to charge to individual user funds the costs of acquisition, construction, financing, maintenance and capital accumulation for the replacement of governmental capital assets (except for infrastructure and fine art assets – see #1 above); operations of the City’s com-puter, reprographics and cable TV operations,the City’s self-insurance programs and its em-ployee benefits. The assets and liabilities ofthe internal service funds are included in gov-ernmental activities in the statement of net position. Net position total:
Net investment in capital assets $ 123,755,860 Restricted 2,116,519 Unrestricted 131,891,750
Internal service funds net position $ 257,764,129
4) Certain reclassifications and eliminations are re-quired to properly state governmental activitiesin the statement of net position:– Pension contribution, is a use of
current financial resources and an expenditureat the fund level, is deferred and recognizedas a net pension asset on the Statement of Net position $ 10,714,263
– Certain interest receivables are not availableto pay for current-period expenditures and,therefore, are deferred in the funds 232,335
Certain property tax receivables are not avail-able to pay for current-period expendituresand, therefore, are deferred in the funds 2,265,696
Certain intergovernmental receivables are not avail-able to pay for current-period expendituresand, therefore, are deferred in the funds 326,527
Net reduction in deferred revenue 2,824,558
– Fund balances are reclassified and restatedinto three categories of net position:net investment in capital assets, restric-ted and unrestricted.
Fund balances,Nonspendable (23,137,136) Restricted (32,028,324) Committed (33,218,891) Assigned (4,293,685) Unassigned (80,605,022)
Net Position, Net investment in capital assetsrelated debt (16,194,851)
Net position, restricted 31,895,935 Net position, unrestricted 160,406,532
Net fund balance reclassifications 2,824,558
Net reclasses and eliminations $ -

CITY OF BEVERLY HILLS, CALIFORNIA Notes to Basic Financial Statements
For the year ended June 30, 2013
53
(2) RECONCILIATION OF GOVERNMENT-WIDE AND FUND FINANCIAL STATEMENTS, CONTINUED
B. Explanation of Certain Differences between the Governmental Fund Statement of Revenues, Expenditures and Changes in Fund Balances and the Gov-ernment-wide Statement of Activities
Total Internal Reclassifications Statement ofGovernmental Net Pension Capital Long-Term Service and Activities
Funds Asset Assets Liabilities Funds Eliminations TotalsRevenues:
Program revenues:Charges for services $ 10,818,820 — — — 79,292,116 (31,132,807) 58,978,129Operating grants and contributions — — — — — 4,337,875 4,337,875Capital grants and contributions 131,255 — — — — 1,773,290 1,904,545Licenses and permits 15,218,056 — — — — (15,218,056) — Fines, forfeitures and penalties 7,508,395 — — — — (7,508,395) —
General revenues:Taxes 146,805,031 — — — — (488,035) 146,316,996Intergovernmental 6,339,981 — — — 243,428 (6,583,409) — Grants and contributions not restricted
to specific programs — — — — — 667,516 667,516Investment earnings 6,587,605 — — — 5,585,169 124,428 12,297,202Net change in fair value of investments (2,039,739) — — — (2,535,777) — (4,575,516)Gain (loss) on sale of capital assets — — — — (54,553) 54,553 — Miscellaneous 961,257 — — — 189,805 81,988 1,233,050
Transfers in 300,000 — — — 3,988,744 (4,113,744) 175,000
Total revenues and transfers in 192,630,661 — — — 86,708,932 (58,004,796) 221,334,797
General government 7,988,423 — — — — 2,570,025 10,558,448Public safety 88,275,098 — — — — 7,732,945 96,008,043Public service 24,961,697 — — — — 1,976,572 26,938,269Culture and recreation 39,009,248 — — — — 3,972,938 42,982,186Debt service:
Interest 1,307,007 — — — 6,579,195 — 7,886,202Capital outlay 4,521,352 — — — — (4,521,352) — Internal service fund operating expenses:
Salaries and employee benefits — — — — 23,748,649 (23,748,649) — Maintenance and operation — — — — 21,609,110 (21,609,110) — Insurance premiums, settlements and
provisions — — — — 4,232,592 (4,232,592) — Depreciation and amortization — — 4,367,119 (38,036) 13,912,219 (18,241,302) — Amortization of debt issue costs — — — — 442,404 (442,404) —
Transfers out 5,613,744 — — — 6,600,000 (4,113,744) 8,100,000Contribution to Parking Authority 4,123,100 — — — — — 4,123,100Insurance Recoveries (5,286) — — — — 5,286 — Payment to refunded bond escrow agent 12,924 — — (12,924) — — — Infrastructure, fine art assets, and net pension assets —
completed and transferred — 378,723 (3,062,394) — — 2,683,671 —
Total expenditures/expenses and transfers out 175,807,307 378,723 1,304,725 (50,960) 77,124,169 (57,967,716) 196,596,248
Change in fund balances/net position 16,823,354 (378,723) (1,304,725) 50,960 9,584,763 (37,080) 24,738,549
Fund balances/net position, July 1 156,459,704 11,092,986 123,123,565 (30,161,352) 248,179,366 2,861,638 511,555,907
Fund balances/net position, June 30 $ 173,283,058 10,714,263 121,818,840 (30,110,392) 257,764,129 2,824,558 536,294,456
Infrastructure
Expenditures/expenses:
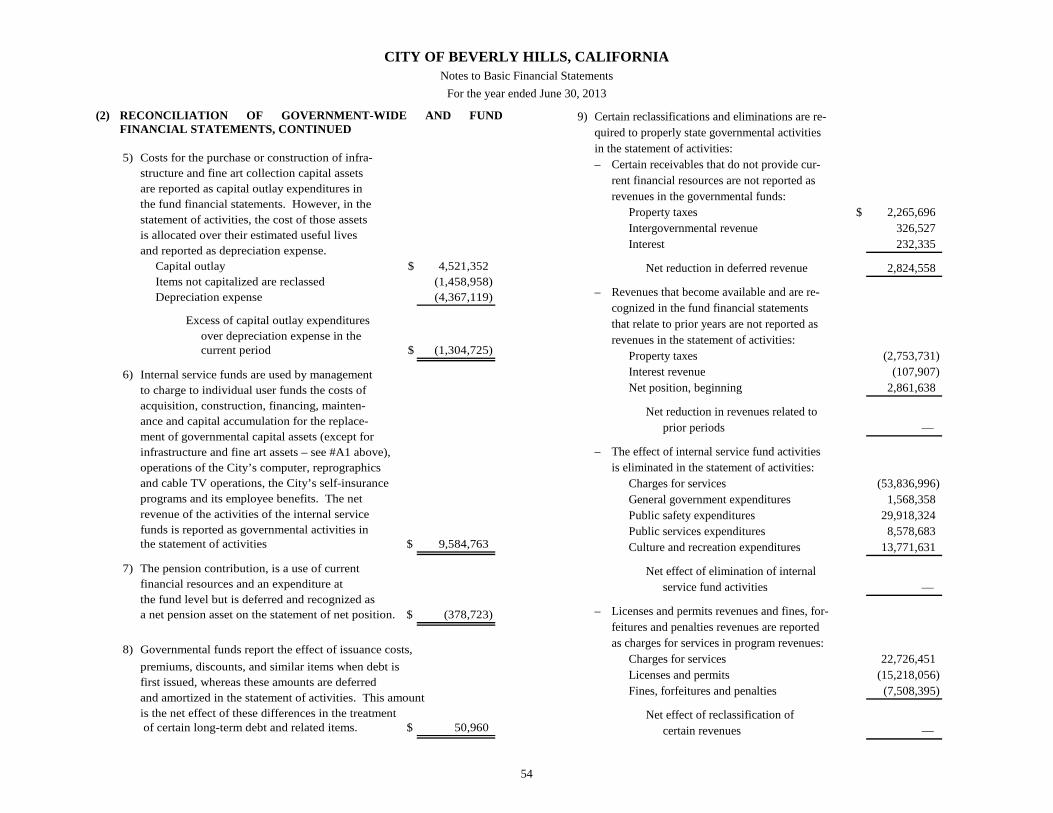
CITY OF BEVERLY HILLS, CALIFORNIA Notes to Basic Financial Statements
For the year ended June 30, 2013
54
(2) RECONCILIATION OF GOVERNMENT-WIDE AND FUND FINANCIAL STATEMENTS, CONTINUED
5) Costs for the purchase or construction of infra-structure and fine art collection capital assets are reported as capital outlay expenditures in the fund financial statements. However, in thestatement of activities, the cost of those assets is allocated over their estimated useful lives and reported as depreciation expense.
Capital outlay $ 4,521,352Items not capitalized are reclassed (1,458,958)Depreciation expense (4,367,119)
Excess of capital outlay expendituresover depreciation expense in thecurrent period $ (1,304,725)
6) Internal service funds are used by managementto charge to individual user funds the costs ofacquisition, construction, financing, mainten-ance and capital accumulation for the replace-ment of governmental capital assets (except forinfrastructure and fine art assets – see #A1 above),operations of the City’s computer, reprographicsand cable TV operations, the City’s self-insuranceprograms and its employee benefits. The netrevenue of the activities of the internal servicefunds is reported as governmental activities inthe statement of activities $ 9,584,763
7) The pension contribution, is a use of current financial resources and an expenditure atthe fund level but is deferred and recognized as a net pension asset on the statement of net position. $ (378,723)
8) Governmental funds report the effect of issuance costs, premiums, discounts, and similar items when debt is first issued, whereas these amounts are deferred and amortized in the statement of activities. This amountis the net effect of these differences in the treatment of certain long-term debt and related items. $ 50,960
9) Certain reclassifications and eliminations are re-quired to properly state governmental activitiesin the statement of activities:– Certain receivables that do not provide cur-
rent financial resources are not reported asrevenues in the governmental funds:
Property taxes $ 2,265,696Intergovernmental revenue 326,527Interest 232,335
Net reduction in deferred revenue 2,824,558
– Revenues that become available and are re-cognized in the fund financial statementsthat relate to prior years are not reported asrevenues in the statement of activities:
Property taxes (2,753,731)Interest revenue (107,907)Net position, beginning 2,861,638
Net reduction in revenues related toprior periods —
– The effect of internal service fund activitiesis eliminated in the statement of activities:
Charges for services (53,836,996)General government expenditures 1,568,358Public safety expenditures 29,918,324Public services expenditures 8,578,683Culture and recreation expenditures 13,771,631
Net effect of elimination of internalservice fund activities —
– Licenses and permits revenues and fines, for-feitures and penalties revenues are reportedas charges for services in program revenues:
Charges for services 22,726,451Licenses and permits (15,218,056)Fines, forfeitures and penalties (7,508,395)
Net effect of reclassification ofcertain revenues —
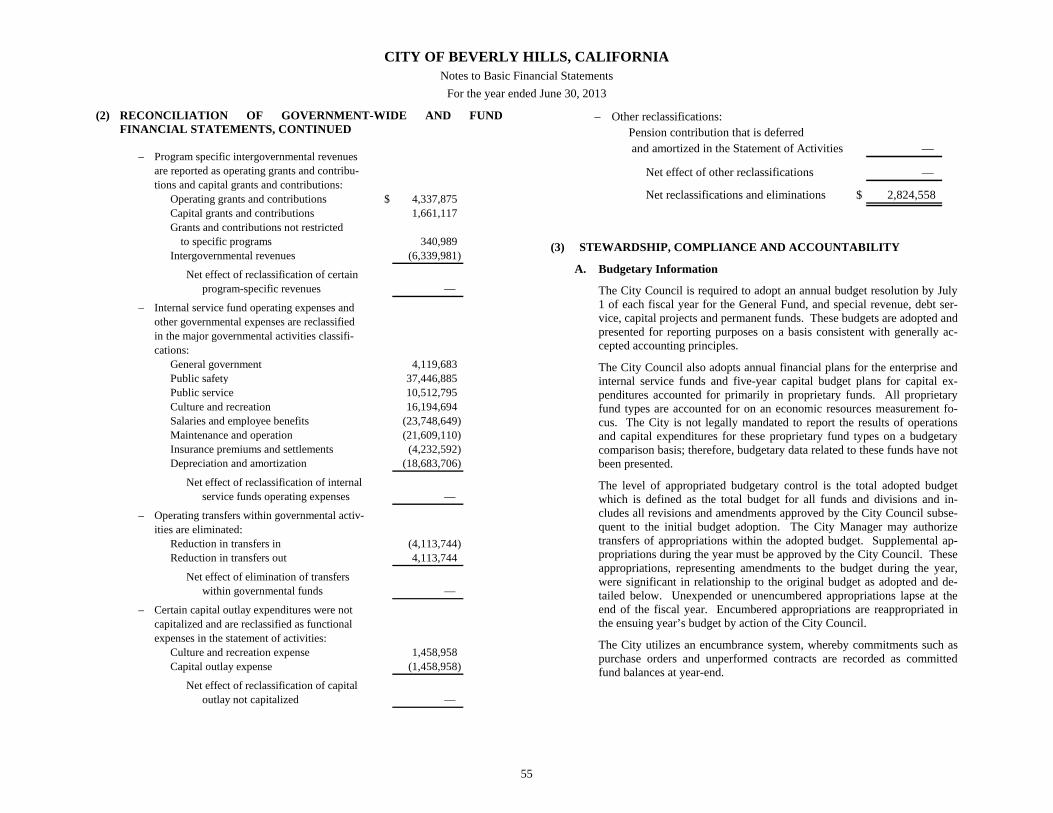
CITY OF BEVERLY HILLS, CALIFORNIA Notes to Basic Financial Statements
For the year ended June 30, 2013
55
(2) RECONCILIATION OF GOVERNMENT-WIDE AND FUND FINANCIAL STATEMENTS, CONTINUED
(3) STEWARDSHIP, COMPLIANCE AND ACCOUNTABILITY
A. Budgetary Information
The City Council is required to adopt an annual budget resolution by July 1 of each fiscal year for the General Fund, and special revenue, debt ser-vice, capital projects and permanent funds. These budgets are adopted and presented for reporting purposes on a basis consistent with generally ac-cepted accounting principles.
The City Council also adopts annual financial plans for the enterprise and internal service funds and five-year capital budget plans for capital ex-penditures accounted for primarily in proprietary funds. All proprietary fund types are accounted for on an economic resources measurement fo-cus. The City is not legally mandated to report the results of operations and capital expenditures for these proprietary fund types on a budgetary comparison basis; therefore, budgetary data related to these funds have not been presented.
The level of appropriated budgetary control is the total adopted budget which is defined as the total budget for all funds and divisions and in-cludes all revisions and amendments approved by the City Council subse-quent to the initial budget adoption. The City Manager may authorize transfers of appropriations within the adopted budget. Supplemental ap-propriations during the year must be approved by the City Council. These appropriations, representing amendments to the budget during the year, were significant in relationship to the original budget as adopted and de-tailed below. Unexpended or unencumbered appropriations lapse at the end of the fiscal year. Encumbered appropriations are reappropriated in the ensuing year’s budget by action of the City Council.
The City utilizes an encumbrance system, whereby commitments such as purchase orders and unperformed contracts are recorded as committed fund balances at year-end.
– Program specific intergovernmental revenuesare reported as operating grants and contribu-tions and capital grants and contributions:
Operating grants and contributions $ 4,337,875Capital grants and contributions 1,661,117Grants and contributions not restricted
to specific programs 340,989Intergovernmental revenues (6,339,981)
Net effect of reclassification of certainprogram-specific revenues —
– Internal service fund operating expenses andother governmental expenses are reclassifiedin the major governmental activities classifi-cations:
General government 4,119,683Public safety 37,446,885Public service 10,512,795Culture and recreation 16,194,694Salaries and employee benefits (23,748,649)Maintenance and operation (21,609,110)Insurance premiums and settlements (4,232,592)Depreciation and amortization (18,683,706)
Net effect of reclassification of internalservice funds operating expenses —
– Operating transfers within governmental activ-ities are eliminated:
Reduction in transfers in (4,113,744)Reduction in transfers out 4,113,744
Net effect of elimination of transfers within governmental funds —
– Certain capital outlay expenditures were notcapitalized and are reclassified as functionalexpenses in the statement of activities:
Culture and recreation expense 1,458,958Capital outlay expense (1,458,958)
Net effect of reclassification of capitaloutlay not capitalized —
– Other reclassifications:Pension contribution that is deferred and amortized in the Statement of Activities —
Net effect of other reclassifications —
Net reclassifications and eliminations $ 2,824,558
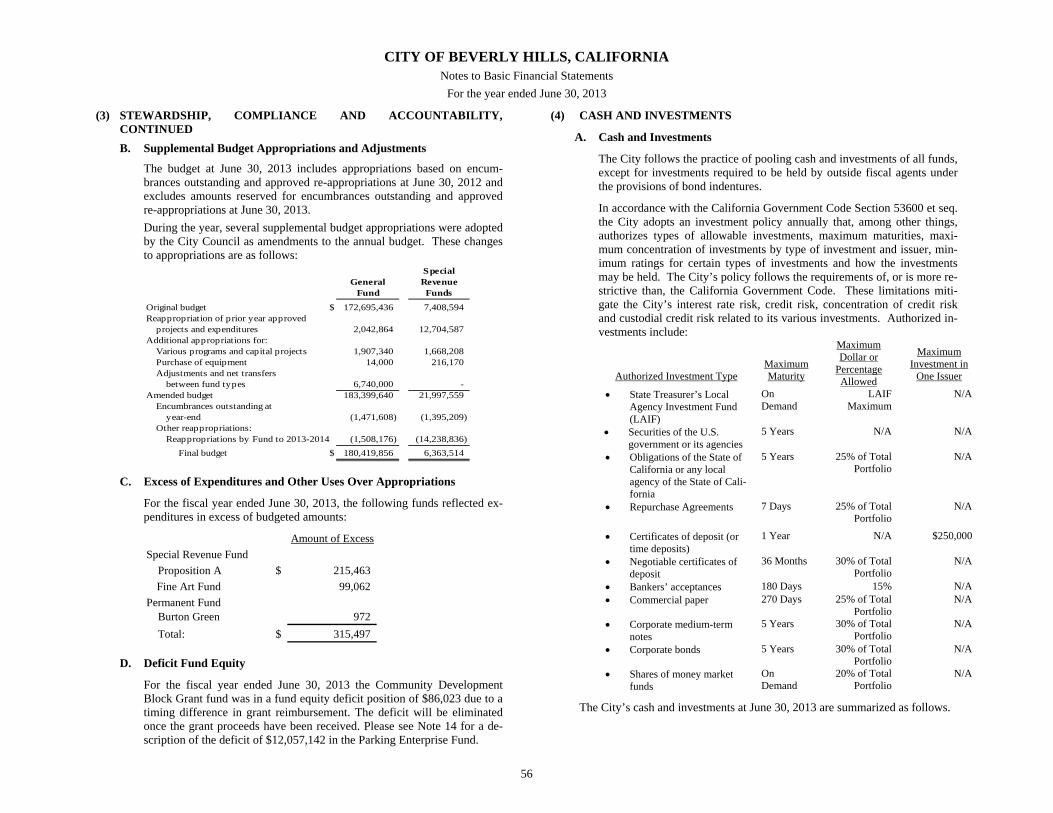
CITY OF BEVERLY HILLS, CALIFORNIA Notes to Basic Financial Statements
For the year ended June 30, 2013
56
(3) STEWARDSHIP, COMPLIANCE AND ACCOUNTABILITY, CONTINUED B. Supplemental Budget Appropriations and Adjustments
The budget at June 30, 2013 includes appropriations based on encum-brances outstanding and approved re-appropriations at June 30, 2012 and excludes amounts reserved for encumbrances outstanding and approved re-appropriations at June 30, 2013. During the year, several supplemental budget appropriations were adopted by the City Council as amendments to the annual budget. These changes to appropriations are as follows:
SpecialGeneral Revenue
Fund Funds
Original budget $ 172,695,436 7,408,594 Reappropriation of prior year approved
projects and expenditures 2,042,864 12,704,587 Additional appropriations for:
Various programs and capital projects 1,907,340 1,668,208 Purchase of equipment 14,000 216,170 Adjustments and net transfers
between fund types 6,740,000 - Amended budget 183,399,640 21,997,559
Encumbrances outstanding atyear-end (1,471,608) (1,395,209)
Other reappropriations:Reappropriations by Fund to 2013-2014 (1,508,176) (14,238,836) Final budget $ 180,419,856 6,363,514
C. Excess of Expenditures and Other Uses Over Appropriations
For the fiscal year ended June 30, 2013, the following funds reflected ex-penditures in excess of budgeted amounts:
D. Deficit Fund Equity
For the fiscal year ended June 30, 2013 the Community Development Block Grant fund was in a fund equity deficit position of $86,023 due to a timing difference in grant reimbursement. The deficit will be eliminated once the grant proceeds have been received. Please see Note 14 for a de-scription of the deficit of $12,057,142 in the Parking Enterprise Fund.
(4) CASH AND INVESTMENTS
A. Cash and Investments
The City follows the practice of pooling cash and investments of all funds, except for investments required to be held by outside fiscal agents under the provisions of bond indentures.
In accordance with the California Government Code Section 53600 et seq. the City adopts an investment policy annually that, among other things, authorizes types of allowable investments, maximum maturities, maxi-mum concentration of investments by type of investment and issuer, min-imum ratings for certain types of investments and how the investments may be held. The City’s policy follows the requirements of, or is more re-strictive than, the California Government Code. These limitations miti-gate the City’s interest rate risk, credit risk, concentration of credit risk and custodial credit risk related to its various investments. Authorized in-vestments include:
Authorized Investment Type Maximum Maturity
Maximum Dollar or
Percentage Allowed
Maximum Investment in
One Issuer
State Treasurer’s Local Agency Investment Fund (LAIF)
On Demand
LAIFMaximum
N/A
Securities of the U.S. government or its agencies
5 Years N/A N/A
Obligations of the State of California or any local agency of the State of Cali-fornia
5 Years 25% of Total Portfolio
N/A
Repurchase Agreements 7 Days 25% of Total Portfolio
N/A
Certificates of deposit (or time deposits)
1 Year N/A $250,000
Negotiable certificates of deposit
36 Months 30% of Total Portfolio
N/A
Bankers’ acceptances 180 Days 15% N/A Commercial paper 270 Days 25% of Total
Portfolio N/A
Corporate medium-term notes
5 Years 30% of Total Portfolio
N/A
Corporate bonds 5 Years 30% of Total Portfolio
N/A
Shares of money market funds
On Demand
20% of Total Portfolio
N/A
The City’s cash and investments at June 30, 2013 are summarized as follows.
Amount of ExcessSpecial Revenue Fund
Proposition A $ 215,463 Fine Art Fund 99,062
Permanent FundBurton Green 972 Total: $ 315,497
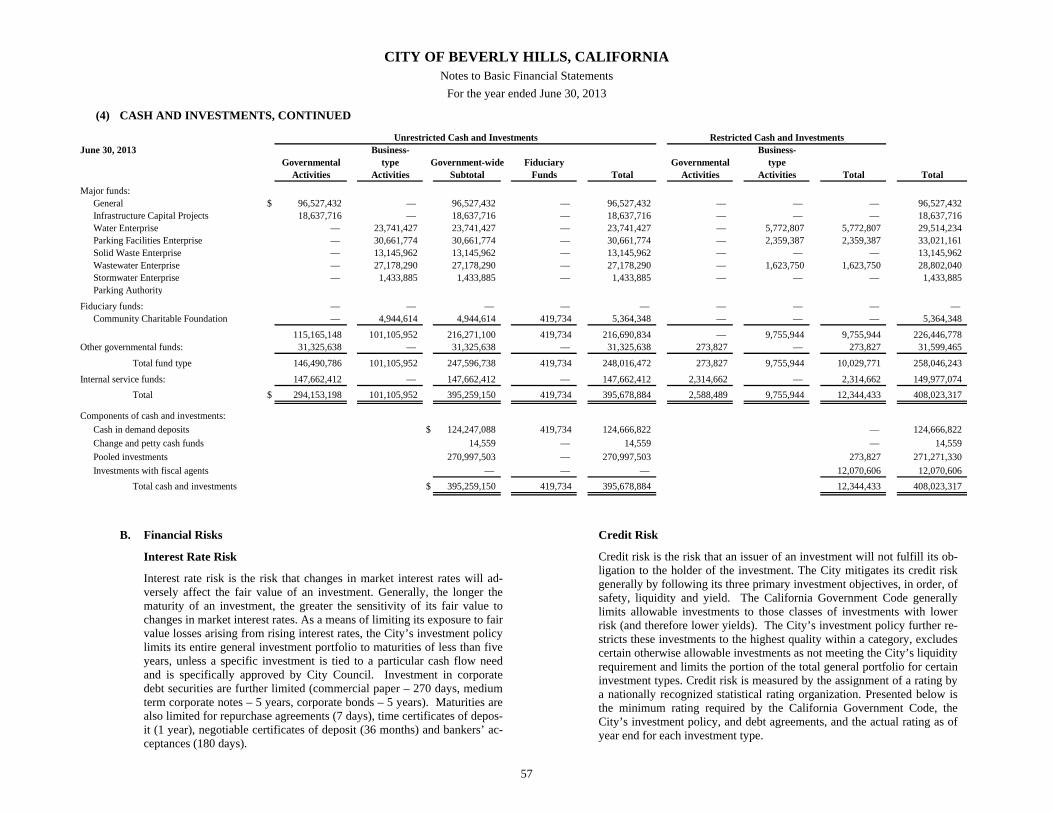
CITY OF BEVERLY HILLS, CALIFORNIA Notes to Basic Financial Statements
For the year ended June 30, 2013
57
(4) CASH AND INVESTMENTS, CONTINUED
B. Financial Risks
Interest Rate Risk
Interest rate risk is the risk that changes in market interest rates will ad-versely affect the fair value of an investment. Generally, the longer the maturity of an investment, the greater the sensitivity of its fair value to changes in market interest rates. As a means of limiting its exposure to fair value losses arising from rising interest rates, the City’s investment policy limits its entire general investment portfolio to maturities of less than five years, unless a specific investment is tied to a particular cash flow need and is specifically approved by City Council. Investment in corporate debt securities are further limited (commercial paper – 270 days, medium term corporate notes – 5 years, corporate bonds – 5 years). Maturities are also limited for repurchase agreements (7 days), time certificates of depos-it (1 year), negotiable certificates of deposit (36 months) and bankers’ ac-ceptances (180 days).
Credit Risk
Credit risk is the risk that an issuer of an investment will not fulfill its ob-ligation to the holder of the investment. The City mitigates its credit risk generally by following its three primary investment objectives, in order, of safety, liquidity and yield. The California Government Code generally limits allowable investments to those classes of investments with lower risk (and therefore lower yields). The City’s investment policy further re-stricts these investments to the highest quality within a category, excludes certain otherwise allowable investments as not meeting the City’s liquidity requirement and limits the portion of the total general portfolio for certain investment types. Credit risk is measured by the assignment of a rating by a nationally recognized statistical rating organization. Presented below is the minimum rating required by the California Government Code, the City’s investment policy, and debt agreements, and the actual rating as of year end for each investment type.
June 30, 2013 Business- Business-Governmental type Government-wide Fiduciary Governmental type
Activities Activities Subtotal Funds Total Activities Activities Total TotalMajor funds:
General $ 96,527,432 — 96,527,432 — 96,527,432 — — — 96,527,432Infrastructure Capital Projects 18,637,716 — 18,637,716 — 18,637,716 — — — 18,637,716Water Enterprise — 23,741,427 23,741,427 — 23,741,427 — 5,772,807 5,772,807 29,514,234Parking Facilities Enterprise — 30,661,774 30,661,774 — 30,661,774 — 2,359,387 2,359,387 33,021,161Solid Waste Enterprise — 13,145,962 13,145,962 — 13,145,962 — — — 13,145,962Wastewater Enterprise — 27,178,290 27,178,290 — 27,178,290 — 1,623,750 1,623,750 28,802,040Stormwater Enterprise — 1,433,885 1,433,885 — 1,433,885 — — — 1,433,885Parking Authority
Fiduciary funds: — — — — — — — — — Community Charitable Foundation — 4,944,614 4,944,614 419,734 5,364,348 — — — 5,364,348
115,165,148 101,105,952 216,271,100 419,734 216,690,834 — 9,755,944 9,755,944 226,446,778Other governmental funds: 31,325,638 — 31,325,638 — 31,325,638 273,827 — 273,827 31,599,465
Total fund type 146,490,786 101,105,952 247,596,738 419,734 248,016,472 273,827 9,755,944 10,029,771 258,046,243Internal service funds: 147,662,412 — 147,662,412 — 147,662,412 2,314,662 — 2,314,662 149,977,074
Total $ 294,153,198 101,105,952 395,259,150 419,734 395,678,884 2,588,489 9,755,944 12,344,433 408,023,317
Components of cash and investments:Cash in demand deposits $ 124,247,088 419,734 124,666,822 — 124,666,822Change and petty cash funds 14,559 — 14,559 — 14,559Pooled investments 270,997,503 — 270,997,503 273,827 271,271,330Investments with fiscal agents — — — 12,070,606 12,070,606
Total cash and investments $ 395,259,150 419,734 395,678,884 12,344,433 408,023,317
Unrestricted Cash and Investments Restricted Cash and Investments
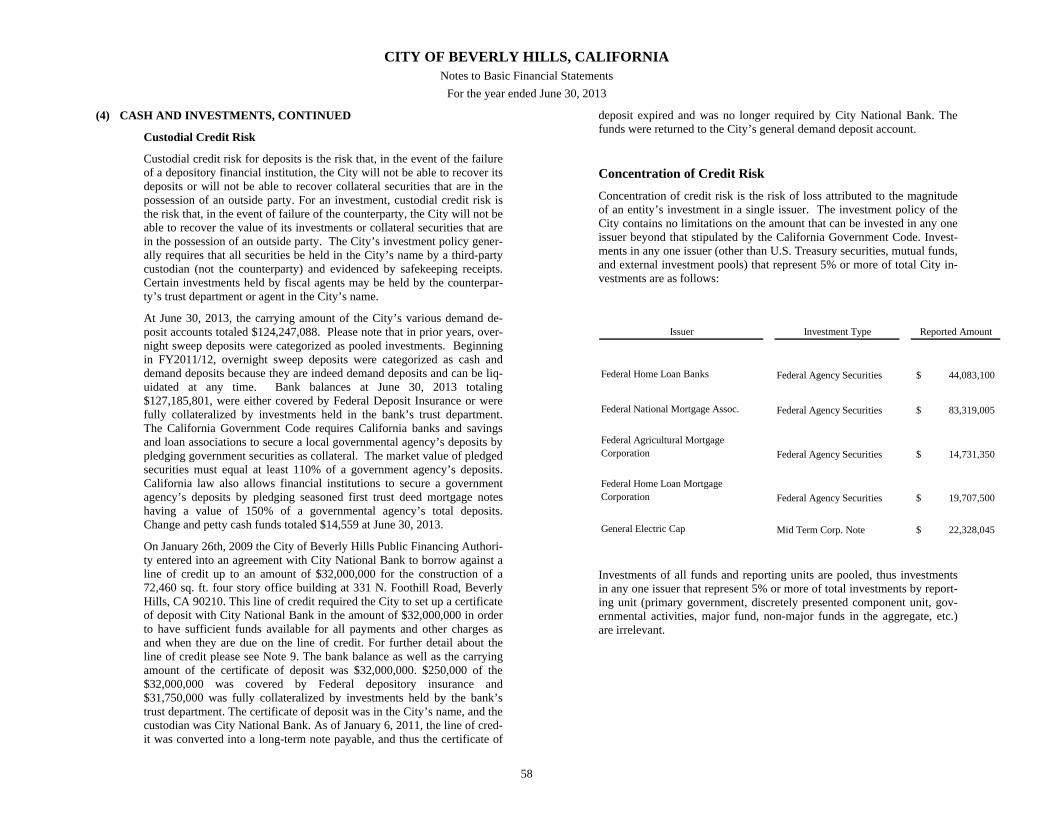
CITY OF BEVERLY HILLS, CALIFORNIA Notes to Basic Financial Statements
For the year ended June 30, 2013
58
(4) CASH AND INVESTMENTS, CONTINUED
Custodial Credit Risk
Custodial credit risk for deposits is the risk that, in the event of the failure of a depository financial institution, the City will not be able to recover its deposits or will not be able to recover collateral securities that are in the possession of an outside party. For an investment, custodial credit risk is the risk that, in the event of failure of the counterparty, the City will not be able to recover the value of its investments or collateral securities that are in the possession of an outside party. The City’s investment policy gener-ally requires that all securities be held in the City’s name by a third-party custodian (not the counterparty) and evidenced by safekeeping receipts. Certain investments held by fiscal agents may be held by the counterpar-ty’s trust department or agent in the City’s name.
At June 30, 2013, the carrying amount of the City’s various demand de-posit accounts totaled $124,247,088. Please note that in prior years, over-night sweep deposits were categorized as pooled investments. Beginning in FY2011/12, overnight sweep deposits were categorized as cash and demand deposits because they are indeed demand deposits and can be liq-uidated at any time. Bank balances at June 30, 2013 totaling $127,185,801, were either covered by Federal Deposit Insurance or were fully collateralized by investments held in the bank’s trust department. The California Government Code requires California banks and savings and loan associations to secure a local governmental agency’s deposits by pledging government securities as collateral. The market value of pledged securities must equal at least 110% of a government agency’s deposits. California law also allows financial institutions to secure a government agency’s deposits by pledging seasoned first trust deed mortgage notes having a value of 150% of a governmental agency’s total deposits. Change and petty cash funds totaled $14,559 at June 30, 2013.
On January 26th, 2009 the City of Beverly Hills Public Financing Authori-ty entered into an agreement with City National Bank to borrow against a line of credit up to an amount of $32,000,000 for the construction of a 72,460 sq. ft. four story office building at 331 N. Foothill Road, Beverly Hills, CA 90210. This line of credit required the City to set up a certificate of deposit with City National Bank in the amount of $32,000,000 in order to have sufficient funds available for all payments and other charges as and when they are due on the line of credit. For further detail about the line of credit please see Note 9. The bank balance as well as the carrying amount of the certificate of deposit was $32,000,000. $250,000 of the $32,000,000 was covered by Federal depository insurance and $31,750,000 was fully collateralized by investments held by the bank’s trust department. The certificate of deposit was in the City’s name, and the custodian was City National Bank. As of January 6, 2011, the line of cred-it was converted into a long-term note payable, and thus the certificate of
deposit expired and was no longer required by City National Bank. The funds were returned to the City’s general demand deposit account.
Concentration of Credit Risk
Concentration of credit risk is the risk of loss attributed to the magnitude of an entity’s investment in a single issuer. The investment policy of the City contains no limitations on the amount that can be invested in any one issuer beyond that stipulated by the California Government Code. Invest-ments in any one issuer (other than U.S. Treasury securities, mutual funds, and external investment pools) that represent 5% or more of total City in-vestments are as follows:
Investments of all funds and reporting units are pooled, thus investments in any one issuer that represent 5% or more of total investments by report-ing unit (primary government, discretely presented component unit, gov-ernmental activities, major fund, non-major funds in the aggregate, etc.) are irrelevant.
Issuer Investment Type Reported Amount
Federal Home Loan Banks Federal Agency Securities 44,083,100$
Federal National Mortgage Assoc. Federal Agency Securities 83,319,005$
Federal Agricultural Mortgage Corporation Federal Agency Securities 14,731,350$
Federal Home Loan Mortgage Corporation Federal Agency Securities 19,707,500$
General Electric Cap Mid Term Corp. Note 22,328,045$
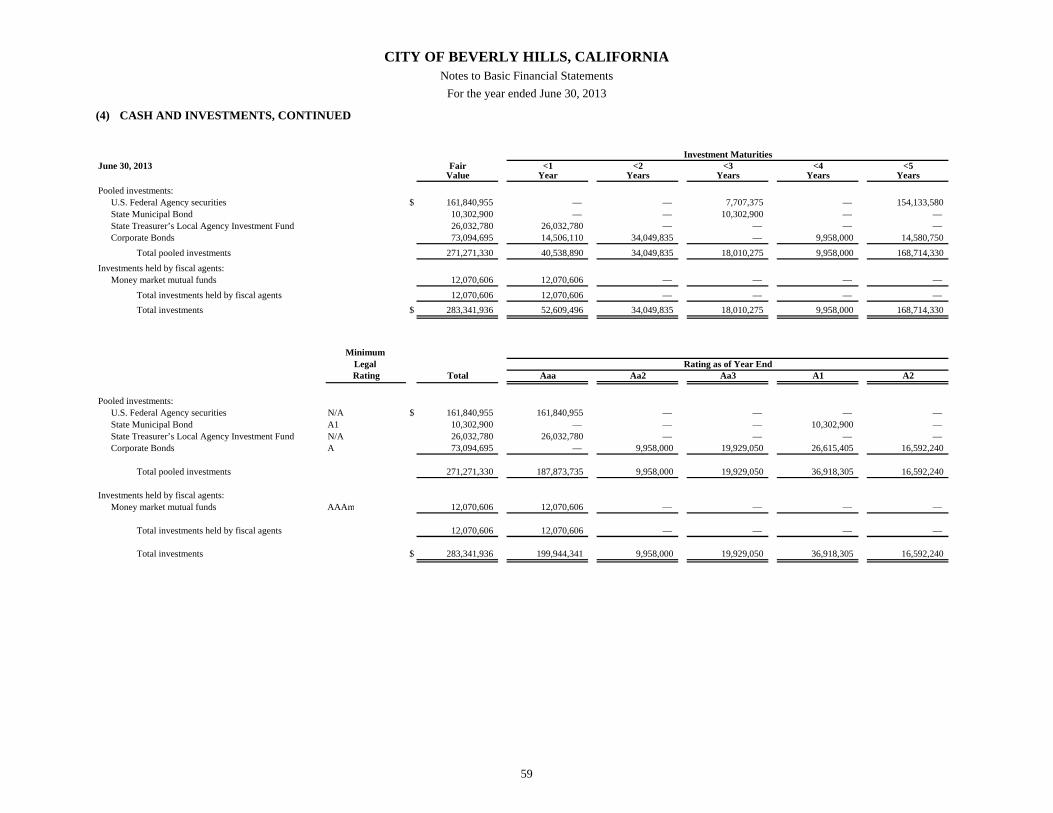
CITY OF BEVERLY HILLS, CALIFORNIA Notes to Basic Financial Statements
For the year ended June 30, 2013
59
(4) CASH AND INVESTMENTS, CONTINUED
June 30, 2013 Fair <1 <2 <3 <4 <5Value Year Years Years Years Years
Pooled investments:U.S. Federal Agency securities $ 161,840,955 — — 7,707,375 — 154,133,580State Municipal Bond 10,302,900 — — 10,302,900 — — State Treasurer’s Local Agency Investment Fund 26,032,780 26,032,780 — — — — Corporate Bonds 73,094,695 14,506,110 34,049,835 — 9,958,000 14,580,750
Total pooled investments 271,271,330 40,538,890 34,049,835 18,010,275 9,958,000 168,714,330Investments held by fiscal agents:
Money market mutual funds 12,070,606 12,070,606 — — — — Total investments held by fiscal agents 12,070,606 12,070,606 — — — — Total investments $ 283,341,936 52,609,496 34,049,835 18,010,275 9,958,000 168,714,330
Minimum Legal Rating Total Aaa Aa2 Aa3 A1 A2
Pooled investments:U.S. Federal Agency securities N/A $ 161,840,955 161,840,955 — — — — State Municipal Bond A1 10,302,900 — — — 10,302,900 — State Treasurer’s Local Agency Investment Fund N/A 26,032,780 26,032,780 — — — — Corporate Bonds A 73,094,695 — 9,958,000 19,929,050 26,615,405 16,592,240
Total pooled investments 271,271,330 187,873,735 9,958,000 19,929,050 36,918,305 16,592,240
Investments held by fiscal agents:Money market mutual funds AAAm 12,070,606 12,070,606 — — — —
Total investments held by fiscal agents 12,070,606 12,070,606 — — — —
Total investments $ 283,341,936 199,944,341 9,958,000 19,929,050 36,918,305 16,592,240
Investment Maturities
Rating as of Year End
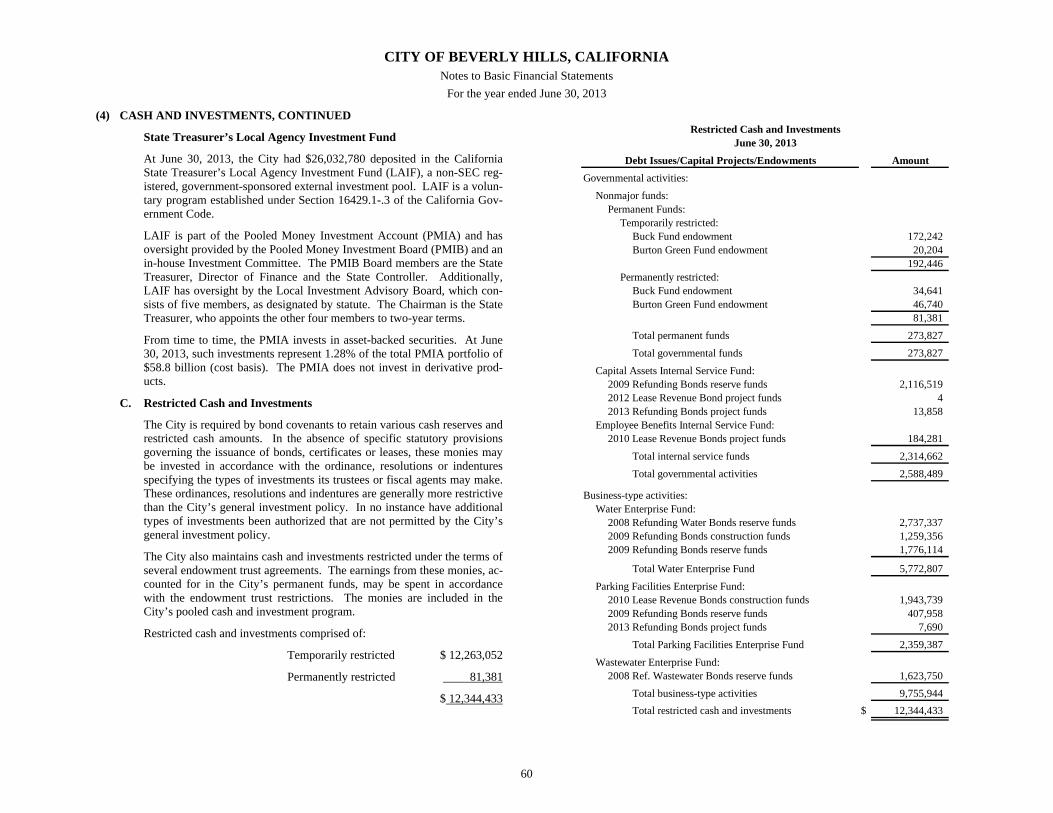
CITY OF BEVERLY HILLS, CALIFORNIA Notes to Basic Financial Statements
For the year ended June 30, 2013
60
(4) CASH AND INVESTMENTS, CONTINUED
State Treasurer’s Local Agency Investment Fund
At June 30, 2013, the City had $26,032,780 deposited in the California State Treasurer’s Local Agency Investment Fund (LAIF), a non-SEC reg-istered, government-sponsored external investment pool. LAIF is a volun-tary program established under Section 16429.1-.3 of the California Gov-ernment Code.
LAIF is part of the Pooled Money Investment Account (PMIA) and has oversight provided by the Pooled Money Investment Board (PMIB) and an in-house Investment Committee. The PMIB Board members are the State Treasurer, Director of Finance and the State Controller. Additionally, LAIF has oversight by the Local Investment Advisory Board, which con-sists of five members, as designated by statute. The Chairman is the State Treasurer, who appoints the other four members to two-year terms.
From time to time, the PMIA invests in asset-backed securities. At June 30, 2013, such investments represent 1.28% of the total PMIA portfolio of $58.8 billion (cost basis). The PMIA does not invest in derivative prod-ucts.
C. Restricted Cash and Investments
The City is required by bond covenants to retain various cash reserves and restricted cash amounts. In the absence of specific statutory provisions governing the issuance of bonds, certificates or leases, these monies may be invested in accordance with the ordinance, resolutions or indentures specifying the types of investments its trustees or fiscal agents may make. These ordinances, resolutions and indentures are generally more restrictive than the City’s general investment policy. In no instance have additional types of investments been authorized that are not permitted by the City’s general investment policy.
The City also maintains cash and investments restricted under the terms of several endowment trust agreements. The earnings from these monies, ac-counted for in the City’s permanent funds, may be spent in accordance with the endowment trust restrictions. The monies are included in the City’s pooled cash and investment program.
Restricted cash and investments comprised of:
Temporarily restricted $ 12,263,052
Permanently restricted 81,381
$ 12,344,433
AmountGovernmental activities:
Nonmajor funds:Permanent Funds:
Temporarily restricted:Buck Fund endowment 172,242Burton Green Fund endowment 20,204
192,446Permanently restricted:
Buck Fund endowment 34,641Burton Green Fund endowment 46,740
81,381Total permanent funds 273,827
Total governmental funds 273,827Capital Assets Internal Service Fund:
2009 Refunding Bonds reserve funds 2,116,5192012 Lease Revenue Bond project funds 42013 Refunding Bonds project funds 13,858
Employee Benefits Internal Service Fund:2010 Lease Revenue Bonds project funds 184,281
Total internal service funds 2,314,662Total governmental activities 2,588,489
Business-type activities:Water Enterprise Fund:
2008 Refunding Water Bonds reserve funds 2,737,3372009 Refunding Bonds construction funds 1,259,3562009 Refunding Bonds reserve funds 1,776,114
Total Water Enterprise Fund 5,772,807Parking Facilities Enterprise Fund:
2010 Lease Revenue Bonds construction funds 1,943,7392009 Refunding Bonds reserve funds 407,9582013 Refunding Bonds project funds 7,690
Total Parking Facilities Enterprise Fund 2,359,387
Wastewater Enterprise Fund:2008 Ref. Wastewater Bonds reserve funds 1,623,750
Total business-type activities 9,755,944Total restricted cash and investments $ 12,344,433
Debt Issues/Capital Projects/Endowments
Restricted Cash and InvestmentsJune 30, 2013
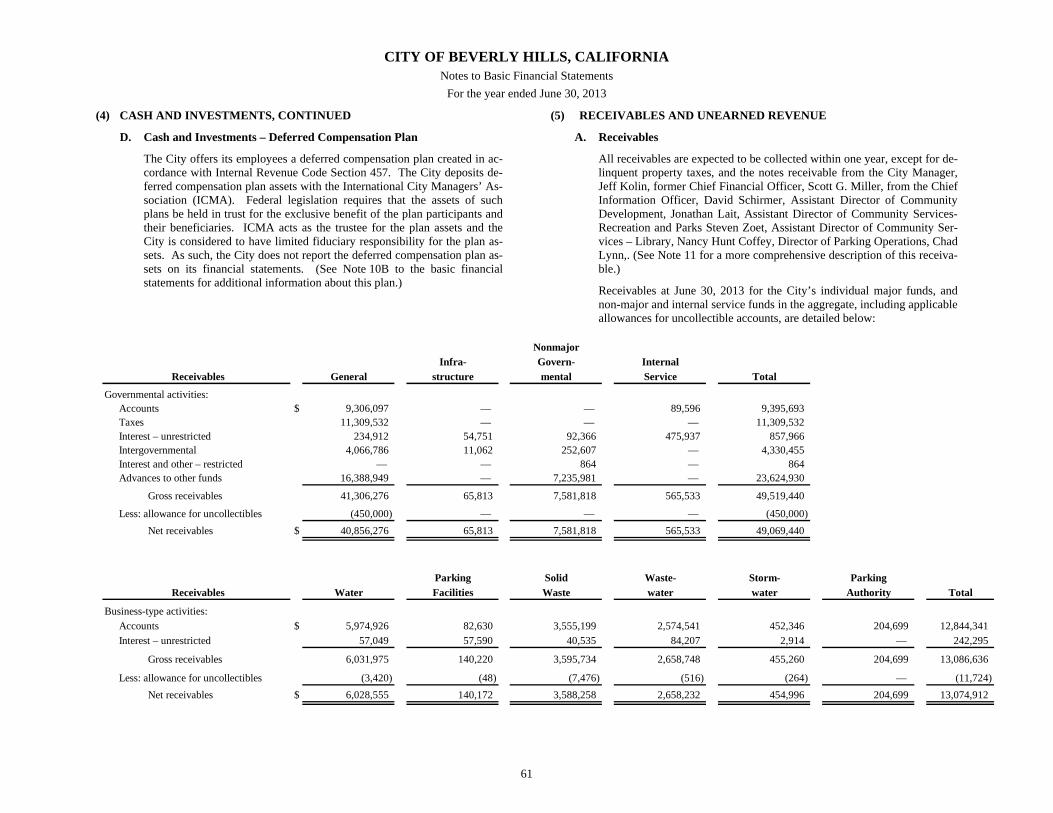
CITY OF BEVERLY HILLS, CALIFORNIA Notes to Basic Financial Statements
For the year ended June 30, 2013
61
(4) CASH AND INVESTMENTS, CONTINUED
D. Cash and Investments – Deferred Compensation Plan
The City offers its employees a deferred compensation plan created in ac-cordance with Internal Revenue Code Section 457. The City deposits de-ferred compensation plan assets with the International City Managers’ As-sociation (ICMA). Federal legislation requires that the assets of such plans be held in trust for the exclusive benefit of the plan participants and their beneficiaries. ICMA acts as the trustee for the plan assets and the City is considered to have limited fiduciary responsibility for the plan as-sets. As such, the City does not report the deferred compensation plan as-sets on its financial statements. (See Note 10B to the basic financial statements for additional information about this plan.)
(5) RECEIVABLES AND UNEARNED REVENUE
A. Receivables
All receivables are expected to be collected within one year, except for de-linquent property taxes, and the notes receivable from the City Manager, Jeff Kolin, former Chief Financial Officer, Scott G. Miller, from the Chief Information Officer, David Schirmer, Assistant Director of Community Development, Jonathan Lait, Assistant Director of Community Services- Recreation and Parks Steven Zoet, Assistant Director of Community Ser-vices – Library, Nancy Hunt Coffey, Director of Parking Operations, Chad Lynn,. (See Note 11 for a more comprehensive description of this receiva-ble.)
Receivables at June 30, 2013 for the City’s individual major funds, and non-major and internal service funds in the aggregate, including applicable allowances for uncollectible accounts, are detailed below:
NonmajorInfra- Govern- Internal
General structure mental Service Total
Governmental activities:Accounts $ 9,306,097 — — 89,596 9,395,693Taxes 11,309,532 — — — 11,309,532Interest – unrestricted 234,912 54,751 92,366 475,937 857,966Intergovernmental 4,066,786 11,062 252,607 — 4,330,455Interest and other – restricted — — 864 — 864Advances to other funds 16,388,949 — 7,235,981 — 23,624,930
Gross receivables 41,306,276 65,813 7,581,818 565,533 49,519,440
Less: allowance for uncollectibles (450,000) — — — (450,000)Net receivables $ 40,856,276 65,813 7,581,818 565,533 49,069,440
Parking Solid Waste- Storm- ParkingWater Facilities Waste water water Authority Total
Business-type activities:Accounts $ 5,974,926 82,630 3,555,199 2,574,541 452,346 204,699 12,844,341Interest – unrestricted 57,049 57,590 40,535 84,207 2,914 — 242,295
Gross receivables 6,031,975 140,220 3,595,734 2,658,748 455,260 204,699 13,086,636
Less: allowance for uncollectibles (3,420) (48) (7,476) (516) (264) — (11,724)Net receivables $ 6,028,555 140,172 3,588,258 2,658,232 454,996 204,699 13,074,912
Receivables
Receivables

CITY OF BEVERLY HILLS, CALIFORNIA Notes to Basic Financial Statements
For the year ended June 30, 2013
62
(5) RECEIVABLES AND UNEARNED REVENUE, CONTINUED
B. Deferred / Unearned Revenue
Governmental funds report deferred revenue in connection with receivables for revenues that are not considered to be available to liquidate liabilities of the current peri-od. All funds defer revenue recognition in connection with resources that have been received, but not yet earned. At June 30, 2013, the various components of deferred revenue and unearned revenue are as follows:
Unavailable Unearned Total Unearned
Governmental funds: Business-type activities:General fund: Utility accounts credit balances $ 232,197
Delinquent property taxes $ 2,265,696 — 2,265,696 Prepaid property leases 101,704Business tax — 515,957 515,957 Prepaid Post Office lease 475,898Interest receivable 145,721 — 145,721Prepaid Community Development $ 809,799
services — 433,883 433,883Federal grant revenue 23,138 — 23,138Prepaid recreation services — 1,219,234 1,219,234
General fund total 2,434,555 2,169,074 4,603,629Infrastructure capital projects fund 45,025 — 45,025Other governmental funds 344,978 — 344,978
Governmental funds total 2,824,558 2,169,074 4,993,632Internal Service funds total $ — 3,316,376 3,316,376
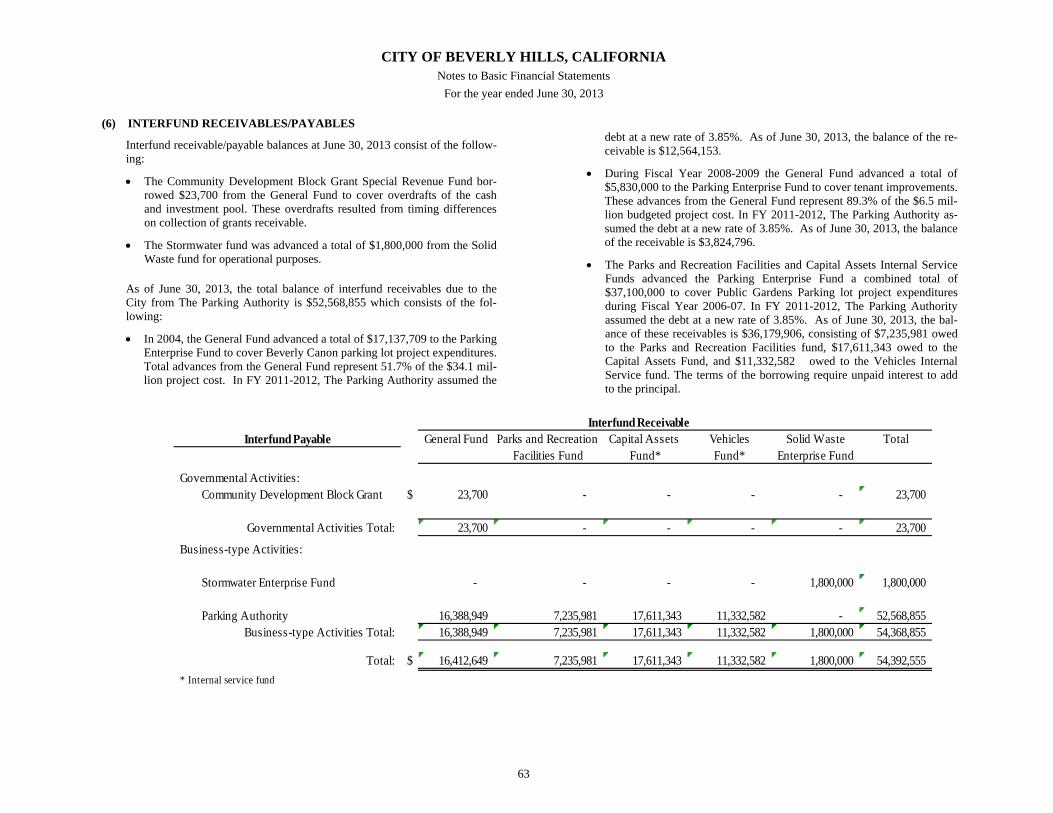
CITY OF BEVERLY HILLS, CALIFORNIA Notes to Basic Financial Statements
For the year ended June 30, 2013
63
(6) INTERFUND RECEIVABLES/PAYABLES
Interfund receivable/payable balances at June 30, 2013 consist of the follow-ing:
The Community Development Block Grant Special Revenue Fund bor-rowed $23,700 from the General Fund to cover overdrafts of the cash and investment pool. These overdrafts resulted from timing differences on collection of grants receivable.
The Stormwater fund was advanced a total of $1,800,000 from the Solid Waste fund for operational purposes.
As of June 30, 2013, the total balance of interfund receivables due to the City from The Parking Authority is $52,568,855 which consists of the fol-lowing:
In 2004, the General Fund advanced a total of $17,137,709 to the Parking Enterprise Fund to cover Beverly Canon parking lot project expenditures. Total advances from the General Fund represent 51.7% of the $34.1 mil-lion project cost. In FY 2011-2012, The Parking Authority assumed the
debt at a new rate of 3.85%. As of June 30, 2013, the balance of the re-ceivable is $12,564,153.
During Fiscal Year 2008-2009 the General Fund advanced a total of $5,830,000 to the Parking Enterprise Fund to cover tenant improvements. These advances from the General Fund represent 89.3% of the $6.5 mil-lion budgeted project cost. In FY 2011-2012, The Parking Authority as-sumed the debt at a new rate of 3.85%. As of June 30, 2013, the balance of the receivable is $3,824,796.
The Parks and Recreation Facilities and Capital Assets Internal Service Funds advanced the Parking Enterprise Fund a combined total of $37,100,000 to cover Public Gardens Parking lot project expenditures during Fiscal Year 2006-07. In FY 2011-2012, The Parking Authority assumed the debt at a new rate of 3.85%. As of June 30, 2013, the bal-ance of these receivables is $36,179,906, consisting of $7,235,981 owed to the Parks and Recreation Facilities fund, $17,611,343 owed to the Capital Assets Fund, and $11,332,582 owed to the Vehicles Internal Service fund. The terms of the borrowing require unpaid interest to add to the principal.
Interfund Payable General Fund Parks and Recreation Capital Assets Vehicles Solid Waste TotalFacilities Fund Fund* Fund* Enterprise Fund
Governmental Activities:Community Development Block Grant $ 23,700 - - - - 23,700
Governmental Activities Total: 23,700 - - - - 23,700
Business-type Activities:
Stormwater Enterprise Fund - - - - 1,800,000 1,800,000
Parking Authority 16,388,949 7,235,981 17,611,343 11,332,582 - 52,568,855 Business-type Activities Total: 16,388,949 7,235,981 17,611,343 11,332,582 1,800,000 54,368,855
Total: $ 16,412,649 7,235,981 17,611,343 11,332,582 1,800,000 54,392,555 * Internal service fund
Interfund Receivable
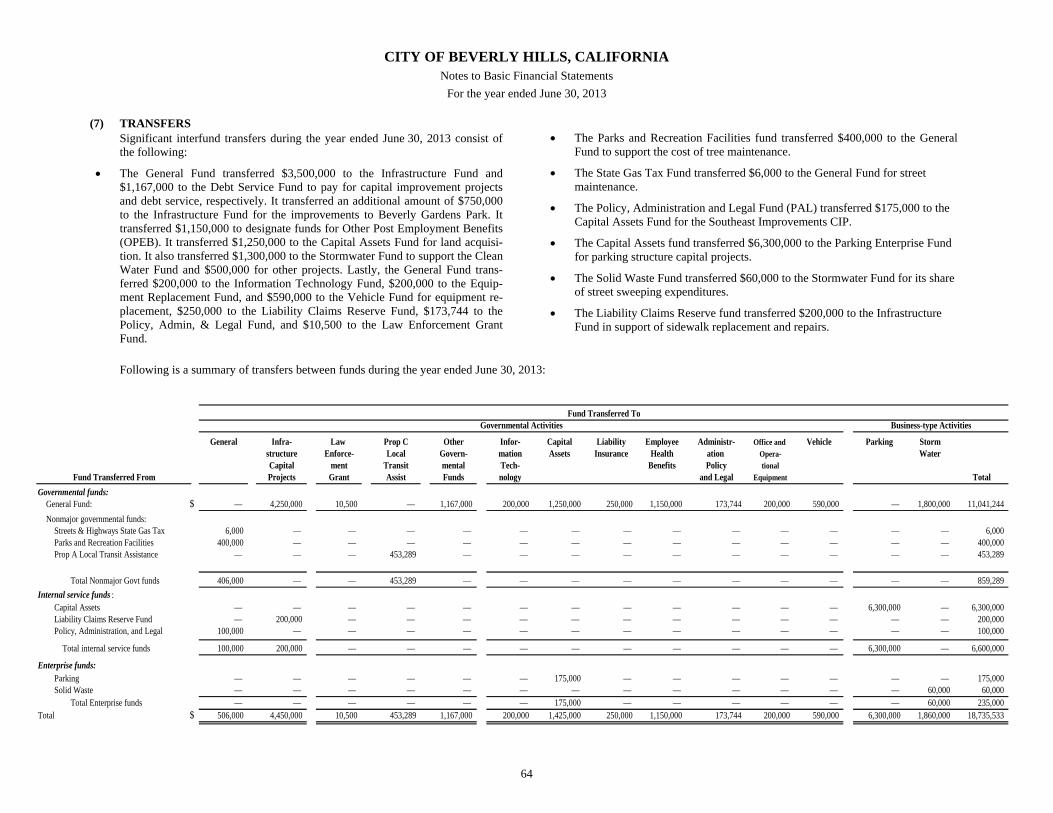
CITY OF BEVERLY HILLS, CALIFORNIA Notes to Basic Financial Statements
For the year ended June 30, 2013
64
(7) TRANSFERS Significant interfund transfers during the year ended June 30, 2013 consist of the following:
The General Fund transferred $3,500,000 to the Infrastructure Fund and $1,167,000 to the Debt Service Fund to pay for capital improvement projects and debt service, respectively. It transferred an additional amount of $750,000 to the Infrastructure Fund for the improvements to Beverly Gardens Park. It transferred $1,150,000 to designate funds for Other Post Employment Benefits (OPEB). It transferred $1,250,000 to the Capital Assets Fund for land acquisi-tion. It also transferred $1,300,000 to the Stormwater Fund to support the Clean Water Fund and $500,000 for other projects. Lastly, the General Fund trans-ferred $200,000 to the Information Technology Fund, $200,000 to the Equip-ment Replacement Fund, and $590,000 to the Vehicle Fund for equipment re-placement, $250,000 to the Liability Claims Reserve Fund, $173,744 to the Policy, Admin, & Legal Fund, and $10,500 to the Law Enforcement Grant Fund.
The Parks and Recreation Facilities fund transferred $400,000 to the General Fund to support the cost of tree maintenance.
The State Gas Tax Fund transferred $6,000 to the General Fund for street maintenance.
The Policy, Administration and Legal Fund (PAL) transferred $175,000 to the Capital Assets Fund for the Southeast Improvements CIP.
The Capital Assets fund transferred $6,300,000 to the Parking Enterprise Fund for parking structure capital projects.
The Solid Waste Fund transferred $60,000 to the Stormwater Fund for its share of street sweeping expenditures.
The Liability Claims Reserve fund transferred $200,000 to the Infrastructure Fund in support of sidewalk replacement and repairs.
Following is a summary of transfers between funds during the year ended June 30, 2013:
General Infra- Law Prop C Other Infor- Capital Liability Employee Administr- Office and Vehicle Parking Stormstructure Enforce- Local Govern- mation Assets Insurance Health ation Opera- WaterCapital ment Transit mental Tech- Benefits Policy tionalProjects Grant Assist Funds nology and Legal Equipment Total
Governmental funds:General Fund: $ — 4,250,000 10,500 — 1,167,000 200,000 1,250,000 250,000 1,150,000 173,744 200,000 590,000 — 1,800,000 11,041,244Nonmajor governmental funds:
Streets & Highways State Gas Tax 6,000 — — — — — — — — — — — — — 6,000Parks and Recreation Facilities 400,000 — — — — — — — — — — — — — 400,000Prop A Local Transit Assistance — — — 453,289 — — — — — — — — — — 453,289
Total Nonmajor Govt funds 406,000 — — 453,289 — — — — — — — — — — 859,289Internal service funds :
Capital Assets — — — — — — — — — — — — 6,300,000 — 6,300,000Liability Claims Reserve Fund — 200,000 — — — — — — — — — — — — 200,000Policy, Administration, and Legal 100,000 — — — — — — — — — — — — — 100,000
Total internal service funds 100,000 200,000 — — — — — — — — — — 6,300,000 — 6,600,000
Enterprise funds: Parking — — — — — — 175,000 — — — — — — — 175,000Solid Waste — — — — — — — — — — — — — 60,000 60,000
Total Enterprise funds — — — — — — 175,000 — — — — — — 60,000 235,000Total $ 506,000 4,450,000 10,500 453,289 1,167,000 200,000 1,425,000 250,000 1,150,000 173,744 200,000 590,000 6,300,000 1,860,000 18,735,533
Fund Transferred ToGovernmental Activities
Fund Transferred From
Business-type Activities
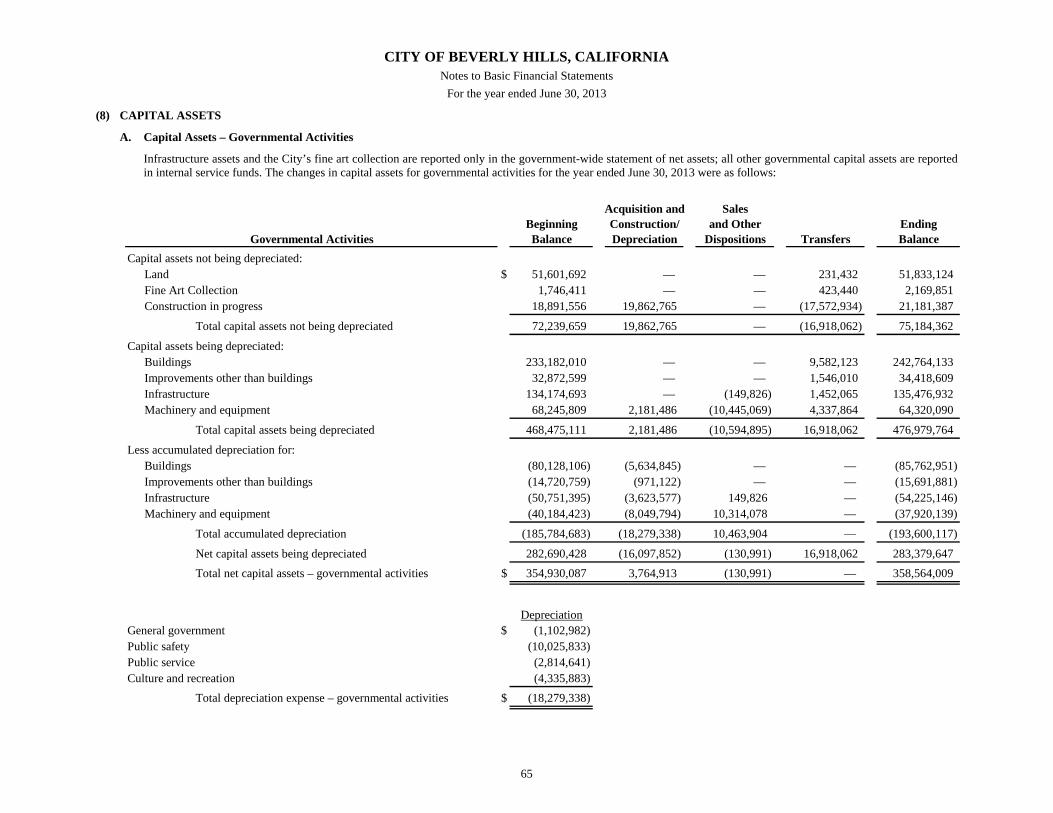
CITY OF BEVERLY HILLS, CALIFORNIA Notes to Basic Financial Statements
For the year ended June 30, 2013
65
(8) CAPITAL ASSETS
A. Capital Assets – Governmental Activities
Infrastructure assets and the City’s fine art collection are reported only in the government-wide statement of net assets; all other governmental capital assets are reported in internal service funds. The changes in capital assets for governmental activities for the year ended June 30, 2013 were as follows:
Acquisition and SalesBeginning Construction/ and Other EndingBalance Depreciation Dispositions Transfers Balance
Capital assets not being depreciated:Land $ 51,601,692 — — 231,432 51,833,124Fine Art Collection 1,746,411 — — 423,440 2,169,851Construction in progress 18,891,556 19,862,765 — (17,572,934) 21,181,387
Total capital assets not being depreciated 72,239,659 19,862,765 — (16,918,062) 75,184,362
Capital assets being depreciated:Buildings 233,182,010 — — 9,582,123 242,764,133Improvements other than buildings 32,872,599 — — 1,546,010 34,418,609Infrastructure 134,174,693 — (149,826) 1,452,065 135,476,932Machinery and equipment 68,245,809 2,181,486 (10,445,069) 4,337,864 64,320,090
Total capital assets being depreciated 468,475,111 2,181,486 (10,594,895) 16,918,062 476,979,764
Less accumulated depreciation for:Buildings (80,128,106) (5,634,845) — — (85,762,951)Improvements other than buildings (14,720,759) (971,122) — — (15,691,881)Infrastructure (50,751,395) (3,623,577) 149,826 — (54,225,146)Machinery and equipment (40,184,423) (8,049,794) 10,314,078 — (37,920,139)
Total accumulated depreciation (185,784,683) (18,279,338) 10,463,904 — (193,600,117)
Net capital assets being depreciated 282,690,428 (16,097,852) (130,991) 16,918,062 283,379,647Total net capital assets – governmental activities $ 354,930,087 3,764,913 (130,991) — 358,564,009
DepreciationGeneral government $ (1,102,982)Public safety (10,025,833)Public service (2,814,641)Culture and recreation (4,335,883)
Total depreciation expense – governmental activities $ (18,279,338)
Governmental Activities
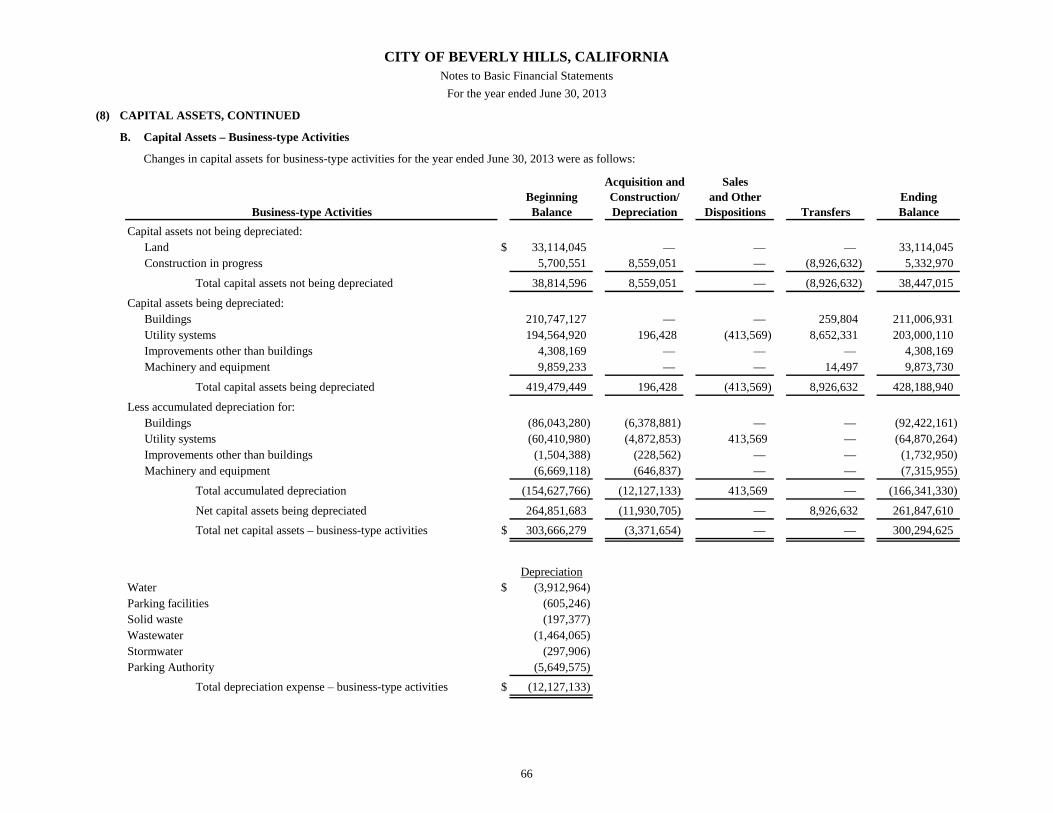
CITY OF BEVERLY HILLS, CALIFORNIA Notes to Basic Financial Statements
For the year ended June 30, 2013
66
(8) CAPITAL ASSETS, CONTINUED
B. Capital Assets – Business-type Activities
Changes in capital assets for business-type activities for the year ended June 30, 2013 were as follows:
Acquisition and SalesBeginning Construction/ and Other EndingBalance Depreciation Dispositions Transfers Balance
Capital assets not being depreciated:Land $ 33,114,045 — — — 33,114,045Construction in progress 5,700,551 8,559,051 — (8,926,632) 5,332,970
Total capital assets not being depreciated 38,814,596 8,559,051 — (8,926,632) 38,447,015
Capital assets being depreciated:Buildings 210,747,127 — — 259,804 211,006,931Utility systems 194,564,920 196,428 (413,569) 8,652,331 203,000,110Improvements other than buildings 4,308,169 — — — 4,308,169Machinery and equipment 9,859,233 — — 14,497 9,873,730
Total capital assets being depreciated 419,479,449 196,428 (413,569) 8,926,632 428,188,940
Less accumulated depreciation for:Buildings (86,043,280) (6,378,881) — — (92,422,161)Utility systems (60,410,980) (4,872,853) 413,569 — (64,870,264)Improvements other than buildings (1,504,388) (228,562) — — (1,732,950)Machinery and equipment (6,669,118) (646,837) — — (7,315,955)
Total accumulated depreciation (154,627,766) (12,127,133) 413,569 — (166,341,330)
Net capital assets being depreciated 264,851,683 (11,930,705) — 8,926,632 261,847,610Total net capital assets – business-type activities $ 303,666,279 (3,371,654) — — 300,294,625
DepreciationWater $ (3,912,964)Parking facilities (605,246)Solid waste (197,377)Wastewater (1,464,065)Stormwater (297,906)Parking Authority (5,649,575)
Total depreciation expense – business-type activities $ (12,127,133)
Business-type Activities
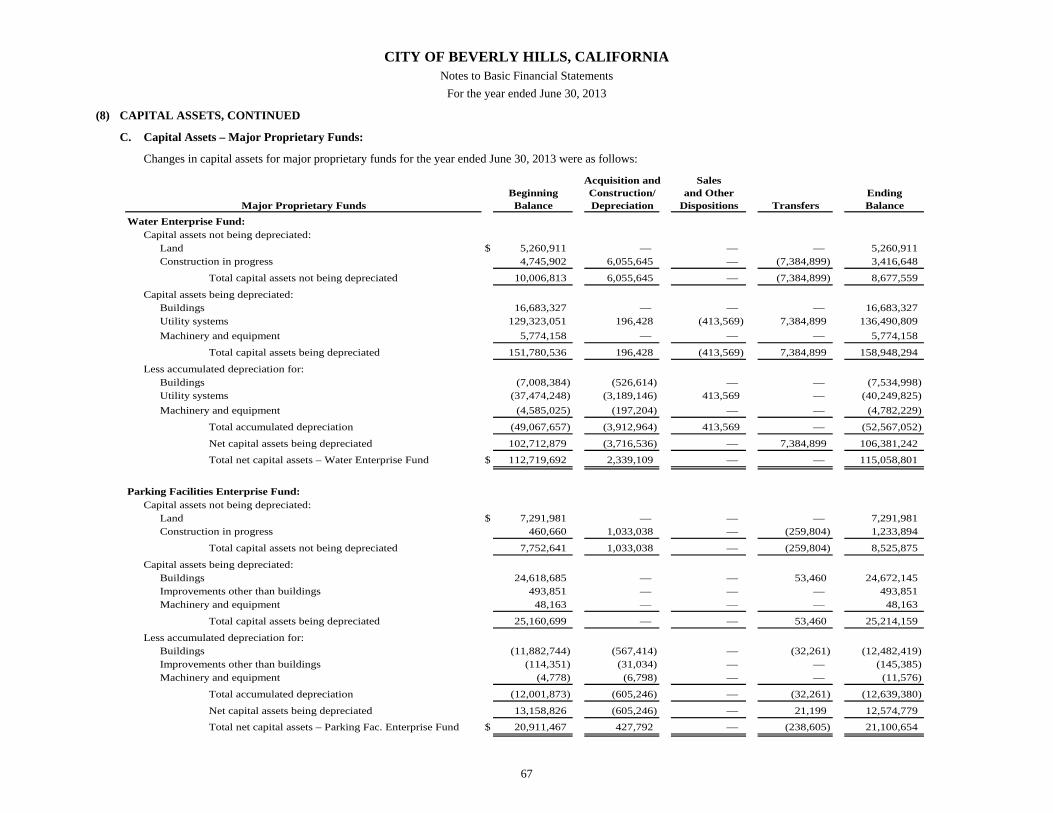
CITY OF BEVERLY HILLS, CALIFORNIA Notes to Basic Financial Statements
For the year ended June 30, 2013
67
(8) CAPITAL ASSETS, CONTINUED
C. Capital Assets – Major Proprietary Funds:
Changes in capital assets for major proprietary funds for the year ended June 30, 2013 were as follows:
Acquisition and SalesBeginning Construction/ and Other EndingBalance Depreciation Dispositions Transfers Balance
Water Enterprise Fund:Capital assets not being depreciated:
Land $ 5,260,911 — — — 5,260,911Construction in progress 4,745,902 6,055,645 — (7,384,899) 3,416,648
Total capital assets not being depreciated 10,006,813 6,055,645 — (7,384,899) 8,677,559
Capital assets being depreciated:Buildings 16,683,327 — — — 16,683,327Utility systems 129,323,051 196,428 (413,569) 7,384,899 136,490,809Machinery and equipment 5,774,158 — — — 5,774,158
Total capital assets being depreciated 151,780,536 196,428 (413,569) 7,384,899 158,948,294
Less accumulated depreciation for:Buildings (7,008,384) (526,614) — — (7,534,998)Utility systems (37,474,248) (3,189,146) 413,569 — (40,249,825)Machinery and equipment (4,585,025) (197,204) — — (4,782,229)
Total accumulated depreciation (49,067,657) (3,912,964) 413,569 — (52,567,052)
Net capital assets being depreciated 102,712,879 (3,716,536) — 7,384,899 106,381,242
Total net capital assets – Water Enterprise Fund $ 112,719,692 2,339,109 — — 115,058,801
Parking Facilities Enterprise Fund:Capital assets not being depreciated:
Land $ 7,291,981 — — — 7,291,981Construction in progress 460,660 1,033,038 — (259,804) 1,233,894
Total capital assets not being depreciated 7,752,641 1,033,038 — (259,804) 8,525,875
Capital assets being depreciated:Buildings 24,618,685 — — 53,460 24,672,145Improvements other than buildings 493,851 — — — 493,851Machinery and equipment 48,163 — — — 48,163
Total capital assets being depreciated 25,160,699 — — 53,460 25,214,159
Less accumulated depreciation for:Buildings (11,882,744) (567,414) — (32,261) (12,482,419)Improvements other than buildings (114,351) (31,034) — — (145,385)Machinery and equipment (4,778) (6,798) — — (11,576)
Total accumulated depreciation (12,001,873) (605,246) — (32,261) (12,639,380)
Net capital assets being depreciated 13,158,826 (605,246) — 21,199 12,574,779Total net capital assets – Parking Fac. Enterprise Fund $ 20,911,467 427,792 — (238,605) 21,100,654
Major Proprietary Funds
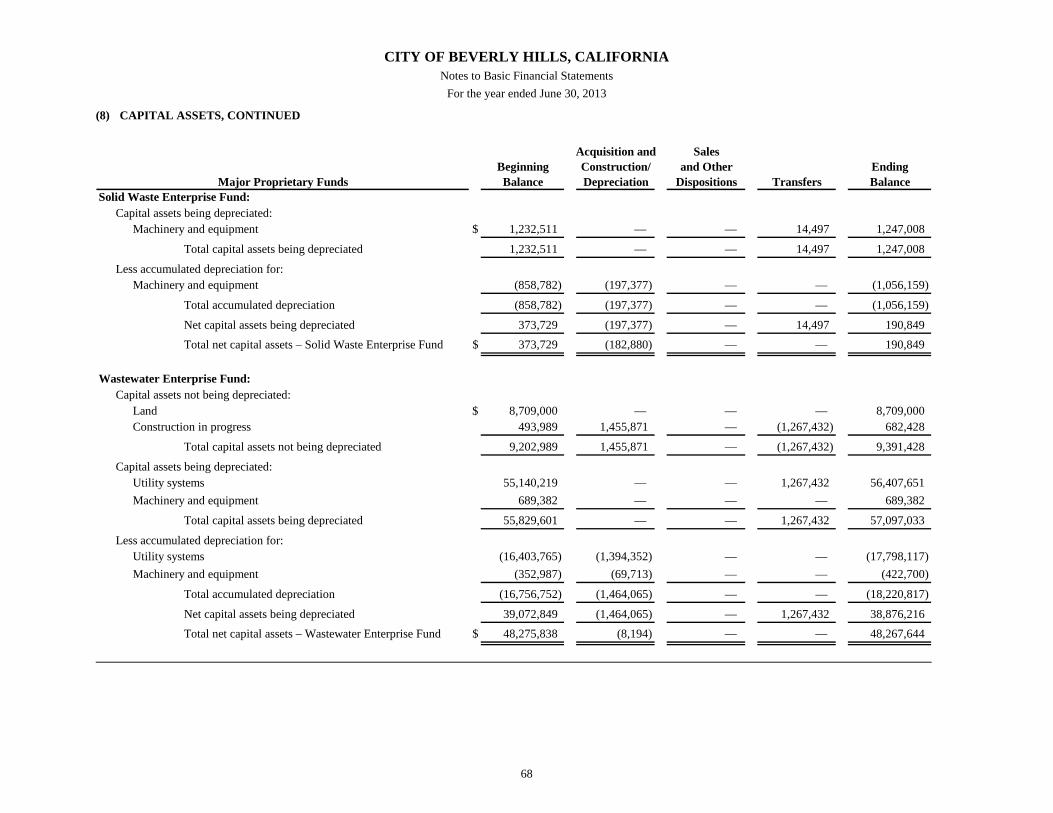
CITY OF BEVERLY HILLS, CALIFORNIA Notes to Basic Financial Statements
For the year ended June 30, 2013
68
(8) CAPITAL ASSETS, CONTINUED
Acquisition and SalesBeginning Construction/ and Other EndingBalance Depreciation Dispositions Transfers Balance
Solid Waste Enterprise Fund:Capital assets being depreciated:
Machinery and equipment $ 1,232,511 — — 14,497 1,247,008
Total capital assets being depreciated 1,232,511 — — 14,497 1,247,008
Less accumulated depreciation for:Machinery and equipment (858,782) (197,377) — — (1,056,159)
Total accumulated depreciation (858,782) (197,377) — — (1,056,159)
Net capital assets being depreciated 373,729 (197,377) — 14,497 190,849Total net capital assets – Solid Waste Enterprise Fund $ 373,729 (182,880) — — 190,849
Wastewater Enterprise Fund:Capital assets not being depreciated:
Land $ 8,709,000 — — — 8,709,000Construction in progress 493,989 1,455,871 — (1,267,432) 682,428
Total capital assets not being depreciated 9,202,989 1,455,871 — (1,267,432) 9,391,428
Capital assets being depreciated:Utility systems 55,140,219 — — 1,267,432 56,407,651Machinery and equipment 689,382 — — — 689,382
Total capital assets being depreciated 55,829,601 — — 1,267,432 57,097,033
Less accumulated depreciation for:Utility systems (16,403,765) (1,394,352) — — (17,798,117)Machinery and equipment (352,987) (69,713) — — (422,700)
Total accumulated depreciation (16,756,752) (1,464,065) — — (18,220,817)
Net capital assets being depreciated 39,072,849 (1,464,065) — 1,267,432 38,876,216Total net capital assets – Wastewater Enterprise Fund $ 48,275,838 (8,194) — — 48,267,644
Major Proprietary Funds
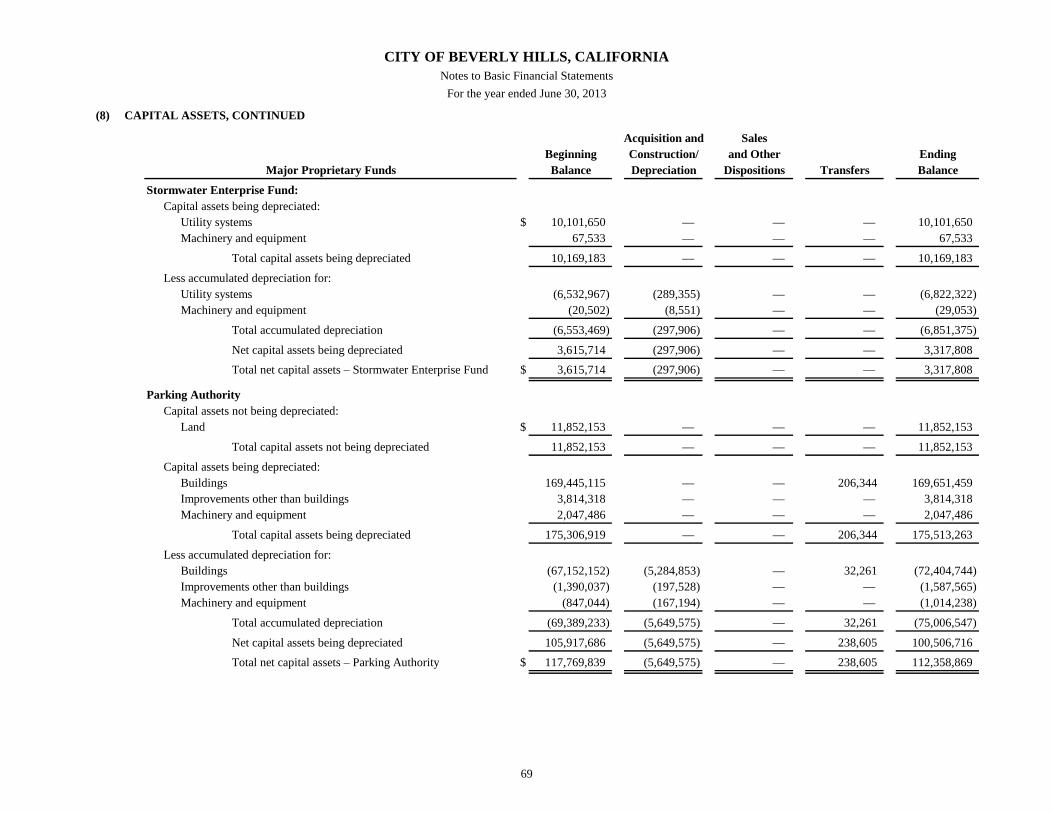
CITY OF BEVERLY HILLS, CALIFORNIA Notes to Basic Financial Statements
For the year ended June 30, 2013
69
(8) CAPITAL ASSETS, CONTINUED
Acquisition and SalesBeginning Construction/ and Other EndingBalance Depreciation Dispositions Transfers Balance
Stormwater Enterprise Fund:Capital assets being depreciated:
Utility systems $ 10,101,650 — — — 10,101,650Machinery and equipment 67,533 — — — 67,533
Total capital assets being depreciated 10,169,183 — — — 10,169,183
Less accumulated depreciation for:Utility systems (6,532,967) (289,355) — — (6,822,322)Machinery and equipment (20,502) (8,551) — — (29,053)
Total accumulated depreciation (6,553,469) (297,906) — — (6,851,375)
Net capital assets being depreciated 3,615,714 (297,906) — — 3,317,808
Total net capital assets – Stormwater Enterprise Fund $ 3,615,714 (297,906) — — 3,317,808
Parking AuthorityCapital assets not being depreciated:
Land $ 11,852,153 — — — 11,852,153
Total capital assets not being depreciated 11,852,153 — — — 11,852,153
Capital assets being depreciated:Buildings 169,445,115 — — 206,344 169,651,459Improvements other than buildings 3,814,318 — — — 3,814,318Machinery and equipment 2,047,486 — — — 2,047,486
Total capital assets being depreciated 175,306,919 — — 206,344 175,513,263
Less accumulated depreciation for:Buildings (67,152,152) (5,284,853) — 32,261 (72,404,744)Improvements other than buildings (1,390,037) (197,528) — — (1,587,565)Machinery and equipment (847,044) (167,194) — — (1,014,238)
Total accumulated depreciation (69,389,233) (5,649,575) — 32,261 (75,006,547)
Net capital assets being depreciated 105,917,686 (5,649,575) — 238,605 100,506,716
Total net capital assets – Parking Authority $ 117,769,839 (5,649,575) — 238,605 112,358,869
Major Proprietary Funds
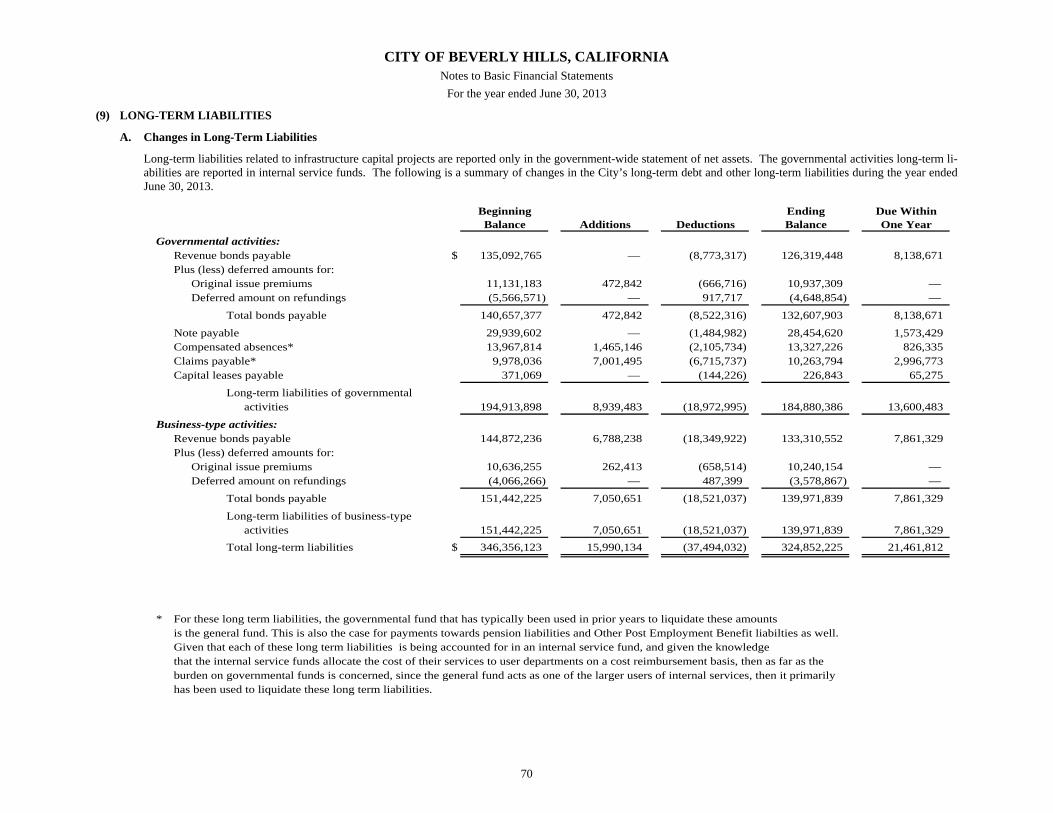
CITY OF BEVERLY HILLS, CALIFORNIA Notes to Basic Financial Statements
For the year ended June 30, 2013
70
(9) LONG-TERM LIABILITIES
A. Changes in Long-Term Liabilities
Long-term liabilities related to infrastructure capital projects are reported only in the government-wide statement of net assets. The governmental activities long-term li-abilities are reported in internal service funds. The following is a summary of changes in the City’s long-term debt and other long-term liabilities during the year ended June 30, 2013.
Beginning Ending Due WithinBalance Additions Deductions Balance One Year
Governmental activities:Revenue bonds payable $ 135,092,765 — (8,773,317) 126,319,448 8,138,671Plus (less) deferred amounts for:
Original issue premiums 11,131,183 472,842 (666,716) 10,937,309 — Deferred amount on refundings (5,566,571) — 917,717 (4,648,854) —
Total bonds payable 140,657,377 472,842 (8,522,316) 132,607,903 8,138,671
Note payable 29,939,602 — (1,484,982) 28,454,620 1,573,429Compensated absences* 13,967,814 1,465,146 (2,105,734) 13,327,226 826,335Claims payable* 9,978,036 7,001,495 (6,715,737) 10,263,794 2,996,773Capital leases payable 371,069 — (144,226) 226,843 65,275
Long-term liabilities of governmentalactivities 194,913,898 8,939,483 (18,972,995) 184,880,386 13,600,483
Business-type activities:Revenue bonds payable 144,872,236 6,788,238 (18,349,922) 133,310,552 7,861,329Plus (less) deferred amounts for:
Original issue premiums 10,636,255 262,413 (658,514) 10,240,154 — Deferred amount on refundings (4,066,266) — 487,399 (3,578,867) —
Total bonds payable 151,442,225 7,050,651 (18,521,037) 139,971,839 7,861,329
Long-term liabilities of business-typeactivities 151,442,225 7,050,651 (18,521,037) 139,971,839 7,861,329
Total long-term liabilities $ 346,356,123 15,990,134 (37,494,032) 324,852,225 21,461,812
* For these long term liabilities, the governmental fund that has typically been used in prior years to liquidate these amountsis the general fund. This is also the case for payments towards pension liabilities and Other Post Employment Benefit liabilties as well.Given that each of these long term liabilities is being accounted for in an internal service fund, and given the knowledge that the internal service funds allocate the cost of their services to user departments on a cost reimbursement basis, then as far as the burden on governmental funds is concerned, since the general fund acts as one of the larger users of internal services, then it primarily has been used to liquidate these long term liabilities.
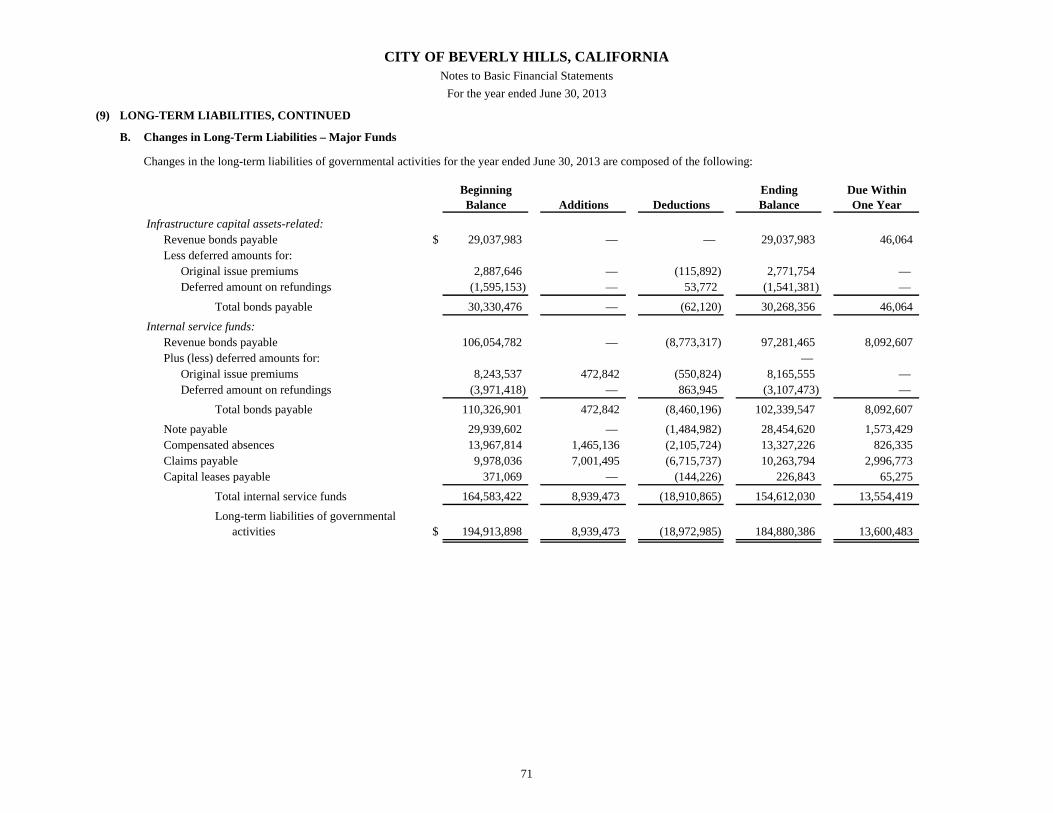
CITY OF BEVERLY HILLS, CALIFORNIA Notes to Basic Financial Statements
For the year ended June 30, 2013
71
(9) LONG-TERM LIABILITIES, CONTINUED
B. Changes in Long-Term Liabilities – Major Funds
Changes in the long-term liabilities of governmental activities for the year ended June 30, 2013 are composed of the following:
Beginning Ending Due WithinBalance Additions Deductions Balance One Year
Infrastructure capital assets-related:Revenue bonds payable $ 29,037,983 — — 29,037,983 46,064Less deferred amounts for:
Original issue premiums 2,887,646 — (115,892) 2,771,754 — Deferred amount on refundings (1,595,153) — 53,772 (1,541,381) —
Total bonds payable 30,330,476 — (62,120) 30,268,356 46,064
Internal service funds:Revenue bonds payable 106,054,782 — (8,773,317) 97,281,465 8,092,607Plus (less) deferred amounts for: —
Original issue premiums 8,243,537 472,842 (550,824) 8,165,555 — Deferred amount on refundings (3,971,418) — 863,945 (3,107,473) —
Total bonds payable 110,326,901 472,842 (8,460,196) 102,339,547 8,092,607
Note payable 29,939,602 — (1,484,982) 28,454,620 1,573,429Compensated absences 13,967,814 1,465,136 (2,105,724) 13,327,226 826,335Claims payable 9,978,036 7,001,495 (6,715,737) 10,263,794 2,996,773Capital leases payable 371,069 — (144,226) 226,843 65,275
Total internal service funds 164,583,422 8,939,473 (18,910,865) 154,612,030 13,554,419
Long-term liabilities of governmentalactivities $ 194,913,898 8,939,473 (18,972,985) 184,880,386 13,600,483
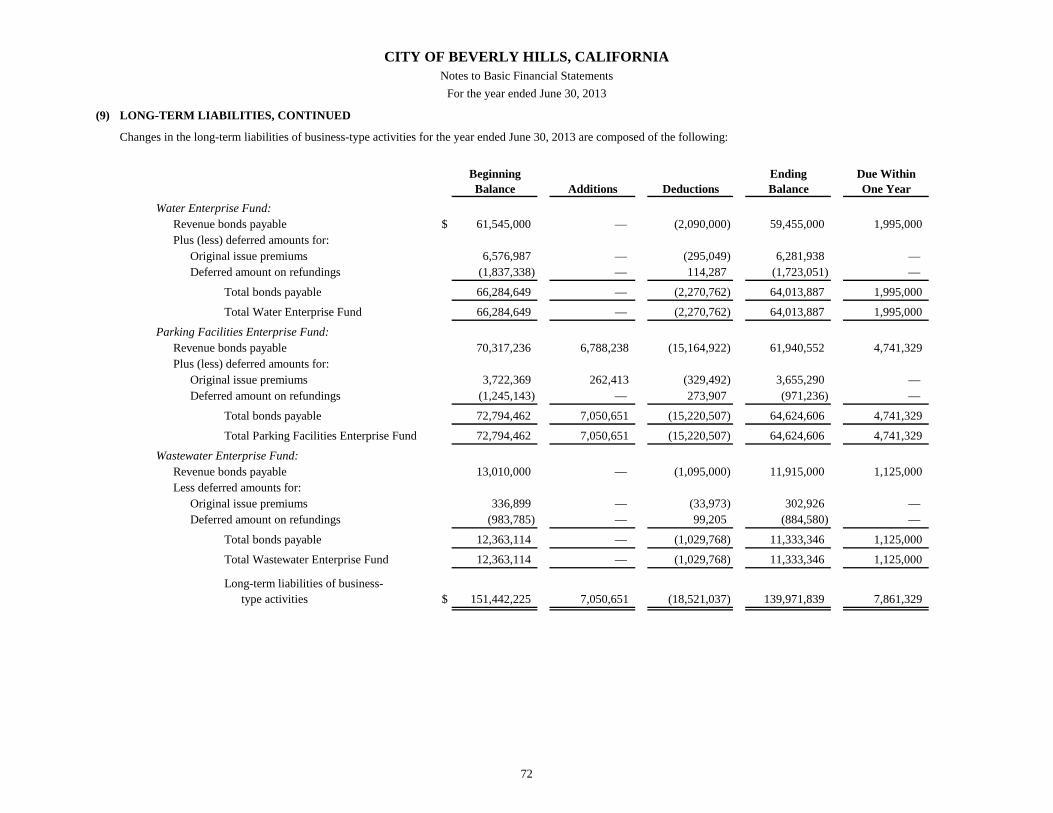
CITY OF BEVERLY HILLS, CALIFORNIA Notes to Basic Financial Statements
For the year ended June 30, 2013
72
(9) LONG-TERM LIABILITIES, CONTINUED
Changes in the long-term liabilities of business-type activities for the year ended June 30, 2013 are composed of the following:
Beginning Ending Due WithinBalance Additions Deductions Balance One Year
Water Enterprise Fund:Revenue bonds payable $ 61,545,000 — (2,090,000) 59,455,000 1,995,000Plus (less) deferred amounts for:
Original issue premiums 6,576,987 — (295,049) 6,281,938 — Deferred amount on refundings (1,837,338) — 114,287 (1,723,051) —
Total bonds payable 66,284,649 — (2,270,762) 64,013,887 1,995,000
Total Water Enterprise Fund 66,284,649 — (2,270,762) 64,013,887 1,995,000
Parking Facilities Enterprise Fund:Revenue bonds payable 70,317,236 6,788,238 (15,164,922) 61,940,552 4,741,329Plus (less) deferred amounts for:
Original issue premiums 3,722,369 262,413 (329,492) 3,655,290 — Deferred amount on refundings (1,245,143) — 273,907 (971,236) —
Total bonds payable 72,794,462 7,050,651 (15,220,507) 64,624,606 4,741,329
Total Parking Facilities Enterprise Fund 72,794,462 7,050,651 (15,220,507) 64,624,606 4,741,329
Wastewater Enterprise Fund:Revenue bonds payable 13,010,000 — (1,095,000) 11,915,000 1,125,000Less deferred amounts for:
Original issue premiums 336,899 — (33,973) 302,926 — Deferred amount on refundings (983,785) — 99,205 (884,580) —
Total bonds payable 12,363,114 — (1,029,768) 11,333,346 1,125,000
Total Wastewater Enterprise Fund 12,363,114 — (1,029,768) 11,333,346 1,125,000
Long-term liabilities of business-type activities $ 151,442,225 7,050,651 (18,521,037) 139,971,839 7,861,329

CITY OF BEVERLY HILLS, CALIFORNIA Notes to Basic Financial Statements
For the year ended June 30, 2013
73
(9) LONG-TERM LIABILITIES, CONTINUED
C. Bonds and Note Payable
The City’s bonds were issued primarily to finance or refinance capital fa-cilities. The 2012 Lease Revenue Bonds are reported only in the govern-ment-wide statements of net assets and activities; the balance of govern-mental activities debt issues are reported in the Capital Assets Internal Service Fund. Business-type activities debt issues are reported in the City’s enterprise funds. Several debt securities were issued for multiple purposes so the principal and related interest costs of the debt are allocated between the respective funds.
A summary of bonds outstanding at June 30, 2013 is as follows:
A description of individual bond issues follow:
Revenue Bonds 2008 Refunding Water Revenue Bonds - $30,735,000
Public Financing Authority, Water Revenue Bonds, issued March 2008, are due in annual installments ranging from $670,000 to $2,360,000 through June 1, 2024, with interest rates ranging from 3.00% to 5.00% payable semiannually June 1 and December 1. The Bonds are special limited obliga-tions of the Public Financing Authority and are primarily payable from installment payments from the City pursuant to an installment sale agreement dated April 1, 2008. The City’s obligation to make installment payments is solely payable from and se-cured by a pledge of net revenues of the Water En-
terprise Fund. The advance refunding resulted in an economic gain (difference between the present val-ue of the debt services payments on the old and new debt) of $ 389,918 and a reduction of total debt ser-vice payments of $601,184. The 2008 WRBs were issued in part to advance refunding of the 1998 WRBs, which were in turn issued for multiple pur-poses. The non-refunding portion was issued for acquiring an existing water treatment plant.
$ 22,180,000 Plus original issue premium 650,514
Less deferred amount on refunding (570,472) Net bonds outstanding 22,260,042
2008 Refunding Wastewater Revenue Bonds - $17,035,000 Public Financing Authority, Wastewater Revenue Bonds, issued April 2009, are due in annual install-ments ranging from $910,000 to $1,555,000 through June 1, 2022, with interest rates ranging from 2.40% to 5.00% payable semiannually June 1 and Decem-ber 1. The Bonds are special limited obligations of the Public Financing Authority and are primarily payable from installment payments from the City pursuant to an installment sale agreement dated May 1, 2008. The City’s obligation to make installment payments is solely payable from and secured by a pledge of net revenues of the Wastewater Enterprise Fund. The ad-vance refunding resulted in an economic gain (differ-ence between the present value of the debt services payments on the old and new debt) of $793,750 and a reduction of total debt service payments of $1,161,564. The 2008 WWRBs were issued to ad-vance refunding of the 1998 WWRBs, which were in turn issued for multiple purposes. $ 11,915,000
Plus original issue premium 302,926 Less deferred amount on refunding (884,580)
Net bonds outstanding 11,333,346
Govern- Business-mental type
Activities Activities TotalRevenue bonds:
2013 Refunding Lease $ 12,231,762 6,788,238 19,020,0002012 Lease Revenue 43,114,779 13,620,221 56,735,0002012 Water Revenue — 37,275,000 37,275,0002010 Lease Revenue 16,761,404 34,658,596 51,420,0002009 Refunding Lease 54,211,503 6,873,497 61,085,0002008 Water Revenue — 22,180,000 22,180,0002008 Wastewater Revenue — 11,915,000 11,915,000Original issue premium 10,937,309 10,240,154 21,177,463Deferred amount on refunding (4,648,854) (3,578,867) (8,227,721)
Total revenue bonds 132,607,903 139,971,839 272,579,742Total bonds $ 132,607,903 139,971,839 272,579,742
Debt Issue
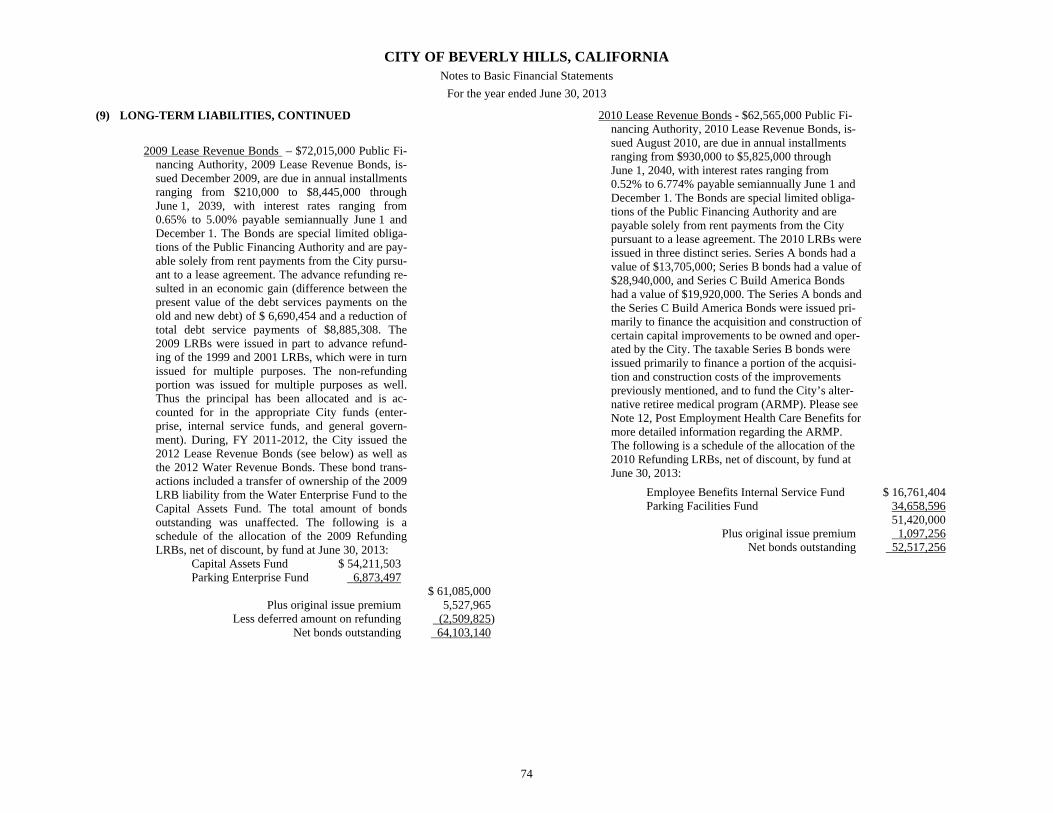
CITY OF BEVERLY HILLS, CALIFORNIA Notes to Basic Financial Statements
For the year ended June 30, 2013
74
(9) LONG-TERM LIABILITIES, CONTINUED
2009 Lease Revenue Bonds – $72,015,000 Public Fi-
nancing Authority, 2009 Lease Revenue Bonds, is-sued December 2009, are due in annual installments ranging from $210,000 to $8,445,000 through June 1, 2039, with interest rates ranging from 0.65% to 5.00% payable semiannually June 1 and December 1. The Bonds are special limited obliga-tions of the Public Financing Authority and are pay-able solely from rent payments from the City pursu-ant to a lease agreement. The advance refunding re-sulted in an economic gain (difference between the present value of the debt services payments on the old and new debt) of $ 6,690,454 and a reduction of total debt service payments of $8,885,308. The 2009 LRBs were issued in part to advance refund-ing of the 1999 and 2001 LRBs, which were in turn issued for multiple purposes. The non-refunding portion was issued for multiple purposes as well. Thus the principal has been allocated and is ac-counted for in the appropriate City funds (enter-prise, internal service funds, and general govern-ment). During, FY 2011-2012, the City issued the 2012 Lease Revenue Bonds (see below) as well as the 2012 Water Revenue Bonds. These bond trans-actions included a transfer of ownership of the 2009 LRB liability from the Water Enterprise Fund to the Capital Assets Fund. The total amount of bonds outstanding was unaffected. The following is a schedule of the allocation of the 2009 Refunding LRBs, net of discount, by fund at June 30, 2013:
Capital Assets Fund $ 54,211,503 Parking Enterprise Fund 6,873,497 $ 61,085,000 Plus original issue premium 5,527,965 Less deferred amount on refunding (2,509,825) Net bonds outstanding 64,103,140
2010 Lease Revenue Bonds - $62,565,000 Public Fi-nancing Authority, 2010 Lease Revenue Bonds, is-sued August 2010, are due in annual installments ranging from $930,000 to $5,825,000 through June 1, 2040, with interest rates ranging from 0.52% to 6.774% payable semiannually June 1 and December 1. The Bonds are special limited obliga-tions of the Public Financing Authority and are payable solely from rent payments from the City pursuant to a lease agreement. The 2010 LRBs were issued in three distinct series. Series A bonds had a value of $13,705,000; Series B bonds had a value of $28,940,000, and Series C Build America Bonds had a value of $19,920,000. The Series A bonds and the Series C Build America Bonds were issued pri-marily to finance the acquisition and construction of certain capital improvements to be owned and oper-ated by the City. The taxable Series B bonds were issued primarily to finance a portion of the acquisi-tion and construction costs of the improvements previously mentioned, and to fund the City’s alter-native retiree medical program (ARMP). Please see Note 12, Post Employment Health Care Benefits for more detailed information regarding the ARMP. The following is a schedule of the allocation of the 2010 Refunding LRBs, net of discount, by fund at June 30, 2013:
Employee Benefits Internal Service Fund $ 16,761,404 Parking Facilities Fund 34,658,596 51,420,000 Plus original issue premium 1,097,256 Net bonds outstanding 52,517,256
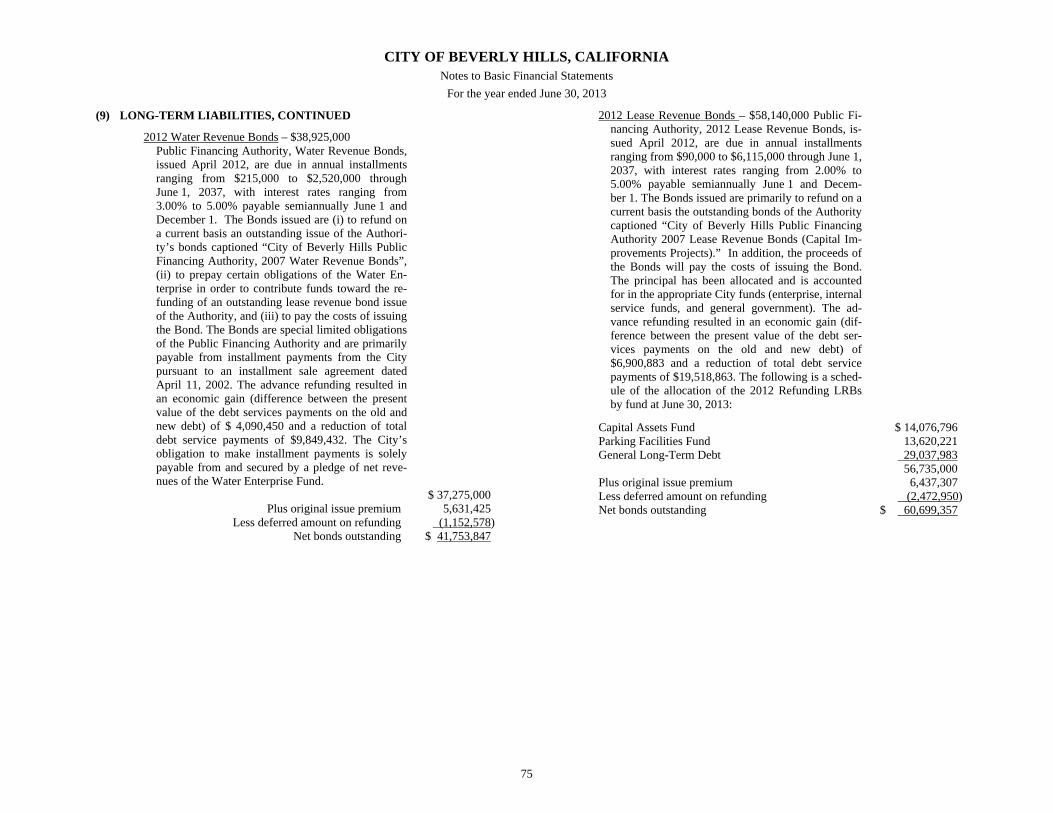
CITY OF BEVERLY HILLS, CALIFORNIA Notes to Basic Financial Statements
For the year ended June 30, 2013
75
(9) LONG-TERM LIABILITIES, CONTINUED
2012 Water Revenue Bonds – $38,925,000 Public Financing Authority, Water Revenue Bonds,
issued April 2012, are due in annual installments ranging from $215,000 to $2,520,000 through June 1, 2037, with interest rates ranging from 3.00% to 5.00% payable semiannually June 1 and December 1. The Bonds issued are (i) to refund on a current basis an outstanding issue of the Authori-ty’s bonds captioned “City of Beverly Hills Public Financing Authority, 2007 Water Revenue Bonds”, (ii) to prepay certain obligations of the Water En-terprise in order to contribute funds toward the re-funding of an outstanding lease revenue bond issue of the Authority, and (iii) to pay the costs of issuing the Bond. The Bonds are special limited obligations of the Public Financing Authority and are primarily payable from installment payments from the City pursuant to an installment sale agreement dated April 11, 2002. The advance refunding resulted in an economic gain (difference between the present value of the debt services payments on the old and new debt) of $ 4,090,450 and a reduction of total debt service payments of $9,849,432. The City’s obligation to make installment payments is solely payable from and secured by a pledge of net reve-nues of the Water Enterprise Fund.
$ 37,275,000 Plus original issue premium 5,631,425 Less deferred amount on refunding (1,152,578) Net bonds outstanding $ 41,753,847
2012 Lease Revenue Bonds – $58,140,000 Public Fi-nancing Authority, 2012 Lease Revenue Bonds, is-sued April 2012, are due in annual installments ranging from $90,000 to $6,115,000 through June 1, 2037, with interest rates ranging from 2.00% to 5.00% payable semiannually June 1 and Decem-ber 1. The Bonds issued are primarily to refund on a current basis the outstanding bonds of the Authority captioned “City of Beverly Hills Public Financing Authority 2007 Lease Revenue Bonds (Capital Im-provements Projects).” In addition, the proceeds of the Bonds will pay the costs of issuing the Bond. The principal has been allocated and is accounted for in the appropriate City funds (enterprise, internal service funds, and general government). The ad-vance refunding resulted in an economic gain (dif-ference between the present value of the debt ser-vices payments on the old and new debt) of $6,900,883 and a reduction of total debt service payments of $19,518,863. The following is a sched-ule of the allocation of the 2012 Refunding LRBs by fund at June 30, 2013:
Capital Assets Fund $ 14,076,796 Parking Facilities Fund 13,620,221 General Long-Term Debt 29,037,983 56,735,000 Plus original issue premium 6,437,307 Less deferred amount on refunding (2,472,950) Net bonds outstanding $ 60,699,357
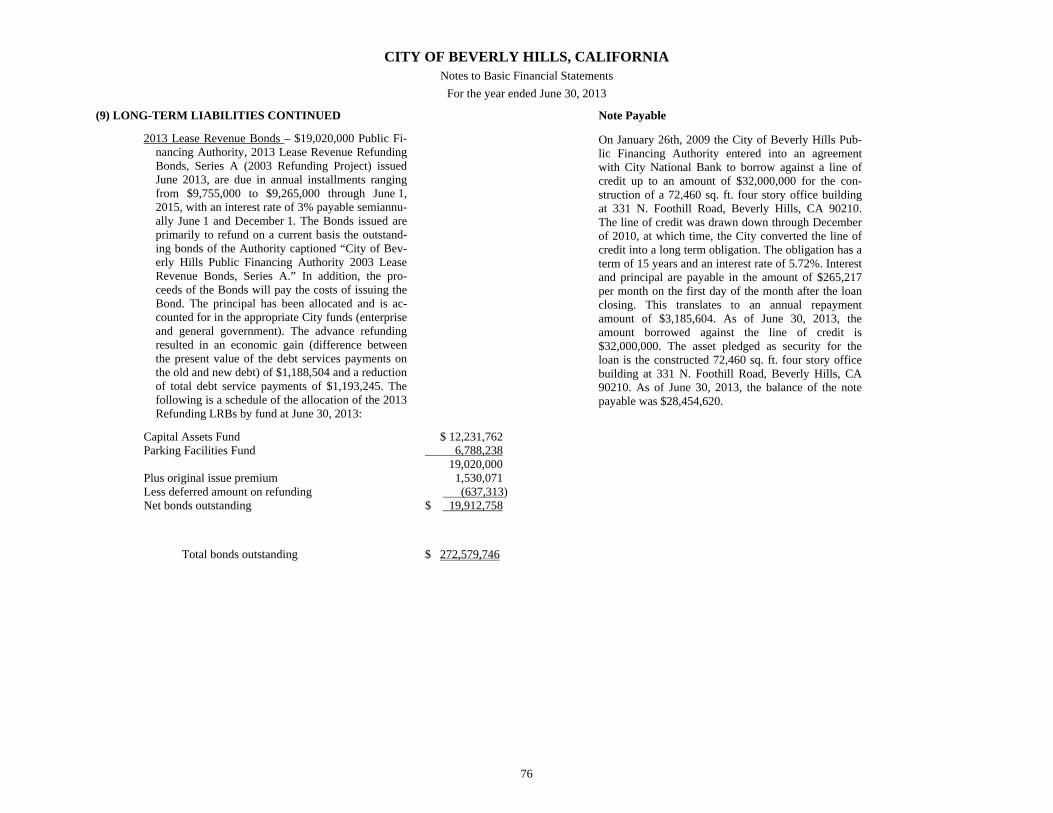
CITY OF BEVERLY HILLS, CALIFORNIA Notes to Basic Financial Statements
For the year ended June 30, 2013
76
(9) LONG-TERM LIABILITIES CONTINUED
2013 Lease Revenue Bonds – $19,020,000 Public Fi-nancing Authority, 2013 Lease Revenue Refunding Bonds, Series A (2003 Refunding Project) issued June 2013, are due in annual installments ranging from $9,755,000 to $9,265,000 through June 1, 2015, with an interest rate of 3% payable semiannu-ally June 1 and December 1. The Bonds issued are primarily to refund on a current basis the outstand-ing bonds of the Authority captioned “City of Bev-erly Hills Public Financing Authority 2003 Lease Revenue Bonds, Series A.” In addition, the pro-ceeds of the Bonds will pay the costs of issuing the Bond. The principal has been allocated and is ac-counted for in the appropriate City funds (enterprise and general government). The advance refunding resulted in an economic gain (difference between the present value of the debt services payments on the old and new debt) of $1,188,504 and a reduction of total debt service payments of $1,193,245. The following is a schedule of the allocation of the 2013 Refunding LRBs by fund at June 30, 2013:
Capital Assets Fund $ 12,231,762 Parking Facilities Fund 6,788,238 19,020,000 Plus original issue premium 1,530,071 Less deferred amount on refunding (637,313) Net bonds outstanding $ 19,912,758
Total bonds outstanding $ 272,579,746
Note Payable
On January 26th, 2009 the City of Beverly Hills Pub-lic Financing Authority entered into an agreement with City National Bank to borrow against a line of credit up to an amount of $32,000,000 for the con-struction of a 72,460 sq. ft. four story office building at 331 N. Foothill Road, Beverly Hills, CA 90210. The line of credit was drawn down through December of 2010, at which time, the City converted the line of credit into a long term obligation. The obligation has a term of 15 years and an interest rate of 5.72%. Interest and principal are payable in the amount of $265,217 per month on the first day of the month after the loan closing. This translates to an annual repayment amount of $3,185,604. As of June 30, 2013, the amount borrowed against the line of credit is $32,000,000. The asset pledged as security for the loan is the constructed 72,460 sq. ft. four story office building at 331 N. Foothill Road, Beverly Hills, CA 90210. As of June 30, 2013, the balance of the note payable was $28,454,620.
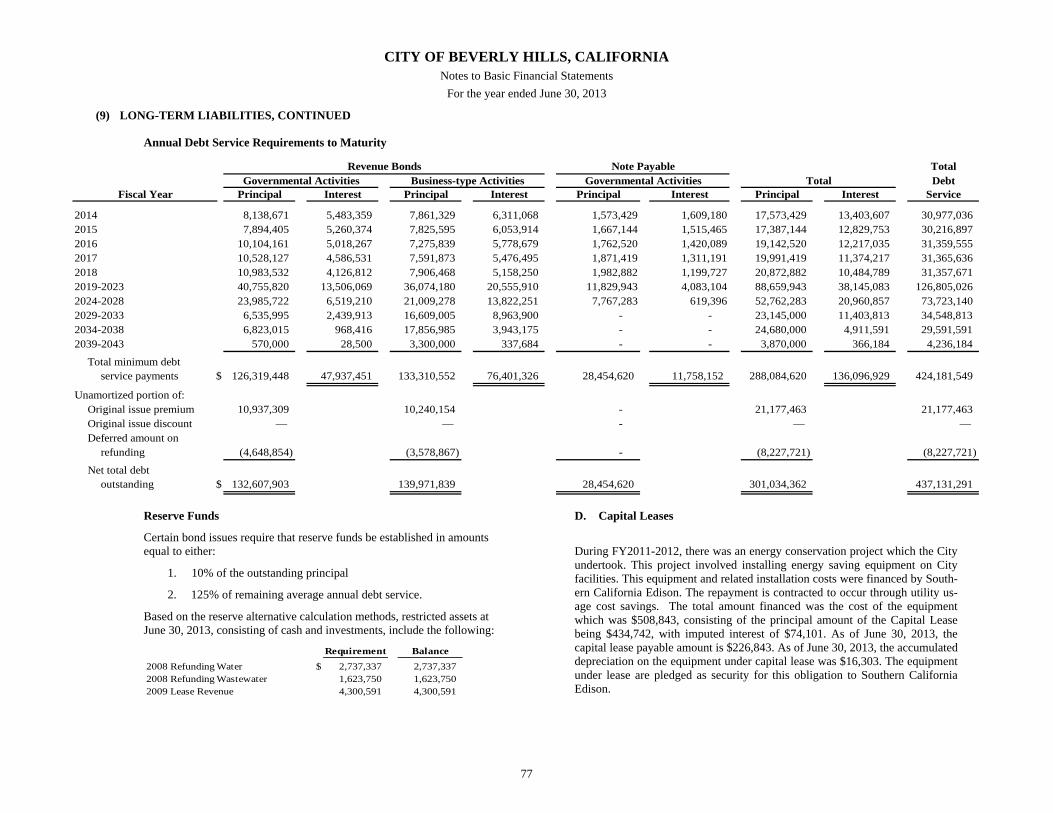
CITY OF BEVERLY HILLS, CALIFORNIA Notes to Basic Financial Statements
For the year ended June 30, 2013
77
(9) LONG-TERM LIABILITIES, CONTINUED
Annual Debt Service Requirements to Maturity
Reserve Funds
Certain bond issues require that reserve funds be established in amounts equal to either:
1. 10% of the outstanding principal
2. 125% of remaining average annual debt service.
Based on the reserve alternative calculation methods, restricted assets at June 30, 2013, consisting of cash and investments, include the following:
Requirement Balance2008 Refunding Water $ 2,737,337 2,737,3372008 Refunding Wastewater 1,623,750 1,623,7502009 Lease Revenue 4,300,591 4,300,591
D. Capital Leases
During FY2011-2012, there was an energy conservation project which the City undertook. This project involved installing energy saving equipment on City facilities. This equipment and related installation costs were financed by South-ern California Edison. The repayment is contracted to occur through utility us-age cost savings. The total amount financed was the cost of the equipment which was $508,843, consisting of the principal amount of the Capital Lease being $434,742, with imputed interest of $74,101. As of June 30, 2013, the capital lease payable amount is $226,843. As of June 30, 2013, the accumulated depreciation on the equipment under capital lease was $16,303. The equipment under lease are pledged as security for this obligation to Southern California Edison.
TotalDebt
Principal Interest Principal Interest Principal Interest Principal Interest Service
2014 8,138,671 5,483,359 7,861,329 6,311,068 1,573,429 1,609,180 17,573,429 13,403,607 30,977,0362015 7,894,405 5,260,374 7,825,595 6,053,914 1,667,144 1,515,465 17,387,144 12,829,753 30,216,8972016 10,104,161 5,018,267 7,275,839 5,778,679 1,762,520 1,420,089 19,142,520 12,217,035 31,359,5552017 10,528,127 4,586,531 7,591,873 5,476,495 1,871,419 1,311,191 19,991,419 11,374,217 31,365,6362018 10,983,532 4,126,812 7,906,468 5,158,250 1,982,882 1,199,727 20,872,882 10,484,789 31,357,6712019-2023 40,755,820 13,506,069 36,074,180 20,555,910 11,829,943 4,083,104 88,659,943 38,145,083 126,805,0262024-2028 23,985,722 6,519,210 21,009,278 13,822,251 7,767,283 619,396 52,762,283 20,960,857 73,723,1402029-2033 6,535,995 2,439,913 16,609,005 8,963,900 - - 23,145,000 11,403,813 34,548,8132034-2038 6,823,015 968,416 17,856,985 3,943,175 - - 24,680,000 4,911,591 29,591,5912039-2043 570,000 28,500 3,300,000 337,684 - - 3,870,000 366,184 4,236,184
Total minimum debtservice payments $ 126,319,448 47,937,451 133,310,552 76,401,326 28,454,620 11,758,152 288,084,620 136,096,929 424,181,549
Unamortized portion of:Original issue premium 10,937,309 10,240,154 - 21,177,463 21,177,463Original issue discount — — - — — Deferred amount on
refunding (4,648,854) (3,578,867) - (8,227,721) (8,227,721)
Net total debtoutstanding $ 132,607,903 139,971,839 28,454,620 301,034,362 437,131,291
Fiscal Year
Revenue BondsGovernmental Activities Business-type Activities Total
Note PayableGovernmental Activities
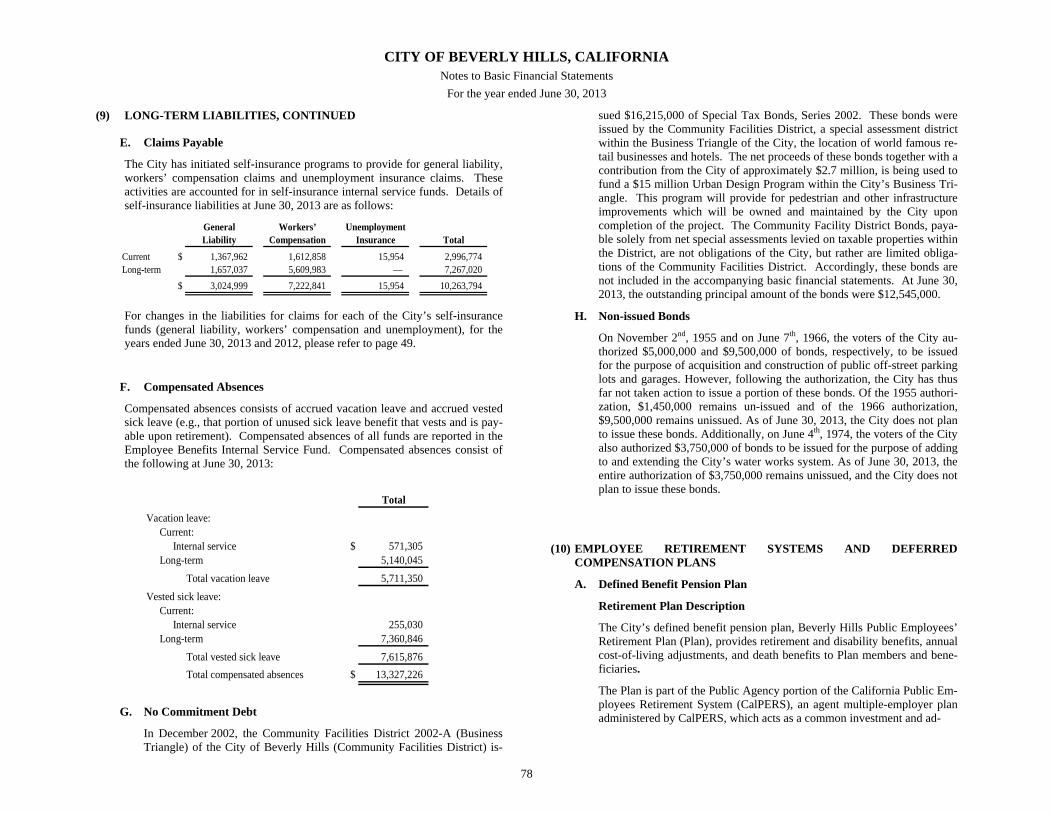
CITY OF BEVERLY HILLS, CALIFORNIA Notes to Basic Financial Statements
For the year ended June 30, 2013
78
(9) LONG-TERM LIABILITIES, CONTINUED
E. Claims Payable
The City has initiated self-insurance programs to provide for general liability, workers’ compensation claims and unemployment insurance claims. These activities are accounted for in self-insurance internal service funds. Details of self-insurance liabilities at June 30, 2013 are as follows:
For changes in the liabilities for claims for each of the City’s self-insurance funds (general liability, workers’ compensation and unemployment), for the years ended June 30, 2013 and 2012, please refer to page 49.
F. Compensated Absences
Compensated absences consists of accrued vacation leave and accrued vested sick leave (e.g., that portion of unused sick leave benefit that vests and is pay-able upon retirement). Compensated absences of all funds are reported in the Employee Benefits Internal Service Fund. Compensated absences consist of the following at June 30, 2013:
G. No Commitment Debt
In December 2002, the Community Facilities District 2002-A (Business Triangle) of the City of Beverly Hills (Community Facilities District) is-
sued $16,215,000 of Special Tax Bonds, Series 2002. These bonds were issued by the Community Facilities District, a special assessment district within the Business Triangle of the City, the location of world famous re-tail businesses and hotels. The net proceeds of these bonds together with a contribution from the City of approximately $2.7 million, is being used to fund a $15 million Urban Design Program within the City’s Business Tri-angle. This program will provide for pedestrian and other infrastructure improvements which will be owned and maintained by the City upon completion of the project. The Community Facility District Bonds, paya-ble solely from net special assessments levied on taxable properties within the District, are not obligations of the City, but rather are limited obliga-tions of the Community Facilities District. Accordingly, these bonds are not included in the accompanying basic financial statements. At June 30, 2013, the outstanding principal amount of the bonds were $12,545,000.
H. Non-issued Bonds
On November 2nd, 1955 and on June 7th, 1966, the voters of the City au-thorized $5,000,000 and $9,500,000 of bonds, respectively, to be issued for the purpose of acquisition and construction of public off-street parking lots and garages. However, following the authorization, the City has thus far not taken action to issue a portion of these bonds. Of the 1955 authori-zation, $1,450,000 remains un-issued and of the 1966 authorization, $9,500,000 remains unissued. As of June 30, 2013, the City does not plan to issue these bonds. Additionally, on June 4th, 1974, the voters of the City also authorized $3,750,000 of bonds to be issued for the purpose of adding to and extending the City’s water works system. As of June 30, 2013, the entire authorization of $3,750,000 remains unissued, and the City does not plan to issue these bonds.
(10) EMPLOYEE RETIREMENT SYSTEMS AND DEFERRED COMPENSATION PLANS
A. Defined Benefit Pension Plan
Retirement Plan Description
The City’s defined benefit pension plan, Beverly Hills Public Employees’ Retirement Plan (Plan), provides retirement and disability benefits, annual cost-of-living adjustments, and death benefits to Plan members and bene-ficiaries.
The Plan is part of the Public Agency portion of the California Public Em-ployees Retirement System (CalPERS), an agent multiple-employer plan administered by CalPERS, which acts as a common investment and ad-
General Workers’ UnemploymentLiability Compensation Insurance Total
Current $ 1,367,962 1,612,858 15,954 2,996,774Long-term 1,657,037 5,609,983 — 7,267,020
$ 3,024,999 7,222,841 15,954 10,263,794
TotalVacation leave:
Current:Internal service $ 571,305
Long-term 5,140,045
Total vacation leave 5,711,350
Vested sick leave:Current:
Internal service 255,030Long-term 7,360,846
Total vested sick leave 7,615,876Total compensated absences $ 13,327,226
CITY OF BEVERLY HILLS, CALIFORNIA Notes to Basic Financial Statements
For the year ended June 30, 2013
79
(10) EMPLOYEE RETIREMENT SYSTEMS AND DEFERRED COMPENSATION PLANS, CONTINUED
ministrative agent for participating public employers within the State of Cali-fornia.
State statutes within the Public Employees’ Retirement Law establish a menu of benefit provisions, as well as other requirements.
The City selects optional benefit provisions from the benefit menu by contract with CalPERS and adopts those benefits through City ordinance. CalPERS is-sues a separate comprehensive annual financial report. Copies of CalPERS’ annual financial report may be obtained from the CalPERS Executive Office, 400 “P” Street, Sacramento, California 95814.
All full-time employees of the City are eligible to participate in the Plan. Part-time employees appointed to a term of one year or longer and who work at least 1,000 hours per year are also eligible to participate. Other part-time non-benefited hourly employees do not participate in the Plan. (Presently, such part-time employees participate in a program through Public Agency Retire-ment Services (PARS)). Related benefits vest over five years of service. Up-on five years of service, employees who retire at or after age 50 are entitled to receive an annual retirement benefit.
The benefit is payable monthly for life and varies by member category, Clas-sic or PEPRA, and level one or two. Classic members are those employees in-itially enrolled in CalPERS prior to 1/1/13. Per the California Public Employ-ees’ Pension Reform Act of 2013, PEPRA employees are those hired on or af-ter 1/1/13 with no service to a CalPERS agency for the six months prior to their hire date. Classic members’ final compensation is based on the average pensionable compensation for a 36 month consecutive period of employment. Miscellaneous Classic employees receive monthly benefits payable in the amount of 2.5% at age 55, of the employee’s single highest year’s salary for each year of credited service. Miscellaneous PEPRA members receive bene-fits payable in the amount of 2.00% at age 62 and over. Level one Classic Safety employees receive 3.00% at age 55 and over. Safety PEPRA members receive benefits payable in the amount of 2.7% at age 57 and over. Also effec-tive in 2013 are compensation limits for defined benefit plans. The 2013 pen-sionable compensation limit for Classic members is $255,000 and $136,440 for PEPRA (non-social security) members. The plan also provides death and disability benefits.
Funding Policy
Active full-time plan members in the Plan are required to contribute 8%, for miscellaneous employees, and 9%, for safety employees, of their annual cov-ered salary. Active full-time members hired on or after 1/1/13, who have not worked for another CalPERS agency in the prior six months are required to contribute 6.25% for miscellaneous, and 12%, for safety employees, of their annual covered salary. The City makes such employee contributions for all
safety employees and for members of the executive, executive management and confidential bargaining units on their behalf and for their account. For the remaining full-time bargaining groups the City contributes 7% of their annual covered salary on their behalf and for their account. The City is required to contribute the actuarially determined remaining amounts necessary to fund the benefits for its members. The actuarial methods and assumptions used are those adopted by the CalPERS Board of Administration. The required em-ployer contribution rate for the year ended June 30, 2013 was 33.161% for safety members and 16.676% for miscellaneous employees. The contribution requirements of the Plan members are established by State statute and the em-ployer contribution rate is established and may be amended by CalPERS.
Annual Pension Cost
For the year ended June 30, 2013, the City’s actual contributions were $8,178,476 for the safety employees and $5,617,641 for miscellaneous em-ployees. The City also contributed $2,285,435 on behalf of the safety employ-ees and $2,970,871 on behalf of miscellaneous employees. Miscellaneous part-time employees directly contributed $295,610. Total contributions were $19,348,033. The required contribution for the year ended June 30, 2013 was determined as part of the June 30, 2012 actuarial valuation using the entry age normal actuarial cost method with the contributions determined as a percent of pay. The actuarial assumptions included (a) 7.50% investment rate of return (net of administrative expenses) for safety and miscellaneous employee plans; (b) projected salary increases that vary by duration of service ranging from 3.30% to 14.20% for both safety and miscellaneous members, and (c) 3.0% cost-of-living adjustment for both safety and miscellaneous members. Both (a) and (b) include an inflation component of 2.75%.
The actuarial value of the Plan’s assets are typically determined using a tech-nique that smoothes the effect of short-term volatility in the market value of investments over a two to five year period depending on the size of investment gains and/or losses. However, a temporary change to the asset smoothing method was adopted by the CalPERS Board in June 2009 to phase in the im-pact of the -24% investment loss experienced by CalPERS in fiscal year 2008-2009. The change increased the corridor limits for the actuarial value of as-sets from 80%-120% to 60%-140% of market value on June 30, 2009 and over three years will reduce the corridor limits back to the initial percentages. Ad-ditionally, the temporary change isolated and amortized all gains and losses during fiscal years 2008-2011 over fixed and declining 30 year periods (as op-posed to the current rolling 30 year amortization). CalPERS is in the third year of the 3-year temporary plan, which upon completion will result in the corridor limits being reduced to the initial percentages of 80%-120% by June 30, 2011 and thereafter, has been reducing the corridor limits back to the ini-tial percentages by June 30, 2011 and thereafter. On April 17, 2013, the CalPERS Board approved a change to the CalPERS amortization and smooth-ing policies. Beginning with the June 30, 2013 valuations that set the 2015-16 rates, CalPERS will no longer use an actuarial value of assets and will employ an amortization
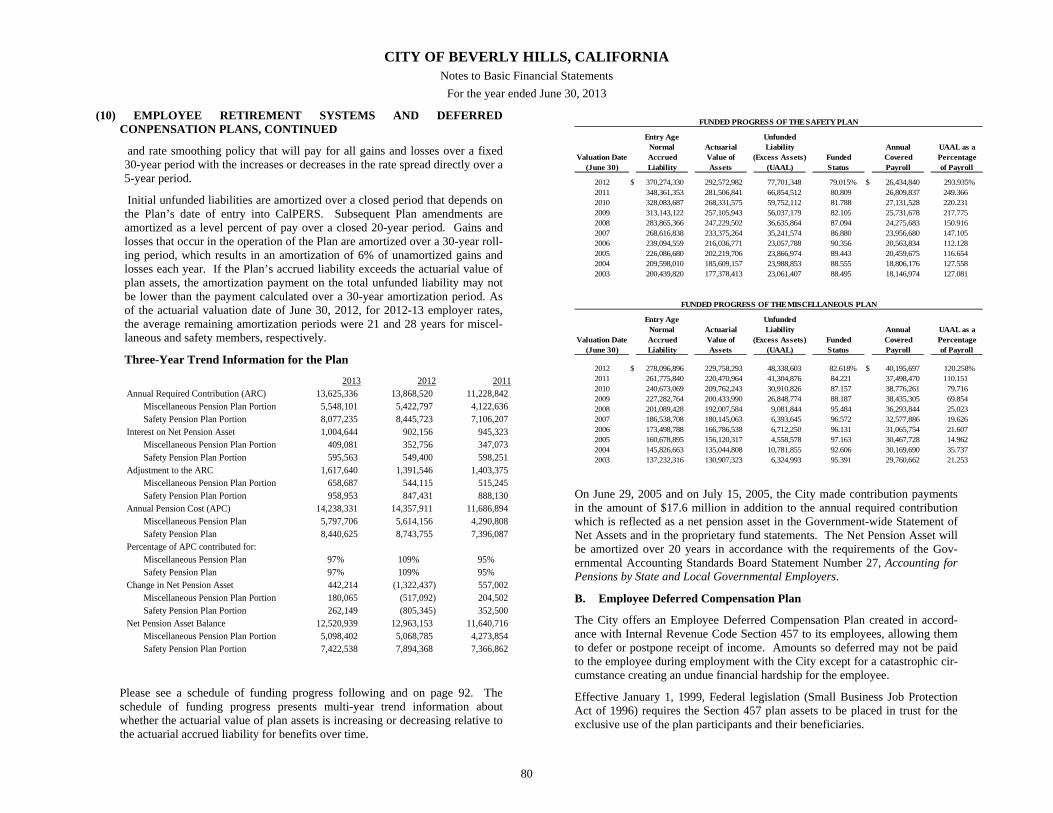
CITY OF BEVERLY HILLS, CALIFORNIA Notes to Basic Financial Statements
For the year ended June 30, 2013
80
(10) EMPLOYEE RETIREMENT SYSTEMS AND DEFERRED CONPENSATION PLANS, CONTINUED
and rate smoothing policy that will pay for all gains and losses over a fixed 30-year period with the increases or decreases in the rate spread directly over a 5-year period.
Initial unfunded liabilities are amortized over a closed period that depends on the Plan’s date of entry into CalPERS. Subsequent Plan amendments are amortized as a level percent of pay over a closed 20-year period. Gains and losses that occur in the operation of the Plan are amortized over a 30-year roll-ing period, which results in an amortization of 6% of unamortized gains and losses each year. If the Plan’s accrued liability exceeds the actuarial value of plan assets, the amortization payment on the total unfunded liability may not be lower than the payment calculated over a 30-year amortization period. As of the actuarial valuation date of June 30, 2012, for 2012-13 employer rates, the average remaining amortization periods were 21 and 28 years for miscel-laneous and safety members, respectively.
Three-Year Trend Information for the Plan
Please see a schedule of funding progress following and on page 92. The schedule of funding progress presents multi-year trend information about whether the actuarial value of plan assets is increasing or decreasing relative to the actuarial accrued liability for benefits over time.
Entry Age UnfundedNormal Actuarial Liability Annual UAAL as a
Valuation Date Accrued Value of (Excess Assets) Funded Covered Percentage(June 30) Liability Assets (UAAL) Status Payroll of Payroll
2012 $ 370,274,330 292,572,982 77,701,348 79.015% $ 26,434,840 293.935% 2011 348,361,353 281,506,841 66,854,512 80.809 26,809,837 249.366 2010 328,083,687 268,331,575 59,752,112 81.788 27,131,528 220.231 2009 313,143,122 257,105,943 56,037,179 82.105 25,731,678 217.775 2008 283,865,366 247,229,502 36,635,864 87.094 24,275,683 150.916 2007 268,616,838 233,375,264 35,241,574 86.880 23,956,680 147.105 2006 239,094,559 216,036,771 23,057,788 90.356 20,563,834 112.128 2005 226,086,680 202,219,706 23,866,974 89.443 20,459,675 116.654 2004 209,598,010 185,609,157 23,988,853 88.555 18,806,176 127.558 2003 200,439,820 177,378,413 23,061,407 88.495 18,146,974 127.081
Entry Age UnfundedNormal Actuarial Liability Annual UAAL as a
Valuation Date Accrued Value of (Excess Assets) Funded Covered Percentage(June 30) Liability Assets (UAAL) Status Payroll of Payroll
2012 $ 278,096,896 229,758,293 48,338,603 82.618% $ 40,195,697 120.258% 2011 261,775,840 220,470,964 41,304,876 84.221 37,498,470 110.151 2010 240,673,069 209,762,243 30,910,826 87.157 38,776,261 79.716 2009 227,282,764 200,433,990 26,848,774 88.187 38,435,305 69.854 2008 201,089,428 192,007,584 9,081,844 95.484 36,293,844 25.023 2007 186,538,708 180,145,063 6,393,645 96.572 32,577,886 19.626 2006 173,498,788 166,786,538 6,712,250 96.131 31,065,754 21.607 2005 160,678,895 156,120,317 4,558,578 97.163 30,467,728 14.962 2004 145,826,663 135,044,808 10,781,855 92.606 30,169,690 35.737 2003 137,232,316 130,907,323 6,324,993 95.391 29,760,662 21.253
FUNDED PROGRESS OF THE SAFETY PLAN
FUNDED PROGRESS OF THE MISCELLANEOUS PLAN
On June 29, 2005 and on July 15, 2005, the City made contribution payments in the amount of $17.6 million in addition to the annual required contribution which is reflected as a net pension asset in the Government-wide Statement of Net Assets and in the proprietary fund statements. The Net Pension Asset will be amortized over 20 years in accordance with the requirements of the Gov-ernmental Accounting Standards Board Statement Number 27, Accounting for Pensions by State and Local Governmental Employers.
B. Employee Deferred Compensation Plan
The City offers an Employee Deferred Compensation Plan created in accord-ance with Internal Revenue Code Section 457 to its employees, allowing them to defer or postpone receipt of income. Amounts so deferred may not be paid to the employee during employment with the City except for a catastrophic cir-cumstance creating an undue financial hardship for the employee.
Effective January 1, 1999, Federal legislation (Small Business Job Protection Act of 1996) requires the Section 457 plan assets to be placed in trust for the exclusive use of the plan participants and their beneficiaries.
2013 2012 2011Annual Required Contribution (ARC) 13,625,336 13,868,520 11,228,842
Miscellaneous Pension Plan Portion 5,548,101 5,422,797 4,122,636 Safety Pension Plan Portion 8,077,235 8,445,723 7,106,207
Interest on Net Pension Asset 1,004,644 902,156 945,323 Miscellaneous Pension Plan Portion 409,081 352,756 347,073 Safety Pension Plan Portion 595,563 549,400 598,251
Adjustment to the ARC 1,617,640 1,391,546 1,403,375 Miscellaneous Pension Plan Portion 658,687 544,115 515,245 Safety Pension Plan Portion 958,953 847,431 888,130
Annual Pension Cost (APC) 14,238,331 14,357,911 11,686,894 Miscellaneous Pension Plan 5,797,706 5,614,156 4,290,808 Safety Pension Plan 8,440,625 8,743,755 7,396,087
Percentage of APC contributed for:Miscellaneous Pension Plan 97% 109% 95%Safety Pension Plan 97% 109% 95%
Change in Net Pension Asset 442,214 (1,322,437) 557,002 Miscellaneous Pension Plan Portion 180,065 (517,092) 204,502 Safety Pension Plan Portion 262,149 (805,345) 352,500
Net Pension Asset Balance 12,520,939 12,963,153 11,640,716 Miscellaneous Pension Plan Portion 5,098,402 5,068,785 4,273,854 Safety Pension Plan Portion 7,422,538 7,894,368 7,366,862
CITY OF BEVERLY HILLS, CALIFORNIA Notes to Basic Financial Statements
For the year ended June 30, 2013
81
(10) EMPLOYEE RETIREMENT SYSTEMS AND DEFERRED COMPENSATION PLANS, CONTINUED
The City’s deferred compensation administrator, the International City Manag-ers’ Association (ICMA) qualifies as the plan trustee to meet Federal require-ments. Since the plan assets are no longer considered the property and rights of the City, such assets are no longer reflected in the accompanying basic finan-cial statements.
The City also offers to its employees a deferred compensation plan created in accordance with Internal Revenue Code Section 401(k). All amounts deferred and invested under this plan, with related interest, are the property and rights of the participating employees and, as such, are not reflected in the accompanying financial statements.
(11) RELATED PARTY TRANSACTIONS
In November 1984, The Parking Authority paid the City $6,500,000 in consid-eration for certain land to be used as the site for the construction of a new park-ing structure. Upon completion in August 1986, the City leased the parking fa-cility from The Parking Authority. The sale of the land has been accounted for as a sale/leaseback transaction, and the related gain of $1,890,055 is being amortized into income in the Parking Enterprise Fund over the 55-year life of the lease. At June 30, 2013 the balance remaining is $962,167.
During Fiscal Year 2007-2008 the City of Beverly Hills initiated the Housing Assistance Loan Program which provides housing assistance for other execu-tive employees to help them cope with the high cost of housing and to achieve additional objectives. On June 15, 2008, the then Director of the Administrative Services Department and Chief Financial Officer, Scott G. Miller, entered into the Housing Assistance Loan Program and was provided a home loan for $792,000. The loan period is 40 years with an interest rate of 3.0% per annum. At June 30, 2013 the outstanding principal balance of the loan was $732,784.
On October 9th, 2008 the Chief Information Officer, David Schirmer entered in-to the Housing Assistance Loan Program and was provided an interest only (with future graduated terms) home loan for $952,771. The loan period is 40 years with an interest rate of 3% per annum. At June 30, 2013 the outstanding principal balance of the loan was $942,998.
On July 10th, 2008, the City provided a housing assistance loan to Nancy Hunt Coffey, Assistant Director of Community Services – Library for $1,100,814. The loan period is 40 years with an interest rate of 3.0% per annum. At June 30, 2013 the outstanding principal balance of the loan was $1,024,131.
On May 14th, 2009, the City provided an interest only (with future graduated terms) housing assistance loan to Steven Zoet, Assistant Director of Communi-ty Services- Recreation and Parks, for $1,100,000. The loan period is 40 years with an interest rate of 3.0% per annum. At June 30, 2013 the outstanding prin-cipal balance of the loan was $1,060,347.
Further, on May 14th, 2009, the City provided a housing assistance loan to Jon-athan Lait, Assistant Director of Community Development for $750,000. The loan period is 40 years with an interest rate of 3.0% per annum. At June 30, 2013 the outstanding principal balance of the loan was $707,383.
On August 20th, 2009, the City provided a housing assistance loan to Chad Lynn, Director of Parking Operations, for $735,000. The loan period is 40 years with an interest rate of 3.0% per annum. At June 30, 2013 the outstanding principal balance of the loan was $696,000. On October 28, 2010, the City Manager, Jeffrey C. Kolin, entered into the Housing Assistance Loan Program and was provided a home loan for $1,081,341. According to the employment contract, the City Manager has an option for a home improvement loan. Between December 2010 and February 2011, $107,236 of home improvement advances was added to the original home loan principal. The loan period is 40 years with an interest rate of 3.0% per annum. At June 30, 2013 the outstanding principal balance of the loan was $1,180,846. The balances of the notes receivable are contained within the General Fund receivables (see Note 5).
(12) POST EMPLOYMENT HEALTH CARE BENEFITS
A. Defined Benefit Plan
In addition to the pension benefits described in Note 10, the City provides postretirement health care benefits in accordance with employees’ respective compensation plans.
The other post employment benefit (OPEB) provisions of the compensation plans are negotiated with formally recognized bargaining units and groups not formally recognized and are adopted by City Council action. Benefit provisions are stated in the bargaining unit Memorandums of Understanding (MOUs) and may be amended during negotiations, subject to City Council approval. The City is currently enrolled in various health care plans administered by the Cali-fornia Public Employees Retirement System (PERS). The City, as a single em-ployer of this defined benefit plan, pays retirees’ PERS health care premiums to the following limits as stipulated in the compensation plans:
CITY OF BEVERLY HILLS, CALIFORNIA Notes to Basic Financial Statements
For the year ended June 30, 2013
82
(12) POST EMPLOYMENT HEALTH CARE BENEFITS, CONTINUED
Technical Service employees:
– For service retirees after the following dates through age 65, or the date the retiree becomes eligible for Medicare, the following health benefits are provided:
After June 1, 1985 Single-party rate After June 1, 1986 $200/month After December 1, 1987 $245/month After December 1, 1988 $270/month
– For service retirees after February 1, 1990 through age 70, or the date the retiree becomes eligible for Medicare, $300 per month in health benefits is provided.
– For service retirees after July 1, 2000 through age 70, or the date the re-tiree becomes eligible for Medicare, the City provides up to $300 per month in health benefits. The benefit is extended up to $150 per month after age 70 if the employee retired with 20 or more years of service. For retirees over the age of 70 who do not meet the requirement, the City will pay the statutory minimum.
Police Association employees: – For employees retiring (service retirement only) after July 1, 1989
through age 70, the City pays up to the two-party rate of the Peace Of-ficers Research Association of California (PORAC) Plan under PERS.
– For retirees who retired between July 1, 1978 and July 1, 1989, the City pays $211/month, through age 65.
– Retired sworn police personnel who received a disability retirement on or after July 1, 1987 are eligible for the PERS health plan if the em-ployee had 20 years of service with the Beverly Hills Police Depart-ment or is over 45 years of age at the time of his or her retirement.
Police Management Association employees: – For employees who retired after July 1, 1989, the City pays up to the
two-party rate of the PORAC Plan under PERS (with spouse continu-ance).
– For employees who retired before July 1, 1979, the City pays the PERS statutory minimum.
Firemen’s Association employees: – For management employees retired after July 1, 1980 with 15 years ac-
tive City service, the City pays up to the two-party rate of the PORAC Plan, through age 65.
– For non-management employees (service retirement only) retired after July 1, 1980, the City pays up to the two-party rate of the PORAC Plan, up to age 65.
– Retired sworn fire employees who received a disability retirement on or after July 1, 1981 are eligible for PERS health care coverage if the em-ployee would have received a service retirement of 50% or greater.
Safety Support Association employees: – For employees service-retired on or after July 1, 1984, the City pays up
to the single-party coverage up to the age of 65. – For service retirees after July 1, 2001, the City provides health benefits
up to $150 per month if the employee retired after age 60 with 20 or more years of service and up to $75 per month with 15 to 20 years of service.
Executive employees and Management and Professional employees: – For employees service-retired after July 1, 1981, with the exception of
those employees hired after December 2, 1997, the City pays up to the two-party rate of the PERSCare Plan (with spouse continuance).
– For employees hired or promoted into the management and professional service group on or after December 2, 1997, but on or before December 31, 2009, and who complete a minimum of 5 years of full-time em-ployment with the City, receive a service retirement and do not perform any paid work for a PERS contracting agency following retirement, the City pays up to the single party coverage of the PERSCare Plan at 25% for employees who have completed at least 5 years of service with the City, incremented by 5% for each year of service completed up to 20 years. For Executive employees, the same is true, but at the two-party rate as opposed to the one-party rate. After December 2, 1997, there is no spousal continuance.
Confidential employees: – For employees service-retired after July 1, 1981, the City pays up to the
one-party rate of the PERSCare Plan. Supervisors Association employees:
– For employees who were hired prior to January 1, 2010 will receive up to $350 per month until: 1) employee reaches the age of 70 or, 2) retir-ee becomes eligible for Medicare or, 3) retiree becomes eligible for an-other employer paid medical plan or V.A. benefits or, 4) for Kaiser en-rollees, the retiree moves from the Kaiser Permanente service area .
– For eligible retirees who are age 70 or older will receive $150 per month toward medical coverage if the retiree: 1) retires after July 1, 2000 and, 2) has 20 years or more of full time service.
CITY OF BEVERLY HILLS, CALIFORNIA Notes to Basic Financial Statements
For the year ended June 30, 2013
83
(12) POST EMPLOYMENT HEALTH CARE BENEFITS, CONTINUED
– For retirees over the age of 70 who do not meet this criteria, the City will pay the PERS statutory minimum on their behalf.
The above postretirement health benefits are currently financed on a pay-as-you-go basis, and there is no required or maximum contribution rate for the City, or for plan members. The City Council will set or amend contribution requirements to fund the OPEB liability as needed.
During FY2010, the City provided an offer for full-time employees hired be-fore January 1, 2010 (except sworn employees and members of the Supervi-sors Association) to participate in the Alternative Retiree Medical Program (ARMP). Employees who do not accept the offer will keep their current retiree medical benefits under their applicable collective bargaining agreement or compensation plan. Employees who choose to accept the ARMP will receive an actuarially determined “Transition Amount” and a monthly “Residual Amount” (if applicable). Employees choosing this new retiree medical pro-gram will, in effect, be opting-out of their current retiree medical program.
Employees who elect to participate in ARMP will receive a one-time lump sum transition amount (referred to as the “Transition Amount”). The Transi-tion Amount is an actuarially determined value of current retiree medical cov-erage based on each employee’s current compensation plan or bargaining unit and her/his total years of service with the City and other actuarial factors.
As a mandatory aspect of ARMP, 20% of the Transition Amount will be placed in an ICMA-RC VantageCare Retirement Health Savings Plan account (referred to as an “RHS account”) on the employee’s behalf. Amounts in this RHS account can be used to pay for eligible medical expenses for the employ-ee and eligible dependents after leaving employment with the City.
Employees who are not already eligible for full retiree medical coverage at the time, then under the terms of the applicable collective bargaining agreement or compensation plan, in addition to the Transition Amount, employees will re-ceive a monthly contribution to their RHS account while employed by the City. Contributions into the RHS account will be made until the amount of the one-time Transition Amount and the monthly contributions equal the actuari-ally calculated value of full retiree medical coverage under the particular bar-gaining agreement or compensation plan the employee would have received if she/he had worked with the City until eligible to retire. These additional monthly amounts are referred to as the employee’s “Residual Amount.”
The City will apply the remainder of the one-time Transition Amount in the following three options.
Option 1: Receive as cash (the cash payment is referred to as the “ARMP Tenure Benefit”) in the following year. Option 2: Distribute among deferred compensation plans (the 457(b), 401(k), and 415(m) plans). Option 3: Receive a portion as a cash ARMP Tenure Benefit in the following year and the bal-ance deposited in deferred compensation plans.
Contributions to the deferred compensation plans were transmitted on behalf of employees to ICMA-RC in later half of December 2010 and any cash dis-tributions of the ARMP Tenure Benefit was received by employees still em-ployed by the City during February 2011 (unless employment terminated due to death or disability in which case the cash was paid upon termination).
During Fiscal Year 2009-2010, the employees’ contractual agreements to par-ticipate in the ARMP program resulted in reducing the City’s OPEB liability by a total of $6,420,416. In accordance with the program, the employees who elected Option 1 or 3 received a cash payout in February of 2011. Employees who elected Option 2 or 3 received a distribution to their deferred compensa-tion plan account. The total of Transition amounts elected before June 30, 2010 and paid in fiscal year 2010-2011, under these options computed to $4,795,522. The portion of the Transition amounts that were distributed to the RHS and deferred compensation accounts as of June 30, 2010 was $1,624,894. During fiscal year 2010-2011, for participants who elected to join the program after June 30, 2010, the total of Transition amounts paid and/or transferred to the RHS and deferred compensation accounts was $10,761,180. Therefore, the total benefits paid for the whole length of the ARMP program was $17,181,597. On-going payments to beneficiaries during FY2010-2011 was $2,056,729. Thus the total OPEB contributions (of on-going payments plus the ARMP Transition) decreased the OPEB liability for FY2010-2011 by $12,817,909.
Please refer to the following table for trend information on the components of annual OPEB cost, net OPEB obligation, as well as information on contribu-tions made. Governmental Accounting Standards Board (GASB) Statement, No. 45, Accounting and Financial Reporting by Employers for Postemploy-ment Benefits Other than Pension, was implemented as a new pronouncement starting with Fiscal Year 2007-2008.
CITY OF BEVERLY HILLS, CALIFORNIA Notes to Basic Financial Statements
For the year ended June 30, 2013
84
(12) POST EMPLOYMENT HEALTH CARE BENEFITS, CONTINUED
The City has set aside a total amount of $31,407,111. Since the money set aside has not been placed into an irrevocable trust, then based on the standards of GASB 45, the funding status of the actuarial liability is 0%. However, includ-ing the money that has been set aside in the Employee Benefits Fund, the fund-ing status is 64%.
The actuarial accrued OPEB liability as of June 30, 2013 is $48,999,000. The total unfunded actuarial liability is $48,999,000. There are no assets under an actuarial valuation since the City is on a pay-as-you-go basis. The actuarial valuation date is July 1, 2013. The City’s annual covered payroll is estimated to be $72,922,623 for Fiscal Year 2012-2013. The ratio of the unfunded actuarial liability to annual covered payroll is 67.19%.
Please see a schedule of funding progress below and on page 93.
The cost shown was developed using two different funding methods: 1) the Aggregate cost method and 2) the Entry Age Normal (EAN) method. The dif-ference in the cost methods is the period over which past service liabilities are spread. The aggregate method spreads unfunded past service liabilities over the future working lifetimes of active participants while the entry age normal method spreads unfunded past service liabilities over the specified amortization period. The amortization of the unfunded AAL is shown for a closed period of 30 years and is based on a level percentage of future payroll amounts.
The discount rate assumed for this UAAL is 5.00% where the assumption is that benefits will be paid from general City assets, or paid from a separate trust where assets are invested relatively conservatively. The annual rate at which to-tal payroll is expected to increase is 3.25%. This is used in the cost method in order to calculate the ARC as a level percentage of payroll. Only current active and retired participants are valued. Current and future retirees are assumed to continue in their current plans. Actual spouse information is used. Where spouse date of birth is unavailable, males are assumed to be three years older than their female spouses.
The inflation rate assumed for health care costs in 2011 and 2012 is 6.5%. The average inflation rate for the next 5 years is 7.75%. There were no assumptions with respect to post retirement benefit increases as current and future retirees are assumed to continue in their current plans. Salary costs or increases are not relevant to the determination of the level of benefits.
Actuarial valuations involve estimates of the value of reported amounts and as-sumptions about the probability of events far into the future. Actuarially deter-mined amounts are subject to continual revision as actual results are compared to past expectations and new estimates are made about the future.
Since actuarial calculations reflect a long term perspective, the actuarial meth-ods and assumptions used include techniques that are designed to reduce short-term volatility in actuarial accrued liabilities and the actuarial value of assets. Calculations are based on the types of benefits provided under the terms of the substantive plan at the time of each valuation and on the pattern of sharing of costs between the employer and plan members to that point.
The City currently provides these benefits to an average of 343 participants for the year ended June 30, 2013. Additionally, for those retirees and their covered family members who no longer qualify for the benefits detailed above, but who
Fiscal Year Ended June 30: 2013 2012 2011Annual Required Contribution (ARC) $ 4,297,000 4,061,000 4,095,000
Miscellaneous Employee Portion 1,761,770 1,518,000 1,530,709 Safety Employee Portion 2,535,230 2,543,000 2,564,291
Interest on the Net OPEB Obligation (241,000) (342,000) 337,000Miscellaneous Employee Portion (98,810) (127,839) 125,970Safety Employee Portion (142,190) (214,161) 211,030
ARC Adjustment 240,000 330,000 (316,000)Miscellaneous Employee Portion 98,400 123,354 (118,121)Safety Employee Portion 141,600 206,646 (197,879)
Annual OPEB Cost 4,296,000 4,049,000 4,116,000 Miscellaneous Employee Portion 1,761,360 1,513,514 1,538,559 Safety Employee Portion 2,534,640 2,535,486 2,577,441
OPEB contributions made (2,436,624) (2,397,858) (12,817,909)
Increase (decrease) of Net OPEB Obligation 1,859,376 1,651,142 (8,701,909)Miscellaneous Employee Portion 762,344 617,196 (3,252,770)Safety Employee Portion 1,097,032 1,033,946 (5,449,139)
Net OPEB Obligation (asset) at beginning of year (5,267,332) (6,918,474) 1,783,435
Net OPEB Obligation (asset) at end of year (3,407,956) (5,267,332) (6,918,474)Miscellaneous Employee Portion (1,397,262) (1,968,926) (2,586,122)Safety Employee Portion (2,010,694) (3,298,405) (4,332,351)
Percentage of annual OPEB cost contributed 56.72% 59.22% 311.42%
Entry Age UnfundedNormal Actuarial Liability Annual UAAL as a
Valuation Date Accrued Value of (Excess Assets) Funded Covered Percentage(June 30) Liability Assets (UAAL) Status Payroll of Payroll
2013 $ 48,999,000 — 48,999,000 — $ 72,922,623 67.193 %2011 52,688,000 — 52,688,000 — 71,261,000 73.937 2009 57,787,000 — 57,787,000 — 61,551,189 93.884
FUNDED PROGRESS OF THE OPEB PLAN
CITY OF BEVERLY HILLS, CALIFORNIA Notes to Basic Financial Statements
For the year ended June 30, 2013
85
(12) POST EMPLOYMENT HEALTH CARE BENEFITS, CONTINUED
Choose to maintain coverage, the City contributed $112 per month from July 1, 2012 through December 31, 2012. From January 1, 2013 through June 30, 2013 the City contributed $115. The City currently provides this benefit to 112 par-ticipants at a cost of $154,940 for the year ended June 30, 2013. Since the City administers the OPEB plan by paying a portion of the benefits, a stand-alone financial report of the OPEB plan is not produced and all relevant disclosures are included in this section.
B. Defined Contribution Plan
In addition to the defined benefit plan described in section A above, on January 1, 2010, the City has implemented a defined contribution plan which provides postretirement health care benefits in accordance with employees’ respective compensation plans.
The provisions of the defined contribution plans are negotiated with formally recognized bargaining units and groups not formally recognized and are adopt-ed by City Council action. Contribution provisions are stated in the bargaining unit Memorandums of Understanding (MOUs) and may be amended during ne-gotiations, subject to City Council approval.
There is no contribution rate for plan members. Employees hired by the City in-to the unit on or after January 1, 2010 who retire from the City will receive the PERS statutory minimum paid by the City. In addition, for employees hired in-to the unit as new employees of the City on or after January 1, 2010, in lieu of additional retiree medical insurance benefits, the City shall, while the employ-ees are working for the City, contribute to a retirement account on behalf of such employees the sum of the following amounts as stipulated in the compen-sation plans: Technical Service employees: $150 per month Police Officers: $275 per month Firemen: $275 per month Safety Support Association employees: $250 per month Executive employees $1,375 per month Management and Professional employees: $300 per month Confidential employees: $150 per month Supervisors: $150 per month
For employees hired after January 1, 2010, the City has contributed a total of $213,927 as of the fiscal year ended June 30, 2013.
(13) COMMITMENTS AND CONTINGENCIES
A. Litigation and Claims
The City is a defendant in various lawsuits. Although the outcome of these lawsuits is not presently determinable, in the opinion of the City’s counsel, the results of these lawsuits will not have a material adverse effect on the financial condition of the City.
B. Grants
Amounts received or receivable from granting agencies are subject to au-dit and adjustment by grantor agencies. The grantor agencies may subject grant programs to compliance tests, which may result in disallowed costs. In the opinion of management, future disallowances of current or prior grant expenditures, if any, would not have a material adverse effect on the financial position of the City.
C. Construction Commitments
The City has a number of construction programs currently underway. The more significant of these programs and the commitment under related con-struction contracts at June 30, 2013 is as follows (note that this does not represent the expected total remaining cost of these programs):
D. Future Minimum Operating Lease Revenues/Expenses
The City is lessor under a variety of property operating leases (primarily retail sites in parking structures and buildings in the industrial sector) and lessee in a variety of equipment operating leases. In addition, the City uses educational and recreational facilities, provided by the Beverly Hills Unified School Dis-trict, in carrying out its programs for the benefit of its residents. The City, through a JPA with the District, leases the facilities for the annual sum of $9,825,000, per the terms of the agreement signed January 10, 2012. The agreement is effective through FY2015/16.
Construction in Progress
thru June 30, 2013
Future Budgeted
PW Facilities Upgrade $ 7,170,581 — Library Facility Maint & Improvement 4,702,071 450,000Traffic Lights Installed 3,124,107 1,572,000Reservoir Maint. & Repair 2,117,646 1,000,000Water Mains Replacement 1,299,003 11,600,000Replacement of Sewer 682,428 9,300,000Client Server/Computer Acquisition 93,879 6,880,083Hyperion Capital Component — 8,018,700Street Resurfacing — 12,750,000Elevator Replacement Upgrades 82,601 3,025,000
$ 19,272,316 54,595,783
CAPITAL PROJECT
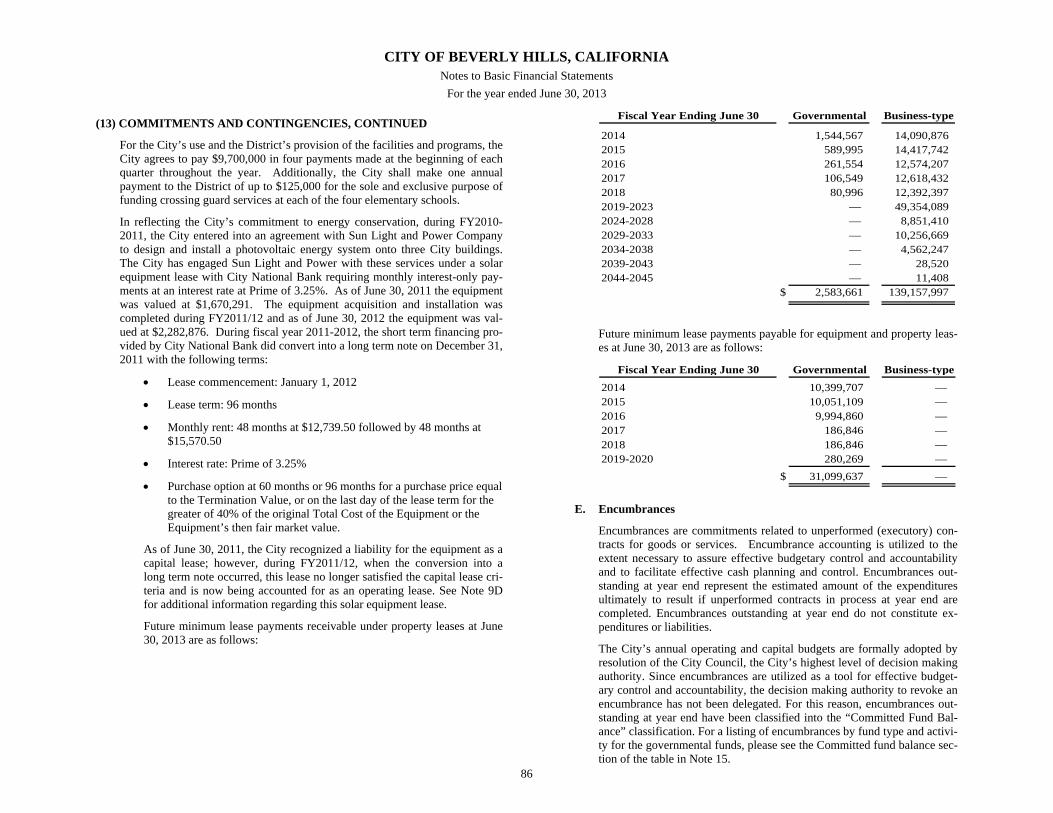
CITY OF BEVERLY HILLS, CALIFORNIA Notes to Basic Financial Statements
For the year ended June 30, 2013
86
(13) COMMITMENTS AND CONTINGENCIES, CONTINUED
For the City’s use and the District’s provision of the facilities and programs, the City agrees to pay $9,700,000 in four payments made at the beginning of each quarter throughout the year. Additionally, the City shall make one annual payment to the District of up to $125,000 for the sole and exclusive purpose of funding crossing guard services at each of the four elementary schools.
In reflecting the City’s commitment to energy conservation, during FY2010-2011, the City entered into an agreement with Sun Light and Power Company to design and install a photovoltaic energy system onto three City buildings. The City has engaged Sun Light and Power with these services under a solar equipment lease with City National Bank requiring monthly interest-only pay-ments at an interest rate at Prime of 3.25%. As of June 30, 2011 the equipment was valued at $1,670,291. The equipment acquisition and installation was completed during FY2011/12 and as of June 30, 2012 the equipment was val-ued at $2,282,876. During fiscal year 2011-2012, the short term financing pro-vided by City National Bank did convert into a long term note on December 31, 2011 with the following terms:
Lease commencement: January 1, 2012
Lease term: 96 months
Monthly rent: 48 months at $12,739.50 followed by 48 months at $15,570.50
Interest rate: Prime of 3.25%
Purchase option at 60 months or 96 months for a purchase price equal to the Termination Value, or on the last day of the lease term for the greater of 40% of the original Total Cost of the Equipment or the Equipment’s then fair market value.
As of June 30, 2011, the City recognized a liability for the equipment as a capital lease; however, during FY2011/12, when the conversion into a long term note occurred, this lease no longer satisfied the capital lease cri-teria and is now being accounted for as an operating lease. See Note 9D for additional information regarding this solar equipment lease.
Future minimum lease payments receivable under property leases at June 30, 2013 are as follows:
Future minimum lease payments payable for equipment and property leas-es at June 30, 2013 are as follows:
E. Encumbrances
Encumbrances are commitments related to unperformed (executory) con-tracts for goods or services. Encumbrance accounting is utilized to the extent necessary to assure effective budgetary control and accountability and to facilitate effective cash planning and control. Encumbrances out-standing at year end represent the estimated amount of the expenditures ultimately to result if unperformed contracts in process at year end are completed. Encumbrances outstanding at year end do not constitute ex-penditures or liabilities.
The City’s annual operating and capital budgets are formally adopted by resolution of the City Council, the City’s highest level of decision making authority. Since encumbrances are utilized as a tool for effective budget-ary control and accountability, the decision making authority to revoke an encumbrance has not been delegated. For this reason, encumbrances out-standing at year end have been classified into the “Committed Fund Bal-ance” classification. For a listing of encumbrances by fund type and activi-ty for the governmental funds, please see the Committed fund balance sec-tion of the table in Note 15.
Governmental Business-type
2014 1,544,567 14,090,8762015 589,995 14,417,7422016 261,554 12,574,2072017 106,549 12,618,4322018 80,996 12,392,3972019-2023 — 49,354,0892024-2028 — 8,851,4102029-2033 — 10,256,6692034-2038 — 4,562,2472039-2043 — 28,5202044-2045 — 11,408
$ 2,583,661 139,157,997
Fiscal Year Ending June 30
Governmental Business-type
2014 10,399,707 — 2015 10,051,109 — 2016 9,994,860 — 2017 186,846 — 2018 186,846 — 2019-2020 280,269 —
$ 31,099,637 —
Fiscal Year Ending June 30
CITY OF BEVERLY HILLS, CALIFORNIA Notes to Basic Financial Statements
For the year ended June 30, 2013
87
(14) SEPARATION OF THE PARKING AUTHORITY OF THE CITY OF BEVERLY HILLS
A. Background
On September 30, 2011, certain City parking assets were transferred from the City to The Parking Authority, pursuant to a Purchase and Sale Agreement dated August 16, 2011. This transfer of assets was done to al-low the City to consolidate its parking operations under the control and oversight of The Parking Authority. The City retained control of two fa-cilities, 9333 West Third Street and 450 N. Rexford Drive, which provide visitor and employee parking for the office building at 331 Foothill Road, the City Public Works facility, City Hall, and the Civic Center complex.
On December 19, 2011, the City Council and The Parking Authority en-tered into a property management agreement for the management of The Parking Authority’s facilities. On July 1 of each year the agreement shall automatically renew for a period of one year unless either party gives written notice to the other on or before June 1 of any year that it has elected not to renew the agreement.
B. Contribution from the City’s General Fund
The Parking Authority continues to face economic challenges as its reve-nues from leased space and parking operations does not meet the opera-tional, debt service and capital expenditures necessary to operate the parking system. This gap is closed only through the contribution of funds totaling $4,123,100 from the City of Beverly Hills General Fund.
C. Net Investment in Capital Assets
I. City Parking Enterprise Fund
Transfer of Assets to Parking Authority
As noted in Section A above, the City’s Parking Enterprise Fund transferred the majority of its assets, including its parking facilities, to The Parking Authority. Although fixed assets were transferred to The Parking Authority, the related debt which was issued to con-struct those assets was not transferred. The related debt used to construct those assets continues to be collateralized by the City, and the issuance of said debt continues to be tied to City’s credit wor-thiness for repayment. Therefore, they are the obligations of the City and have not been transferred to The Parking Authority. This set of circumstances was also used as criteria in the qualification of The Parking Authority to be recognized as a blended component unit of the City. Please see Note 1 on pages 43-44 for more details.
Impact
The impact of this transfer of assets from the City’s Parking Enter-prise Fund to The Parking Authority has resulted in the assets of
the Parking Enterprise fund to be less than its liabilities, thus a net position deficit has been reported. The net position deficit of the Parking Enterprise fund at June 30, 2013 is $12,057,142.
The line item Net Investment in Capital Assets within the Net Posi-tion section of the Statement of Net Position has also resulted in a negative amount. As noted in Section A of this footnote, the only parking facilities which remained with the City were 9333 West Third Street and 450 N. Rexford Drive. The negative number with-in this line item results from the historical value of these facilities, net of accumulated depreciation, having a value which is less than the debt related to these facilities and the facilities transferred to The Parking Authority. The value of Net Investment in Capital As-sets for the Parking Enterprise fund as of June 30, 2013 is negative $43,010,588.
II. Parking Authority
Background
As stated in Note 1, Summary of Significant Accounting Policies on page 48, “In the government-wide financial statements and pro-prietary fund financial statements, net position is displayed in three components: net investment in capital assets, restricted net position and unrestricted net position.”
The Governmental Accounting Standards Board Statement Number 34 (GASB 34) paragraph 33 defines the line item of “Net Invest-ment in Capital Assets” as, “This component of net position con-sists of capital assets including restricted capital assets, net of ac-cumulated depreciation and reduced by the outstanding balances of any bonds, mortgages, notes, or other borrowings that are attributa-ble to the acquisition, construction, or improvement of those as-sets.”
The Parking Authority Advances From Other Funds
Prior to The Parking Authority separation, the City’s Parking En-terprise fund (of the Business-type activities) had entered into long-term borrowing arrangements with the General Fund, the Parks and Recreation Facilities Special Revenue Fund, as well as the Capital Assets Internal Service Fund in order to finance construction of the parking lots at “Beverly Canon” (438 N Beverly Dr/439 N Canon Dr.), and at the “Public Gardens Parking Facility” (242 N Beverly Dr/241 N Canon Dr.). Between these different funds, these types of borrowings are referred to as “Advances to/from other funds”.
CITY OF BEVERLY HILLS, CALIFORNIA Notes to Basic Financial Statements
For the year ended June 30, 2013
88
(14) SEPARATION OF THE PARKING AUTHORITY OF THE CITY OF BEVERLY HILLS, CONTINUED
Management’s decision for the Parking Enterprise Fund to finance construction of these parking lots via advances from other funds was based on the benefit that those funds would receive by invest-ing their idle cash into the City’s parking structures which included retail space. The terms of the advances are stated on page 63 in Note 6. The terms of the borrowings are comparable to terms the City is restricted to when seeking external sources of financing. However, as a result of The Parking Authority’s separation from the City’s Parking Enterprise fund, these liabilities were transferred to The Parking Authority. From a legal standpoint, The Parking Authority is a legally separate entity from the City. However, the Governmental Accounting Standards Board (GASB)’s criteria for the qualification of a blended component unit, treats The Parking Authority as a component of the City, and therefore requires The Parking Authority to be treated as another fund of the City. This treatment results in the classification of these borrowings to remain as Advances From Other Funds. Although they are currently the li-ability of another legal entity (The Parking Authority), since that entity is a blended component unit, the classification of these bor-rowings may not be reclassified as Notes Payable. For further in-formation about blended component units, please see Note 1 on pages 43-44.
These various borrowing arrangements, as well as their respective repayment schedules were approved by the City Council via budget resolutions restricting portions of the Parking Enterprise’s fund balance solely for repayment of these advances. [A listing of the balances of these advances (which have been transferred to The Parking Authority) at June 30, 2013 is shown in Note 6 on page 63.] These advances to the Parking Enterprise fund are what fi-nanced the construction of the aforementioned parking lots, and since The Parking Authority is now obligated to and has arranged to repay these borrowings, these advances constitute debt within this fund. In total, as of June 30, 2013, The Parking Authority has $52,568,855 outstanding in Advances from other funds.
Adherence to Authoritative Accounting Guidelines
As stated in Note 1, private-sector standards of accounting and fi-nancial reporting issued prior to December 1, 1989, generally are followed in both the government-wide and proprietary fund finan-cial statements to the extent that those standards do not conflict with or contradict guidance of the GASB. The City also has the option of following subsequent private-sector guidance for its busi-ness-type activities and enterprise funds, subject to the same limita-
tion. The City has elected not to follow subsequent private-sector guidance.
While electing not to contradict the guidance of GASB and taking the above accounting policy into consideration, the City must fol-low the GASB-Implementation-guide ruling in Chapter 7, Section 7.23 on “Net Investment in Capital Assets”. In this section of the implementation guide, a question was posed to GASB as follows, “Q – A government made an interfund loan from its general fund to an enterprise fund for the purpose of purchasing capital assets. Does the advance due to the general fund constitute capital-related debt in the enterprise fund?”
The answer given by GASB states, “A – No. Internal Advances are not considered debt or other borrowing for purposes of calculating the net position components. Internal balances enter into the com-putation of unrestricted net position.”
Impact
Unfortunately, by adhering to this interpretation of GASB, which denies that internal advances constitute debt, the calculation of the line item “Net Investment in Capital Assets” then excludes the in-ternal advances used to finance The Parking Authority’s capital as-sets which amount to $112,358,869 as of June 30, 2013. Although the assets constructed are required to be included in this line item, the related debt is required to be excluded per this GASB interpre-tation.
It is the opinion of the City of Beverly Hills Management, that this answer given by GASB in the implementation guide is a contradic-tion to GASB 34 paragraph 33, i.e. to leave interfund borrowings out of the equation for Net Investment in Capital assets is a contra-diction to paragraph 33.
If the capital assets constructed with these borrowings are included in this classification of net position, then the related debt should al-so be included in the same classification. This is what the title of this net position component is describing, and the contents of that line item should properly reflect the name.
Substance Over Form
Further, it is the opinion of the City of Beverly Hills Management, that to remove interfund borrowings from the Net Investment in Capital Assets equation is misleading to financial statement users. The IASB (International Accounting Standards Board) Framework says that, “to be reliable, information must represent faithfully the transactions and other events it either purports to represent or could reasonably be expected to represent. Further, to be representational-
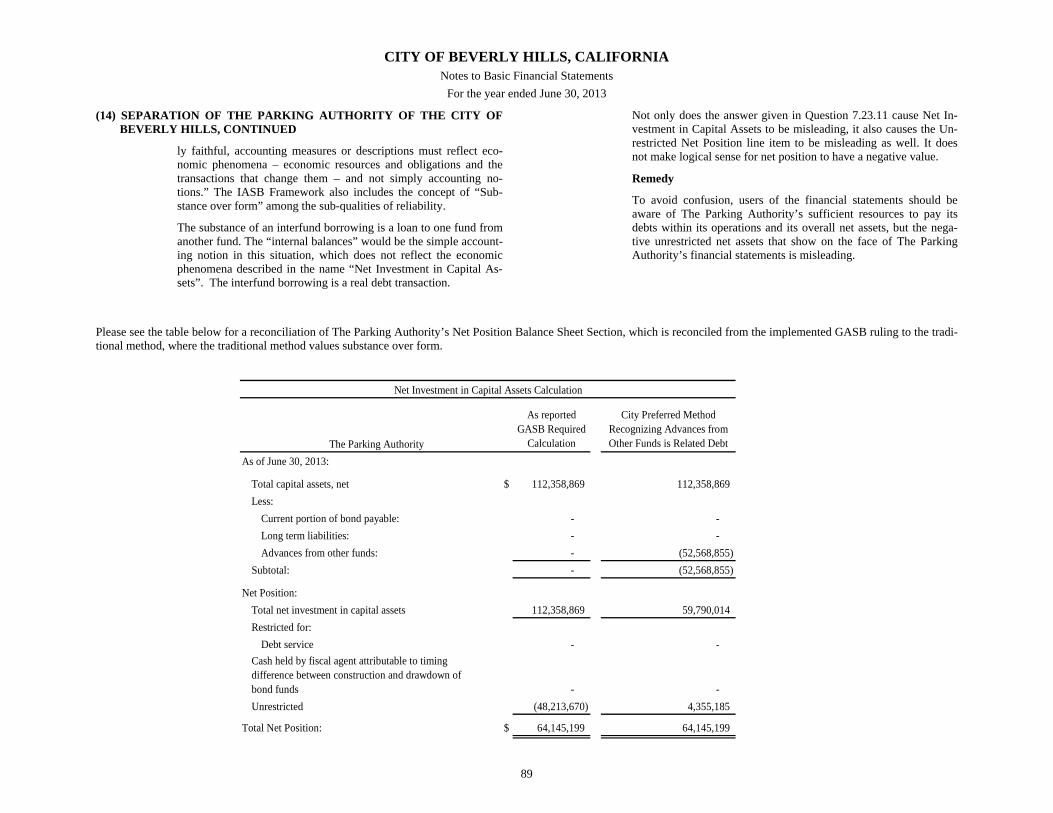
CITY OF BEVERLY HILLS, CALIFORNIA Notes to Basic Financial Statements
For the year ended June 30, 2013
89
(14) SEPARATION OF THE PARKING AUTHORITY OF THE CITY OF BEVERLY HILLS, CONTINUED
ly faithful, accounting measures or descriptions must reflect eco-nomic phenomena – economic resources and obligations and the transactions that change them – and not simply accounting no-tions.” The IASB Framework also includes the concept of “Sub-stance over form” among the sub-qualities of reliability.
The substance of an interfund borrowing is a loan to one fund from another fund. The “internal balances” would be the simple account-ing notion in this situation, which does not reflect the economic phenomena described in the name “Net Investment in Capital As-sets”. The interfund borrowing is a real debt transaction.
Not only does the answer given in Question 7.23.11 cause Net In-vestment in Capital Assets to be misleading, it also causes the Un-restricted Net Position line item to be misleading as well. It does not make logical sense for net position to have a negative value.
Remedy
To avoid confusion, users of the financial statements should be aware of The Parking Authority’s sufficient resources to pay its debts within its operations and its overall net assets, but the nega-tive unrestricted net assets that show on the face of The Parking Authority’s financial statements is misleading.
Please see the table below for a reconciliation of The Parking Authority’s Net Position Balance Sheet Section, which is reconciled from the implemented GASB ruling to the tradi-tional method, where the traditional method values substance over form.
As reportedGASB Required
Calculation
City Preferred MethodRecognizing Advances fromOther Funds is Related Debt
As of June 30, 2013:
Total capital assets, net $ 112,358,869 112,358,869 Less:
Current portion of bond payable: - - Long term liabilities: - - Advances from other funds: - (52,568,855)
Subtotal: - (52,568,855)
Net Position:Total net investment in capital assets 112,358,869 59,790,014 Restricted for:
Debt service - -
- - Unrestricted (48,213,670) 4,355,185
Total Net Position: $ 64,145,199 64,145,199
The Parking Authority
Net Investment in Capital Assets Calculation
Cash held by fiscal agent attributable to timing difference between construction and drawdown of bond funds
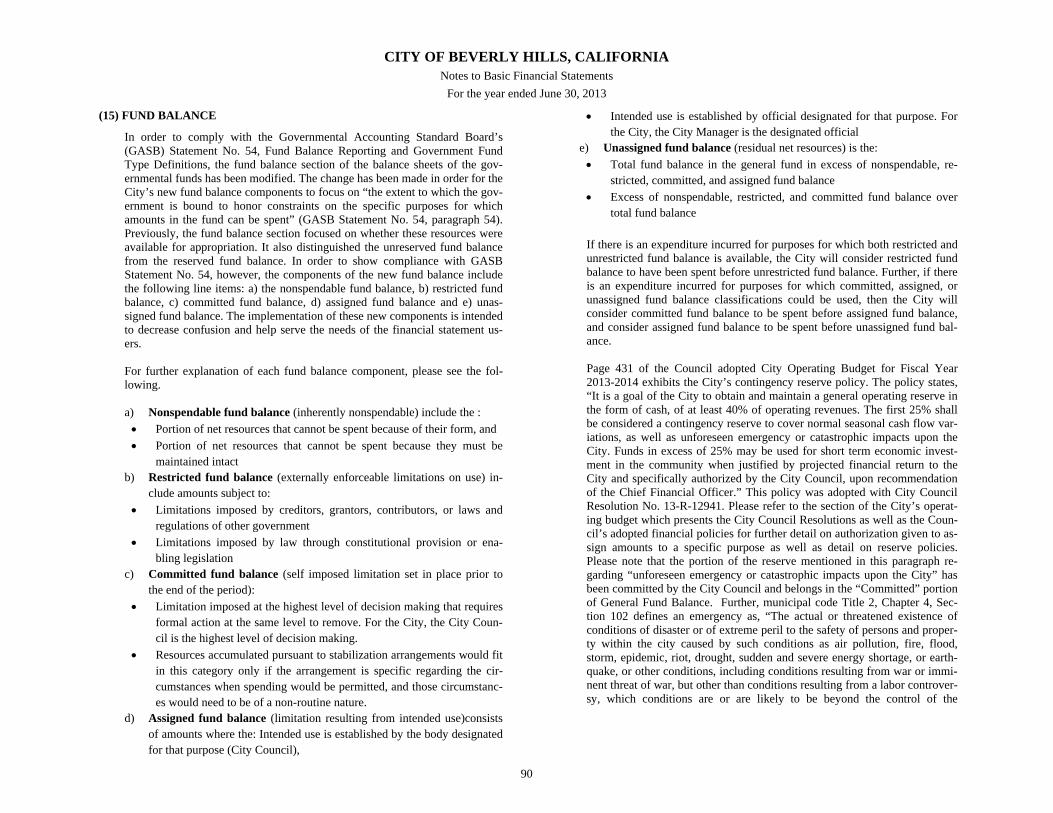
CITY OF BEVERLY HILLS, CALIFORNIA Notes to Basic Financial Statements
For the year ended June 30, 2013
90
(15) FUND BALANCE
In order to comply with the Governmental Accounting Standard Board’s (GASB) Statement No. 54, Fund Balance Reporting and Government Fund Type Definitions, the fund balance section of the balance sheets of the gov-ernmental funds has been modified. The change has been made in order for the City’s new fund balance components to focus on “the extent to which the gov-ernment is bound to honor constraints on the specific purposes for which amounts in the fund can be spent” (GASB Statement No. 54, paragraph 54). Previously, the fund balance section focused on whether these resources were available for appropriation. It also distinguished the unreserved fund balance from the reserved fund balance. In order to show compliance with GASB Statement No. 54, however, the components of the new fund balance include the following line items: a) the nonspendable fund balance, b) restricted fund balance, c) committed fund balance, d) assigned fund balance and e) unas-signed fund balance. The implementation of these new components is intended to decrease confusion and help serve the needs of the financial statement us-ers.
For further explanation of each fund balance component, please see the fol-lowing.
a) Nonspendable fund balance (inherently nonspendable) include the : Portion of net resources that cannot be spent because of their form, and Portion of net resources that cannot be spent because they must be
maintained intact b) Restricted fund balance (externally enforceable limitations on use) in-
clude amounts subject to: Limitations imposed by creditors, grantors, contributors, or laws and
regulations of other government Limitations imposed by law through constitutional provision or ena-
bling legislation c) Committed fund balance (self imposed limitation set in place prior to
the end of the period): Limitation imposed at the highest level of decision making that requires
formal action at the same level to remove. For the City, the City Coun-cil is the highest level of decision making.
Resources accumulated pursuant to stabilization arrangements would fit in this category only if the arrangement is specific regarding the cir-cumstances when spending would be permitted, and those circumstanc-es would need to be of a non-routine nature.
d) Assigned fund balance (limitation resulting from intended use)consists of amounts where the: Intended use is established by the body designated for that purpose (City Council),
Intended use is established by official designated for that purpose. For the City, the City Manager is the designated official
e) Unassigned fund balance (residual net resources) is the: Total fund balance in the general fund in excess of nonspendable, re-
stricted, committed, and assigned fund balance Excess of nonspendable, restricted, and committed fund balance over
total fund balance
If there is an expenditure incurred for purposes for which both restricted and unrestricted fund balance is available, the City will consider restricted fund balance to have been spent before unrestricted fund balance. Further, if there is an expenditure incurred for purposes for which committed, assigned, or unassigned fund balance classifications could be used, then the City will consider committed fund balance to be spent before assigned fund balance, and consider assigned fund balance to be spent before unassigned fund bal-ance.
Page 431 of the Council adopted City Operating Budget for Fiscal Year 2013-2014 exhibits the City’s contingency reserve policy. The policy states, “It is a goal of the City to obtain and maintain a general operating reserve in the form of cash, of at least 40% of operating revenues. The first 25% shall be considered a contingency reserve to cover normal seasonal cash flow var-iations, as well as unforeseen emergency or catastrophic impacts upon the City. Funds in excess of 25% may be used for short term economic invest-ment in the community when justified by projected financial return to the City and specifically authorized by the City Council, upon recommendation of the Chief Financial Officer.” This policy was adopted with City Council Resolution No. 13-R-12941. Please refer to the section of the City’s operat-ing budget which presents the City Council Resolutions as well as the Coun-cil’s adopted financial policies for further detail on authorization given to as-sign amounts to a specific purpose as well as detail on reserve policies. Please note that the portion of the reserve mentioned in this paragraph re-garding “unforeseen emergency or catastrophic impacts upon the City” has been committed by the City Council and belongs in the “Committed” portion of General Fund Balance. Further, municipal code Title 2, Chapter 4, Sec-tion 102 defines an emergency as, “The actual or threatened existence of conditions of disaster or of extreme peril to the safety of persons and proper-ty within the city caused by such conditions as air pollution, fire, flood, storm, epidemic, riot, drought, sudden and severe energy shortage, or earth-quake, or other conditions, including conditions resulting from war or immi-nent threat of war, but other than conditions resulting from a labor controver-sy, which conditions are or are likely to be beyond the control of the
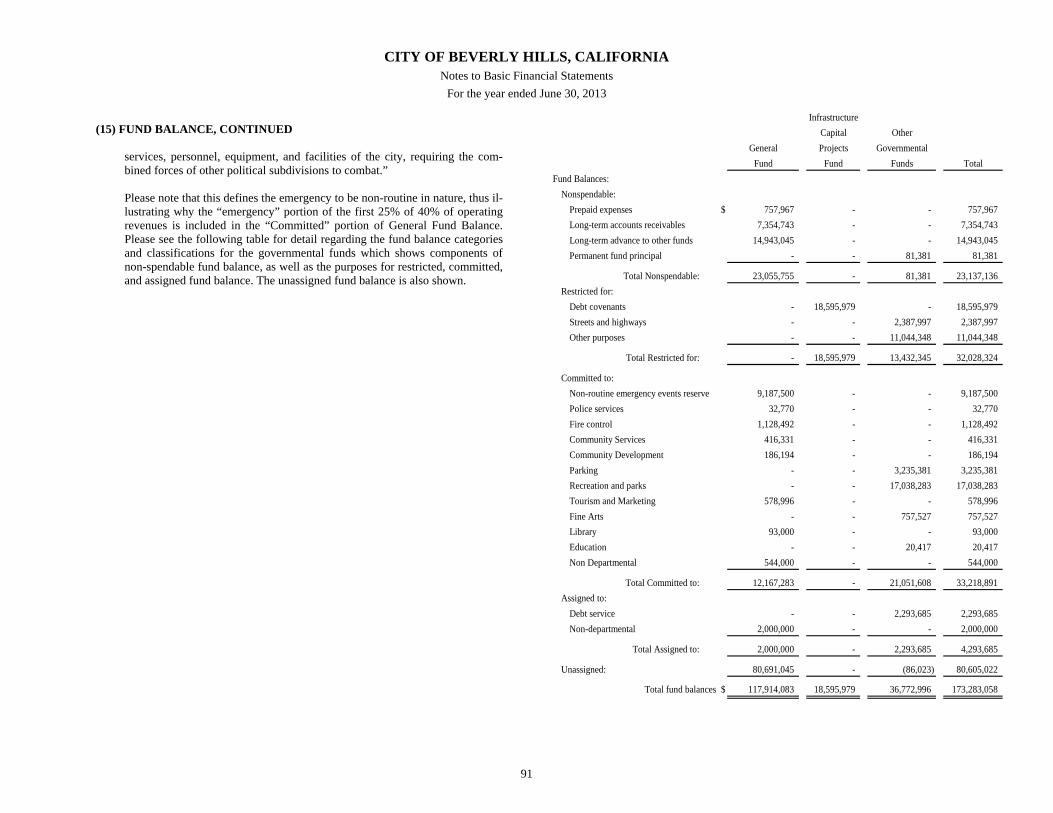
CITY OF BEVERLY HILLS, CALIFORNIA Notes to Basic Financial Statements
For the year ended June 30, 2013
91
(15) FUND BALANCE, CONTINUED
services, personnel, equipment, and facilities of the city, requiring the com-bined forces of other political subdivisions to combat.” Please note that this defines the emergency to be non-routine in nature, thus il-lustrating why the “emergency” portion of the first 25% of 40% of operating revenues is included in the “Committed” portion of General Fund Balance. Please see the following table for detail regarding the fund balance categories and classifications for the governmental funds which shows components of non-spendable fund balance, as well as the purposes for restricted, committed, and assigned fund balance. The unassigned fund balance is also shown.
InfrastructureCapital Other
General Projects GovernmentalFund Fund Funds Total
Fund Balances:Nonspendable:
Prepaid expenses $ 757,967 - - 757,967 Long-term accounts receivables 7,354,743 - - 7,354,743 Long-term advance to other funds 14,943,045 - - 14,943,045 Permanent fund principal - - 81,381 81,381
Total Nonspendable: 23,055,755 - 81,381 23,137,136 Restricted for:
Debt covenants - 18,595,979 - 18,595,979 Streets and highways - - 2,387,997 2,387,997 Other purposes - - 11,044,348 11,044,348
Total Restricted for: - 18,595,979 13,432,345 32,028,324
Committed to:Non-routine emergency events reserve 9,187,500 - - 9,187,500 Police services 32,770 - - 32,770 Fire control 1,128,492 - - 1,128,492 Community Services 416,331 - - 416,331 Community Development 186,194 - - 186,194 Parking - - 3,235,381 3,235,381 Recreation and parks - - 17,038,283 17,038,283 Tourism and Marketing 578,996 - - 578,996 Fine Arts - - 757,527 757,527 Library 93,000 - - 93,000 Education - - 20,417 20,417 Non Departmental 544,000 - - 544,000
Total Committed to: 12,167,283 - 21,051,608 33,218,891 Assigned to:
Debt service - - 2,293,685 2,293,685 Non-departmental 2,000,000 - - 2,000,000
Total Assigned to: 2,000,000 - 2,293,685 4,293,685
Unassigned: 80,691,045 - (86,023) 80,605,022
Total fund balances $ 117,914,083 18,595,979 36,772,996 173,283,058
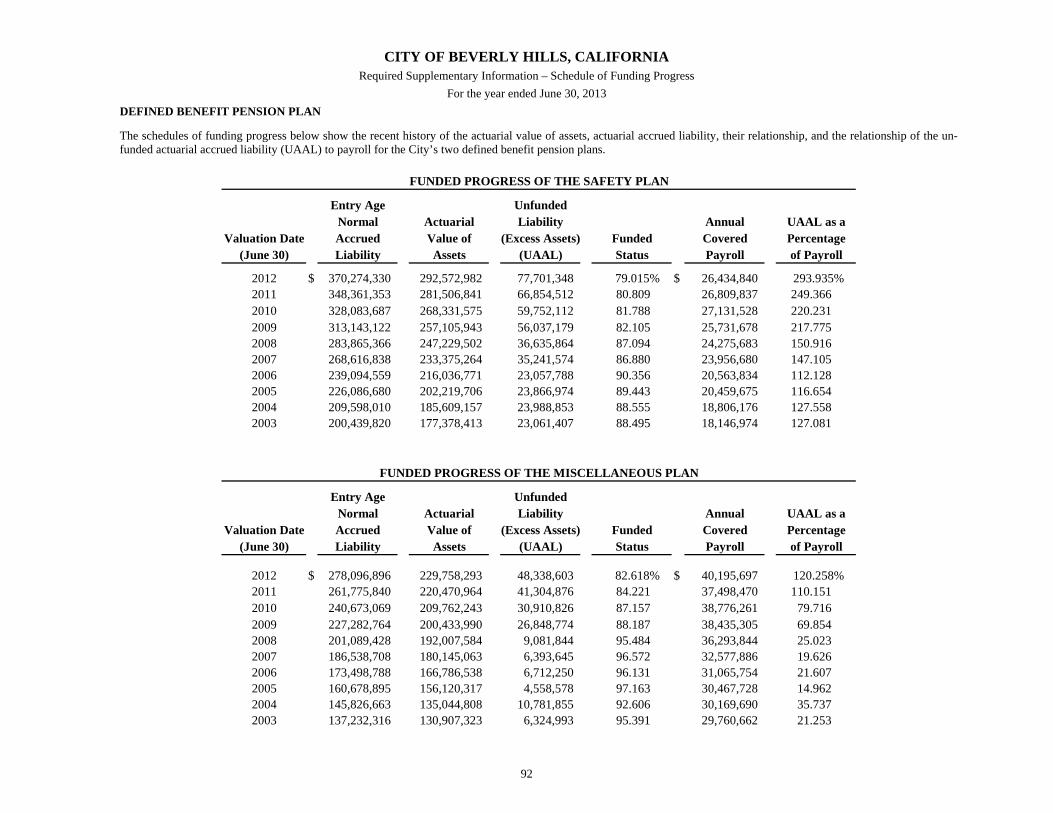
CITY OF BEVERLY HILLS, CALIFORNIA Required Supplementary Information – Schedule of Funding Progress
For the year ended June 30, 2013
92
DEFINED BENEFIT PENSION PLAN
The schedules of funding progress below show the recent history of the actuarial value of assets, actuarial accrued liability, their relationship, and the relationship of the un-funded actuarial accrued liability (UAAL) to payroll for the City’s two defined benefit pension plans.
Entry Age UnfundedNormal Actuarial Liability Annual UAAL as a
Valuation Date Accrued Value of (Excess Assets) Funded Covered Percentage(June 30) Liability Assets (UAAL) Status Payroll of Payroll
2012 $ 370,274,330 292,572,982 77,701,348 79.015% $ 26,434,840 293.935% 2011 348,361,353 281,506,841 66,854,512 80.809 26,809,837 249.366 2010 328,083,687 268,331,575 59,752,112 81.788 27,131,528 220.231 2009 313,143,122 257,105,943 56,037,179 82.105 25,731,678 217.775 2008 283,865,366 247,229,502 36,635,864 87.094 24,275,683 150.916 2007 268,616,838 233,375,264 35,241,574 86.880 23,956,680 147.105 2006 239,094,559 216,036,771 23,057,788 90.356 20,563,834 112.128 2005 226,086,680 202,219,706 23,866,974 89.443 20,459,675 116.654 2004 209,598,010 185,609,157 23,988,853 88.555 18,806,176 127.558 2003 200,439,820 177,378,413 23,061,407 88.495 18,146,974 127.081
Entry Age UnfundedNormal Actuarial Liability Annual UAAL as a
Valuation Date Accrued Value of (Excess Assets) Funded Covered Percentage(June 30) Liability Assets (UAAL) Status Payroll of Payroll
2012 $ 278,096,896 229,758,293 48,338,603 82.618% $ 40,195,697 120.258% 2011 261,775,840 220,470,964 41,304,876 84.221 37,498,470 110.151 2010 240,673,069 209,762,243 30,910,826 87.157 38,776,261 79.716 2009 227,282,764 200,433,990 26,848,774 88.187 38,435,305 69.854 2008 201,089,428 192,007,584 9,081,844 95.484 36,293,844 25.023 2007 186,538,708 180,145,063 6,393,645 96.572 32,577,886 19.626 2006 173,498,788 166,786,538 6,712,250 96.131 31,065,754 21.607 2005 160,678,895 156,120,317 4,558,578 97.163 30,467,728 14.962 2004 145,826,663 135,044,808 10,781,855 92.606 30,169,690 35.737 2003 137,232,316 130,907,323 6,324,993 95.391 29,760,662 21.253
FUNDED PROGRESS OF THE SAFETY PLAN
FUNDED PROGRESS OF THE MISCELLANEOUS PLAN
CITY OF BEVERLY HILLS, CALIFORNIA Required Supplementary Information – Schedule of Funding Progress
For the year ended June 30, 2013
93
OTHER POST EMPLOYMENT BENEFITS (OPEB) PLAN
The schedule of funding progress below shows the recent history of the actuarial value of assets, actuarial accrued liability, their relationship, and the relationship of the un-funded actuarial accrued liability (UAAL) to payroll for the City’s OPEB plans.
Entry Age UnfundedNormal Actuarial Liability Annual UAAL as a
Valuation Date Accrued Value of (Excess Assets) Funded Covered Percentage(June 30) Liability Assets (UAAL) Status Payroll of Payroll
2013 $ 48,999,000 — 48,999,000 — $ 77,686,000 63.073 %2011 52,688,000 — 52,688,000 — 71,261,000 73.937 2009 57,787,000 — 57,787,000 — 61,551,189 93.884
FUNDED PROGRESS OF THE OPEB PLAN
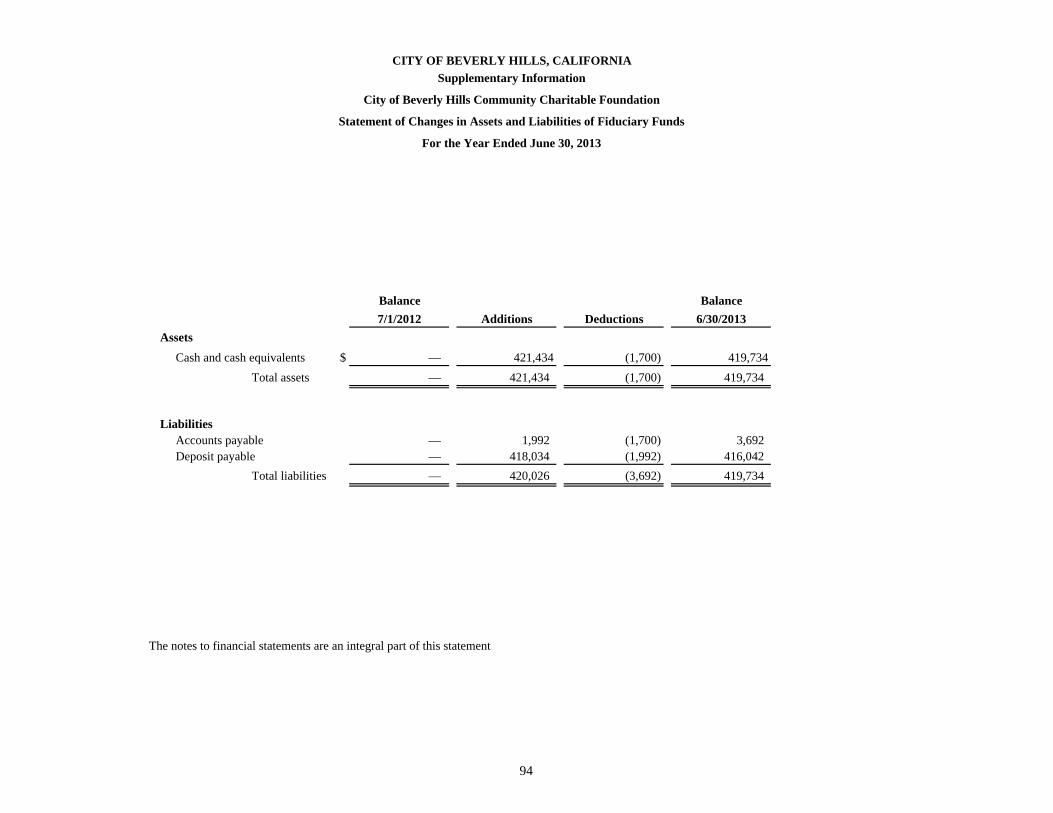
Balance Balance7/1/2012 Additions Deductions 6/30/2013
AssetsCash and cash equivalents $ — 421,434 (1,700) 419,734
Total assets — 421,434 (1,700) 419,734
LiabilitiesAccounts payable — 1,992 (1,700) 3,692Deposit payable — 418,034 (1,992) 416,042
Total liabilities — 420,026 (3,692) 419,734
The notes to financial statements are an integral part of this statement
Supplementary Information
City of Beverly Hills Community Charitable Foundation
CITY OF BEVERLY HILLS, CALIFORNIA
Statement of Changes in Assets and Liabilities of Fiduciary Funds
For the Year Ended June 30, 2013
94


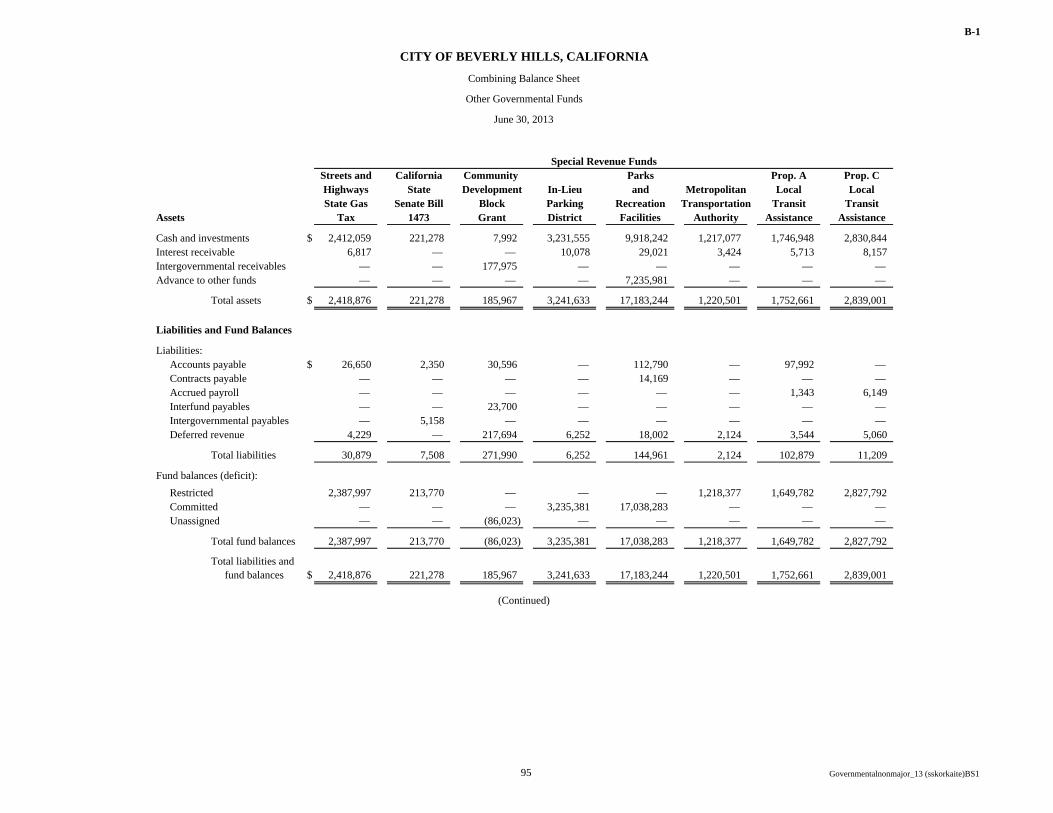
B-1
Streets and California Community Parks Prop. A Prop. CHighways State Development In-Lieu and Metropolitan Local LocalState Gas Senate Bill Block Parking Recreation Transportation Transit Transit
Tax 1473 Grant District Facilities Authority Assistance Assistance
Cash and investments $ 2,412,059 221,278 7,992 3,231,555 9,918,242 1,217,077 1,746,948 2,830,844Interest receivable 6,817 — — 10,078 29,021 3,424 5,713 8,157Intergovernmental receivables — — 177,975 — — — — — Advance to other funds — — — — 7,235,981 — — —
Total assets $ 2,418,876 221,278 185,967 3,241,633 17,183,244 1,220,501 1,752,661 2,839,001
Liabilities:Accounts payable $ 26,650 2,350 30,596 — 112,790 — 97,992 — Contracts payable — — — — 14,169 — — — Accrued payroll — — — — — — 1,343 6,149Interfund payables — — 23,700 — — — — — Intergovernmental payables — 5,158 — — — — — — Deferred revenue 4,229 — 217,694 6,252 18,002 2,124 3,544 5,060
Total liabilities 30,879 7,508 271,990 6,252 144,961 2,124 102,879 11,209
Fund balances (deficit):Restricted 2,387,997 213,770 — — — 1,218,377 1,649,782 2,827,792Committed — — — 3,235,381 17,038,283 — — — Unassigned — — (86,023) — — — — —
Total fund balances 2,387,997 213,770 (86,023) 3,235,381 17,038,283 1,218,377 1,649,782 2,827,792
Total liabilities andfund balances $ 2,418,876 221,278 185,967 3,241,633 17,183,244 1,220,501 1,752,661 2,839,001
(Continued)
CITY OF BEVERLY HILLS, CALIFORNIA
Combining Balance Sheet
Other Governmental Funds
June 30, 2013
Assets
Liabilities and Fund Balances
Special Revenue Funds
95 Governmentalnonmajor_13 (sskorkaite)BS1
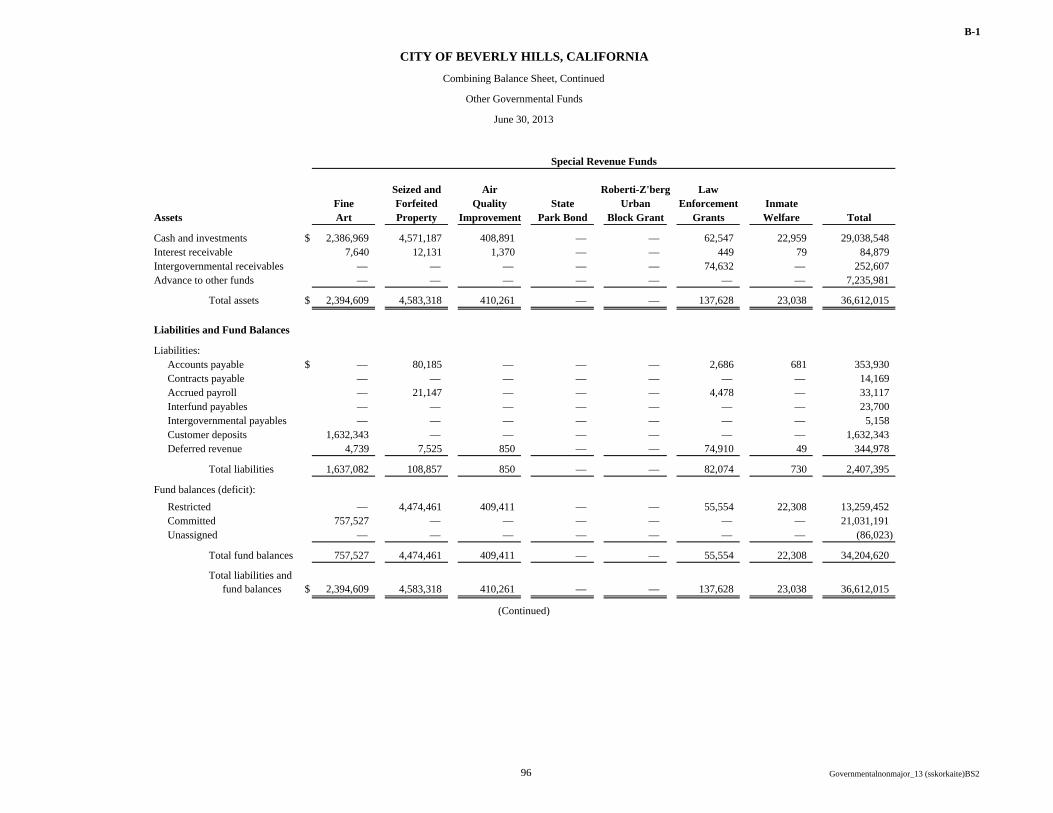
B-1
Seized and Air Roberti-Z'berg LawFine Forfeited Quality State Urban Enforcement InmateArt Property Improvement Park Bond Block Grant Grants Welfare Total
Cash and investments $ 2,386,969 4,571,187 408,891 — — 62,547 22,959 29,038,548Interest receivable 7,640 12,131 1,370 — — 449 79 84,879Intergovernmental receivables — — — — — 74,632 — 252,607Advance to other funds — — — — — — — 7,235,981
Total assets $ 2,394,609 4,583,318 410,261 — — 137,628 23,038 36,612,015
Liabilities:Accounts payable $ — 80,185 — — — 2,686 681 353,930Contracts payable — — — — — — — 14,169Accrued payroll — 21,147 — — — 4,478 — 33,117Interfund payables — — — — — — — 23,700Intergovernmental payables — — — — — — — 5,158Customer deposits 1,632,343 — — — — — — 1,632,343Deferred revenue 4,739 7,525 850 — — 74,910 49 344,978
Total liabilities 1,637,082 108,857 850 — — 82,074 730 2,407,395
Fund balances (deficit):Restricted — 4,474,461 409,411 — — 55,554 22,308 13,259,452Committed 757,527 — — — — — — 21,031,191Unassigned — — — — — — — (86,023)
Total fund balances 757,527 4,474,461 409,411 — — 55,554 22,308 34,204,620
Total liabilities andfund balances $ 2,394,609 4,583,318 410,261 — — 137,628 23,038 36,612,015
CITY OF BEVERLY HILLS, CALIFORNIA
Combining Balance Sheet, Continued
Other Governmental Funds
June 30, 2013
(Continued)
Assets
Liabilities and Fund Balances
Special Revenue Funds
96 Governmentalnonmajor_13 (sskorkaite)BS2
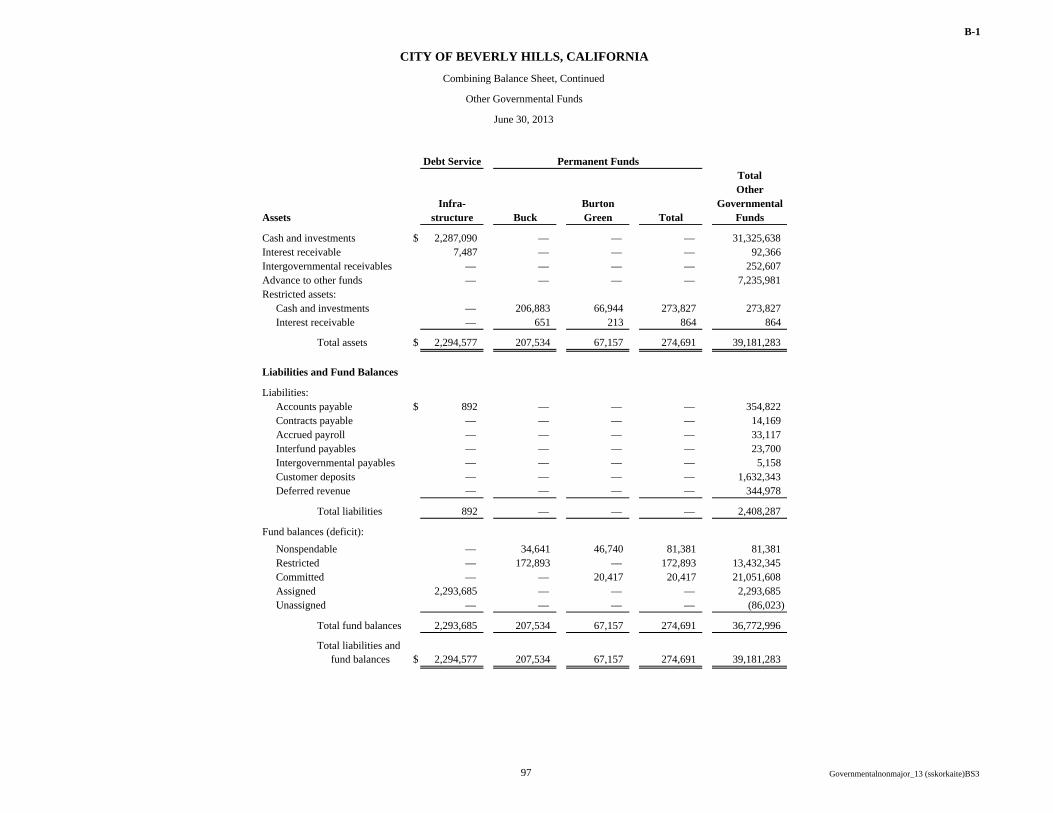
B-1
Debt ServiceTotalOther
Infra- Burton Governmentalstructure Buck Green Total Funds
Cash and investments $ 2,287,090 — — — 31,325,638Interest receivable 7,487 — — — 92,366Intergovernmental receivables — — — — 252,607Advance to other funds — — — — 7,235,981Restricted assets:
Cash and investments — 206,883 66,944 273,827 273,827Interest receivable — 651 213 864 864
Total assets $ 2,294,577 207,534 67,157 274,691 39,181,283
Liabilities:Accounts payable $ 892 — — — 354,822Contracts payable — — — — 14,169Accrued payroll — — — — 33,117Interfund payables — — — — 23,700Intergovernmental payables — — — — 5,158Customer deposits — — — — 1,632,343Deferred revenue — — — — 344,978
Total liabilities 892 — — — 2,408,287
Fund balances (deficit):Nonspendable — 34,641 46,740 81,381 81,381Restricted — 172,893 — 172,893 13,432,345Committed — — 20,417 20,417 21,051,608Assigned 2,293,685 — — — 2,293,685Unassigned — — — — (86,023)
Total fund balances 2,293,685 207,534 67,157 274,691 36,772,996
Total liabilities andfund balances $ 2,294,577 207,534 67,157 274,691 39,181,283
CITY OF BEVERLY HILLS, CALIFORNIA
Combining Balance Sheet, Continued
Other Governmental Funds
June 30, 2013
Liabilities and Fund Balances
Permanent Funds
Assets
97 Governmentalnonmajor_13 (sskorkaite)BS3
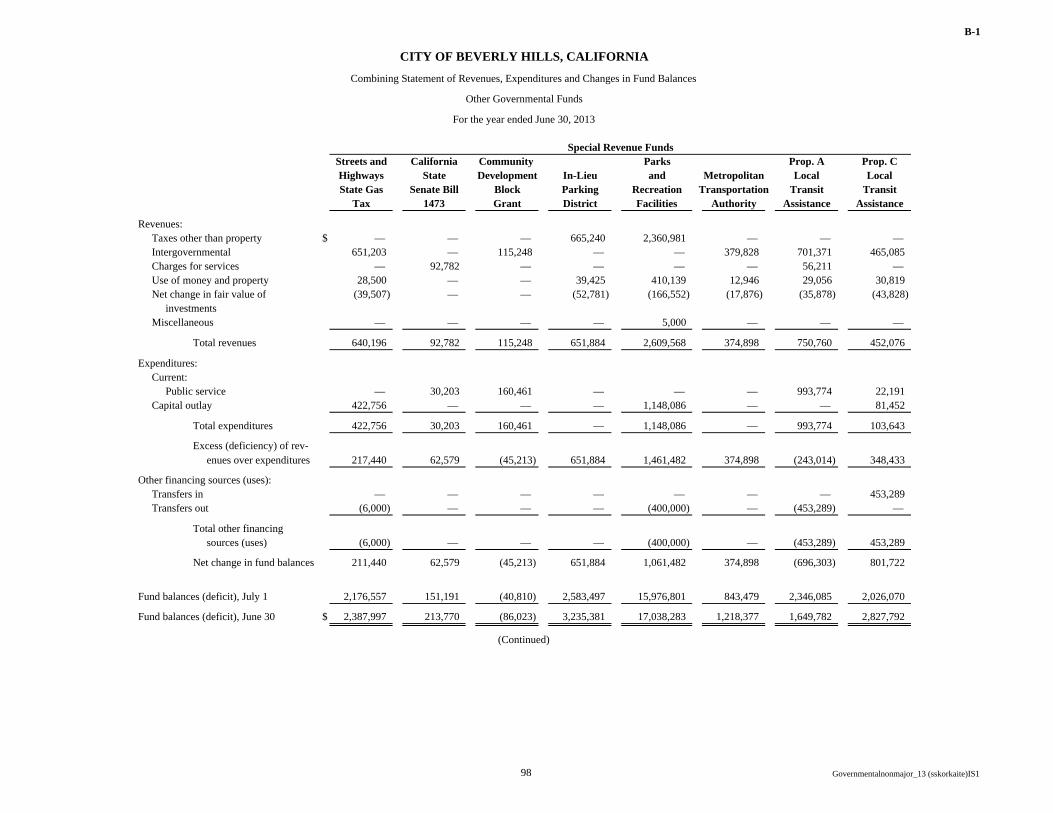
B-1
Streets and California Community Parks Prop. A Prop. CHighways State Development In-Lieu and Metropolitan Local LocalState Gas Senate Bill Block Parking Recreation Transportation Transit Transit
Tax 1473 Grant District Facilities Authority Assistance Assistance
Revenues:Taxes other than property $ — — — 665,240 2,360,981 — — — Intergovernmental 651,203 — 115,248 — — 379,828 701,371 465,085Charges for services — 92,782 — — — — 56,211 — Use of money and property 28,500 — — 39,425 410,139 12,946 29,056 30,819Net change in fair value of (39,507) — — (52,781) (166,552) (17,876) (35,878) (43,828)
investmentsMiscellaneous — — — — 5,000 — — —
Total revenues 640,196 92,782 115,248 651,884 2,609,568 374,898 750,760 452,076
Expenditures:Current:
Public service — 30,203 160,461 — — — 993,774 22,191Capital outlay 422,756 — — — 1,148,086 — — 81,452
Total expenditures 422,756 30,203 160,461 — 1,148,086 — 993,774 103,643
Excess (deficiency) of rev-enues over expenditures 217,440 62,579 (45,213) 651,884 1,461,482 374,898 (243,014) 348,433
Other financing sources (uses):Transfers in — — — — — — — 453,289Transfers out (6,000) — — — (400,000) — (453,289) —
Total other financingsources (uses) (6,000) — — — (400,000) — (453,289) 453,289
Net change in fund balances 211,440 62,579 (45,213) 651,884 1,061,482 374,898 (696,303) 801,722
2,176,557 151,191 (40,810) 2,583,497 15,976,801 843,479 2,346,085 2,026,070
Fund balances (deficit), June 30 $ 2,387,997 213,770 (86,023) 3,235,381 17,038,283 1,218,377 1,649,782 2,827,792
(Continued)
CITY OF BEVERLY HILLS, CALIFORNIA
Combining Statement of Revenues, Expenditures and Changes in Fund Balances
Other Governmental Funds
For the year ended June 30, 2013
Special Revenue Funds
Fund balances (deficit), July 1
98 Governmentalnonmajor_13 (sskorkaite)IS1
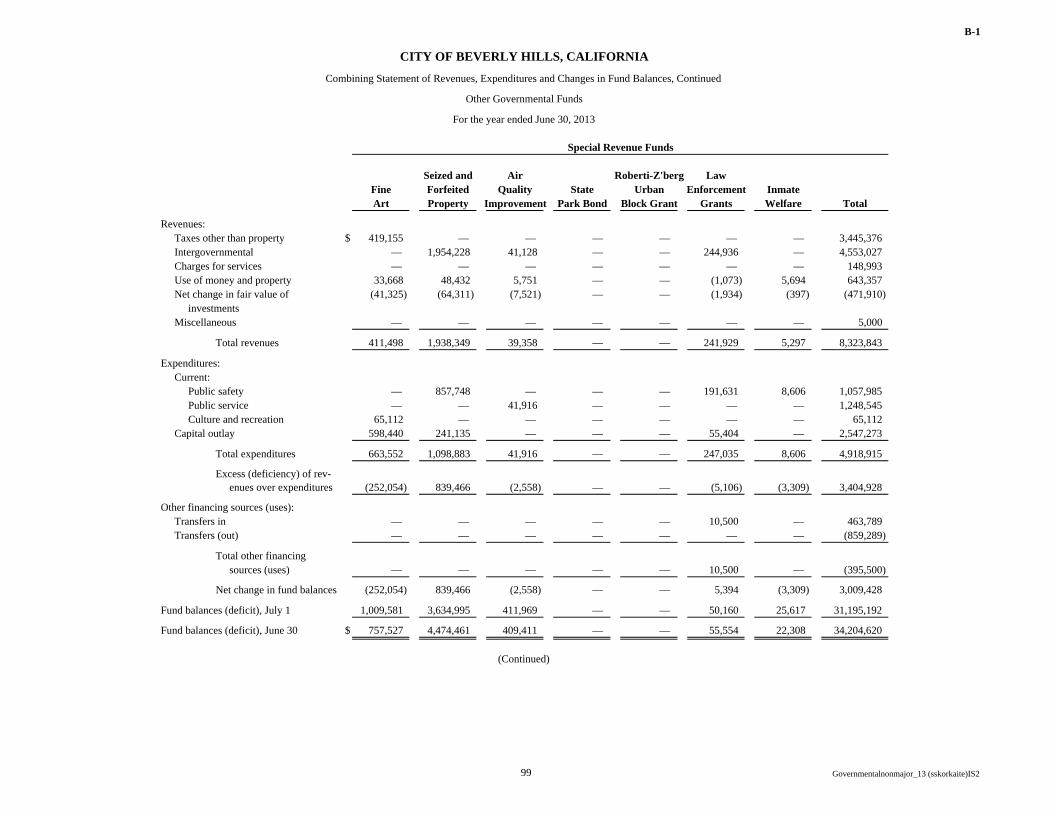
B-1
Seized and Air Roberti-Z'berg LawFine Forfeited Quality State Urban Enforcement InmateArt Property Improvement Park Bond Block Grant Grants Welfare Total
Revenues:Taxes other than property $ 419,155 — — — — — — 3,445,376Intergovernmental — 1,954,228 41,128 — — 244,936 — 4,553,027Charges for services — — — — — — — 148,993Use of money and property 33,668 48,432 5,751 — — (1,073) 5,694 643,357Net change in fair value of (41,325) (64,311) (7,521) — — (1,934) (397) (471,910)
investmentsMiscellaneous — — — — — — — 5,000
Total revenues 411,498 1,938,349 39,358 — — 241,929 5,297 8,323,843
Expenditures:Current:
Public safety — 857,748 — — — 191,631 8,606 1,057,985Public service — — 41,916 — — — — 1,248,545Culture and recreation 65,112 — — — — — — 65,112
Capital outlay 598,440 241,135 — — — 55,404 — 2,547,273
Total expenditures 663,552 1,098,883 41,916 — — 247,035 8,606 4,918,915
Excess (deficiency) of rev-enues over expenditures (252,054) 839,466 (2,558) — — (5,106) (3,309) 3,404,928
Other financing sources (uses):Transfers in — — — — — 10,500 — 463,789Transfers (out) — — — — — — — (859,289)
Total other financingsources (uses) — — — — — 10,500 — (395,500)
Net change in fund balances (252,054) 839,466 (2,558) — — 5,394 (3,309) 3,009,428
1,009,581 3,634,995 411,969 — — 50,160 25,617 31,195,192
Fund balances (deficit), June 30 $ 757,527 4,474,461 409,411 — — 55,554 22,308 34,204,620
(Continued)
Special Revenue Funds
CITY OF BEVERLY HILLS, CALIFORNIA
Combining Statement of Revenues, Expenditures and Changes in Fund Balances, Continued
Other Governmental Funds
For the year ended June 30, 2013
Fund balances (deficit), July 1
99 Governmentalnonmajor_13 (sskorkaite)IS2
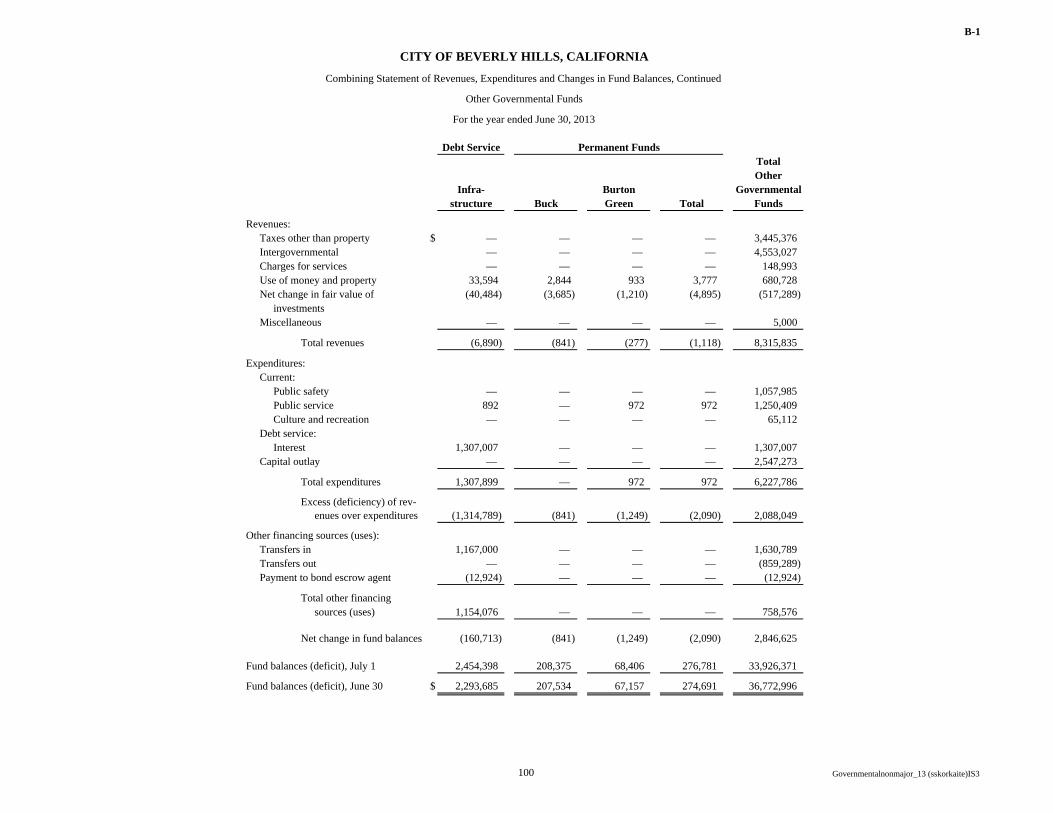
B-1
Debt ServiceTotalOther
Infra- Burton Governmentalstructure Buck Green Total Funds
Revenues:Taxes other than property $ — — — — 3,445,376Intergovernmental — — — — 4,553,027Charges for services — — — — 148,993Use of money and property 33,594 2,844 933 3,777 680,728Net change in fair value of (40,484) (3,685) (1,210) (4,895) (517,289)
investmentsMiscellaneous — — — — 5,000
Total revenues (6,890) (841) (277) (1,118) 8,315,835
Expenditures:Current:
Public safety — — — — 1,057,985Public service 892 — 972 972 1,250,409Culture and recreation — — — — 65,112
Debt service:Interest 1,307,007 — — — 1,307,007
Capital outlay — — — — 2,547,273
Total expenditures 1,307,899 — 972 972 6,227,786
Excess (deficiency) of rev-enues over expenditures (1,314,789) (841) (1,249) (2,090) 2,088,049
Other financing sources (uses):Transfers in 1,167,000 — — — 1,630,789Transfers out — — — — (859,289)Payment to bond escrow agent (12,924) — — — (12,924)
Total other financingsources (uses) 1,154,076 — — — 758,576
Net change in fund balances (160,713) (841) (1,249) (2,090) 2,846,625
2,454,398 208,375 68,406 276,781 33,926,371
Fund balances (deficit), June 30 $ 2,293,685 207,534 67,157 274,691 36,772,996
Fund balances (deficit), July 1
Permanent Funds
CITY OF BEVERLY HILLS, CALIFORNIA
Combining Statement of Revenues, Expenditures and Changes in Fund Balances, Continued
Other Governmental Funds
For the year ended June 30, 2013
100 Governmentalnonmajor_13 (sskorkaite)IS3
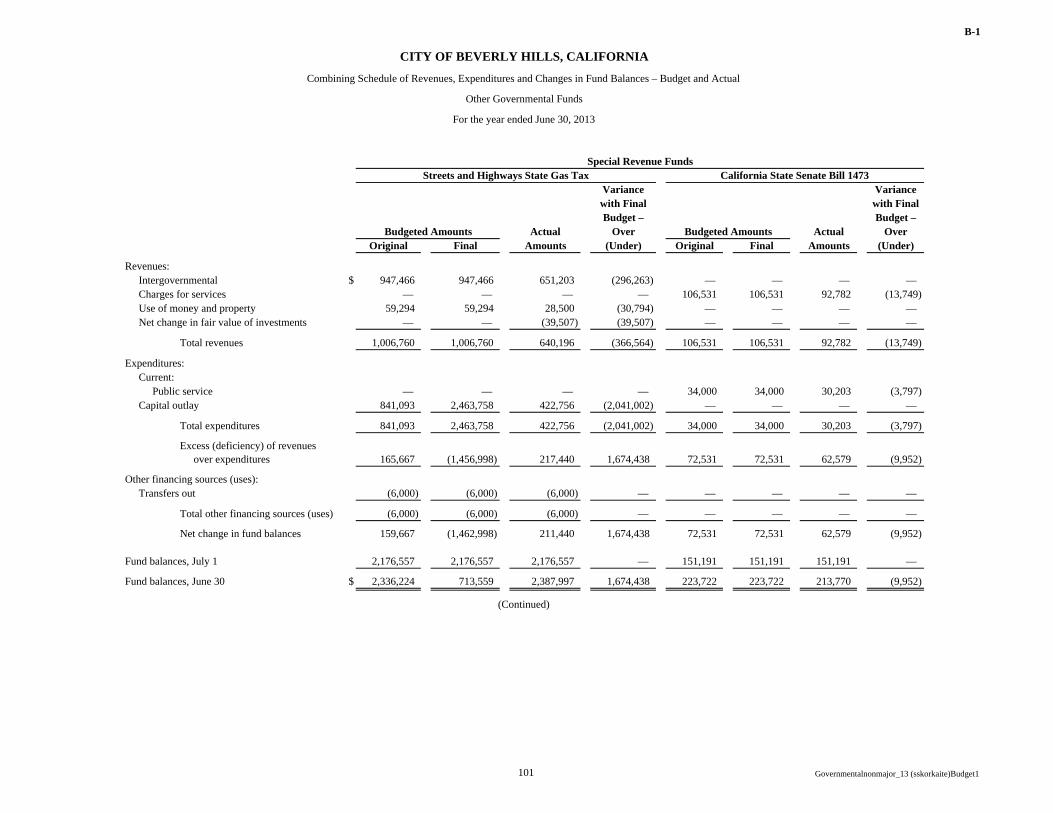
B-1
Variance Variancewith Final with FinalBudget – Budget –
Actual Over Actual OverOriginal Final Amounts (Under) Original Final Amounts (Under)
Revenues:Intergovernmental $ 947,466 947,466 651,203 (296,263) — — — — Charges for services — — — — 106,531 106,531 92,782 (13,749)Use of money and property 59,294 59,294 28,500 (30,794) — — — — Net change in fair value of investments — — (39,507) (39,507) — — — —
Total revenues 1,006,760 1,006,760 640,196 (366,564) 106,531 106,531 92,782 (13,749)
Expenditures:Current:
Public service — — — — 34,000 34,000 30,203 (3,797)Capital outlay 841,093 2,463,758 422,756 (2,041,002) — — — —
Total expenditures 841,093 2,463,758 422,756 (2,041,002) 34,000 34,000 30,203 (3,797)
Excess (deficiency) of revenuesover expenditures 165,667 (1,456,998) 217,440 1,674,438 72,531 72,531 62,579 (9,952)
Other financing sources (uses):Transfers out (6,000) (6,000) (6,000) — — — — —
Total other financing sources (uses) (6,000) (6,000) (6,000) — — — — —
Net change in fund balances 159,667 (1,462,998) 211,440 1,674,438 72,531 72,531 62,579 (9,952)
Fund balances, July 1 2,176,557 2,176,557 2,176,557 — 151,191 151,191 151,191 —
Fund balances, June 30 $ 2,336,224 713,559 2,387,997 1,674,438 223,722 223,722 213,770 (9,952)
(Continued)
Budgeted Amounts Budgeted Amounts
Special Revenue FundsCalifornia State Senate Bill 1473Streets and Highways State Gas Tax
CITY OF BEVERLY HILLS, CALIFORNIA
Combining Schedule of Revenues, Expenditures and Changes in Fund Balances – Budget and Actual
Other Governmental Funds
For the year ended June 30, 2013
101 Governmentalnonmajor_13 (sskorkaite)Budget1
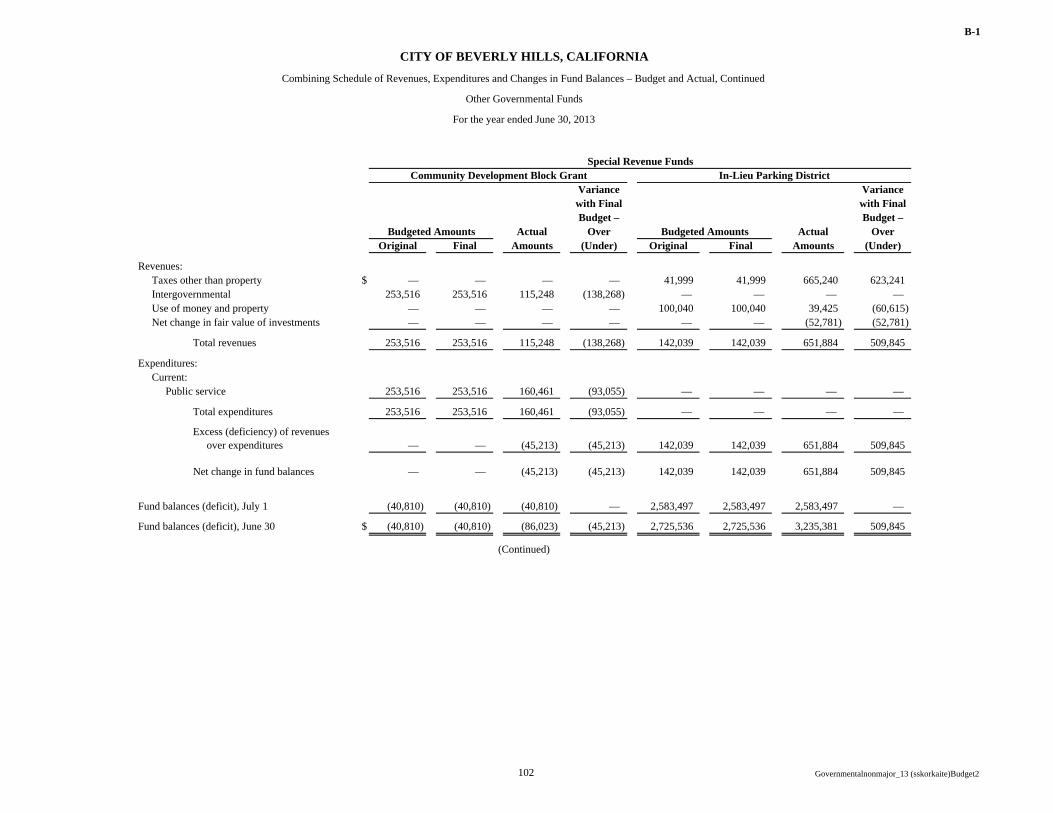
B-1
Variance Variancewith Final with FinalBudget – Budget –
Actual Over Actual OverOriginal Final Amounts (Under) Original Final Amounts (Under)
Revenues:Taxes other than property $ — — — — 41,999 41,999 665,240 623,241Intergovernmental 253,516 253,516 115,248 (138,268) — — — — Use of money and property — — — — 100,040 100,040 39,425 (60,615)Net change in fair value of investments — — — — — — (52,781) (52,781)
Total revenues 253,516 253,516 115,248 (138,268) 142,039 142,039 651,884 509,845
Expenditures:Current:
Public service 253,516 253,516 160,461 (93,055) — — — —
Total expenditures 253,516 253,516 160,461 (93,055) — — — —
Excess (deficiency) of revenuesover expenditures — — (45,213) (45,213) 142,039 142,039 651,884 509,845
Net change in fund balances — — (45,213) (45,213) 142,039 142,039 651,884 509,845
(40,810) (40,810) (40,810) — 2,583,497 2,583,497 2,583,497 —
Fund balances (deficit), June 30 $ (40,810) (40,810) (86,023) (45,213) 2,725,536 2,725,536 3,235,381 509,845
(Continued)
Special Revenue FundsCommunity Development Block Grant In-Lieu Parking District
Fund balances (deficit), July 1
CITY OF BEVERLY HILLS, CALIFORNIA
Combining Schedule of Revenues, Expenditures and Changes in Fund Balances – Budget and Actual, Continued
Other Governmental Funds
For the year ended June 30, 2013
Budgeted Amounts Budgeted Amounts
102 Governmentalnonmajor_13 (sskorkaite)Budget2
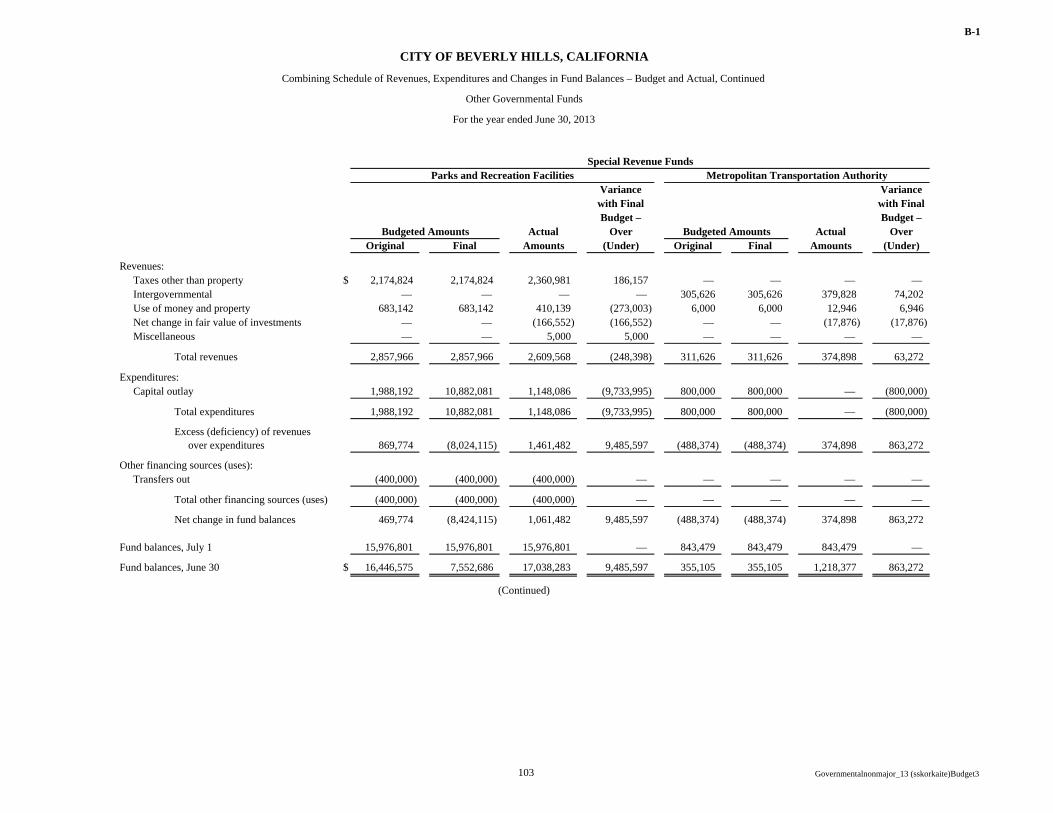
B-1
Variance Variancewith Final with FinalBudget – Budget –
Actual Over Actual OverOriginal Final Amounts (Under) Original Final Amounts (Under)
Revenues:Taxes other than property $ 2,174,824 2,174,824 2,360,981 186,157 — — — — Intergovernmental — — — — 305,626 305,626 379,828 74,202Use of money and property 683,142 683,142 410,139 (273,003) 6,000 6,000 12,946 6,946Net change in fair value of investments — — (166,552) (166,552) — — (17,876) (17,876)Miscellaneous — — 5,000 5,000 — — — —
Total revenues 2,857,966 2,857,966 2,609,568 (248,398) 311,626 311,626 374,898 63,272
Expenditures:Capital outlay 1,988,192 10,882,081 1,148,086 (9,733,995) 800,000 800,000 — (800,000)
Total expenditures 1,988,192 10,882,081 1,148,086 (9,733,995) 800,000 800,000 — (800,000)
Excess (deficiency) of revenues over expenditures 869,774 (8,024,115) 1,461,482 9,485,597 (488,374) (488,374) 374,898 863,272
Other financing sources (uses):Transfers out (400,000) (400,000) (400,000) — — — — —
Total other financing sources (uses) (400,000) (400,000) (400,000) — — — — —
Net change in fund balances 469,774 (8,424,115) 1,061,482 9,485,597 (488,374) (488,374) 374,898 863,272
Fund balances, July 1 15,976,801 15,976,801 15,976,801 — 843,479 843,479 843,479 —
Fund balances, June 30 $ 16,446,575 7,552,686 17,038,283 9,485,597 355,105 355,105 1,218,377 863,272
(Continued)
Special Revenue FundsParks and Recreation Facilities Metropolitan Transportation Authority
CITY OF BEVERLY HILLS, CALIFORNIA
Combining Schedule of Revenues, Expenditures and Changes in Fund Balances – Budget and Actual, Continued
Other Governmental Funds
For the year ended June 30, 2013
Budgeted Amounts Budgeted Amounts
103 Governmentalnonmajor_13 (sskorkaite)Budget3
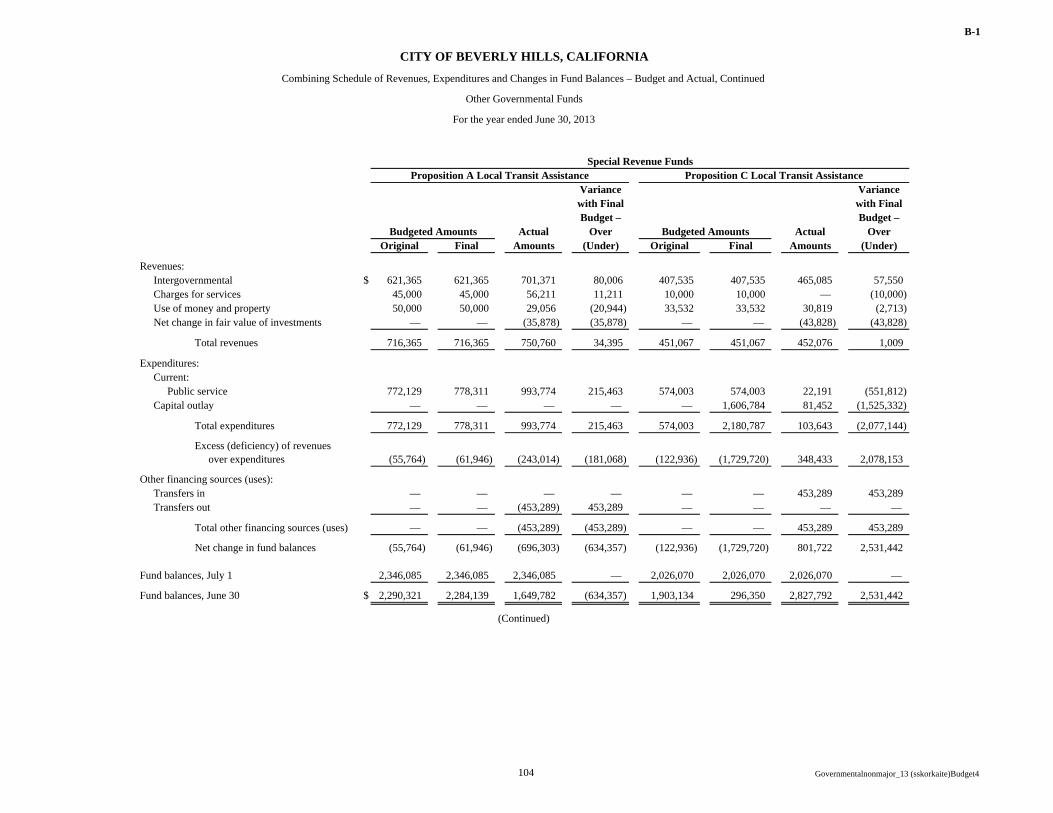
B-1
Variance Variancewith Final with FinalBudget – Budget –
Actual Over Actual OverOriginal Final Amounts (Under) Original Final Amounts (Under)
Revenues:Intergovernmental $ 621,365 621,365 701,371 80,006 407,535 407,535 465,085 57,550Charges for services 45,000 45,000 56,211 11,211 10,000 10,000 — (10,000)Use of money and property 50,000 50,000 29,056 (20,944) 33,532 33,532 30,819 (2,713)Net change in fair value of investments — — (35,878) (35,878) — — (43,828) (43,828)
Total revenues 716,365 716,365 750,760 34,395 451,067 451,067 452,076 1,009
Expenditures:Current:
Public service 772,129 778,311 993,774 215,463 574,003 574,003 22,191 (551,812)Capital outlay — — — — — 1,606,784 81,452 (1,525,332)
Total expenditures 772,129 778,311 993,774 215,463 574,003 2,180,787 103,643 (2,077,144)
Excess (deficiency) of revenuesover expenditures (55,764) (61,946) (243,014) (181,068) (122,936) (1,729,720) 348,433 2,078,153
Other financing sources (uses):Transfers in — — — — — — 453,289 453,289Transfers out — — (453,289) 453,289 — — — —
Total other financing sources (uses) — — (453,289) (453,289) — — 453,289 453,289
Net change in fund balances (55,764) (61,946) (696,303) (634,357) (122,936) (1,729,720) 801,722 2,531,442
Fund balances, July 1 2,346,085 2,346,085 2,346,085 — 2,026,070 2,026,070 2,026,070 —
Fund balances, June 30 $ 2,290,321 2,284,139 1,649,782 (634,357) 1,903,134 296,350 2,827,792 2,531,442
(Continued)
Special Revenue FundsProposition A Local Transit Assistance Proposition C Local Transit Assistance
CITY OF BEVERLY HILLS, CALIFORNIA
Combining Schedule of Revenues, Expenditures and Changes in Fund Balances – Budget and Actual, Continued
Other Governmental Funds
For the year ended June 30, 2013
Budgeted Amounts Budgeted Amounts
104 Governmentalnonmajor_13 (sskorkaite)Budget4
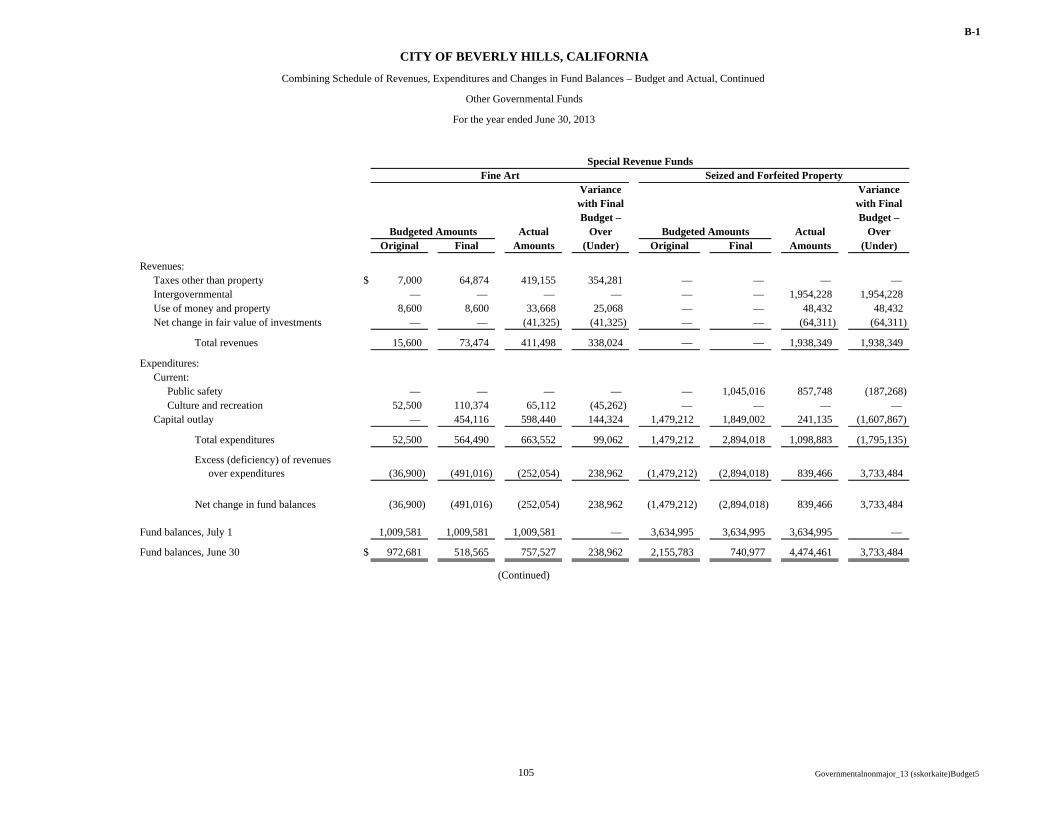
B-1
Variance Variancewith Final with FinalBudget – Budget –
Actual Over Actual OverOriginal Final Amounts (Under) Original Final Amounts (Under)
Revenues:Taxes other than property $ 7,000 64,874 419,155 354,281 — — — — Intergovernmental — — — — — — 1,954,228 1,954,228Use of money and property 8,600 8,600 33,668 25,068 — — 48,432 48,432Net change in fair value of investments — — (41,325) (41,325) — — (64,311) (64,311)
Total revenues 15,600 73,474 411,498 338,024 — — 1,938,349 1,938,349
Expenditures:Current:
Public safety — — — — — 1,045,016 857,748 (187,268)Culture and recreation 52,500 110,374 65,112 (45,262) — — — —
Capital outlay — 454,116 598,440 144,324 1,479,212 1,849,002 241,135 (1,607,867)
Total expenditures 52,500 564,490 663,552 99,062 1,479,212 2,894,018 1,098,883 (1,795,135)
Excess (deficiency) of revenuesover expenditures (36,900) (491,016) (252,054) 238,962 (1,479,212) (2,894,018) 839,466 3,733,484
Net change in fund balances (36,900) (491,016) (252,054) 238,962 (1,479,212) (2,894,018) 839,466 3,733,484
Fund balances, July 1 1,009,581 1,009,581 1,009,581 — 3,634,995 3,634,995 3,634,995 —
Fund balances, June 30 $ 972,681 518,565 757,527 238,962 2,155,783 740,977 4,474,461 3,733,484
(Continued)
Special Revenue FundsFine Art Seized and Forfeited Property
CITY OF BEVERLY HILLS, CALIFORNIA
Combining Schedule of Revenues, Expenditures and Changes in Fund Balances – Budget and Actual, Continued
Other Governmental Funds
For the year ended June 30, 2013
Budgeted Amounts Budgeted Amounts
105 Governmentalnonmajor_13 (sskorkaite)Budget5
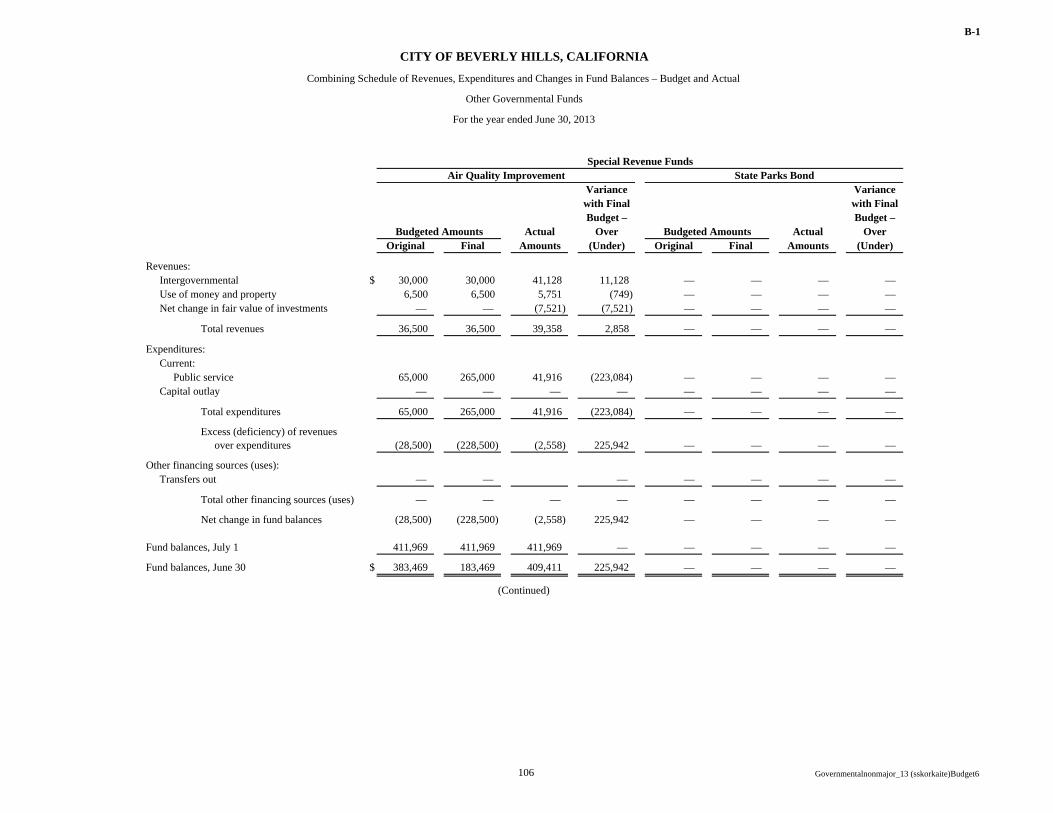
B-1
Variance Variancewith Final with FinalBudget – Budget –
Actual Over Actual OverOriginal Final Amounts (Under) Original Final Amounts (Under)
Revenues:Intergovernmental $ 30,000 30,000 41,128 11,128 — — — — Use of money and property 6,500 6,500 5,751 (749) — — — — Net change in fair value of investments — — (7,521) (7,521) — — — —
Total revenues 36,500 36,500 39,358 2,858 — — — —
Expenditures:Current:
Public service 65,000 265,000 41,916 (223,084) — — — — Capital outlay — — — — — — — —
Total expenditures 65,000 265,000 41,916 (223,084) — — — —
Excess (deficiency) of revenuesover expenditures (28,500) (228,500) (2,558) 225,942 — — — —
Other financing sources (uses):Transfers out — — — — — — —
Total other financing sources (uses) — — — — — — — —
Net change in fund balances (28,500) (228,500) (2,558) 225,942 — — — —
Fund balances, July 1 411,969 411,969 411,969 — — — — —
Fund balances, June 30 $ 383,469 183,469 409,411 225,942 — — — —
Special Revenue Funds
CITY OF BEVERLY HILLS, CALIFORNIA
Combining Schedule of Revenues, Expenditures and Changes in Fund Balances – Budget and Actual
Other Governmental Funds
For the year ended June 30, 2013
Air Quality Improvement State Parks Bond
Budgeted Amounts Budgeted Amounts
(Continued)
106 Governmentalnonmajor_13 (sskorkaite)Budget6
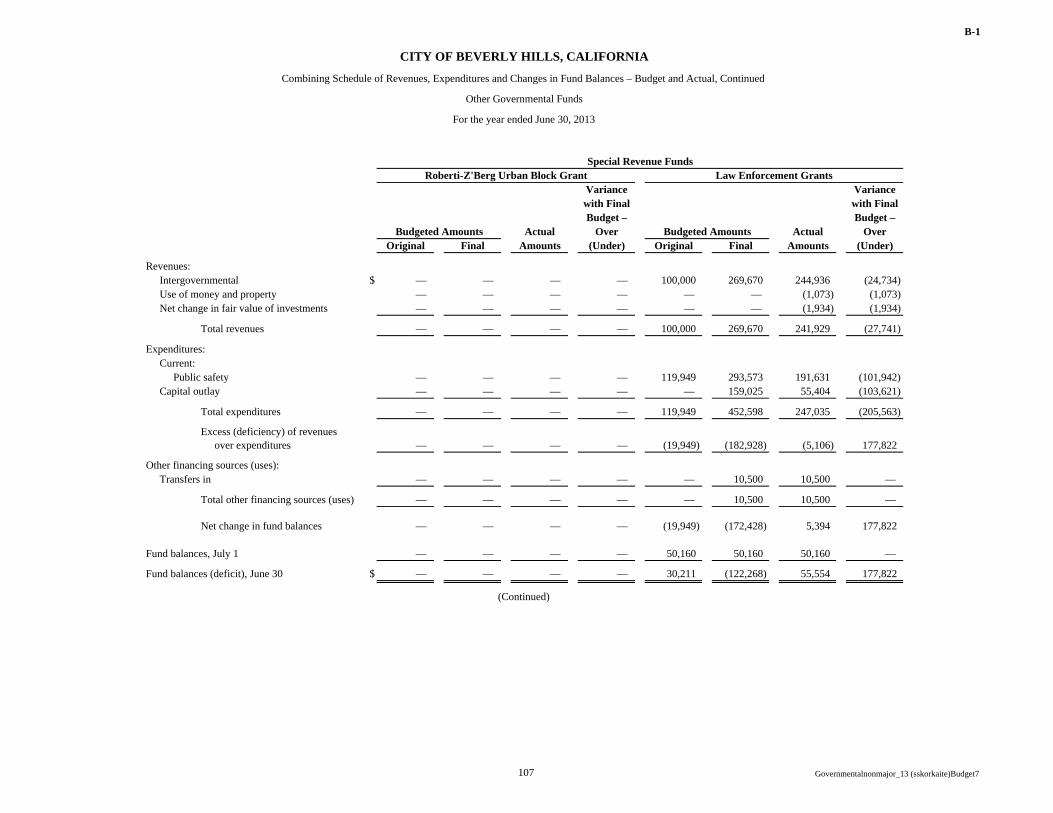
B-1
Variance Variancewith Final with FinalBudget – Budget –
Actual Over Actual OverOriginal Final Amounts (Under) Original Final Amounts (Under)
Revenues:Intergovernmental $ — — — — 100,000 269,670 244,936 (24,734)Use of money and property — — — — — — (1,073) (1,073)Net change in fair value of investments — — — — — — (1,934) (1,934)
Total revenues — — — — 100,000 269,670 241,929 (27,741)
Expenditures:Current:
Public safety — — — — 119,949 293,573 191,631 (101,942)Capital outlay — — — — — 159,025 55,404 (103,621)
Total expenditures — — — — 119,949 452,598 247,035 (205,563)
Excess (deficiency) of revenuesover expenditures — — — — (19,949) (182,928) (5,106) 177,822
Other financing sources (uses):Transfers in — — — — — 10,500 10,500 —
Total other financing sources (uses) — — — — — 10,500 10,500 —
Net change in fund balances — — — — (19,949) (172,428) 5,394 177,822
Fund balances, July 1 — — — — 50,160 50,160 50,160 —
Fund balances (deficit), June 30 $ — — — — 30,211 (122,268) 55,554 177,822
(Continued)
Budgeted Amounts
Special Revenue FundsLaw Enforcement Grants
Budgeted Amounts
CITY OF BEVERLY HILLS, CALIFORNIA
Combining Schedule of Revenues, Expenditures and Changes in Fund Balances – Budget and Actual, Continued
Other Governmental Funds
For the year ended June 30, 2013
Roberti-Z'Berg Urban Block Grant
107 Governmentalnonmajor_13 (sskorkaite)Budget7
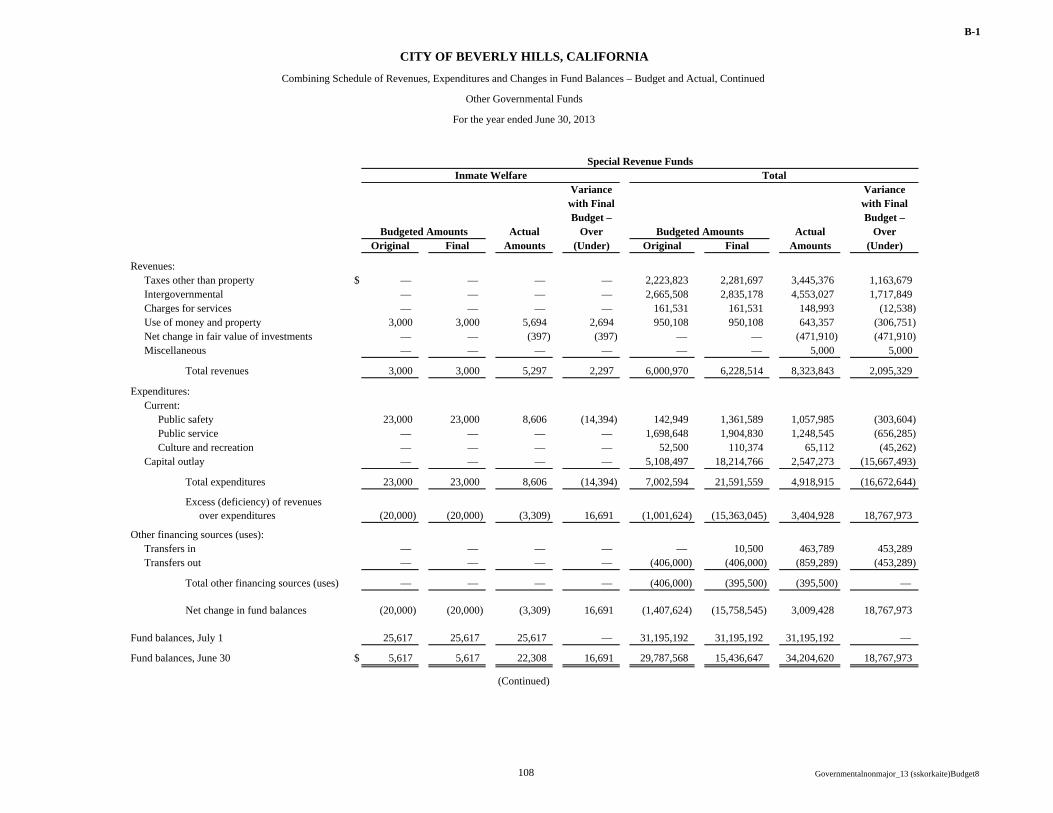
B-1
Variance Variancewith Final with FinalBudget – Budget –
Actual Over Actual OverOriginal Final Amounts (Under) Original Final Amounts (Under)
Revenues:Taxes other than property $ — — — — 2,223,823 2,281,697 3,445,376 1,163,679Intergovernmental — — — — 2,665,508 2,835,178 4,553,027 1,717,849Charges for services — — — — 161,531 161,531 148,993 (12,538)Use of money and property 3,000 3,000 5,694 2,694 950,108 950,108 643,357 (306,751)Net change in fair value of investments — — (397) (397) — — (471,910) (471,910)Miscellaneous — — — — — — 5,000 5,000
Total revenues 3,000 3,000 5,297 2,297 6,000,970 6,228,514 8,323,843 2,095,329
Expenditures:Current:
Public safety 23,000 23,000 8,606 (14,394) 142,949 1,361,589 1,057,985 (303,604)Public service — — — — 1,698,648 1,904,830 1,248,545 (656,285)Culture and recreation — — — — 52,500 110,374 65,112 (45,262)
Capital outlay — — — — 5,108,497 18,214,766 2,547,273 (15,667,493)
Total expenditures 23,000 23,000 8,606 (14,394) 7,002,594 21,591,559 4,918,915 (16,672,644)
Excess (deficiency) of revenuesover expenditures (20,000) (20,000) (3,309) 16,691 (1,001,624) (15,363,045) 3,404,928 18,767,973
Other financing sources (uses):Transfers in — — — — — 10,500 463,789 453,289Transfers out — — — — (406,000) (406,000) (859,289) (453,289)
Total other financing sources (uses) — — — — (406,000) (395,500) (395,500) —
Net change in fund balances (20,000) (20,000) (3,309) 16,691 (1,407,624) (15,758,545) 3,009,428 18,767,973
Fund balances, July 1 25,617 25,617 25,617 — 31,195,192 31,195,192 31,195,192 —
Fund balances, June 30 $ 5,617 5,617 22,308 16,691 29,787,568 15,436,647 34,204,620 18,767,973
(Continued)
Budgeted Amounts
TotalSpecial Revenue Funds
CITY OF BEVERLY HILLS, CALIFORNIA
Combining Schedule of Revenues, Expenditures and Changes in Fund Balances – Budget and Actual, Continued
Other Governmental Funds
For the year ended June 30, 2013
Budgeted Amounts
Inmate Welfare
108 Governmentalnonmajor_13 (sskorkaite)Budget8
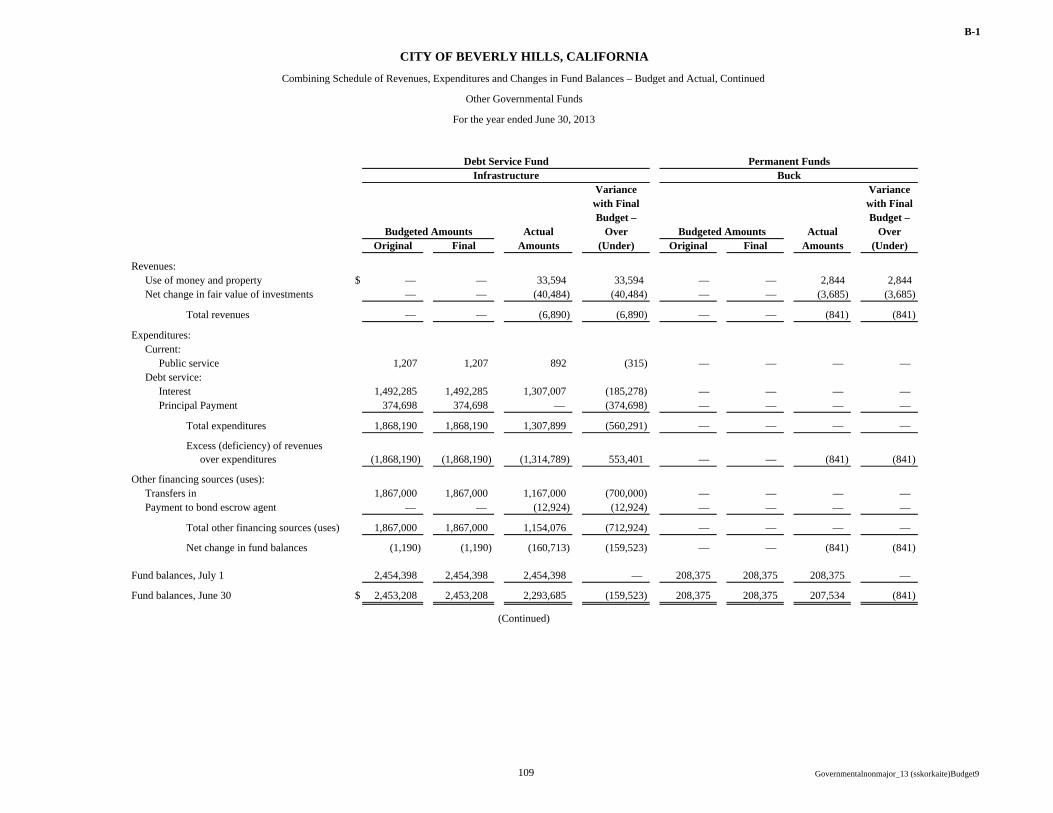
B-1
Variance Variancewith Final with FinalBudget – Budget –
Actual Over Actual OverOriginal Final Amounts (Under) Original Final Amounts (Under)
Revenues:Use of money and property $ — — 33,594 33,594 — — 2,844 2,844Net change in fair value of investments — — (40,484) (40,484) — — (3,685) (3,685)
Total revenues — — (6,890) (6,890) — — (841) (841)
Expenditures:Current:
Public service 1,207 1,207 892 (315) — — — — Debt service:
Interest 1,492,285 1,492,285 1,307,007 (185,278) — — — — Principal Payment 374,698 374,698 — (374,698) — — — —
Total expenditures 1,868,190 1,868,190 1,307,899 (560,291) — — — —
Excess (deficiency) of revenuesover expenditures (1,868,190) (1,868,190) (1,314,789) 553,401 — — (841) (841)
Other financing sources (uses):Transfers in 1,867,000 1,867,000 1,167,000 (700,000) — — — — Payment to bond escrow agent — — (12,924) (12,924) — — — —
Total other financing sources (uses) 1,867,000 1,867,000 1,154,076 (712,924) — — — —
Net change in fund balances (1,190) (1,190) (160,713) (159,523) — — (841) (841)
Fund balances, July 1 2,454,398 2,454,398 2,454,398 — 208,375 208,375 208,375 —
Fund balances, June 30 $ 2,453,208 2,453,208 2,293,685 (159,523) 208,375 208,375 207,534 (841)
CITY OF BEVERLY HILLS, CALIFORNIA
Combining Schedule of Revenues, Expenditures and Changes in Fund Balances – Budget and Actual, Continued
Other Governmental Funds
For the year ended June 30, 2013
(Continued)
Debt Service FundInfrastructure
Budgeted Amounts Budgeted Amounts
BuckPermanent Funds
109 Governmentalnonmajor_13 (sskorkaite)Budget9
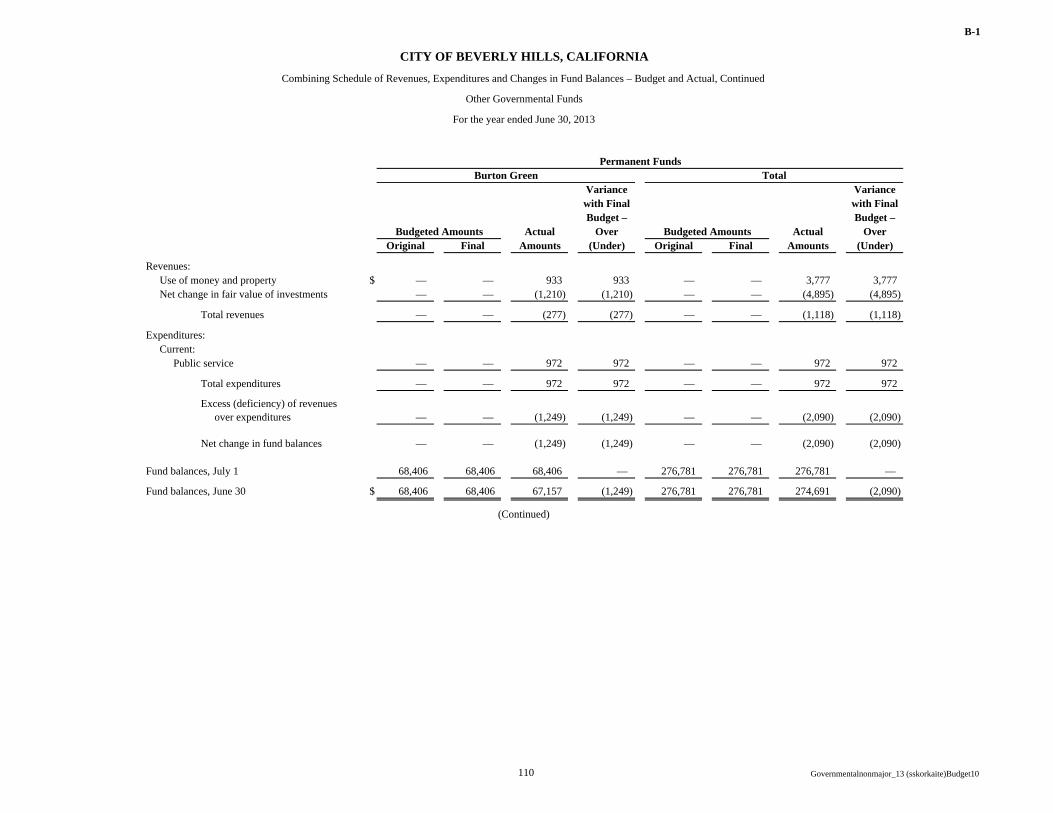
B-1
Variance Variancewith Final with FinalBudget – Budget –
Actual Over Actual OverOriginal Final Amounts (Under) Original Final Amounts (Under)
Revenues:Use of money and property $ — — 933 933 — — 3,777 3,777Net change in fair value of investments — — (1,210) (1,210) — — (4,895) (4,895)
Total revenues — — (277) (277) — — (1,118) (1,118)
Expenditures:Current:
Public service — — 972 972 — — 972 972
Total expenditures — — 972 972 — — 972 972
Excess (deficiency) of revenuesover expenditures — — (1,249) (1,249) — — (2,090) (2,090)
Net change in fund balances — — (1,249) (1,249) — — (2,090) (2,090)
Fund balances, July 1 68,406 68,406 68,406 — 276,781 276,781 276,781 —
Fund balances, June 30 $ 68,406 68,406 67,157 (1,249) 276,781 276,781 274,691 (2,090)
CITY OF BEVERLY HILLS, CALIFORNIA
Combining Schedule of Revenues, Expenditures and Changes in Fund Balances – Budget and Actual, Continued
Other Governmental Funds
For the year ended June 30, 2013
(Continued)
Budgeted Amounts
Total
Budgeted Amounts
Burton GreenPermanent Funds
110 Governmentalnonmajor_13 (sskorkaite)Budget10
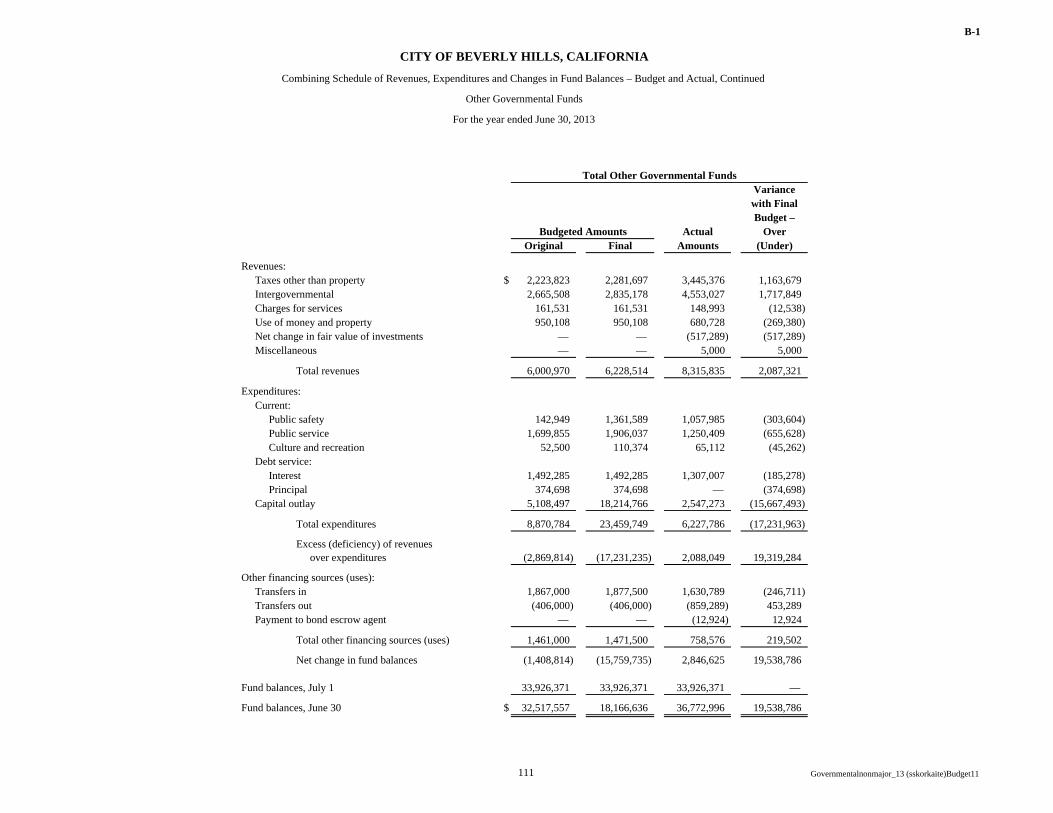
B-1
Variancewith FinalBudget –
Actual OverOriginal Final Amounts (Under)
Revenues:Taxes other than property $ 2,223,823 2,281,697 3,445,376 1,163,679Intergovernmental 2,665,508 2,835,178 4,553,027 1,717,849Charges for services 161,531 161,531 148,993 (12,538)Use of money and property 950,108 950,108 680,728 (269,380)Net change in fair value of investments — — (517,289) (517,289)Miscellaneous — — 5,000 5,000
Total revenues 6,000,970 6,228,514 8,315,835 2,087,321
Expenditures:Current:
Public safety 142,949 1,361,589 1,057,985 (303,604)Public service 1,699,855 1,906,037 1,250,409 (655,628)Culture and recreation 52,500 110,374 65,112 (45,262)
Debt service:Interest 1,492,285 1,492,285 1,307,007 (185,278)Principal 374,698 374,698 — (374,698)
Capital outlay 5,108,497 18,214,766 2,547,273 (15,667,493)
Total expenditures 8,870,784 23,459,749 6,227,786 (17,231,963)
Excess (deficiency) of revenuesover expenditures (2,869,814) (17,231,235) 2,088,049 19,319,284
Other financing sources (uses):Transfers in 1,867,000 1,877,500 1,630,789 (246,711)Transfers out (406,000) (406,000) (859,289) 453,289Payment to bond escrow agent — — (12,924) 12,924
Total other financing sources (uses) 1,461,000 1,471,500 758,576 219,502
Net change in fund balances (1,408,814) (15,759,735) 2,846,625 19,538,786
Fund balances, July 1 33,926,371 33,926,371 33,926,371 —
Fund balances, June 30 $ 32,517,557 18,166,636 36,772,996 19,538,786
Budgeted Amounts
Total Other Governmental Funds
CITY OF BEVERLY HILLS, CALIFORNIA
Combining Schedule of Revenues, Expenditures and Changes in Fund Balances – Budget and Actual, Continued
Other Governmental Funds
For the year ended June 30, 2013
111 Governmentalnonmajor_13 (sskorkaite)Budget11

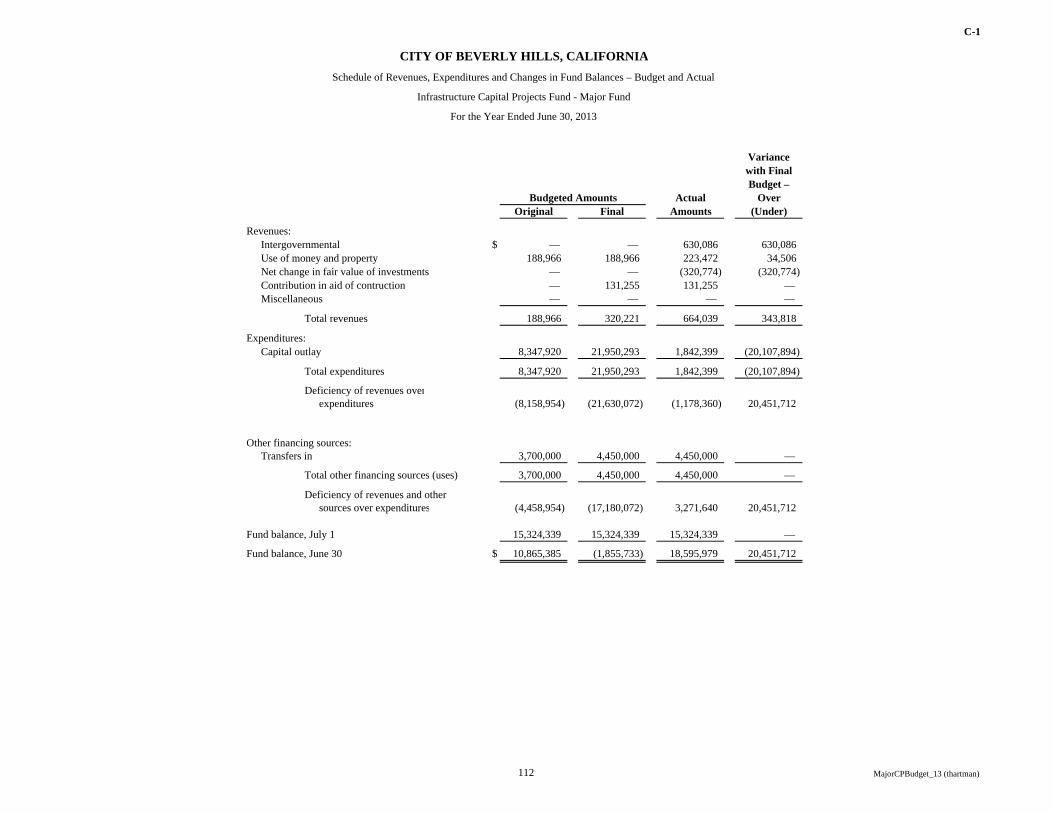
C-1
Variancewith FinalBudget –
Actual OverOriginal Final Amounts (Under)
Revenues:Intergovernmental $ — — 630,086 630,086Use of money and property 188,966 188,966 223,472 34,506Net change in fair value of investments — — (320,774) (320,774)Contribution in aid of contruction — 131,255 131,255 — Miscellaneous — — — —
Total revenues 188,966 320,221 664,039 343,818
Expenditures:Capital outlay 8,347,920 21,950,293 1,842,399 (20,107,894)
Total expenditures 8,347,920 21,950,293 1,842,399 (20,107,894)
Deficiency of revenues overexpenditures (8,158,954) (21,630,072) (1,178,360) 20,451,712
Other financing sources:3,700,000 4,450,000 4,450,000 —
Total other financing sources (uses) 3,700,000 4,450,000 4,450,000 —
Deficiency of revenues and othersources over expenditures (4,458,954) (17,180,072) 3,271,640 20,451,712
Fund balance, July 1 15,324,339 15,324,339 15,324,339 —
Fund balance, June 30 $ 10,865,385 (1,855,733) 18,595,979 20,451,712
Transfers in
Budgeted Amounts
CITY OF BEVERLY HILLS, CALIFORNIASchedule of Revenues, Expenditures and Changes in Fund Balances – Budget and Actual
Infrastructure Capital Projects Fund - Major Fund
For the Year Ended June 30, 2013
112 MajorCPBudget_13 (thartman)

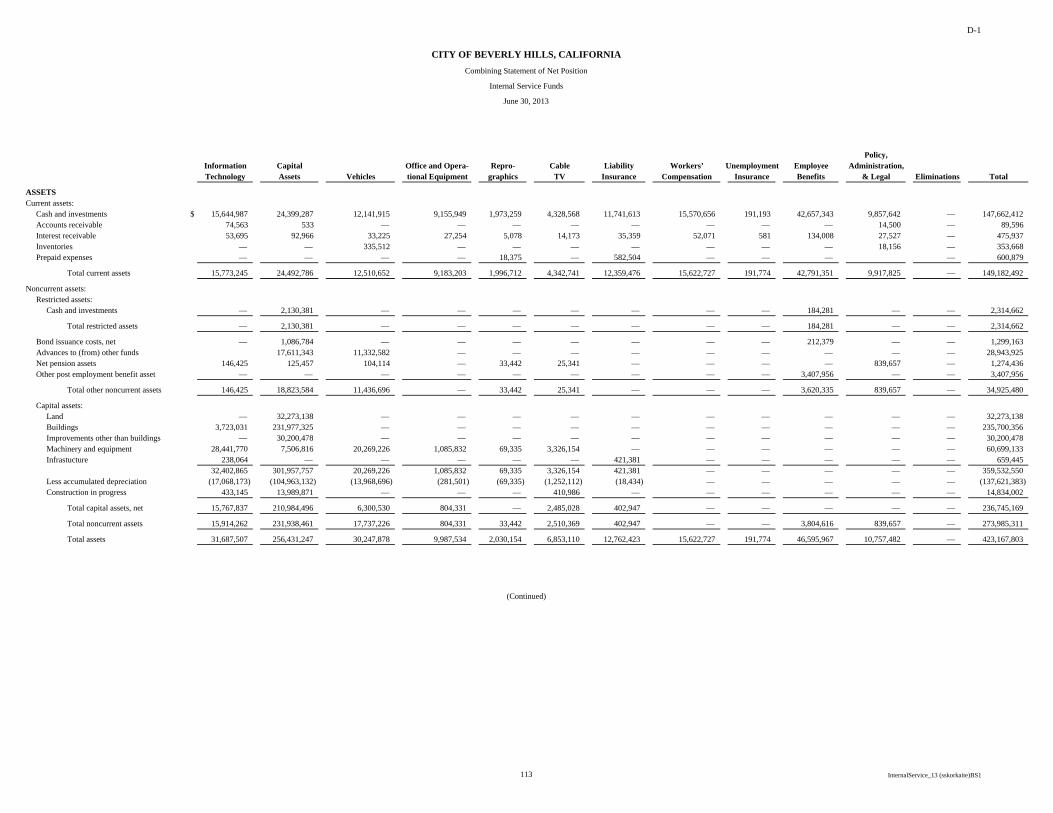
D-1
Policy,Information Capital Office and Opera- Repro- Cable Liability Workers’ Unemployment Employee Administration,Technology Assets Vehicles tional Equipment graphics TV Insurance Compensation Insurance Benefits & Legal Eliminations Total
ASSETSCurrent assets:
Cash and investments $ 15,644,987 24,399,287 12,141,915 9,155,949 1,973,259 4,328,568 11,741,613 15,570,656 191,193 42,657,343 9,857,642 — 147,662,412Accounts receivable 74,563 533 — — — — — — — — 14,500 — 89,596Interest receivable 53,695 92,966 33,225 27,254 5,078 14,173 35,359 52,071 581 134,008 27,527 — 475,937Inventories — — 335,512 — — — — — — — 18,156 — 353,668Prepaid expenses — — — — 18,375 — 582,504 — — — — 600,879
Total current assets 15,773,245 24,492,786 12,510,652 9,183,203 1,996,712 4,342,741 12,359,476 15,622,727 191,774 42,791,351 9,917,825 — 149,182,492
Noncurrent assets:Restricted assets:
Cash and investments — 2,130,381 — — — — — — — 184,281 — — 2,314,662
Total restricted assets — 2,130,381 — — — — — — — 184,281 — — 2,314,662
Bond issuance costs, net — 1,086,784 — — — — — — — 212,379 — — 1,299,163Advances to (from) other funds 17,611,343 11,332,582 — — — — — — — — — 28,943,925Net pension assets 146,425 125,457 104,114 — 33,442 25,341 — — — — 839,657 — 1,274,436Other post employment benefit asset — — — — — — — — — 3,407,956 — — 3,407,956
Total other noncurrent assets 146,425 18,823,584 11,436,696 — 33,442 25,341 — — — 3,620,335 839,657 — 34,925,480
Capital assets:Land — 32,273,138 — — — — — — — — — — 32,273,138Buildings 3,723,031 231,977,325 — — — — — — — — — — 235,700,356Improvements other than buildings — 30,200,478 — — — — — — — — — — 30,200,478Machinery and equipment 28,441,770 7,506,816 20,269,226 1,085,832 69,335 3,326,154 — — — — — — 60,699,133Infrastucture 238,064 — — — — — 421,381 — — — — — 659,445
32,402,865 301,957,757 20,269,226 1,085,832 69,335 3,326,154 421,381 — — — — — 359,532,550Less accumulated depreciation (17,068,173) (104,963,132) (13,968,696) (281,501) (69,335) (1,252,112) (18,434) — — — — — (137,621,383)Construction in progress 433,145 13,989,871 — — — 410,986 — — — — — — 14,834,002
Total capital assets, net 15,767,837 210,984,496 6,300,530 804,331 — 2,485,028 402,947 — — — — — 236,745,169
Total noncurrent assets 15,914,262 231,938,461 17,737,226 804,331 33,442 2,510,369 402,947 — — 3,804,616 839,657 — 273,985,311
Total assets 31,687,507 256,431,247 30,247,878 9,987,534 2,030,154 6,853,110 12,762,423 15,622,727 191,774 46,595,967 10,757,482 — 423,167,803
(Continued)
CITY OF BEVERLY HILLS, CALIFORNIACombining Statement of Net Position
Internal Service Funds
June 30, 2013
113 InternalService_13 (sskorkaite)BS1
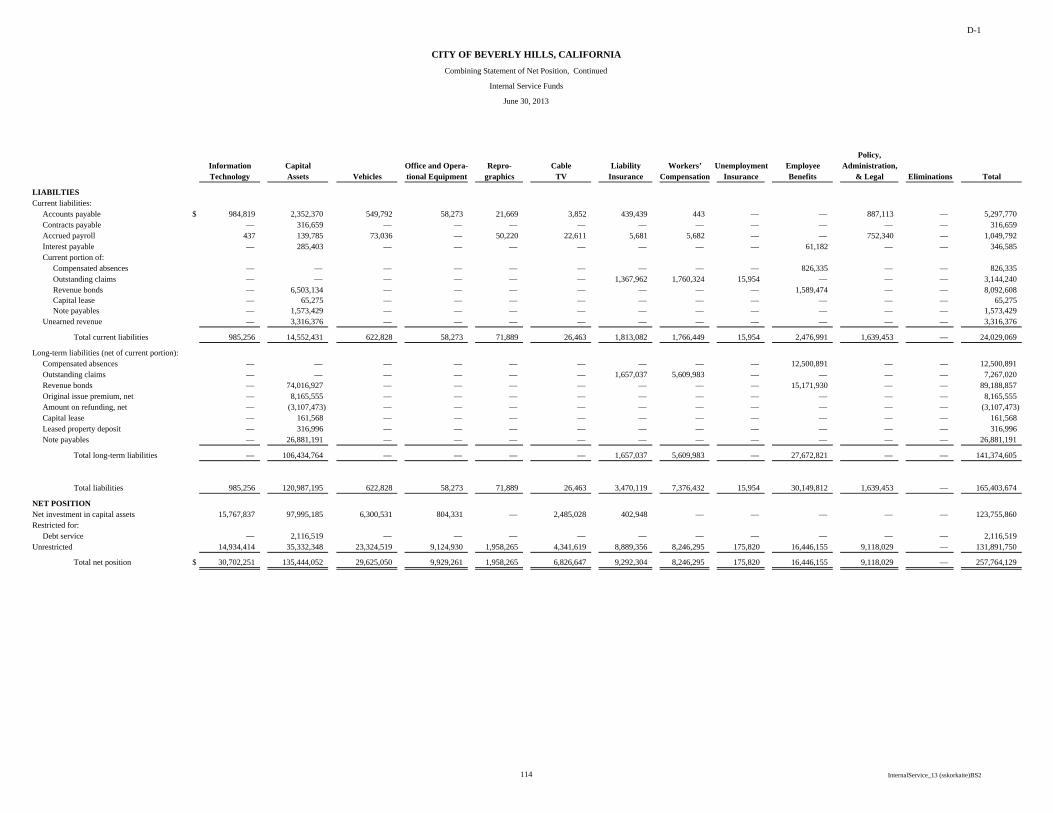
D-1
Policy,Information Capital Office and Opera- Repro- Cable Liability Workers’ Unemployment Employee Administration,Technology Assets Vehicles tional Equipment graphics TV Insurance Compensation Insurance Benefits & Legal Eliminations Total
LIABILTIESCurrent liabilities:
Accounts payable $ 984,819 2,352,370 549,792 58,273 21,669 3,852 439,439 443 — — 887,113 — 5,297,770Contracts payable — 316,659 — — — — — — — — — — 316,659Accrued payroll 437 139,785 73,036 — 50,220 22,611 5,681 5,682 — — 752,340 — 1,049,792Interest payable — 285,403 — — — — — — — 61,182 — — 346,585Current portion of:
Compensated absences — — — — — — — — — 826,335 — — 826,335Outstanding claims — — — — — — 1,367,962 1,760,324 15,954 — — — 3,144,240Revenue bonds — 6,503,134 — — — — — — — 1,589,474 — — 8,092,608Capital lease — 65,275 — — — — — — — — — — 65,275Note payables — 1,573,429 — — — — — — — — — — 1,573,429
Unearned revenue — 3,316,376 — — — — — — — — — — 3,316,376
Total current liabilities 985,256 14,552,431 622,828 58,273 71,889 26,463 1,813,082 1,766,449 15,954 2,476,991 1,639,453 — 24,029,069
Long-term liabilities (net of current portion):Compensated absences — — — — — — — — — 12,500,891 — — 12,500,891Outstanding claims — — — — — — 1,657,037 5,609,983 — — — — 7,267,020Revenue bonds — 74,016,927 — — — — — — — 15,171,930 — — 89,188,857Original issue premium, net — 8,165,555 — — — — — — — — — — 8,165,555Amount on refunding, net — (3,107,473) — — — — — — — — — — (3,107,473)Capital lease — 161,568 — — — — — — — — — — 161,568Leased property deposit — 316,996 — — — — — — — — — — 316,996Note payables — 26,881,191 — — — — — — — — — — 26,881,191
Total long-term liabilities — 106,434,764 — — — — 1,657,037 5,609,983 — 27,672,821 — — 141,374,605
Total liabilities 985,256 120,987,195 622,828 58,273 71,889 26,463 3,470,119 7,376,432 15,954 30,149,812 1,639,453 — 165,403,674
NET POSITIONNet investment in capital assets 15,767,837 97,995,185 6,300,531 804,331 — 2,485,028 402,948 — — — — — 123,755,860Restricted for:
Debt service — 2,116,519 — — — — — — — — — — 2,116,519Unrestricted 14,934,414 35,332,348 23,324,519 9,124,930 1,958,265 4,341,619 8,889,356 8,246,295 175,820 16,446,155 9,118,029 — 131,891,750
Total net position $ 30,702,251 135,444,052 29,625,050 9,929,261 1,958,265 6,826,647 9,292,304 8,246,295 175,820 16,446,155 9,118,029 — 257,764,129
CITY OF BEVERLY HILLS, CALIFORNIACombining Statement of Net Position, Continued
Internal Service Funds
June 30, 2013
114 InternalService_13 (sskorkaite)BS2
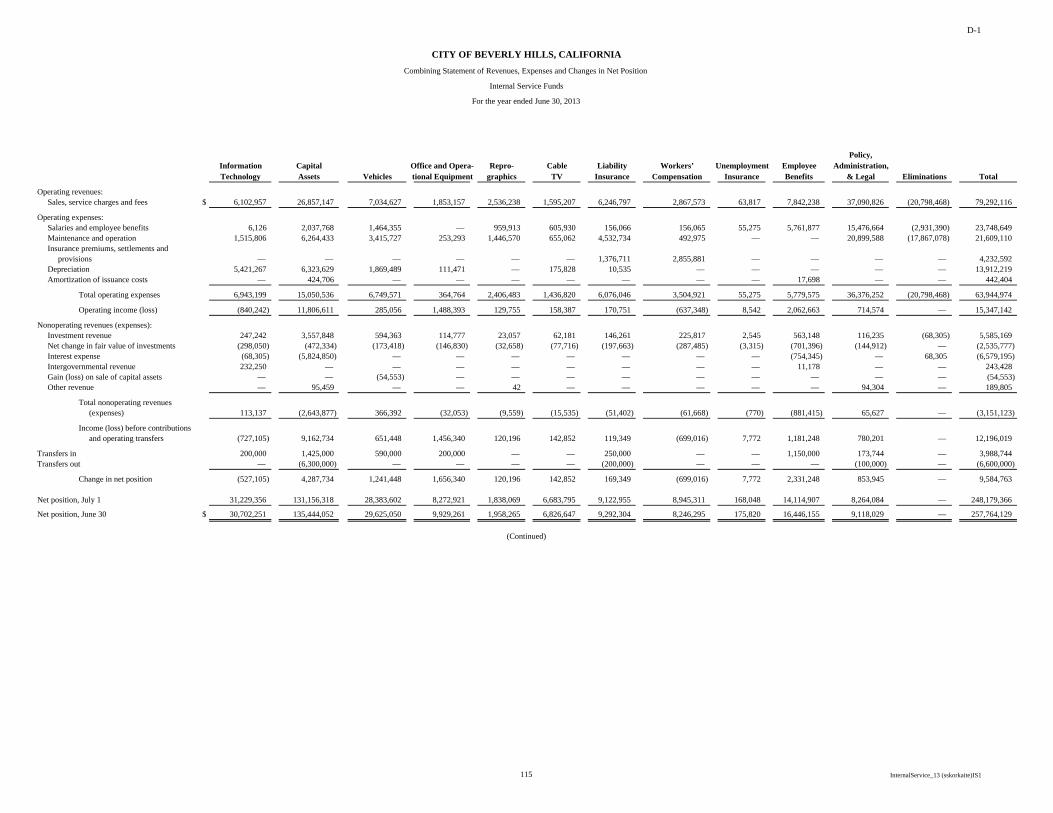
D-1
Policy,Information Capital Office and Opera- Repro- Cable Liability Workers’ Unemployment Employee Administration,Technology Assets Vehicles tional Equipment graphics TV Insurance Compensation Insurance Benefits & Legal Eliminations Total
Operating revenues:Sales, service charges and fees $ 6,102,957 26,857,147 7,034,627 1,853,157 2,536,238 1,595,207 6,246,797 2,867,573 63,817 7,842,238 37,090,826 (20,798,468) 79,292,116
Operating expenses:Salaries and employee benefits 6,126 2,037,768 1,464,355 — 959,913 605,930 156,066 156,065 55,275 5,761,877 15,476,664 (2,931,390) 23,748,649Maintenance and operation 1,515,806 6,264,433 3,415,727 253,293 1,446,570 655,062 4,532,734 492,975 — — 20,899,588 (17,867,078) 21,609,110Insurance premiums, settlements and
provisions — — — — — — 1,376,711 2,855,881 — — — — 4,232,592Depreciation 5,421,267 6,323,629 1,869,489 111,471 — 175,828 10,535 — — — — — 13,912,219Amortization of issuance costs — 424,706 — — — — — — — 17,698 — — 442,404
Total operating expenses 6,943,199 15,050,536 6,749,571 364,764 2,406,483 1,436,820 6,076,046 3,504,921 55,275 5,779,575 36,376,252 (20,798,468) 63,944,974
Operating income (loss) (840,242) 11,806,611 285,056 1,488,393 129,755 158,387 170,751 (637,348) 8,542 2,062,663 714,574 — 15,347,142
Nonoperating revenues (expenses):Investment revenue 247,242 3,557,848 594,363 114,777 23,057 62,181 146,261 225,817 2,545 563,148 116,235 (68,305) 5,585,169Net change in fair value of investments (298,050) (472,334) (173,418) (146,830) (32,658) (77,716) (197,663) (287,485) (3,315) (701,396) (144,912) — (2,535,777)Interest expense (68,305) (5,824,850) — — — — — — — (754,345) — 68,305 (6,579,195)Intergovernmental revenue 232,250 — — — — — — — — 11,178 — — 243,428Gain (loss) on sale of capital assets — — (54,553) — — — — — — — — — (54,553)Other revenue — 95,459 — — 42 — — — — — 94,304 — 189,805
Total nonoperating revenues(expenses) 113,137 (2,643,877) 366,392 (32,053) (9,559) (15,535) (51,402) (61,668) (770) (881,415) 65,627 — (3,151,123)
Income (loss) before contributions and operating transfers (727,105) 9,162,734 651,448 1,456,340 120,196 142,852 119,349 (699,016) 7,772 1,181,248 780,201 — 12,196,019
Transfers in 200,000 1,425,000 590,000 200,000 — — 250,000 — — 1,150,000 173,744 — 3,988,744Transfers out — (6,300,000) — — — — (200,000) — — — (100,000) — (6,600,000)
Change in net position (527,105) 4,287,734 1,241,448 1,656,340 120,196 142,852 169,349 (699,016) 7,772 2,331,248 853,945 — 9,584,763
Net position, July 1 31,229,356 131,156,318 28,383,602 8,272,921 1,838,069 6,683,795 9,122,955 8,945,311 168,048 14,114,907 8,264,084 — 248,179,366
Net position, June 30 $ 30,702,251 135,444,052 29,625,050 9,929,261 1,958,265 6,826,647 9,292,304 8,246,295 175,820 16,446,155 9,118,029 — 257,764,129
(Continued)
CITY OF BEVERLY HILLS, CALIFORNIACombining Statement of Revenues, Expenses and Changes in Net Position
Internal Service Funds
For the year ended June 30, 2013
115 InternalService_13 (sskorkaite)IS1

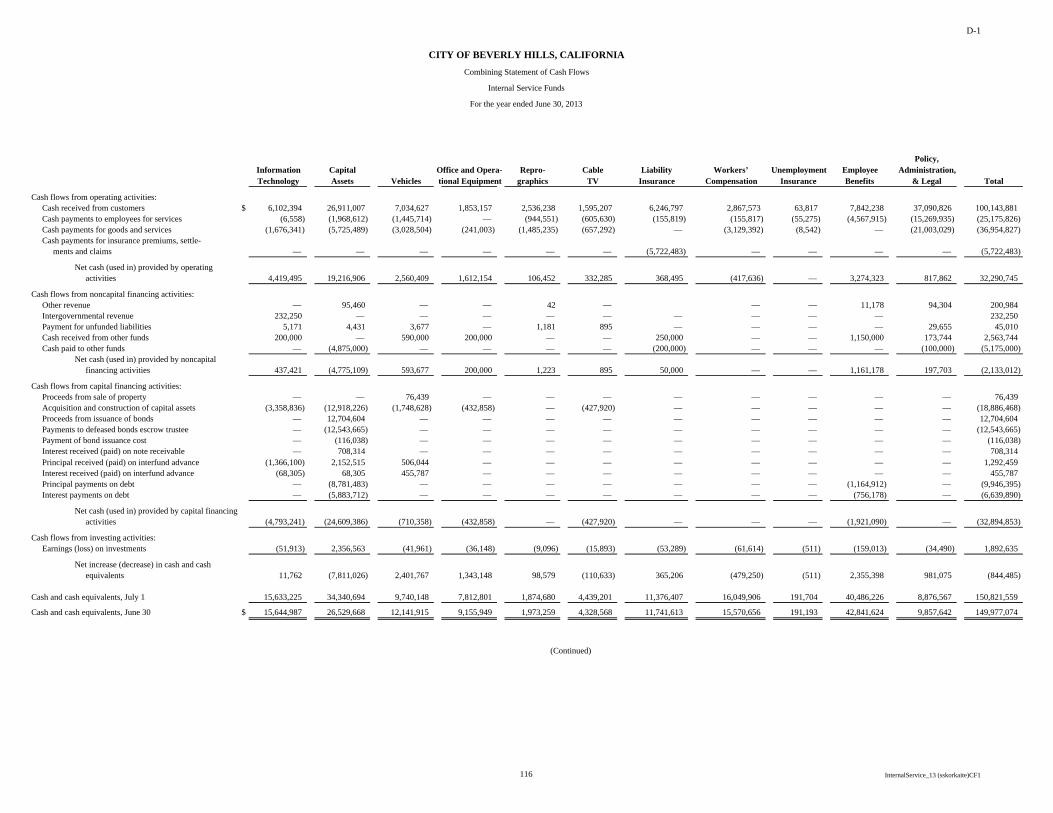
D-1
Policy,Information Capital Office and Opera- Repro- Cable Liability Workers’ Unemployment Employee Administration,Technology Assets Vehicles tional Equipment graphics TV Insurance Compensation Insurance Benefits & Legal Total
Cash flows from operating activities:Cash received from customers $ 6,102,394 26,911,007 7,034,627 1,853,157 2,536,238 1,595,207 6,246,797 2,867,573 63,817 7,842,238 37,090,826 100,143,881 Cash payments to employees for services (6,558) (1,968,612) (1,445,714) — (944,551) (605,630) (155,819) (155,817) (55,275) (4,567,915) (15,269,935) (25,175,826) Cash payments for goods and services (1,676,341) (5,725,489) (3,028,504) (241,003) (1,485,235) (657,292) — (3,129,392) (8,542) — (21,003,029) (36,954,827) Cash payments for insurance premiums, settle-
ments and claims — — — — — — (5,722,483) — — — — (5,722,483)
Net cash (used in) provided by operating activities 4,419,495 19,216,906 2,560,409 1,612,154 106,452 332,285 368,495 (417,636) — 3,274,323 817,862 32,290,745
Cash flows from noncapital financing activities:Other revenue — 95,460 — — 42 — — — 11,178 94,304 200,984 Intergovernmental revenue 232,250 — — — — — — — — — 232,250 Payment for unfunded liabilities 5,171 4,431 3,677 — 1,181 895 — — — — 29,655 45,010 Cash received from other funds 200,000 — 590,000 200,000 — — 250,000 — — 1,150,000 173,744 2,563,744 Cash paid to other funds — (4,875,000) — — — — (200,000) — — — (100,000) (5,175,000)
Net cash (used in) provided by noncapitalfinancing activities 437,421 (4,775,109) 593,677 200,000 1,223 895 50,000 — — 1,161,178 197,703 (2,133,012)
Cash flows from capital financing activities:Proceeds from sale of property — — 76,439 — — — — — — — — 76,439 Acquisition and construction of capital assets (3,358,836) (12,918,226) (1,748,628) (432,858) — (427,920) — — — — — (18,886,468) Proceeds from issuance of bonds — 12,704,604 — — — — — — — — — 12,704,604 Payments to defeased bonds escrow trustee — (12,543,665) — — — — — — — — — (12,543,665) Payment of bond issuance cost — (116,038) — — — — — — — — — (116,038) Interest received (paid) on note receivable — 708,314 — — — — — — — — — 708,314 Principal received (paid) on interfund advance (1,366,100) 2,152,515 506,044 — — — — — — — — 1,292,459 Interest received (paid) on interfund advance (68,305) 68,305 455,787 — — — — — — — — 455,787 Principal payments on debt — (8,781,483) — — — — — — — (1,164,912) — (9,946,395) Interest payments on debt — (5,883,712) — — — — — — — (756,178) — (6,639,890)
Net cash (used in) provided by capital financingactivities (4,793,241) (24,609,386) (710,358) (432,858) — (427,920) — — — (1,921,090) — (32,894,853)
Cash flows from investing activities:Earnings (loss) on investments (51,913) 2,356,563 (41,961) (36,148) (9,096) (15,893) (53,289) (61,614) (511) (159,013) (34,490) 1,892,635
Net increase (decrease) in cash and cashequivalents 11,762 (7,811,026) 2,401,767 1,343,148 98,579 (110,633) 365,206 (479,250) (511) 2,355,398 981,075 (844,485)
Cash and cash equivalents, July 1 15,633,225 34,340,694 9,740,148 7,812,801 1,874,680 4,439,201 11,376,407 16,049,906 191,704 40,486,226 8,876,567 150,821,559
Cash and cash equivalents, June 30 $ 15,644,987 26,529,668 12,141,915 9,155,949 1,973,259 4,328,568 11,741,613 15,570,656 191,193 42,841,624 9,857,642 149,977,074
(Continued)
CITY OF BEVERLY HILLS, CALIFORNIA
Combining Statement of Cash Flows
Internal Service Funds
For the year ended June 30, 2013
116 InternalService_13 (sskorkaite)CF1
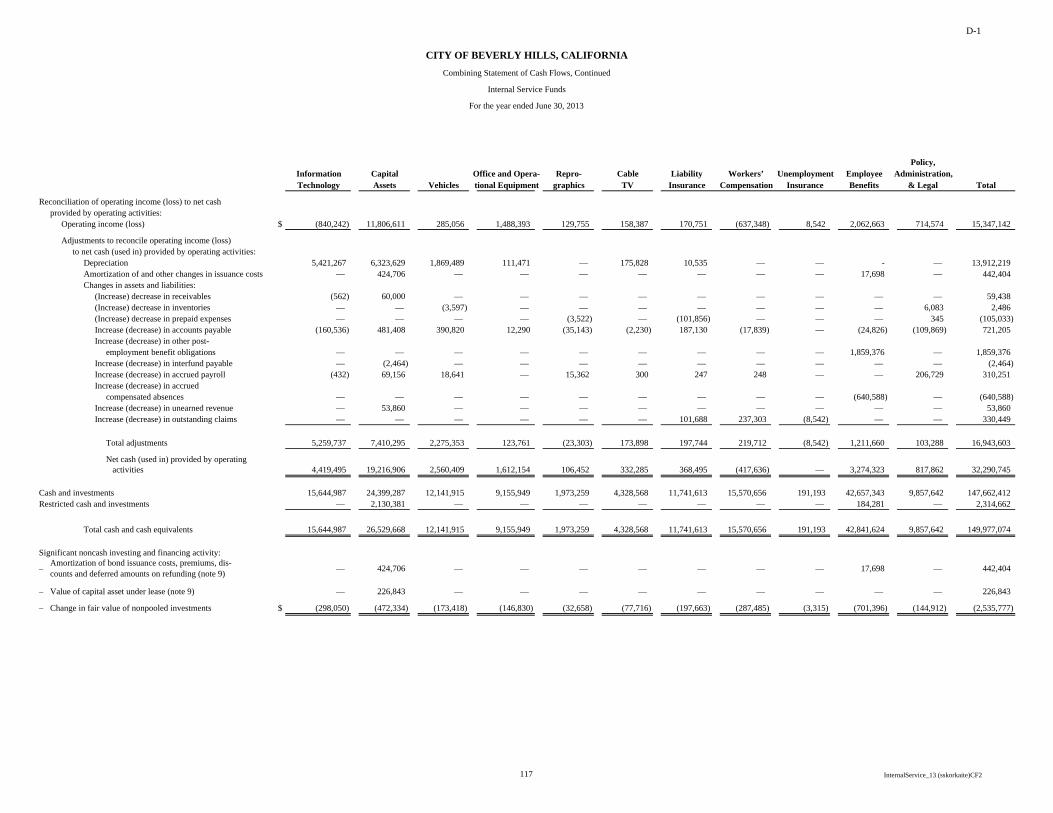
D-1
Policy,Information Capital Office and Opera- Repro- Cable Liability Workers’ Unemployment Employee Administration,Technology Assets Vehicles tional Equipment graphics TV Insurance Compensation Insurance Benefits & Legal Total
Reconciliation of operating income (loss) to net cashprovided by operating activities:
Operating income (loss) $ (840,242) 11,806,611 285,056 1,488,393 129,755 158,387 170,751 (637,348) 8,542 2,062,663 714,574 15,347,142
Adjustments to reconcile operating income (loss)to net cash (used in) provided by operating activities:
Depreciation 5,421,267 6,323,629 1,869,489 111,471 — 175,828 10,535 — — - — 13,912,219 Amortization of and other changes in issuance costs — 424,706 — — — — — — — 17,698 — 442,404 Changes in assets and liabilities:
(Increase) decrease in receivables (562) 60,000 — — — — — — — — — 59,438 (Increase) decrease in inventories — — (3,597) — — — — — — — 6,083 2,486 (Increase) decrease in prepaid expenses — — — — (3,522) — (101,856) — — — 345 (105,033) Increase (decrease) in accounts payable (160,536) 481,408 390,820 12,290 (35,143) (2,230) 187,130 (17,839) — (24,826) (109,869) 721,205 Increase (decrease) in other post-
employment benefit obligations — — — — — — — — — 1,859,376 — 1,859,376 Increase (decrease) in interfund payable — (2,464) — — — — — — — — — (2,464) Increase (decrease) in accrued payroll (432) 69,156 18,641 — 15,362 300 247 248 — — 206,729 310,251 Increase (decrease) in accrued
compensated absences — — — — — — — — — (640,588) — (640,588) Increase (decrease) in unearned revenue — 53,860 — — — — — — — — — 53,860 Increase (decrease) in outstanding claims — — — — — — 101,688 237,303 (8,542) — — 330,449
Total adjustments 5,259,737 7,410,295 2,275,353 123,761 (23,303) 173,898 197,744 219,712 (8,542) 1,211,660 103,288 16,943,603
Net cash (used in) provided by operating activities 4,419,495 19,216,906 2,560,409 1,612,154 106,452 332,285 368,495 (417,636) — 3,274,323 817,862 32,290,745
Cash and investments 15,644,987 24,399,287 12,141,915 9,155,949 1,973,259 4,328,568 11,741,613 15,570,656 191,193 42,657,343 9,857,642 147,662,412 Restricted cash and investments — 2,130,381 — — — — — — — 184,281 — 2,314,662
Total cash and cash equivalents 15,644,987 26,529,668 12,141,915 9,155,949 1,973,259 4,328,568 11,741,613 15,570,656 191,193 42,841,624 9,857,642 149,977,074
Significant noncash investing and financing activity:
– — 424,706 — — — — — — — 17,698 — 442,404
– Value of capital asset under lease (note 9) — 226,843 — — — — — — — — — 226,843
– Change in fair value of nonpooled investments $ (298,050) (472,334) (173,418) (146,830) (32,658) (77,716) (197,663) (287,485) (3,315) (701,396) (144,912) (2,535,777)
Amortization of bond issuance costs, premiums, dis-counts and deferred amounts on refunding (note 9)
CITY OF BEVERLY HILLS, CALIFORNIA
Combining Statement of Cash Flows, Continued
Internal Service Funds
For the year ended June 30, 2013
117 InternalService_13 (sskorkaite)CF2


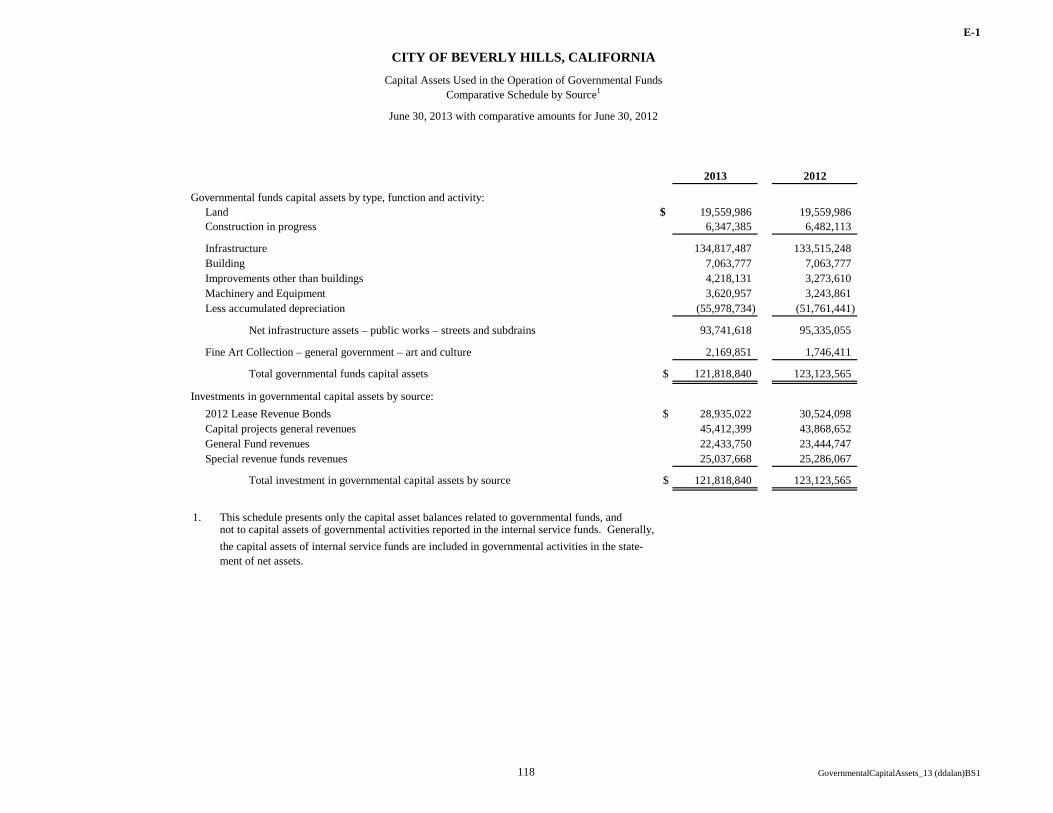
E-1
2013 2012
Governmental funds capital assets by type, function and activity:Land $ 19,559,986 19,559,986Construction in progress 6,347,385 6,482,113
Infrastructure 134,817,487 133,515,248Building 7,063,777 7,063,777Improvements other than buildings 4,218,131 3,273,610Machinery and Equipment 3,620,957 3,243,861Less accumulated depreciation (55,978,734) (51,761,441)
Net infrastructure assets – public works – streets and subdrains 93,741,618 95,335,055
Fine Art Collection – general government – art and culture 2,169,851 1,746,411
Total governmental funds capital assets $ 121,818,840 123,123,565
Investments in governmental capital assets by source:2012 Lease Revenue Bonds $ 28,935,022 30,524,098Capital projects general revenues 45,412,399 43,868,652General Fund revenues 22,433,750 23,444,747Special revenue funds revenues 25,037,668 25,286,067
Total investment in governmental capital assets by source $ 121,818,840 123,123,565
1. This schedule presents only the capital asset balances related to governmental funds, andnot to capital assets of governmental activities reported in the internal service funds. Generally,the capital assets of internal service funds are included in governmental activities in the state-ment of net assets.
Comparative Schedule by Source1
CITY OF BEVERLY HILLS, CALIFORNIACapital Assets Used in the Operation of Governmental Funds
June 30, 2013 with comparative amounts for June 30, 2012
118 GovernmentalCapitalAssets_13 (ddalan)BS1
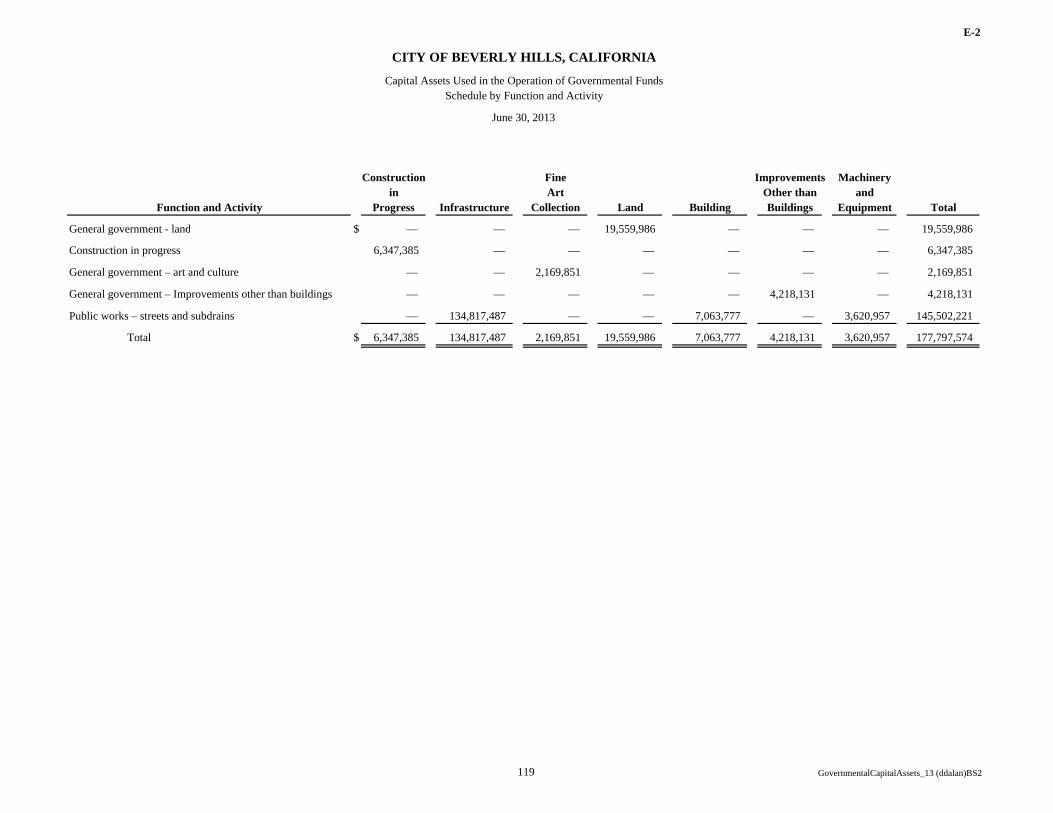
E-2
Construction Fine Improvements Machineryin Art Other than and
Progress Infrastructure Collection Land Building Buildings Equipment Total
General government - land $ — — — 19,559,986 — — — 19,559,986
Construction in progress 6,347,385 — — — — — — 6,347,385
General government – art and culture — — 2,169,851 — — — — 2,169,851
General government – Improvements other than buildings — — — — — 4,218,131 — 4,218,131
Public works – streets and subdrains — 134,817,487 — — 7,063,777 — 3,620,957 145,502,221
Total $ 6,347,385 134,817,487 2,169,851 19,559,986 7,063,777 4,218,131 3,620,957 177,797,574
Function and Activity
CITY OF BEVERLY HILLS, CALIFORNIA
Capital Assets Used in the Operation of Governmental FundsSchedule by Function and Activity
June 30, 2013
119 GovernmentalCapitalAssets_13 (ddalan)BS2
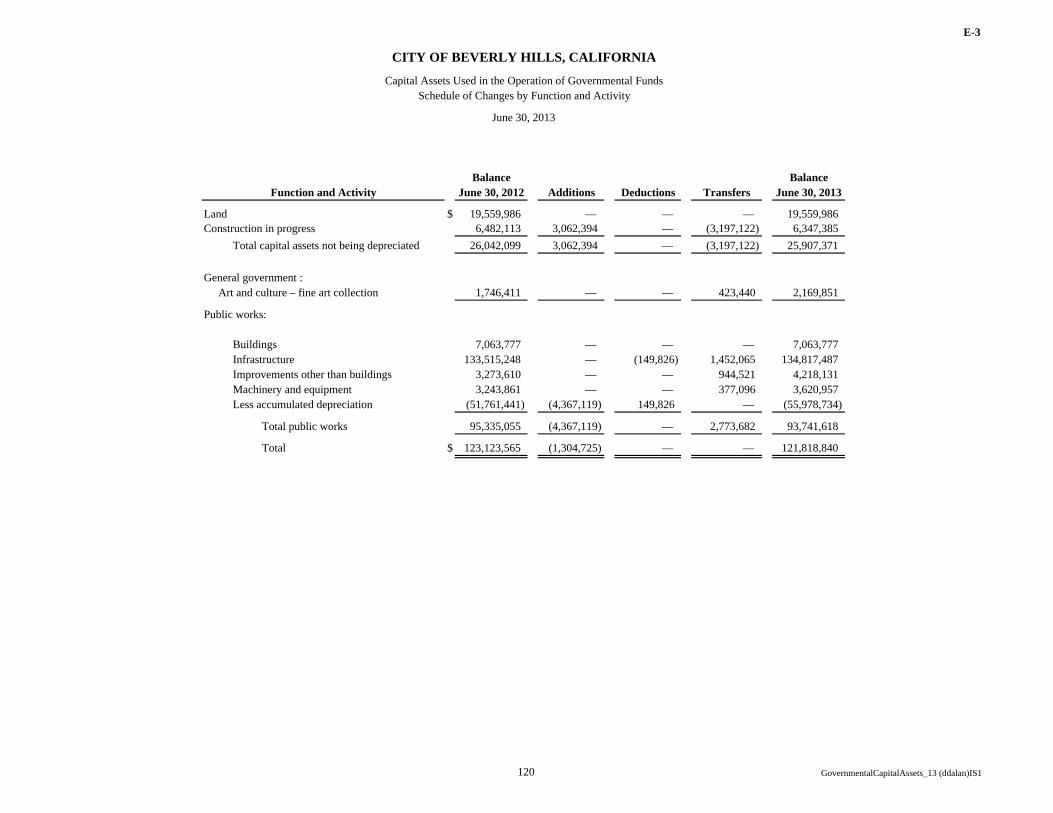
E-3
Balance BalanceJune 30, 2012 Additions Deductions Transfers June 30, 2013
Land $ 19,559,986 — — — 19,559,986Construction in progress 6,482,113 3,062,394 — (3,197,122) 6,347,385
Total capital assets not being depreciated 26,042,099 3,062,394 — (3,197,122) 25,907,371
General government :Art and culture – fine art collection 1,746,411 — — 423,440 2,169,851
Public works:
Buildings 7,063,777 — — — 7,063,777Infrastructure 133,515,248 — (149,826) 1,452,065 134,817,487Improvements other than buildings 3,273,610 — — 944,521 4,218,131Machinery and equipment 3,243,861 — — 377,096 3,620,957Less accumulated depreciation (51,761,441) (4,367,119) 149,826 — (55,978,734)
Total public works 95,335,055 (4,367,119) — 2,773,682 93,741,618
Total $ 123,123,565 (1,304,725) — — 121,818,840
Function and Activity
CITY OF BEVERLY HILLS, CALIFORNIA
Capital Assets Used in the Operation of Governmental FundsSchedule of Changes by Function and Activity
June 30, 2013
120 GovernmentalCapitalAssets_13 (ddalan)IS1

CITY OF BEVERLY HILLS CALIFORNIA Statistical Section
June 30, 2013
121
The statistical section of the City of Beverly Hills consists of statistics on various operational aspects of the City. The information presented is un-audited. Its purpose is to provide the user with additional information that would assist in understanding and assessing how the overall financial position of the City has changed over time. The statistical section can be divided into 5 areas:
Net Position and Changes in Net Position- the schedules provided depict the financial trend of the City’s net position and will assist the user in the assessment of the City’s financial position. In addition, the schedules for the changes in net position will give the user a better perspective on the information provided in the basic financial statements.
Revenue Capacity- the data provided will show the
City’s ability to generate its own revenue. The overlapping rate schedules will illustrate the citizens’ of Beverly Hills capacity for additional rate increases. By providing the information of the City’s direct rate, the data establishes the link in creating a more complete picture on the taxes levied on the City’s taxpayers.
Debt Capacity- the data provided will show the City’s
levels of outstanding debt and the City’s ability to issue additional debt. The information will give a measure of what the City’s economy can bear.
Demographic and Economic Information- the data
provided will assist users in understanding the economic condition in which the City’s financial activities take place.
Operating Information- the data provided will show a
quantitative measure of the activities in which the City engages and will assist users in gaining an idea of the size of the City. This section will complement the data provided in the Management Discussion and Analysis (MD&A), basic financial statements, and other sections.
The data of these statistics have been derived from the City of Beverly Hills’ Comprehensive Annual Financial Report unless otherwise noted.
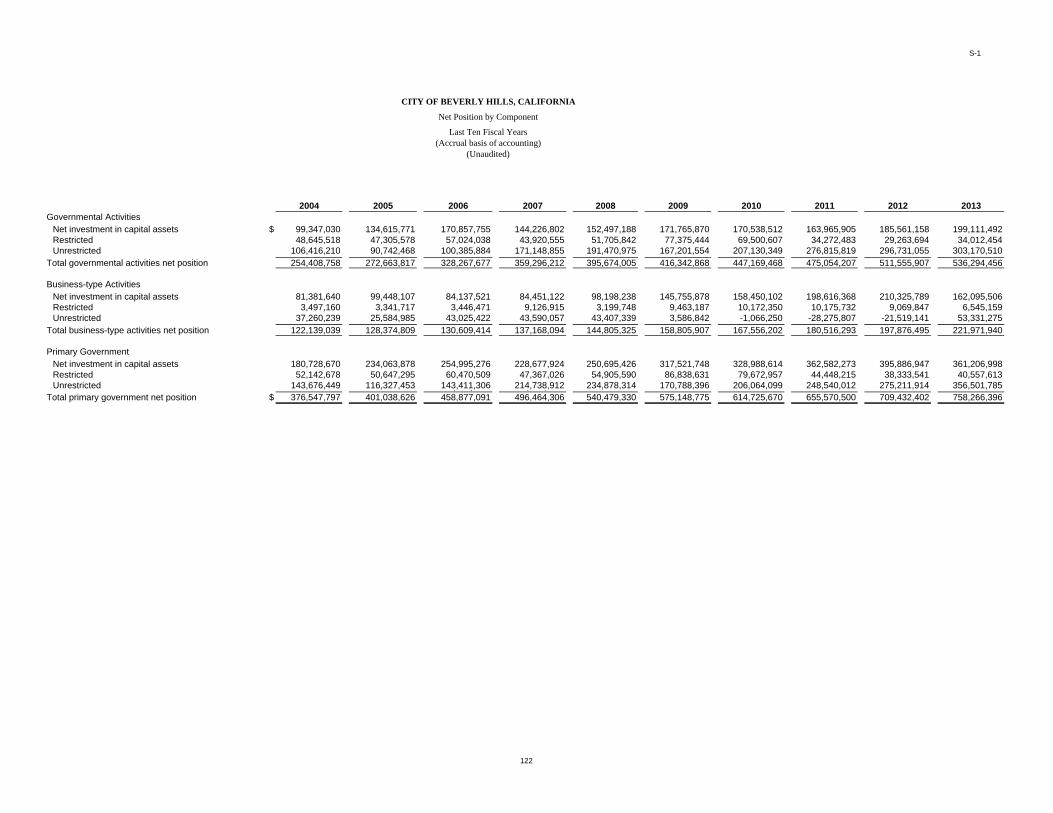
S-1
2004 2005 2006 2007 2008 2009 2010 2011 2012 2013Governmental Activities
Net investment in capital assets $ 99,347,030 134,615,771 170,857,755 144,226,802 152,497,188 171,765,870 170,538,512 163,965,905 185,561,158 199,111,492Restricted 48,645,518 47,305,578 57,024,038 43,920,555 51,705,842 77,375,444 69,500,607 34,272,483 29,263,694 34,012,454Unrestricted 106,416,210 90,742,468 100,385,884 171,148,855 191,470,975 167,201,554 207,130,349 276,815,819 296,731,055 303,170,510
Total governmental activities net position 254,408,758 272,663,817 328,267,677 359,296,212 395,674,005 416,342,868 447,169,468 475,054,207 511,555,907 536,294,456
Business-type ActivitiesNet investment in capital assets 81,381,640 99,448,107 84,137,521 84,451,122 98,198,238 145,755,878 158,450,102 198,616,368 210,325,789 162,095,506Restricted 3,497,160 3,341,717 3,446,471 9,126,915 3,199,748 9,463,187 10,172,350 10,175,732 9,069,847 6,545,159Unrestricted 37,260,239 25,584,985 43,025,422 43,590,057 43,407,339 3,586,842 -1,066,250 -28,275,807 -21,519,141 53,331,275
Total business-type activities net position 122,139,039 128,374,809 130,609,414 137,168,094 144,805,325 158,805,907 167,556,202 180,516,293 197,876,495 221,971,940
Primary GovernmentNet investment in capital assets 180,728,670 234,063,878 254,995,276 228,677,924 250,695,426 317,521,748 328,988,614 362,582,273 395,886,947 361,206,998Restricted 52,142,678 50,647,295 60,470,509 47,367,026 54,905,590 86,838,631 79,672,957 44,448,215 38,333,541 40,557,613Unrestricted 143,676,449 116,327,453 143,411,306 214,738,912 234,878,314 170,788,396 206,064,099 248,540,012 275,211,914 356,501,785, , , ,
Total primary government net position $ 376,547,797 401,038,626 458,877,091 496,464,306 540,479,330 575,148,775 614,725,670 655,570,500 709,432,402 758,266,396
CITY OF BEVERLY HILLS, CALIFORNIA
Net Position by Component
Last Ten Fiscal Years(Accrual basis of accounting)
(Unaudited)
122
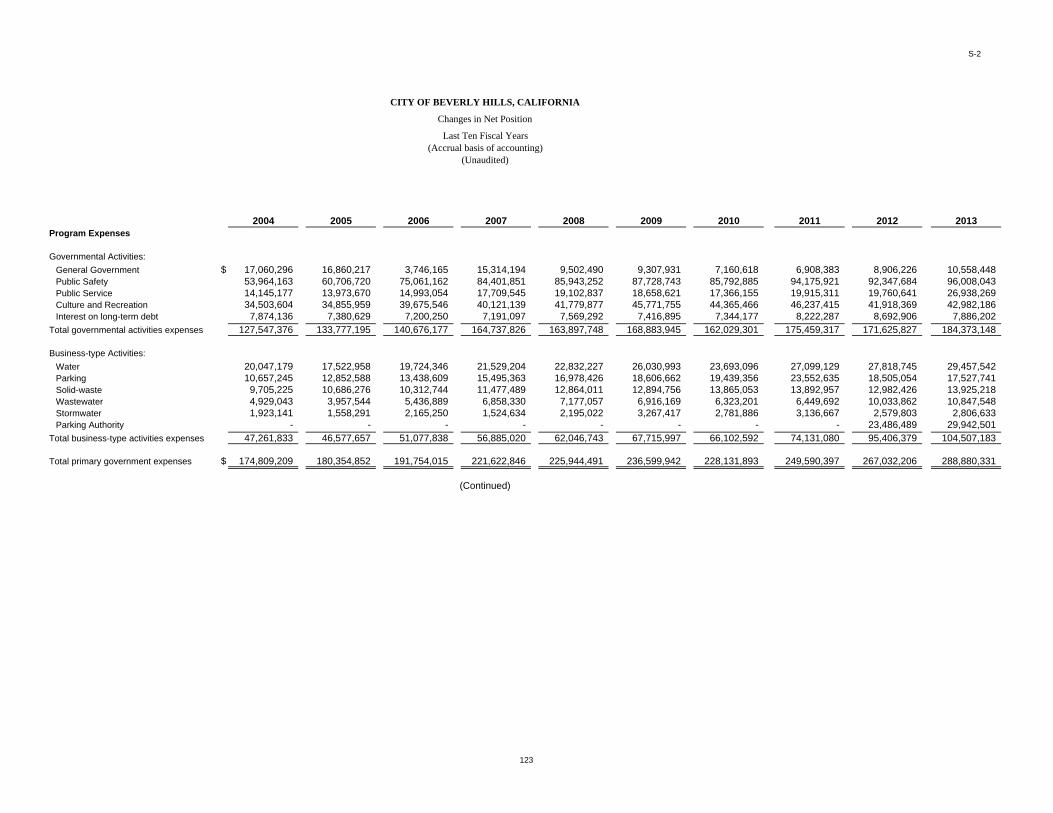
S-2
2004 2005 2006 2007 2008 2009 2010 2011 2012 2013Program Expenses
Governmental Activities:General Government $ 17,060,296 16,860,217 3,746,165 15,314,194 9,502,490 9,307,931 7,160,618 6,908,383 8,906,226 10,558,448 Public Safety 53,964,163 60,706,720 75,061,162 84,401,851 85,943,252 87,728,743 85,792,885 94,175,921 92,347,684 96,008,043 Public Service 14,145,177 13,973,670 14,993,054 17,709,545 19,102,837 18,658,621 17,366,155 19,915,311 19,760,641 26,938,269 Culture and Recreation 34,503,604 34,855,959 39,675,546 40,121,139 41,779,877 45,771,755 44,365,466 46,237,415 41,918,369 42,982,186 Interest on long-term debt 7,874,136 7,380,629 7,200,250 7,191,097 7,569,292 7,416,895 7,344,177 8,222,287 8,692,906 7,886,202
Total governmental activities expenses 127,547,376 133,777,195 140,676,177 164,737,826 163,897,748 168,883,945 162,029,301 175,459,317 171,625,827 184,373,148
Business-type Activities:Water 20,047,179 17,522,958 19,724,346 21,529,204 22,832,227 26,030,993 23,693,096 27,099,129 27,818,745 29,457,542 Parking 10,657,245 12,852,588 13,438,609 15,495,363 16,978,426 18,606,662 19,439,356 23,552,635 18,505,054 17,527,741 Solid-waste 9,705,225 10,686,276 10,312,744 11,477,489 12,864,011 12,894,756 13,865,053 13,892,957 12,982,426 13,925,218 Wastewater 4,929,043 3,957,544 5,436,889 6,858,330 7,177,057 6,916,169 6,323,201 6,449,692 10,033,862 10,847,548 Stormwater 1,923,141 1,558,291 2,165,250 1,524,634 2,195,022 3,267,417 2,781,886 3,136,667 2,579,803 2,806,633 Parking Authority - - - - - - - - 23,486,489 29,942,501
Total business-type activities expenses 47,261,833 46,577,657 51,077,838 56,885,020 62,046,743 67,715,997 66,102,592 74,131,080 95,406,379 104,507,183
Total primary government expenses $ 174,809,209 180,354,852 191,754,015 221,622,846 225,944,491 236,599,942 228,131,893 249,590,397 267,032,206 288,880,331
(Continued)
CITY OF BEVERLY HILLS, CALIFORNIA
Changes in Net Position
Last Ten Fiscal Years(Accrual basis of accounting)
(Unaudited)
123
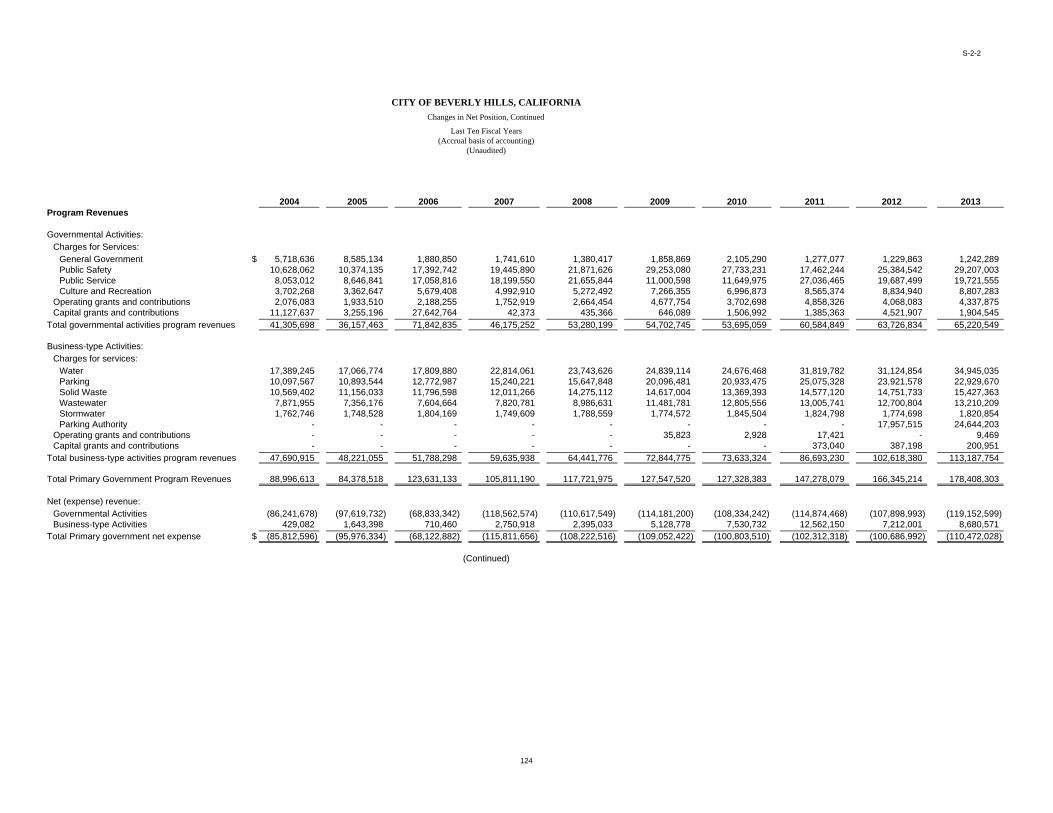
S-2-2
2004 2005 2006 2007 2008 2009 2010 2011 2012 2013Program Revenues
Governmental Activities:Charges for Services:
General Government $ 5,718,636 8,585,134 1,880,850 1,741,610 1,380,417 1,858,869 2,105,290 1,277,077 1,229,863 1,242,289 Public Safety 10,628,062 10,374,135 17,392,742 19,445,890 21,871,626 29,253,080 27,733,231 17,462,244 25,384,542 29,207,003 Public Service 8,053,012 8,646,841 17,058,816 18,199,550 21,655,844 11,000,598 11,649,975 27,036,465 19,687,499 19,721,555 Culture and Recreation 3,702,268 3,362,647 5,679,408 4,992,910 5,272,492 7,266,355 6,996,873 8,565,374 8,834,940 8,807,283
Operating grants and contributions 2,076,083 1,933,510 2,188,255 1,752,919 2,664,454 4,677,754 3,702,698 4,858,326 4,068,083 4,337,875 Capital grants and contributions 11,127,637 3,255,196 27,642,764 42,373 435,366 646,089 1,506,992 1,385,363 4,521,907 1,904,545
Total governmental activities program revenues 41,305,698 36,157,463 71,842,835 46,175,252 53,280,199 54,702,745 53,695,059 60,584,849 63,726,834 65,220,549
Business-type Activities:Charges for services:
Water 17,389,245 17,066,774 17,809,880 22,814,061 23,743,626 24,839,114 24,676,468 31,819,782 31,124,854 34,945,035 Parking 10,097,567 10,893,544 12,772,987 15,240,221 15,647,848 20,096,481 20,933,475 25,075,328 23,921,578 22,929,670 Solid Waste 10,569,402 11,156,033 11,796,598 12,011,266 14,275,112 14,617,004 13,369,393 14,577,120 14,751,733 15,427,363 Wastewater 7,871,955 7,356,176 7,604,664 7,820,781 8,986,631 11,481,781 12,805,556 13,005,741 12,700,804 13,210,209 Stormwater 1,762,746 1,748,528 1,804,169 1,749,609 1,788,559 1,774,572 1,845,504 1,824,798 1,774,698 1,820,854 Parking Authority - - - - - - - - 17,957,515 24,644,203
Operating grants and contributions - - - - - 35,823 2,928 17,421 - 9,469 Capital grants and contributions - - - - - - - 373,040 387,198 200,951
Total business-type activities program revenues 47,690,915 48,221,055 51,788,298 59,635,938 64,441,776 72,844,775 73,633,324 86,693,230 102,618,380 113,187,754
Total Primary Government Program Revenues 88,996,613 84,378,518 123,631,133 105,811,190 117,721,975 127,547,520 127,328,383 147,278,079 166,345,214 178,408,303
Net (expense) revenue:Governmental Activities (86,241,678) (97,619,732) (68,833,342) (118,562,574) (110,617,549) (114,181,200) (108,334,242) (114,874,468) (107,898,993) (119,152,599) Business-type Activities 429,082 1,643,398 710,460 2,750,918 2,395,033 5,128,778 7,530,732 12,562,150 7,212,001 8,680,571
Total Primary government net expense $ (85,812,596) (95,976,334) (68,122,882) (115,811,656) (108,222,516) (109,052,422) (100,803,510) (102,312,318) (100,686,992) (110,472,028)
(Continued)
CITY OF BEVERLY HILLS, CALIFORNIAChanges in Net Position, Continued
Last Ten Fiscal Years(Accrual basis of accounting)
(Unaudited)
124
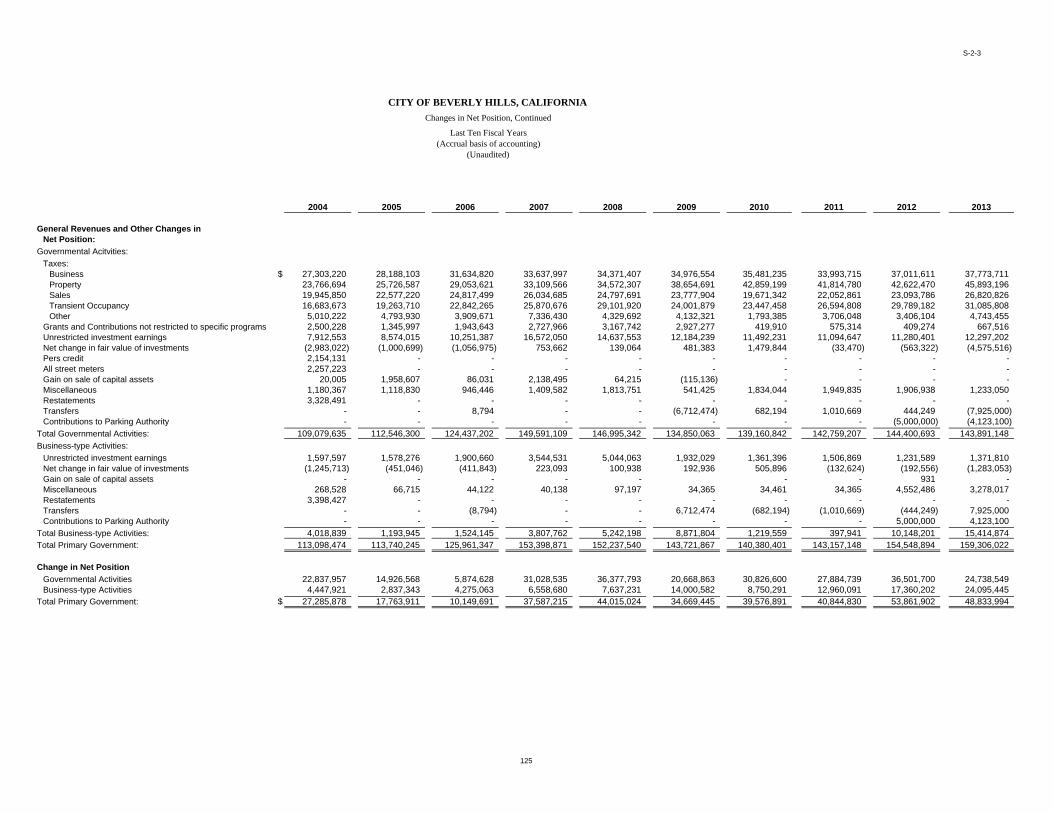
S-2-3
2004 2005 2006 2007 2008 2009 2010 2011 2012 2013
General Revenues and Other Changes in Net Position:
Governmental Acitvities:Taxes:
Business $ 27,303,220 28,188,103 31,634,820 33,637,997 34,371,407 34,976,554 35,481,235 33,993,715 37,011,611 37,773,711 Property 23,766,694 25,726,587 29,053,621 33,109,566 34,572,307 38,654,691 42,859,199 41,814,780 42,622,470 45,893,196 Sales 19,945,850 22,577,220 24,817,499 26,034,685 24,797,691 23,777,904 19,671,342 22,052,861 23,093,786 26,820,826 Transient Occupancy 16,683,673 19,263,710 22,842,265 25,870,676 29,101,920 24,001,879 23,447,458 26,594,808 29,789,182 31,085,808 Other 5,010,222 4,793,930 3,909,671 7,336,430 4,329,692 4,132,321 1,793,385 3,706,048 3,406,104 4,743,455
Grants and Contributions not restricted to specific programs 2,500,228 1,345,997 1,943,643 2,727,966 3,167,742 2,927,277 419,910 575,314 409,274 667,516 Unrestricted investment earnings 7,912,553 8,574,015 10,251,387 16,572,050 14,637,553 12,184,239 11,492,231 11,094,647 11,280,401 12,297,202 Net change in fair value of investments (2,983,022) (1,000,699) (1,056,975) 753,662 139,064 481,383 1,479,844 (33,470) (563,322) (4,575,516) Pers credit 2,154,131 - - - - - - - - - All street meters 2,257,223 - - - - - - - - - Gain on sale of capital assets 20,005 1,958,607 86,031 2,138,495 64,215 (115,136) - - - - Miscellaneous 1,180,367 1,118,830 946,446 1,409,582 1,813,751 541,425 1,834,044 1,949,835 1,906,938 1,233,050 Restatements 3,328,491 - - - - - - - - - Transfers - - 8,794 - - (6,712,474) 682,194 1,010,669 444,249 (7,925,000) Contributions to Parking Authority - - - - - - - - (5,000,000) (4,123,100)
Total Governmental Activities: 109,079,635 112,546,300 124,437,202 149,591,109 146,995,342 134,850,063 139,160,842 142,759,207 144,400,693 143,891,148 Business-type Activities:
Unrestricted investment earnings 1,597,597 1,578,276 1,900,660 3,544,531 5,044,063 1,932,029 1,361,396 1,506,869 1,231,589 1,371,810 Net change in fair value of investments (1,245,713) (451,046) (411,843) 223,093 100,938 192,936 505,896 (132,624) (192,556) (1,283,053) Gain on sale of capital assets - - - - - - - 931 - Miscellaneous 268,528 66,715 44,122 40,138 97,197 34,365 34,461 34,365 4,552,486 3,278,017 Restatements 3,398,427 - - - - - - - - - Transfers - - (8,794) - - 6,712,474 (682,194) (1,010,669) (444,249) 7,925,000 Contributions to Parking Authority - - - - - - - - 5,000,000 4,123,100
Total Business-type Activities: 4,018,839 1,193,945 1,524,145 3,807,762 5,242,198 8,871,804 1,219,559 397,941 10,148,201 15,414,874 Total Primary Government: 113,098,474 113,740,245 125,961,347 153,398,871 152,237,540 143,721,867 140,380,401 143,157,148 154,548,894 159,306,022
Change in Net PositionGovernmental Activities 22,837,957 14,926,568 5,874,628 31,028,535 36,377,793 20,668,863 30,826,600 27,884,739 36,501,700 24,738,549 Business-type Activities 4,447,921 2,837,343 4,275,063 6,558,680 7,637,231 14,000,582 8,750,291 12,960,091 17,360,202 24,095,445
Total Primary Government: $ 27,285,878 17,763,911 10,149,691 37,587,215 44,015,024 34,669,445 39,576,891 40,844,830 53,861,902 48,833,994
CITY OF BEVERLY HILLS, CALIFORNIAChanges in Net Position, Continued
Last Ten Fiscal Years(Accrual basis of accounting)
(Unaudited)
125
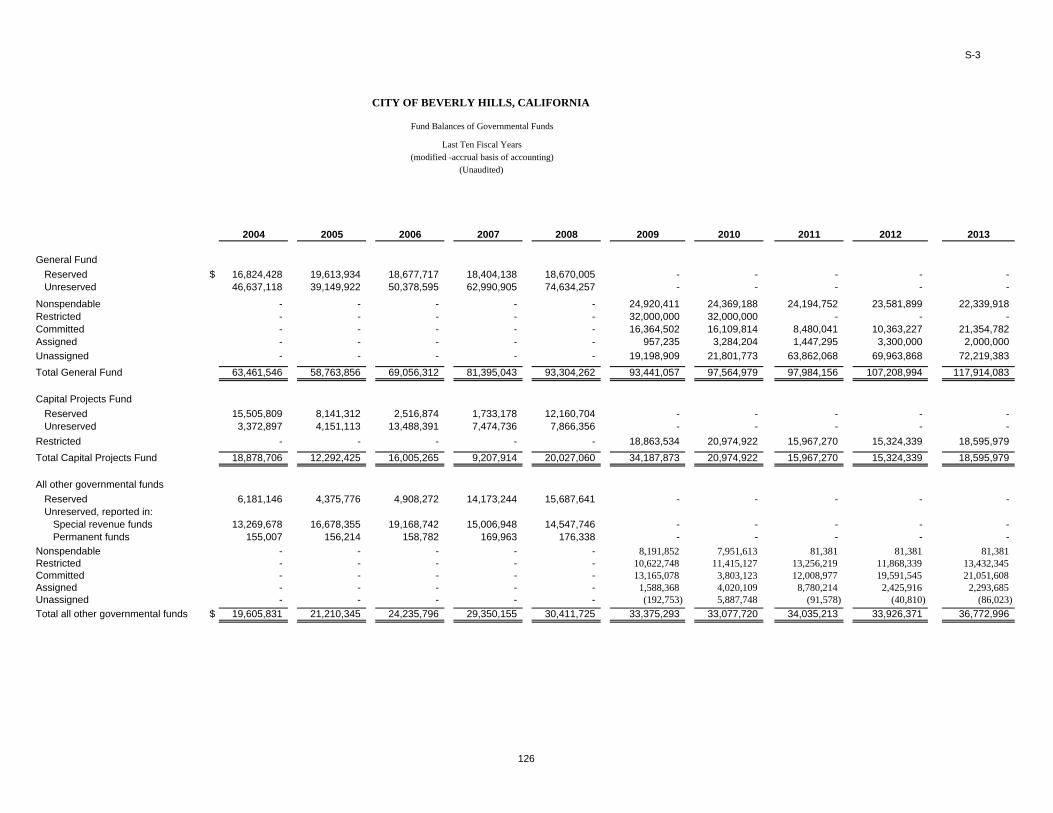
S-3
2004 2005 2006 2007 2008 2009 2010 2011 2012 2013
General FundReserved $ 16,824,428 19,613,934 18,677,717 18,404,138 18,670,005 - - - - - Unreserved 46,637,118 39,149,922 50,378,595 62,990,905 74,634,257 - - - - -
Nonspendable - - - - - 24,920,411 24,369,188 24,194,752 23,581,899 22,339,918 Restricted - - - - - 32,000,000 32,000,000 - - - Committed - - - - - 16,364,502 16,109,814 8,480,041 10,363,227 21,354,782 Assigned - - - - - 957,235 3,284,204 1,447,295 3,300,000 2,000,000 Unassigned - - - - - 19,198,909 21,801,773 63,862,068 69,963,868 72,219,383 Total General Fund 63,461,546 58,763,856 69,056,312 81,395,043 93,304,262 93,441,057 97,564,979 97,984,156 107,208,994 117,914,083
Capital Projects FundReserved 15,505,809 8,141,312 2,516,874 1,733,178 12,160,704 - - - - - Unreserved 3,372,897 4,151,113 13,488,391 7,474,736 7,866,356 - - - - -
Restricted - - - - - 18,863,534 20,974,922 15,967,270 15,324,339 18,595,979 Total Capital Projects Fund 18,878,706 12,292,425 16,005,265 9,207,914 20,027,060 34,187,873 20,974,922 15,967,270 15,324,339 18,595,979
All other governmental fundsReserved 6,181,146 4,375,776 4,908,272 14,173,244 15,687,641 - - - - - Unreserved, reported in:
Special revenue funds 13,269,678 16,678,355 19,168,742 15,006,948 14,547,746 - - - - - Permanent funds 155,007 156,214 158,782 169,963 176,338 - - - - -
Nonspendable - - - - - 8,191,852 7,951,613 81,381 81,381 81,381Restricted - - - - - 10,622,748 11,415,127 13,256,219 11,868,339 13,432,345Committed - - - - - 13,165,078 3,803,123 12,008,977 19,591,545 21,051,608Assigned - - - - - 1,588,368 4,020,109 8,780,214 2,425,916 2,293,685Unassigned - - - - - (192,753) 5,887,748 (91,578) (40,810) (86,023)Total all other governmental funds $ 19,605,831 21,210,345 24,235,796 29,350,155 30,411,725 33,375,293 33,077,720 34,035,213 33,926,371 36,772,996
CITY OF BEVERLY HILLS, CALIFORNIA
Fund Balances of Governmental Funds
Last Ten Fiscal Years(modified -accrual basis of accounting)
(Unaudited)
126
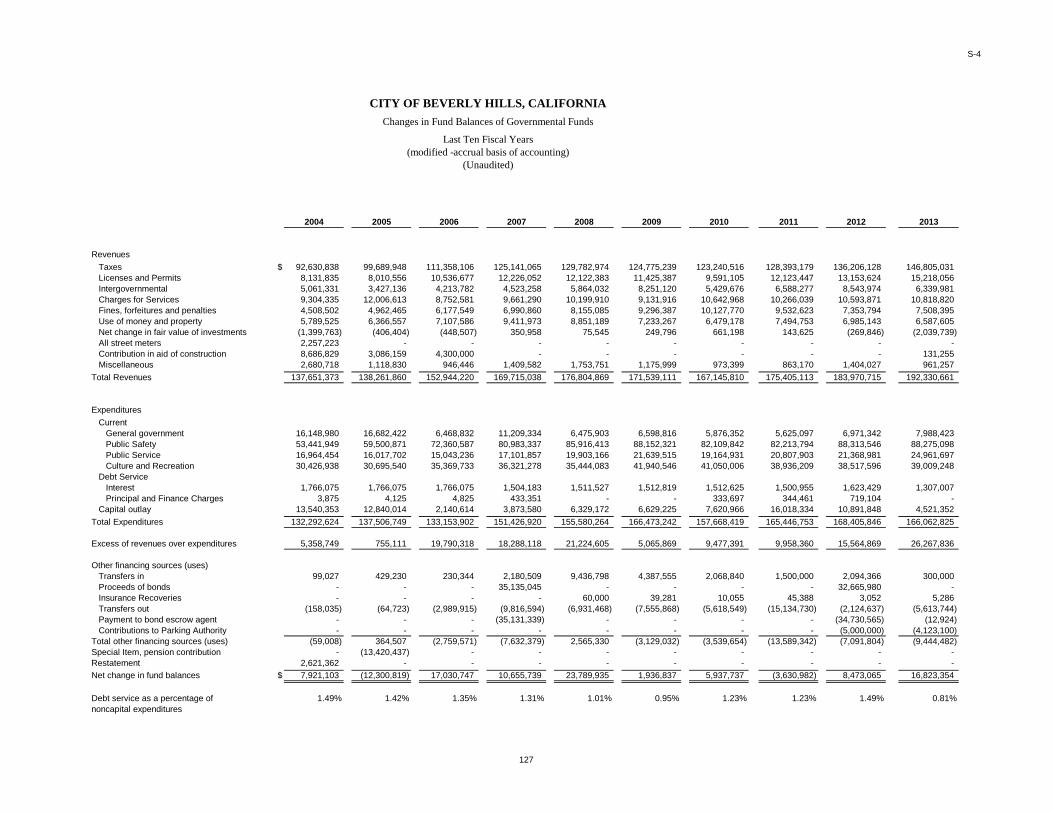
S-4
2004 2005 2006 2007 2008 2009 2010 2011 2012 2013
RevenuesTaxes $ 92,630,838 99,689,948 111,358,106 125,141,065 129,782,974 124,775,239 123,240,516 128,393,179 136,206,128 146,805,031 Licenses and Permits 8,131,835 8,010,556 10,536,677 12,226,052 12,122,383 11,425,387 9,591,105 12,123,447 13,153,624 15,218,056 Intergovernmental 5,061,331 3,427,136 4,213,782 4,523,258 5,864,032 8,251,120 5,429,676 6,588,277 8,543,974 6,339,981 Charges for Services 9,304,335 12,006,613 8,752,581 9,661,290 10,199,910 9,131,916 10,642,968 10,266,039 10,593,871 10,818,820 Fines, forfeitures and penalties 4,508,502 4,962,465 6,177,549 6,990,860 8,155,085 9,296,387 10,127,770 9,532,623 7,353,794 7,508,395 Use of money and property 5,789,525 6,366,557 7,107,586 9,411,973 8,851,189 7,233,267 6,479,178 7,494,753 6,985,143 6,587,605 Net change in fair value of investments (1,399,763) (406,404) (448,507) 350,958 75,545 249,796 661,198 143,625 (269,846) (2,039,739) All street meters 2,257,223 - - - - - - - - - Contribution in aid of construction 8,686,829 3,086,159 4,300,000 - - - - - - 131,255 Miscellaneous 2,680,718 1,118,830 946,446 1,409,582 1,753,751 1,175,999 973,399 863,170 1,404,027 961,257
Total Revenues 137,651,373 138,261,860 152,944,220 169,715,038 176,804,869 171,539,111 167,145,810 175,405,113 183,970,715 192,330,661
ExpendituresCurrent
General government 16,148,980 16,682,422 6,468,832 11,209,334 6,475,903 6,598,816 5,876,352 5,625,097 6,971,342 7,988,423 Public Safety 53,441,949 59,500,871 72,360,587 80,983,337 85,916,413 88,152,321 82,109,842 82,213,794 88,313,546 88,275,098 Public Service 16,964,454 16,017,702 15,043,236 17,101,857 19,903,166 21,639,515 19,164,931 20,807,903 21,368,981 24,961,697 Culture and Recreation 30,426,938 30,695,540 35,369,733 36,321,278 35,444,083 41,940,546 41,050,006 38,936,209 38,517,596 39,009,248
Debt ServiceInterest 1,766,075 1,766,075 1,766,075 1,504,183 1,511,527 1,512,819 1,512,625 1,500,955 1,623,429 1,307,007 Principal and Finance Charges 3,875 4,125 4,825 433,351 - - 333,697 344,461 719,104 -
Capital outlay 13,540,353 12,840,014 2,140,614 3,873,580 6,329,172 6,629,225 7,620,966 16,018,334 10,891,848 4,521,352 Total Expenditures 132,292,624 137,506,749 133,153,902 151,426,920 155,580,264 166,473,242 157,668,419 165,446,753 168,405,846 166,062,825
Excess of revenues over expenditures 5,358,749 755,111 19,790,318 18,288,118 21,224,605 5,065,869 9,477,391 9,958,360 15,564,869 26,267,836
Other financing sources (uses)Transfers in 99,027 429,230 230,344 2,180,509 9,436,798 4,387,555 2,068,840 1,500,000 2,094,366 300,000 Proceeds of bonds - - - 35,135,045 - - - - 32,665,980 - Insurance Recoveries - - - - 60,000 39,281 10,055 45,388 3,052 5,286 Transfers out (158,035) (64,723) (2,989,915) (9,816,594) (6,931,468) (7,555,868) (5,618,549) (15,134,730) (2,124,637) (5,613,744) Payment to bond escrow agent - - - (35,131,339) - - - - (34,730,565) (12,924) Contributions to Parking Authority - - - - - - - - (5,000,000) (4,123,100)
Total other financing sources (uses) (59,008) 364,507 (2,759,571) (7,632,379) 2,565,330 (3,129,032) (3,539,654) (13,589,342) (7,091,804) (9,444,482) Special Item, pension contribution - (13,420,437) - - - - - - - - Restatement 2,621,362 - - - - - - - - - Net change in fund balances $ 7,921,103 (12,300,819) 17,030,747 10,655,739 23,789,935 1,936,837 5,937,737 (3,630,982) 8,473,065 16,823,354
Debt service as a percentage of 1.49% 1.42% 1.35% 1.31% 1.01% 0.95% 1.23% 1.23% 1.49% 0.81%noncapital expenditures
CITY OF BEVERLY HILLS, CALIFORNIAChanges in Fund Balances of Governmental Funds
Last Ten Fiscal Years(modified -accrual basis of accounting)
(Unaudited)
127
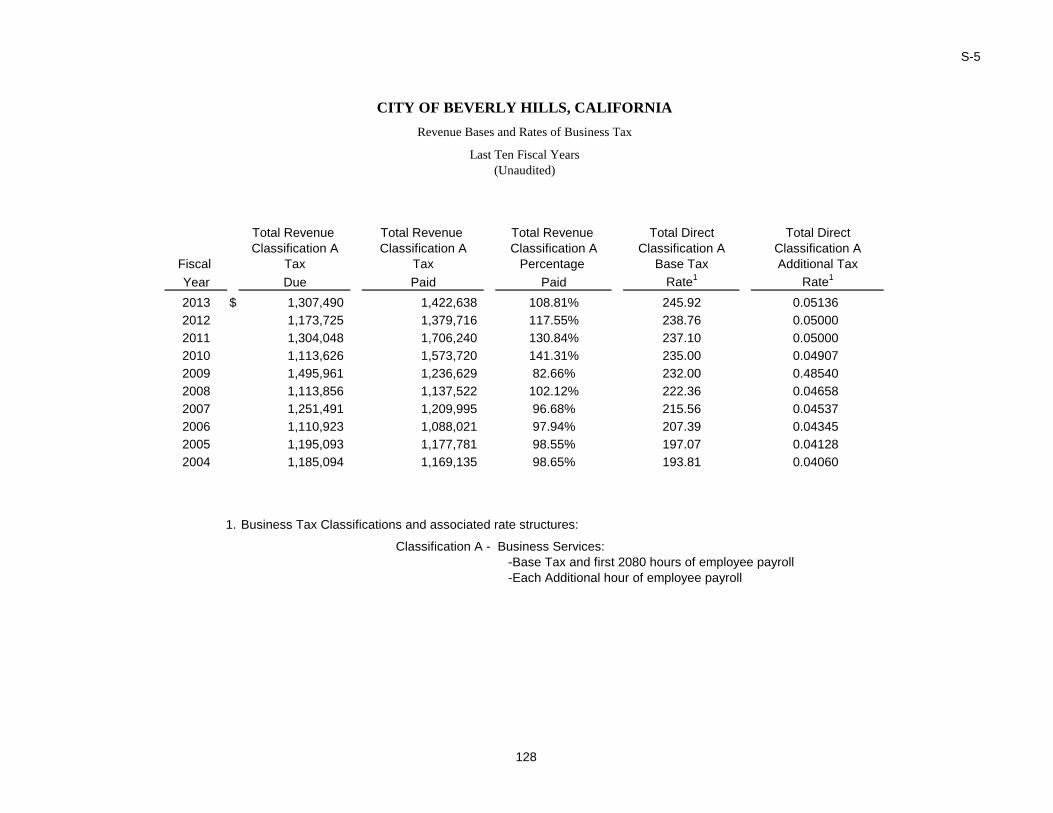
S-5
Total Revenue Total Revenue Total Revenue Total Direct Total DirectClassification A Classification A Classification A Classification A Classification A
Fiscal Tax Tax Percentage Base Tax Additional TaxYear Due Paid Paid Rate1 Rate1
2013 $ 1,307,490 1,422,638 108.81% 245.92 0.051362012 1,173,725 1,379,716 117.55% 238.76 0.050002011 1,304,048 1,706,240 130.84% 237.10 0.050002010 1,113,626 1,573,720 141.31% 235.00 0.049072009 1,495,961 1,236,629 82.66% 232.00 0.485402008 1,113,856 1,137,522 102.12% 222.36 0.046582007 1,251,491 1,209,995 96.68% 215.56 0.045372006 1,110,923 1,088,021 97.94% 207.39 0.043452005 1,195,093 1,177,781 98.55% 197.07 0.041282004 1,185,094 1,169,135 98.65% 193.81 0.04060
1. Business Tax Classifications and associated rate structures:
Classification A - Business Services:-Base Tax and first 2080 hours of employee payroll-Each Additional hour of employee payroll
CITY OF BEVERLY HILLS, CALIFORNIARevenue Bases and Rates of Business Tax
Last Ten Fiscal Years(Unaudited)
128
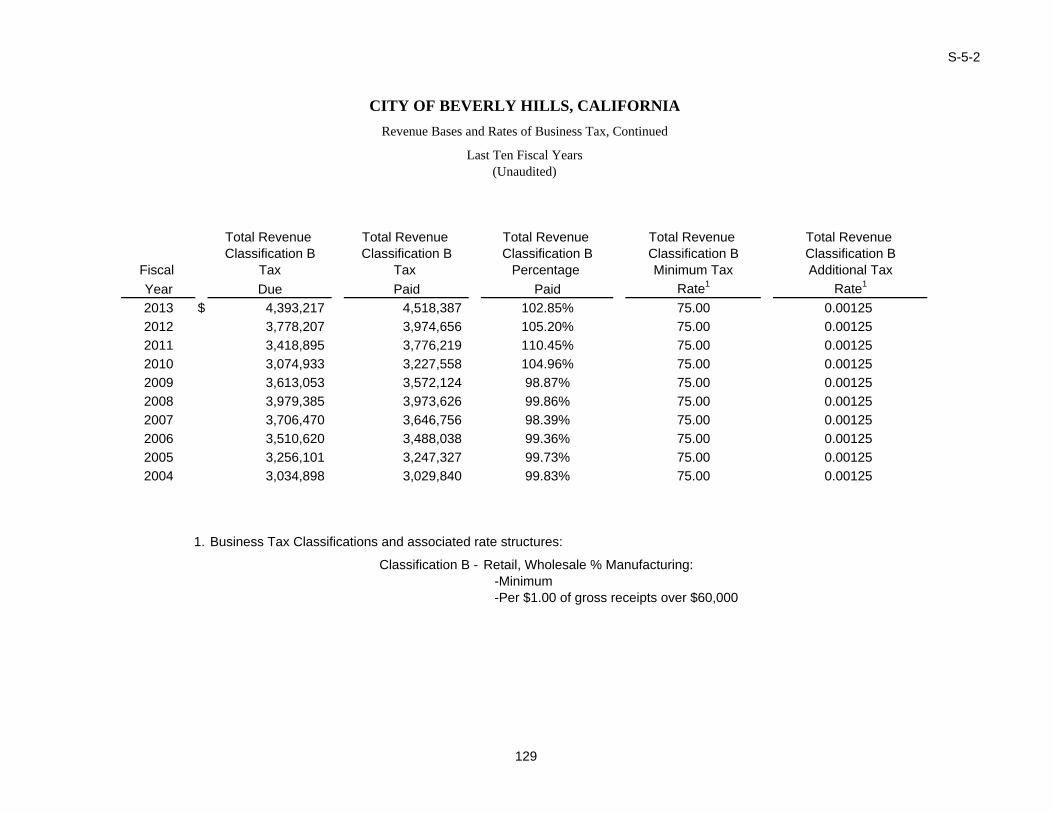
S-5-2
Total Revenue Total Revenue Total Revenue Total Revenue Total Revenue Classification B Classification B Classification B Classification B Classification B
Fiscal Tax Tax Percentage Minimum Tax Additional TaxYear Due Paid Paid Rate1 Rate1
2013 $ 4,393,217 4,518,387 102.85% 75.00 0.001252012 3,778,207 3,974,656 105.20% 75.00 0.001252011 3,418,895 3,776,219 110.45% 75.00 0.001252010 3,074,933 3,227,558 104.96% 75.00 0.001252009 3,613,053 3,572,124 98.87% 75.00 0.001252008 3,979,385 3,973,626 99.86% 75.00 0.001252007 3,706,470 3,646,756 98.39% 75.00 0.001252006 3,510,620 3,488,038 99.36% 75.00 0.001252005 3,256,101 3,247,327 99.73% 75.00 0.001252004 3,034,898 3,029,840 99.83% 75.00 0.00125
1. Business Tax Classifications and associated rate structures:
Classification B - Retail, Wholesale % Manufacturing:-Minimum-Per $1.00 of gross receipts over $60,000
CITY OF BEVERLY HILLS, CALIFORNIARevenue Bases and Rates of Business Tax, Continued
Last Ten Fiscal Years(Unaudited)
129
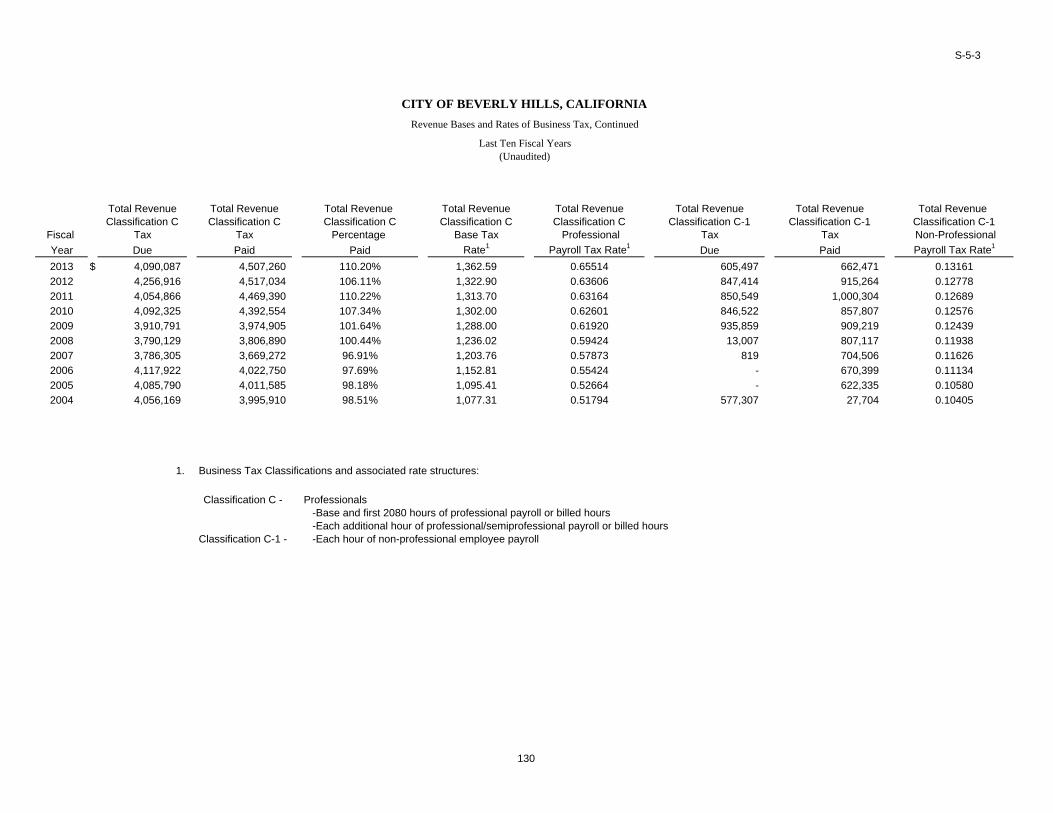
S-5-3
Total Revenue Total Revenue Total Revenue Total Revenue Total Revenue Total Revenue Total Revenue Total Revenue Classification C Classification C Classification C Classification C Classification C Classification C-1 Classification C-1 Classification C-1
Fiscal Tax Tax Percentage Base Tax Professional Tax Tax Non-ProfessionalYear Due Paid Paid Rate1 Payroll Tax Rate1 Due Paid Payroll Tax Rate1
2013 $ 4,090,087 4,507,260 110.20% 1,362.59 0.65514 605,497 662,471 0.131612012 4,256,916 4,517,034 106.11% 1,322.90 0.63606 847,414 915,264 0.127782011 4,054,866 4,469,390 110.22% 1,313.70 0.63164 850,549 1,000,304 0.126892010 4,092,325 4,392,554 107.34% 1,302.00 0.62601 846,522 857,807 0.125762009 3,910,791 3,974,905 101.64% 1,288.00 0.61920 935,859 909,219 0.124392008 3,790,129 3,806,890 100.44% 1,236.02 0.59424 13,007 807,117 0.119382007 3,786,305 3,669,272 96.91% 1,203.76 0.57873 819 704,506 0.116262006 4,117,922 4,022,750 97.69% 1,152.81 0.55424 - 670,399 0.111342005 4,085,790 4,011,585 98.18% 1,095.41 0.52664 - 622,335 0.105802004 4,056,169 3,995,910 98.51% 1,077.31 0.51794 577,307 27,704 0.10405
1. Business Tax Classifications and associated rate structures:
Classification C - Professionals-Base and first 2080 hours of professional payroll or billed hours-Each additional hour of professional/semiprofessional payroll or billed hours
Classification C-1 - -Each hour of non-professional employee payroll
CITY OF BEVERLY HILLS, CALIFORNIARevenue Bases and Rates of Business Tax, Continued
Last Ten Fiscal Years(Unaudited)
130
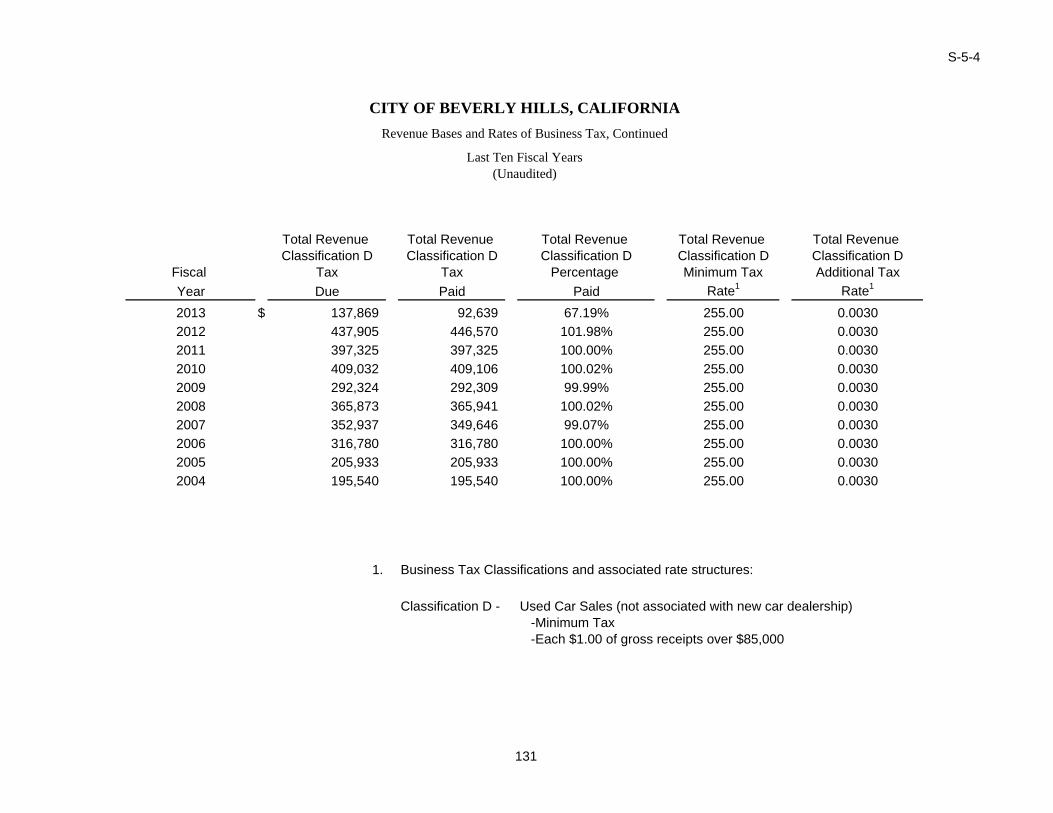
S-5-4
Total Revenue Total Revenue Total Revenue Total Revenue Total Revenue Classification D Classification D Classification D Classification D Classification D
Fiscal Tax Tax Percentage Minimum Tax Additional TaxYear Due Paid Paid Rate1 Rate1
2013 $ 137,869 92,639 67.19% 255.00 0.00302012 437,905 446,570 101.98% 255.00 0.00302011 397,325 397,325 100.00% 255.00 0.00302010 409,032 409,106 100.02% 255.00 0.00302009 292,324 292,309 99.99% 255.00 0.00302008 365,873 365,941 100.02% 255.00 0.00302007 352,937 349,646 99.07% 255.00 0.00302006 316,780 316,780 100.00% 255.00 0.00302005 205,933 205,933 100.00% 255.00 0.00302004 195,540 195,540 100.00% 255.00 0.0030
1. Business Tax Classifications and associated rate structures:
Classification D - Used Car Sales (not associated with new car dealership)-Minimum Tax-Each $1.00 of gross receipts over $85,000
CITY OF BEVERLY HILLS, CALIFORNIARevenue Bases and Rates of Business Tax, Continued
Last Ten Fiscal Years(Unaudited)
131
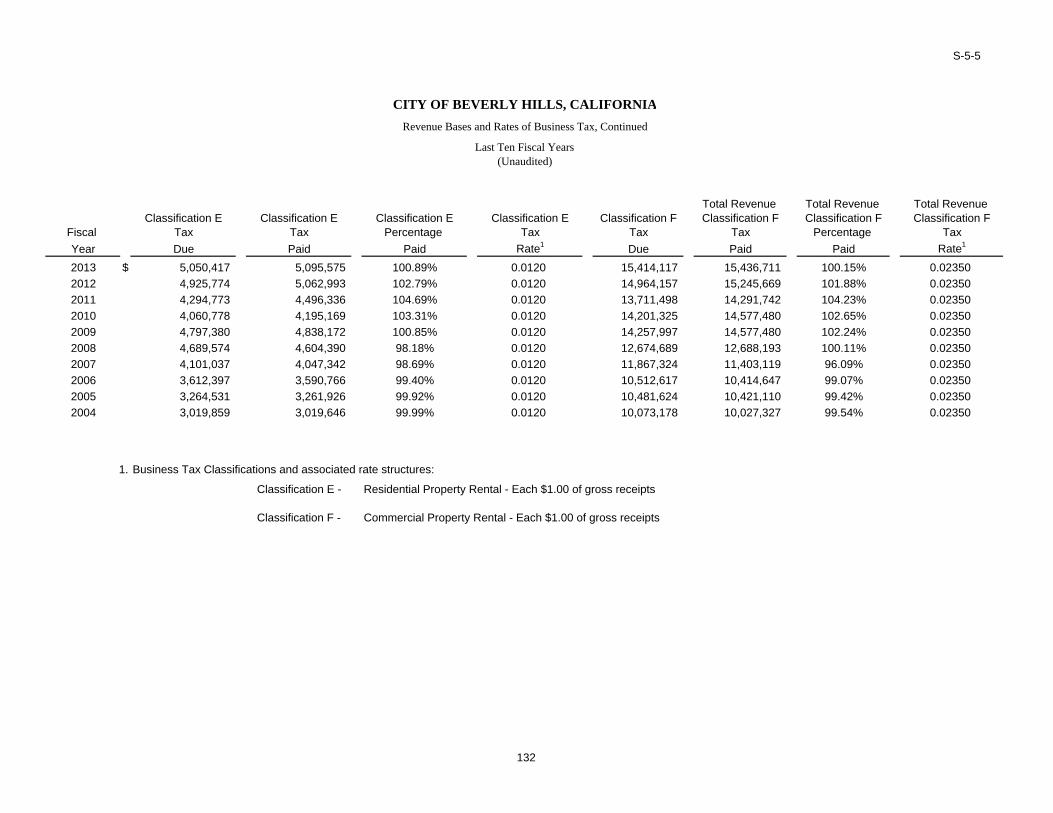
S-5-5
Total Revenue Total Revenue Total Revenue Classification E Classification E Classification E Classification E Classification F Classification F Classification F Classification F
Fiscal Tax Tax Percentage Tax Tax Tax Percentage TaxYear Due Paid Paid Rate1 Due Paid Paid Rate1
2013 $ 5,050,417 5,095,575 100.89% 0.0120 15,414,117 15,436,711 100.15% 0.023502012 4,925,774 5,062,993 102.79% 0.0120 14,964,157 15,245,669 101.88% 0.023502011 4,294,773 4,496,336 104.69% 0.0120 13,711,498 14,291,742 104.23% 0.023502010 4,060,778 4,195,169 103.31% 0.0120 14,201,325 14,577,480 102.65% 0.023502009 4,797,380 4,838,172 100.85% 0.0120 14,257,997 14,577,480 102.24% 0.023502008 4,689,574 4,604,390 98.18% 0.0120 12,674,689 12,688,193 100.11% 0.023502007 4,101,037 4,047,342 98.69% 0.0120 11,867,324 11,403,119 96.09% 0.023502006 3,612,397 3,590,766 99.40% 0.0120 10,512,617 10,414,647 99.07% 0.023502005 3,264,531 3,261,926 99.92% 0.0120 10,481,624 10,421,110 99.42% 0.023502004 3,019,859 3,019,646 99.99% 0.0120 10,073,178 10,027,327 99.54% 0.02350
1. Business Tax Classifications and associated rate structures:
Classification E - Residential Property Rental - Each $1.00 of gross receipts
Classification F - Commercial Property Rental - Each $1.00 of gross receipts
(Unaudited)Last Ten Fiscal Years
Revenue Bases and Rates of Business Tax, Continued
CITY OF BEVERLY HILLS, CALIFORNIA
132
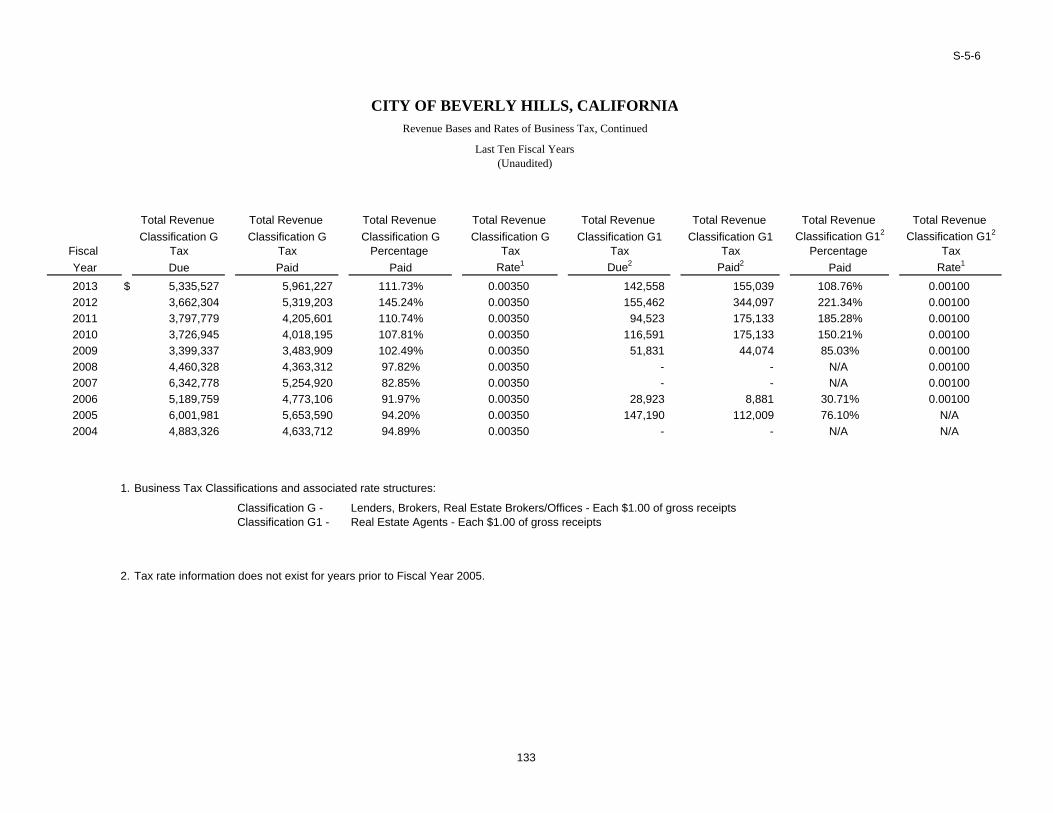
S-5-6
Total Revenue Total Revenue Total Revenue Total Revenue Total Revenue Total Revenue Total Revenue Total Revenue Classification G Classification G Classification G Classification G Classification G1 Classification G1 Classification G12 Classification G12
Fiscal Tax Tax Percentage Tax Tax Tax Percentage TaxYear Due Paid Paid Rate1 Due2 Paid2 Paid Rate1
2013 $ 5,335,527 5,961,227 111.73% 0.00350 142,558 155,039 108.76% 0.001002012 3,662,304 5,319,203 145.24% 0.00350 155,462 344,097 221.34% 0.001002011 3,797,779 4,205,601 110.74% 0.00350 94,523 175,133 185.28% 0.001002010 3,726,945 4,018,195 107.81% 0.00350 116,591 175,133 150.21% 0.001002009 3,399,337 3,483,909 102.49% 0.00350 51,831 44,074 85.03% 0.001002008 4,460,328 4,363,312 97.82% 0.00350 - - N/A 0.001002007 6,342,778 5,254,920 82.85% 0.00350 - - N/A 0.001002006 5,189,759 4,773,106 91.97% 0.00350 28,923 8,881 30.71% 0.001002005 6,001,981 5,653,590 94.20% 0.00350 147,190 112,009 76.10% N/A 2004 4,883,326 4,633,712 94.89% 0.00350 - - N/A N/A
1. Business Tax Classifications and associated rate structures:
Classification G - Lenders, Brokers, Real Estate Brokers/Offices - Each $1.00 of gross receiptsClassification G1 - Real Estate Agents - Each $1.00 of gross receipts
2. Tax rate information does not exist for years prior to Fiscal Year 2005.
CITY OF BEVERLY HILLS, CALIFORNIARevenue Bases and Rates of Business Tax, Continued
Last Ten Fiscal Years(Unaudited)
133
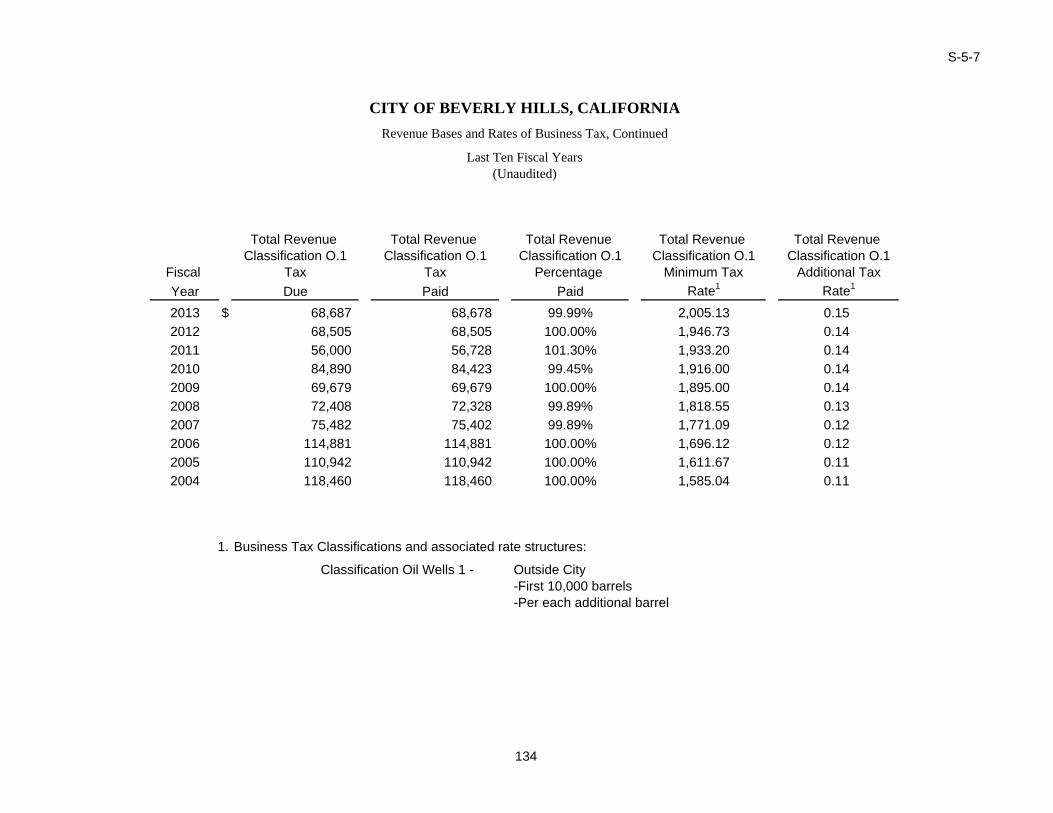
S-5-7
Total Revenue Total Revenue Total Revenue Total Revenue Total Revenue Classification O.1 Classification O.1 Classification O.1 Classification O.1 Classification O.1
Fiscal Tax Tax Percentage Minimum Tax Additional TaxYear Due Paid Paid Rate1 Rate1
2013 $ 68,687 68,678 99.99% 2,005.13 0.152012 68,505 68,505 100.00% 1,946.73 0.142011 56,000 56,728 101.30% 1,933.20 0.142010 84,890 84,423 99.45% 1,916.00 0.142009 69,679 69,679 100.00% 1,895.00 0.142008 72,408 72,328 99.89% 1,818.55 0.132007 75,482 75,402 99.89% 1,771.09 0.122006 114,881 114,881 100.00% 1,696.12 0.122005 110,942 110,942 100.00% 1,611.67 0.112004 118,460 118,460 100.00% 1,585.04 0.11
1. Business Tax Classifications and associated rate structures:
Classification Oil Wells 1 - Outside City-First 10,000 barrels-Per each additional barrel
Last Ten Fiscal Years(Unaudited)
CITY OF BEVERLY HILLS, CALIFORNIARevenue Bases and Rates of Business Tax, Continued
134
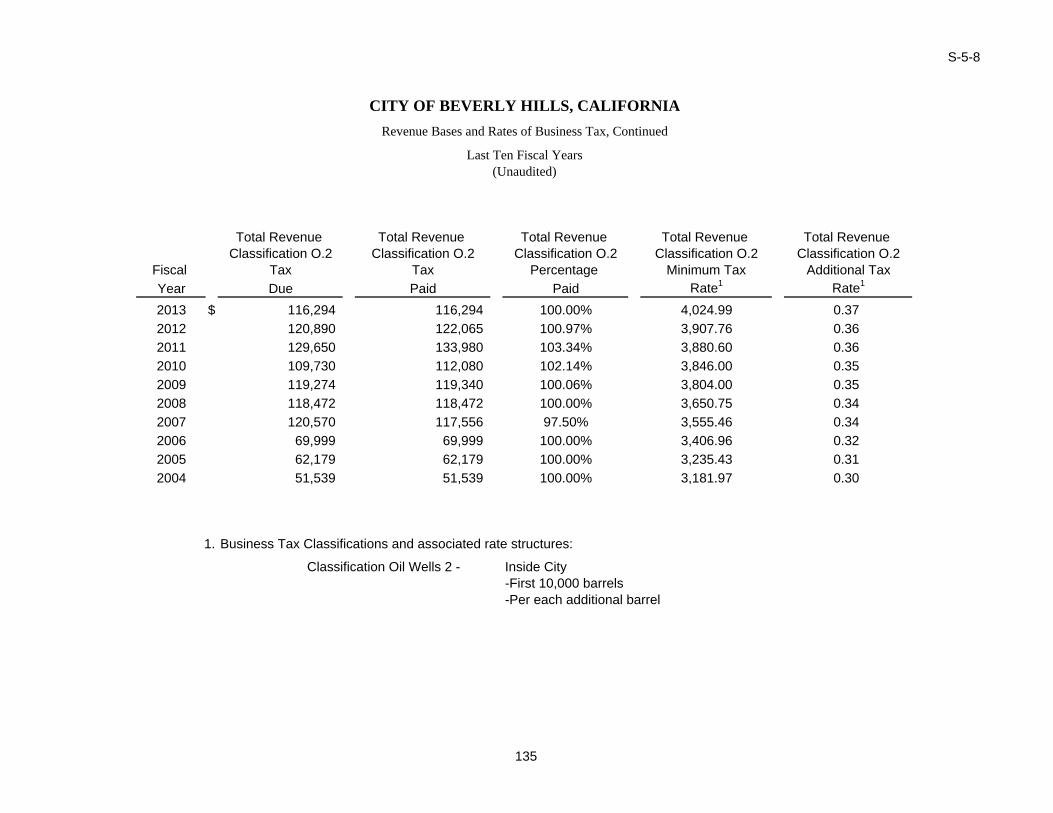
S-5-8
Total Revenue Total Revenue Total Revenue Total Revenue Total Revenue Classification O.2 Classification O.2 Classification O.2 Classification O.2 Classification O.2
Fiscal Tax Tax Percentage Minimum Tax Additional TaxYear Due Paid Paid Rate1 Rate1
2013 $ 116,294 116,294 100.00% 4,024.99 0.372012 120,890 122,065 100.97% 3,907.76 0.362011 129,650 133,980 103.34% 3,880.60 0.362010 109,730 112,080 102.14% 3,846.00 0.352009 119,274 119,340 100.06% 3,804.00 0.352008 118,472 118,472 100.00% 3,650.75 0.342007 120,570 117,556 97.50% 3,555.46 0.342006 69,999 69,999 100.00% 3,406.96 0.322005 62,179 62,179 100.00% 3,235.43 0.312004 51,539 51,539 100.00% 3,181.97 0.30
1. Business Tax Classifications and associated rate structures:
Classification Oil Wells 2 - Inside City-First 10,000 barrels-Per each additional barrel
CITY OF BEVERLY HILLS, CALIFORNIARevenue Bases and Rates of Business Tax, Continued
Last Ten Fiscal Years(Unaudited)
135
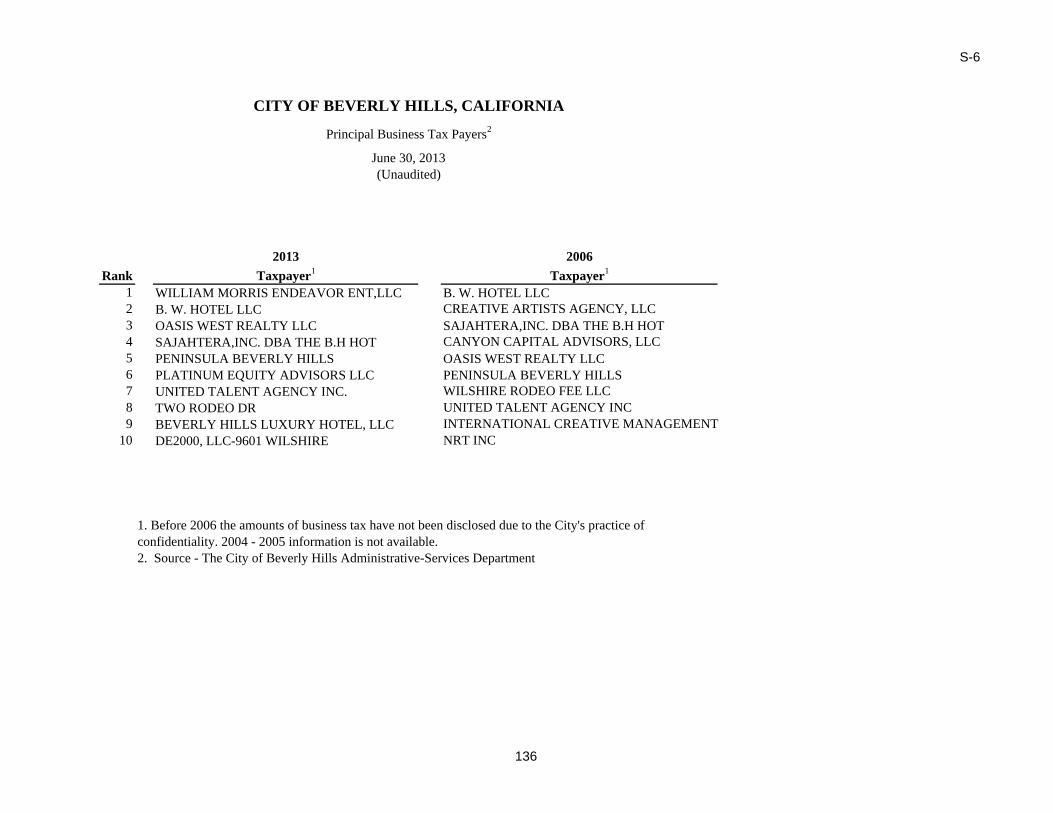
S-6
Rank1 WILLIAM MORRIS ENDEAVOR ENT,LLC B. W. HOTEL LLC2 B. W. HOTEL LLC CREATIVE ARTISTS AGENCY, LLC3 OASIS WEST REALTY LLC SAJAHTERA,INC. DBA THE B.H HOT4 SAJAHTERA,INC. DBA THE B.H HOT CANYON CAPITAL ADVISORS, LLC5 PENINSULA BEVERLY HILLS OASIS WEST REALTY LLC6 PLATINUM EQUITY ADVISORS LLC PENINSULA BEVERLY HILLS7 UNITED TALENT AGENCY INC. WILSHIRE RODEO FEE LLC8 TWO RODEO DR UNITED TALENT AGENCY INC9 BEVERLY HILLS LUXURY HOTEL, LLC INTERNATIONAL CREATIVE MANAGEMENT
10 DE2000, LLC-9601 WILSHIRE NRT INC
1. Before 2006 the amounts of business tax have not been disclosed due to the City's practice of confidentiality. 2004 - 2005 information is not available.2. Source - The City of Beverly Hills Administrative-Services Department
CITY OF BEVERLY HILLS, CALIFORNIA
Principal Business Tax Payers2
June 30, 2013(Unaudited)
Taxpayer12013 2006
Taxpayer1
136
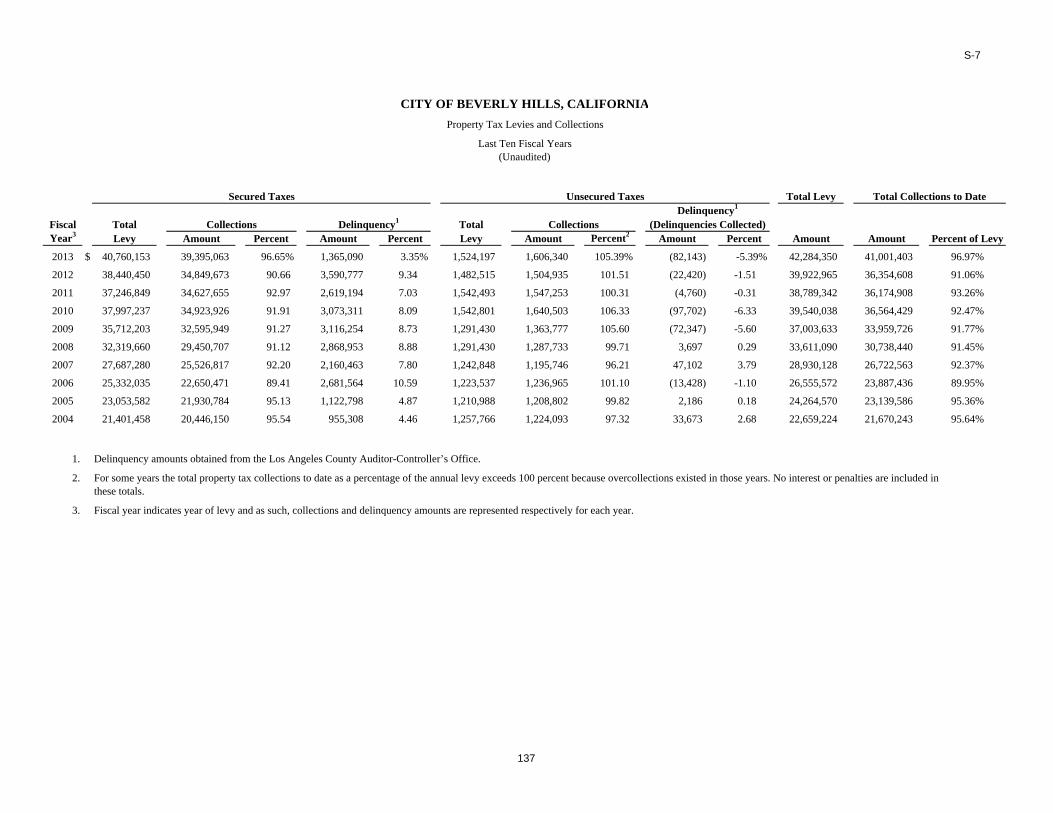
S-7
Total Levy
Fiscal Total TotalYear3 Levy Amount Percent Amount Percent Levy Amount Percent2 Amount Percent Amount Amount Percent of Levy
2013 $ 40,760,153 39,395,063 96.65% 1,365,090 3.35% 1,524,197 1,606,340 105.39% (82,143) -5.39% 42,284,350 41,001,403 96.97%
2012 38,440,450 34,849,673 90.66 3,590,777 9.34 1,482,515 1,504,935 101.51 (22,420) -1.51 39,922,965 36,354,608 91.06%
2011 37,246,849 34,627,655 92.97 2,619,194 7.03 1,542,493 1,547,253 100.31 (4,760) -0.31 38,789,342 36,174,908 93.26%
2010 37,997,237 34,923,926 91.91 3,073,311 8.09 1,542,801 1,640,503 106.33 (97,702) -6.33 39,540,038 36,564,429 92.47%
2009 35,712,203 32,595,949 91.27 3,116,254 8.73 1,291,430 1,363,777 105.60 (72,347) -5.60 37,003,633 33,959,726 91.77%
2008 32,319,660 29,450,707 91.12 2,868,953 8.88 1,291,430 1,287,733 99.71 3,697 0.29 33,611,090 30,738,440 91.45%
2007 27,687,280 25,526,817 92.20 2,160,463 7.80 1,242,848 1,195,746 96.21 47,102 3.79 28,930,128 26,722,563 92.37%
2006 25,332,035 22,650,471 89.41 2,681,564 10.59 1,223,537 1,236,965 101.10 (13,428) -1.10 26,555,572 23,887,436 89.95%
2005 23,053,582 21,930,784 95.13 1,122,798 4.87 1,210,988 1,208,802 99.82 2,186 0.18 24,264,570 23,139,586 95.36%
2004 21,401,458 20,446,150 95.54 955,308 4.46 1,257,766 1,224,093 97.32 33,673 2.68 22,659,224 21,670,243 95.64%
1. Delinquency amounts obtained from the Los Angeles County Auditor-Controller’s Office.
2. For some years the total property tax collections to date as a percentage of the annual levy exceeds 100 percent because overcollections existed in those years. No interest or penalties are included in these totals.
3. Fiscal year indicates year of levy and as such, collections and delinquency amounts are represented respectively for each year.
CITY OF BEVERLY HILLS, CALIFORNIAProperty Tax Levies and Collections
Last Ten Fiscal Years(Unaudited)
Total Collections to DateSecured Taxes Unsecured TaxesDelinquency1
Collections Delinquency1 Collections (Delinquencies Collected)
137
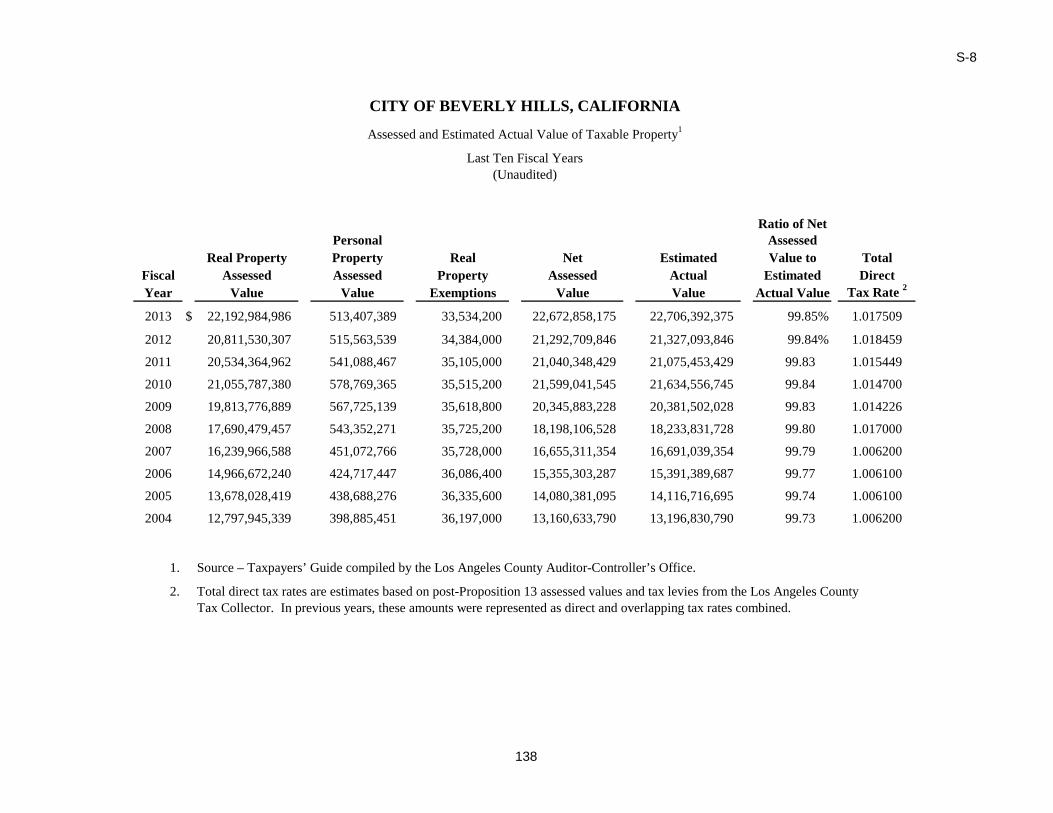
S-8
Ratio of NetPersonal Assessed
Real Property Property Real Net Estimated Value to TotalFiscal Assessed Assessed Property Assessed Actual Estimated DirectYear Value Value Exemptions Value Value Actual Value Tax Rate 2
2013 $ 22,192,984,986 513,407,389 33,534,200 22,672,858,175 22,706,392,375 99.85% 1.017509
2012 20,811,530,307 515,563,539 34,384,000 21,292,709,846 21,327,093,846 99.84% 1.018459
2011 20,534,364,962 541,088,467 35,105,000 21,040,348,429 21,075,453,429 99.83 1.015449
2010 21,055,787,380 578,769,365 35,515,200 21,599,041,545 21,634,556,745 99.84 1.014700
2009 19,813,776,889 567,725,139 35,618,800 20,345,883,228 20,381,502,028 99.83 1.014226
2008 17,690,479,457 543,352,271 35,725,200 18,198,106,528 18,233,831,728 99.80 1.017000
2007 16,239,966,588 451,072,766 35,728,000 16,655,311,354 16,691,039,354 99.79 1.006200
2006 14,966,672,240 424,717,447 36,086,400 15,355,303,287 15,391,389,687 99.77 1.006100
2005 13,678,028,419 438,688,276 36,335,600 14,080,381,095 14,116,716,695 99.74 1.006100
2004 12,797,945,339 398,885,451 36,197,000 13,160,633,790 13,196,830,790 99.73 1.006200
1. Source – Taxpayers’ Guide compiled by the Los Angeles County Auditor-Controller’s Office.
2. Total direct tax rates are estimates based on post-Proposition 13 assessed values and tax levies from the Los Angeles CountyTax Collector. In previous years, these amounts were represented as direct and overlapping tax rates combined.
CITY OF BEVERLY HILLS, CALIFORNIA
Assessed and Estimated Actual Value of Taxable Property1
Last Ten Fiscal Years(Unaudited)
138
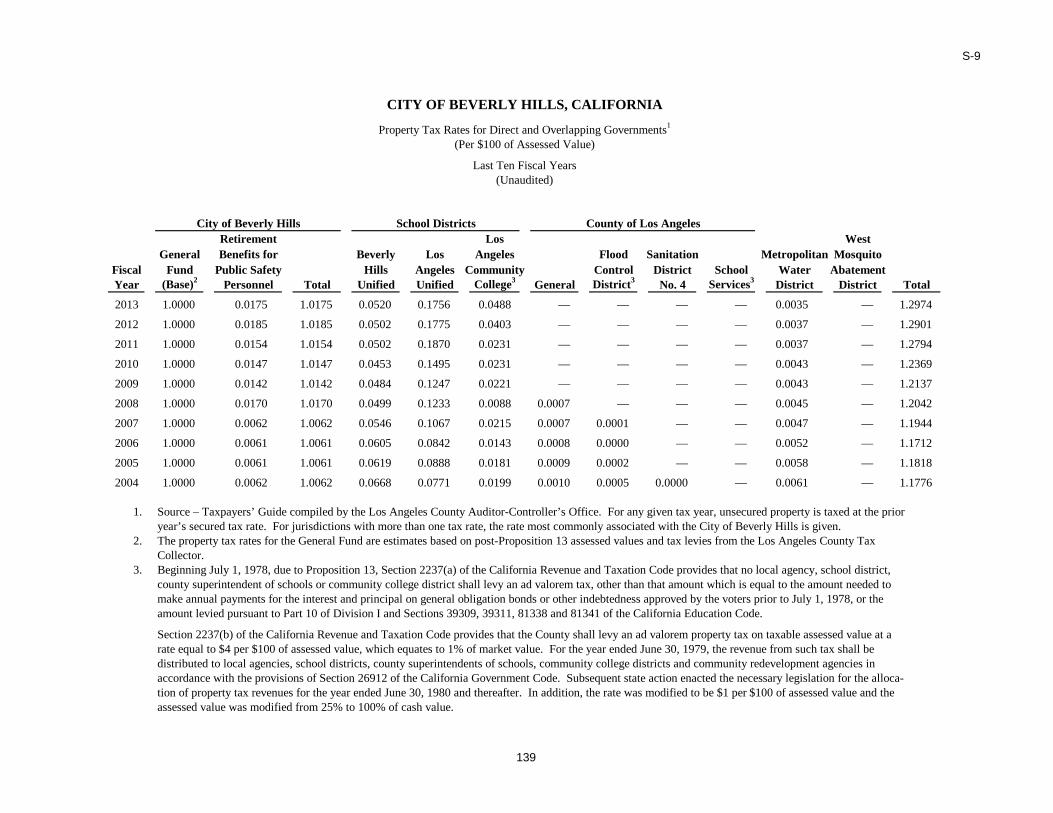
S-9
Retirement Los WestGeneral Benefits for Beverly Los Angeles Flood Sanitation Metropolitan Mosquito
Fiscal Fund Public Safety Hills Angeles Community Control District School Water AbatementYear (Base)2 Personnel Total Unified Unified College3 General District3 No. 4 Services3 District District Total
2013 1.0000 0.0175 1.0175 0.0520 0.1756 0.0488 — — — — 0.0035 — 1.2974
2012 1.0000 0.0185 1.0185 0.0502 0.1775 0.0403 — — — — 0.0037 — 1.2901
2011 1.0000 0.0154 1.0154 0.0502 0.1870 0.0231 — — — — 0.0037 — 1.2794
2010 1.0000 0.0147 1.0147 0.0453 0.1495 0.0231 — — — — 0.0043 — 1.2369
2009 1.0000 0.0142 1.0142 0.0484 0.1247 0.0221 — — — — 0.0043 — 1.2137
2008 1.0000 0.0170 1.0170 0.0499 0.1233 0.0088 0.0007 — — — 0.0045 — 1.2042
2007 1.0000 0.0062 1.0062 0.0546 0.1067 0.0215 0.0007 0.0001 — — 0.0047 — 1.1944
2006 1.0000 0.0061 1.0061 0.0605 0.0842 0.0143 0.0008 0.0000 — — 0.0052 — 1.1712
2005 1.0000 0.0061 1.0061 0.0619 0.0888 0.0181 0.0009 0.0002 — — 0.0058 — 1.1818
2004 1.0000 0.0062 1.0062 0.0668 0.0771 0.0199 0.0010 0.0005 0.0000 — 0.0061 — 1.1776
1. Source – Taxpayers’ Guide compiled by the Los Angeles County Auditor-Controller’s Office. For any given tax year, unsecured property is taxed at the prior year’s secured tax rate. For jurisdictions with more than one tax rate, the rate most commonly associated with the City of Beverly Hills is given.
2. The property tax rates for the General Fund are estimates based on post-Proposition 13 assessed values and tax levies from the Los Angeles County TaxCollector.
3. Beginning July 1, 1978, due to Proposition 13, Section 2237(a) of the California Revenue and Taxation Code provides that no local agency, school district,county superintendent of schools or community college district shall levy an ad valorem tax, other than that amount which is equal to the amount needed tomake annual payments for the interest and principal on general obligation bonds or other indebtedness approved by the voters prior to July 1, 1978, or the amount levied pursuant to Part 10 of Division I and Sections 39309, 39311, 81338 and 81341 of the California Education Code.
Section 2237(b) of the California Revenue and Taxation Code provides that the County shall levy an ad valorem property tax on taxable assessed value at arate equal to $4 per $100 of assessed value, which equates to 1% of market value. For the year ended June 30, 1979, the revenue from such tax shall bedistributed to local agencies, school districts, county superintendents of schools, community college districts and community redevelopment agencies inaccordance with the provisions of Section 26912 of the California Government Code. Subsequent state action enacted the necessary legislation for the alloca-tion of property tax revenues for the year ended June 30, 1980 and thereafter. In addition, the rate was modified to be $1 per $100 of assessed value and the assessed value was modified from 25% to 100% of cash value.
(Unaudited)
City of Beverly Hills School Districts County of Los Angeles
CITY OF BEVERLY HILLS, CALIFORNIA
Property Tax Rates for Direct and Overlapping Governments1
(Per $100 of Assessed Value)
Last Ten Fiscal Years
139
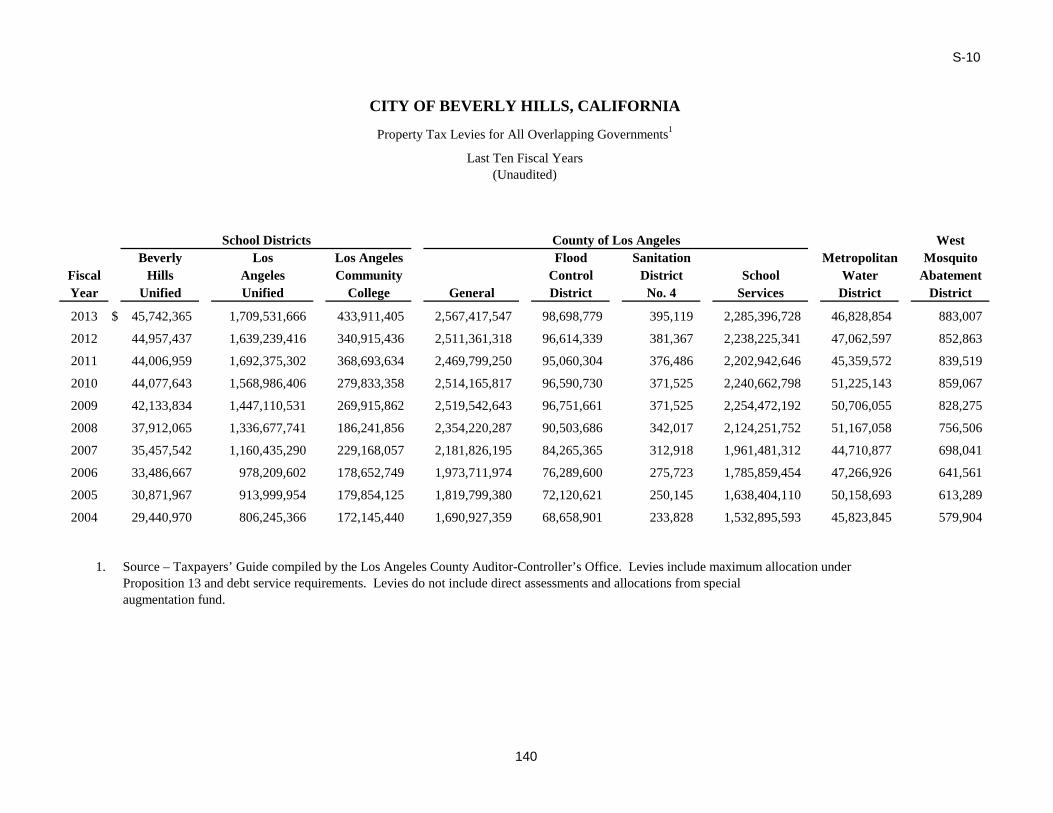
S-10
WestBeverly Los Los Angeles Flood Sanitation Metropolitan Mosquito
Fiscal Hills Angeles Community Control District School Water AbatementYear Unified Unified College General District No. 4 Services District District
2013 $ 45,742,365 1,709,531,666 433,911,405 2,567,417,547 98,698,779 395,119 2,285,396,728 46,828,854 883,007
2012 44,957,437 1,639,239,416 340,915,436 2,511,361,318 96,614,339 381,367 2,238,225,341 47,062,597 852,863
2011 44,006,959 1,692,375,302 368,693,634 2,469,799,250 95,060,304 376,486 2,202,942,646 45,359,572 839,519
2010 44,077,643 1,568,986,406 279,833,358 2,514,165,817 96,590,730 371,525 2,240,662,798 51,225,143 859,067
2009 42,133,834 1,447,110,531 269,915,862 2,519,542,643 96,751,661 371,525 2,254,472,192 50,706,055 828,275
2008 37,912,065 1,336,677,741 186,241,856 2,354,220,287 90,503,686 342,017 2,124,251,752 51,167,058 756,506
2007 35,457,542 1,160,435,290 229,168,057 2,181,826,195 84,265,365 312,918 1,961,481,312 44,710,877 698,041
2006 33,486,667 978,209,602 178,652,749 1,973,711,974 76,289,600 275,723 1,785,859,454 47,266,926 641,561
2005 30,871,967 913,999,954 179,854,125 1,819,799,380 72,120,621 250,145 1,638,404,110 50,158,693 613,289
2004 29,440,970 806,245,366 172,145,440 1,690,927,359 68,658,901 233,828 1,532,895,593 45,823,845 579,904
1. Source – Taxpayers’ Guide compiled by the Los Angeles County Auditor-Controller’s Office. Levies include maximum allocation under Proposition 13 and debt service requirements. Levies do not include direct assessments and allocations from special augmentation fund.
School Districts County of Los Angeles
CITY OF BEVERLY HILLS, CALIFORNIA
Property Tax Levies for All Overlapping Governments1
Last Ten Fiscal Years(Unaudited)
140
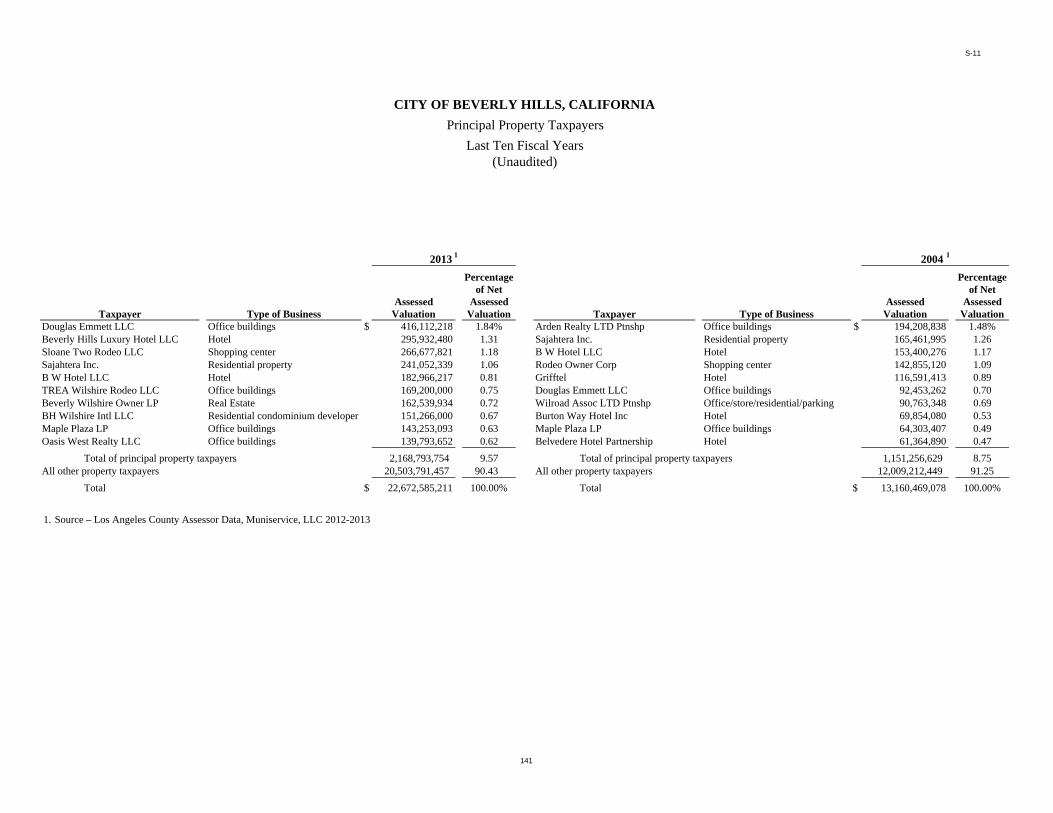
S-11
Percentage Percentageof Net of Net
Assessed Assessed Assessed AssessedType of Business Valuation Valuation Type of Business Valuation Valuation
Douglas Emmett LLC Office buildings $ 416,112,218 1.84% Arden Realty LTD Ptnshp Office buildings $ 194,208,838 1.48%Beverly Hills Luxury Hotel LLC Hotel 295,932,480 1.31 Sajahtera Inc. Residential property 165,461,995 1.26Sloane Two Rodeo LLC Shopping center 266,677,821 1.18 B W Hotel LLC Hotel 153,400,276 1.17Sajahtera Inc. Residential property 241,052,339 1.06 Rodeo Owner Corp Shopping center 142,855,120 1.09B W Hotel LLC Hotel 182,966,217 0.81 Grifftel Hotel 116,591,413 0.89TREA Wilshire Rodeo LLC Office buildings 169,200,000 0.75 Douglas Emmett LLC Office buildings 92,453,262 0.70Beverly Wilshire Owner LP Real Estate 162,539,934 0.72 Wilroad Assoc LTD Ptnshp Office/store/residential/parking 90,763,348 0.69BH Wilshire Intl LLC Residential condominium developer 151,266,000 0.67 Burton Way Hotel Inc Hotel 69,854,080 0.53Maple Plaza LP Office buildings 143,253,093 0.63 Maple Plaza LP Office buildings 64,303,407 0.49Oasis West Realty LLC Office buildings 139,793,652 0.62 Belvedere Hotel Partnership Hotel 61,364,890 0.47
Total of principal property taxpayers 2,168,793,754 9.57 Total of principal property taxpayers 1,151,256,629 8.75All other property taxpayers 20,503,791,457 90.43 All other property taxpayers 12,009,212,449 91.25
Total $ 22,672,585,211 100.00% Total $ 13,160,469,078 100.00%
1. Source – Los Angeles County Assessor Data, Muniservice, LLC 2012-2013
TaxpayerTaxpayer
Principal Property TaxpayersCITY OF BEVERLY HILLS, CALIFORNIA
Last Ten Fiscal Years(Unaudited)
2013 1 2004 1
141
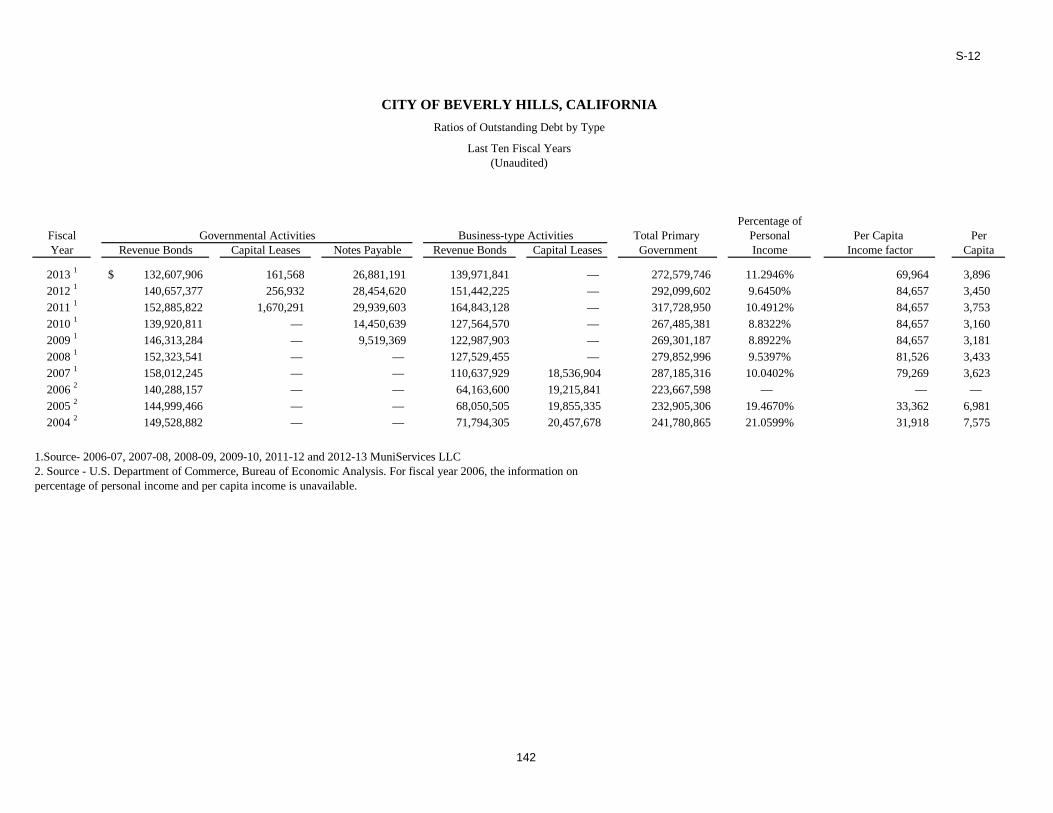
S-12
Percentage ofFiscal Total Primary Personal Per Capita PerYear Revenue Bonds Capital Leases Notes Payable Revenue Bonds Capital Leases Government Income Income factor Capita
2013 1 132,607,906$ 161,568 26,881,191 139,971,841 — 272,579,746 11.2946% 69,964 3,8962012 1 140,657,377 256,932 28,454,620 151,442,225 — 292,099,602 9.6450% 84,657 3,4502011 1 152,885,822 1,670,291 29,939,603 164,843,128 — 317,728,950 10.4912% 84,657 3,7532010 1 139,920,811 — 14,450,639 127,564,570 — 267,485,381 8.8322% 84,657 3,1602009 1 146,313,284 — 9,519,369 122,987,903 — 269,301,187 8.8922% 84,657 3,1812008 1 152,323,541 — — 127,529,455 — 279,852,996 9.5397% 81,526 3,4332007 1 158,012,245 — — 110,637,929 18,536,904 287,185,316 10.0402% 79,269 3,6232006 2 140,288,157 — — 64,163,600 19,215,841 223,667,598 — — — 2005 2 144,999,466 — — 68,050,505 19,855,335 232,905,306 19.4670% 33,362 6,9812004 2 149,528,882 — — 71,794,305 20,457,678 241,780,865 21.0599% 31,918 7,575
1.Source- 2006-07, 2007-08, 2008-09, 2009-10, 2011-12 and 2012-13 MuniServices LLC2. Source - U.S. Department of Commerce, Bureau of Economic Analysis. For fiscal year 2006, the information onpercentage of personal income and per capita income is unavailable.
CITY OF BEVERLY HILLS, CALIFORNIARatios of Outstanding Debt by Type
Last Ten Fiscal Years(Unaudited)
Business-type ActivitiesGovernmental Activities
142
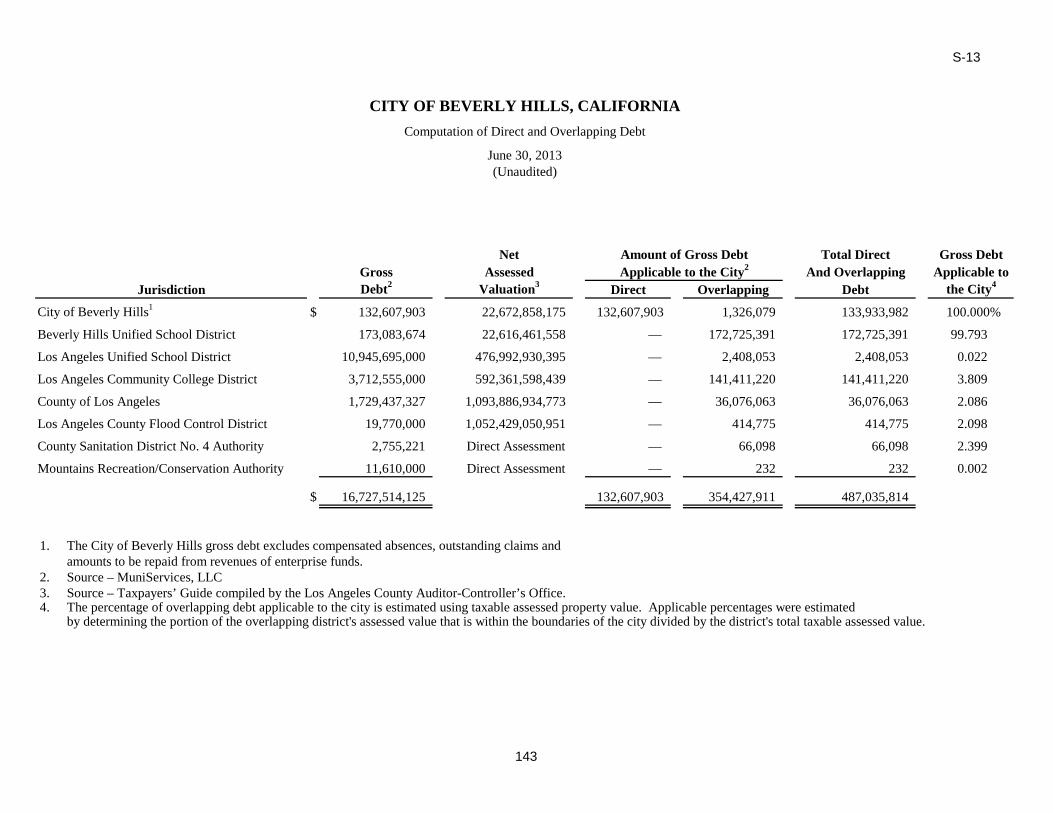
S-13
Net Total Direct Gross DebtGross Assessed And Overlapping Applicable toDebt2 Valuation3 Direct Overlapping Debt the City4
City of Beverly Hills1 $ 132,607,903 22,672,858,175 132,607,903 1,326,079 133,933,982 100.000%
Beverly Hills Unified School District 173,083,674 22,616,461,558 — 172,725,391 172,725,391 99.793
Los Angeles Unified School District 10,945,695,000 476,992,930,395 — 2,408,053 2,408,053 0.022
Los Angeles Community College District 3,712,555,000 592,361,598,439 — 141,411,220 141,411,220 3.809
County of Los Angeles 1,729,437,327 1,093,886,934,773 — 36,076,063 36,076,063 2.086
Los Angeles County Flood Control District 19,770,000 1,052,429,050,951 — 414,775 414,775 2.098
County Sanitation District No. 4 Authority 2,755,221 Direct Assessment — 66,098 66,098 2.399
Mountains Recreation/Conservation Authority 11,610,000 Direct Assessment — 232 232 0.002
$ 16,727,514,125 132,607,903 354,427,911 487,035,814
1. The City of Beverly Hills gross debt excludes compensated absences, outstanding claims and amounts to be repaid from revenues of enterprise funds.
2. Source – MuniServices, LLC3. Source – Taxpayers’ Guide compiled by the Los Angeles County Auditor-Controller’s Office.4. The percentage of overlapping debt applicable to the city is estimated using taxable assessed property value. Applicable percentages were estimated
by determining the portion of the overlapping district's assessed value that is within the boundaries of the city divided by the district's total taxable assessed value.
Amount of Gross DebtApplicable to the City2
Jurisdiction
CITY OF BEVERLY HILLS, CALIFORNIAComputation of Direct and Overlapping Debt
June 30, 2013(Unaudited)
143
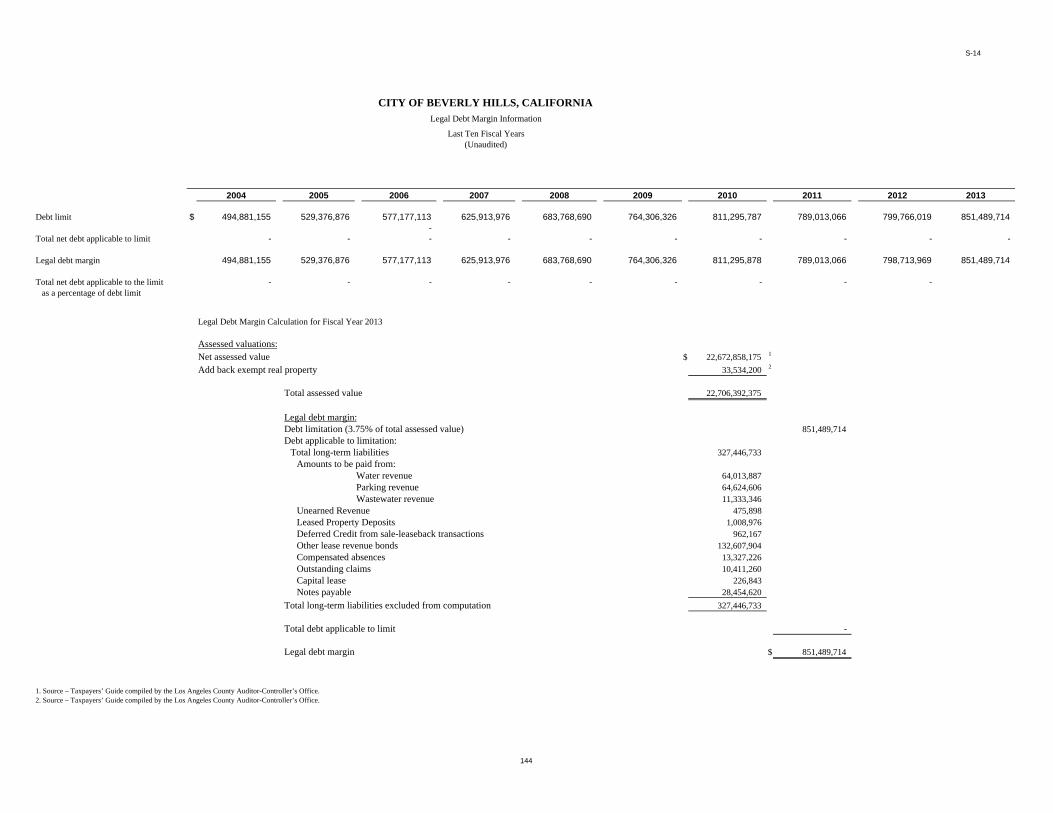
S-14
2004 2005 2006 2007 2008 2009 2010 2011 2012 2013
Debt limit $ 494,881,155 529,376,876 577,177,113 625,913,976 683,768,690 764,306,326 811,295,787 789,013,066 799,766,019 851,489,714 -
Total net debt applicable to limit - - - - - - - - - -
Legal debt margin 494,881,155 529,376,876 577,177,113 625,913,976 683,768,690 764,306,326 811,295,878 789,013,066 798,713,969 851,489,714
Total net debt applicable to the limit - - - - - - - - - as a percentage of debt limit
Legal Debt Margin Calculation for Fiscal Year 2013
Assessed valuations:Net assessed value $ 22,672,858,175 1
Add back exempt real property 33,534,200 2
Total assessed value 22,706,392,375
Legal debt margin:Debt limitation (3.75% of total assessed value) 851,489,714Debt applicable to limitation:
Total long-term liabilities 327,446,733Amounts to be paid from:
Water revenue 64,013,887Parking revenue 64,624,606Wastewater revenue 11,333,346
Unearned Revenue 475,898Leased Property Deposits 1,008,976Deferred Credit from sale-leaseback transactions 962,167Other lease revenue bonds 132,607,904Compensated absences 13,327,226Outstanding claims 10,411,260Capital lease 226,843Notes payable 28,454,620
Total long-term liabilities excluded from computation 327,446,733
Total debt applicable to limit -
Legal debt margin $ 851,489,714
1. Source – Taxpayers’ Guide compiled by the Los Angeles County Auditor-Controller’s Office.2. Source – Taxpayers’ Guide compiled by the Los Angeles County Auditor-Controller’s Office.
CITY OF BEVERLY HILLS, CALIFORNIALegal Debt Margin Information
Last Ten Fiscal Years(Unaudited)
144
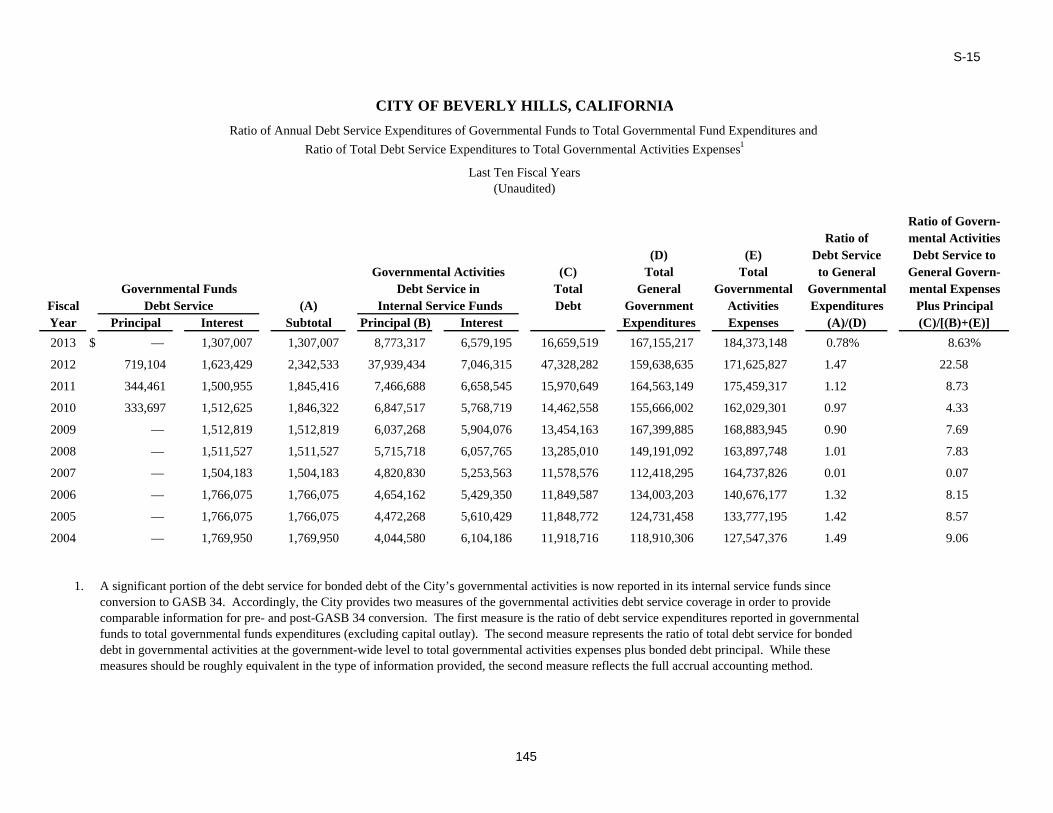
S-15
Ratio of Govern-Ratio of mental Activities
(D) (E) Debt Service Debt Service to(C) Total Total to General General Govern-
Total General Governmental Governmental mental ExpensesFiscal (A) Debt Government Activities Expenditures Plus PrincipalYear Principal Interest Subtotal Principal (B) Interest Expenditures Expenses (A)/(D) (C)/[(B)+(E)]2013 $ — 1,307,007 1,307,007 8,773,317 6,579,195 16,659,519 167,155,217 184,373,148 0.78% 8.63%
2012 719,104 1,623,429 2,342,533 37,939,434 7,046,315 47,328,282 159,638,635 171,625,827 1.47 22.58
2011 344,461 1,500,955 1,845,416 7,466,688 6,658,545 15,970,649 164,563,149 175,459,317 1.12 8.73
2010 333,697 1,512,625 1,846,322 6,847,517 5,768,719 14,462,558 155,666,002 162,029,301 0.97 4.33
2009 — 1,512,819 1,512,819 6,037,268 5,904,076 13,454,163 167,399,885 168,883,945 0.90 7.69
2008 — 1,511,527 1,511,527 5,715,718 6,057,765 13,285,010 149,191,092 163,897,748 1.01 7.83
2007 — 1,504,183 1,504,183 4,820,830 5,253,563 11,578,576 112,418,295 164,737,826 0.01 0.07
2006 — 1,766,075 1,766,075 4,654,162 5,429,350 11,849,587 134,003,203 140,676,177 1.32 8.15
2005 — 1,766,075 1,766,075 4,472,268 5,610,429 11,848,772 124,731,458 133,777,195 1.42 8.57
2004 — 1,769,950 1,769,950 4,044,580 6,104,186 11,918,716 118,910,306 127,547,376 1.49 9.06
1. A significant portion of the debt service for bonded debt of the City’s governmental activities is now reported in its internal service funds sinceconversion to GASB 34. Accordingly, the City provides two measures of the governmental activities debt service coverage in order to providecomparable information for pre- and post-GASB 34 conversion. The first measure is the ratio of debt service expenditures reported in governmentalfunds to total governmental funds expenditures (excluding capital outlay). The second measure represents the ratio of total debt service for bondeddebt in governmental activities at the government-wide level to total governmental activities expenses plus bonded debt principal. While thesemeasures should be roughly equivalent in the type of information provided, the second measure reflects the full accrual accounting method.
CITY OF BEVERLY HILLS, CALIFORNIARatio of Annual Debt Service Expenditures of Governmental Funds to Total Governmental Fund Expenditures and
Ratio of Total Debt Service Expenditures to Total Governmental Activities Expenses1
Last Ten Fiscal Years
Debt Service Internal Service Funds
(Unaudited)
Governmental ActivitiesGovernmental Funds Debt Service in
145

S-16
Total Fiscal PrimaryYear Principal Interest Principal Interest Government Per Capita1
2013 $ 1,187,051 2,518,295 - - 3,705,346 1072012 9,252,375 5,678,418 10,132,625 6,775,654 31,839,072 9282011 7,811,149 6,901,445 6,438,851 7,412,750 28,564,195 8352010 7,181,213 6,788,760 4,688,787 5,603,809 24,262,569 6752009 6,037,268 7,295,907 4,692,732 5,657,844 23,683,751 6622008 2 5,715,718 7,524,535 2,999,282 4,333,646 20,573,181 5722007 4,820,830 5,740,760 4,284,170 3,725,437 18,571,197 5152006 6,420,238 7,091,662 2,780,837 1,882,432 18,175,169 5082005 4,472,269 5,384,700 3,007,102 1,818,017 14,682,088 4112004 4,044,580 7,499,719 2,425,420 1,957,097 15,926,816 447
1.The totals for Fiscal Years 2004 - 2005 have been updated based on the restated population data from Muniservices, LLC available as of October 25, 2011.2. The per capita information for 2008 is provided by the California Department of Finance Projections.
Governmental Activities Business-Type Activities
CITY OF BEVERLY HILLS, CALIFORNIA
Ratios of Debt Service Per Capita
Last Ten Fiscal Years(Unaudited)
146
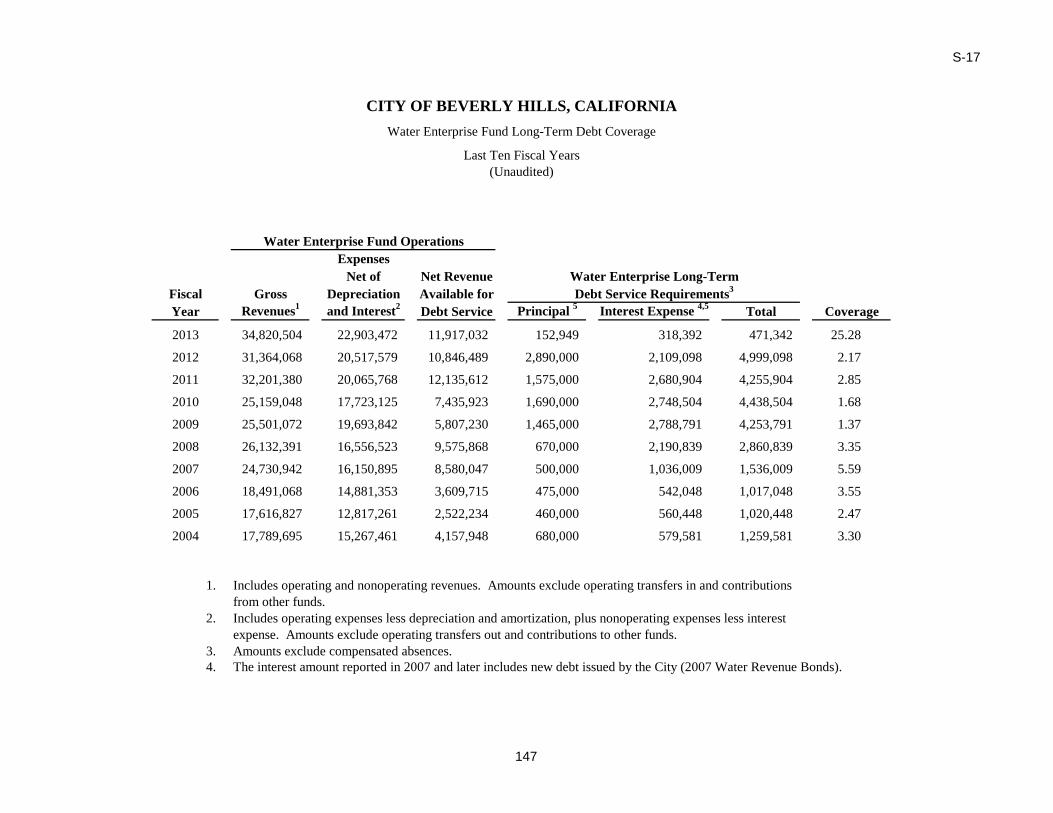
S-17
ExpensesNet of Net Revenue
Fiscal Gross Depreciation Available forYear Revenues1 and Interest2 Debt Service Principal 5 Interest Expense 4,5 Total Coverage
2013 34,820,504 22,903,472 11,917,032 152,949 318,392 471,342 25.28
2012 31,364,068 20,517,579 10,846,489 2,890,000 2,109,098 4,999,098 2.17
2011 32,201,380 20,065,768 12,135,612 1,575,000 2,680,904 4,255,904 2.85
2010 25,159,048 17,723,125 7,435,923 1,690,000 2,748,504 4,438,504 1.68
2009 25,501,072 19,693,842 5,807,230 1,465,000 2,788,791 4,253,791 1.37
2008 26,132,391 16,556,523 9,575,868 670,000 2,190,839 2,860,839 3.35
2007 24,730,942 16,150,895 8,580,047 500,000 1,036,009 1,536,009 5.59
2006 18,491,068 14,881,353 3,609,715 475,000 542,048 1,017,048 3.55
2005 17,616,827 12,817,261 2,522,234 460,000 560,448 1,020,448 2.47
2004 17,789,695 15,267,461 4,157,948 680,000 579,581 1,259,581 3.30
1. Includes operating and nonoperating revenues. Amounts exclude operating transfers in and contributions from other funds.
2. Includes operating expenses less depreciation and amortization, plus nonoperating expenses less interestexpense. Amounts exclude operating transfers out and contributions to other funds.
3. Amounts exclude compensated absences.4. The interest amount reported in 2007 and later includes new debt issued by the City (2007 Water Revenue Bonds).
Water Enterprise Fund Operations
Water Enterprise Long-TermDebt Service Requirements3
CITY OF BEVERLY HILLS, CALIFORNIAWater Enterprise Fund Long-Term Debt Coverage
Last Ten Fiscal Years(Unaudited)
147
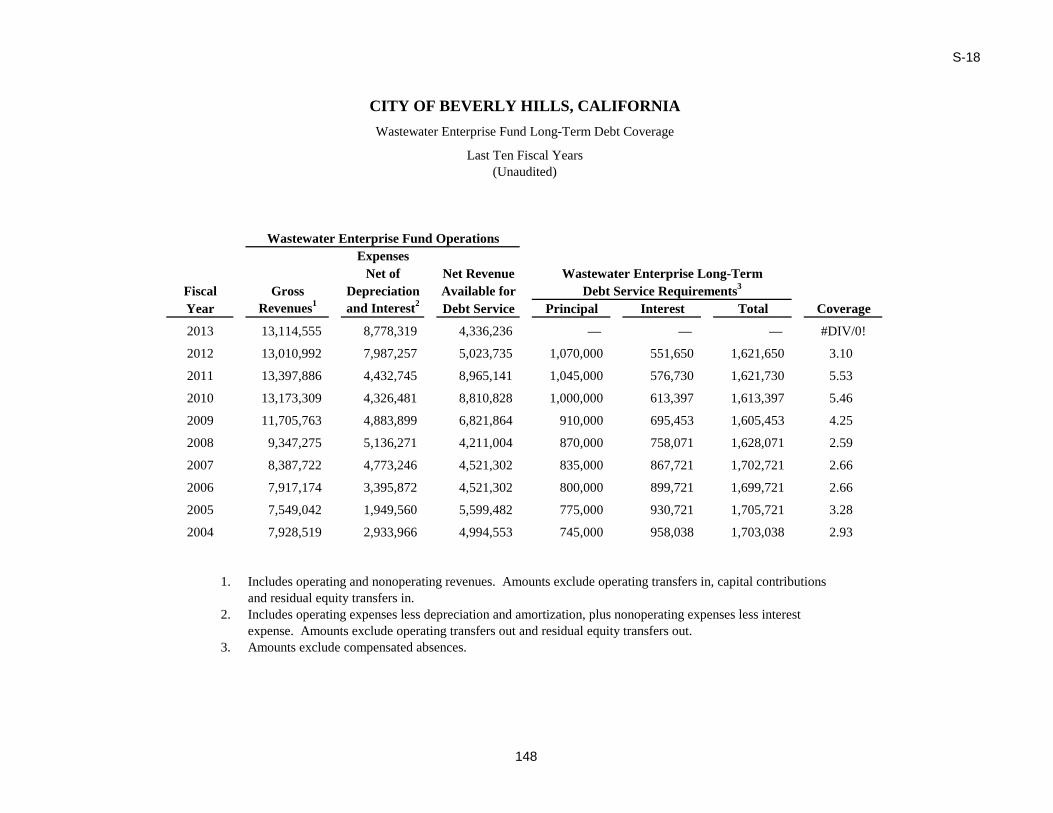
S-18
ExpensesNet of Net Revenue
Fiscal Gross Depreciation Available forYear Revenues1 and Interest2 Debt Service Principal Interest Total Coverage
2013 13,114,555 8,778,319 4,336,236 — — — #DIV/0!
2012 13,010,992 7,987,257 5,023,735 1,070,000 551,650 1,621,650 3.10
2011 13,397,886 4,432,745 8,965,141 1,045,000 576,730 1,621,730 5.53
2010 13,173,309 4,326,481 8,810,828 1,000,000 613,397 1,613,397 5.46
2009 11,705,763 4,883,899 6,821,864 910,000 695,453 1,605,453 4.25
2008 9,347,275 5,136,271 4,211,004 870,000 758,071 1,628,071 2.59
2007 8,387,722 4,773,246 4,521,302 835,000 867,721 1,702,721 2.66
2006 7,917,174 3,395,872 4,521,302 800,000 899,721 1,699,721 2.66
2005 7,549,042 1,949,560 5,599,482 775,000 930,721 1,705,721 3.28
2004 7,928,519 2,933,966 4,994,553 745,000 958,038 1,703,038 2.93
1. Includes operating and nonoperating revenues. Amounts exclude operating transfers in, capital contributions and residual equity transfers in.
2. Includes operating expenses less depreciation and amortization, plus nonoperating expenses less interestexpense. Amounts exclude operating transfers out and residual equity transfers out.
3. Amounts exclude compensated absences.
Wastewater Enterprise Fund Operations
Wastewater Enterprise Long-TermDebt Service Requirements3
CITY OF BEVERLY HILLS, CALIFORNIAWastewater Enterprise Fund Long-Term Debt Coverage
Last Ten Fiscal Years(Unaudited)
148
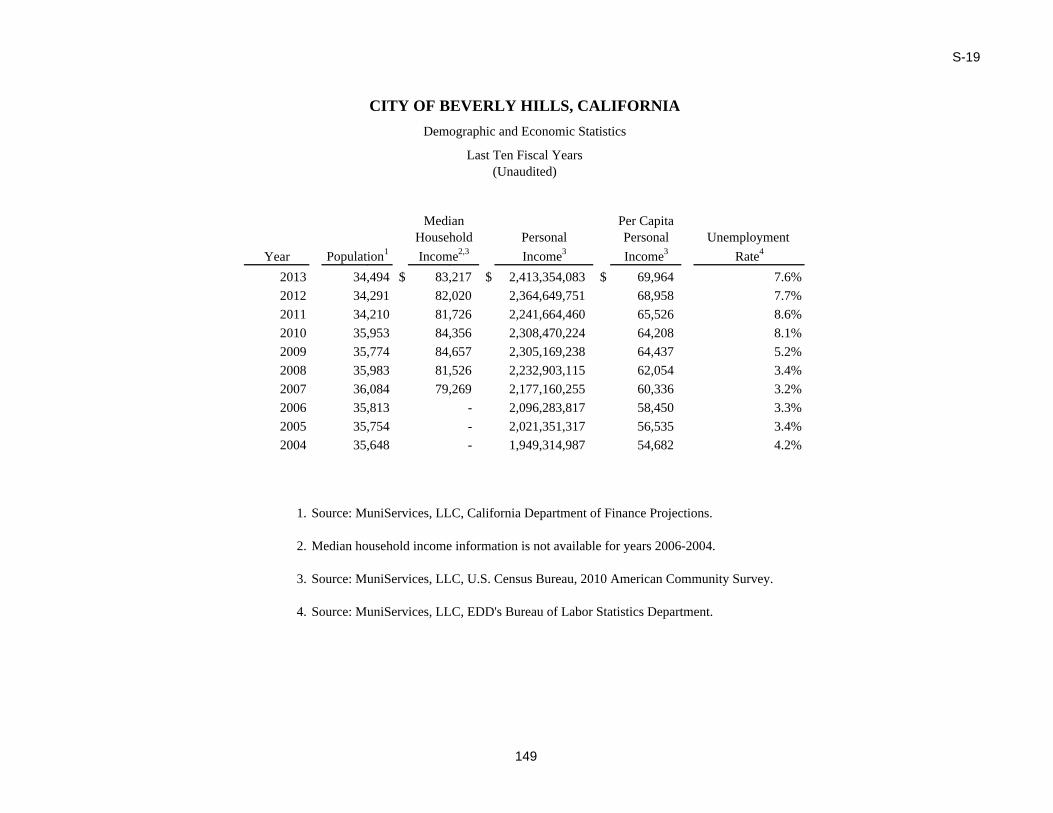
S-19
Median Per CapitaHousehold Personal Personal Unemployment
Year Population1 Income2,3 Income3 Income3 Rate4, ,
2013 34,494 $ 83,217 $ 2,413,354,083 $ 69,964 7.6%2012 34,291 82,020 2,364,649,751 68,958 7.7%2011 34,210 81,726 2,241,664,460 65,526 8.6%2010 35,953 84,356 2,308,470,224 64,208 8.1%2009 35,774 84,657 2,305,169,238 64,437 5.2%2008 35,983 81,526 2,232,903,115 62,054 3.4%2007 36,084 79,269 2,177,160,255 60,336 3.2%2006 35,813 - 2,096,283,817 58,450 3.3%2005 35,754 - 2,021,351,317 56,535 3.4%2004 35,648 - 1,949,314,987 54,682 4.2%
1. Source: MuniServices, LLC, California Department of Finance Projections.
2. Median household income information is not available for years 2006-2004.
3. Source: MuniServices, LLC, U.S. Census Bureau, 2010 American Community Survey.
4. Source: MuniServices, LLC, EDD's Bureau of Labor Statistics Department.
CITY OF BEVERLY HILLS, CALIFORNIADemographic and Economic Statistics
Last Ten Fiscal Years(Unaudited)
149
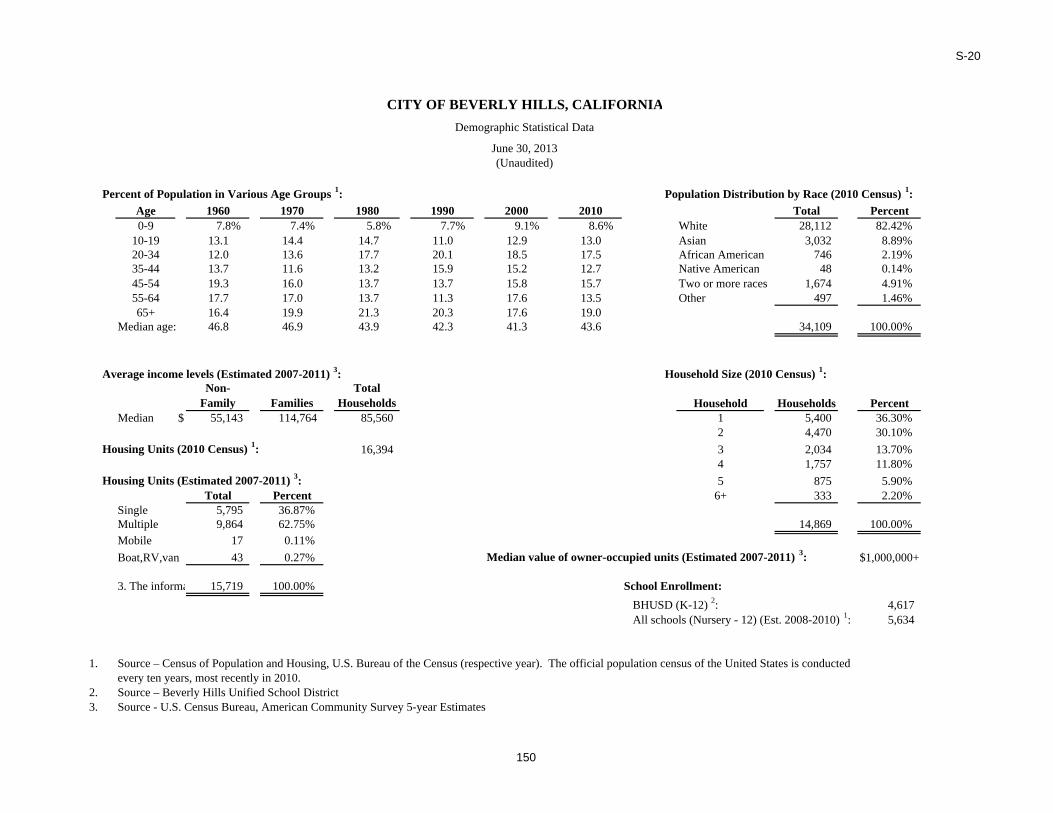
S-20
Percent of Population in Various Age Groups 1: Population Distribution by Race (2010 Census) 1:Age 1960 1970 1980 1990 2000 2010 Total Percent0-9 7.8% 7.4% 5.8% 7.7% 9.1% 8.6% White 28,112 82.42%
10-19 13.1 14.4 14.7 11.0 12.9 13.0 Asian 3,032 8.89% 20-34 12.0 13.6 17.7 20.1 18.5 17.5 African American 746 2.19% 35-44 13.7 11.6 13.2 15.9 15.2 12.7 Native American 48 0.14% 45-54 19.3 16.0 13.7 13.7 15.8 15.7 Two or more races 1,674 4.91% 55-64 17.7 17.0 13.7 11.3 17.6 13.5 Other 497 1.46% 65+ 16.4 19.9 21.3 20.3 17.6 19.0
Median age: 46.8 46.9 43.9 42.3 41.3 43.6 34,109 100.00%
Average income levels (Estimated 2007-2011) 3: Household Size (2010 Census) 1:Non-
Family FamiliesTotal
Households Household Households PercentMedian $ 55,143 114,764 85,560 1 5,400 36.30%
2 4,470 30.10% Housing Units (2010 Census) 1: 16,394 3 2,034 13.70%
4 1,757 11.80% Housing Units (Estimated 2007-2011) 3: 5 875 5.90%
Total Percent 6+ 333 2.20% Single 5,795 36.87% Multiple 9,864 62.75% 14,869 100.00% Mobile 17 0.11% Boat,RV,van 43 0.27% Median value of owner-occupied units (Estimated 2007-2011) 3: $1,000,000+
3. The informa 15,719 100.00% School Enrollment: BHUSD (K-12) 2: 4,617 All schools (Nursery - 12) (Est. 2008-2010) 1: 5,634
1. Source – Census of Population and Housing, U.S. Bureau of the Census (respective year). The official population census of the United States is conducted every ten years, most recently in 2010.
2. Source – Beverly Hills Unified School District3. Source - U.S. Census Bureau, American Community Survey 5-year Estimates
CITY OF BEVERLY HILLS, CALIFORNIADemographic Statistical Data
June 30, 2013(Unaudited)
150
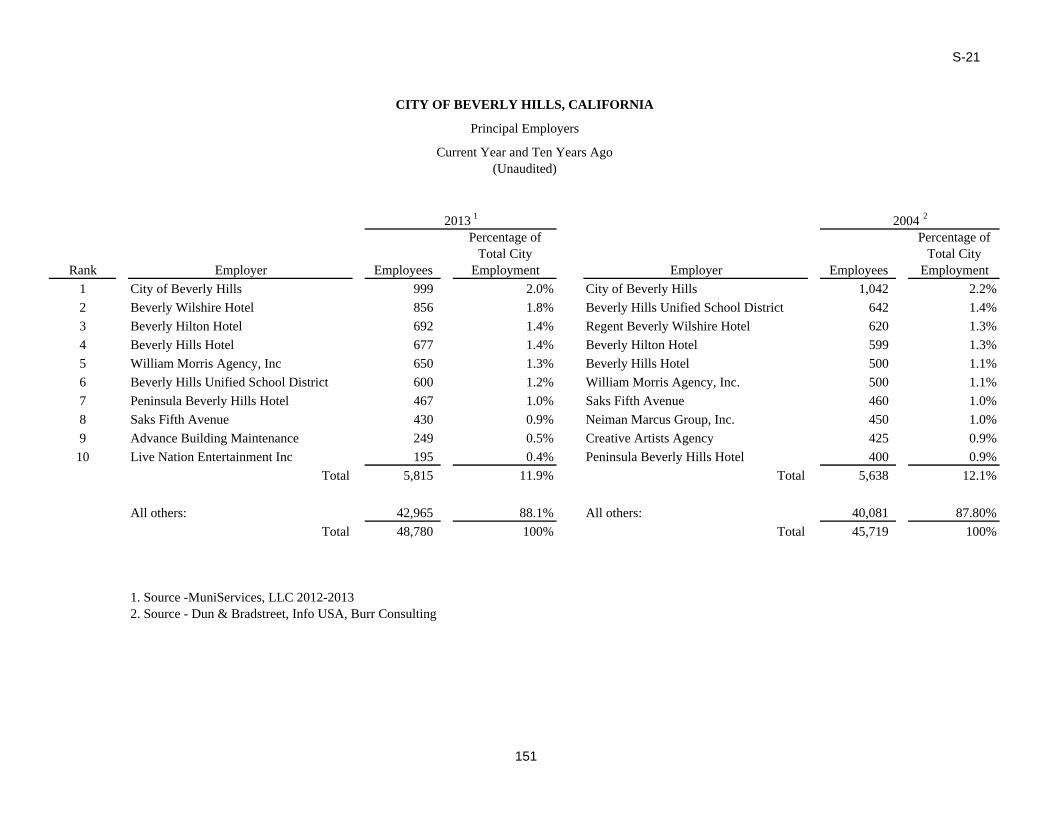
S-21
Percentage of Percentage ofTotal City Total City
Rank Employer Employees Employment Employer Employees Employment1 City of Beverly Hills 999 2.0% City of Beverly Hills 1,042 2.2%2 Beverly Wilshire Hotel 856 1.8% Beverly Hills Unified School District 642 1.4%3 Beverly Hilton Hotel 692 1.4% Regent Beverly Wilshire Hotel 620 1.3%4 Beverly Hills Hotel 677 1.4% Beverly Hilton Hotel 599 1.3%5 William Morris Agency, Inc 650 1.3% Beverly Hills Hotel 500 1.1%6 Beverly Hills Unified School District 600 1.2% William Morris Agency, Inc. 500 1.1%7 Peninsula Beverly Hills Hotel 467 1.0% Saks Fifth Avenue 460 1.0%8 Saks Fifth Avenue 430 0.9% Neiman Marcus Group, Inc. 450 1.0%9 Advance Building Maintenance 249 0.5% Creative Artists Agency 425 0.9%
10 Live Nation Entertainment Inc 195 0.4% Peninsula Beverly Hills Hotel 400 0.9%Total 5,815 11.9% Total 5,638 12.1%
All others: 42,965 88.1% All others: 40,081 87.80%Total 48,780 100% Total 45,719 100%
1. Source -MuniServices, LLC 2012-20132. Source - Dun & Bradstreet, Info USA, Burr Consulting
2013 1 2004 2
CITY OF BEVERLY HILLS, CALIFORNIA
Principal Employers
Current Year and Ten Years Ago(Unaudited)
151
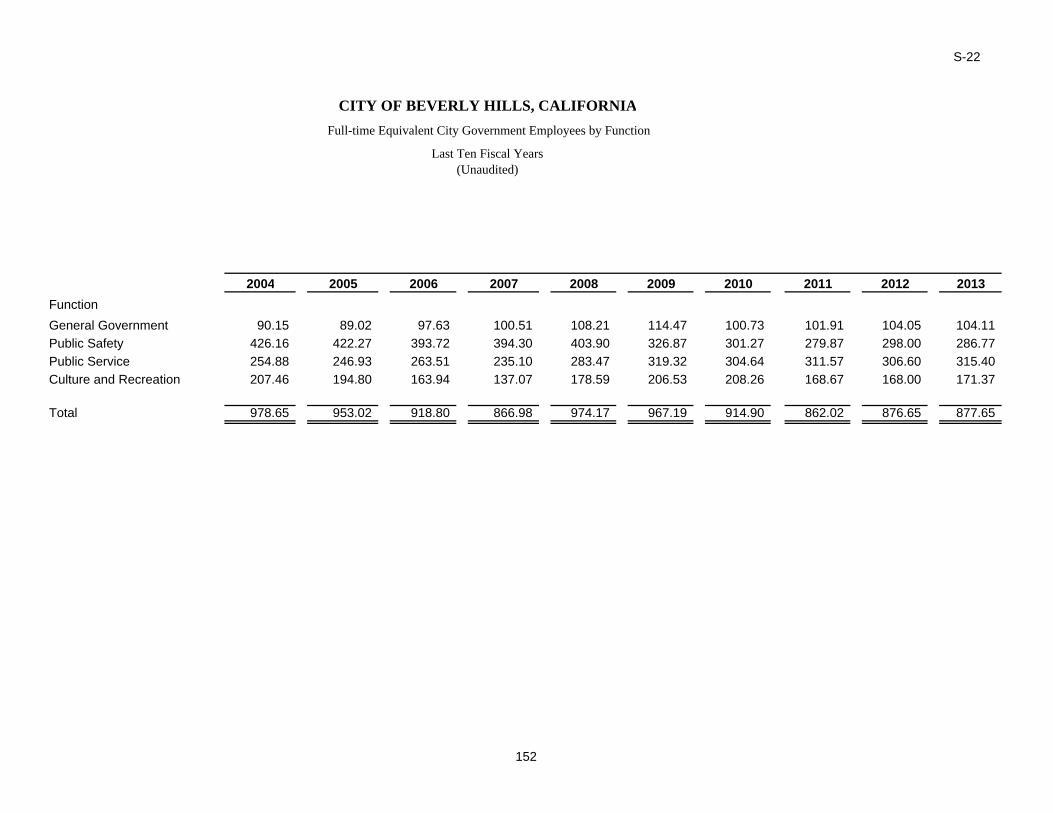
S-22
2004 2005 2006 2007 2008 2009 2010 2011 2012 2013FunctionGeneral Government 90.15 89.02 97.63 100.51 108.21 114.47 100.73 101.91 104.05 104.11 Public Safety 426.16 422.27 393.72 394.30 403.90 326.87 301.27 279.87 298.00 286.77 Public Service 254.88 246.93 263.51 235.10 283.47 319.32 304.64 311.57 306.60 315.40 Culture and Recreation 207.46 194.80 163.94 137.07 178.59 206.53 208.26 168.67 168.00 171.37
Total 978.65 953.02 918.80 866.98 974.17 967.19 914.90 862.02 876.65 877.65
CITY OF BEVERLY HILLS, CALIFORNIAFull-time Equivalent City Government Employees by Function
Last Ten Fiscal Years(Unaudited)
152
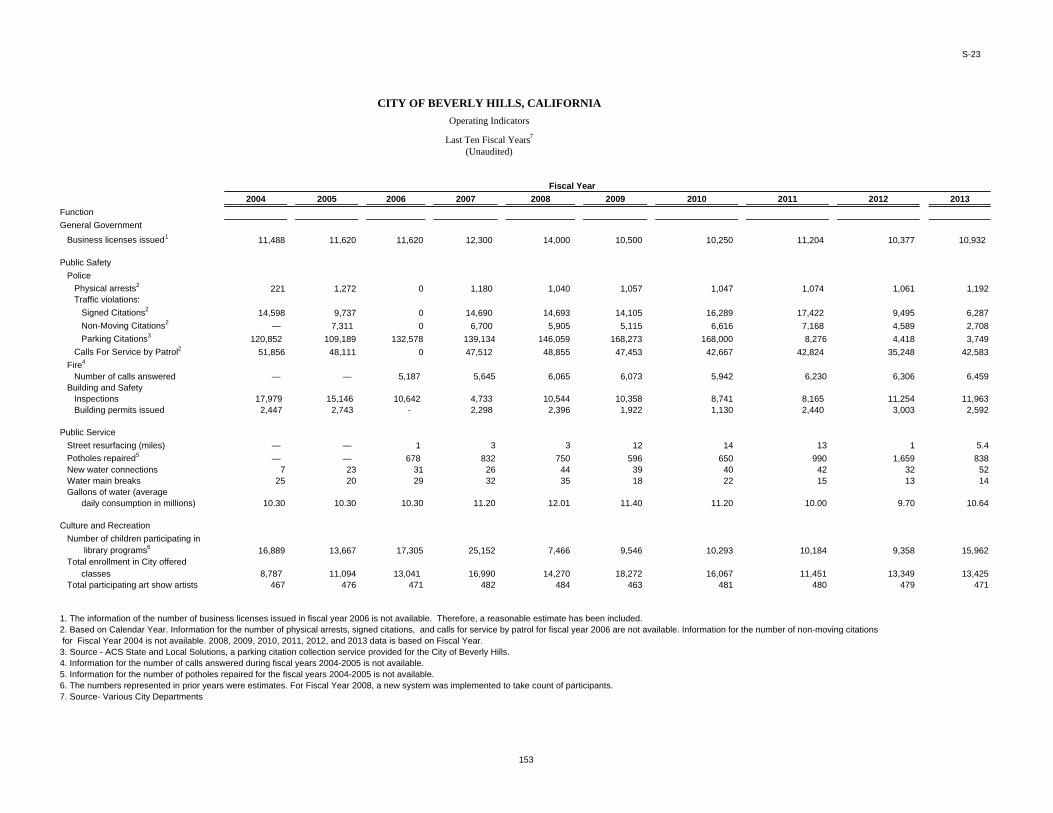
S-23
2004 2005 2006 2007 2008 2009 2010 2011 2012 2013FunctionGeneral Government
Business licenses issued1 11,488 11,620 11,620 12,300 14,000 10,500 10,250 11,204 10,377 10,932
Public SafetyPolice
Physical arrests2 221 1,272 0 1,180 1,040 1,057 1,047 1,074 1,061 1,192Traffic violations:
Signed Citations2 14,598 9,737 0 14,690 14,693 14,105 16,289 17,422 9,495 6,287Non-Moving Citations2 — 7,311 0 6,700 5,905 5,115 6,616 7,168 4,589 2,708Parking Citations3 120,852 109,189 132,578 139,134 146,059 168,273 168,000 8,276 4,418 3,749
Calls For Service by Patrol2 51,856 48,111 0 47,512 48,855 47,453 42,667 42,824 35,248 42,583Fire4
Number of calls answered — — 5,187 5,645 6,065 6,073 5,942 6,230 6,306 6,459Building and Safety
Inspections 17,979 15,146 10,642 4,733 10,544 10,358 8,741 8,165 11,254 11,963Building permits issued 2,447 2,743 - 2,298 2,396 1,922 1,130 2,440 3,003 2,592
Public ServiceStreet resurfacing (miles) — — 1 3 3 12 14 13 1 5.4Potholes repaired5 — — 678 832 750 596 650 990 1,659 838New water connections 7 23 31 26 44 39 40 42 32 52Water main breaks 25 20 29 32 35 18 22 15 13 14Gallons of water (average
daily consumption in millions) 10.30 10.30 10.30 11.20 12.01 11.40 11.20 10.00 9.70 10.64
Culture and RecreationNumber of children participating in
library programs6 16,889 13,667 17,305 25,152 7,466 9,546 10,293 10,184 9,358 15,962Total enrollment in City offered
classes 8,787 11,094 13,041 16,990 14,270 18,272 16,067 11,451 13,349 13,425Total participating art show artists 467 476 471 482 484 463 481 480 479 471
1. The information of the number of business licenses issued in fiscal year 2006 is not available. Therefore, a reasonable estimate has been included.2. Based on Calendar Year. Information for the number of physical arrests, signed citations, and calls for service by patrol for fiscal year 2006 are not available. Information for the number of non-moving citations for Fiscal Year 2004 is not available. 2008, 2009, 2010, 2011, 2012, and 2013 data is based on Fiscal Year.3. Source - ACS State and Local Solutions, a parking citation collection service provided for the City of Beverly Hills.4. Information for the number of calls answered during fiscal years 2004-2005 is not available.5. Information for the number of potholes repaired for the fiscal years 2004-2005 is not available.6. The numbers represented in prior years were estimates. For Fiscal Year 2008, a new system was implemented to take count of participants.7. Source- Various City Departments
Fiscal Year
CITY OF BEVERLY HILLS, CALIFORNIAOperating Indicators
Last Ten Fiscal Years7
(Unaudited)
153
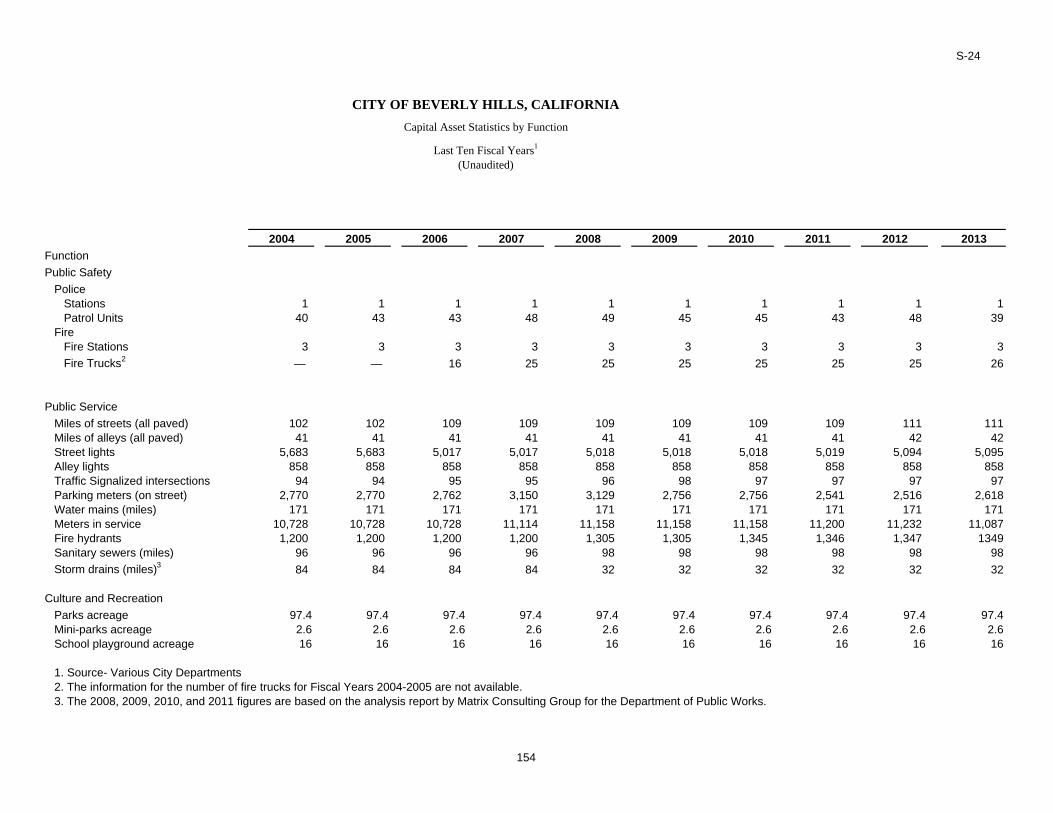
S-24
2004 2005 2006 2007 2008 2009 2010 2011 2012 2013FunctionPublic Safety
PoliceStations 1 1 1 1 1 1 1 1 1 1Patrol Units 40 43 43 48 49 45 45 43 48 39
FireFire Stations 3 3 3 3 3 3 3 3 3 3Fire Trucks2 — — 16 25 25 25 25 25 25 26
Public ServiceMiles of streets (all paved) 102 102 109 109 109 109 109 109 111 111Miles of alleys (all paved) 41 41 41 41 41 41 41 41 42 42Street lights 5,683 5,683 5,017 5,017 5,018 5,018 5,018 5,019 5,094 5,095Alley lights 858 858 858 858 858 858 858 858 858 858Traffic Signalized intersections 94 94 95 95 96 98 97 97 97 97Parking meters (on street) 2,770 2,770 2,762 3,150 3,129 2,756 2,756 2,541 2,516 2,618Water mains (miles) 171 171 171 171 171 171 171 171 171 171Meters in service 10,728 10,728 10,728 11,114 11,158 11,158 11,158 11,200 11,232 11,087Fire hydrants 1,200 1,200 1,200 1,200 1,305 1,305 1,345 1,346 1,347 1349Sanitary sewers (miles) 96 96 96 96 98 98 98 98 98 98Storm drains (miles)3 84 84 84 84 32 32 32 32 32 32
Culture and RecreationParks acreage 97.4 97.4 97.4 97.4 97.4 97.4 97.4 97.4 97.4 97.4Mini-parks acreage 2.6 2.6 2.6 2.6 2.6 2.6 2.6 2.6 2.6 2.6School playground acreage 16 16 16 16 16 16 16 16 16 16
1. Source- Various City Departments2. The information for the number of fire trucks for Fiscal Years 2004-2005 are not available. 3. The 2008, 2009, 2010, and 2011 figures are based on the analysis report by Matrix Consulting Group for the Department of Public Works.
CITY OF BEVERLY HILLS, CALIFORNIACapital Asset Statistics by Function
Last Ten Fiscal Years1
(Unaudited)
154