Embed Size (px)
Citation preview
COMPREHENSIVE ANNUAL FINANCIAL REPORT
CITY OF SOUTH SAN FRANCISCO
CALIFORNIAYEAR ENDED JUNE 30, 2020
CITY OF SOUTH SAN FRANCISCO, CALIFORNIA COMPREHENSIVE ANNUAL FINANCIAL REPORT
FOR THE YEAR ENDED JUNE 30, 2020
Prepared by:
Department of Finance
This Page Left Intentionally Blank
CITY OF SOUTH SAN FRANCISCO, CALIFORNIA
Comprehensive Annual Financial Report For the Year Ended June 30, 2020
Table of Contents
Page
INTRODUCTORY SECTION Table of Contents ............................................................................................................................................... i Letter of Transmittal ......................................................................................................................................... v Certificate of Achievement for Excellence in Financial Reporting ................................................................ ix Organization Chart ............................................................................................................................................ x City Council and Directory of City Officials .................................................................................................. xi FINANCIAL SECTION Independent Auditor's Report ...................................................................................................................... 1 Management’s Discussion and Analysis ....................................................................................................... 5 Basic Financial Statements: Government-wide Financial Statements: Statement of Net Position .................................................................................................................. 27 Statement of Activities ...................................................................................................................... 28 Fund Financial Statements: Major Governmental Funds: Balance Sheet ................................................................................................................................ 32 Reconciliation of Governmental Fund Balances to Net Position of Governmental Activities .... 34 Statement of Revenues, Expenditures, and Changes in Fund Balances ....................................... 36 Reconciliation of the Net Change in Fund Balances Total Governmental Funds with the Statement of Activities ........................................................................................................ 38
Statement of Revenues, Expenditures and Changes in Fund Balance – Budget and Actual – Budgetary Basis:
General Fund ....................................................................................................................... 39 Low and Moderate Income Housing Assets ....................................................................... 40
Major Proprietary Funds: Statement of Net Position .............................................................................................................. 42 Statement of Revenues, Expenses, and Changes in Fund Net Position ........................................ 43 Statement of Cash Flows ............................................................................................................... 44
i
CITY OF SOUTH SAN FRANCISCO, CALIFORNIA
Comprehensive Annual Financial Report For the Year Ended June 30, 2020
Table of Contents
Page
FINANCIAL SECTION (Continued) Fiduciary Funds: Statement of Fiduciary Net Position ............................................................................................. 46
Statement of Changes in Fiduciary Net Position .......................................................................... 47 Notes to Basic Financial Statements ...................................................................................................... 49 Required Supplementary Information:
Schedule of Changes in Net Pension Liability and Related Ratios- Miscellaneous Plan .............................................................................................................. 96
Schedule of Contributions – Miscellaneous Plan .......................................................................... 97 Schedule of Changes in Net Pension Liability and Related Ratios – Safety Plan ........................ 98 Schedule of Contributions – Safety Plan ....................................................................................... 99 Schedule of Changes in the Net OPEB Liability and Related Ratios ......................................... 100 Schedule of Contributions – Retiree Healthcare OPEB Plan ...................................................... 101 Notes to Schedule of Employer Contributions ............................................................................ 102
Supplementary Information:
General Fund: Combining Balance Sheets ............................................................................................................. 106 Combining Schedule of Revenues, Expenditures, and Changes in Fund Balances ..................................................................................................................... 107 Combining Schedule of Revenues, Expenditures, and Changes in Fund Balance Budget and Actual - (Non GAAP Legal Basis) ........................................... 108 Major Governmental Funds Other Than the General Fund and Special Revenue Funds: Schedule of Revenues, Expenditures, and Changes in Fund Balance – Budget and Actual:
East of 101 Sewer Impact Fees Capital Projects Fund (Non GAAP Legal Basis) ................ 112 East of 101 Traffic Impact Fees Capital Projects Fund (Non GAAP Legal Basis) ............... 113 Child Care Impact Fees Capital Projects Fund (Non GAAP Legal Basis) ............................ 114
ii
CITY OF SOUTH SAN FRANCISCO, CALIFORNIA
Comprehensive Annual Financial Report For the Year Ended June 30, 2020
Table of Contents
Page
FINANCIAL SECTION (Continued) Developer Deposit Capital Projects Fund (Non GAAP Legal Basis) .................................... 115 Capital Infrastructure Reserve Fund (Non GAAP Legal Basis) ............................................ 116 Capital Improvements Police Stations Capital Projects Fund (Non GAAP Legal Basis) ..... 117
Non-major Governmental Funds: Combining Balance Sheet ............................................................................................................... 122 Combining Statement of Revenues, Expenditures, and Changes in Fund Balances ..................................................................................................................... 126 Budgeted Non-major Government Funds: Combining Schedule of Revenues, Expenditures, and Changes in Fund Balances – Budget and Actual ................................................................................... 130 Internal Service Funds: Combining Statement of Net Position ............................................................................................ 138 Combining Statement of Revenues, Expenses and Changes in Fund Net Position ....................... 139 Combining Statement of Cash Flows ............................................................................................. 140 Fiduciary Funds: Statement of Changes in Assets and Liabilities – Agency Fund .................................................. 142
STATISTICAL SECTION Net Position by Component – Last Ten Fiscal Years .................................................................... 145 Changes in Net Position - Last Ten Fiscal Years ........................................................................... 146 Fund Balances of Governmental Funds - Last Ten Fiscal Years ................................................... 150 Changes in Fund Balance of Governmental Funds – Last Ten Fiscal Years ................................ 152 Assessed Value of Taxable Property - Last Ten Fiscal Years ....................................................... 154 Direct and Overlapping Governments - Property Tax Rates Last Ten Fiscal Years ................................................................................................................ 155
Principal Property Taxpayers – Current Year and Nine Years Ago .............................................. 157 Property Tax Levies and Collections – Last Ten Fiscal Years ...................................................... 158
iii
CITY OF SOUTH SAN FRANCISCO, CALIFORNIA
Comprehensive Annual Financial Report For the Year Ended June 30, 2020
Table of Contents
Page
STATISTICAL SECTION (Continued)
Ratio of Outstanding Debt by Type – Last Ten Fiscal Years ........................................................ 159 Computation of Direct and Overlapping Debt ............................................................................... 160 Computation of Legal Bonded Debt Margin ................................................................................. 161 Revenue Bond Coverage Sewer Rental Enterprise Fund – Last Ten Fiscal Years ....................... 162 Sewer Debt Service Coverage Sewer Rental Enterprise Fund – Last Six Fiscal Years ................ 163 Redevelopment Pledged Revenue Coverage – Last Eight Fiscal Years ........................................ 164 Demographic and Economic Statistics – Last Ten Fiscal Years ................................................... 165 Principal Employers – Current Year and Nine Years Ago ............................................................ 166
Full-Time Equivalent City Governmental Employees by Function – Last Ten Fiscal Years ....... 167
Operating Indicators by Function/Program – Last Six Fiscal Years ............................................. 168 Capital Asset Statistics by Function/Program – Last Ten Fiscal Years ......................................... 169
Miscellaneous Information – Last Four Fiscal Years .................................................................... 170
iv
v
vi
vii
viii
Government Finance Officers Association
Certificate of Achievementfor Excellence
in Financial Reporting
Presented to
City of South San FranciscoCalifornia
For its Comprehensive AnnualFinancial Report
For the Fiscal Year Ended
June 30, 2019
Executive Director/CEO
ix
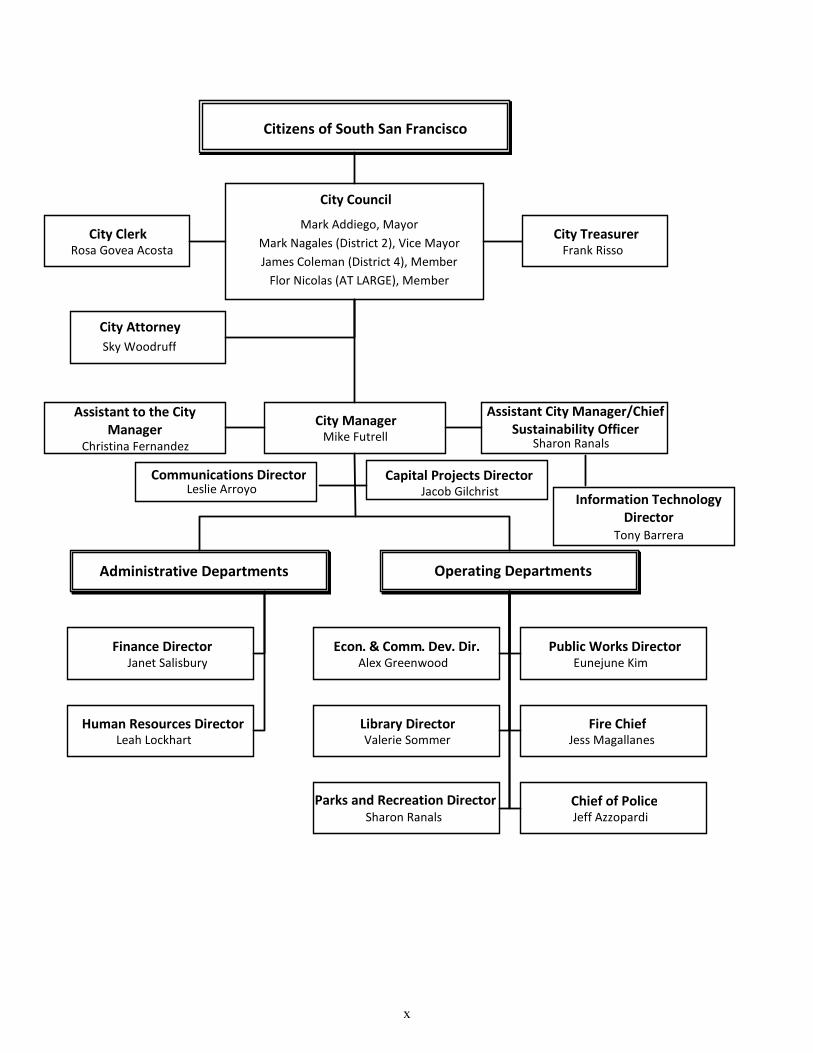
Citizens of South San Francisco
City Council
City Clerk Rosa Govea Acosta
City Treasurer Frank Risso
City Manager Mike Futrell
City Attorney Sky Woodruff
Assistant to the City Manager
Christina Fernandez
Administrative Departments
Operating Departments
Fire Chief Jess Magallanes
Public Works Director Eunejune Kim
Library Director Valerie Sommer
Parks and Recreation Director Sharon Ranals
Econ . & Comm . Dev . Dir . Alex Greenwood
Chief of Police Jeff Azzopardi
Human Resources Director Leah Lockhart
Finance Director Janet Salisbury
Assistant City Manager/Chief Sustainability Officer
Sharon Ranals
Communications Director Leslie Arroyo
Mark Addiego, Mayor Mark Nagales (District 2), Vice Mayor James Coleman (District 4), Member
Flor Nicolas (AT LARGE), Member
Information Technology Director
Tony Barrera
Capital Projects Director Jacob Gilchrist
x
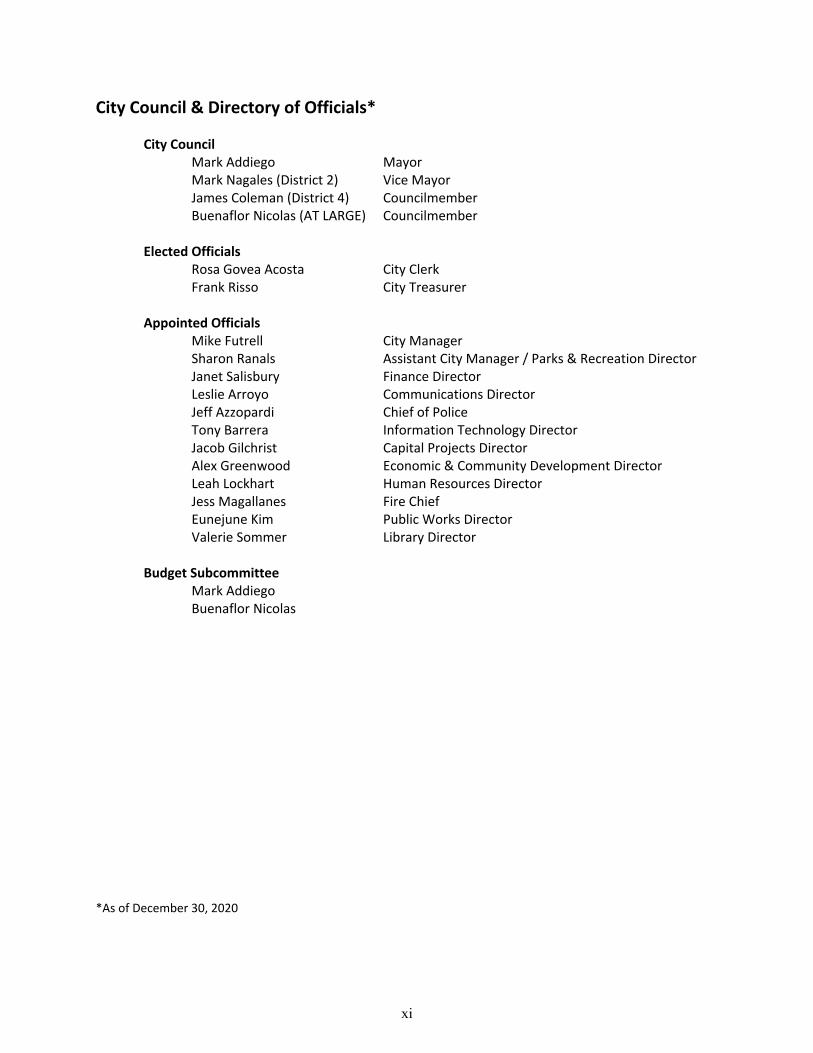
City Council & Directory of Officials*
City Council Mark Addiego Mayor Mark Nagales (District 2) Vice Mayor James Coleman (District 4) Councilmember Buenaflor Nicolas (AT LARGE) Councilmember Elected Officials Rosa Govea Acosta City Clerk Frank Risso City Treasurer Appointed Officials Mike Futrell City Manager Sharon Ranals Assistant City Manager / Parks & Recreation Director Janet Salisbury Finance Director Leslie Arroyo Communications Director Jeff Azzopardi Chief of Police
Tony Barrera Information Technology Director Jacob Gilchrist Capital Projects Director Alex Greenwood Economic & Community Development Director Leah Lockhart Human Resources Director
Jess Magallanes Fire Chief Eunejune Kim Public Works Director Valerie Sommer Library Director Budget Subcommittee Mark Addiego Buenaflor Nicolas *As of December 30, 2020
xi

This Page Left Intentionally Blank
INDEPENDENT AUDITOR’S REPORT
Honorable Members of the City Council City of South San Francisco, California
Report on Financial Statements
We have audited the accompanying financial statements of the governmental activities, the business-type activities, each major fund, and the aggregate remaining fund information of the City of South San Francisco (City), California, as of and for the year ended June 30, 2020, and the related notes to the financial statements, which collectively comprise the City’s basic financial statements as listed in the Table of Contents.
Management’s Responsibility for the Financial Statements
Management is responsible for the preparation and fair presentation of these financial statements in accordance with accounting principles generally accepted in the United States of America; this includes the design, implementation, and maintenance of internal control relevant to the preparation and fair presentation of the financial statements that are free from material misstatement, whether due to fraud or error.
Auditor’s Responsibility
Our responsibility is to express opinions on these financial statements based on our audit. We did not audit the discretely presented component unit financial statements of the South San Francisco Conference Center Authority (Authority), which represents 0.91%, 1.62%, and 1.58%, respectively, of the assets, net position, and revenue of the primary government. These component unit financial statements were audited by other auditors, whose report thereon has been furnished to us, and our opinion, insofar as it relates to the amounts included for this entity, is based solely on the report of the other auditors.
We conducted our audit in accordance with auditing standards generally accepted in the United States of America and the standards applicable to financial audits contained in Government Auditing Standards, issued by the Comptroller General of the United States. Those standards require that we plan and perform the audit to obtain reasonable assurance about whether the financial statements are free from material misstatement.
An audit involves performing procedures to obtain audit evidence about the amounts and disclosures in the financial statements. The procedures selected depend on the auditor’s judgment, including the assessment of the risks of material misstatement of the financial statements, whether due to fraud or error. In making those risk assessments, the auditor considers internal control relevant to the City’s preparation and fair presentation of the financial statements in order to design audit procedures that are appropriate in the circumstances, but not for the purpose of expressing an opinion on the effectiveness of the City’s internal control. Accordingly, we express no such opinion. An audit also includes evaluating the appropriateness of accounting policies used and the reasonableness of significant accounting estimates made by management, as well as evaluating the overall presentation of the financial statements.
We believe that the audit evidence we have obtained is sufficient and appropriate to provide a basis for our audit opinions.
1
Opinions
In our opinion, based on our audit and the report of the other auditors, the financial statements referred to above present fairly, in all material respects, the respective financial position of the governmental activities, the business-type activities, the aggregate discretely presented component unit, each major fund, and the aggregate remaining information of the City as of June 30, 2020, and the respective changes in financial position and, where applicable, cash flows thereof and the respective budgetary comparisons listed in the Table of Contents as part of the basic financial statements for the year then ended in accordance with accounting principles generally accepted in the United States of America.
Other Matters
Required Supplementary Information
Accounting principles generally accepted in the United States of America require that Management’s Discussion and Analysis and other Required Supplementary Information as listed in the Table of Contents be presented to supplement the basic financial statements. Such information, although not a part of the basic financial statements, is required by the Governmental Accounting Standards Board, who considers it to be an essential part of financial reporting for placing the basic financial statements in an appropriate operational, economic or historical context. We have applied certain limited procedures to the required supplementary information in accordance with auditing standards generally accepted in the United States of America, which consisted of inquiries of management about the methods of preparing the information and comparing the information for consistency with management’s responses to our inquiries, the basic financial statements, and other knowledge we obtained during our audit of the basic financial statements. We do not express an opinion or provide any assurance on the information because the limited procedures do not provide us with sufficient evidence to express an opinion or provide any assurance.
Other Information
Our audit was conducted for the purpose of forming opinions on the financial statements that collectively comprise the City’s basic financial statements. The Introductory Section, Supplemental Information, and Statistical Section as listed in the Table of Contents are presented for purposes of additional analysis and are not required parts of the basic financial statements.
The Supplemental Information is the responsibility of management and was derived from and relates directly to the underlying accounting and other records used to prepare the basic financial statements. The information has been subjected to the auditing procedures applied in the audit of the basic financial statements and certain additional procedures, including comparing and reconciling such information directly to the underlying accounting and other records used to prepare the basic financial statements or to the basic financial statements themselves, and other additional procedures in accordance with auditing standards generally accepted in the United States of America. In our opinion, the Supplemental Information is fairly stated, in all material respects, in relation to the basic financial statements as a whole.
The Introductory and Statistical Sections have not been subjected to the auditing procedures applied in the audit of the basic financial statements and, accordingly, we do not express an opinion or provide any assurance on them.
2
Other Reporting Required by Government Auditing Standards
In accordance with Government Auditing Standards, we have also issued our report dated January 20, 2021 on our consideration of the City’s internal control over financial reporting and on our tests of its compliance with certain provisions of laws, regulations, contracts, and grant agreements and other matters. The purpose of that report is to describe the scope of our testing of internal control over financial reporting and compliance and the results of that testing, and not to provide an opinion on internal control over financial reporting or on compliance. That report is an integral part of an audit performed in accordance with Government Auditing Standards in considering the City’s internal control over financial reporting and compliance.
Pleasant Hill, California January 20, 2021
3

This Page Left Intentionally Blank
CITY OF SOUTH SAN FRANCISCO MANAGEMENT’S DISCUSSION AND ANALYSIS
Required Supplementary Information
Government Accounting Standards Board Statement 34 (GASB 34) requires the City of South San Francisco to provide an overview of its financial activities for the fiscal year. Please read this in conjunction with the accompanying Transmittal Letter and Basic Financial Statements.
FISCAL YEAR (FY) 2019-20 FINANCIAL HIGHLIGHTS
Summary:
The City of South San Francisco started Fiscal Year 2019-20 with a strong economy throughout the region fueled by development growth from the biotechnology and housing sectors. In February 2020, S&P Global Ratings (“S&P”) assigned an issuer rating of triple A (“AAA”) to the City. AAA is the highest rating possible and is important as higher ratings generally result in lower borrowing costs. In a release announcing the rating, S&P noted the City's strong financial position, bolstered by the local economic growth and development momentum. The solid executive management, fiscally sound policies and practices, and sound budgetary performance were also recognized.
From March 2020 to June 2020, the City was significantly impacted – both financially and operationally – as a result of the global COVID-19 pandemic. In reaction to the COVID-19 pandemic, six Bay Area counties including San Mateo County, issued a Shelter-in-Place order effective March 17, 2020, followed by the State of California’s similar Stay-at-Home order a few days later. All non-essential businesses were ordered to close. The hospitality industry, restaurants, city services and retail businesses were hit extremely hard. The San Francisco-Oakland-Hayward Metropolitan Statistical Area unemployment rate increased from 2.8% in June 2019 to 12.6% in June 2020, according to the U.S. Bureau of Labor Statistics.
The economic impacts of the global pandemic is the main driver for the $2.0 million decrease in General Fund revenues (excluding operating transfers in) versus the prior year; this represents a relatively modest decrease of 1.5%. The expected revenue decline as a result COVID-19 related contractions, especially in sales taxes, transient occupancy taxes, intergovernmental, and charges for services, were offset by the healthy growth in property taxes and licenses and permits revenues, reflective of the strong fundamentals of the local economy.
As in years past, the General Fund reserves were fully funded in accordance with the City’s Reserves Policy, which follows best practices as recommended by the Government Finance Officers’ Association (GFOA).
City-wide financial highlights of the year include the following:
Total Net Position for Governmental Activities in FY 2019-20 increased by $29.6 million incomparison to prior year (from $275 million to $305 million). The increase in assets is aresult of the continued growth in the local economy. Total liabilities increased by $73.9million from the issuance of bonds related to the police facility, OPEB liability, and otherliabilities.
5
CITY OF SOUTH SAN FRANCISCO MANAGEMENT’S DISCUSSION AND ANALYSIS
Required Supplementary Information Net pension liability to CalPERS for fiscal year ending June 30, 2020 increased by $10.4
million (5.69% increase) to $193.1 million. The City’s net pension liability for the prior fiscal year was $182.7 million. The liability increase was driven by revised actuarial valuations from CalPERS taking into account member contributions and investment earnings.
Cash and investments and Net Expenses from Governmental Activities increased compared
to the prior year, reflecting the ongoing strong development environment in South San Francisco. Cash and investments increased $24.2 million or 12.3% from $195.4 million to $219.6 million, while Net Expenses increased $22.1 million or 39.6% from $55.8 million to $77.9 million.
Sales tax revenues for Governmental Funds remained relatively flat to FY 2018-19 at $32.3 million. The COVID-19 pandemic driven declines in the latter half of the year erased much of the gains from the near record-breaking pace in sales tax collections from July 2019 through January 2020. This flat growth in FY 2019-20 is in stark contrast to the healthy 12.3% increase the City saw in FY 2018-19.
Transient Occupancy Tax (“TOT”) collections were the most dramatically impacted by the
Shelter-in-Place orders. TOT revenues declined by 19.1% to $13.8 million, representing a $3.3 million decrease, versus the prior year. Much like sales tax, the City saw a dramatic increase in TOT collections from July 2019 through January 2020, reflective of the strong tourism and business economy in the region prior to the COVID-19. However, with leisure and business travel dramatically falling with the onset of the COVID-19 pandemic, TOT collections dropped precipitously from March 2020 through June 2020.
Revenue from licenses and permits for Governmental Funds increased $0.5 million or 3.2%
from $15.4 million to $15.9 million, reflecting the City’s diverse investments to broaden development throughout the City. South San Francisco continues to see remarkable levels of new construction, especially in the East of 101 area driven by non-residential and biotechnology companies along with high density residential in the downtown area.
Intergovernmental revenues for Governmental Funds increased $5.1 million or 38.6% from $13.2 million to $18.3 million, primarily due to the contribution of $6.1 million from the Successor Agency for the Oyster Point Development Project and in addition, the prior year included a one-time transfer of funds from San Mateo County for $0.7 million to purchase open space on Sign Hill. The South San Francisco Fire Department responded to fewer mutual aid events throughout the State of California due to the fire season. As such, the California Office of Emergency Services (CalOES) reimbursed the City $0.4 million less for employee and equipment costs compared to FY 2018-19.
6
CITY OF SOUTH SAN FRANCISCO MANAGEMENT’S DISCUSSION AND ANALYSIS
Required Supplementary Information OVERVIEW OF THE COMPREHENSIVE ANNUAL FINANCIAL REPORT This Comprehensive Annual Financial Report is in six parts:
1) The Introductory Section, which includes the Transmittal Letter and general information;
2) Management’s Discussion and Analysis (this part);
3) The Basic Financial Statements, which include the Government-wide and the Fund Financial Statements, along with the notes accompanying these statements;
4) Required Supplementary Information and the accompanying notes;
5) Other Supplementary Information including combining statements for non-major governmental funds, internal service funds, other budgetary information, and a fiduciary statement of changes in assets and liabilities; and
6) The Statistical Section.
Basic Financial Statements The Basic Financial Statements are comprised of the City-wide Financial Statements and the Fund Financial Statements. These two sets of financial statements provide two different views of the City’s financial activities and financial position. The City-wide Financial Statements provide a longer-term view of the City’s activities as a whole, and consist of the Statement of Net Position and the Statement of Activities. The Statement of Net Position provides information about the financial position of the City as a whole, including all its capital assets and long-term liabilities on the full accrual basis, similar to the basis used by corporations. The Statement of Activities provides information about all the City’s revenues and all its expenses, also on the full accrual basis, with the emphasis on measuring net revenues or expenses of each the City’s programs. The Statement of Activities provides a detailed explanation of the change in net position for the year. All the amounts in the Statement of Net Position and the Statement of Activities are separated into Governmental Activities and Business-type Activities in order to provide a summary of these two activities of the City as a whole. The Fund Financial Statements report the City’s operations in more detail than the government-wide statements and focus primarily on the short-term activities of the City’s General Fund and other Major Funds. The Fund Financial Statements measure only current revenues, expenditures, and fund balances; they exclude capital assets, long-term debt and other long-term amounts. Major Funds account for the major financial activities of the City and are presented individually, while the activities of Non-major funds are presented in summary, with subordinate schedules presenting the detail for each of these other funds. Major Funds are explained below.
7
CITY OF SOUTH SAN FRANCISCO MANAGEMENT’S DISCUSSION AND ANALYSIS
Required Supplementary Information The fiduciary statements provide financial information about the activities of Non-Obligated Assessment Districts, for which the City acts solely as agent. Note 1 to the Basic Financial Statements provides a summary of the City’s significant accounting policies, fund categories, and fund types. City-wide Financial Statements The Statement of Net Position and the Statement of Activities present information about the following: Governmental activities - All of the City’s basic services are considered to be governmental
activities, including general government, fire, public works, parks and recreation, library, and economic and community development. These services are supported by general City revenues such as taxes, and by specific program revenues from grants, contributions, and fees. The City’s governmental activities also include the City of South San Francisco Capital Improvements Financing Authority and South San Francisco Public Facilities Financing Authority, as the City Council also governs these entities.
Business-type activities - All the City’s enterprise activities are reported here, including
wastewater treatment, parking, and storm water management. Unlike governmental services, user fees fully support most of these services.
Component Unit - The City of South San Francisco Conference Center Authority comprises
the component unit. The Authority serves the City and other interests and it has a governing body separate from the City Council.
Citywide financial statements are prepared on the accrual basis, which means they measure the flow of all economic resources of the City as a whole. Fund Financial Statements The Fund Financial Statements provide detailed information about each of the City’s most significant funds, called Major Funds. Each Major Fund is presented individually, with all Non-major Funds summarized and presented only in a single column. Subordinate schedules present the detail of these Non-major funds. Major Funds present the major activities of the City for the year, and may change from year to year as a result of changes in the pattern of City’s activities. Fund Financial Statements include governmental, enterprise and internal service funds as discussed below.
8
CITY OF SOUTH SAN FRANCISCO MANAGEMENT’S DISCUSSION AND ANALYSIS
Required Supplementary Information Governmental Fund Financial Statements are prepared on the modified accrual basis, which mean they measure only current financial resources and uses. Capital assets and other long-lived assets, along with long-term liabilities, are not presented in the Governmental Fund Financial Statements. Enterprise and Internal Service Fund financial statements are prepared on the full accrual basis and include all their assets, liabilities and deferred outflows/inflows of resources, current and long-term. Since the City’s Internal Service Funds provide goods and services only to the City’s governmental and business-type activities, their activities are reported only in total at the Fund level. Internal Service Funds may not be Major Funds because their revenues are derived from other City Funds. These revenues are eliminated in the citywide financial statements and any related profits or losses are returned to the activities which created them, along with any residual net position of the Internal Service Funds. Comparisons of Budget and Actual financial information are required in the Basic Financial Statements only for the General Fund and other Major Funds that are Special Revenue Funds. Fiduciary Statements The City is the agent for certain assessment districts, holding amounts collected from property owners which await transfer to these Districts’ bond trustees. The City’s fiduciary activities are reported in the separate Statement of Fiduciary Net Position and the Statement of Changes in Fiduciary Net Position. These activities are excluded from the City’s other financial statements because the City cannot use these assets to finance its own operations. FINANCIAL ACTIVITIES OF THE CITY AS A WHOLE The following analyses focus on the net position and changes in the City’s Governmental Activities (Tables 1 through 3 and Chart 1) and Business-type Activities (Tables 4 and 5), which are presented in the City-wide Statement of Net Position and Statement of Activities. The comparative results for FY 2019-20 are presented against FY 2018-19. Governmental Activities Net position may serve over time as a useful indicator of the City’s financial condition. Table 1 below shows that total assets deferred outflows of resources exceed the total liabilities and deferred inflows of resources as of June 30, 2020 for governmental activities:
9
CITY OF SOUTH SAN FRANCISCO MANAGEMENT’S DISCUSSION AND ANALYSIS
Required Supplementary Information Governmental Net Position
Table 1 Governmental Net Position at June 30
(In Millions)
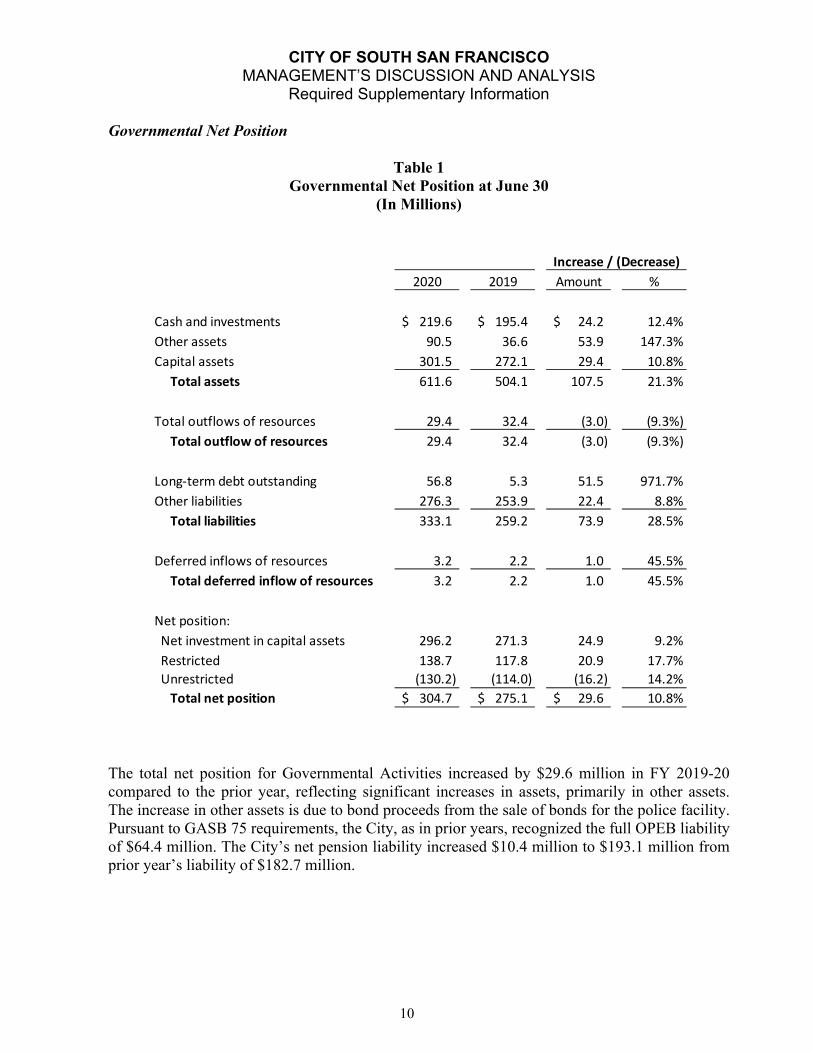
The total net position for Governmental Activities increased by $29.6 million in FY 2019-20 compared to the prior year, reflecting significant increases in assets, primarily in other assets. The increase in other assets is due to bond proceeds from the sale of bonds for the police facility. Pursuant to GASB 75 requirements, the City, as in prior years, recognized the full OPEB liability of $64.4 million. The City’s net pension liability increased $10.4 million to $193.1 million from prior year’s liability of $182.7 million.
Increase / (Decrease)
2020 2019 Amount %
Cash and investments 219.6$ 195.4$ 24.2$ 12.4%
Other assets 90.5 36.6 53.9 147.3%
Capital assets 301.5 272.1 29.4 10.8%
Total assets 611.6 504.1 107.5 21.3%
Total outflows of resources 29.4 32.4 (3.0) (9.3%)
Total outflow of resources 29.4 32.4 (3.0) (9.3%)
Long‐term debt outstanding 56.8 5.3 51.5 971.7%
Other liabilities 276.3 253.9 22.4 8.8%
Total liabilities 333.1 259.2 73.9 28.5%
Deferred inflows of resources 3.2 2.2 1.0 45.5%
Total deferred inflow of resources 3.2 2.2 1.0 45.5%
Net position:
Net investment in capital assets 296.2 271.3 24.9 9.2%
Restricted 138.7 117.8 20.9 17.7%
Unrestricted (130.2) (114.0) (16.2) 14.2%
Total net position 304.7$ 275.1$ 29.6$ 10.8%
10
CITY OF SOUTH SAN FRANCISCO MANAGEMENT’S DISCUSSION AND ANALYSIS
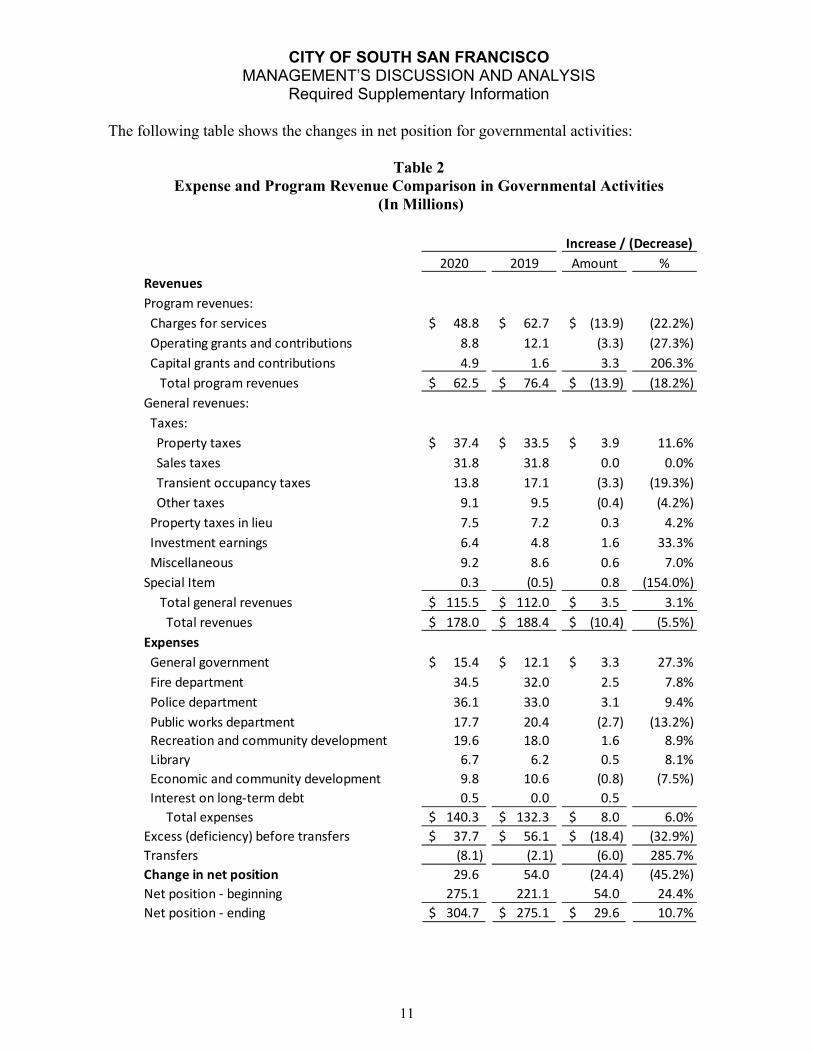
Required Supplementary Information The following table shows the changes in net position for governmental activities:
Table 2 Expense and Program Revenue Comparison in Governmental Activities
(In Millions)
Increase / (Decrease)
2020 2019 Amount %
Revenues
Program revenues:
Charges for services 48.8$ 62.7$ (13.9)$ (22.2%)
Operating grants and contributions 8.8 12.1 (3.3) (27.3%)
Capital grants and contributions 4.9 1.6 3.3 206.3%
Total program revenues 62.5$ 76.4$ (13.9)$ (18.2%)
General revenues:
Taxes:
Property taxes 37.4$ 33.5$ 3.9$ 11.6%
Sales taxes 31.8 31.8 0.0 0.0%
Transient occupancy taxes 13.8 17.1 (3.3) (19.3%)
Other taxes 9.1 9.5 (0.4) (4.2%)
Property taxes in lieu 7.5 7.2 0.3 4.2%
Investment earnings 6.4 4.8 1.6 33.3%
Miscellaneous 9.2 8.6 0.6 7.0%
Special Item 0.3 (0.5) 0.8 (154.0%)
Total general revenues 115.5$ 112.0$ 3.5$ 3.1%
Total revenues 178.0$ 188.4$ (10.4)$ (5.5%)
Expenses
General government 15.4$ 12.1$ 3.3$ 27.3%
Fire department 34.5 32.0 2.5 7.8%
Police department 36.1 33.0 3.1 9.4%
Public works department 17.7 20.4 (2.7) (13.2%)
Recreation and community development 19.6 18.0 1.6 8.9%
Library 6.7 6.2 0.5 8.1%
Economic and community development 9.8 10.6 (0.8) (7.5%)
Interest on long‐term debt 0.5 0.0 0.5
Total expenses 140.3$ 132.3$ 8.0$ 6.0%
Excess (deficiency) before transfers 37.7$ 56.1$ (18.4)$ (32.9%)
Transfers (8.1) (2.1) (6.0) 285.7%
Change in net position 29.6 54.0 (24.4) (45.2%)
Net position ‐ beginning 275.1 221.1 54.0 24.4%
Net position ‐ ending 304.7$ 275.1$ 29.6$ 10.7%
11
CITY OF SOUTH SAN FRANCISCO MANAGEMENT’S DISCUSSION AND ANALYSIS
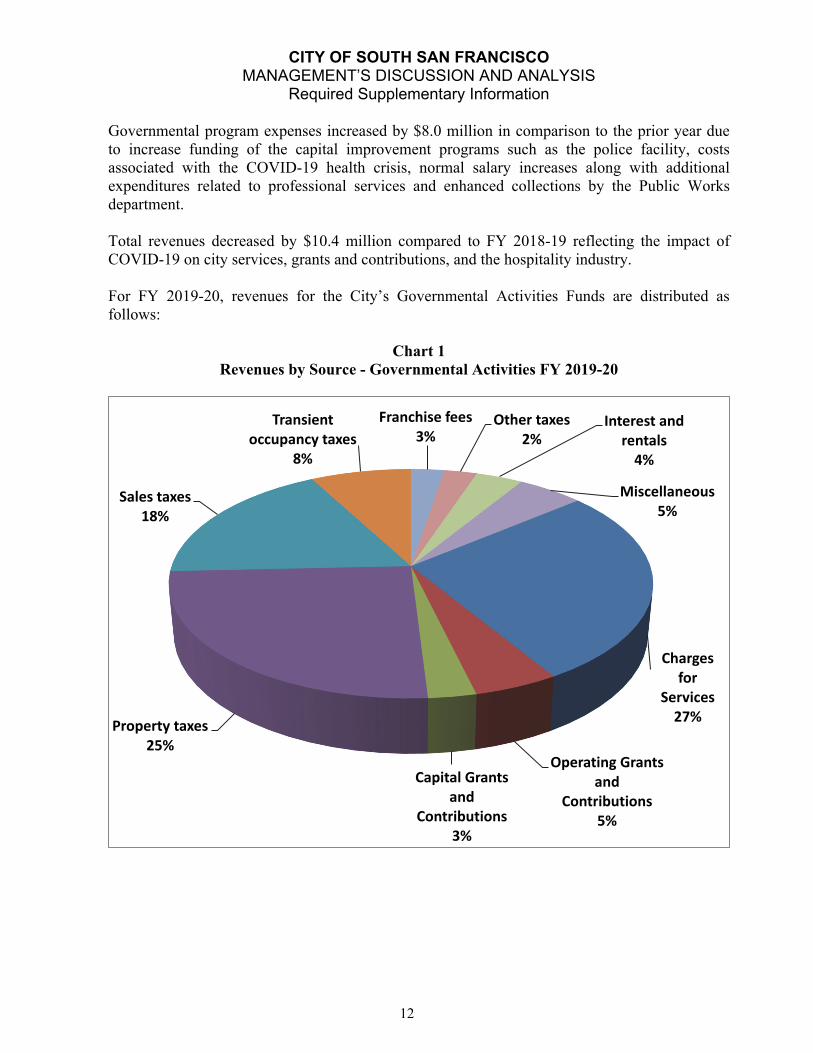
Required Supplementary Information Governmental program expenses increased by $8.0 million in comparison to the prior year due to increase funding of the capital improvement programs such as the police facility, costs associated with the COVID-19 health crisis, normal salary increases along with additional expenditures related to professional services and enhanced collections by the Public Works department. Total revenues decreased by $10.4 million compared to FY 2018-19 reflecting the impact of COVID-19 on city services, grants and contributions, and the hospitality industry. For FY 2019-20, revenues for the City’s Governmental Activities Funds are distributed as follows:
Chart 1 Revenues by Source - Governmental Activities FY 2019-20
Charges for
Services27%
Operating Grants and
Contributions5%
Capital Grants and
Contributions3%
Property taxes25%
Sales taxes18%
Transient occupancy taxes
8%
Franchise fees3%
Other taxes2%
Interest and rentals4%
Miscellaneous5%
12
CITY OF SOUTH SAN FRANCISCO MANAGEMENT’S DISCUSSION AND ANALYSIS
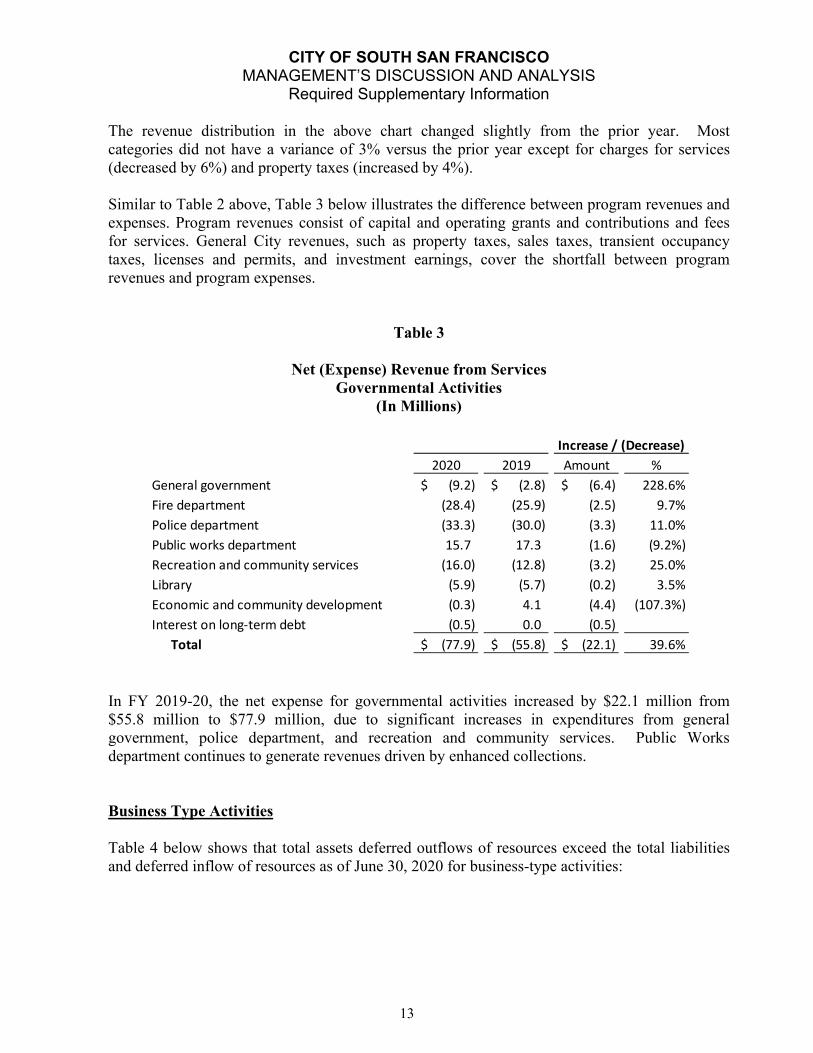
Required Supplementary Information The revenue distribution in the above chart changed slightly from the prior year. Most categories did not have a variance of 3% versus the prior year except for charges for services (decreased by 6%) and property taxes (increased by 4%). Similar to Table 2 above, Table 3 below illustrates the difference between program revenues and expenses. Program revenues consist of capital and operating grants and contributions and fees for services. General City revenues, such as property taxes, sales taxes, transient occupancy taxes, licenses and permits, and investment earnings, cover the shortfall between program revenues and program expenses.
Table 3
Net (Expense) Revenue from Services Governmental Activities
(In Millions)
In FY 2019-20, the net expense for governmental activities increased by $22.1 million from $55.8 million to $77.9 million, due to significant increases in expenditures from general government, police department, and recreation and community services. Public Works department continues to generate revenues driven by enhanced collections. Business Type Activities Table 4 below shows that total assets deferred outflows of resources exceed the total liabilities and deferred inflow of resources as of June 30, 2020 for business-type activities:
Increase / (Decrease)
2020 2019 Amount %
General government (9.2)$ (2.8)$ (6.4)$ 228.6%
Fire department (28.4) (25.9) (2.5) 9.7%
Police department (33.3) (30.0) (3.3) 11.0%
Public works department 15.7 17.3 (1.6) (9.2%)
Recreation and community services (16.0) (12.8) (3.2) 25.0%
Library (5.9) (5.7) (0.2) 3.5%
Economic and community development (0.3) 4.1 (4.4) (107.3%)
Interest on long‐term debt (0.5) 0.0 (0.5)
Total (77.9)$ (55.8)$ (22.1)$ 39.6%
13
CITY OF SOUTH SAN FRANCISCO MANAGEMENT’S DISCUSSION AND ANALYSIS
Required Supplementary Information
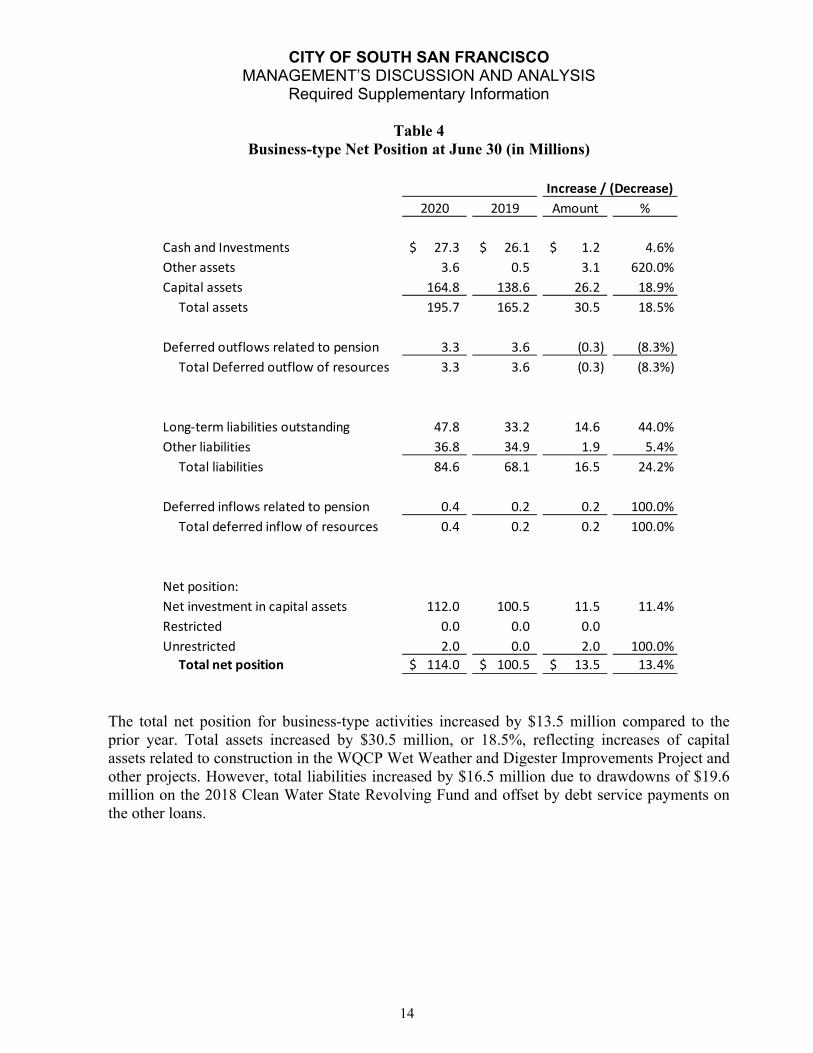
Table 4 Business-type Net Position at June 30 (in Millions)
The total net position for business-type activities increased by $13.5 million compared to the prior year. Total assets increased by $30.5 million, or 18.5%, reflecting increases of capital assets related to construction in the WQCP Wet Weather and Digester Improvements Project and other projects. However, total liabilities increased by $16.5 million due to drawdowns of $19.6 million on the 2018 Clean Water State Revolving Fund and offset by debt service payments on the other loans.
Increase / (Decrease)
2020 2019 Amount %
Cash and Investments 27.3$ 26.1$ 1.2$ 4.6%
Other assets 3.6 0.5 3.1 620.0%
Capital assets 164.8 138.6 26.2 18.9%
Total assets 195.7 165.2 30.5 18.5%
Deferred outflows related to pension 3.3 3.6 (0.3) (8.3%)
Total Deferred outflow of resources 3.3 3.6 (0.3) (8.3%)
Long‐term liabilities outstanding 47.8 33.2 14.6 44.0%
Other liabilities 36.8 34.9 1.9 5.4%
Total liabilities 84.6 68.1 16.5 24.2%
Deferred inflows related to pension 0.4 0.2 0.2 100.0%
Total deferred inflow of resources 0.4 0.2 0.2 100.0%
Net position:
Net investment in capital assets 112.0 100.5 11.5 11.4%
Restricted 0.0 0.0 0.0
Unrestricted 2.0 0.0 2.0 100.0%
Total net position 114.0$ 100.5$ 13.5$ 13.4%
14
CITY OF SOUTH SAN FRANCISCO MANAGEMENT’S DISCUSSION AND ANALYSIS
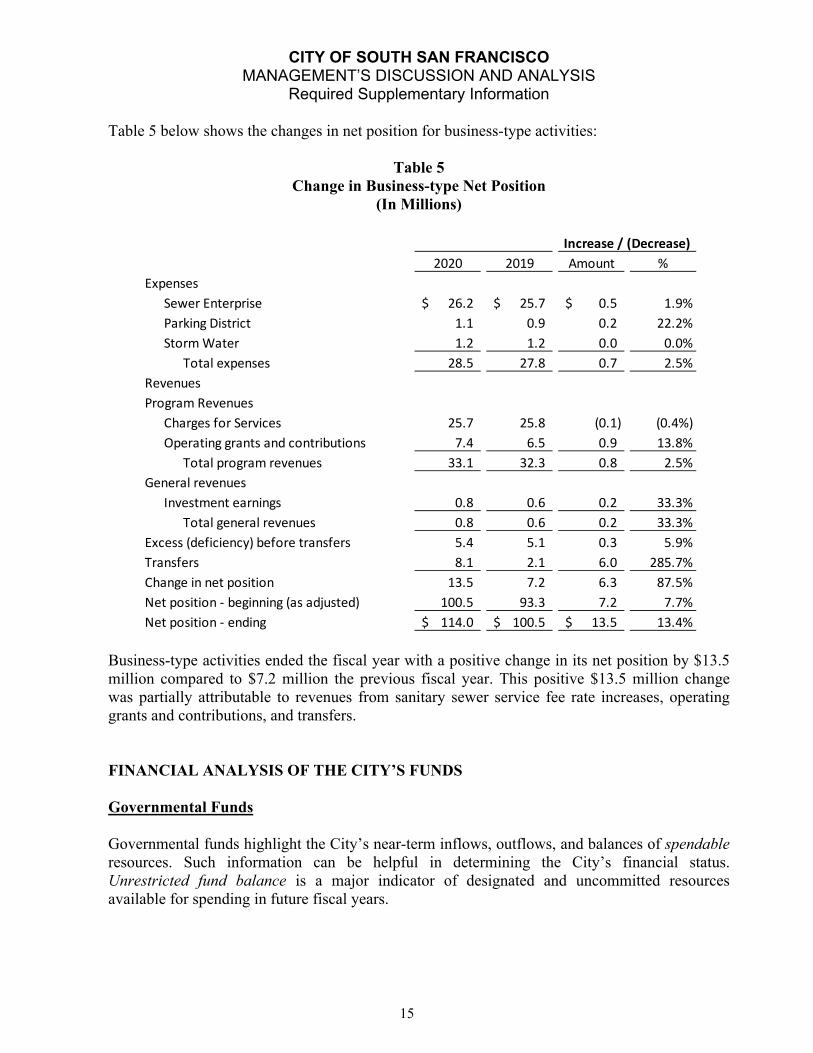
Required Supplementary Information Table 5 below shows the changes in net position for business-type activities:
Table 5 Change in Business-type Net Position
(In Millions)
Business-type activities ended the fiscal year with a positive change in its net position by $13.5 million compared to $7.2 million the previous fiscal year. This positive $13.5 million change was partially attributable to revenues from sanitary sewer service fee rate increases, operating grants and contributions, and transfers. FINANCIAL ANALYSIS OF THE CITY’S FUNDS Governmental Funds Governmental funds highlight the City’s near-term inflows, outflows, and balances of spendable resources. Such information can be helpful in determining the City’s financial status. Unrestricted fund balance is a major indicator of designated and uncommitted resources available for spending in future fiscal years.
Increase / (Decrease)
2020 2019 Amount %
Expenses
Sewer Enterprise 26.2$ 25.7$ 0.5$ 1.9%
Parking District 1.1 0.9 0.2 22.2%
Storm Water 1.2 1.2 0.0 0.0%
Total expenses 28.5 27.8 0.7 2.5%
Revenues
Program Revenues
Charges for Services 25.7 25.8 (0.1) (0.4%)
Operating grants and contributions 7.4 6.5 0.9 13.8%
Total program revenues 33.1 32.3 0.8 2.5%
General revenues
Investment earnings 0.8 0.6 0.2 33.3%
Total general revenues 0.8 0.6 0.2 33.3%
Excess (deficiency) before transfers 5.4 5.1 0.3 5.9%
Transfers 8.1 2.1 6.0 285.7%
Change in net position 13.5 7.2 6.3 87.5%
Net position ‐ beginning (as adjusted) 100.5 93.3 7.2 7.7%
Net position ‐ ending 114.0$ 100.5$ 13.5$ 13.4%
15
CITY OF SOUTH SAN FRANCISCO MANAGEMENT’S DISCUSSION AND ANALYSIS
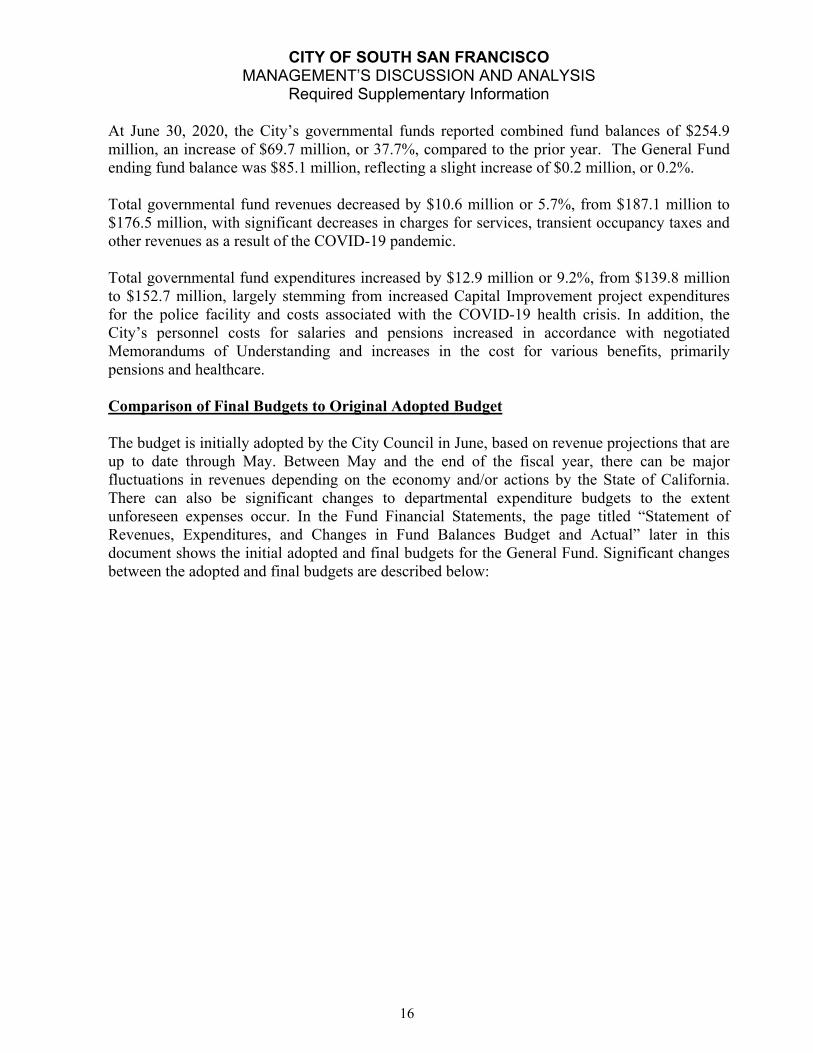
Required Supplementary Information At June 30, 2020, the City’s governmental funds reported combined fund balances of $254.9 million, an increase of $69.7 million, or 37.7%, compared to the prior year. The General Fund ending fund balance was $85.1 million, reflecting a slight increase of $0.2 million, or 0.2%. Total governmental fund revenues decreased by $10.6 million or 5.7%, from $187.1 million to $176.5 million, with significant decreases in charges for services, transient occupancy taxes and other revenues as a result of the COVID-19 pandemic. Total governmental fund expenditures increased by $12.9 million or 9.2%, from $139.8 million to $152.7 million, largely stemming from increased Capital Improvement project expenditures for the police facility and costs associated with the COVID-19 health crisis. In addition, the City’s personnel costs for salaries and pensions increased in accordance with negotiated Memorandums of Understanding and increases in the cost for various benefits, primarily pensions and healthcare. Comparison of Final Budgets to Original Adopted Budget The budget is initially adopted by the City Council in June, based on revenue projections that are up to date through May. Between May and the end of the fiscal year, there can be major fluctuations in revenues depending on the economy and/or actions by the State of California. There can also be significant changes to departmental expenditure budgets to the extent unforeseen expenses occur. In the Fund Financial Statements, the page titled “Statement of Revenues, Expenditures, and Changes in Fund Balances Budget and Actual” later in this document shows the initial adopted and final budgets for the General Fund. Significant changes between the adopted and final budgets are described below:
16
CITY OF SOUTH SAN FRANCISCO MANAGEMENT’S DISCUSSION AND ANALYSIS
Required Supplementary Information
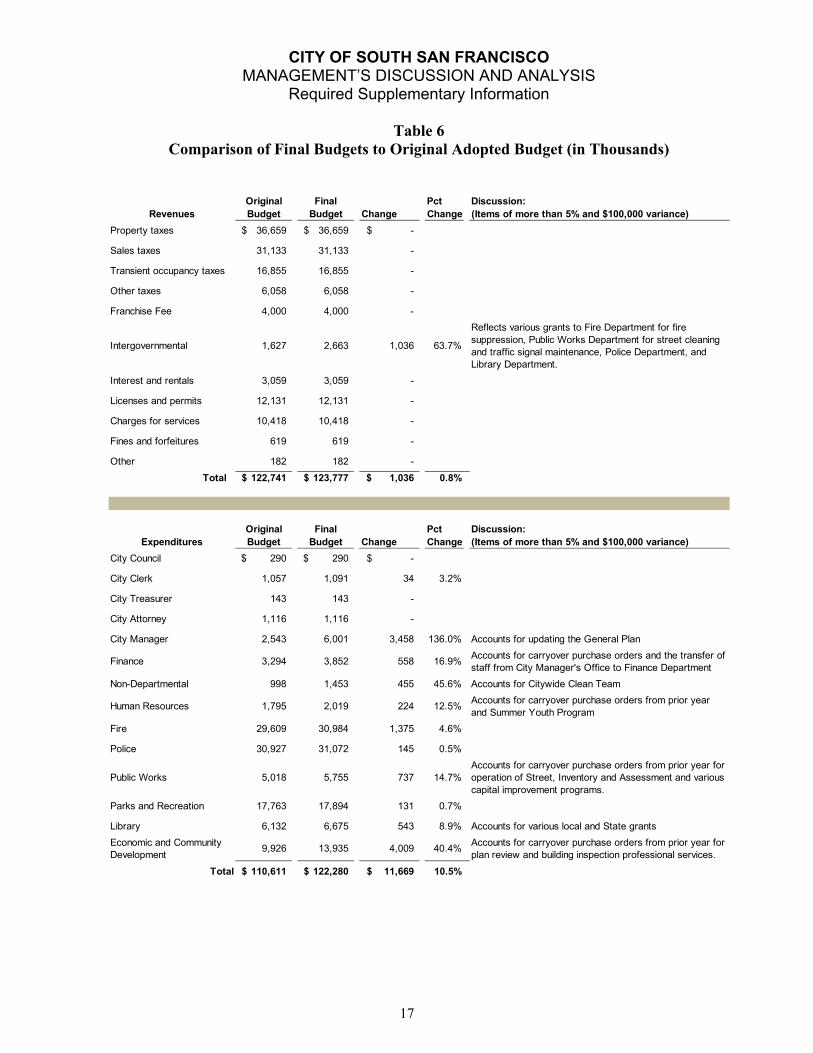
Table 6 Comparison of Final Budgets to Original Adopted Budget (in Thousands)
Original Final Pct Discussion:Revenues Budget Budget Change Change (Items of more than 5% and $100,000 variance)
Property taxes 36,659$ 36,659$ -$
Sales taxes 31,133 31,133 -
Transient occupancy taxes 16,855 16,855 -
Other taxes 6,058 6,058 -
Franchise Fee 4,000 4,000 -
Intergovernmental 1,627 2,663 1,036 63.7%
Reflects various grants to Fire Department for fire suppression, Public Works Department for street cleaning and traffic signal maintenance, Police Department, and Library Department.
Interest and rentals 3,059 3,059 -
Licenses and permits 12,131 12,131 -
Charges for services 10,418 10,418 -
Fines and forfeitures 619 619 -
Other 182 182 -
Total 122,741$ 123,777$ 1,036$ 0.8%
Original Final Pct Discussion:Expenditures Budget Budget Change Change (Items of more than 5% and $100,000 variance)
City Council 290$ 290$ -$
City Clerk 1,057 1,091 34 3.2%
City Treasurer 143 143 -
City Attorney 1,116 1,116 -
City Manager 2,543 6,001 3,458 136.0% Accounts for updating the General Plan
Finance 3,294 3,852 558 16.9%Accounts for carryover purchase orders and the transfer of staff from City Manager's Office to Finance Department
Non-Departmental 998 1,453 455 45.6% Accounts for Citywide Clean Team
Human Resources 1,795 2,019 224 12.5%Accounts for carryover purchase orders from prior year and Summer Youth Program
Fire 29,609 30,984 1,375 4.6%
Police 30,927 31,072 145 0.5%
Public Works 5,018 5,755 737 14.7%Accounts for carryover purchase orders from prior year for operation of Street, Inventory and Assessment and various capital improvement programs.
Parks and Recreation 17,763 17,894 131 0.7%
Library 6,132 6,675 543 8.9% Accounts for various local and State grants
Economic and Community Development
9,926 13,935 4,009 40.4%Accounts for carryover purchase orders from prior year for plan review and building inspection professional services.
Total 110,611$ 122,280$ 11,669$ 10.5%
17
CITY OF SOUTH SAN FRANCISCO MANAGEMENT’S DISCUSSION AND ANALYSIS
Required Supplementary Information Analysis of Major Governmental Funds General Fund Revenues. In FY 2019-20, total General Fund revenues, excluding transfers in, were $130.9 million, which was $4.9 million, or 3.9% over the final amended budget. Total General Fund expenditures, excluding transfers out, ended FY 2019-20 at $107.7 million. Overall, including transfers, the General Fund ended FY 2019-20 with a surplus of $0.2 million, predominantly due to the items discussed below. Property tax collections in FY 2019-20 was $42.8 million, which was $6.2 million or 16.9% over budget. This was mainly due to higher than expected increases in assessed values and new properties added to the tax roll. Sales tax revenues, including Measure W, was $31.6 million, which was $0.4 million or 1.4% over budget. Last year, sales tax receipts were 9.9% over budget. Transient occupancy taxes came in at $13.8 million, which was $3.0 million or 18.0% below budget. Demand for travel and lodging throughout the area fell significantly after March 2020 due to the COVID-19 pandemic. Licenses and permits revenues were $15.9 million, which was $3.8 million or 31.1% over budget, setting an all-time record for a fiscal year. The strong demand for licenses and permits were primarily attributable to non-residential and bio-tech development in the East of 101 area and high density residential development in the downtown area. Charges for services was $10.0 million, which was $0.4 million or 4.2% below budget, due to the reduction in city services resulting from the Shelter-in-Place order. Expenditures. General Fund expenditures, excluding transfers out, were $8.9 million, or 7.3% under the final amended budget. Higher than expected expenditures for the City Manager’s Office is due to professional services related to updating the City’s General Plan and the Public Works Department as a result of additional capital improvement projects. Compared to the prior year, General Fund expenditures decreased from $114.4 million to $113.4 million, driven by expenditure “savings” as a result of staff vacancies in multiple departments, available state and local grants, and reduced city services due to the COVID-19 pandemic. As of June 30, 2020, the General Fund total fund balance was $85.1 million, which included $17.7 million in committed reserves, $18.4 million in restricted reserves, and $43.3 million in unassigned reserves. The unassigned reserves are designated by the City Council based on the City’s Reserves Policy, which follows best practices from the Government Finance Officers’ Association (GFOA) of between 15-20 percent of General Fund operating revenue. Within the City’s unassigned reserves, the City Council designated funds for economic contingencies, potential catastrophe and budget contingencies.
18
CITY OF SOUTH SAN FRANCISCO MANAGEMENT’S DISCUSSION AND ANALYSIS
Required Supplementary Information City Housing Fund Up until Redevelopment Agencies were abolished in FY 2011-12 by the State of California under ABX1 26, the City set aside 20% of Redevelopment property taxes to fund the provision of new affordable housing units, as well as the operation and maintenance of housing stock that the Redevelopment Agency had already funded. That fund was formerly called the Low/Moderate Income Housing Fund. With its source of funding (20% of Redevelopment property tax dollars) abolished, the City Council voted to take on the operations of the former housing units by becoming the Housing Successor Agency, with activities funded primarily from the rental revenues received by the City for those City-owned occupied housing units. Any shortfall between the rents received and the operations and maintenance costs of those housing units are funded by either one time grants or by the General Fund. Any fund balances will be held for future housing property maintenance needs. As of June 30, 2020, the fund balance was $6 million. In FY 2019-20, the City Housing Fund received for $0.3 million in revenues. The fund had $0.3 million in expenses, the majority of which was for administrative staff costs to support the City’s Housing Division. Capital Improvement Fund The City consolidates and reports its governmental fund-type capital project expenditures in this fund. Resources consist of transfers from the General Fund, major and non-major funds, developer impact fees, and gasoline taxes and transportation sales taxes from non-major governmental funds. Resources also come from federal, state, and local grants, contributions from other cities, utilities and private developers. Entire capital projects are appropriated in one-year, but expended over multiple years, with unspent appropriations carried forward year-to-year until completion. Developer Impact Fees To ensure developers pay their fair share of the impact on the City’s capital and infrastructure, the City imposes impact fees on new developments. In FY 2019-20, South San Francisco experienced a robust development environment that accounted for significant collection of developer impact fees and interest earned including $1.5 million in East of 101 Sewer Impact Fees for upgrades at Pump Station #2 and #14, $5.1 million in East of 101 Traffic Impact Fees for Adaptive Traffic Control System, South Airport Bridge Replacement, Traffic Improvements, and other various projects, $0.7 million in Child Care Impact Fees for the construction of a new preschool facility, and $1.2 million in Oyster Point Improvement Impact Fees to repay a loan from the South San Francisco Successor Agency.
19
CITY OF SOUTH SAN FRANCISCO MANAGEMENT’S DISCUSSION AND ANALYSIS
Required Supplementary Information Other Governmental Funds Presented as a group in the Basic Financial Statements, these funds are individually presented as Supplementary Information. Enterprise Funds Sewer Enterprise Fund The Sewer Enterprise fund reported operating income (before non-operating revenues and operating transfers) of $5.6 million in FY 2019-20. Operating revenues increased $1.3 million or 4.3% from $29.9 million to $31.2 million. Operating expenses increased $0.6 million or 2.8% from $24.9 million to $25.5 million, reflecting the impact of increases in employee compensation along with slight increases in normal expenditures like professional services and supplies. Parking District Fund In FY 2019-20, the Parking District fund reported an operating loss (before non-operating revenues and operating transfers) of $0.2 million compared to an operating income of $0.3 million last year. Operating revenues decreased by $0.2 million or 19.0% from $1.2 million to $1.0 million, primarily due to loss revenues from parking meters as a result of the Shelter-in-Place order. Operating expenses increased by $0.2 million or 24.9% from $0.9 million to $1.1 million due to higher personnel cost and professional services expenditures. Storm Water Fund The Storm Water Fund is used to account for resources needed to fund storm drain and storm infrastructure operations, maintenance, capital replacement, and compliance with various federal and state regulations regarding storm water runoff. Revenues totaled $0.4 million, primarily from a levy on property owners. Transfers in totaled $1.1 million, primarily comprised of $0.3 million from the General Fund and $0.8 million from non-major governmental funds. Expenses totaled $1.2 million, which was flat from prior year. Net position increased $0.9 million or 20% from $4.5 million to $5.4 million. CAPITAL ASSETS Generally accepted accounting principles require the City to add infrastructure to its reportable capital assets. Infrastructure includes streets, drainage systems, and traffic control and safety devices. The City has successfully reported on the depreciated value of all such assets acquired or built since 1980. The City reports the depreciated book value of other types of capital assets such as buildings, land, equipment and furniture, on the City-wide Statement of Net Position. Such information is summarized below and is more completely detailed in Note 3 to the Basic Financial Statements. The City depreciates all its capital assets, except land and construction in progress.
20
CITY OF SOUTH SAN FRANCISCO MANAGEMENT’S DISCUSSION AND ANALYSIS
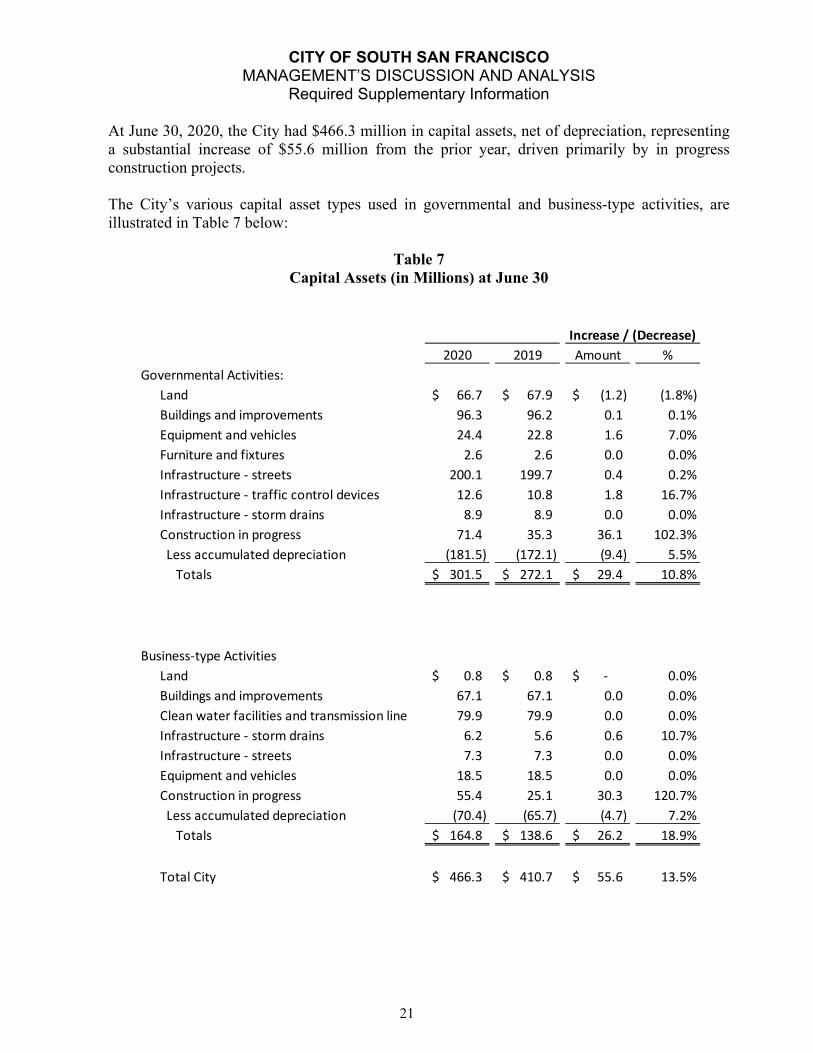
Required Supplementary Information At June 30, 2020, the City had $466.3 million in capital assets, net of depreciation, representing a substantial increase of $55.6 million from the prior year, driven primarily by in progress construction projects. The City’s various capital asset types used in governmental and business-type activities, are illustrated in Table 7 below:
Table 7 Capital Assets (in Millions) at June 30
Increase / (Decrease)
2020 2019 Amount %
Governmental Activities:
Land 66.7$ 67.9$ (1.2)$ (1.8%)
Buildings and improvements 96.3 96.2 0.1 0.1%
Equipment and vehicles 24.4 22.8 1.6 7.0%
Furniture and fixtures 2.6 2.6 0.0 0.0%
Infrastructure ‐ streets 200.1 199.7 0.4 0.2%
Infrastructure ‐ traffic control devices 12.6 10.8 1.8 16.7%
Infrastructure ‐ storm drains 8.9 8.9 0.0 0.0%
Construction in progress 71.4 35.3 36.1 102.3%
Less accumulated depreciation (181.5) (172.1) (9.4) 5.5%
Totals 301.5$ 272.1$ 29.4$ 10.8%
Business‐type Activities
Land 0.8$ 0.8$ ‐$ 0.0%
Buildings and improvements 67.1 67.1 0.0 0.0%
Clean water facilities and transmission line 79.9 79.9 0.0 0.0%
Infrastructure ‐ storm drains 6.2 5.6 0.6 10.7%
Infrastructure ‐ streets 7.3 7.3 0.0 0.0%
Equipment and vehicles 18.5 18.5 0.0 0.0%
Construction in progress 55.4 25.1 30.3 120.7%
Less accumulated depreciation (70.4) (65.7) (4.7) 7.2%
Totals 164.8$ 138.6$ 26.2$ 18.9%
Total City 466.3$ 410.7$ 55.6$ 13.5%
21
CITY OF SOUTH SAN FRANCISCO MANAGEMENT’S DISCUSSION AND ANALYSIS
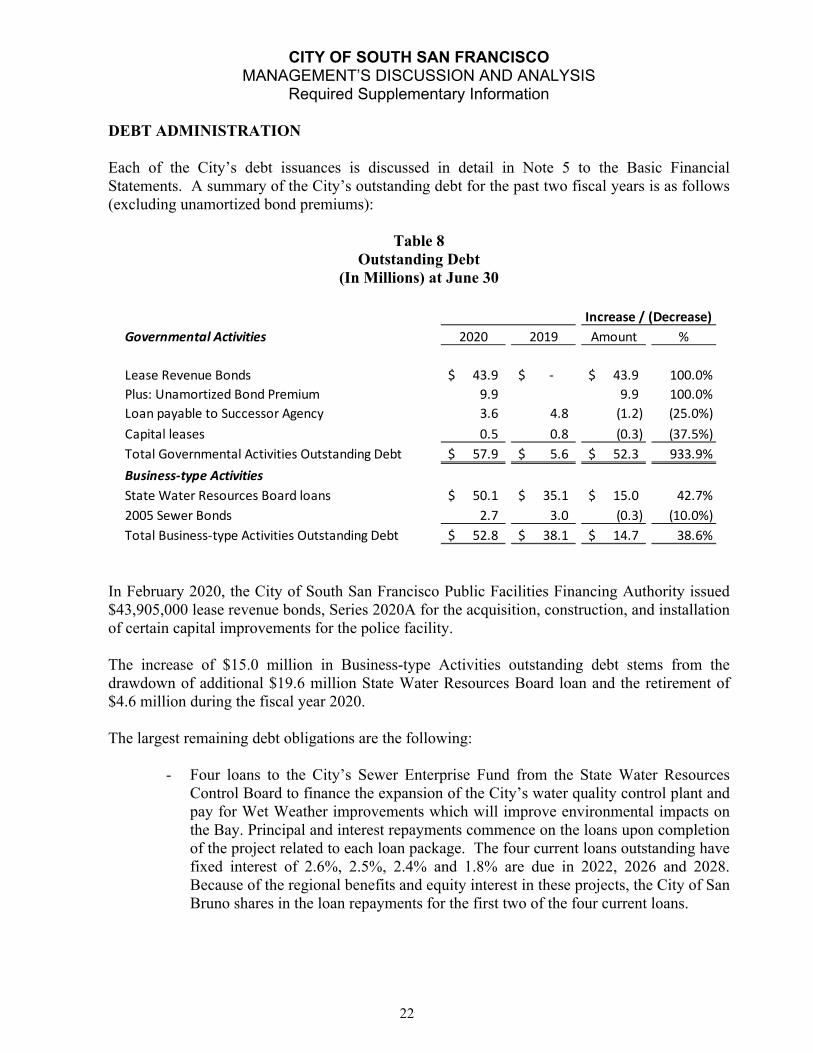
Required Supplementary Information DEBT ADMINISTRATION Each of the City’s debt issuances is discussed in detail in Note 5 to the Basic Financial Statements. A summary of the City’s outstanding debt for the past two fiscal years is as follows (excluding unamortized bond premiums):
Table 8 Outstanding Debt
(In Millions) at June 30
In February 2020, the City of South San Francisco Public Facilities Financing Authority issued $43,905,000 lease revenue bonds, Series 2020A for the acquisition, construction, and installation of certain capital improvements for the police facility. The increase of $15.0 million in Business-type Activities outstanding debt stems from the drawdown of additional $19.6 million State Water Resources Board loan and the retirement of $4.6 million during the fiscal year 2020. The largest remaining debt obligations are the following:
- Four loans to the City’s Sewer Enterprise Fund from the State Water Resources Control Board to finance the expansion of the City’s water quality control plant and pay for Wet Weather improvements which will improve environmental impacts on the Bay. Principal and interest repayments commence on the loans upon completion of the project related to each loan package. The four current loans outstanding have fixed interest of 2.6%, 2.5%, 2.4% and 1.8% are due in 2022, 2026 and 2028. Because of the regional benefits and equity interest in these projects, the City of San Bruno shares in the loan repayments for the first two of the four current loans.
Increase / (Decrease)
Governmental Activities 2020 2019 Amount %
Lease Revenue Bonds 43.9$ ‐$ 43.9$ 100.0%
Plus: Unamortized Bond Premium 9.9 9.9 100.0%
Loan payable to Successor Agency 3.6 4.8 (1.2) (25.0%)
Capital leases 0.5 0.8 (0.3) (37.5%)
Total Governmental Activities Outstanding Debt 57.9$ 5.6$ 52.3$ 933.9%
Business‐type Activities
State Water Resources Board loans 50.1$ 35.1$ 15.0$ 42.7%
2005 Sewer Bonds 2.7 3.0 (0.3) (10.0%)
Total Business‐type Activities Outstanding Debt 52.8$ 38.1$ 14.7$ 38.6%
22
CITY OF SOUTH SAN FRANCISCO MANAGEMENT’S DISCUSSION AND ANALYSIS
Required Supplementary Information ECONOMIC OUTLOOK AND MAJOR ACCOMPLISHMENTS The economic outlook and major accomplishments of the City are discussed in the accompanying Transmittal Letter. CONTACTING THE CITY’S FINANCIAL MANAGEMENT This Comprehensive Annual Financial Report is intended to provide readers with a general overview of the City’s finances. Questions about this report or requests for additional financial information should be directed to the City of South San Francisco Finance Department, P.O. Box 711, South San Francisco, CA 94083, and phone (650) 877-8512. The City’s website is at www.ssf.net.
23

This Page Left Intentionally Blank
CITY OF SOUTH SAN FRANCISCO
STATEMENT OF NET POSITION AND STATEMENT OF ACTIVITIES
The Statement of Net Position and the Statement of Activities summarize the entire City’s financial activities and financial position.
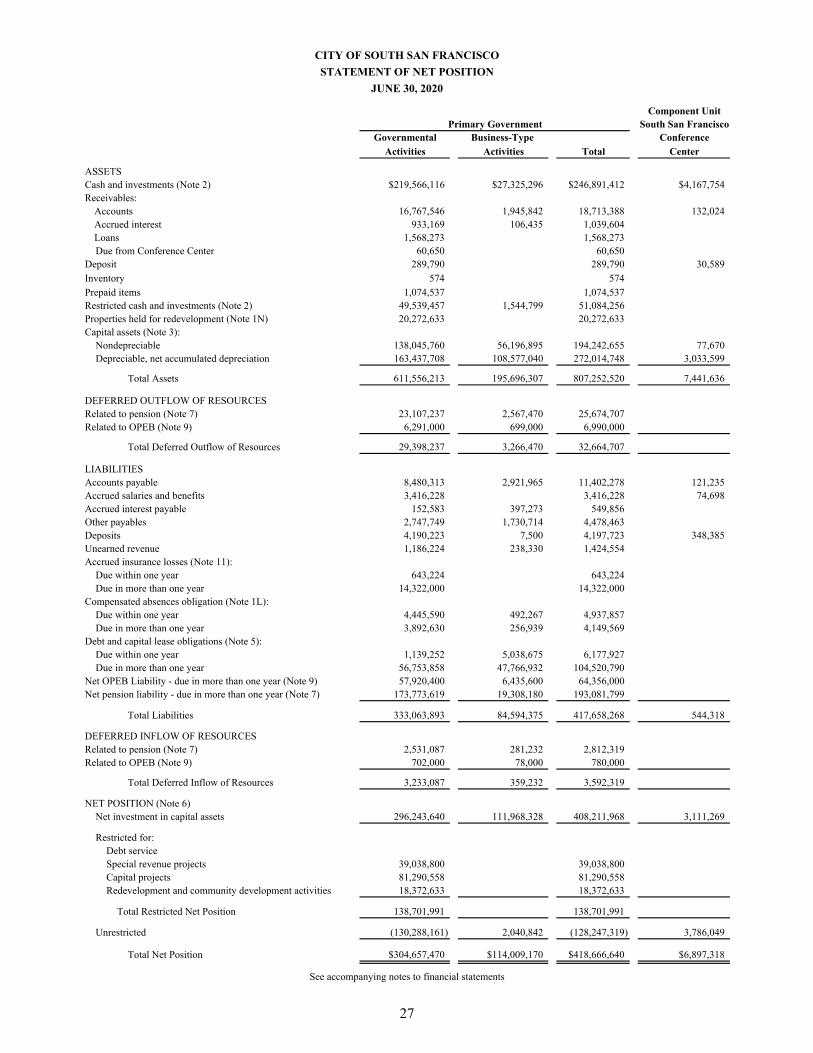
The Statement of Net Position reports the excess of the City’s total assets and deferred outflows of resources over the City’s total liabilities and deferred inflows of resources, including all the City’s capital assets and all its long-term debt. The Statement of Net Position focuses the reader on the composition of the City’s net position, by subtracting total liabilities and deferred inflows of resources from total assets and deferred outflows of resources.
The Statement of Net Position summarizes the financial position of all the City’s Governmental Activities in a single column, and the financial position of all the City’s Business-Type Activities in a single column; these columns are followed by a total column which presents the financial position of the entire City.
The City’s Governmental Activities include the activities of its General Fund, along with all its Special Revenue, Capital Projects and Debt Service Funds. Since the City’s Internal Service Funds service these Funds, their activities are consolidated with Governmental Activities, after eliminating inter-fund transactions and balances. The City’s Business Type Activities include all its Enterprise Fund activities.
The Statement of Activities reports increases and decreases in the City’s net position. It is also prepared on the full accrual basis, which means it includes all the City’s revenues and all its expenses, regardless of when cash changes hands. This differs from the “modified accrual” basis used in the Fund financial statements, which reflect only current assets, current liabilities, available revenues and measurable expenditures.
The Statement of Activities presents the City’s expenses first, listed by program, and follow these with the expenses of its business-type activities. Program revenues—that is, revenues which are generated directly by these programs—are then deducted from program expenses to arrive at the net expense of each governmental and business-type program. The City’s general revenues are then listed in the Governmental Activities or Business-type Activities column, as appropriate, and the Change in Net Position is computed and reconciled with the Statement of Net Position.
Both these Statements include the financial activities of the City, the City of South San Francisco Capital Improvements Financing Authority, the Parking Authority of the City of South San Francisco and the City of South San Francisco Public Facilities Financing Authority that are legally separate but are component units of the City because they are controlled by the City, which is financially accountable for the activities. Data for the South San Francisco Conference Center Authority is reflected as a discretely presented component unit of the City. This data is presented separately from other funds of the City to reflect operations under control of a governing body with a voting majority which is different from the City Council.
25
This Page Left Intentionally Blank
Component UnitPrimary Government South San Francisco
Governmental Business-Type Conference
Activities Activities Total Center
ASSETSCash and investments (Note 2) $219,566,116 $27,325,296 $246,891,412 $4,167,754Receivables:
Accounts 16,767,546 1,945,842 18,713,388 132,024Accrued interest 933,169 106,435 1,039,604Loans 1,568,273 1,568,273Due from Conference Center 60,650 60,650
Deposit 289,790 289,790 30,589
Inventory 574 574
Prepaid items 1,074,537 1,074,537Restricted cash and investments (Note 2) 49,539,457 1,544,799 51,084,256Properties held for redevelopment (Note 1N) 20,272,633 20,272,633Capital assets (Note 3):
Nondepreciable 138,045,760 56,196,895 194,242,655 77,670Depreciable, net accumulated depreciation 163,437,708 108,577,040 272,014,748 3,033,599
Total Assets 611,556,213 195,696,307 807,252,520 7,441,636
DEFERRED OUTFLOW OF RESOURCESRelated to pension (Note 7) 23,107,237 2,567,470 25,674,707Related to OPEB (Note 9) 6,291,000 699,000 6,990,000
Total Deferred Outflow of Resources 29,398,237 3,266,470 32,664,707
LIABILITIESAccounts payable 8,480,313 2,921,965 11,402,278 121,235Accrued salaries and benefits 3,416,228 3,416,228 74,698Accrued interest payable 152,583 397,273 549,856Other payables 2,747,749 1,730,714 4,478,463Deposits 4,190,223 7,500 4,197,723 348,385Unearned revenue 1,186,224 238,330 1,424,554Accrued insurance losses (Note 11):
Due within one year 643,224 643,224Due in more than one year 14,322,000 14,322,000
Compensated absences obligation (Note 1L):Due within one year 4,445,590 492,267 4,937,857Due in more than one year 3,892,630 256,939 4,149,569
Debt and capital lease obligations (Note 5):Due within one year 1,139,252 5,038,675 6,177,927Due in more than one year 56,753,858 47,766,932 104,520,790
Net OPEB Liability - due in more than one year (Note 9) 57,920,400 6,435,600 64,356,000Net pension liability - due in more than one year (Note 7) 173,773,619 19,308,180 193,081,799
Total Liabilities 333,063,893 84,594,375 417,658,268 544,318
DEFERRED INFLOW OF RESOURCESRelated to pension (Note 7) 2,531,087 281,232 2,812,319Related to OPEB (Note 9) 702,000 78,000 780,000
Total Deferred Inflow of Resources 3,233,087 359,232 3,592,319
NET POSITION (Note 6)Net investment in capital assets 296,243,640 111,968,328 408,211,968 3,111,269
Restricted for:Debt serviceSpecial revenue projects 39,038,800 39,038,800Capital projects 81,290,558 81,290,558Redevelopment and community development activities 18,372,633 18,372,633
Total Restricted Net Position 138,701,991 138,701,991
Unrestricted (130,288,161) 2,040,842 (128,247,319) 3,786,049
Total Net Position $304,657,470 $114,009,170 $418,666,640 $6,897,318
See accompanying notes to financial statements
CITY OF SOUTH SAN FRANCISCO
STATEMENT OF NET POSITION
JUNE 30, 2020
27
Operating CapitalCharges for Grants and Grants and
Functions/Programs Expenses Services Contributions ContributionsPrimary Government
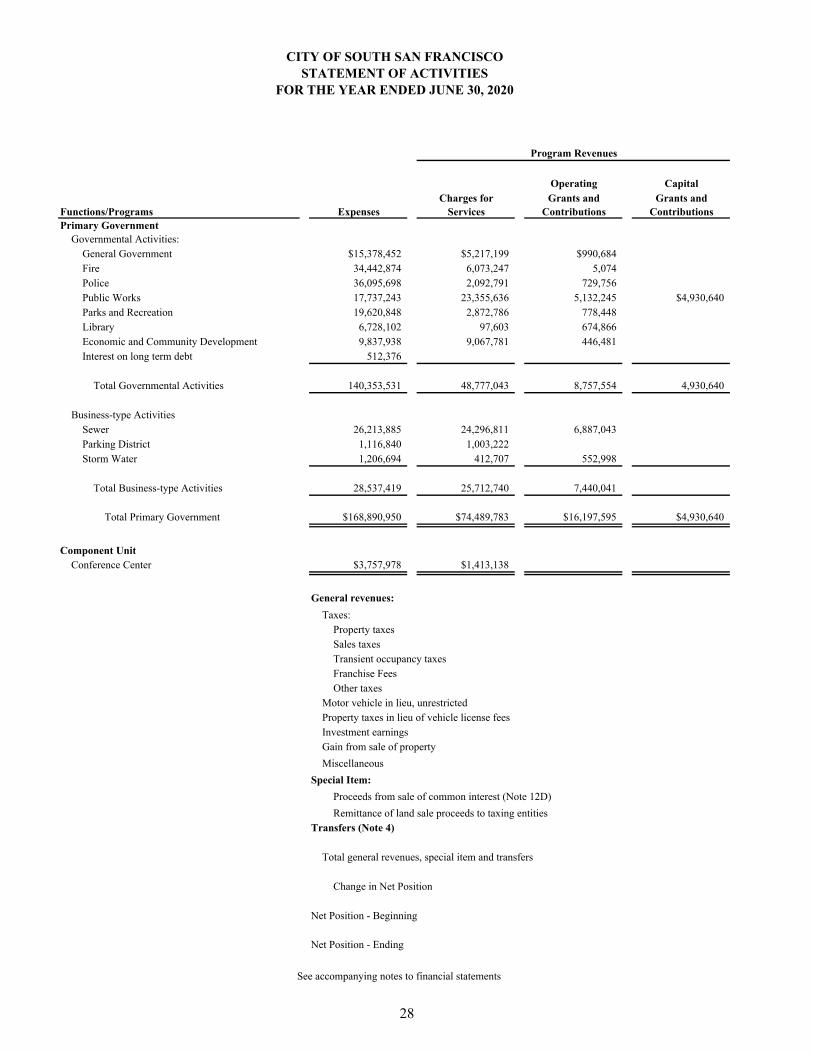
Governmental Activities:General Government $15,378,452 $5,217,199 $990,684Fire 34,442,874 6,073,247 5,074Police 36,095,698 2,092,791 729,756Public Works 17,737,243 23,355,636 5,132,245 $4,930,640Parks and Recreation 19,620,848 2,872,786 778,448Library 6,728,102 97,603 674,866Economic and Community Development 9,837,938 9,067,781 446,481Interest on long term debt 512,376
Total Governmental Activities 140,353,531 48,777,043 8,757,554 4,930,640
Business-type ActivitiesSewer 26,213,885 24,296,811 6,887,043Parking District 1,116,840 1,003,222Storm Water 1,206,694 412,707 552,998
Total Business-type Activities 28,537,419 25,712,740 7,440,041
Total Primary Government $168,890,950 $74,489,783 $16,197,595 $4,930,640
Component UnitConference Center $3,757,978 $1,413,138
General revenues:
Taxes:Property taxesSales taxesTransient occupancy taxesFranchise FeesOther taxes
Motor vehicle in lieu, unrestrictedProperty taxes in lieu of vehicle license feesInvestment earningsGain from sale of property
Miscellaneous
Special Item:
Proceeds from sale of common interest (Note 12D)
Remittance of land sale proceeds to taxing entitiesTransfers (Note 4)
Total general revenues, special item and transfers
Change in Net Position
Net Position - Beginning
Net Position - Ending
See accompanying notes to financial statements
CITY OF SOUTH SAN FRANCISCOSTATEMENT OF ACTIVITIES
FOR THE YEAR ENDED JUNE 30, 2020
Program Revenues
28
Component UnitSouth
San FranciscoGovernmental Business-Type Conference
Activities Activities Total Center
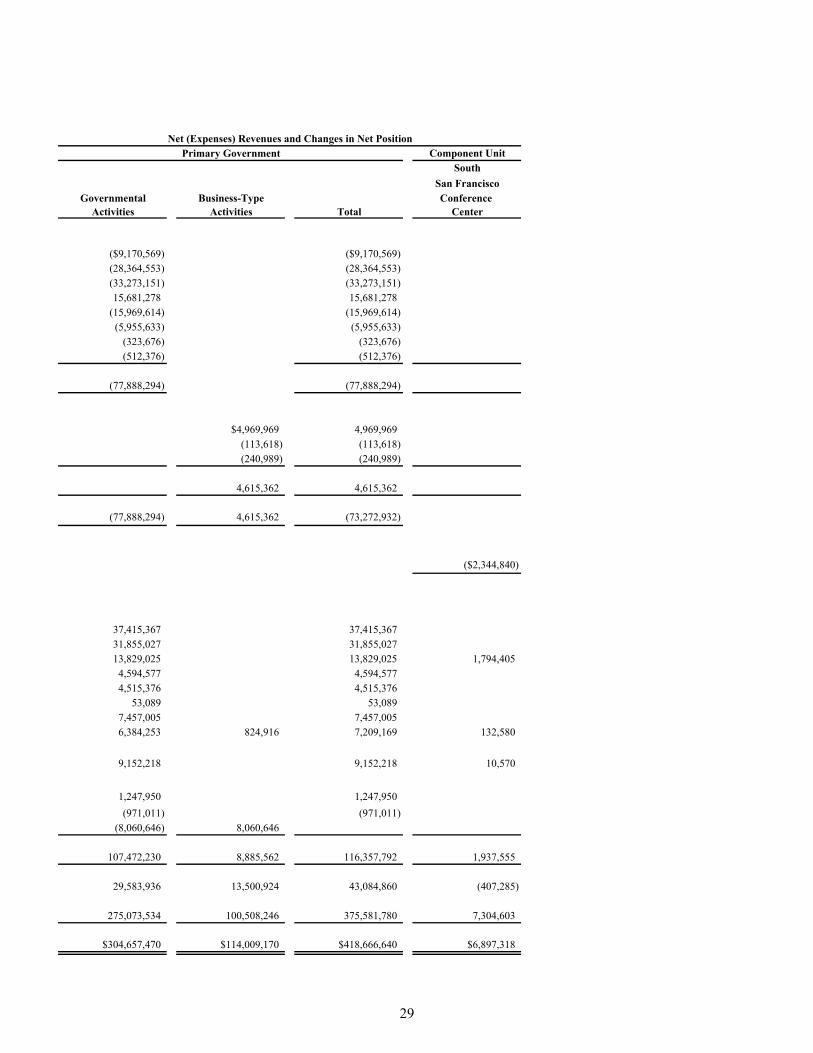
($9,170,569) ($9,170,569)(28,364,553) (28,364,553)(33,273,151) (33,273,151)15,681,278 15,681,278
(15,969,614) (15,969,614)(5,955,633) (5,955,633)
(323,676) (323,676)(512,376) (512,376)
(77,888,294) (77,888,294)
$4,969,969 4,969,969(113,618) (113,618)(240,989) (240,989)
4,615,362 4,615,362
(77,888,294) 4,615,362 (73,272,932)
($2,344,840)
37,415,367 37,415,36731,855,027 31,855,02713,829,025 13,829,025 1,794,405
4,594,577 4,594,5774,515,376 4,515,376
53,089 53,0897,457,005 7,457,0056,384,253 824,916 7,209,169 132,580
9,152,218 9,152,218 10,570
1,247,950 1,247,950
(971,011) (971,011)(8,060,646) 8,060,646
107,472,230 8,885,562 116,357,792 1,937,555
29,583,936 13,500,924 43,084,860 (407,285)
275,073,534 100,508,246 375,581,780 7,304,603
$304,657,470 $114,009,170 $418,666,640 $6,897,318
Primary GovernmentNet (Expenses) Revenues and Changes in Net Position
29

This Page Left Intentionally Blank
FUND FINANCIAL STATEMENTS
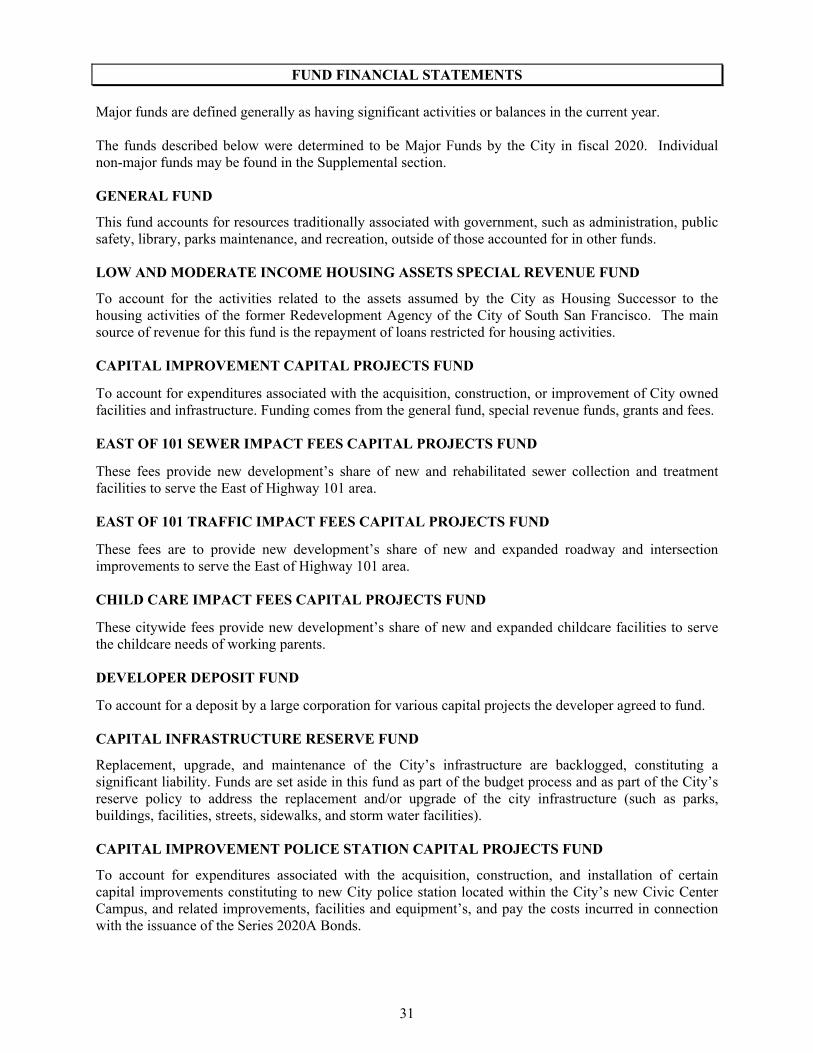
Major funds are defined generally as having significant activities or balances in the current year.
The funds described below were determined to be Major Funds by the City in fiscal 2020. Individual non-major funds may be found in the Supplemental section.
GENERAL FUND
This fund accounts for resources traditionally associated with government, such as administration, public safety, library, parks maintenance, and recreation, outside of those accounted for in other funds.
LOW AND MODERATE INCOME HOUSING ASSETS SPECIAL REVENUE FUND
To account for the activities related to the assets assumed by the City as Housing Successor to the housing activities of the former Redevelopment Agency of the City of South San Francisco. The main source of revenue for this fund is the repayment of loans restricted for housing activities.
CAPITAL IMPROVEMENT CAPITAL PROJECTS FUND
To account for expenditures associated with the acquisition, construction, or improvement of City owned facilities and infrastructure. Funding comes from the general fund, special revenue funds, grants and fees.
EAST OF 101 SEWER IMPACT FEES CAPITAL PROJECTS FUND
These fees provide new development’s share of new and rehabilitated sewer collection and treatment facilities to serve the East of Highway 101 area.
EAST OF 101 TRAFFIC IMPACT FEES CAPITAL PROJECTS FUND
These fees are to provide new development’s share of new and expanded roadway and intersection improvements to serve the East of Highway 101 area.
CHILD CARE IMPACT FEES CAPITAL PROJECTS FUND
These citywide fees provide new development’s share of new and expanded childcare facilities to serve the childcare needs of working parents.
DEVELOPER DEPOSIT FUND
To account for a deposit by a large corporation for various capital projects the developer agreed to fund.
CAPITAL INFRASTRUCTURE RESERVE FUND
Replacement, upgrade, and maintenance of the City’s infrastructure are backlogged, constituting a significant liability. Funds are set aside in this fund as part of the budget process and as part of the City’s reserve policy to address the replacement and/or upgrade of the city infrastructure (such as parks, buildings, facilities, streets, sidewalks, and storm water facilities).
CAPITAL IMPROVEMENT POLICE STATION CAPITAL PROJECTS FUND
To account for expenditures associated with the acquisition, construction, and installation of certain capital improvements constituting to new City police station located within the City’s new Civic Center Campus, and related improvements, facilities and equipment’s, and pay the costs incurred in connection with the issuance of the Series 2020A Bonds.
31
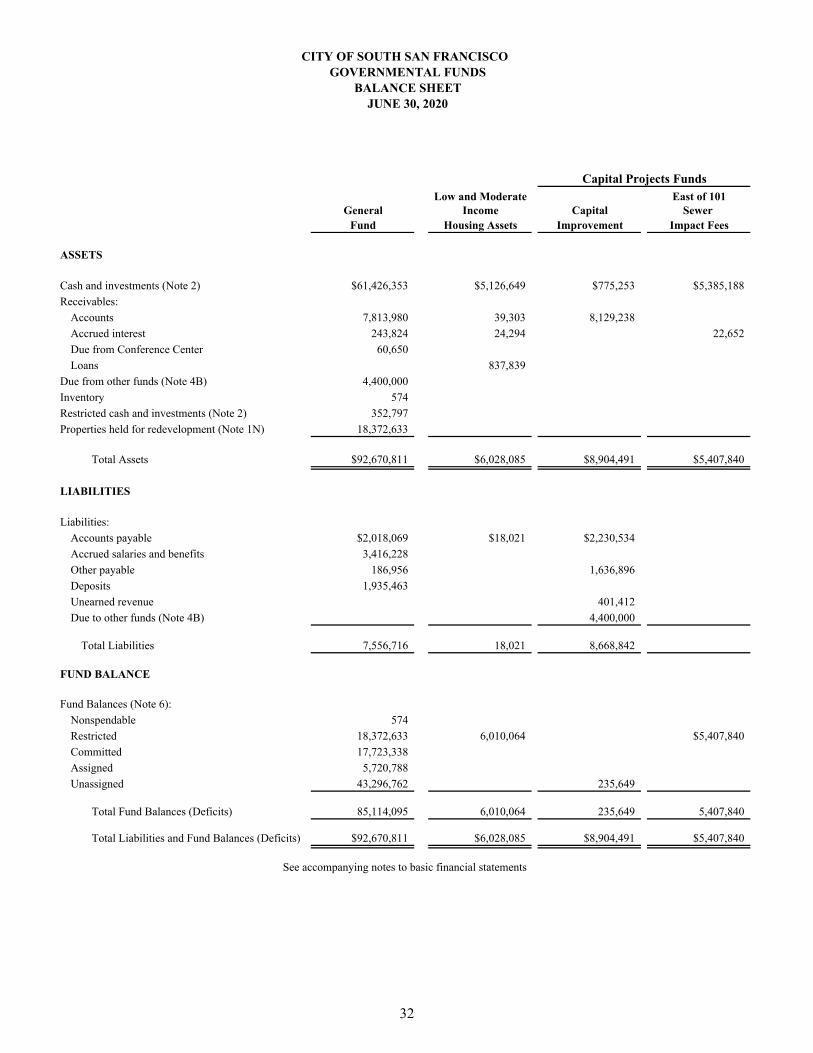
CITY OF SOUTH SAN FRANCISCOGOVERNMENTAL FUNDS
BALANCE SHEETJUNE 30, 2020
Capital Projects FundsLow and Moderate East of 101
General Income Capital Sewer Fund Housing Assets Improvement Impact Fees
ASSETS
Cash and investments (Note 2) $61,426,353 $5,126,649 $775,253 $5,385,188
Receivables:
Accounts 7,813,980 39,303 8,129,238
Accrued interest 243,824 24,294 22,652
Due from Conference Center 60,650
Loans 837,839
Due from other funds (Note 4B) 4,400,000
Inventory 574
Restricted cash and investments (Note 2) 352,797
Properties held for redevelopment (Note 1N) 18,372,633
Total Assets $92,670,811 $6,028,085 $8,904,491 $5,407,840
LIABILITIES
Liabilities:
Accounts payable $2,018,069 $18,021 $2,230,534
Accrued salaries and benefits 3,416,228
Other payable 186,956 1,636,896
Deposits 1,935,463
Unearned revenue 401,412
Due to other funds (Note 4B) 4,400,000
Total Liabilities 7,556,716 18,021 8,668,842
FUND BALANCE
Fund Balances (Note 6):
Nonspendable 574
Restricted 18,372,633 6,010,064 $5,407,840
Committed 17,723,338
Assigned 5,720,788
Unassigned 43,296,762 235,649
Total Fund Balances (Deficits) 85,114,095 6,010,064 235,649 5,407,840
Total Liabilities and Fund Balances (Deficits) $92,670,811 $6,028,085 $8,904,491 $5,407,840
See accompanying notes to basic financial statements
32
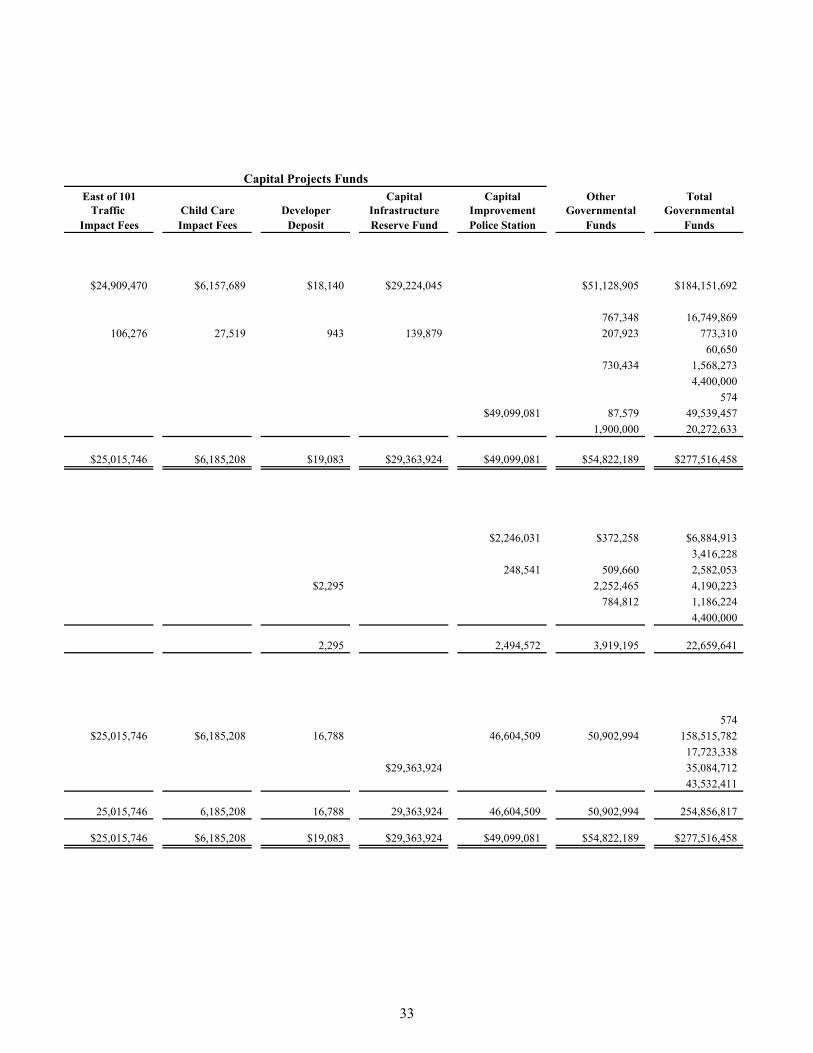
Capital Projects Funds East of 101 Capital Capital Other Total
Traffic Child Care Developer Infrastructure Improvement Governmental GovernmentalImpact Fees Impact Fees Deposit Reserve Fund Police Station Funds Funds
$24,909,470 $6,157,689 $18,140 $29,224,045 $51,128,905 $184,151,692
767,348 16,749,869
106,276 27,519 943 139,879 207,923 773,310
60,650
730,434 1,568,273
4,400,000
574
$49,099,081 87,579 49,539,457
1,900,000 20,272,633
$25,015,746 $6,185,208 $19,083 $29,363,924 $49,099,081 $54,822,189 $277,516,458
$2,246,031 $372,258 $6,884,913
3,416,228
248,541 509,660 2,582,053
$2,295 2,252,465 4,190,223
784,812 1,186,224
4,400,000
2,295 2,494,572 3,919,195 22,659,641
574
$25,015,746 $6,185,208 16,788 46,604,509 50,902,994 158,515,782
17,723,338
$29,363,924 35,084,712
43,532,411
25,015,746 6,185,208 16,788 29,363,924 46,604,509 50,902,994 254,856,817
$25,015,746 $6,185,208 $19,083 $29,363,924 $49,099,081 $54,822,189 $277,516,458
33
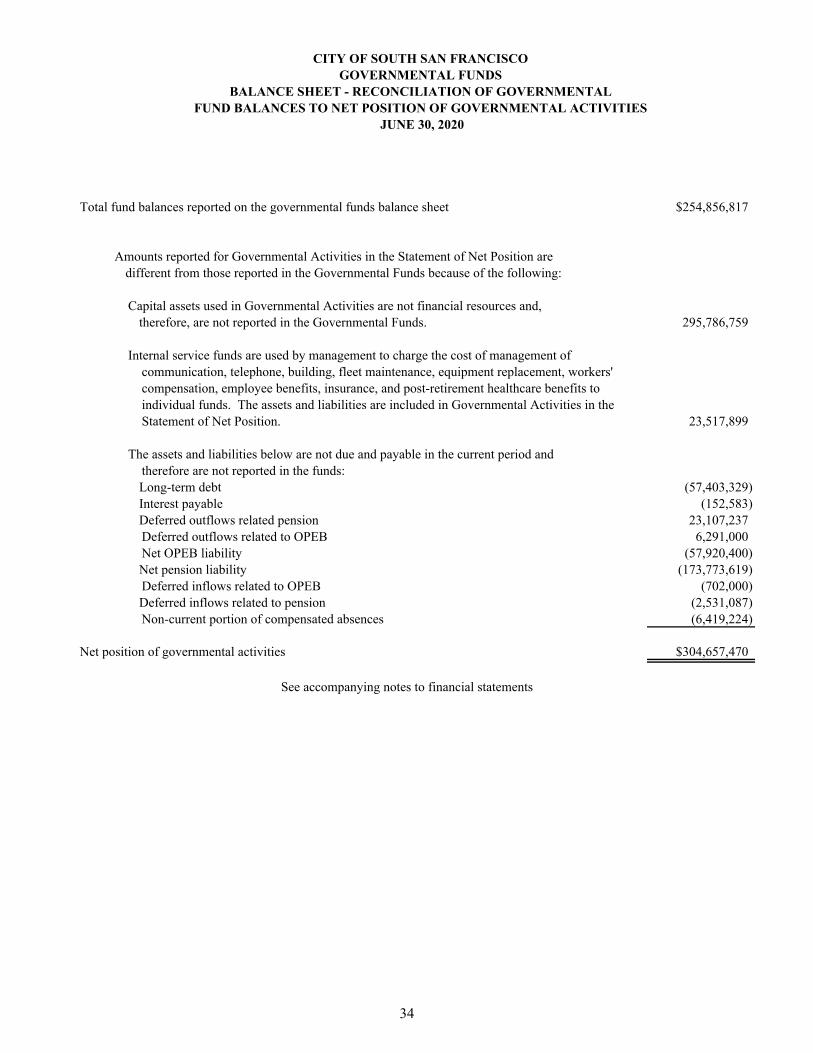
CITY OF SOUTH SAN FRANCISCOGOVERNMENTAL FUNDS
BALANCE SHEET - RECONCILIATION OF GOVERNMENTALFUND BALANCES TO NET POSITION OF GOVERNMENTAL ACTIVITIES
JUNE 30, 2020
Total fund balances reported on the governmental funds balance sheet $254,856,817
Amounts reported for Governmental Activities in the Statement of Net Position are different from those reported in the Governmental Funds because of the following:
Capital assets used in Governmental Activities are not financial resources and, therefore, are not reported in the Governmental Funds. 295,786,759
Internal service funds are used by management to charge the cost of management of communication, telephone, building, fleet maintenance, equipment replacement, workers' compensation, employee benefits, insurance, and post-retirement healthcare benefits to individual funds. The assets and liabilities are included in Governmental Activities in the Statement of Net Position. 23,517,899
The assets and liabilities below are not due and payable in the current period and therefore are not reported in the funds:Long-term debt (57,403,329)Interest payable (152,583)Deferred outflows related pension 23,107,237Deferred outflows related to OPEB 6,291,000Net OPEB liability (57,920,400)Net pension liability (173,773,619)Deferred inflows related to OPEB (702,000)Deferred inflows related to pension (2,531,087)Non-current portion of compensated absences (6,419,224)
Net position of governmental activities $304,657,470
See accompanying notes to financial statements
34

This Page Left Intentionally Blank
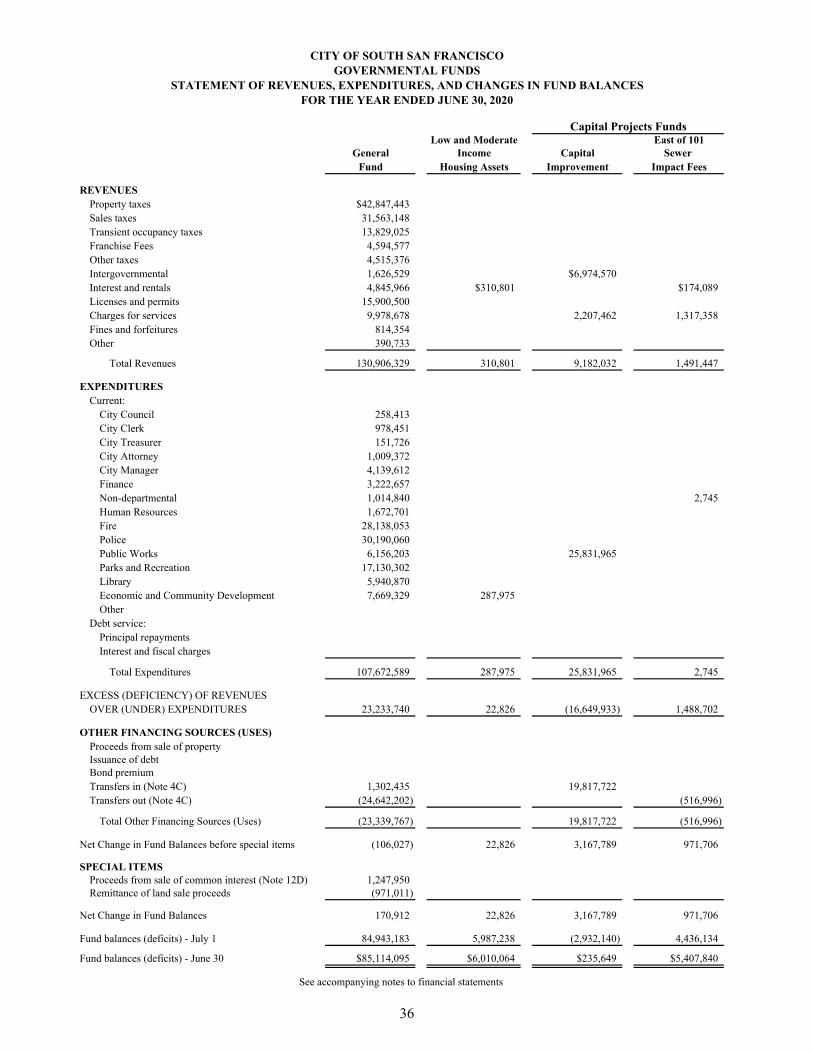
CITY OF SOUTH SAN FRANCISCOGOVERNMENTAL FUNDS
STATEMENT OF REVENUES, EXPENDITURES, AND CHANGES IN FUND BALANCESFOR THE YEAR ENDED JUNE 30, 2020
Low and Moderate East of 101General Income Capital Sewer
Fund Housing Assets Improvement Impact Fees
REVENUESProperty taxes $42,847,443Sales taxes 31,563,148Transient occupancy taxes 13,829,025Franchise Fees 4,594,577Other taxes 4,515,376Intergovernmental 1,626,529 $6,974,570Interest and rentals 4,845,966 $310,801 $174,089Licenses and permits 15,900,500Charges for services 9,978,678 2,207,462 1,317,358Fines and forfeitures 814,354Other 390,733
Total Revenues 130,906,329 310,801 9,182,032 1,491,447
EXPENDITURESCurrent:
City Council 258,413City Clerk 978,451City Treasurer 151,726City Attorney 1,009,372City Manager 4,139,612Finance 3,222,657Non-departmental 1,014,840 2,745Human Resources 1,672,701Fire 28,138,053Police 30,190,060Public Works 6,156,203 25,831,965Parks and Recreation 17,130,302Library 5,940,870Economic and Community Development 7,669,329 287,975Other
Debt service:Principal repaymentsInterest and fiscal charges
Total Expenditures 107,672,589 287,975 25,831,965 2,745
EXCESS (DEFICIENCY) OF REVENUES OVER (UNDER) EXPENDITURES 23,233,740 22,826 (16,649,933) 1,488,702
OTHER FINANCING SOURCES (USES)Proceeds from sale of propertyIssuance of debtBond premiumTransfers in (Note 4C) 1,302,435 19,817,722Transfers out (Note 4C) (24,642,202) (516,996)
Total Other Financing Sources (Uses) (23,339,767) 19,817,722 (516,996)
Net Change in Fund Balances before special items (106,027) 22,826 3,167,789 971,706
SPECIAL ITEMSProceeds from sale of common interest (Note 12D) 1,247,950Remittance of land sale proceeds (971,011)
Net Change in Fund Balances 170,912 22,826 3,167,789 971,706
Fund balances (deficits) - July 1 84,943,183 5,987,238 (2,932,140) 4,436,134
Fund balances (deficits) - June 30 $85,114,095 $6,010,064 $235,649 $5,407,840
See accompanying notes to financial statements
Capital Projects Funds
36
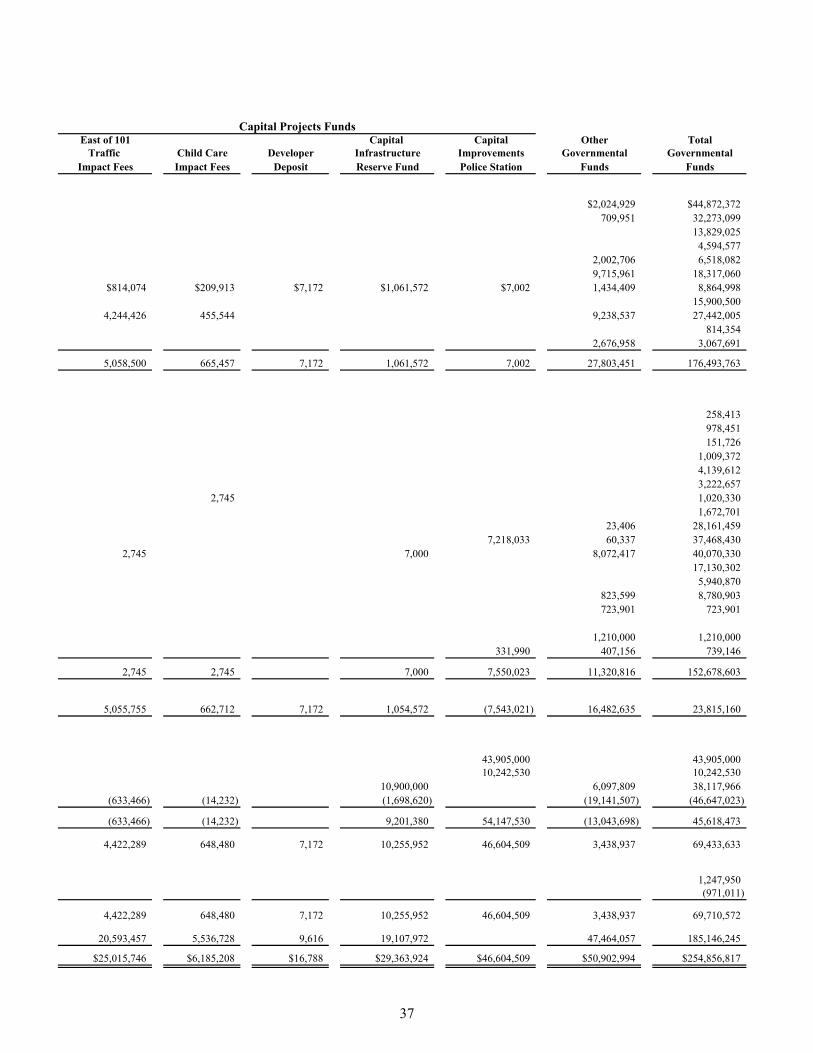
Capital Projects FundsEast of 101 Capital Capital Other Total
Traffic Child Care Developer Infrastructure Improvements Governmental GovernmentalImpact Fees Impact Fees Deposit Reserve Fund Police Station Funds Funds
$2,024,929 $44,872,372709,951 32,273,099
13,829,0254,594,577
2,002,706 6,518,0829,715,961 18,317,060
$814,074 $209,913 $7,172 $1,061,572 $7,002 1,434,409 8,864,99815,900,500
4,244,426 455,544 9,238,537 27,442,005814,354
2,676,958 3,067,691
5,058,500 665,457 7,172 1,061,572 7,002 27,803,451 176,493,763
258,413978,451151,726
1,009,3724,139,6123,222,657
2,745 1,020,3301,672,701
23,406 28,161,4597,218,033 60,337 37,468,430
2,745 7,000 8,072,417 40,070,33017,130,302
5,940,870823,599 8,780,903723,901 723,901
1,210,000 1,210,000331,990 407,156 739,146
2,745 2,745 7,000 7,550,023 11,320,816 152,678,603
5,055,755 662,712 7,172 1,054,572 (7,543,021) 16,482,635 23,815,160
43,905,000 43,905,00010,242,530 10,242,530
10,900,000 6,097,809 38,117,966(633,466) (14,232) (1,698,620) (19,141,507) (46,647,023)
(633,466) (14,232) 9,201,380 54,147,530 (13,043,698) 45,618,473
4,422,289 648,480 7,172 10,255,952 46,604,509 3,438,937 69,433,633
1,247,950(971,011)
4,422,289 648,480 7,172 10,255,952 46,604,509 3,438,937 69,710,572
20,593,457 5,536,728 9,616 19,107,972 47,464,057 185,146,245
$25,015,746 $6,185,208 $16,788 $29,363,924 $46,604,509 $50,902,994 $254,856,817
37
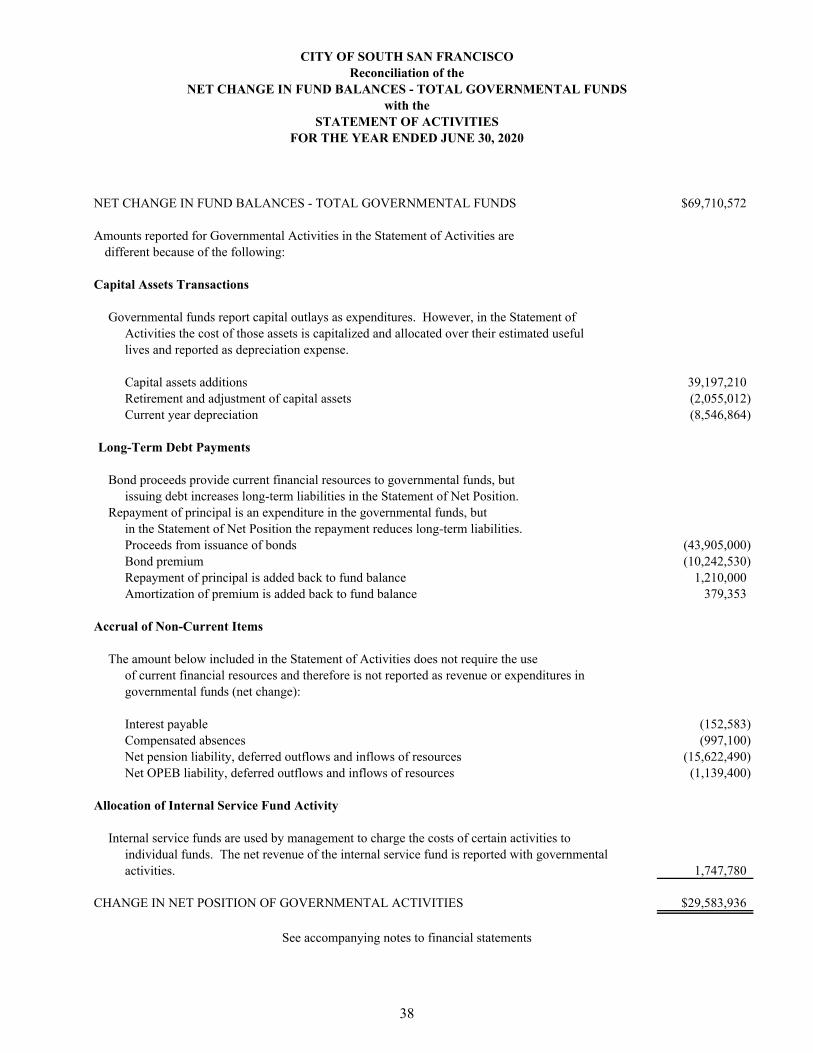
CITY OF SOUTH SAN FRANCISCOReconciliation of the
NET CHANGE IN FUND BALANCES - TOTAL GOVERNMENTAL FUNDSwith the
STATEMENT OF ACTIVITIESFOR THE YEAR ENDED JUNE 30, 2020
NET CHANGE IN FUND BALANCES - TOTAL GOVERNMENTAL FUNDS $69,710,572
Amounts reported for Governmental Activities in the Statement of Activities are different because of the following:
Capital Assets Transactions
Governmental funds report capital outlays as expenditures. However, in the Statement of Activities the cost of those assets is capitalized and allocated over their estimated useful lives and reported as depreciation expense.
Capital assets additions 39,197,210Retirement and adjustment of capital assets (2,055,012)Current year depreciation (8,546,864)
Long-Term Debt Payments
Bond proceeds provide current financial resources to governmental funds, butissuing debt increases long-term liabilities in the Statement of Net Position.
Repayment of principal is an expenditure in the governmental funds, butin the Statement of Net Position the repayment reduces long-term liabilities.Proceeds from issuance of bonds (43,905,000)Bond premium (10,242,530)Repayment of principal is added back to fund balance 1,210,000Amortization of premium is added back to fund balance 379,353
Accrual of Non-Current Items
of current financial resources and therefore is not reported as revenue or expenditures in governmental funds (net change):
Interest payable (152,583)Compensated absences (997,100)Net pension liability, deferred outflows and inflows of resources (15,622,490)Net OPEB liability, deferred outflows and inflows of resources (1,139,400)
Allocation of Internal Service Fund Activity
Internal service funds are used by management to charge the costs of certain activities to individual funds. The net revenue of the internal service fund is reported with governmental activities. 1,747,780
CHANGE IN NET POSITION OF GOVERNMENTAL ACTIVITIES $29,583,936
See accompanying notes to financial statements
The amount below included in the Statement of Activities does not require the use
38
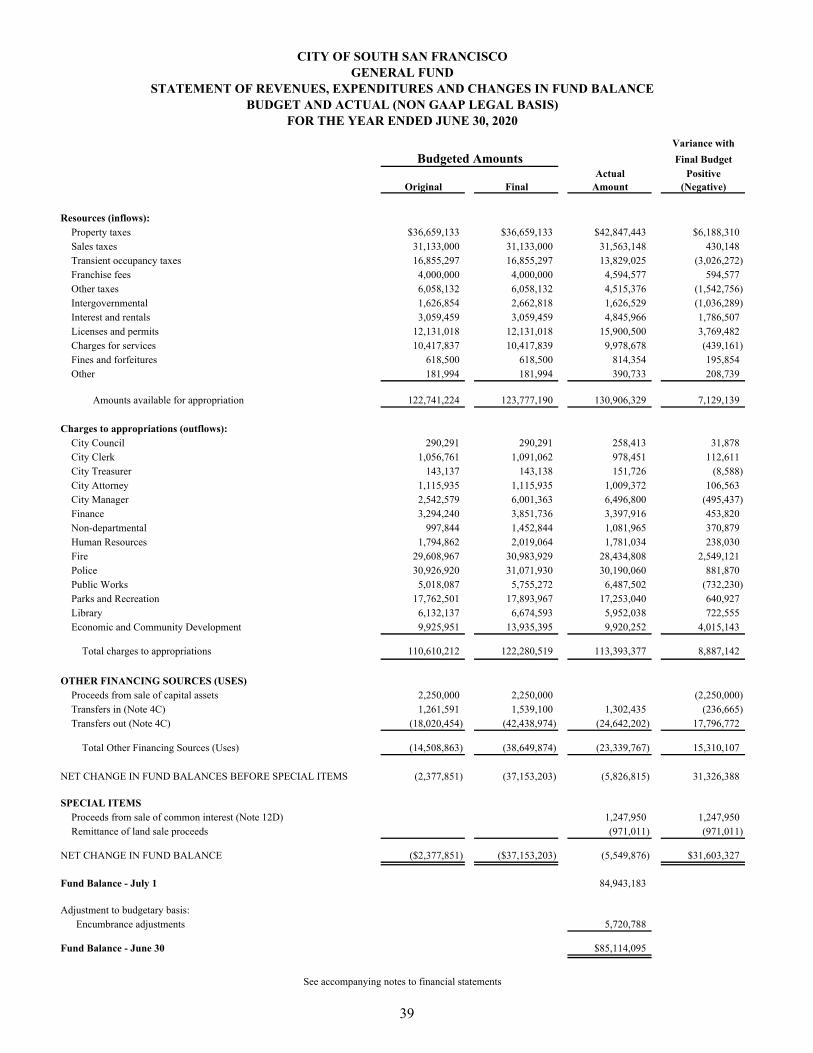
CITY OF SOUTH SAN FRANCISCOGENERAL FUND
STATEMENT OF REVENUES, EXPENDITURES AND CHANGES IN FUND BALANCEBUDGET AND ACTUAL (NON GAAP LEGAL BASIS)
FOR THE YEAR ENDED JUNE 30, 2020
Variance with
Final BudgetActual Positive
Original Final Amount (Negative)
Resources (inflows):Property taxes $36,659,133 $36,659,133 $42,847,443 $6,188,310Sales taxes 31,133,000 31,133,000 31,563,148 430,148Transient occupancy taxes 16,855,297 16,855,297 13,829,025 (3,026,272)Franchise fees 4,000,000 4,000,000 4,594,577 594,577Other taxes 6,058,132 6,058,132 4,515,376 (1,542,756)Intergovernmental 1,626,854 2,662,818 1,626,529 (1,036,289)Interest and rentals 3,059,459 3,059,459 4,845,966 1,786,507Licenses and permits 12,131,018 12,131,018 15,900,500 3,769,482Charges for services 10,417,837 10,417,839 9,978,678 (439,161)Fines and forfeitures 618,500 618,500 814,354 195,854Other 181,994 181,994 390,733 208,739
Amounts available for appropriation 122,741,224 123,777,190 130,906,329 7,129,139
Charges to appropriations (outflows):City Council 290,291 290,291 258,413 31,878City Clerk 1,056,761 1,091,062 978,451 112,611City Treasurer 143,137 143,138 151,726 (8,588)City Attorney 1,115,935 1,115,935 1,009,372 106,563City Manager 2,542,579 6,001,363 6,496,800 (495,437)Finance 3,294,240 3,851,736 3,397,916 453,820Non-departmental 997,844 1,452,844 1,081,965 370,879Human Resources 1,794,862 2,019,064 1,781,034 238,030Fire 29,608,967 30,983,929 28,434,808 2,549,121Police 30,926,920 31,071,930 30,190,060 881,870Public Works 5,018,087 5,755,272 6,487,502 (732,230)Parks and Recreation 17,762,501 17,893,967 17,253,040 640,927Library 6,132,137 6,674,593 5,952,038 722,555Economic and Community Development 9,925,951 13,935,395 9,920,252 4,015,143
Total charges to appropriations 110,610,212 122,280,519 113,393,377 8,887,142
OTHER FINANCING SOURCES (USES)Proceeds from sale of capital assets 2,250,000 2,250,000 (2,250,000)Transfers in (Note 4C) 1,261,591 1,539,100 1,302,435 (236,665)Transfers out (Note 4C) (18,020,454) (42,438,974) (24,642,202) 17,796,772
Total Other Financing Sources (Uses) (14,508,863) (38,649,874) (23,339,767) 15,310,107
(2,377,851) (37,153,203) (5,826,815) 31,326,388
SPECIAL ITEMSProceeds from sale of common interest (Note 12D) 1,247,950 1,247,950Remittance of land sale proceeds (971,011) (971,011)
NET CHANGE IN FUND BALANCE ($2,377,851) ($37,153,203) (5,549,876) $31,603,327
Fund Balance - July 1 84,943,183
Adjustment to budgetary basis: Encumbrance adjustments 5,720,788
Fund Balance - June 30 $85,114,095
See accompanying notes to financial statements
Budgeted Amounts
NET CHANGE IN FUND BALANCES BEFORE SPECIAL ITEMS
39
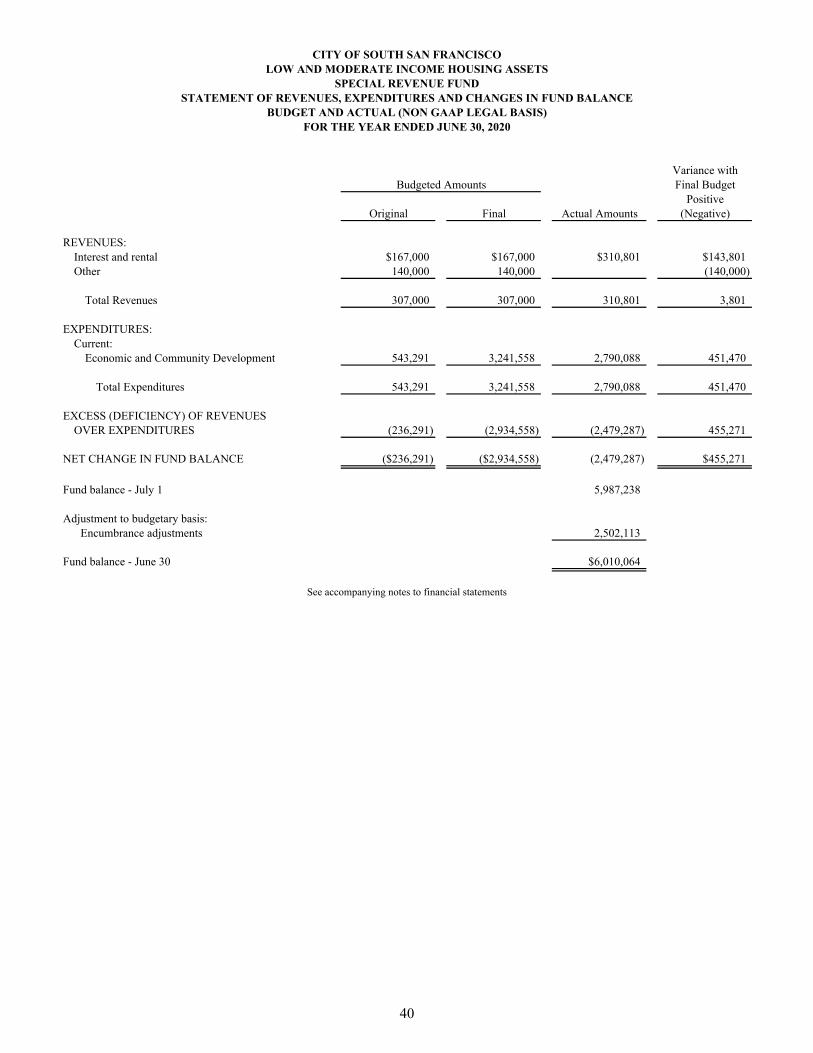
Variance withFinal Budget
PositiveOriginal Final Actual Amounts (Negative)
REVENUES:Interest and rental $167,000 $167,000 $310,801 $143,801Other 140,000 140,000 (140,000)
Total Revenues 307,000 307,000 310,801 3,801
EXPENDITURES:Current:
Economic and Community Development 543,291 3,241,558 2,790,088 451,470
Total Expenditures 543,291 3,241,558 2,790,088 451,470
EXCESS (DEFICIENCY) OF REVENUESOVER EXPENDITURES (236,291) (2,934,558) (2,479,287) 455,271
NET CHANGE IN FUND BALANCE ($236,291) ($2,934,558) (2,479,287) $455,271
Fund balance - July 1 5,987,238
Adjustment to budgetary basis: Encumbrance adjustments 2,502,113
Fund balance - June 30 $6,010,064
SPECIAL REVENUE FUND
See accompanying notes to financial statements
CITY OF SOUTH SAN FRANCISCOLOW AND MODERATE INCOME HOUSING ASSETS
STATEMENT OF REVENUES, EXPENDITURES AND CHANGES IN FUND BALANCEBUDGET AND ACTUAL (NON GAAP LEGAL BASIS)
FOR THE YEAR ENDED JUNE 30, 2020
Budgeted Amounts
40
MAJOR PROPRIETARY FUNDS Proprietary funds account for City operations financed and operated in a manner similar to a private business enterprise. The intent of the City is that the cost of providing goods and services be financed primarily through user charges.
SEWER ENTERPRISE FUND
This fund accounts for user charges and debt proceeds supporting the operation, maintenance, and capital expansion of the wastewater collection and treatment system.
PARKING DISTRICT FUND
This fund accounts for meter and parking permit fees used to acquire and maintain parking facilities.
STORM WATER FUND
This fund accounts for user charges sustaining the Storm Water Management Program mandated by state and federal authorities.
41
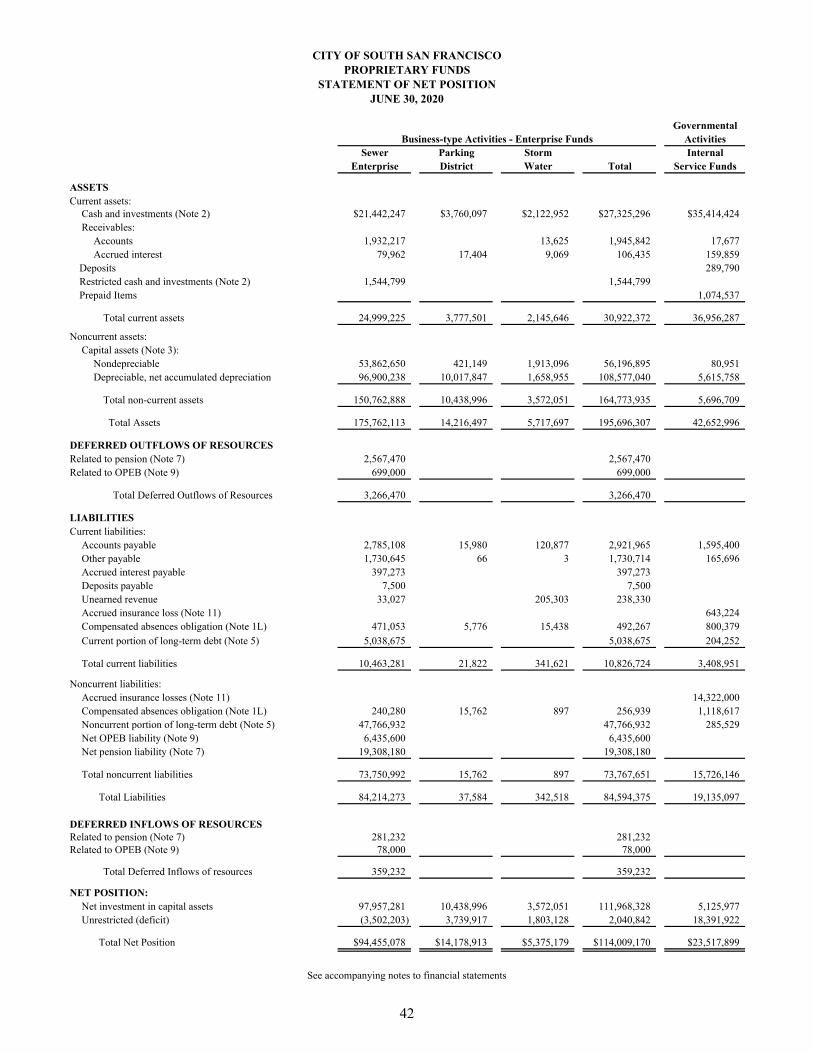
CITY OF SOUTH SAN FRANCISCOPROPRIETARY FUNDS
STATEMENT OF NET POSITIONJUNE 30, 2020
GovernmentalBusiness-type Activities - Enterprise Funds Activities
Sewer Parking Storm InternalEnterprise District Water Total Service Funds
ASSETSCurrent assets:
Cash and investments (Note 2) $21,442,247 $3,760,097 $2,122,952 $27,325,296 $35,414,424Receivables:
Accounts 1,932,217 13,625 1,945,842 17,677Accrued interest 79,962 17,404 9,069 106,435 159,859
Deposits 289,790Restricted cash and investments (Note 2) 1,544,799 1,544,799Prepaid Items 1,074,537
Total current assets 24,999,225 3,777,501 2,145,646 30,922,372 36,956,287
Noncurrent assets:Capital assets (Note 3):
Nondepreciable 53,862,650 421,149 1,913,096 56,196,895 80,951Depreciable, net accumulated depreciation 96,900,238 10,017,847 1,658,955 108,577,040 5,615,758
Total non-current assets 150,762,888 10,438,996 3,572,051 164,773,935 5,696,709
Total Assets 175,762,113 14,216,497 5,717,697 195,696,307 42,652,996
DEFERRED OUTFLOWS OF RESOURCESRelated to pension (Note 7) 2,567,470 2,567,470Related to OPEB (Note 9) 699,000 699,000
Total Deferred Outflows of Resources 3,266,470 3,266,470
LIABILITIESCurrent liabilities:
Accounts payable 2,785,108 15,980 120,877 2,921,965 1,595,400Other payable 1,730,645 66 3 1,730,714 165,696Accrued interest payable 397,273 397,273Deposits payable 7,500 7,500Unearned revenue 33,027 205,303 238,330Accrued insurance loss (Note 11) 643,224Compensated absences obligation (Note 1L) 471,053 5,776 15,438 492,267 800,379
Current portion of long-term debt (Note 5) 5,038,675 5,038,675 204,252
Total current liabilities 10,463,281 21,822 341,621 10,826,724 3,408,951
Noncurrent liabilities:Accrued insurance losses (Note 11) 14,322,000Compensated absences obligation (Note 1L) 240,280 15,762 897 256,939 1,118,617Noncurrent portion of long-term debt (Note 5) 47,766,932 47,766,932 285,529Net OPEB liability (Note 9) 6,435,600 6,435,600Net pension liability (Note 7) 19,308,180 19,308,180
Total noncurrent liabilities 73,750,992 15,762 897 73,767,651 15,726,146
Total Liabilities 84,214,273 37,584 342,518 84,594,375 19,135,097
DEFERRED INFLOWS OF RESOURCESRelated to pension (Note 7) 281,232 281,232Related to OPEB (Note 9) 78,000 78,000
Total Deferred Inflows of resources 359,232 359,232
NET POSITION:Net investment in capital assets 97,957,281 10,438,996 3,572,051 111,968,328 5,125,977Unrestricted (deficit) (3,502,203) 3,739,917 1,803,128 2,040,842 18,391,922
Total Net Position $94,455,078 $14,178,913 $5,375,179 $114,009,170 $23,517,899
See accompanying notes to financial statements
42
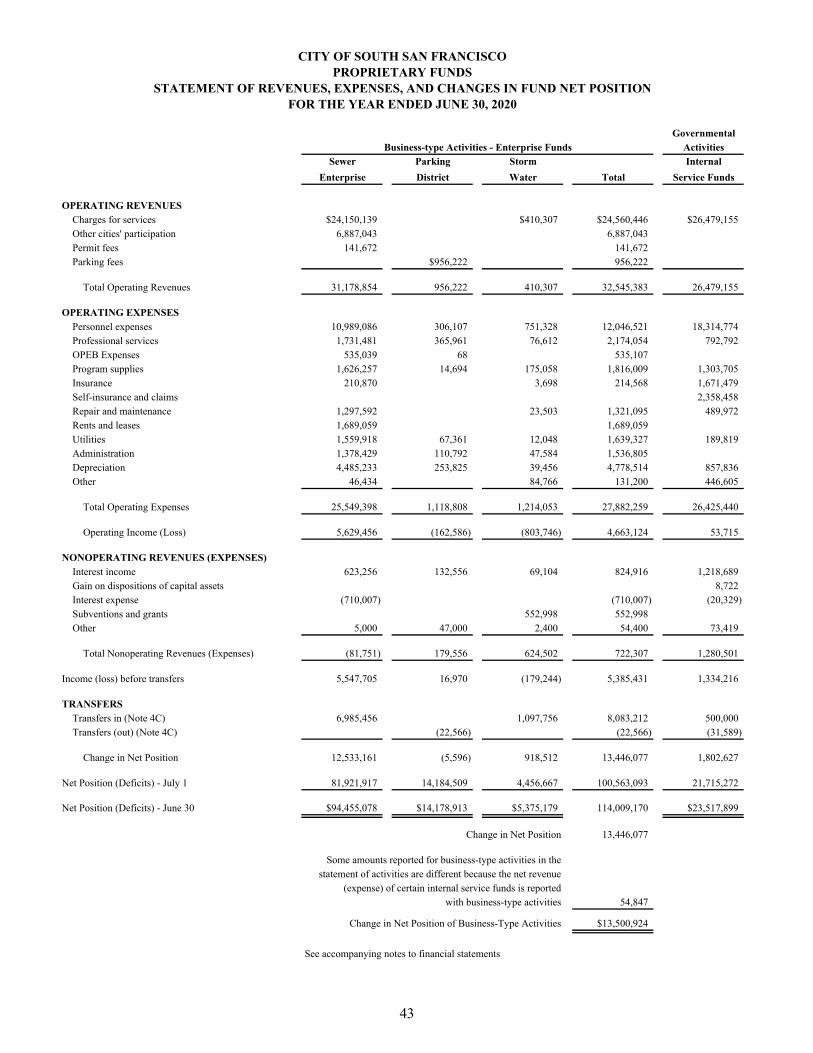
CITY OF SOUTH SAN FRANCISCOPROPRIETARY FUNDS
STATEMENT OF REVENUES, EXPENSES, AND CHANGES IN FUND NET POSITIONFOR THE YEAR ENDED JUNE 30, 2020
GovernmentalBusiness-type Activities - Enterprise Funds Activities
Sewer Parking Storm Internal
Enterprise District Water Total Service Funds
OPERATING REVENUESCharges for services $24,150,139 $410,307 $24,560,446 $26,479,155Other cities' participation 6,887,043 6,887,043Permit fees 141,672 141,672Parking fees $956,222 956,222
Total Operating Revenues 31,178,854 956,222 410,307 32,545,383 26,479,155
OPERATING EXPENSESPersonnel expenses 10,989,086 306,107 751,328 12,046,521 18,314,774Professional services 1,731,481 365,961 76,612 2,174,054 792,792OPEB Expenses 535,039 68 535,107Program supplies 1,626,257 14,694 175,058 1,816,009 1,303,705Insurance 210,870 3,698 214,568 1,671,479Self-insurance and claims 2,358,458Repair and maintenance 1,297,592 23,503 1,321,095 489,972Rents and leases 1,689,059 1,689,059Utilities 1,559,918 67,361 12,048 1,639,327 189,819Administration 1,378,429 110,792 47,584 1,536,805Depreciation 4,485,233 253,825 39,456 4,778,514 857,836Other 46,434 84,766 131,200 446,605
Total Operating Expenses 25,549,398 1,118,808 1,214,053 27,882,259 26,425,440
Operating Income (Loss) 5,629,456 (162,586) (803,746) 4,663,124 53,715
NONOPERATING REVENUES (EXPENSES)Interest income 623,256 132,556 69,104 824,916 1,218,689Gain on dispositions of capital assets 8,722Interest expense (710,007) (710,007) (20,329)Subventions and grants 552,998 552,998Other 5,000 47,000 2,400 54,400 73,419
Total Nonoperating Revenues (Expenses) (81,751) 179,556 624,502 722,307 1,280,501
Income (loss) before transfers 5,547,705 16,970 (179,244) 5,385,431 1,334,216
TRANSFERSTransfers in (Note 4C) 6,985,456 1,097,756 8,083,212 500,000Transfers (out) (Note 4C) (22,566) (22,566) (31,589)
Change in Net Position 12,533,161 (5,596) 918,512 13,446,077 1,802,627
Net Position (Deficits) - July 1 81,921,917 14,184,509 4,456,667 100,563,093 21,715,272
Net Position (Deficits) - June 30 $94,455,078 $14,178,913 $5,375,179 114,009,170 $23,517,899
Change in Net Position 13,446,077
Some amounts reported for business-type activities in thestatement of activities are different because the net revenue
(expense) of certain internal service funds is reportedwith business-type activities 54,847
Change in Net Position of Business-Type Activities $13,500,924
See accompanying notes to financial statements
43
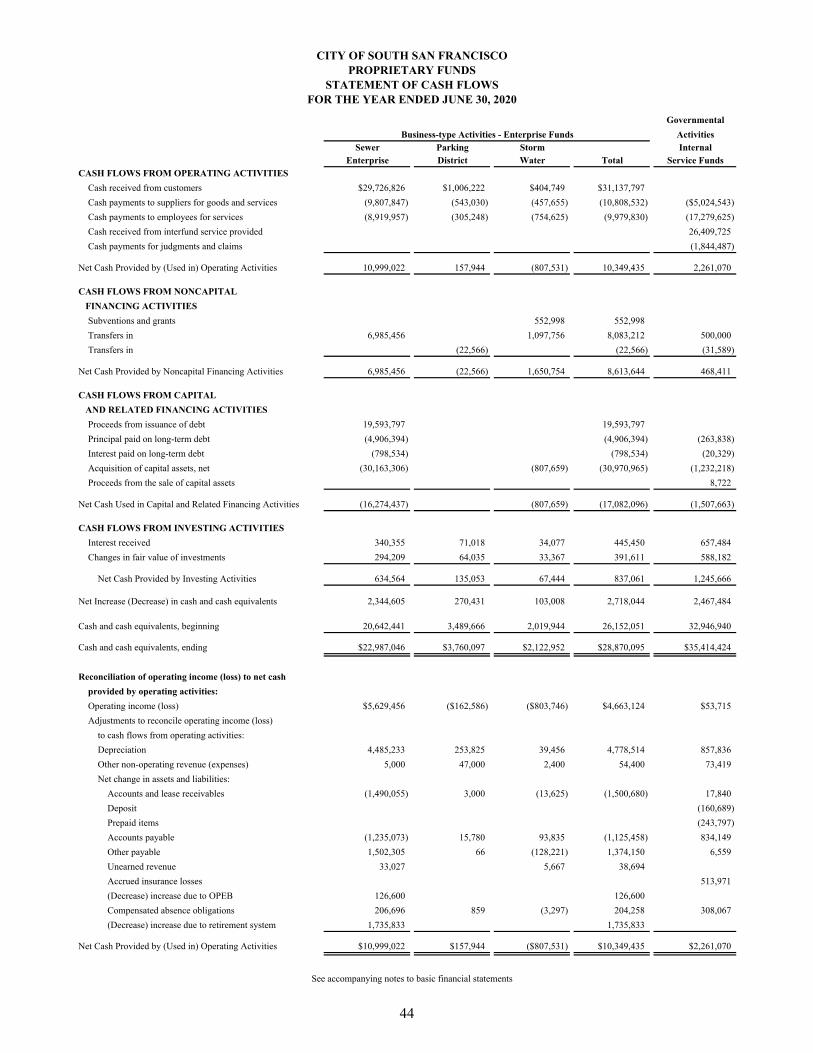
CITY OF SOUTH SAN FRANCISCOPROPRIETARY FUNDS
STATEMENT OF CASH FLOWSFOR THE YEAR ENDED JUNE 30, 2020
Governmental
Business-type Activities - Enterprise Funds ActivitiesSewer Parking Storm Internal
Enterprise District Water Total Service FundsCASH FLOWS FROM OPERATING ACTIVITIES
Cash received from customers $29,726,826 $1,006,222 $404,749 $31,137,797
Cash payments to suppliers for goods and services (9,807,847) (543,030) (457,655) (10,808,532) ($5,024,543)
Cash payments to employees for services (8,919,957) (305,248) (754,625) (9,979,830) (17,279,625)
Cash received from interfund service provided 26,409,725
Cash payments for judgments and claims (1,844,487)
Net Cash Provided by (Used in) Operating Activities 10,999,022 157,944 (807,531) 10,349,435 2,261,070
CASH FLOWS FROM NONCAPITAL
FINANCING ACTIVITIES
Subventions and grants 552,998 552,998
Transfers in 6,985,456 1,097,756 8,083,212 500,000
Transfers in (22,566) (22,566) (31,589)
Net Cash Provided by Noncapital Financing Activities 6,985,456 (22,566) 1,650,754 8,613,644 468,411
CASH FLOWS FROM CAPITAL
AND RELATED FINANCING ACTIVITIES
Proceeds from issuance of debt 19,593,797 19,593,797
Principal paid on long-term debt (4,906,394) (4,906,394) (263,838)
Interest paid on long-term debt (798,534) (798,534) (20,329)
Acquisition of capital assets, net (30,163,306) (807,659) (30,970,965) (1,232,218)
Proceeds from the sale of capital assets 8,722
Net Cash Used in Capital and Related Financing Activities (16,274,437) (807,659) (17,082,096) (1,507,663)
CASH FLOWS FROM INVESTING ACTIVITIES
Interest received 340,355 71,018 34,077 445,450 657,484
Changes in fair value of investments 294,209 64,035 33,367 391,611 588,182
Net Cash Provided by Investing Activities 634,564 135,053 67,444 837,061 1,245,666
Net Increase (Decrease) in cash and cash equivalents 2,344,605 270,431 103,008 2,718,044 2,467,484
Cash and cash equivalents, beginning 20,642,441 3,489,666 2,019,944 26,152,051 32,946,940
Cash and cash equivalents, ending $22,987,046 $3,760,097 $2,122,952 $28,870,095 $35,414,424
Reconciliation of operating income (loss) to net cash
provided by operating activities:
Operating income (loss) $5,629,456 ($162,586) ($803,746) $4,663,124 $53,715
Adjustments to reconcile operating income (loss)
to cash flows from operating activities:
Depreciation 4,485,233 253,825 39,456 4,778,514 857,836
Other non-operating revenue (expenses) 5,000 47,000 2,400 54,400 73,419
Net change in assets and liabilities:
Accounts and lease receivables (1,490,055) 3,000 (13,625) (1,500,680) 17,840
Deposit (160,689)
Prepaid items (243,797)
Accounts payable (1,235,073) 15,780 93,835 (1,125,458) 834,149
Other payable 1,502,305 66 (128,221) 1,374,150 6,559
Unearned revenue 33,027 5,667 38,694
Accrued insurance losses 513,971
(Decrease) increase due to OPEB 126,600 126,600
Compensated absence obligations 206,696 859 (3,297) 204,258 308,067
(Decrease) increase due to retirement system 1,735,833 1,735,833
Net Cash Provided by (Used in) Operating Activities $10,999,022 $157,944 ($807,531) $10,349,435 $2,261,070
See accompanying notes to basic financial statements
44
FIDUCIARY FUNDS
These funds are used to account for assets held by the City as an agent for individuals, private organizations, and other governments. The financial activities of these funds are excluded from the government-wide financial statements, but are presented in separate Fiduciary Fund financial statements.
SUCCESSOR AGENCY PRIVATE PURPOSE TRUST FUND
The Fund is used to account for the activities of the Successor Agency to the former Redevelopment Agency of the City of South San Francisco.
SSF EMPLOYEE DEFERRED COMP TRUST OVERSIGHT AGENCY FUND
This fund is used to pay for the administrative costs of monitoring the Deferred Compensation Funds on behalf of City employees.
45
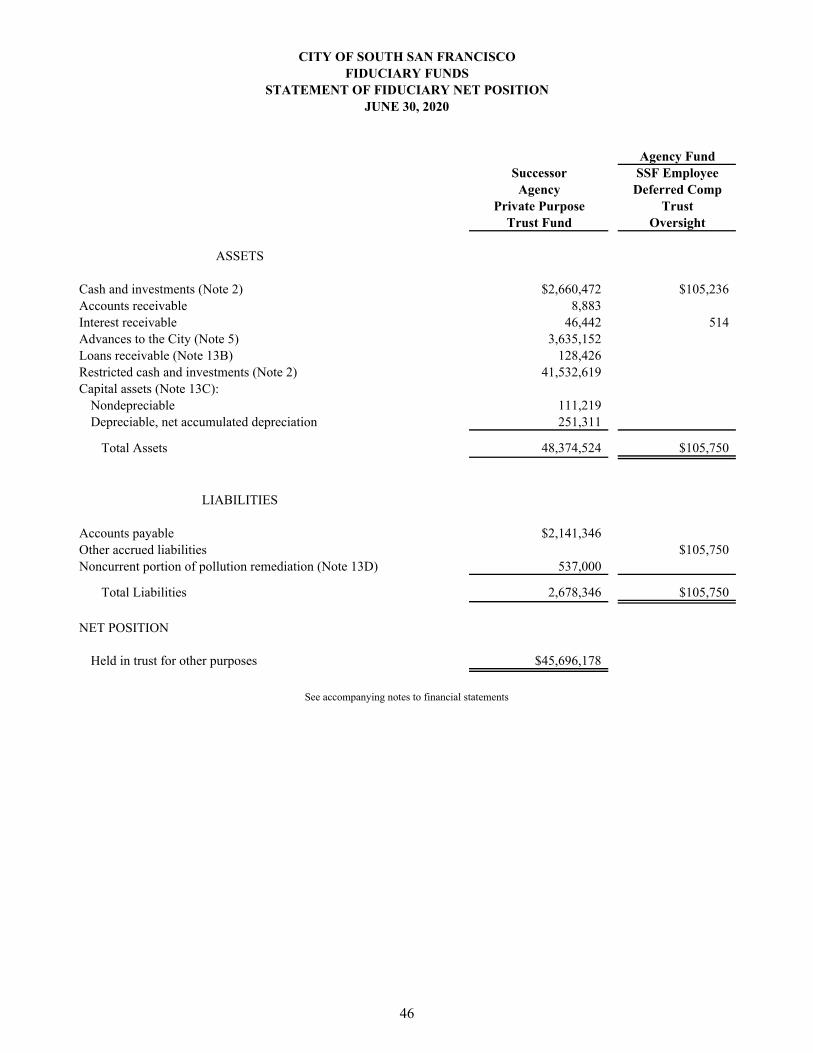
Agency FundSuccessor SSF Employee
Agency Deferred CompPrivate Purpose Trust
Trust Fund Oversight
ASSETS
Cash and investments (Note 2) $2,660,472 $105,236Accounts receivable 8,883Interest receivable 46,442 514Advances to the City (Note 5) 3,635,152Loans receivable (Note 13B) 128,426Restricted cash and investments (Note 2) 41,532,619Capital assets (Note 13C):
Nondepreciable 111,219Depreciable, net accumulated depreciation 251,311
Total Assets 48,374,524 $105,750
LIABILITIES
Accounts payable $2,141,346Other accrued liabilities $105,750Noncurrent portion of pollution remediation (Note 13D) 537,000
Total Liabilities 2,678,346 $105,750
NET POSITION
Held in trust for other purposes $45,696,178
See accompanying notes to financial statements
CITY OF SOUTH SAN FRANCISCO
STATEMENT OF FIDUCIARY NET POSITIONFIDUCIARY FUNDS
JUNE 30, 2020
46
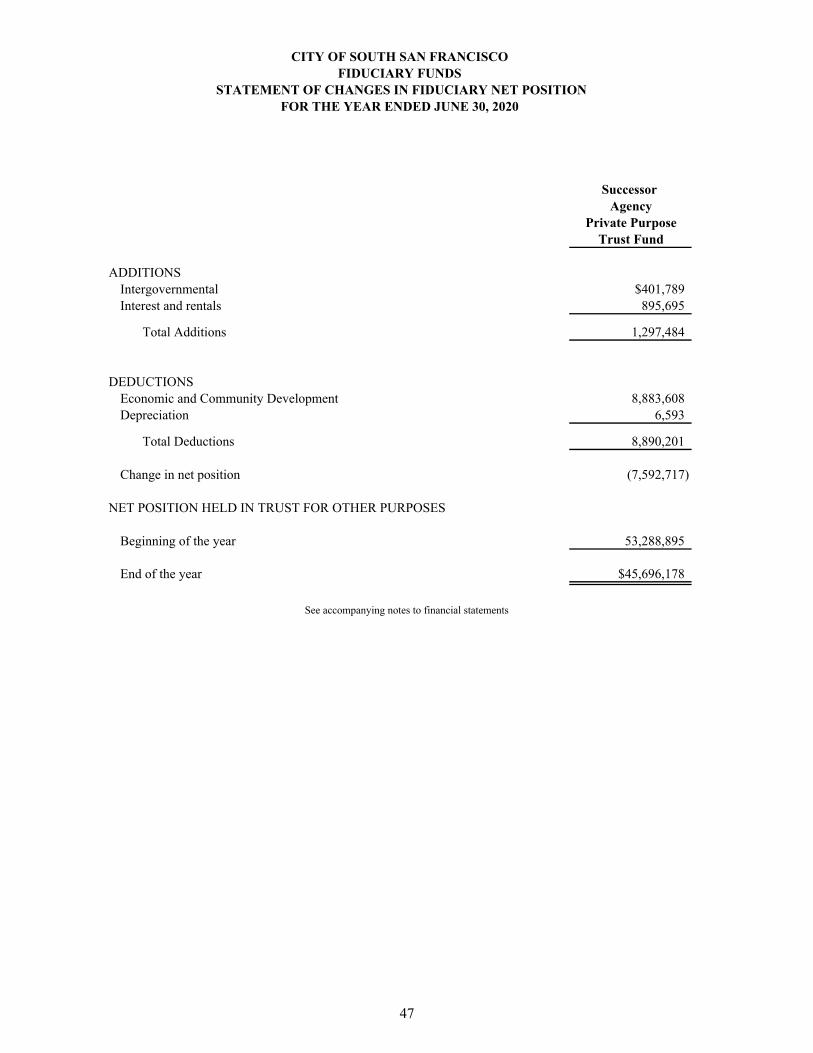
Successor Agency
Private PurposeTrust Fund
ADDITIONSIntergovernmental $401,789Interest and rentals 895,695
Total Additions 1,297,484
DEDUCTIONSEconomic and Community Development 8,883,608Depreciation 6,593
Total Deductions 8,890,201
Change in net position (7,592,717)
NET POSITION HELD IN TRUST FOR OTHER PURPOSES
Beginning of the year 53,288,895
End of the year $45,696,178
See accompanying notes to financial statements
CITY OF SOUTH SAN FRANCISCOFIDUCIARY FUNDS
STATEMENT OF CHANGES IN FIDUCIARY NET POSITIONFOR THE YEAR ENDED JUNE 30, 2020
47

This Page Left Intentionally Blank
CITY OF SOUTH SAN FRANCISCO NOTES TO BASIC FINANCIALS STATEMENTS
For the Fiscal Year Ended June 30, 2020
NOTE 1 - SUMMARY OF SIGNIFICANT ACCOUNTING POLICIES
A. Description of the Financial Reporting Entity
As required by generally accepted accounting principles, the financial statements present the Cityof South San Francisco (the City) as the Primary Government, with its component units for whichthe City is considered financially accountable. The component units discussed below areincluded in the City's reporting entity because of the significance of their operational andfinancial relationships with the City.
B. Description of Blended Component Units
The accompanying basic financial statements include all funds and boards and commissions thatare controlled by the City Council. The basic financial statements include the City’s blendedcomponent units, entities for which the City is considered to be financially accountable. Ablended component unit, although a legally separate entity, is in substance, part of the City’soperations and so data from this unit is combined with the City. The City’s following blendedcomponent units are described below.
The City of South San Francisco Capital Improvements Financing Authority is a jointexercise of powers authority created in 1991 between the City and the City of South SanFrancisco former Redevelopment Agency. The Capital Improvements Financing Authority isauthorized to borrow money through the purchase or issuance of bonds, notes, or otherobligations for the purpose of making loans to the City and other public entities to finance capitalimprovements. The City Council members serve as the Board of Directors. The financialactivities of the Capital Improvements Financing Authority are included in the CapitalImprovement Police Station Capital Projects Fund. Separate financial statements are not issuedfor the Capital Improvements Financing Authority.
The Parking Authority of the City of South San Francisco was formed in October 2019pursuant to the California Parking Law of 1949, Streets and Highways Code Section 32500, etseq. The City Council members serve as the Board of Directors. The financial activities of theParking Authority are included in the Capital Improvements Police Station Capital ProjectsFund. Separate financial statements are not issued for the Parking Authority.
The City of South San Francisco Public Facilities Financing Authority is a joint exercise ofpowers authority created in December 2019 between the City and the Parking Authority. ThePublic Facilities Financing Authority is authorized to borrow money through the purchase orissuance of bonds, notes, or other obligations for the purpose of making loans to the City or theParking Authority and other public or private entities to finance capital improvements. The CityCouncil members serve as the Board of Directors. The financial activities of the Public FacilitiesFinancing Authority are included in the Capital Improvements Police Station Capital ProjectsFund. Separate financial statements are not issued for the Public Facilities Financing Authority.
49
CITY OF SOUTH SAN FRANCISCO NOTES TO BASIC FINANCIALS STATEMENTS
For the Fiscal Year Ended June 30, 2020
NOTE 1 - SUMMARY OF SIGNIFICANT ACCOUNTING POLICIES (Continued)
C. Description of Discrete Component Unit The City of South San Francisco Conference Center Authority was established in 1992 to
manage and operate the South San Francisco Conference Center. The Authority is governed by a Board of nine commissioners consisting of two Council members and seven representatives from various businesses appointed by City Council.
The Authority does not meet the criteria of a blended component unit, since the City Council is not the Authority’s governing body and the Authority does not provide services entirely to the City. However, the City is financially accountable and is able to impose its will on the Authority. The Authority is therefore considered a discrete component unit with its financial data reported separately from the financial data of the City.
The City of South San Francisco Conference Center Authority financial statements may be obtained from the Authority at 255 South Airport Boulevard, South San Francisco, CA 94080.
D. Basis of Presentation
Government-wide Statements - The Statement of Net Position and the Statement of Activities display information about the primary government (the City) and its component units. These statements include the financial activities of the overall City government, except for fiduciary activities. Interfund transfers and amounts owed between funds within the primary government have been eliminated from the statements. Amounts representing interfund services and uses remain in the statements. These statements distinguish between the governmental and business-type activities of the City. Governmental activities generally are financed through taxes, intergovernmental revenues, and other nonexchange transactions. Business-type activities are financed in whole or in part by fees charged to external parties.
The Statement of Activities presents a comparison between direct expenses and program revenues for each segment of the business-type activities of the City and for each function of the City’s governmental activities. Direct expenses are those that are specifically associated with a program or function and, therefore, are clearly identifiable to a particular function. Program revenues include (a) charges paid by the recipients of goods or services offered by the programs, (b) grants and contributions that are restricted to meeting the operational needs of a particular program and (c) fees, grants and contributions that are restricted to financing the acquisition or construction of capital assets. Revenues that are not classified as program revenues, including all taxes, are presented as general revenues. Fund Financial Statements: The fund financial statements provide information about the City’s funds, including fiduciary funds and blended component units. Separate statements for each fund category – governmental, proprietary, and fiduciary – are presented. The emphasis of fund financial statements is on major individual governmental and enterprise funds, each of which is displayed in a separate column. All remaining governmental and enterprise funds are aggregated and reported as nonmajor funds. Proprietary fund operating revenues, such as charges for services, result from exchange transactions associated with the principal activity of the fund. Exchange transactions are those in which each party receives and gives up essentially equal values. Nonoperating revenues, such as subsidies and investment earnings, result from nonexchange transactions or ancillary activities.
50
CITY OF SOUTH SAN FRANCISCO NOTES TO BASIC FINANCIALS STATEMENTS
For the Fiscal Year Ended June 30, 2020
NOTE 1 - SUMMARY OF SIGNIFICANT ACCOUNTING POLICIES (Continued)
E. Major Funds
Major funds are defined as funds that have either assets, liabilities, revenues or expenditures/expenses equal to ten percent of their fund-type total and five percent of the grand total. The General Fund is always a major fund. The City may also select other funds it believes should be presented as major funds. The City reported the following major governmental funds in the accompanying financial statements: General Fund – Accounts for resources traditionally associated with government, such as administration, public safety, library, parks, maintenance, and recreation, outside of those accounted for in other funds. Low and Moderate Income Housing Assets Special Revenue Fund – This fund was established to account for the activities related to the assets assumed by the City as Housing Successor to the housing activities of the former Redevelopment Agency of the City. The main source of revenue for this fund is the repayment of loans restricted for housing activities. Capital Improvement Capital Projects Fund – Accounts for expenditures associated with the acquisition, construction, or improvement of City-owned facilities and infrastructure. Funding comes from the General Fund, Special Revenue funds, grants and fees.
East of 101 Sewer Impact Fees Capital Projects Fund – These fees provide new development’s share of new and rehabilitated sewer collection and treatment facilities to serve the East of Highway 101 area.
East of 101 Traffic Impact Fees Capital Projects Fund – These fees are to provide new developments share of new and expanded roadway and intersection improvements to serve the East of Highway 101 area.
Child Care Impact Fees Capital Projects Fund – These citywide fees provide new development’s share of new and expanded childcare facilities to serve the City.
Developer Deposit Capital Projects Fund – Accounts for a deposit by a large corporation for various capital projects the developer agreed to fund. Capital Infrastructure Reserve Fund – Replacement, upgrade, and maintenance of the City’s infrastructure are backlogged, constituting a significant liability. Funds are set aside in this fund as part of the budget process and as part of the City’s reserve policy to address the replacement and/or upgrade of the city infrastructure (such as parks, buildings, facilities, streets, sidewalks, and storm water facilities).
Capital Improvement Police Station – Accounts for expenditures associated with the acquisition, construction, and installation of certain capital improvements constituting to new City police station located within the City’s new Civic Center Campus, and related improvements, facilities and equipment’s, and pay the costs incurred in connection with the issuance of the Series 2020A Bonds.
51
CITY OF SOUTH SAN FRANCISCO NOTES TO BASIC FINANCIALS STATEMENTS
For the Fiscal Year Ended June 30, 2020
NOTE 1 - SUMMARY OF SIGNIFICANT ACCOUNTING POLICIES (Continued)
The City reported all enterprise funds as major funds in the accompanying financial statements. The enterprise funds are:
Sewer Enterprise Fund – Accounts for user charges and debt proceeds supporting the operation, maintenance, and capital expansion of the wastewater collection and treatment system.
Parking District Fund – Accounts for meter and parking permit fees used to acquire and maintain parking facilities.
Storm Water Fund – Accounts for user charges sustaining the Storm Water Management Program mandated by state and federal authorities.
The City also reports the following fund types:
Internal Service Funds – These funds account for City services, self insurance, health and retirement benefits, and equipment replacement; all of which are provided to other departments on a cost-reimbursement basis.
Fiduciary Funds – An agency fund is used to account for assets held by the City as an agent for SSF Employee Deferred Comp Trust Oversight Fund. The Successor Agency Private-Purpose Trust Fund accounts for the accumulation of resources to be used for payments at appropriate amounts and times in the future. The financial activities of the funds are excluded from the government-wide financial statements, but are presented in the separate Fiduciary Fund financial statements.
F. Basis of Accounting
The government-wide, proprietary, private-purpose trust fund, and discretely presentedcomponent unit financial statements are reported using the economic resources measurementfocus and the full accrual basis of accounting. Revenues are recorded when earned and expensesare recorded at the time liabilities are incurred, regardless of when the related cash flows takeplace.
The agency funds which only report assets and liabilities and do not have a measurement focus.
Governmental funds are reported using the current financial resources measurement focus andthe modified accrual basis of accounting. Under this method, revenues are recognized whenmeasurable and available. The City considers all revenues reported in the governmental funds tobe available if the revenues are collected within sixty days after year-end. Expenditures arerecorded when the related fund liability is incurred, except for principal and interest on long-termdebt, claims and judgments, and compensated absences, which are recognized as expenditures tothe extent they have matured. General capital asset acquisitions are reported as expenditures ingovernmental funds. Proceeds from long-term debt and acquisitions under capital leases arereported as other financing sources.
Those revenues susceptible to accrual are property and sales taxes, certain intergovernmentalrevenues, interest revenue, licenses and permits, charges for services, fines and forfeitures. Salestaxes collected and held by the state at year end on behalf of the City are also recognized asrevenue. Other receipts and taxes are recognized as revenue when the cash is received.
52
CITY OF SOUTH SAN FRANCISCO NOTES TO BASIC FINANCIALS STATEMENTS
For the Fiscal Year Ended June 30, 2020
NOTE 1 - SUMMARY OF SIGNIFICANT ACCOUNTING POLICIES (Continued) Non-exchange transactions, in which the City gives or receives value without directly, receiving or giving equal value in exchange, include taxes, grants, entitlements, and donations. On the accrual basis, revenue from taxes is recognized in the fiscal year for which the taxes are levied or assessed. Revenue from grants, entitlements, and donations is recognized in the fiscal year in which all eligibility requirements have been satisfied. Under the terms of grant agreements, the City may fund certain programs with a combination of cost-reimbursement grants, categorical block grants, and general revenue. Thus, both restricted and unrestricted net position may be made available to finance program expenditures. The City’s policy is to first apply restricted grant resources to such programs, followed by general revenues if necessary. The City considers restricted shared state revenues such as gasoline taxes and public safety sales taxes, restricted locally imposed transportation sales taxes, fines, forfeitures, licenses, permits, charges for services, and program grants as program revenues.
G. Budgets, Budgetary Accounting, and Encumbrances The City is not legally required to budget any of its funds, but does so to enhance City management's effectiveness in their financial planning efforts and to enhance control over the City's operations. Budgets are adopted on a modified accrual basis, except for encumbrances and for the Capital Improvement Fund. Encumbrances are considered expenditures in the year of the purchase order issuance. The Capital Improvement Fund is adopted on a multi-year project basis with unexpended and unencumbered budgets reappropriated in the following year. The City operates under the general laws of the State of California (the State) and annually adopts a budget effective July 1 for the ensuing fiscal year for the General fund; Special Revenue funds; Capital Projects funds except for the Developer Deposit Capital Projects Fund, Non-obligated Capital Projects Fund, Oyster Point Improvement Impact Fees Capital Projects Fund, Oyster Point Development Impact Fees Capital Projects Fund, Park Land Acquisition Capital Projects Fund, Bicycle and Pedestrian Impact Fee Capital Projects Fund, Commercial Linkage Impact Fee Capital Projects Fund and 2020A Police Station Debt Service Fund; and Enterprise funds. The budget is adopted by the City Council and controlled at the department level for the General fund and at the fund level or lower for all other funds with adopted budgets. From the effective date of the budget, the amounts stated therein as proposed expenditures become appropriations to the various City departments. The City Council may amend the budget by resolution during the fiscal year. The department heads may authorize transfers within one object category within the same department within a fund. The City Manager may authorize transfers between object categories and departments within a fund. All appropriations lapse at year-end, except for capital projects and encumbrances. Original adopted budgets and final amended budgets are presented in the basic financial statements. Supplementary budget appropriations were necessary during the year ended June 30, 2020. Encumbrance accounting, under which, purchase orders, contracts and other commitments for the expenditure of funds are recorded in order to reserve that portion of the applicable appropriation, is employed as an extension of the budgetary process. Encumbrances outstanding at year-end are reported as reservations of fund balances since they do not constitute expenditures or liabilities. Encumbrances are reappropriated in the following year.
53
CITY OF SOUTH SAN FRANCISCO NOTES TO BASIC FINANCIALS STATEMENTS
For the Fiscal Year Ended June 30, 2020
NOTE 1 - SUMMARY OF SIGNIFICANT ACCOUNTING POLICIES (Continued) The budgetary comparison statements present comparisons of the legally adopted budget with actual charges to appropriations on a budgetary basis. In order to provide a meaningful comparison, the actual charges on a budgetary basis include encumbrances, which is a basis that differs significantly from those used to present financial statements in conformity with generally accepted accounting principles. Certain indirect costs are included in program expenses reported for individual functions and activities.
H. Expenditures in Excess of Appropriations – The City’s General Fund had the following departmental expenditures in excess of appropriations and other funds had expenditures in excess of appropriations for the year ended June 30, 2020:
Expenditures in Excess of Budget
(Non GAAP Legal Basis)
General Fund:City Treasurer $8,588City Manager 495,437Public Works 732,230
Developer Contributions Special Revenue Fund 321,134Federal Aviation Special Revenue Fund 28,257Supplemental Law Enforcement Services Special Revenue Fund 60,337City Programs Special Revenue Fund 223,901
Sufficient resources were available within each fund to finance these excesses. I. Cash Equivalents – For purposes of the statement of cash flows, the City considers all highly
liquid investments (including all restricted assets) with maturity of three months or less when purchased to be cash equivalents. The City maintains a cash and investment pool that is available for use by all funds. As the proprietary funds' share of this pool is readily available when needed, such share is also considered to be cash equivalent. Deposit assets in the proprietary funds are related to insurance and benefits and are not considered cash equivalents for purposes of the statement of cash flows.
J. Inventory and Prepaid Items – consist of consumable supplies. Inventory is stated at cost (first-
in, first-out method). The costs are recorded as expenditures at the time the individual inventory or prepaid item is consumed. Reported inventory and prepaid items are equally offset by a fund balance reservation, which indicates that they do not constitute "available spendable resources" even though they are a component of net current assets.
54
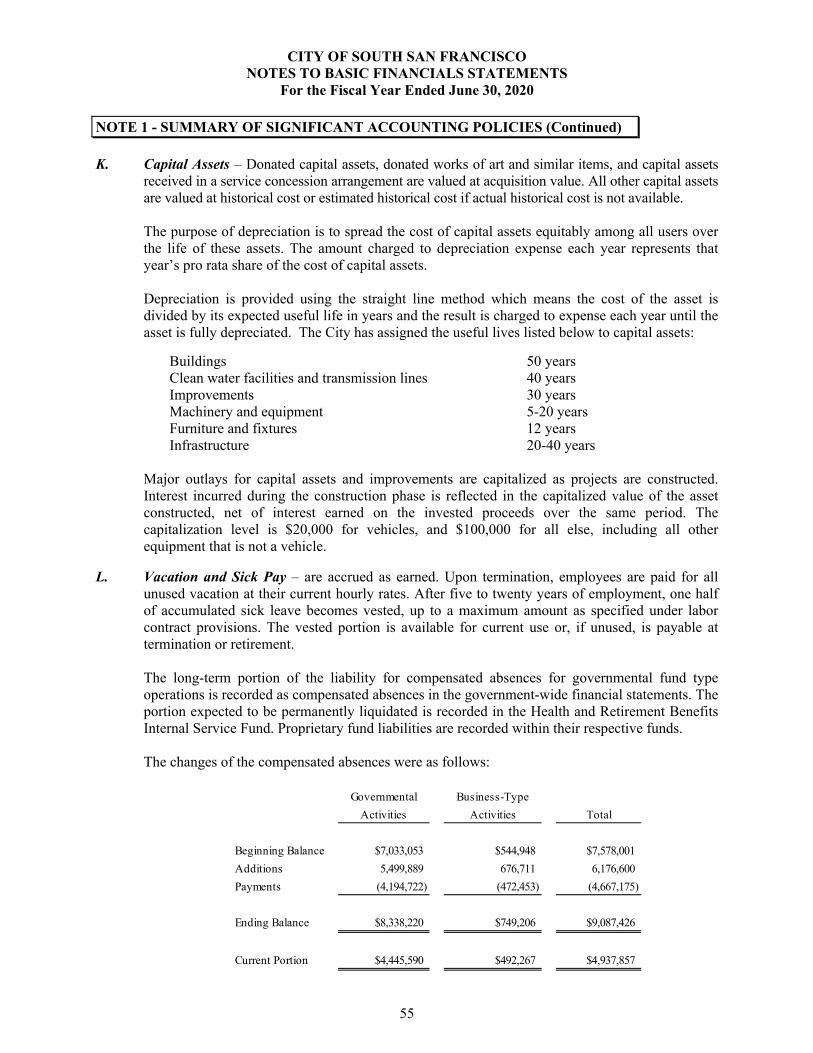
CITY OF SOUTH SAN FRANCISCO NOTES TO BASIC FINANCIALS STATEMENTS
For the Fiscal Year Ended June 30, 2020
NOTE 1 - SUMMARY OF SIGNIFICANT ACCOUNTING POLICIES (Continued)
K. Capital Assets – Donated capital assets, donated works of art and similar items, and capital assetsreceived in a service concession arrangement are valued at acquisition value. All other capital assetsare valued at historical cost or estimated historical cost if actual historical cost is not available.
The purpose of depreciation is to spread the cost of capital assets equitably among all users overthe life of these assets. The amount charged to depreciation expense each year represents thatyear’s pro rata share of the cost of capital assets.
Depreciation is provided using the straight line method which means the cost of the asset isdivided by its expected useful life in years and the result is charged to expense each year until theasset is fully depreciated. The City has assigned the useful lives listed below to capital assets:
Buildings 50 years Clean water facilities and transmission lines 40 years
Improvements 30 years Machinery and equipment 5-20 years Furniture and fixtures 12 years Infrastructure 20-40 years
Major outlays for capital assets and improvements are capitalized as projects are constructed. Interest incurred during the construction phase is reflected in the capitalized value of the asset constructed, net of interest earned on the invested proceeds over the same period. The capitalization level is $20,000 for vehicles, and $100,000 for all else, including all other equipment that is not a vehicle.
L. Vacation and Sick Pay – are accrued as earned. Upon termination, employees are paid for allunused vacation at their current hourly rates. After five to twenty years of employment, one halfof accumulated sick leave becomes vested, up to a maximum amount as specified under laborcontract provisions. The vested portion is available for current use or, if unused, is payable attermination or retirement.
The long-term portion of the liability for compensated absences for governmental fund typeoperations is recorded as compensated absences in the government-wide financial statements. Theportion expected to be permanently liquidated is recorded in the Health and Retirement BenefitsInternal Service Fund. Proprietary fund liabilities are recorded within their respective funds.
The changes of the compensated absences were as follows:
Governmental Business-Type
Activities Activities Total
Beginning Balance $7,033,053 $544,948 $7,578,001
Additions 5,499,889 676,711 6,176,600
Payments (4,194,722) (472,453) (4,667,175)
Ending Balance $8,338,220 $749,206 $9,087,426
Current Portion $4,445,590 $492,267 $4,937,857
55
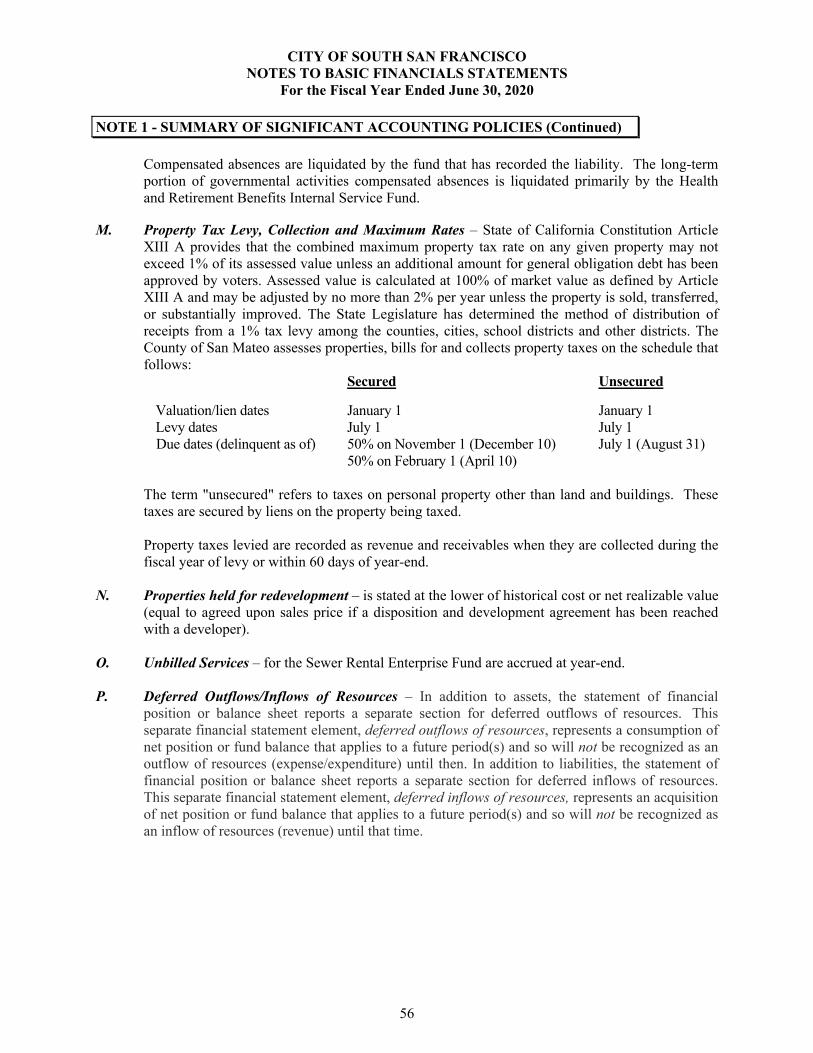
CITY OF SOUTH SAN FRANCISCO NOTES TO BASIC FINANCIALS STATEMENTS
For the Fiscal Year Ended June 30, 2020
NOTE 1 - SUMMARY OF SIGNIFICANT ACCOUNTING POLICIES (Continued)
Compensated absences are liquidated by the fund that has recorded the liability. The long-term portion of governmental activities compensated absences is liquidated primarily by the Health and Retirement Benefits Internal Service Fund.
M. Property Tax Levy, Collection and Maximum Rates – State of California Constitution Article
XIII A provides that the combined maximum property tax rate on any given property may not exceed 1% of its assessed value unless an additional amount for general obligation debt has been approved by voters. Assessed value is calculated at 100% of market value as defined by Article XIII A and may be adjusted by no more than 2% per year unless the property is sold, transferred, or substantially improved. The State Legislature has determined the method of distribution of receipts from a 1% tax levy among the counties, cities, school districts and other districts. The County of San Mateo assesses properties, bills for and collects property taxes on the schedule that follows:
Secured Unsecured
Valuation/lien dates January 1 January 1 Levy dates July 1 July 1 Due dates (delinquent as of) 50% on November 1 (December 10) July 1 (August 31)
50% on February 1 (April 10) The term "unsecured" refers to taxes on personal property other than land and buildings. These taxes are secured by liens on the property being taxed.
Property taxes levied are recorded as revenue and receivables when they are collected during the fiscal year of levy or within 60 days of year-end.
N. Properties held for redevelopment – is stated at the lower of historical cost or net realizable value (equal to agreed upon sales price if a disposition and development agreement has been reached with a developer).
O. Unbilled Services – for the Sewer Rental Enterprise Fund are accrued at year-end. P. Deferred Outflows/Inflows of Resources – In addition to assets, the statement of financial
position or balance sheet reports a separate section for deferred outflows of resources. This separate financial statement element, deferred outflows of resources, represents a consumption of net position or fund balance that applies to a future period(s) and so will not be recognized as an outflow of resources (expense/expenditure) until then. In addition to liabilities, the statement of financial position or balance sheet reports a separate section for deferred inflows of resources. This separate financial statement element, deferred inflows of resources, represents an acquisition of net position or fund balance that applies to a future period(s) and so will not be recognized as an inflow of resources (revenue) until that time.
56
CITY OF SOUTH SAN FRANCISCO NOTES TO BASIC FINANCIALS STATEMENTS
For the Fiscal Year Ended June 30, 2020
NOTE 1 - SUMMARY OF SIGNIFICANT ACCOUNTING POLICIES (Continued) Q. Fair Value Measurements
Fair value is defined as the price that would be received to sell an asset or paid to transfer a liability in an orderly transaction between market participants at the measurement date. The City categorizes its fair value measurements within the fair value hierarchy established by generally accepted accounting principles. The fair value hierarchy categorizes the inputs to valuation techniques used to measure fair value into three levels based on the extent to which inputs used in measuring fair value are observable in the market.
Level 1 inputs are quoted prices (unadjusted) in active markets for identical assets or liabilities. Level 2 inputs are inputs – other than quoted prices included within level 1 – that are observable for an asset or liability, either directly or indirectly. Level 3 inputs are unobservable inputs for an asset or liability.
If the fair value of an asset or liability is measured using inputs from more than one level of the fair value hierarchy, the measurement is considered to be based on the lowest priority level input that is significant to the entire measurement.
R. Use of Estimates – The preparation of financial statements in conformity with generally accepted
accounting principles requires management to make estimates and assumptions that affect the reported amounts of assets and liabilities and disclosure of contingent asset and liabilities at the dates of the financial statements and the reported amounts of revenues and expenditures/expenses during the reporting periods. Actual results could differ from those estimates.
S. New Funds In fiscal year 2019-2020, the City established the following funds: The Capital Improvements Police Station Capital Projects Fund is used to account for
expenditures associated with the acquisition, construction, and installation of certain capital improvements constituting to new City police station located within the City’s new Civic Center Campus, and related improvements, facilities and equipment’s, and pay the costs incurred in connection with the issuance of the Series 2020A Bonds.
The San Mateo County (SMC) Measure W ½ Sales Tax Special Revenue Fund is used to account
for the City’s portion of the special half cent sales tax receipts restricted for congestion relief and transit improvements.
The Commercial Linkage Impact Fee Capital Projects Fund is used to account for affordable housing funding created by new commercial development.
2020A Police Station Debt Service Fund is used to account for expenditures associated with the
acquisition, construction, and installation of certain capital improvements constituting the new City police station located within the City’s new Civic Center Campus, and related improvements, facilities and equipment, and pay the costs incurred in connection with the issuance of the Series 2020A Bonds.
57
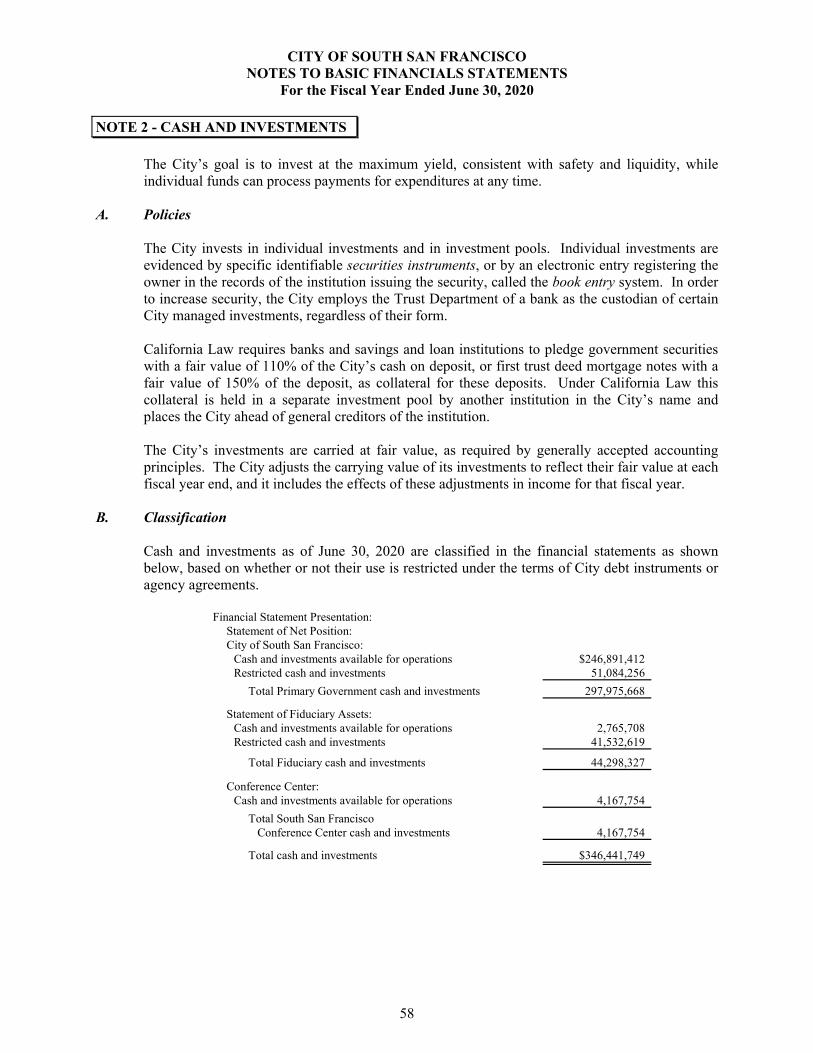
CITY OF SOUTH SAN FRANCISCO NOTES TO BASIC FINANCIALS STATEMENTS
For the Fiscal Year Ended June 30, 2020
NOTE 2 - CASH AND INVESTMENTS
The City’s goal is to invest at the maximum yield, consistent with safety and liquidity, while individual funds can process payments for expenditures at any time.
A. Policies
The City invests in individual investments and in investment pools. Individual investments areevidenced by specific identifiable securities instruments, or by an electronic entry registering theowner in the records of the institution issuing the security, called the book entry system. In orderto increase security, the City employs the Trust Department of a bank as the custodian of certainCity managed investments, regardless of their form.
California Law requires banks and savings and loan institutions to pledge government securitieswith a fair value of 110% of the City’s cash on deposit, or first trust deed mortgage notes with afair value of 150% of the deposit, as collateral for these deposits. Under California Law thiscollateral is held in a separate investment pool by another institution in the City’s name andplaces the City ahead of general creditors of the institution.
The City’s investments are carried at fair value, as required by generally accepted accountingprinciples. The City adjusts the carrying value of its investments to reflect their fair value at eachfiscal year end, and it includes the effects of these adjustments in income for that fiscal year.
B. Classification
Cash and investments as of June 30, 2020 are classified in the financial statements as shownbelow, based on whether or not their use is restricted under the terms of City debt instruments oragency agreements.
Financial Statement Presentation:Statement of Net Position:City of South San Francisco:
Cash and investments available for operations $246,891,412Restricted cash and investments 51,084,256
Total Primary Government cash and investments 297,975,668
Statement of Fiduciary Assets:Cash and investments available for operations 2,765,708Restricted cash and investments 41,532,619
Total Fiduciary cash and investments 44,298,327
Conference Center:Cash and investments available for operations 4,167,754
Total South San Francisco Conference Center cash and investments 4,167,754
Total cash and investments $346,441,749
58
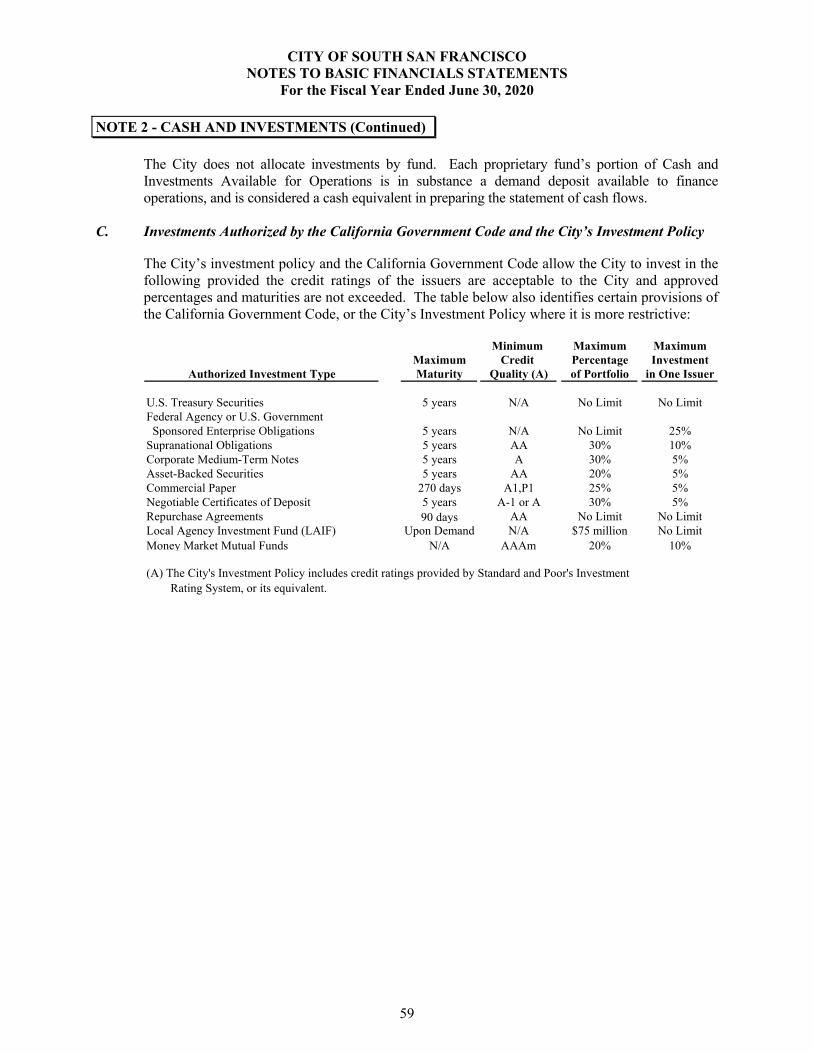
CITY OF SOUTH SAN FRANCISCO NOTES TO BASIC FINANCIALS STATEMENTS
For the Fiscal Year Ended June 30, 2020
NOTE 2 - CASH AND INVESTMENTS (Continued)
The City does not allocate investments by fund. Each proprietary fund’s portion of Cash and Investments Available for Operations is in substance a demand deposit available to finance operations, and is considered a cash equivalent in preparing the statement of cash flows.
C. Investments Authorized by the California Government Code and the City’s Investment Policy The City’s investment policy and the California Government Code allow the City to invest in the following provided the credit ratings of the issuers are acceptable to the City and approved percentages and maturities are not exceeded. The table below also identifies certain provisions of the California Government Code, or the City’s Investment Policy where it is more restrictive:
Minimum Maximum MaximumMaximum Credit Percentage Investment
Authorized Investment Type Maturity Quality (A) of Portfolio in One Issuer
U.S. Treasury Securities 5 years N/A No Limit No LimitFederal Agency or U.S. Government Sponsored Enterprise Obligations 5 years N/A No Limit 25%Supranational Obligations 5 years AA 30% 10%Corporate Medium-Term Notes 5 years A 30% 5%Asset-Backed Securities 5 years AA 20% 5%Commercial Paper 270 days A1,P1 25% 5%Negotiable Certificates of Deposit 5 years A-1 or A 30% 5%Repurchase Agreements 90 days AA No Limit No LimitLocal Agency Investment Fund (LAIF) Upon Demand N/A $75 million No LimitMoney Market Mutual Funds N/A AAAm 20% 10%
Rating System, or its equivalent.(A) The City's Investment Policy includes credit ratings provided by Standard and Poor's Investment
59
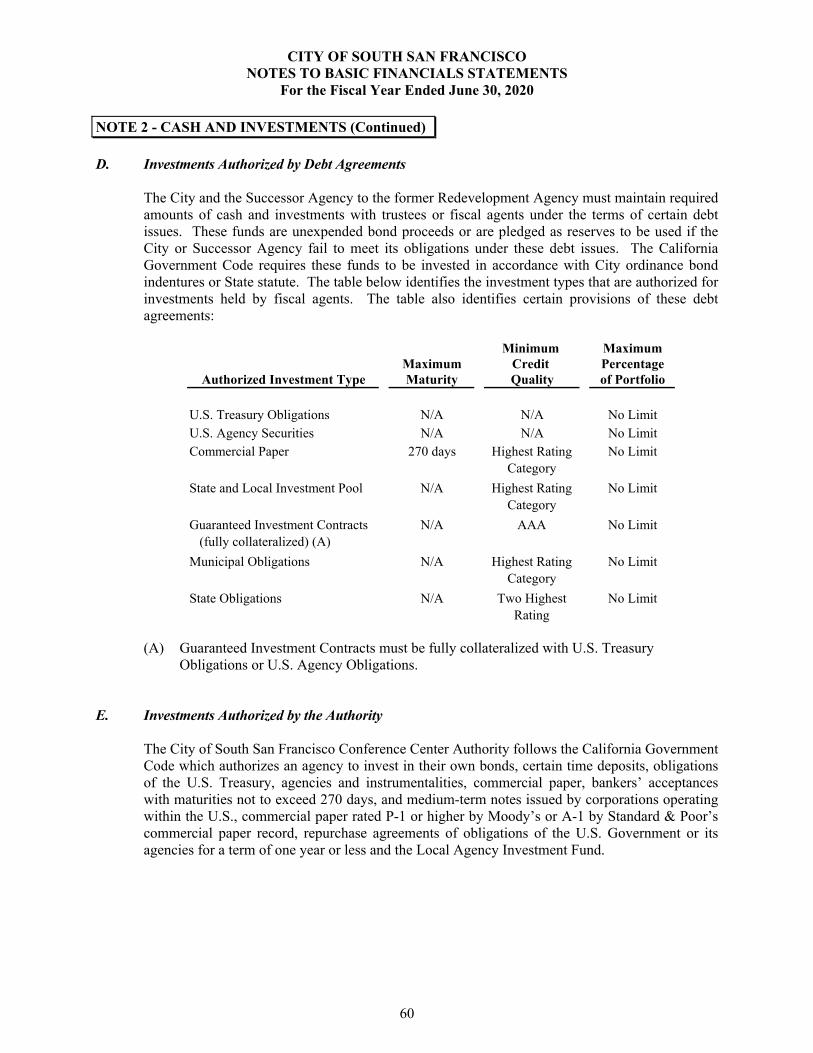
CITY OF SOUTH SAN FRANCISCO NOTES TO BASIC FINANCIALS STATEMENTS
For the Fiscal Year Ended June 30, 2020
NOTE 2 - CASH AND INVESTMENTS (Continued) D. Investments Authorized by Debt Agreements
The City and the Successor Agency to the former Redevelopment Agency must maintain required amounts of cash and investments with trustees or fiscal agents under the terms of certain debt issues. These funds are unexpended bond proceeds or are pledged as reserves to be used if the City or Successor Agency fail to meet its obligations under these debt issues. The California Government Code requires these funds to be invested in accordance with City ordinance bond indentures or State statute. The table below identifies the investment types that are authorized for investments held by fiscal agents. The table also identifies certain provisions of these debt agreements:
Minimum MaximumMaximum Credit Percentage
Authorized Investment Type Maturity Quality of Portfolio
U.S. Treasury Obligations N/A N/A No LimitU.S. Agency Securities N/A N/A No LimitCommercial Paper 270 days Highest Rating
CategoryNo Limit
State and Local Investment Pool N/A Highest Rating Category
No Limit
Guaranteed Investment Contracts (fully collateralized) (A)
N/A AAA No Limit
Municipal Obligations N/A Highest Rating Category
No Limit
State Obligations N/A Two Highest Rating
No Limit
(A) Guaranteed Investment Contracts must be fully collateralized with U.S. Treasury
Obligations or U.S. Agency Obligations.
E. Investments Authorized by the Authority
The City of South San Francisco Conference Center Authority follows the California Government Code which authorizes an agency to invest in their own bonds, certain time deposits, obligations of the U.S. Treasury, agencies and instrumentalities, commercial paper, bankers’ acceptances with maturities not to exceed 270 days, and medium-term notes issued by corporations operating within the U.S., commercial paper rated P-1 or higher by Moody’s or A-1 by Standard & Poor’s commercial paper record, repurchase agreements of obligations of the U.S. Government or its agencies for a term of one year or less and the Local Agency Investment Fund.
60
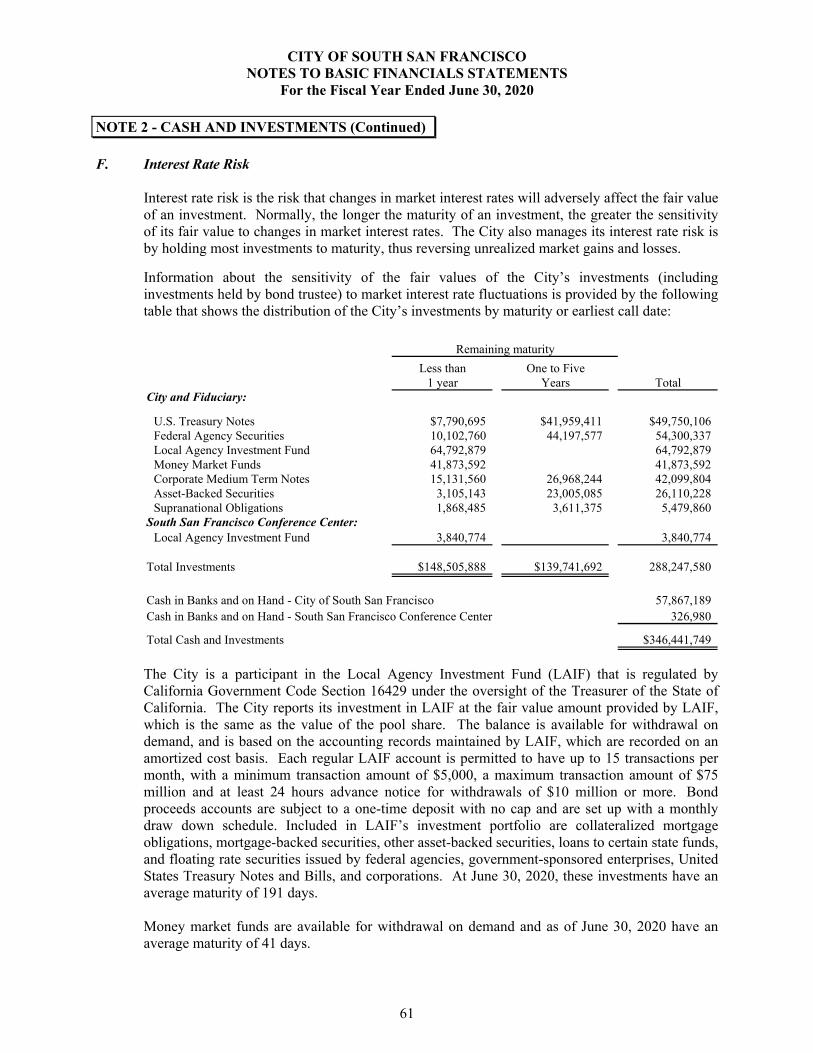
CITY OF SOUTH SAN FRANCISCO NOTES TO BASIC FINANCIALS STATEMENTS
For the Fiscal Year Ended June 30, 2020
NOTE 2 - CASH AND INVESTMENTS (Continued) F. Interest Rate Risk
Interest rate risk is the risk that changes in market interest rates will adversely affect the fair value of an investment. Normally, the longer the maturity of an investment, the greater the sensitivity of its fair value to changes in market interest rates. The City also manages its interest rate risk is by holding most investments to maturity, thus reversing unrealized market gains and losses.
Information about the sensitivity of the fair values of the City’s investments (including investments held by bond trustee) to market interest rate fluctuations is provided by the following table that shows the distribution of the City’s investments by maturity or earliest call date:
Remaining maturity
Less than One to Five1 year Years Total
City and Fiduciary:
U.S. Treasury Notes $7,790,695 $41,959,411 $49,750,106Federal Agency Securities 10,102,760 44,197,577 54,300,337Local Agency Investment Fund 64,792,879 64,792,879Money Market Funds 41,873,592 41,873,592Corporate Medium Term Notes 15,131,560 26,968,244 42,099,804Asset-Backed Securities 3,105,143 23,005,085 26,110,228Supranational Obligations 1,868,485 3,611,375 5,479,860
South San Francisco Conference Center:Local Agency Investment Fund 3,840,774 3,840,774
Total Investments $148,505,888 $139,741,692 288,247,580
Cash in Banks and on Hand - City of South San Francisco 57,867,189Cash in Banks and on Hand - South San Francisco Conference Center 326,980
Total Cash and Investments $346,441,749
The City is a participant in the Local Agency Investment Fund (LAIF) that is regulated by California Government Code Section 16429 under the oversight of the Treasurer of the State of California. The City reports its investment in LAIF at the fair value amount provided by LAIF, which is the same as the value of the pool share. The balance is available for withdrawal on demand, and is based on the accounting records maintained by LAIF, which are recorded on an amortized cost basis. Each regular LAIF account is permitted to have up to 15 transactions per month, with a minimum transaction amount of $5,000, a maximum transaction amount of $75 million and at least 24 hours advance notice for withdrawals of $10 million or more. Bond proceeds accounts are subject to a one‐time deposit with no cap and are set up with a monthly draw down schedule. Included in LAIF’s investment portfolio are collateralized mortgage obligations, mortgage-backed securities, other asset-backed securities, loans to certain state funds, and floating rate securities issued by federal agencies, government-sponsored enterprises, United States Treasury Notes and Bills, and corporations. At June 30, 2020, these investments have an average maturity of 191 days. Money market funds are available for withdrawal on demand and as of June 30, 2020 have an average maturity of 41 days.
61

CITY OF SOUTH SAN FRANCISCO NOTES TO BASIC FINANCIALS STATEMENTS
For the Fiscal Year Ended June 30, 2020
NOTE 2 - CASH AND INVESTMENTS (Continued)
G. Credit Risk Credit risk is the risk that an issuer of an investment will not fulfill its obligation to the holder of the investment. This is measured by the assignment of a rating by a nationally recognized statistical rating organization. Presented below is the actual rating as of June 30, 2020, for each of the Primary Government’s investment types as provided by Moody’s investment rating system, except as noted:
Investment Type Aaa Aaa-mf Aa1-Aa3 A1-A3 TotalCity and Fiduciary:
Federal Agency Securities 46,822,767$ 46,822,767$ Money Market Funds $41,873,592 41,873,592Corporate Medium Term Notes 724,788 $7,608,739 $33,766,277 42,099,804Asset-Backed Securities 20,143,416 20,143,416Supranational Obligations 5,479,860 5,479,860
Totals 73,170,831$ 41,873,592$ 7,608,739$ 33,766,277$ 156,419,439
City and Fiduciary:Not rated:
Federal Agency Securities 7,477,570Asset-Backed Securities 5,966,812Local Agency Investment Fund 64,792,879
Exempt from credit rating disclosure:U.S. Treasury Notes 49,750,106
Not rated:Local Agency Investment Fund 3,840,774
Total Investments 288,247,580$
South San Francisco Conference Center:
H. Concentration of Credit Risk
The City’s investment policy contains limitations on the amount that can be invested in any one issuer beyond that stipulated by the California Government Code. Investments in any one issuer, other than U. S. Treasury securities, mutual funds, and external investment pools that represent 5% or more of total Entity-wide investments are as follows at June 30, 2020:
Issuer Investment Type Amount
Federal National Mortgage Association Federal Agency Securities 21,775,413$ Federal Home Loan Bank Federal Agency Securities 21,233,841Federal Home Loan Mortgage Corporation Federal Agency Securities 22,227,127
62
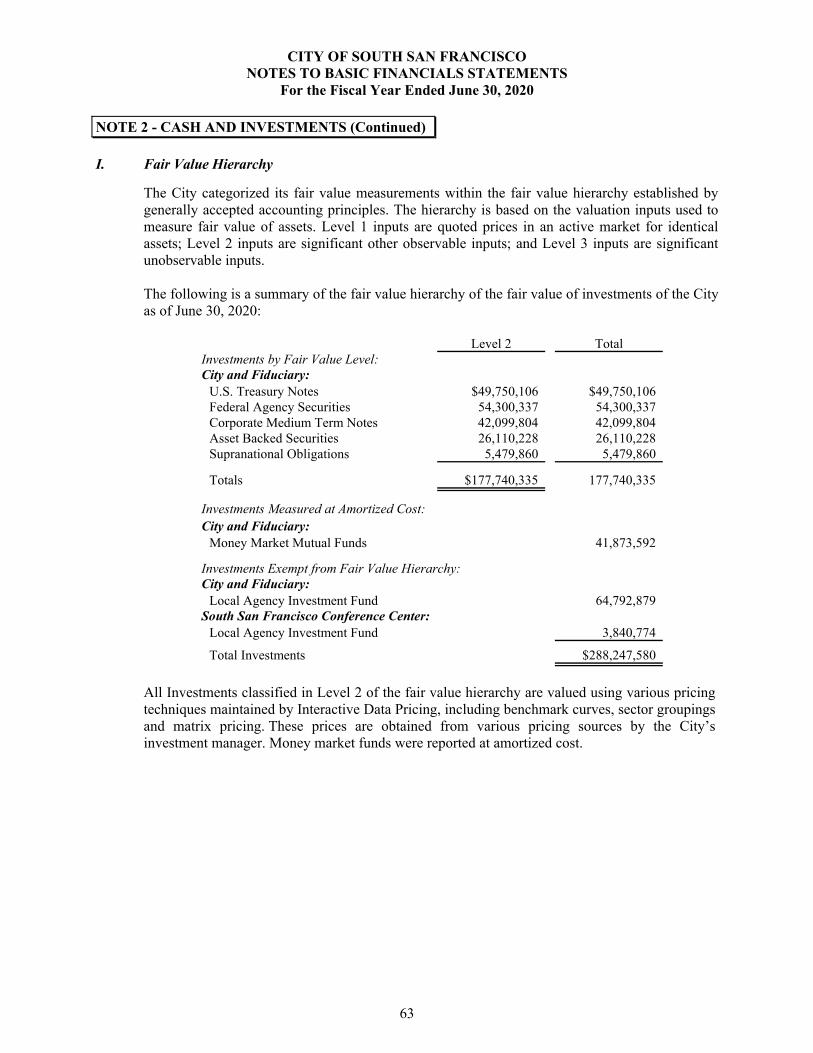
CITY OF SOUTH SAN FRANCISCO NOTES TO BASIC FINANCIALS STATEMENTS
For the Fiscal Year Ended June 30, 2020
NOTE 2 - CASH AND INVESTMENTS (Continued) I. Fair Value Hierarchy
The City categorized its fair value measurements within the fair value hierarchy established by generally accepted accounting principles. The hierarchy is based on the valuation inputs used to measure fair value of assets. Level 1 inputs are quoted prices in an active market for identical assets; Level 2 inputs are significant other observable inputs; and Level 3 inputs are significant unobservable inputs. The following is a summary of the fair value hierarchy of the fair value of investments of the City as of June 30, 2020:
Level 2 TotalInvestments by Fair Value Level:City and Fiduciary:
U.S. Treasury Notes $49,750,106 $49,750,106Federal Agency Securities 54,300,337 54,300,337Corporate Medium Term Notes 42,099,804 42,099,804Asset Backed Securities 26,110,228 26,110,228Supranational Obligations 5,479,860 5,479,860
Totals $177,740,335 177,740,335
Investments Measured at Amortized Cost:City and Fiduciary:
Money Market Mutual Funds 41,873,592
Investments Exempt from Fair Value Hierarchy:City and Fiduciary:
Local Agency Investment Fund 64,792,879South San Francisco Conference Center:
Local Agency Investment Fund 3,840,774
Total Investments $288,247,580
All Investments classified in Level 2 of the fair value hierarchy are valued using various pricing techniques maintained by Interactive Data Pricing, including benchmark curves, sector groupings and matrix pricing. These prices are obtained from various pricing sources by the City’s investment manager. Money market funds were reported at amortized cost.
63
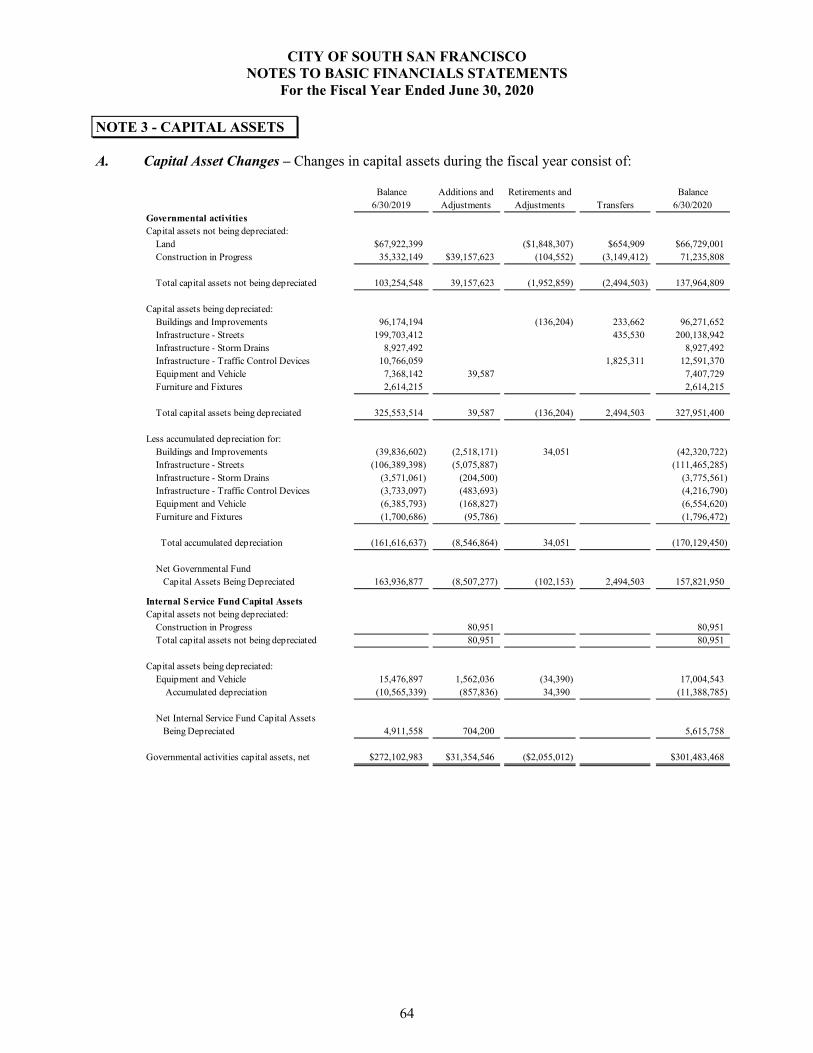
CITY OF SOUTH SAN FRANCISCO NOTES TO BASIC FINANCIALS STATEMENTS
For the Fiscal Year Ended June 30, 2020
NOTE 3 - CAPITAL ASSETS
A. Capital Asset Changes – Changes in capital assets during the fiscal year consist of:
Balance 6/30/2019
Additions and Adjustments
Retirements and Adjustments Transfers
Balance 6/30/2020
Governmental activitiesCapital assets not being depreciated:
Land $67,922,399 ($1,848,307) $654,909 $66,729,001Construction in Progress 35,332,149 $39,157,623 (104,552) (3,149,412) 71,235,808
Total capital assets not being depreciated 103,254,548 39,157,623 (1,952,859) (2,494,503) 137,964,809
Capital assets being depreciated:Buildings and Improvements 96,174,194 (136,204) 233,662 96,271,652Infrastructure - Streets 199,703,412 435,530 200,138,942Infrastructure - Storm Drains 8,927,492 8,927,492Infrastructure - Traffic Control Devices 10,766,059 1,825,311 12,591,370Equipment and Vehicle 7,368,142 39,587 7,407,729Furniture and Fixtures 2,614,215 2,614,215
Total capital assets being depreciated 325,553,514 39,587 (136,204) 2,494,503 327,951,400
Less accumulated depreciation for:Buildings and Improvements (39,836,602) (2,518,171) 34,051 (42,320,722)Infrastructure - Streets (106,389,398) (5,075,887) (111,465,285)Infrastructure - Storm Drains (3,571,061) (204,500) (3,775,561)Infrastructure - Traffic Control Devices (3,733,097) (483,693) (4,216,790)Equipment and Vehicle (6,385,793) (168,827) (6,554,620)Furniture and Fixtures (1,700,686) (95,786) (1,796,472)
Total accumulated depreciation (161,616,637) (8,546,864) 34,051 (170,129,450)
Net Governmental Fund Capital Assets Being Depreciated 163,936,877 (8,507,277) (102,153) 2,494,503 157,821,950
Internal Service Fund Capital AssetsCapital assets not being depreciated:
Construction in Progress 80,951 80,951 Total capital assets not being depreciated 80,951 80,951
Capital assets being depreciated:Equipment and Vehicle 15,476,897 1,562,036 (34,390) 17,004,543
Accumulated depreciation (10,565,339) (857,836) 34,390 (11,388,785)
Net Internal Service Fund Capital Assets Being Depreciated 4,911,558 704,200 5,615,758
Governmental activities capital assets, net $272,102,983 $31,354,546 ($2,055,012) $301,483,468
64
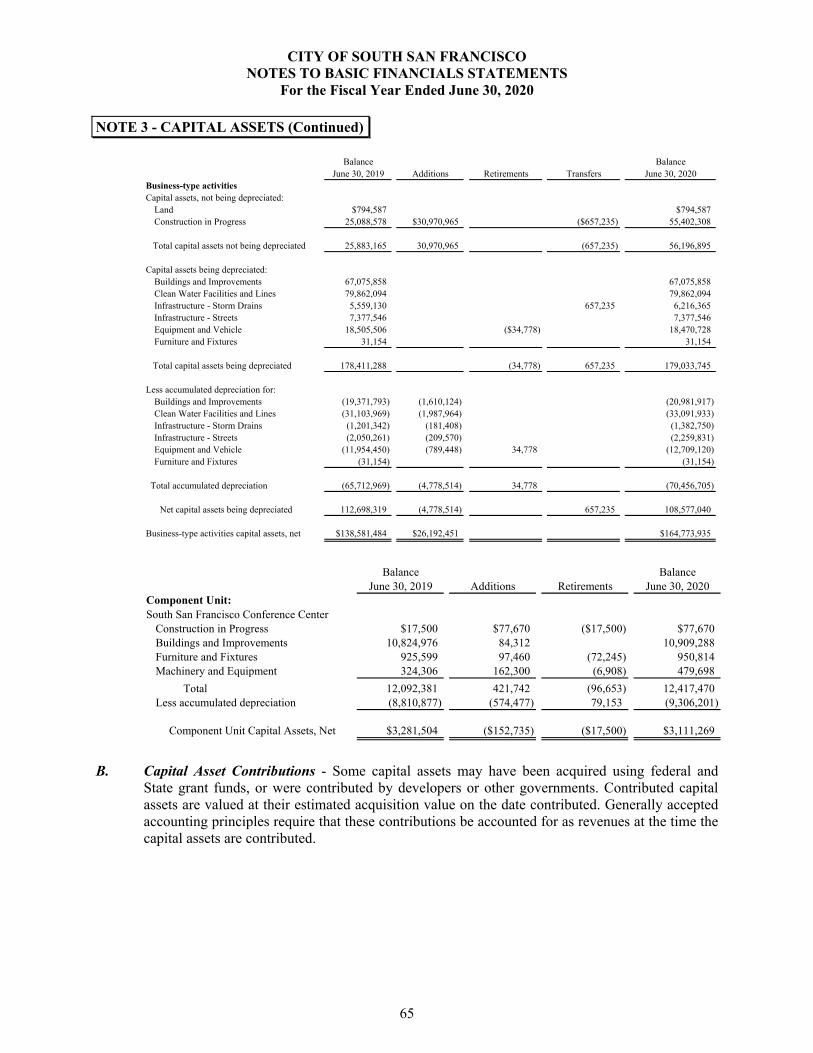
CITY OF SOUTH SAN FRANCISCO NOTES TO BASIC FINANCIALS STATEMENTS
For the Fiscal Year Ended June 30, 2020
NOTE 3 - CAPITAL ASSETS (Continued)
Balance BalanceJune 30, 2019 Additions Retirements Transfers June 30, 2020
Business-type activitiesCapital assets, not being depreciated:
Land $794,587 $794,587Construction in Progress 25,088,578 $30,970,965 ($657,235) 55,402,308
Total capital assets not being depreciated 25,883,165 30,970,965 (657,235) 56,196,895
Capital assets being depreciated:Buildings and Improvements 67,075,858 67,075,858Clean Water Facilities and Lines 79,862,094 79,862,094Infrastructure - Storm Drains 5,559,130 657,235 6,216,365Infrastructure - Streets 7,377,546 7,377,546Equipment and Vehicle 18,505,506 ($34,778) 18,470,728Furniture and Fixtures 31,154 31,154
Total capital assets being depreciated 178,411,288 (34,778) 657,235 179,033,745
Less accumulated depreciation for:Buildings and Improvements (19,371,793) (1,610,124) (20,981,917)Clean Water Facilities and Lines (31,103,969) (1,987,964) (33,091,933)Infrastructure - Storm Drains (1,201,342) (181,408) (1,382,750)Infrastructure - Streets (2,050,261) (209,570) (2,259,831)Equipment and Vehicle (11,954,450) (789,448) 34,778 (12,709,120)Furniture and Fixtures (31,154) (31,154)
Total accumulated depreciation (65,712,969) (4,778,514) 34,778 (70,456,705)
Net capital assets being depreciated 112,698,319 (4,778,514) 657,235 108,577,040
Business-type activities capital assets, net $138,581,484 $26,192,451 $164,773,935
Balance BalanceJune 30, 2019 Additions Retirements June 30, 2020
Component Unit:South San Francisco Conference Center
Construction in Progress $17,500 $77,670 ($17,500) $77,670Buildings and Improvements 10,824,976 84,312 10,909,288Furniture and Fixtures 925,599 97,460 (72,245) 950,814Machinery and Equipment 324,306 162,300 (6,908) 479,698
Total 12,092,381 421,742 (96,653) 12,417,470Less accumulated depreciation (8,810,877) (574,477) 79,153 (9,306,201)
Component Unit Capital Assets, Net $3,281,504 ($152,735) ($17,500) $3,111,269
B. Capital Asset Contributions - Some capital assets may have been acquired using federal andState grant funds, or were contributed by developers or other governments. Contributed capitalassets are valued at their estimated acquisition value on the date contributed. Generally acceptedaccounting principles require that these contributions be accounted for as revenues at the time thecapital assets are contributed.
65
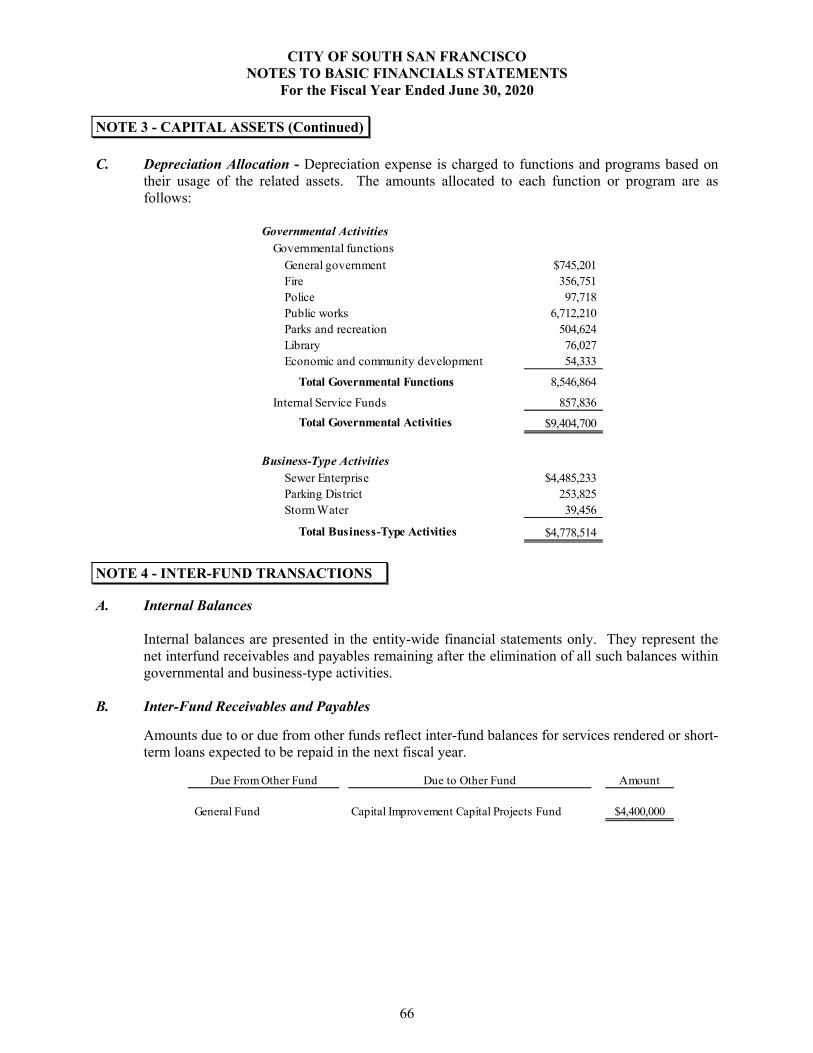
CITY OF SOUTH SAN FRANCISCO NOTES TO BASIC FINANCIALS STATEMENTS
For the Fiscal Year Ended June 30, 2020
NOTE 3 - CAPITAL ASSETS (Continued)
C. Depreciation Allocation - Depreciation expense is charged to functions and programs based on their usage of the related assets. The amounts allocated to each function or program are as follows:
Governmental Activities
Governmental functions
General government $745,201Fire 356,751Police 97,718Public works 6,712,210Parks and recreation 504,624Library 76,027Economic and community development 54,333
Total Governmental Functions 8,546,864
Internal Service Funds 857,836
Total Governmental Activities $9,404,700
Business-Type Activities
Sewer Enterprise $4,485,233Parking District 253,825Storm Water 39,456
Total Business-Type Activities $4,778,514
NOTE 4 - INTER-FUND TRANSACTIONS
A. Internal Balances
Internal balances are presented in the entity-wide financial statements only. They represent the net interfund receivables and payables remaining after the elimination of all such balances within governmental and business-type activities.
B. Inter-Fund Receivables and Payables Amounts due to or due from other funds reflect inter-fund balances for services rendered or short-term loans expected to be repaid in the next fiscal year.
Due From Other Fund Due to Other Fund Amount
General Fund Capital Improvement Capital Projects Fund $4,400,000
66
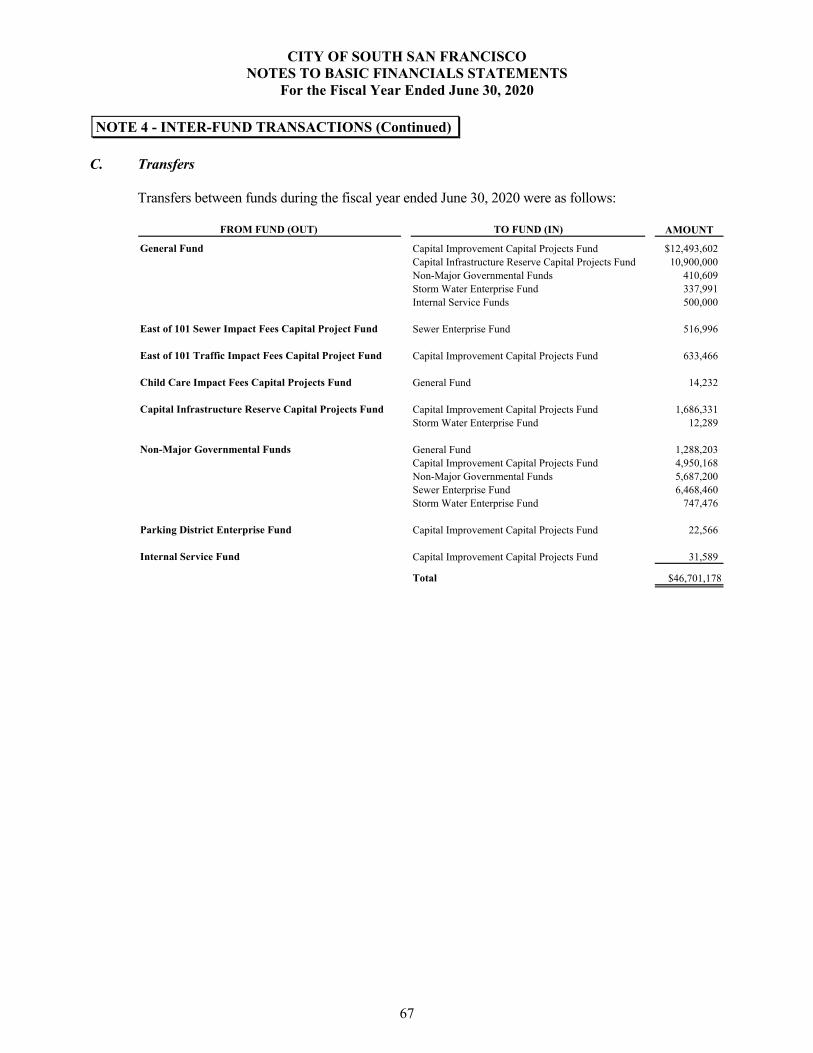
CITY OF SOUTH SAN FRANCISCO NOTES TO BASIC FINANCIALS STATEMENTS
For the Fiscal Year Ended June 30, 2020
NOTE 4 - INTER-FUND TRANSACTIONS (Continued)
C. Transfers Transfers between funds during the fiscal year ended June 30, 2020 were as follows:
FROM FUND (OUT) TO FUND (IN) AMOUNT
General Fund Capital Improvement Capital Projects Fund $12,493,602Capital Infrastructure Reserve Capital Projects Fund 10,900,000Non-Major Governmental Funds 410,609Storm Water Enterprise Fund 337,991Internal Service Funds 500,000
East of 101 Sewer Impact Fees Capital Project Fund Sewer Enterprise Fund 516,996
East of 101 Traffic Impact Fees Capital Project Fund Capital Improvement Capital Projects Fund 633,466
Child Care Impact Fees Capital Projects Fund General Fund 14,232
Capital Infrastructure Reserve Capital Projects Fund Capital Improvement Capital Projects Fund 1,686,331Storm Water Enterprise Fund 12,289
Non-Major Governmental Funds General Fund 1,288,203Capital Improvement Capital Projects Fund 4,950,168Non-Major Governmental Funds 5,687,200Sewer Enterprise Fund 6,468,460Storm Water Enterprise Fund 747,476
Parking District Enterprise Fund Capital Improvement Capital Projects Fund 22,566
Internal Service Fund Capital Improvement Capital Projects Fund 31,589
Total $46,701,178
67
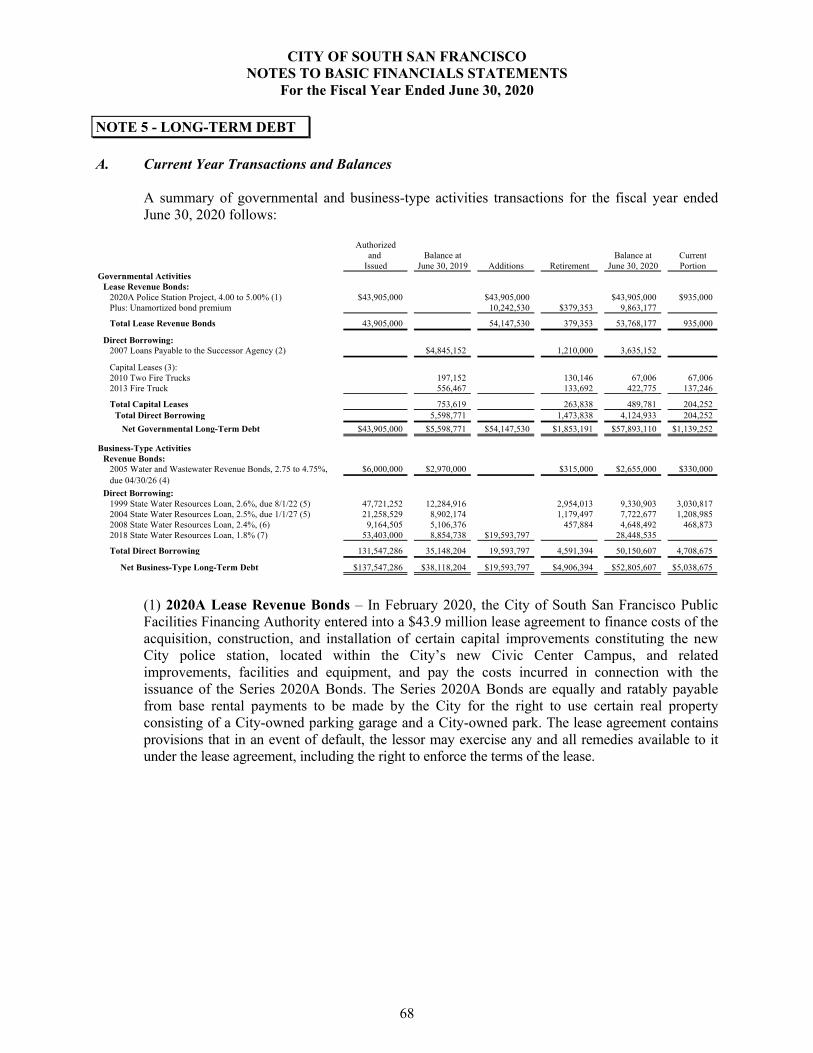
CITY OF SOUTH SAN FRANCISCO NOTES TO BASIC FINANCIALS STATEMENTS
For the Fiscal Year Ended June 30, 2020
NOTE 5 - LONG-TERM DEBT
A. Current Year Transactions and Balances
A summary of governmental and business-type activities transactions for the fiscal year ended June 30, 2020 follows:
Authorizedand Balance at Balance at Current
Issued June 30, 2019 Additions Retirement June 30, 2020 PortionGovernmental Activities
Lease Revenue Bonds:2020A Police Station Project, 4.00 to 5.00% (1) $43,905,000 $43,905,000 $43,905,000 $935,000Plus: Unamortized bond premium 10,242,530 $379,353 9,863,177
Total Lease Revenue Bonds 43,905,000 54,147,530 379,353 53,768,177 935,000
Direct Borrowing:2007 Loans Payable to the Successor Agency (2) $4,845,152 1,210,000 3,635,152
Capital Leases (3):2010 Two Fire Trucks 197,152 130,146 67,006 67,0062013 Fire Truck 556,467 133,692 422,775 137,246
Total Capital Leases 753,619 263,838 489,781 204,252Total Direct Borrowing 5,598,771 1,473,838 4,124,933 204,252
Net Governmental Long-Term Debt $43,905,000 $5,598,771 $54,147,530 $1,853,191 $57,893,110 $1,139,252
Business-Type Activities Revenue Bonds:
2005 Water and Wastewater Revenue Bonds, 2.75 to 4.75%, $6,000,000 $2,970,000 $315,000 $2,655,000 $330,000due 04/30/26 (4)
Direct Borrowing:1999 State Water Resources Loan, 2.6%, due 8/1/22 (5) 47,721,252 12,284,916 2,954,013 9,330,903 3,030,8172004 State Water Resources Loan, 2.5%, due 1/1/27 (5) 21,258,529 8,902,174 1,179,497 7,722,677 1,208,9852008 State Water Resources Loan, 2.4%, (6) 9,164,505 5,106,376 457,884 4,648,492 468,8732018 State Water Resources Loan, 1.8% (7) 53,403,000 8,854,738 $19,593,797 28,448,535
Total Direct Borrowing 131,547,286 35,148,204 19,593,797 4,591,394 50,150,607 4,708,675
Net Business-Type Long-Term Debt $137,547,286 $38,118,204 $19,593,797 $4,906,394 $52,805,607 $5,038,675
(1) 2020A Lease Revenue Bonds – In February 2020, the City of South San Francisco Public Facilities Financing Authority entered into a $43.9 million lease agreement to finance costs of the acquisition, construction, and installation of certain capital improvements constituting the new City police station, located within the City’s new Civic Center Campus, and related improvements, facilities and equipment, and pay the costs incurred in connection with the issuance of the Series 2020A Bonds. The Series 2020A Bonds are equally and ratably payable from base rental payments to be made by the City for the right to use certain real property consisting of a City-owned parking garage and a City-owned park. The lease agreement contains provisions that in an event of default, the lessor may exercise any and all remedies available to it under the lease agreement, including the right to enforce the terms of the lease.
68
CITY OF SOUTH SAN FRANCISCO NOTES TO BASIC FINANCIALS STATEMENTS
For the Fiscal Year Ended June 30, 2020
NOTE 5 - LONG-TERM DEBT (Continued)
(2) As of June 30, 2020, the Oyster Point Improvements Impact Fund owed the Successor Agency (formerly the Merged Redevelopment Project Area Capital Project Fund) for developer fees in the amount of $3,635,152 for the Flyover and Hookramps Projects that were completed in prior years. The outstanding balance will be paid off from the future developer fees. With the dissolution of the Agency effective January 31, 2012, the Successor Agency assumed the asset which the City is to repay. This payable is recorded as a long-term obligation (see also Note 13). Prior to the dissolution of all Redevelopment Agencies in California by the State, the former Redevelopment Agency (Agency) advanced $12,176,207 to the Oyster Point Improvement Impact Fee Capital Projects Fund (the Oyster Point Fund). The impact fees are collected according to a fee methodology adopted under the terms of AB 1600. The fees are assessed against commercial development in a specific geographic area that is primarily east of Highway 101 to repay the former Agency for the funds it advanced to the Oyster Point Fund to pay for freeway interchange improvements at Highway 101 and Oyster Point Blvd, and are assessed per an adopted Engineering report's formula that measures each new development's impact on the area's trip traffic. While the former Agency advanced the funds, the impact fee was put in place specifically to charge future developers for their share of traffic trips generated prior to the construction of the improvements. When the Agency was dissolved, the Successor Agency, and therefore, all local taxing entities, are entitled to receive future Oyster Point Impact fees collected by the City from developers. Future developers, not the City of South San Francisco, are legally obligated to pay the future fees until the liability owed to the Successor Agency is paid off as long as the fee continues to be levied and is in place. The repayment has significantly slowed since 2007, as development has subsided and fees assessed have therefore dropped. Management believes it may take 10-30 years or more before the Successor Agency is fully paid back.
(3) The City has entered into long-term capital leases with various financing agencies. Under these capital leases, all leased assets shall be distributed to the City at the end of the lease terms and shall thereafter remain the sole property of the City. Therefore, these capital leases have been recorded at the present value of the future minimum lease payments at the date of inception of the lease, and the corresponding assets have been included in the Statement of Net Position as appropriate. Capital lease payments are made from revenues of the Equipment Replacement Internal Service Fund and the General Fund. The lease agreements contain provisions that in an event of default, the lessor may (a) seize the properties, (b) sell or lease the properties or (c) exercise any and all remedies available to it under applicable law, including the right to enforce the terms of the lease, recover damages from the breach of the lease, and rescind the lease as to any portion of or all of the properties.
(4) On October 25, 2005, the California Statewide Communities Development Authority issued 2005D Water and Wastewater Revenue Bonds. The City participated in the pooled bond sale and the City’s portion of the debt is $6,000,000. Proceeds were used to finance sewer system capital improvement. The principal payments on the debt commenced in October 2006 and principal is due each October 1. The final principal payment is due on October 1, 2026. Interest payments ranging from the rates of 2.75% to 4.75% are payable semi-annually each April 1 and October 1. The 1999 and 2004 State Water Resources Loans and the 2005 Water and Wastewater Revenue Bonds are secured by a pledge of net revenues of the City’s Sewer Enterprise Fund. Net Revenues available for debt service amounted to $18.5 million which represented coverage of 3.6 over the $5,124,491 in total debt service.
69
CITY OF SOUTH SAN FRANCISCO NOTES TO BASIC FINANCIALS STATEMENTS
For the Fiscal Year Ended June 30, 2020
NOTE 5 - LONG-TERM DEBT (Continued)
(5) The two loans were authorized by the State Water Resources Control Board (SWRCB) to improve and expand the City’s wastewater treatment plant. Loan proceeds were issued as the projects progressed and debt service payments commenced one year after project completion. The loan agreements include provisions that in an event of default, all principal payments shall be immediately due and payable, interests on all amounts owed shall be paid at the highest legal rate, any additional payments shall be made and SWRCB shall enforce its rights under the agreements by any judicial proceeding, whether in law or equity. (6) 2008 State Water Resources Control Board Loan – In November 2007, the City approved the $11.8 million loan agreement with the SWRCB to finance the City’s Wet Weather Program project. Under the terms of the contract, the City has agreed to repay $11.8 million to the State in exchange for receiving $9.2 million in proceeds to be used to fund the Project. The difference between the repayment obligation and proceeds amounted to $2.6 million and represents in-substance interest on the outstanding balance. Debt service payments commenced on August 15, 2009. (7) 2018 State Water Resources Control Board Loan – In September 2018, the City entered into a $53.4 million loan agreement with the SWRCB to finance the South San Francisco/San Bruno’s Water Quality Control Plant Wet Weather and Digester Project. A portion of this amount, $4 million, is anticipated to be forgiven on the date of completion of construction. For the remaining $49.4 million, under the terms of the loan agreement the City has agreed to repay $59.2 million to the State. The difference between the repayment obligation and proceeds amounted to $9.8 million and represents in-substance interest on the outstanding balance. At June 30, 2019, the City had drawn down $8.9 million from SWRCB and $19.6 million was drawn in fiscal year 2020, with the remaining balance of $24.9 million expected to be drawn down in fiscal year 2021. There was no debt service payment required in fiscal year 2020, with the first debt service payment due in fiscal year ending 2024. Future debt service is expected to average $3 million per year through fiscal year 2043. In the event default has occurred, the City shall, upon demand, immediately accelerate the payment of all principal owed under this loan agreement, if any, which shall be immediately due and payable; pay interest at the highest legal rate on all amounts owed; and pay any additional payments as defined in the loan agreement. The 2008 and 2018 loans are secured by a pledge of sewer service charge revenues of the City’s Sewer Enterprise Fund. Sewer service charge revenues available for debt service amounted to $23.1 million which represented coverage of 43.6 over the $529,373 in debt service.
70
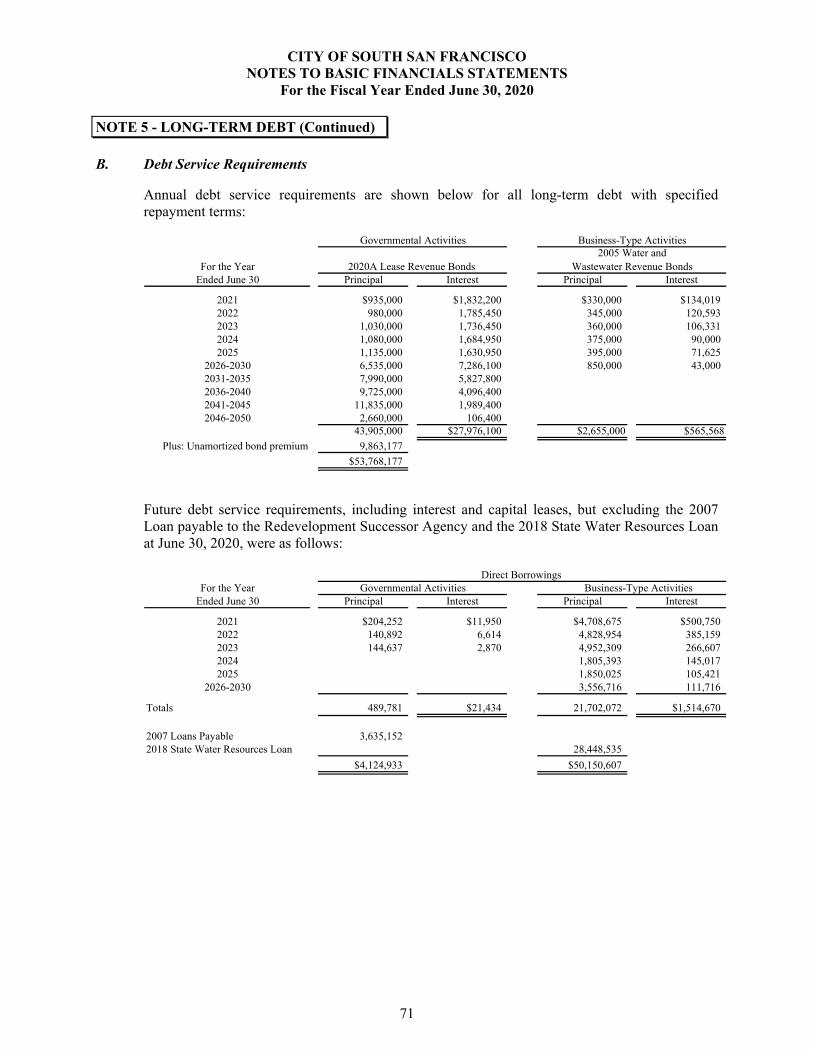
CITY OF SOUTH SAN FRANCISCO NOTES TO BASIC FINANCIALS STATEMENTS
For the Fiscal Year Ended June 30, 2020
NOTE 5 - LONG-TERM DEBT (Continued) B. Debt Service Requirements
Annual debt service requirements are shown below for all long-term debt with specified repayment terms:
Governmental Activities Business-Type Activities
For the Year 2020A Lease Revenue Bonds 2005 Water and
Wastewater Revenue BondsEnded June 30 Principal Interest Principal Interest
2021 $935,000 $1,832,200 $330,000 $134,0192022 980,000 1,785,450 345,000 120,5932023 1,030,000 1,736,450 360,000 106,3312024 1,080,000 1,684,950 375,000 90,0002025 1,135,000 1,630,950 395,000 71,625
2026-2030 6,535,000 7,286,100 850,000 43,0002031-2035 7,990,000 5,827,8002036-2040 9,725,000 4,096,4002041-2045 11,835,000 1,989,4002046-2050 2,660,000 106,400
43,905,000 $27,976,100 $2,655,000 $565,568
Plus: Unamortized bond premium 9,863,177
$53,768,177
Future debt service requirements, including interest and capital leases, but excluding the 2007 Loan payable to the Redevelopment Successor Agency and the 2018 State Water Resources Loan at June 30, 2020, were as follows:
For the Year Governmental Activities Business-Type ActivitiesEnded June 30 Principal Interest Principal Interest
2021 $204,252 $11,950 $4,708,675 $500,7502022 140,892 6,614 4,828,954 385,1592023 144,637 2,870 4,952,309 266,6072024 1,805,393 145,0172025 1,850,025 105,421
2026-2030 3,556,716 111,716
Totals 489,781 $21,434 21,702,072 $1,514,670
2007 Loans Payable 3,635,1522018 State Water Resources Loan 28,448,535
$4,124,933 $50,150,607
Direct Borrowings
71
CITY OF SOUTH SAN FRANCISCO NOTES TO BASIC FINANCIALS STATEMENTS
For the Fiscal Year Ended June 30, 2020
NOTE 5 - LONG-TERM DEBT (Continued)
Capital Leases are issued for the purpose of financing the construction or acquisition of projects defined in each leasing arrangement. Projects are leased to the City for lease payments which, together with unspent proceeds of the leasing arrangement, will be sufficient to meet the debt service obligations of the leasing arrangement. At the termination of the leasing arrangement, title to the project will pass to the City.
Leasing arrangements are similar to debt; they allow investors to participate in a share of guaranteed payments which are made by the City. Because they are similar to debt, the present value of the total of the payments to be made by the City is recorded as long-term debt. The City’s leasing arrangements are included in long term obligations discussed above.
A summary of capital assets leased through the issuance of leasing arrangements follows:
OriginalLeasing Arrangement Fund/Activity Cost
Capital Leases Governmental Activity $5,842,799
C. Legal Debt Margin
The City is subject to a debt limit that is 3.75% of the total assessed value of property, net ofexempt real property. At June 30, 2020, that amount was $784,957,532. As of June 30, 2020, theCity did not have any outstanding debt applicable to the limit.
NOTE 6 - NET POSITION AND FUND BALANCES
A. Net Position
Net Position is the excess of all the City’s assets and deferred outflows of resources over all itsliabilities and deferred inflows of resources, regardless of fund. Net Position are divided intothree captions. These captions apply only to Net Position, which is determined only at theGovernment-wide level, and are described below:
Net Investment in Capital Assets describes the portion of Net Position which is represented by thecurrent net book value of the City’s capital assets, less the outstanding balance of any debt issuedto finance these assets.
Restricted describes the portion of Net Position which is restricted as to use by the terms andconditions of agreements with outside parties, governmental regulations, laws, or otherrestrictions which the City cannot unilaterally alter.
Unrestricted describes the portion of Net Position which is not restricted to use.
72
CITY OF SOUTH SAN FRANCISCO NOTES TO BASIC FINANCIALS STATEMENTS
For the Fiscal Year Ended June 30, 2020
NOTE 6 - NET POSITION AND FUND BALANCE (Continued)
B. Fund Balance
The City’s fund balances are classified in accordance with generally accepted accounting principles which require the City to classify its fund balances based on spending constraints imposed on the use of resources.
For programs with multiple funding sources, the City prioritizes and expends funds in the following order: Restricted, Committed, Assigned, and Unassigned. Each category in the following hierarchy is ranked according to the degree of spending constraint. Nonspendables represents balances set aside to indicate items do not represent available, spendable resources even though they are a component of assets. Fund balances required to be maintained intact, such as Permanent Funds, and assets not expected to be converted to cash, such as prepaids, notes receivable, and land held for redevelopment are included. However, if proceeds realized from the sale or collection of nonspendable assets are restricted, committed or assigned, then Nonspendable amounts are required to be presented as a component of the applicable category. Restricted fund balances have external restrictions imposed by creditors, grantors, contributors, laws, regulations, or enabling legislation which requires the resources to be used only for a specific purpose. Nonspendable amounts subject to restrictions are included along with spendable resources. Committed fund balances have constraints imposed by Council Resolution of the City Council which may be altered only by Council Resolution of the City Council. Nonspendable amounts subject to council commitments are included along with spendable resources. Assigned fund balances are amounts constrained by the City’s intent to be used for a specific purpose, but are neither restricted nor committed. Intent is expressed by the City Council or its designee and may be changed at the discretion of the City Council or its designee. The City Council had delegated authority to the Finance Director to assign fund balances which are not otherwise restricted or committed. This category includes nonspendables, when it is the City’s intent to use proceeds or collections for a specific purpose, and residual fund balances, if any, of Special Revenue, Capital Projects and Debt Service Funds which have not been restricted or committed. Unassigned fund balance represents residual amounts that have not been restricted, committed, or assigned. This includes the residual general fund balance and residual fund deficits, if any, of other governmental funds. Minimum Fund Balance Policies - The City’s Reserve Policy is to have the General Fund Reserves equal to at least two months of operating revenues of 15% and up to 20%, which is in alignment with GFOA best practices. Included is an emergency reserve that reflects 2% of the general fund operating expenditures budget as well as an economic contingency which is 7% of general fund revenues. Funds in excess of these requirements will continue to be earmarked for paying down long-term liabilities, such as the Retiree Health/Other Post-Employment Benefits (OPEB) or for Infrastructure and Facilities Replacement needs.
73
CITY OF SOUTH SAN FRANCISCO NOTES TO BASIC FINANCIALS STATEMENTS
For the Fiscal Year Ended June 30, 2020
NOTE 6 - NET POSITION AND FUND BALANCE (Continued) Detailed classifications of the City’s Fund Balances, as of June 30, 2020, are below:
Low and Moderate East of 101 East of 101General Income Housing Capital Sewer Traffic
Fund Balance Classifications Fund Assets Improvement Impact Fees Impact Fees
Nonspendables:Items not in spendable form:
Inventory and prepaid items $574
Total Nonspendable Fund Balances 574
Restricted for:Sewer Impact Fees $5,407,840Traffic impact fees projects $25,015,746Low and moderate housing projects $6,010,064Redevelopment and community development activities 18,372,633
Total Restricted Fund Balances 18,372,633 6,010,064 5,407,840 25,015,746
Committed for:Capital projects 2,756,632Local services 14,966,706
Total Committed Fund Balances 17,723,338
Assigned to:Capital projects 5,720,788
Total Assigned Fund Balances 5,720,788
Unassigned:General fund 43,296,762Capital Improvement Fund $235,649
Total Unassigned Fund Balances 43,296,762 235,649
Total Fund Balances $85,114,095 $6,010,064 $235,649 $5,407,840 $25,015,746
Capital Project Funds
Capital Capital OtherChild Care Developer Infrastructure Improvements Governmental
Fund Balance Classifications (continued) Impact Fees Deposit Reserve Fund Police Station Funds
Restricted for:
Child Care impact fees projects $6,185,208Developer deposit fees projects $16,788Police station projects $46,604,509Gas Tax projects $439,759Developer contributions projects 7,938,850Community Development Block Grant projects 352,586Maintenance districts projects 4,273,972Transportation sales tax projects 2,799,809City programs projects 6,546,780Other Special Revenues projects 10,676,980Capital projects activities 17,874,258
Total Restricted Fund Balances 6,185,208 16,788 46,604,509 50,902,994
Assigned to:Capital infrastructure projects $29,363,924
Total Assigned Fund Balances 29,363,924
Total Fund Balances $6,185,208 $16,788 $29,363,924 $46,604,509 $50,902,994
Capital Project Funds
74
CITY OF SOUTH SAN FRANCISCO NOTES TO BASIC FINANCIALS STATEMENTS
For the Fiscal Year Ended June 30, 2020
NOTE 6 - NET POSITION AND FUND BALANCE (Continued)
C. Encumbrances The City uses an encumbrance system as an extension of normal budgetary accounting for governmental funds. Under this system, purchase orders, contracts, and other commitments for the expenditure of monies are recorded in order to reserve that portion of applicable appropriations. Encumbrances outstanding at year-end are recorded as restricted, committed or assigned fund balance, depending on the classification of the resources to be used to liquidate the encumbrance, since they do not constitute expenditures or liabilities. Unexpended appropriations lapse at year-end and must be reappropriated in the following year. Encumbrances outstanding in governmental funds as of June 30, 2020, were as listed below:
Governmental funds: Amount
General Fund $5,720,788Low and Moderate Income Housing Assets
Special Revenue Fund 2,502,113Capital Improvement Capital Projects Fund 13,872,958Child Care Impact Fees Capital Projects Fund 1,500Capital Infrastructure Reserve Capital Projects Fund 933,000Capital Improvements Police Station Capital Projects Fund 45,462,322Other Governmental Funds 2,622,779Total $71,115,460
NOTE 7 - PENSION PLANS
For purposes of measuring the net pension liability and deferred outflows/inflows of resources related to pensions, and pension expense, information about the fiduciary net position of the City’s California Public Employees’ Retirement System (CalPERS) plans (Plans) and additions to/deductions from the Plans’ fiduciary net position have been determined on the same basis as they are reported by the CalPERS Financial Office. For this purpose, benefit payments (including refunds of employee contributions) are recognized when due and payable in accordance with the benefit terms. Investments are reported at fair value.
A. General Information about the Pension Plans
Plan Descriptions – All qualified permanent and probationary employees are eligible to participate in the City’s separate Safety (police and fire) and Miscellaneous (all other) Plans, agent multiple-employer defined benefit pension plans administered by the California Public Employees’ Retirement System (CalPERS), which acts as a common investment and administrative agent for its participating member employers. Benefit provisions under the Plans are established by State statute and City resolution. CalPERS issues publicly available reports that include a full description of the pension plans regarding benefit provisions, assumptions and membership information that can be found on the CalPERS website.
75
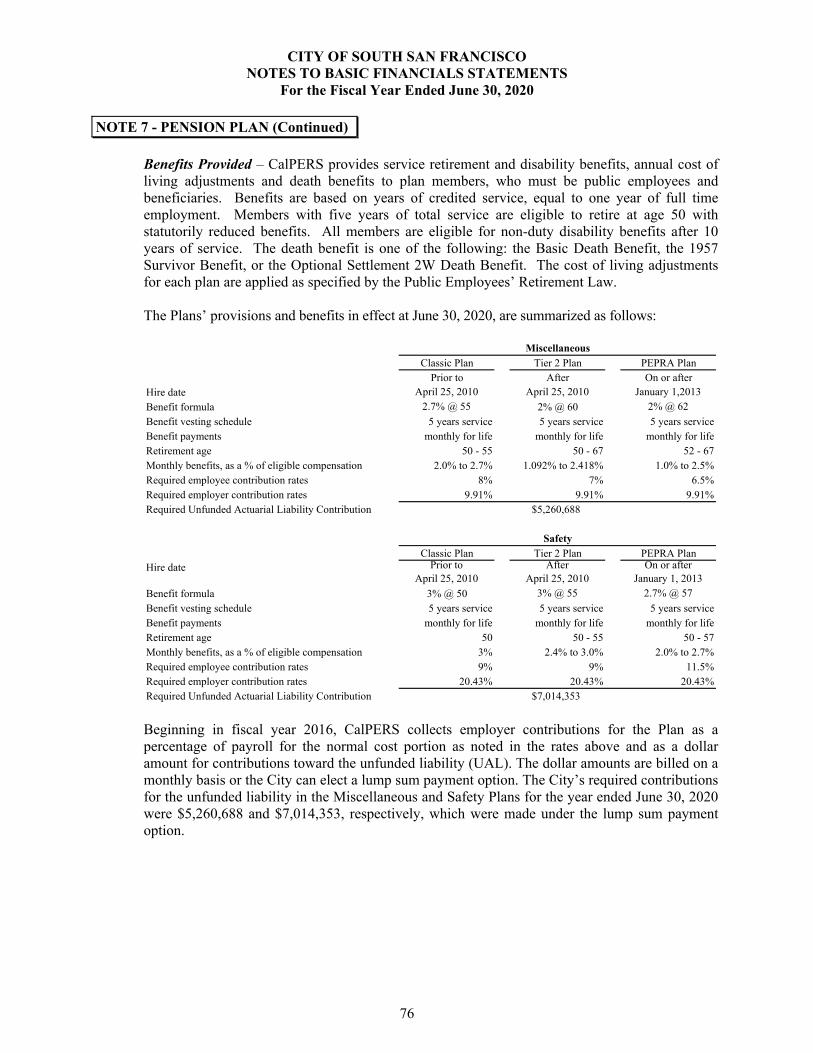
CITY OF SOUTH SAN FRANCISCO NOTES TO BASIC FINANCIALS STATEMENTS
For the Fiscal Year Ended June 30, 2020
NOTE 7 - PENSION PLAN (Continued) Benefits Provided – CalPERS provides service retirement and disability benefits, annual cost of living adjustments and death benefits to plan members, who must be public employees and beneficiaries. Benefits are based on years of credited service, equal to one year of full time employment. Members with five years of total service are eligible to retire at age 50 with statutorily reduced benefits. All members are eligible for non-duty disability benefits after 10 years of service. The death benefit is one of the following: the Basic Death Benefit, the 1957 Survivor Benefit, or the Optional Settlement 2W Death Benefit. The cost of living adjustments for each plan are applied as specified by the Public Employees’ Retirement Law.
The Plans’ provisions and benefits in effect at June 30, 2020, are summarized as follows:
Miscellaneous
Classic Plan Tier 2 Plan PEPRA PlanPrior to After On or after
Hire date April 25, 2010 April 25, 2010 January 1,2013
Benefit formula 2.7% @ 55 2% @ 60 2% @ 62
Benefit vesting schedule 5 years service 5 years service 5 years serviceBenefit payments monthly for life monthly for life monthly for lifeRetirement age 50 - 55 50 - 67 52 - 67Monthly benefits, as a % of eligible compensation 2.0% to 2.7% 1.092% to 2.418% 1.0% to 2.5%Required employee contribution rates 8% 7% 6.5%Required employer contribution rates 9.91% 9.91% 9.91%Required Unfunded Actuarial Liability Contribution $5,260,688
Safety
Classic Plan Tier 2 Plan PEPRA PlanHire date Prior to
April 25, 2010After
April 25, 2010 On or after
January 1, 2013
Benefit formula 3% @ 50 3% @ 55 2.7% @ 57
Benefit vesting schedule 5 years service 5 years service 5 years serviceBenefit payments monthly for life monthly for life monthly for lifeRetirement age 50 50 - 55 50 - 57Monthly benefits, as a % of eligible compensation 3% 2.4% to 3.0% 2.0% to 2.7%Required employee contribution rates 9% 9% 11.5%Required employer contribution rates 20.43% 20.43% 20.43%Required Unfunded Actuarial Liability Contribution $7,014,353 Beginning in fiscal year 2016, CalPERS collects employer contributions for the Plan as a percentage of payroll for the normal cost portion as noted in the rates above and as a dollar amount for contributions toward the unfunded liability (UAL). The dollar amounts are billed on a monthly basis or the City can elect a lump sum payment option. The City’s required contributions for the unfunded liability in the Miscellaneous and Safety Plans for the year ended June 30, 2020 were $5,260,688 and $7,014,353, respectively, which were made under the lump sum payment option.
76
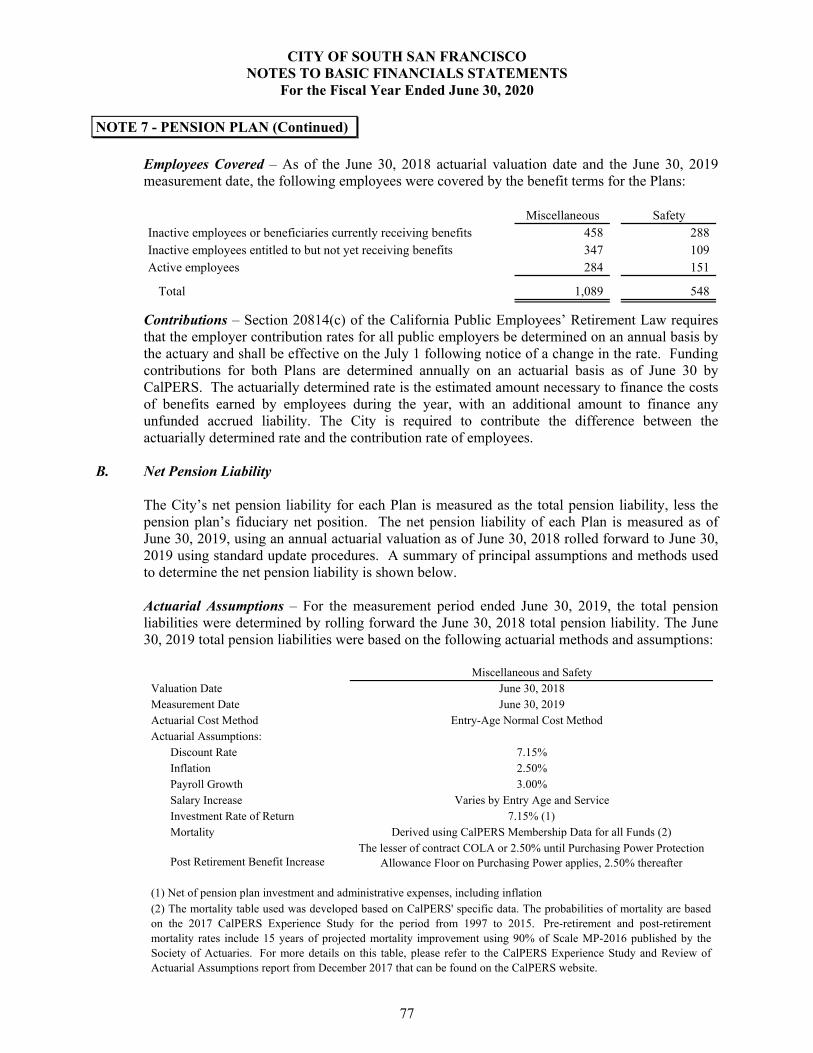
CITY OF SOUTH SAN FRANCISCO NOTES TO BASIC FINANCIALS STATEMENTS
For the Fiscal Year Ended June 30, 2020
NOTE 7 - PENSION PLAN (Continued)
Employees Covered – As of the June 30, 2018 actuarial valuation date and the June 30, 2019 measurement date, the following employees were covered by the benefit terms for the Plans:
Miscellaneous SafetyInactive employees or beneficiaries currently receiving benefits 458 288Inactive employees entitled to but not yet receiving benefits 347 109Active employees 284 151
Total 1,089 548
Contributions – Section 20814(c) of the California Public Employees’ Retirement Law requires that the employer contribution rates for all public employers be determined on an annual basis by the actuary and shall be effective on the July 1 following notice of a change in the rate. Funding contributions for both Plans are determined annually on an actuarial basis as of June 30 by CalPERS. The actuarially determined rate is the estimated amount necessary to finance the costs of benefits earned by employees during the year, with an additional amount to finance any unfunded accrued liability. The City is required to contribute the difference between the actuarially determined rate and the contribution rate of employees.
B. Net Pension Liability
The City’s net pension liability for each Plan is measured as the total pension liability, less thepension plan’s fiduciary net position. The net pension liability of each Plan is measured as ofJune 30, 2019, using an annual actuarial valuation as of June 30, 2018 rolled forward to June 30,2019 using standard update procedures. A summary of principal assumptions and methods usedto determine the net pension liability is shown below.
Actuarial Assumptions – For the measurement period ended June 30, 2019, the total pensionliabilities were determined by rolling forward the June 30, 2018 total pension liability. The June30, 2019 total pension liabilities were based on the following actuarial methods and assumptions:
Valuation DateMeasurement DateActuarial Cost MethodActuarial Assumptions:
Discount RateInflationPayroll GrowthSalary IncreaseInvestment Rate of ReturnMortality
Post Retirement Benefit Increase
(1) Net of pension plan investment and administrative expenses, including inflation(2) The mortality table used was developed based on CalPERS' specific data. The probabilities of mortality are basedon the 2017 CalPERS Experience Study for the period from 1997 to 2015. Pre-retirement and post-retirementmortality rates include 15 years of projected mortality improvement using 90% of Scale MP-2016 published by theSociety of Actuaries. For more details on this table, please refer to the CalPERS Experience Study and Review ofActuarial Assumptions report from December 2017 that can be found on the CalPERS website.
2.50%
Varies by Entry Age and Service7.15% (1)
The lesser of contract COLA or 2.50% until Purchasing Power Protection Allowance Floor on Purchasing Power applies, 2.50% thereafter
Derived using CalPERS Membership Data for all Funds (2)
3.00%
Miscellaneous and SafetyJune 30, 2018June 30, 2019
Entry-Age Normal Cost Method
7.15%
77
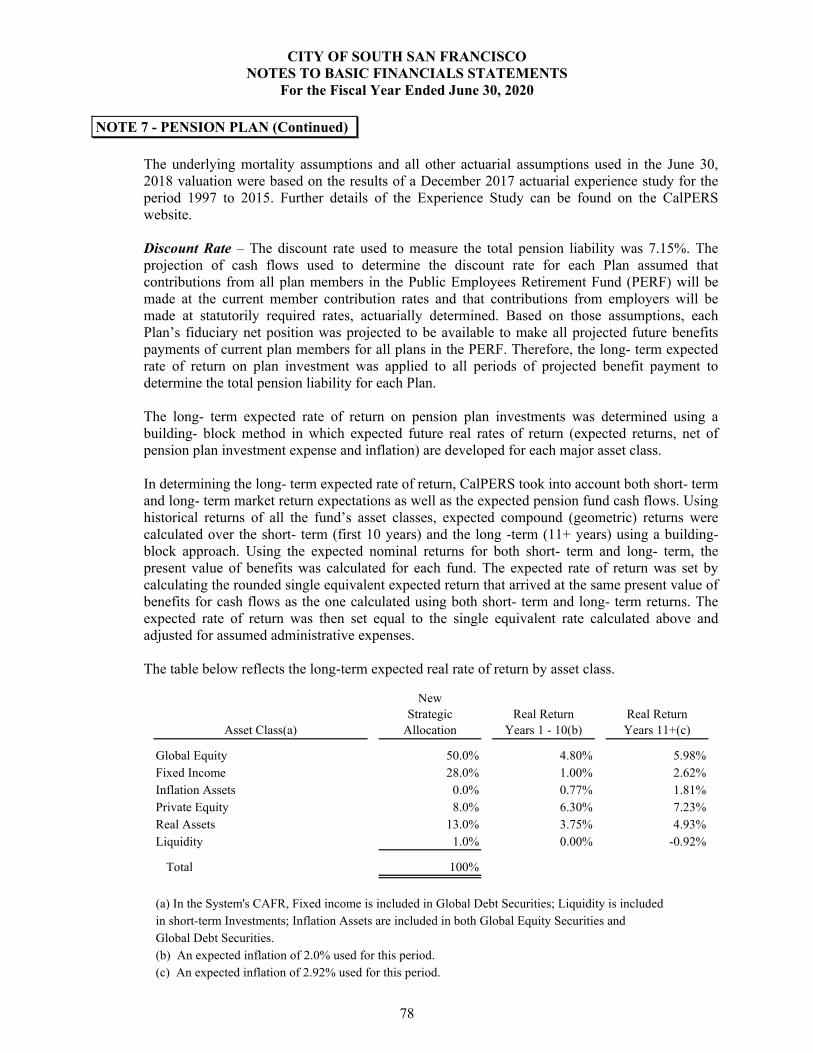
CITY OF SOUTH SAN FRANCISCO NOTES TO BASIC FINANCIALS STATEMENTS
For the Fiscal Year Ended June 30, 2020
NOTE 7 - PENSION PLAN (Continued)
The underlying mortality assumptions and all other actuarial assumptions used in the June 30, 2018 valuation were based on the results of a December 2017 actuarial experience study for the period 1997 to 2015. Further details of the Experience Study can be found on the CalPERS website. Discount Rate – The discount rate used to measure the total pension liability was 7.15%. The projection of cash flows used to determine the discount rate for each Plan assumed that contributions from all plan members in the Public Employees Retirement Fund (PERF) will be made at the current member contribution rates and that contributions from employers will be made at statutorily required rates, actuarially determined. Based on those assumptions, each Plan’s fiduciary net position was projected to be available to make all projected future benefits payments of current plan members for all plans in the PERF. Therefore, the long- term expected rate of return on plan investment was applied to all periods of projected benefit payment to determine the total pension liability for each Plan. The long- term expected rate of return on pension plan investments was determined using a building- block method in which expected future real rates of return (expected returns, net of pension plan investment expense and inflation) are developed for each major asset class. In determining the long- term expected rate of return, CalPERS took into account both short- term and long- term market return expectations as well as the expected pension fund cash flows. Using historical returns of all the fund’s asset classes, expected compound (geometric) returns were calculated over the short- term (first 10 years) and the long -term (11+ years) using a building- block approach. Using the expected nominal returns for both short- term and long- term, the present value of benefits was calculated for each fund. The expected rate of return was set by calculating the rounded single equivalent expected return that arrived at the same present value of benefits for cash flows as the one calculated using both short- term and long- term returns. The expected rate of return was then set equal to the single equivalent rate calculated above and adjusted for assumed administrative expenses. The table below reflects the long-term expected real rate of return by asset class.
Asset Class(a)
NewStrategic
AllocationReal Return
Years 1 - 10(b)Real ReturnYears 11+(c)
Global Equity 50.0% 4.80% 5.98%Fixed Income 28.0% 1.00% 2.62%Inflation Assets 0.0% 0.77% 1.81%Private Equity 8.0% 6.30% 7.23%Real Assets 13.0% 3.75% 4.93%Liquidity 1.0% 0.00% -0.92%
Total 100%
(a) In the System's CAFR, Fixed income is included in Global Debt Securities; Liquidity is includedin short-term Investments; Inflation Assets are included in both Global Equity Securities and Global Debt Securities.(b) An expected inflation of 2.0% used for this period.(c) An expected inflation of 2.92% used for this period.
78
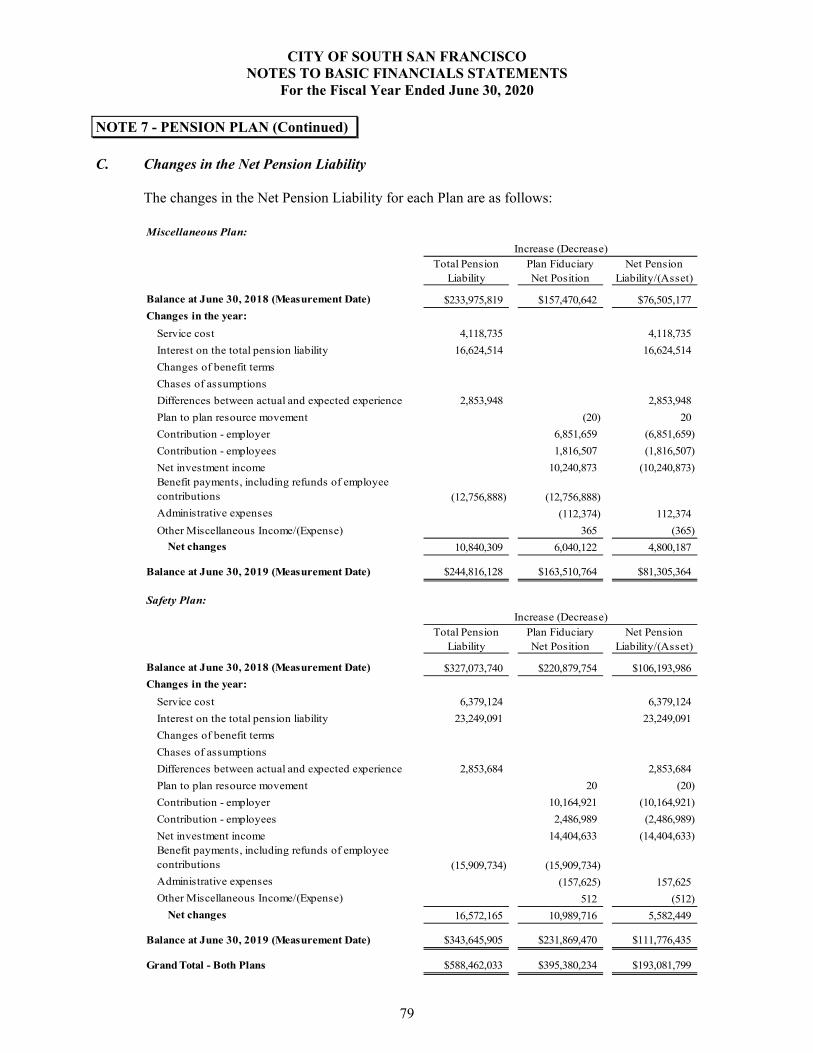
CITY OF SOUTH SAN FRANCISCO NOTES TO BASIC FINANCIALS STATEMENTS
For the Fiscal Year Ended June 30, 2020
NOTE 7 - PENSION PLAN (Continued)
C. Changes in the Net Pension Liability
The changes in the Net Pension Liability for each Plan are as follows:
Miscellaneous Plan:
Increase (Decrease)Total Pension
LiabilityPlan FiduciaryNet Position
Net Pension Liability/(Asset)
Balance at June 30, 2018 (Measurement Date) $233,975,819 $157,470,642 $76,505,177
Changes in the year:
Service cost 4,118,735 4,118,735
Interest on the total pension liability 16,624,514 16,624,514
Changes of benefit terms
Chases of assumptions
Differences between actual and expected experience 2,853,948 2,853,948
Plan to plan resource movement (20) 20
Contribution - employer 6,851,659 (6,851,659)
Contribution - employees 1,816,507 (1,816,507)
Net investment income 10,240,873 (10,240,873)Benefit payments, including refunds of employee contributions (12,756,888) (12,756,888)
Administrative expenses (112,374) 112,374
Other Miscellaneous Income/(Expense) 365 (365)
Net changes 10,840,309 6,040,122 4,800,187
Balance at June 30, 2019 (Measurement Date) $244,816,128 $163,510,764 $81,305,364
Safety Plan:
Increase (Decrease)Total Pension
LiabilityPlan FiduciaryNet Position
Net Pension Liability/(Asset)
Balance at June 30, 2018 (Measurement Date) $327,073,740 $220,879,754 $106,193,986
Changes in the year:
Service cost 6,379,124 6,379,124
Interest on the total pension liability 23,249,091 23,249,091
Changes of benefit terms
Chases of assumptions
Differences between actual and expected experience 2,853,684 2,853,684
Plan to plan resource movement 20 (20)
Contribution - employer 10,164,921 (10,164,921)
Contribution - employees 2,486,989 (2,486,989)
Net investment income 14,404,633 (14,404,633)Benefit payments, including refunds of employee contributions (15,909,734) (15,909,734)
Administrative expenses (157,625) 157,625
Other Miscellaneous Income/(Expense) 512 (512)
Net changes 16,572,165 10,989,716 5,582,449
Balance at June 30, 2019 (Measurement Date) $343,645,905 $231,869,470 $111,776,435
Grand Total - Both Plans $588,462,033 $395,380,234 $193,081,799
79
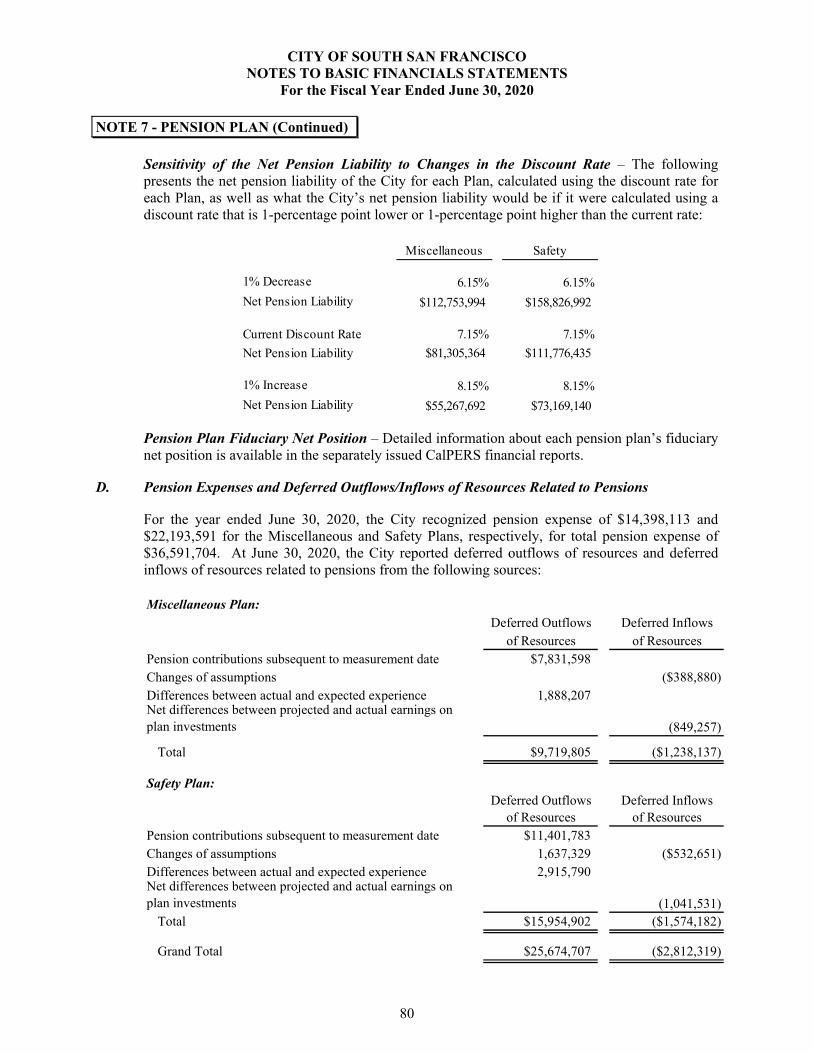
CITY OF SOUTH SAN FRANCISCO NOTES TO BASIC FINANCIALS STATEMENTS
For the Fiscal Year Ended June 30, 2020
NOTE 7 - PENSION PLAN (Continued) Sensitivity of the Net Pension Liability to Changes in the Discount Rate – The following presents the net pension liability of the City for each Plan, calculated using the discount rate for each Plan, as well as what the City’s net pension liability would be if it were calculated using a discount rate that is 1-percentage point lower or 1-percentage point higher than the current rate:
Miscellaneous Safety
1% Decrease 6.15% 6.15%
Net Pension Liability $112,753,994 $158,826,992
Current Discount Rate 7.15% 7.15%
Net Pension Liability $81,305,364 $111,776,435
1% Increase 8.15% 8.15%
Net Pension Liability $55,267,692 $73,169,140
Pension Plan Fiduciary Net Position – Detailed information about each pension plan’s fiduciary net position is available in the separately issued CalPERS financial reports.
D. Pension Expenses and Deferred Outflows/Inflows of Resources Related to Pensions For the year ended June 30, 2020, the City recognized pension expense of $14,398,113 and $22,193,591 for the Miscellaneous and Safety Plans, respectively, for total pension expense of $36,591,704. At June 30, 2020, the City reported deferred outflows of resources and deferred inflows of resources related to pensions from the following sources: Miscellaneous Plan:
Deferred Outflows Deferred Inflowsof Resources of Resources
Pension contributions subsequent to measurement date $7,831,598Changes of assumptions ($388,880)Differences between actual and expected experience 1,888,207Net differences between projected and actual earnings on plan investments (849,257)
Total $9,719,805 ($1,238,137)
Safety Plan:Deferred Outflows Deferred Inflows
of Resources of ResourcesPension contributions subsequent to measurement date $11,401,783Changes of assumptions 1,637,329 ($532,651)Differences between actual and expected experience 2,915,790Net differences between projected and actual earnings on plan investments (1,041,531)
Total $15,954,902 ($1,574,182)
Grand Total $25,674,707 ($2,812,319)
80
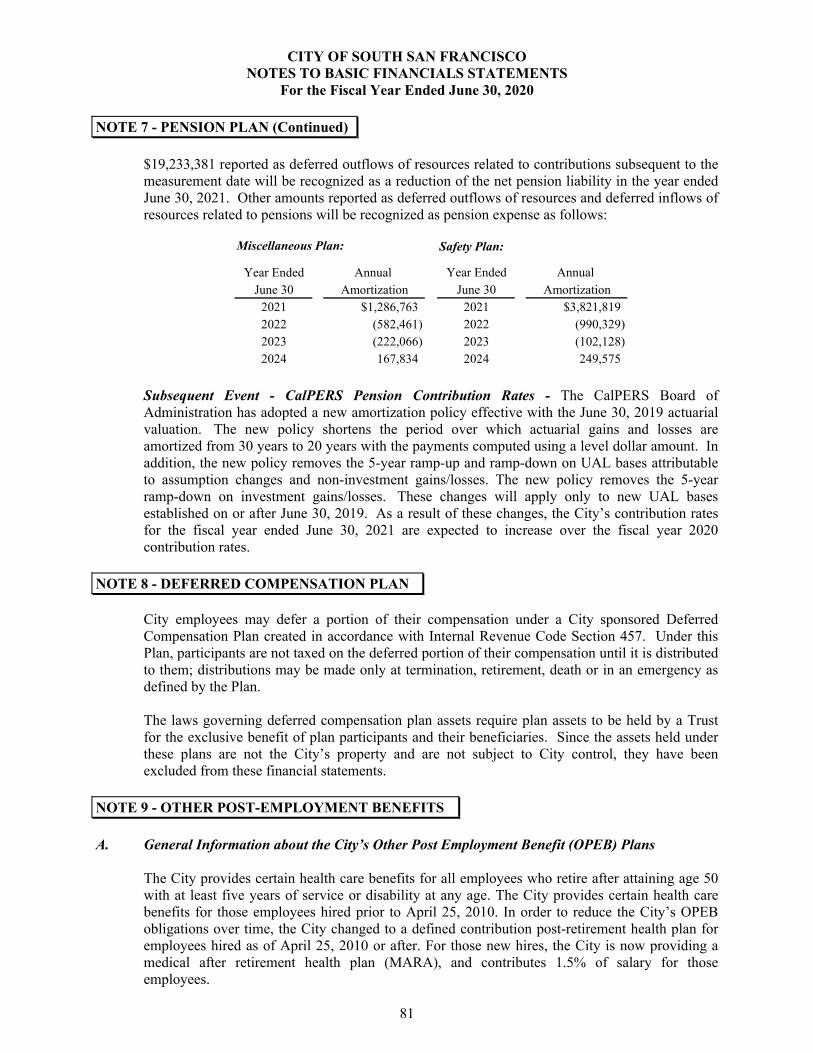
CITY OF SOUTH SAN FRANCISCO NOTES TO BASIC FINANCIALS STATEMENTS
For the Fiscal Year Ended June 30, 2020
NOTE 7 - PENSION PLAN (Continued) $19,233,381 reported as deferred outflows of resources related to contributions subsequent to the measurement date will be recognized as a reduction of the net pension liability in the year ended June 30, 2021. Other amounts reported as deferred outflows of resources and deferred inflows of resources related to pensions will be recognized as pension expense as follows:
Miscellaneous Plan:
Year Ended Annual June 30 Amortization
2021 $1,286,7632022 (582,461)2023 (222,066)2024 167,834
Safety Plan:
Year Ended Annual June 30 Amortization
2021 $3,821,8192022 (990,329)2023 (102,128)2024 249,575
Subsequent Event - CalPERS Pension Contribution Rates - The CalPERS Board of Administration has adopted a new amortization policy effective with the June 30, 2019 actuarial valuation. The new policy shortens the period over which actuarial gains and losses are amortized from 30 years to 20 years with the payments computed using a level dollar amount. In addition, the new policy removes the 5-year ramp-up and ramp-down on UAL bases attributable to assumption changes and non-investment gains/losses. The new policy removes the 5-year ramp-down on investment gains/losses. These changes will apply only to new UAL bases established on or after June 30, 2019. As a result of these changes, the City’s contribution rates for the fiscal year ended June 30, 2021 are expected to increase over the fiscal year 2020 contribution rates.
NOTE 8 - DEFERRED COMPENSATION PLAN
City employees may defer a portion of their compensation under a City sponsored Deferred
Compensation Plan created in accordance with Internal Revenue Code Section 457. Under this Plan, participants are not taxed on the deferred portion of their compensation until it is distributed to them; distributions may be made only at termination, retirement, death or in an emergency as defined by the Plan.
The laws governing deferred compensation plan assets require plan assets to be held by a Trust
for the exclusive benefit of plan participants and their beneficiaries. Since the assets held under these plans are not the City’s property and are not subject to City control, they have been excluded from these financial statements.
NOTE 9 - OTHER POST-EMPLOYMENT BENEFITS A. General Information about the City’s Other Post Employment Benefit (OPEB) Plans
The City provides certain health care benefits for all employees who retire after attaining age 50 with at least five years of service or disability at any age. The City provides certain health care benefits for those employees hired prior to April 25, 2010. In order to reduce the City’s OPEB obligations over time, the City changed to a defined contribution post-retirement health plan for employees hired as of April 25, 2010 or after. For those new hires, the City is now providing a medical after retirement health plan (MARA), and contributes 1.5% of salary for those employees.
81
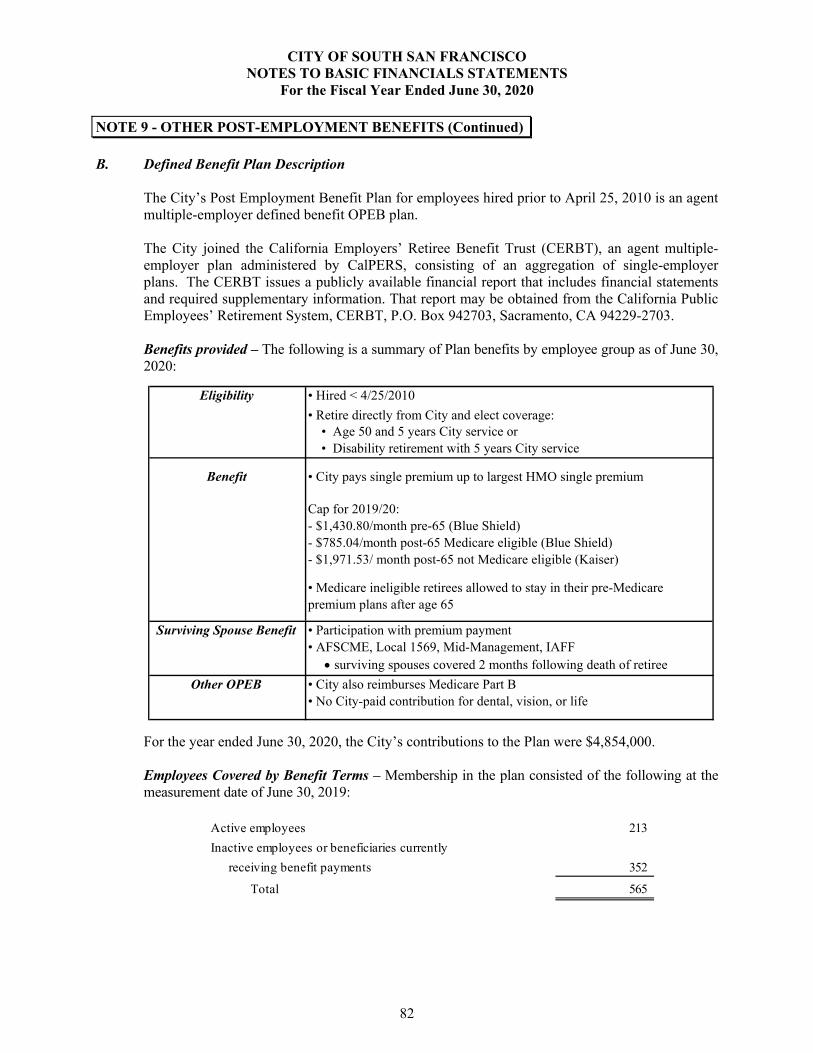
CITY OF SOUTH SAN FRANCISCO NOTES TO BASIC FINANCIALS STATEMENTS
For the Fiscal Year Ended June 30, 2020
NOTE 9 - OTHER POST-EMPLOYMENT BENEFITS (Continued) B. Defined Benefit Plan Description
The City’s Post Employment Benefit Plan for employees hired prior to April 25, 2010 is an agent multiple-employer defined benefit OPEB plan. The City joined the California Employers’ Retiree Benefit Trust (CERBT), an agent multiple-employer plan administered by CalPERS, consisting of an aggregation of single-employer plans. The CERBT issues a publicly available financial report that includes financial statements and required supplementary information. That report may be obtained from the California Public Employees’ Retirement System, CERBT, P.O. Box 942703, Sacramento, CA 94229-2703.
Benefits provided – The following is a summary of Plan benefits by employee group as of June 30, 2020:
Eligibility • Hired < 4/25/2010
• Retire directly from City and elect coverage: • Age 50 and 5 years City service or • Disability retirement with 5 years City service
Benefit • City pays single premium up to largest HMO single premium
Cap for 2019/20:- $1,430.80/month pre-65 (Blue Shield)- $785.04/month post-65 Medicare eligible (Blue Shield)- $1,971.53/ month post-65 not Medicare eligible (Kaiser)
• Medicare ineligible retirees allowed to stay in their pre-Medicare premium plans after age 65
Surviving Spouse Benefit • Participation with premium payment• AFSCME, Local 1569, Mid-Management, IAFF surviving spouses covered 2 months following death of retiree
Other OPEB • City also reimburses Medicare Part B• No City-paid contribution for dental, vision, or life
For the year ended June 30, 2020, the City’s contributions to the Plan were $4,854,000. Employees Covered by Benefit Terms – Membership in the plan consisted of the following at the measurement date of June 30, 2019:
Active employees 213
Inactive employees or beneficiaries currently
receiving benefit payments 352
Total 565
82
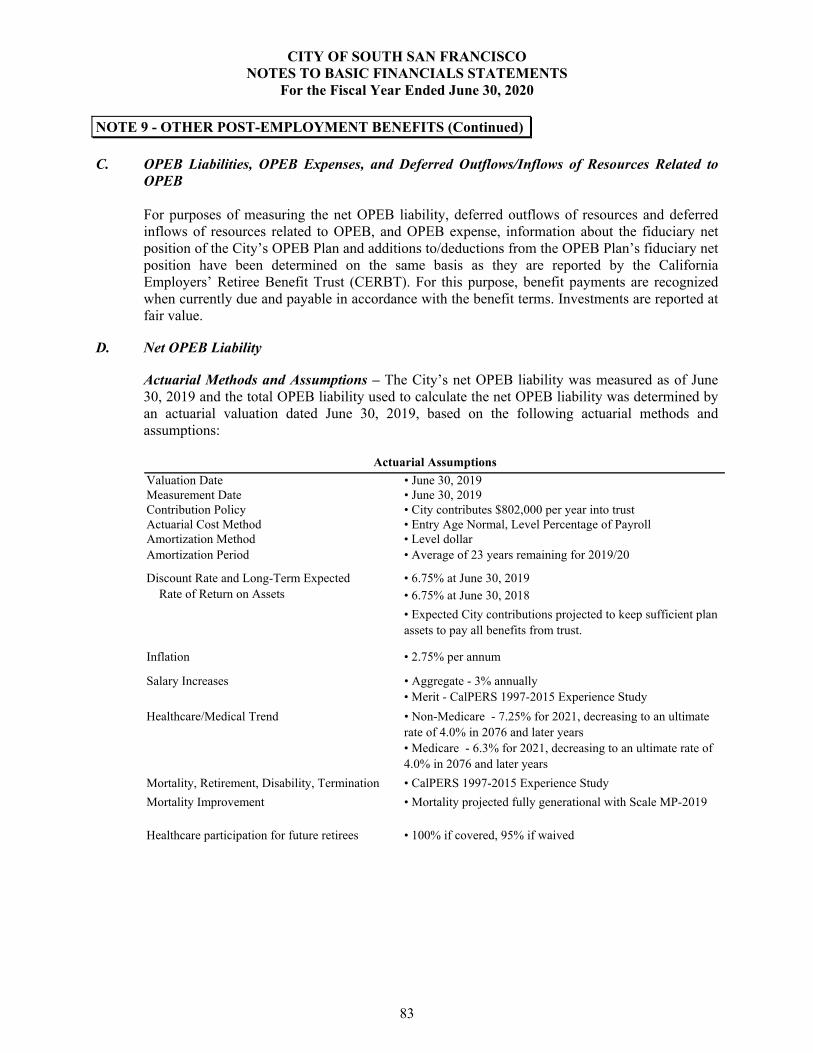
CITY OF SOUTH SAN FRANCISCO NOTES TO BASIC FINANCIALS STATEMENTS
For the Fiscal Year Ended June 30, 2020
NOTE 9 - OTHER POST-EMPLOYMENT BENEFITS (Continued) C. OPEB Liabilities, OPEB Expenses, and Deferred Outflows/Inflows of Resources Related to
OPEB For purposes of measuring the net OPEB liability, deferred outflows of resources and deferred
inflows of resources related to OPEB, and OPEB expense, information about the fiduciary net position of the City’s OPEB Plan and additions to/deductions from the OPEB Plan’s fiduciary net position have been determined on the same basis as they are reported by the California Employers’ Retiree Benefit Trust (CERBT). For this purpose, benefit payments are recognized when currently due and payable in accordance with the benefit terms. Investments are reported at fair value.
D. Net OPEB Liability Actuarial Methods and Assumptions – The City’s net OPEB liability was measured as of June 30, 2019 and the total OPEB liability used to calculate the net OPEB liability was determined by an actuarial valuation dated June 30, 2019, based on the following actuarial methods and assumptions:
Valuation Date • June 30, 2019Measurement Date • June 30, 2019Contribution Policy • City contributes $802,000 per year into trustActuarial Cost Method • Entry Age Normal, Level Percentage of PayrollAmortization Method • Level dollarAmortization Period • Average of 23 years remaining for 2019/20
• 6.75% at June 30, 2019• 6.75% at June 30, 2018
• Expected City contributions projected to keep sufficient plan assets to pay all benefits from trust.
Inflation • 2.75% per annum
Salary Increases • Aggregate - 3% annually• Merit - CalPERS 1997-2015 Experience Study
Healthcare/Medical Trend • Non-Medicare - 7.25% for 2021, decreasing to an ultimate rate of 4.0% in 2076 and later years• Medicare - 6.3% for 2021, decreasing to an ultimate rate of 4.0% in 2076 and later years
Mortality, Retirement, Disability, Termination • CalPERS 1997-2015 Experience Study
Mortality Improvement • Mortality projected fully generational with Scale MP-2019
Healthcare participation for future retirees • 100% if covered, 95% if waived
Discount Rate and Long-Term Expected Rate of Return on Assets
Actuarial Assumptions
83
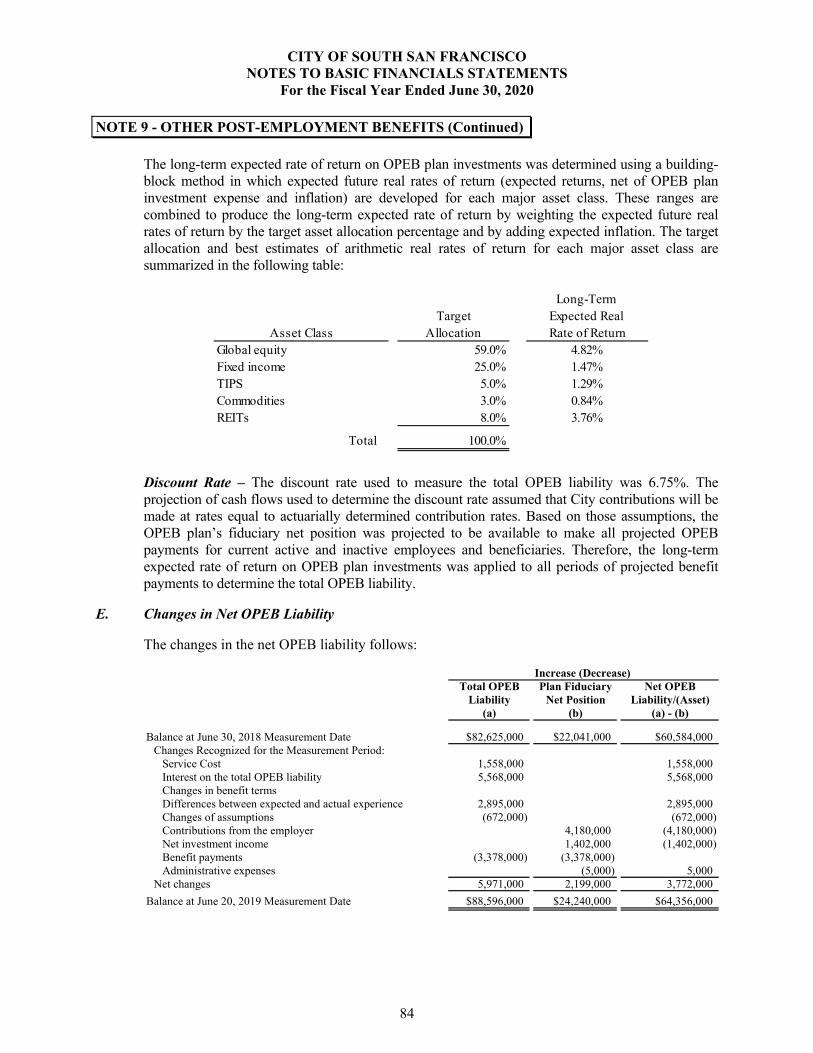
CITY OF SOUTH SAN FRANCISCO NOTES TO BASIC FINANCIALS STATEMENTS
For the Fiscal Year Ended June 30, 2020
NOTE 9 - OTHER POST-EMPLOYMENT BENEFITS (Continued)
The long-term expected rate of return on OPEB plan investments was determined using a building-block method in which expected future real rates of return (expected returns, net of OPEB plan investment expense and inflation) are developed for each major asset class. These ranges are combined to produce the long-term expected rate of return by weighting the expected future real rates of return by the target asset allocation percentage and by adding expected inflation. The target allocation and best estimates of arithmetic real rates of return for each major asset class are summarized in the following table:
Long-Term Target Expected Real
Asset Class Allocation Rate of ReturnGlobal equity 59.0% 4.82%Fixed income 25.0% 1.47%TIPS 5.0% 1.29%Commodities 3.0% 0.84%REITs 8.0% 3.76%
Total 100.0%
Discount Rate – The discount rate used to measure the total OPEB liability was 6.75%. The projection of cash flows used to determine the discount rate assumed that City contributions will be made at rates equal to actuarially determined contribution rates. Based on those assumptions, the OPEB plan’s fiduciary net position was projected to be available to make all projected OPEB payments for current active and inactive employees and beneficiaries. Therefore, the long-term expected rate of return on OPEB plan investments was applied to all periods of projected benefit payments to determine the total OPEB liability.
E. Changes in Net OPEB Liability
The changes in the net OPEB liability follows:
Total OPEB Plan Fiduciary Net OPEBLiability Net Position Liability/(Asset)
(a) (b) (a) - (b)
Balance at June 30, 2018 Measurement Date $82,625,000 $22,041,000 $60,584,000Changes Recognized for the Measurement Period:
Service Cost 1,558,000 1,558,000Interest on the total OPEB liability 5,568,000 5,568,000Changes in benefit termsDifferences between expected and actual experience 2,895,000 2,895,000Changes of assumptions (672,000) (672,000)Contributions from the employer 4,180,000 (4,180,000)Net investment income 1,402,000 (1,402,000)Benefit payments (3,378,000) (3,378,000)Administrative expenses (5,000) 5,000
Net changes 5,971,000 2,199,000 3,772,000
Balance at June 20, 2019 Measurement Date $88,596,000 $24,240,000 $64,356,000
Increase (Decrease)
84
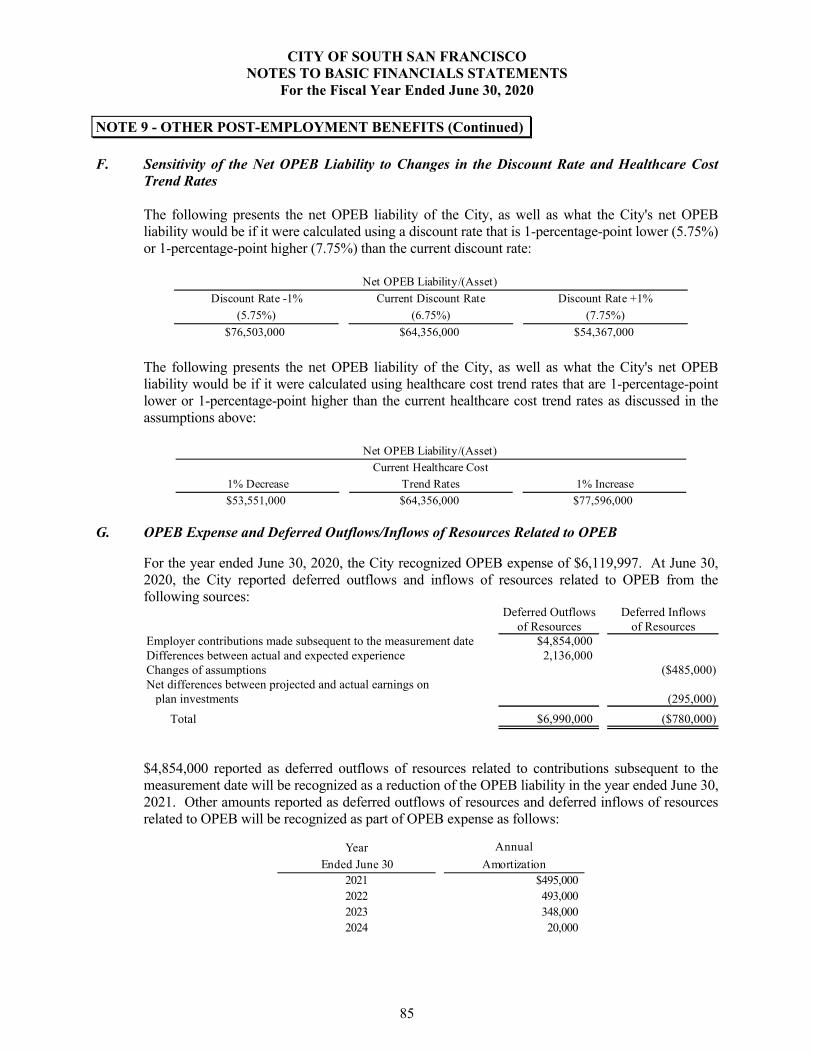
CITY OF SOUTH SAN FRANCISCO NOTES TO BASIC FINANCIALS STATEMENTS
For the Fiscal Year Ended June 30, 2020
NOTE 9 - OTHER POST-EMPLOYMENT BENEFITS (Continued)
F. Sensitivity of the Net OPEB Liability to Changes in the Discount Rate and Healthcare CostTrend Rates
The following presents the net OPEB liability of the City, as well as what the City's net OPEBliability would be if it were calculated using a discount rate that is 1-percentage-point lower (5.75%)or 1-percentage-point higher (7.75%) than the current discount rate:
Net OPEB Liability/(Asset)
Discount Rate -1% Current Discount Rate Discount Rate +1%
(5.75%) (6.75%) (7.75%)
$76,503,000 $64,356,000 $54,367,000
The following presents the net OPEB liability of the City, as well as what the City's net OPEB liability would be if it were calculated using healthcare cost trend rates that are 1-percentage-point lower or 1-percentage-point higher than the current healthcare cost trend rates as discussed in the assumptions above:
Net OPEB Liability/(Asset)
Current Healthcare Cost
1% Decrease Trend Rates 1% Increase
$53,551,000 $64,356,000 $77,596,000
G. OPEB Expense and Deferred Outflows/Inflows of Resources Related to OPEB
For the year ended June 30, 2020, the City recognized OPEB expense of $6,119,997. At June 30,2020, the City reported deferred outflows and inflows of resources related to OPEB from thefollowing sources:
Deferred Outflows Deferred Inflowsof Resources of Resources
Employer contributions made subsequent to the measurement date $4,854,000Differences between actual and expected experience 2,136,000Changes of assumptions ($485,000)Net differences between projected and actual earnings on
plan investments (295,000)
Total $6,990,000 ($780,000)
$4,854,000 reported as deferred outflows of resources related to contributions subsequent to the measurement date will be recognized as a reduction of the OPEB liability in the year ended June 30, 2021. Other amounts reported as deferred outflows of resources and deferred inflows of resources related to OPEB will be recognized as part of OPEB expense as follows:
Year Annual
Ended June 30 Amortization2021 $495,0002022 493,0002023 348,0002024 20,000
85
CITY OF SOUTH SAN FRANCISCO NOTES TO BASIC FINANCIALS STATEMENTS
For the Fiscal Year Ended June 30, 2020
NOTE 9 - OTHER POST-EMPLOYMENT BENEFITS (Continued)
H. Defined Contribution Plan Description The City of South San Francisco funded HRA Plan is a defined contribution OPEB plan for employees hired on or after April 25, 2010. For those new hires, the City provides a medical after retirement health plan (MARA), and contributes 1.5% of salary for those employees. In addition, employees contribute to the MARA plan as directed by their respective bargaining unit’s Memorandum of Understanding or compensation plan. The plan is administered by Matrix Trust Company. Employee contributions for the fiscal year totaled $200,361. Employer contributions of $373,207 were paid into the Defined Contribution Plan. No liability for the defined contribution has been included in the report since the City fully paid the annual required contribution. Since the assets held under this plan are not the City’s property and are not subject to claims by general creditors of the City, the assets have been excluded from these financial statements.
NOTE 10 - JOINTLY GOVERNED ORGANIZATIONS The City participates in the jointly governed organizations discussed below through formally organized and separate entities established under the Joint Exercise of Powers Act of the State of California. As separate legal entities, these entities exercise full powers and authorities within the scope of the related Joint Powers Agreements including the preparation of annual budgets, accountability for all funds, the power to make and execute contracts and the right to sue and be sued. Each joint organization is governed by a board consisting of representatives from member municipalities. Each board controls the operations of the respective joint organization, including selection of management and approval of operating budgets, independent of any influence by member municipalities beyond their representation on that board. Obligations and liabilities of this joint organization are not the City’s responsibility and the City does not have an equity interest in the assets of each joint organization except upon dissolution of the joint organization.
A. Oyster Point Marina (OPM) was established in 1977 by the City and the San Mateo County Harbor District (Harbor District) for the purpose of expanding, improving and operating the Oyster Point Marina and Park. The governing board consists of two of the City's council members and two Harbor District commissioners. The Harbor District operates OPM. Operation of the Marina provides revenues for the marina's operations. The City retains title to the land; however, the City is not liable for any obligations of the San Mateo County Harbor District. Condensed unaudited financial information may be obtained from San Mateo County Harbor District, #1 Johnson Pier, Half Moon Bay, CA 94019.
86
CITY OF SOUTH SAN FRANCISCO NOTES TO BASIC FINANCIALS STATEMENTS
For the Fiscal Year Ended June 30, 2020
NOTE 10 - JOINTLY GOVERNED ORGANIZATIONS (Continued) B. Peninsula Traffic Congestion Relief Alliance (PTCRA)
PTCRA was formed from the merger of the Inter City Transportation Systems Management
Agency and Multi-City Transportation Systems Management Agency (MCTSMA) in 2000. The members are the cities of South San Francisco, Brisbane, Colma, Daly City, Half Moon Bay, Millbrae, Pacifica and San Bruno and seven other members for the purpose of mitigating traffic congestion. The governing board consists of one council member from each member city. The finance director of the City of San Carlos acts as the treasurer and controller of PTCRA. The individual cities are not liable for the debts, liabilities or obligations of PTCRA. Each member city has an equal interest in PTCRA. Condensed accrual basis unaudited financial information may be obtained from the City of San Carlos Finance Department, 666 Elm Street, San Carlos, CA 94070.
C. City/County Association of Governments (C/CAG) C/CAG was established in 1990 by the County of San Mateo and the Cities of San Mateo County
for preparation, adoption, monitoring and enforcing of Countywide state mandated plans. A Board of Directors consisting of one council member from each member city and one member from the County Board of Supervisors governs C/CAG. The city treasurer of San Carlos acts as the treasurer of C/CAG. The individual cities and the County are not liable for the debts, liabilities, or obligations of C/CAG. Condensed unaudited cash basis financial information may be obtained from the City of San Carlos Finance Department, 666 Elm Street, San Carlos, CA 94070.
NOTE 11 - RISK MANAGEMENT A. Insurance Coverage The City participates in Pooled Liability Assurance Network Joint Powers Authority (PLAN
JPA), a nonprofit benefit corporation established to provide liability insurance coverage, claims and risk management, and legal defense to its participating members. PLAN JPA provides $2,500,000 of self- funded general liability and automobile coverage and $27,500,000 excess liability coverage per occurrence and is responsible for paying claims in excess of the City’s $100,000 self-insured retention. The Plan includes a per occurrence or wrongful act or employee benefit wrongful act up to $10,000,000 with two retained limits of $5,000,000. For the year ended June 30, 2020, the City paid PLAN JPA $1,357,655 in premiums and did not receive a refund of premiums paid in prior years. Financial statements may be obtained from PLAN JPA 1750 Creekside Oaks Drive, Suite 200, Sacramento, CA 95833. The City has also purchased excess coverage insurance for worker’s compensation claims from CSAC Excess Insurance Authority (CSAC-EIA). CSAC-EIA provides coverage up to statutory limits in excess of the City’s $500,000 self-insured retention. For the past five fiscal years, general liability and worker compensation settlements did not exceed insurance coverage.
87
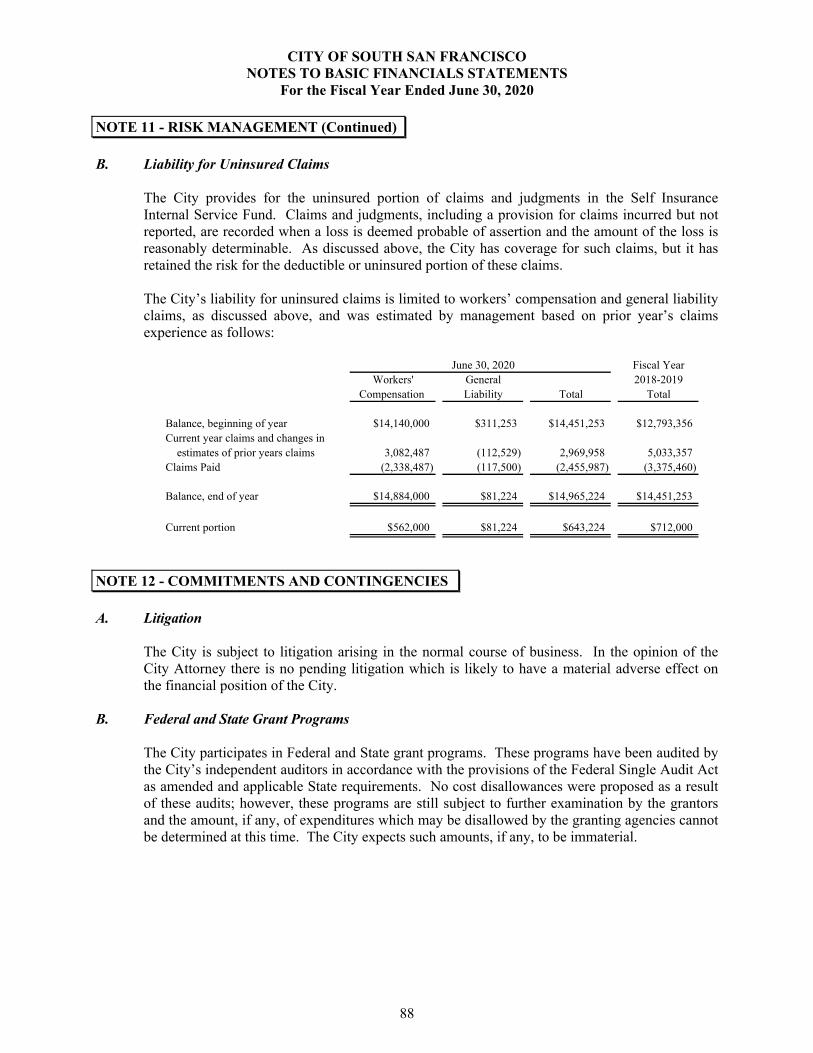
CITY OF SOUTH SAN FRANCISCO NOTES TO BASIC FINANCIALS STATEMENTS
For the Fiscal Year Ended June 30, 2020
NOTE 11 - RISK MANAGEMENT (Continued) B. Liability for Uninsured Claims The City provides for the uninsured portion of claims and judgments in the Self Insurance
Internal Service Fund. Claims and judgments, including a provision for claims incurred but not reported, are recorded when a loss is deemed probable of assertion and the amount of the loss is reasonably determinable. As discussed above, the City has coverage for such claims, but it has retained the risk for the deductible or uninsured portion of these claims.
The City’s liability for uninsured claims is limited to workers’ compensation and general liability
claims, as discussed above, and was estimated by management based on prior year’s claims experience as follows:
June 30, 2020 Fiscal Year
Workers' General 2018-2019Compensation Liability Total Total
Balance, beginning of year $14,140,000 $311,253 $14,451,253 $12,793,356Current year claims and changes in estimates of prior years claims 3,082,487 (112,529) 2,969,958 5,033,357Claims Paid (2,338,487) (117,500) (2,455,987) (3,375,460)
Balance, end of year $14,884,000 $81,224 $14,965,224 $14,451,253
Current portion $562,000 $81,224 $643,224 $712,000
NOTE 12 - COMMITMENTS AND CONTINGENCIES A. Litigation
The City is subject to litigation arising in the normal course of business. In the opinion of the City Attorney there is no pending litigation which is likely to have a material adverse effect on the financial position of the City.
B. Federal and State Grant Programs
The City participates in Federal and State grant programs. These programs have been audited by the City’s independent auditors in accordance with the provisions of the Federal Single Audit Act as amended and applicable State requirements. No cost disallowances were proposed as a result of these audits; however, these programs are still subject to further examination by the grantors and the amount, if any, of expenditures which may be disallowed by the granting agencies cannot be determined at this time. The City expects such amounts, if any, to be immaterial.
88
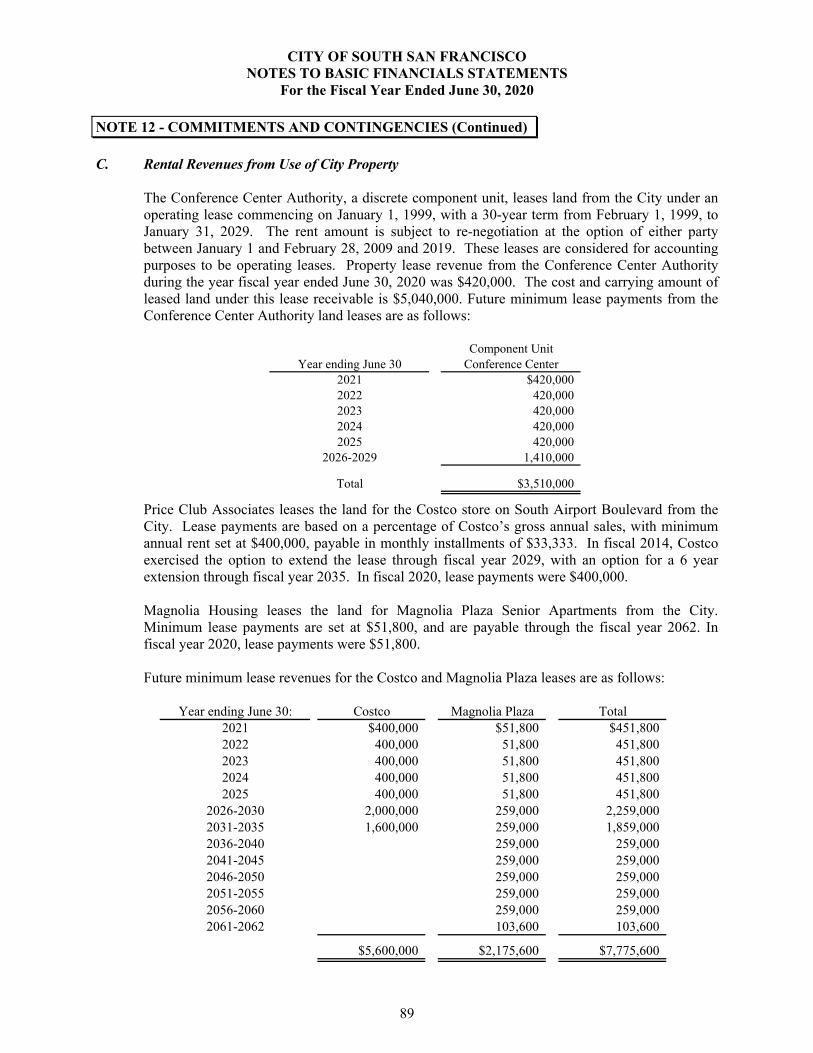
CITY OF SOUTH SAN FRANCISCO NOTES TO BASIC FINANCIALS STATEMENTS
For the Fiscal Year Ended June 30, 2020
NOTE 12 - COMMITMENTS AND CONTINGENCIES (Continued)
C. Rental Revenues from Use of City Property
The Conference Center Authority, a discrete component unit, leases land from the City under anoperating lease commencing on January 1, 1999, with a 30-year term from February 1, 1999, toJanuary 31, 2029. The rent amount is subject to re-negotiation at the option of either partybetween January 1 and February 28, 2009 and 2019. These leases are considered for accountingpurposes to be operating leases. Property lease revenue from the Conference Center Authorityduring the year fiscal year ended June 30, 2020 was $420,000. The cost and carrying amount ofleased land under this lease receivable is $5,040,000. Future minimum lease payments from theConference Center Authority land leases are as follows:
Component UnitYear ending June 30 Conference Center
2021 $420,0002022 420,0002023 420,0002024 420,0002025 420,000
2026-2029 1,410,000
Total $3,510,000
Price Club Associates leases the land for the Costco store on South Airport Boulevard from the City. Lease payments are based on a percentage of Costco’s gross annual sales, with minimum annual rent set at $400,000, payable in monthly installments of $33,333. In fiscal 2014, Costco exercised the option to extend the lease through fiscal year 2029, with an option for a 6 year extension through fiscal year 2035. In fiscal 2020, lease payments were $400,000.
Magnolia Housing leases the land for Magnolia Plaza Senior Apartments from the City. Minimum lease payments are set at $51,800, and are payable through the fiscal year 2062. In fiscal year 2020, lease payments were $51,800.
Future minimum lease revenues for the Costco and Magnolia Plaza leases are as follows:
Year ending June 30: Costco Magnolia Plaza Total2021 $400,000 $51,800 $451,8002022 400,000 51,800 451,8002023 400,000 51,800 451,8002024 400,000 51,800 451,8002025 400,000 51,800 451,800
2026-2030 2,000,000 259,000 2,259,0002031-2035 1,600,000 259,000 1,859,0002036-2040 259,000 259,0002041-2045 259,000 259,0002046-2050 259,000 259,0002051-2055 259,000 259,0002056-2060 259,000 259,0002061-2062 103,600 103,600
$5,600,000 $2,175,600 $7,775,600
89
CITY OF SOUTH SAN FRANCISCO NOTES TO BASIC FINANCIALS STATEMENTS
For the Fiscal Year Ended June 30, 2020
NOTE 12 - COMMITMENTS AND CONTINGENCIES (Continued) D. Miller Parking Garage
The Miller Parking Garage (“Parking Garage)”, constructed in 2011, is located at 329 Miller Avenue in the City. The Parking Garage consists of a five-level open-air concrete structure building of approximately 100,000 square feet with 244 parking spaces. Approximately 14,350 square feet of commercial and office space (the “Commercial Space”) is located on the ground floor of the Parking Garage. In February 2020, the City sold the Commercial Space for $1,247,950, which has been reported as a Special Item. In connection with the sale of the Commercial Space, a condominium map was recorded with the County to create separate assessor parcel numbers for the Commercial Space and the balance of the property included within the Parking Garage. No rights to the parking spaces were granted to the owners of the Commercial Space in connection with its sale. However, the owners of the Commercial Space may use such spaces upon payment to the City of the applicable parking fees.
E. COVID-19 Pandemic On March 11, 2020, the World Health Organization declared the novel strain of coronavirus (COVID-19) a global pandemic and recommended containment and mitigation measures worldwide. The COVID-19 outbreak in the United States has caused business disruption through mandated and voluntary closings of businesses and shelter in place orders for all but those deemed essential services. While the business disruption is currently expected to be temporary, there is considerable uncertainty around the duration of the closings and shelter in place orders. Although many of the City's services are considered essential, City Hall was closed to the public, certain other services transitioned to online-only and because the City's major revenue sources, including businesses that collect sales taxes, transient occupancy taxes and parking taxes, are directly impacted by these events, it is probable that this matter will negatively impact the City. However, the ultimate financial impact and duration cannot be reasonably estimated at this time.
NOTE 13 - FORMER REDEVELOPMENT AGENCY DISSOLUTION AND SUCCESSOR AGENCY ACTIVITIES
The activities of the Successor Agency are reported in the Successor Agency to the former Redevelopment Agency Private-Purpose Trust Fund as the activities are under the control of the Oversight Board. The City provides administrative services to the Successor Agency to wind down the affairs of the former Redevelopment Agency. Information presented in the following footnotes represents assets and liabilities of the Successor Agency.
A. Cash and Investments Cash and investments of the Successor Agency as of June 30, 2020 are discussed in Note 2 to the financial statements. Information presented in the following footnotes represents other assets and liabilities of the Successor Agency as of June 30, 2020.
90
CITY OF SOUTH SAN FRANCISCO NOTES TO BASIC FINANCIALS STATEMENTS
For the Fiscal Year Ended June 30, 2020
NOTE 13 - FORMER REDEVELOPMENT AGENCY DISSOLUTION AND SUCCESSOR AGENCY ACTIVITIES (Continued)
B. Loans Receivable
The Successor Agency assumed the non-housing loans receivable of the former RedevelopmentAgency as of February 1, 2012. The former Redevelopment Agency engaged in programsdesigned to encourage construction of or improvement to low-to-moderate income housing.Under these programs, grants or loans were provided to homeowners or developers who agreed toexpend these funds in accordance with the Agency’s terms.
C. Capital Assets
The Successor Agency assumed the capital assets of the former Redevelopment Agency as ofFebruary 1, 2012. All capital assets are valued at historical cost or estimated historical cost ifactual historical cost is not available. Contributed capital assets are valued at their acquisitionvalue. The Successor Agency’s policy is to capitalize all assets with costs exceeding certainminimum thresholds and with useful lives exceeding two years.
All capital assets with limited useful lives are depreciated over their estimated useful lives. Thepurpose of depreciation is to spread the cost of capital assets equitably among all users over thelife of these assets. The amount charged to depreciation expense each year represents that year’spro rata share of the cost of capital assets.
Depreciation of all capital assets is charged as an expense against operations each year and thetotal amount of depreciation taken over the years, called accumulated depreciation, is reported onthe balance sheet as a reduction in the book value of capital assets.
Depreciation is provided using the straight line method which means the cost of the asset isdivided by its expected useful life in years and the result is charged to expense each year until theasset is fully depreciated. The Successor Agency has assigned the useful lives listed below tocapital assets:
Buildings 50 years Improvements 30 years Machinery and equipment 5-20 years Furniture and fixtures 12 years
Major outlays for capital assets and improvements are capitalized as projects are constructed. Interest incurred during the construction phase is reflected in the capitalized value of the asset constructed, net of interest earned on the invested proceeds over the same period. The capitalization level is $20,000 for vehicles, and $100,000 for all else, including all other equipment that is not a vehicle.
91
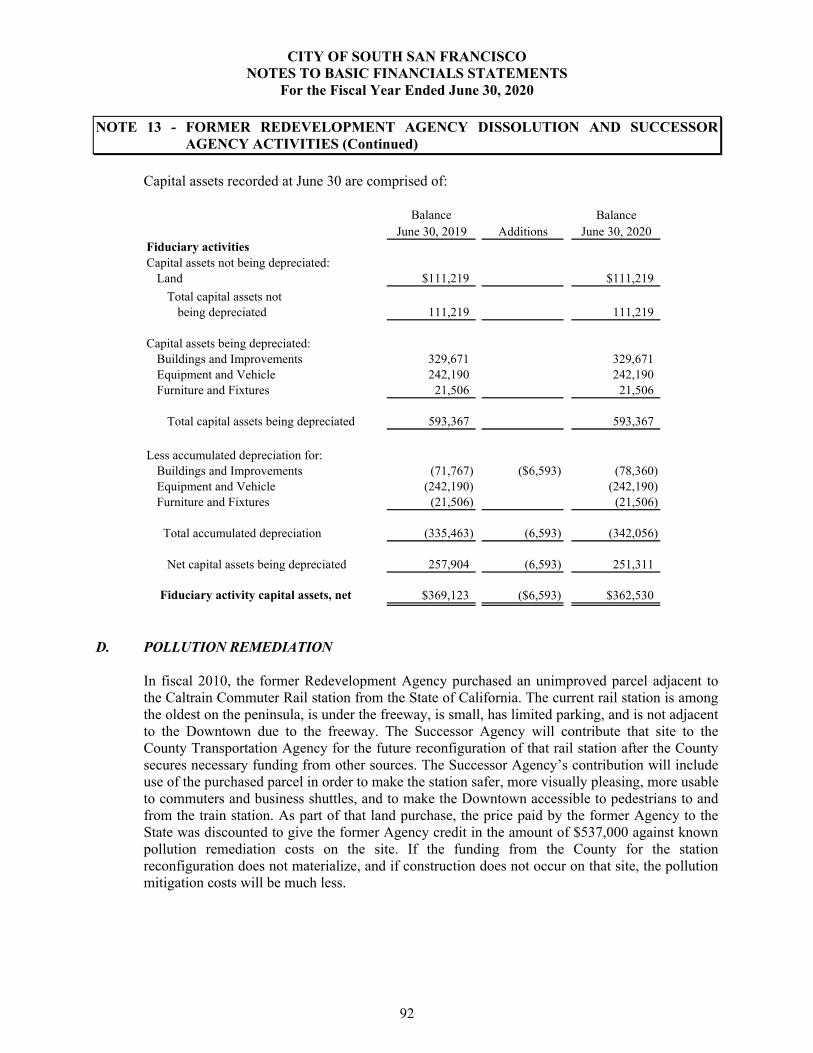
CITY OF SOUTH SAN FRANCISCO NOTES TO BASIC FINANCIALS STATEMENTS
For the Fiscal Year Ended June 30, 2020
NOTE 13 - FORMER REDEVELOPMENT AGENCY DISSOLUTION AND SUCCESSOR AGENCY ACTIVITIES (Continued)
Capital assets recorded at June 30 are comprised of:
Balance BalanceJune 30, 2019 Additions June 30, 2020
Fiduciary activitiesCapital assets not being depreciated:
Land $111,219 $111,219
Total capital assets notbeing depreciated 111,219 111,219
Capital assets being depreciated:Buildings and Improvements 329,671 329,671Equipment and Vehicle 242,190 242,190Furniture and Fixtures 21,506 21,506
Total capital assets being depreciated 593,367 593,367
Less accumulated depreciation for:Buildings and Improvements (71,767) ($6,593) (78,360)Equipment and Vehicle (242,190) (242,190)Furniture and Fixtures (21,506) (21,506)
Total accumulated depreciation (335,463) (6,593) (342,056)
Net capital assets being depreciated 257,904 (6,593) 251,311
Fiduciary activity capital assets, net $369,123 ($6,593) $362,530
D. POLLUTION REMEDIATION
In fiscal 2010, the former Redevelopment Agency purchased an unimproved parcel adjacent to the Caltrain Commuter Rail station from the State of California. The current rail station is among the oldest on the peninsula, is under the freeway, is small, has limited parking, and is not adjacent to the Downtown due to the freeway. The Successor Agency will contribute that site to the County Transportation Agency for the future reconfiguration of that rail station after the County secures necessary funding from other sources. The Successor Agency’s contribution will include use of the purchased parcel in order to make the station safer, more visually pleasing, more usable to commuters and business shuttles, and to make the Downtown accessible to pedestrians to and from the train station. As part of that land purchase, the price paid by the former Agency to the State was discounted to give the former Agency credit in the amount of $537,000 against known pollution remediation costs on the site. If the funding from the County for the station reconfiguration does not materialize, and if construction does not occur on that site, the pollution mitigation costs will be much less.
92
CITY OF SOUTH SAN FRANCISCO NOTES TO BASIC FINANCIALS STATEMENTS
For the Fiscal Year Ended June 30, 2020
NOTE 13 - FORMER REDEVELOPMENT AGENCY DISSOLUTION AND SUCCESSOR AGENCY ACTIVITIES (Continued)
E. DEFEASED BONDS
As of June 30, 2020, the outstanding balance of defeased debt was $4,955,000 for the 1997 Downtown /Central Redevelopment Tax Allocation Bonds.
F. COMMITMENTS AND CONTINGENCIES
State Approval of Enforceable Obligations
The Successor Agency prepares a Recognized Obligation Payment Schedule (ROPS) semi-annually that contains all proposed expenditures for the subsequent six-month period. The ROPS is subject to the review and approval of the Oversight Board as well as the State Department of Finance. Although the State Department of Finance may not question items included on the ROPS in one period, they may question the same items in a future period and disallow associated activities. The amount, if any, of current obligations that may be denied by the State Department of Finance cannot be determined at this time. The City expects such amounts, if any, to be immaterial.
State Asset Transfer Review
The activities of the former Redevelopment Agency and the Successor Agency were also subject to further examination by the State of California. The State Controller’s Office conducted a review of the propriety of asset transfers between the former Redevelopment Agency or the Successor Agency and any public agency that occurred on or after January 1, 2011. The results of that review were issued in July 2015 and although the review did identify ineligible transfers of assets from the former Redevelopment Agency to the City, the report reflected the current year and prior year transfers and made no further demands for the return of assets to the Successor Agency. San Mateo Countywide Oversight Board On July 1, 2018, the duties of the South San Francisco Oversight Board transferred to a new San Mateo Countywide Oversight Board, which will now be responsible for overseeing the winddown affairs of all Successor Agencies in San Mateo County, including the Successor Agency to the South San Francisco Redevelopment Agency.
93

This Page Left Intentionally Blank
REQUIRED SUPPLEMENTARY INFORMATION
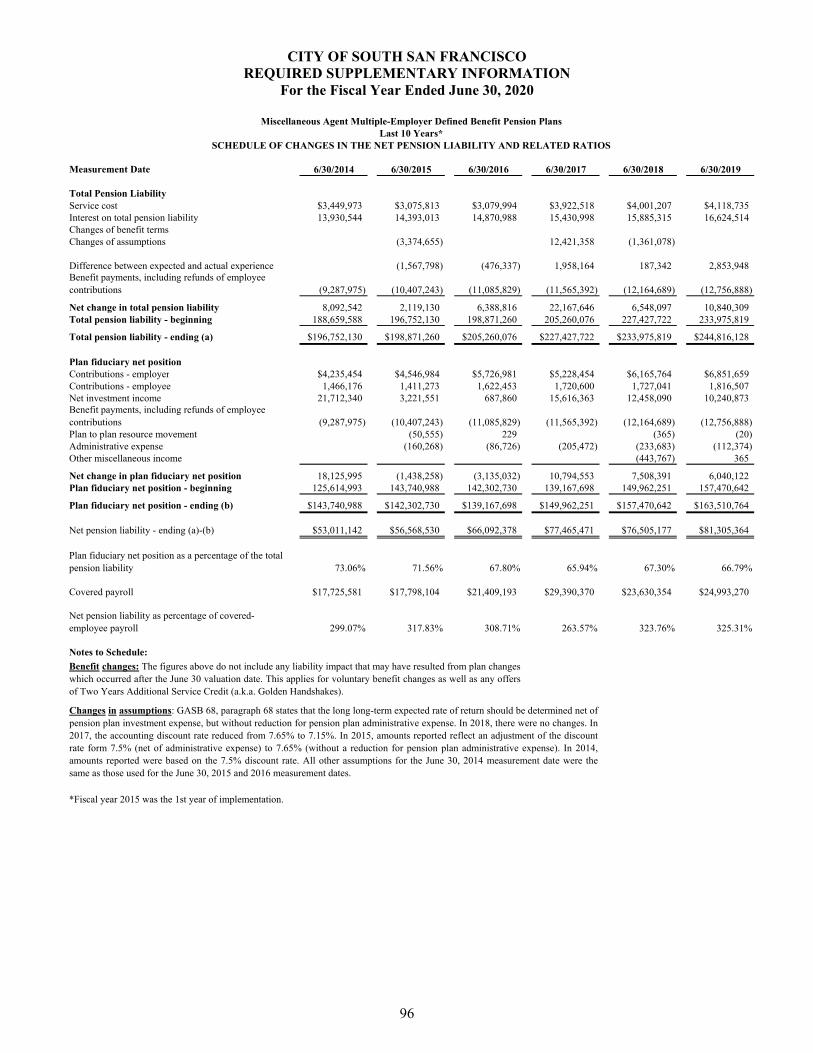
CITY OF SOUTH SAN FRANCISCO REQUIRED SUPPLEMENTARY INFORMATION
For the Fiscal Year Ended June 30, 2020
Miscellaneous Agent Multiple-Employer Defined Benefit Pension PlansLast 10 Years*
SCHEDULE OF CHANGES IN THE NET PENSION LIABILITY AND RELATED RATIOS
Measurement Date 6/30/2014 6/30/2015 6/30/2016 6/30/2017 6/30/2018 6/30/2019
Total Pension LiabilityService cost $3,449,973 $3,075,813 $3,079,994 $3,922,518 $4,001,207 $4,118,735Interest on total pension liability 13,930,544 14,393,013 14,870,988 15,430,998 15,885,315 16,624,514Changes of benefit termsChanges of assumptions (3,374,655) 12,421,358 (1,361,078)
Difference between expected and actual experience (1,567,798) (476,337) 1,958,164 187,342 2,853,948Benefit payments, including refunds of employee contributions (9,287,975) (10,407,243) (11,085,829) (11,565,392) (12,164,689) (12,756,888)
Net change in total pension liability 8,092,542 2,119,130 6,388,816 22,167,646 6,548,097 10,840,309 Total pension liability - beginning 188,659,588 196,752,130 198,871,260 205,260,076 227,427,722 233,975,819
Total pension liability - ending (a) $196,752,130 $198,871,260 $205,260,076 $227,427,722 $233,975,819 $244,816,128
Plan fiduciary net positionContributions - employer $4,235,454 $4,546,984 $5,726,981 $5,228,454 $6,165,764 $6,851,659Contributions - employee 1,466,176 1,411,273 1,622,453 1,720,600 1,727,041 1,816,507 Net investment income 21,712,340 3,221,551 687,860 15,616,363 12,458,090 10,240,873 Benefit payments, including refunds of employee contributions (9,287,975) (10,407,243) (11,085,829) (11,565,392) (12,164,689) (12,756,888) Plan to plan resource movement (50,555) 229 (365) (20)Administrative expense (160,268) (86,726) (205,472) (233,683) (112,374)Other miscellaneous income (443,767) 365
Net change in plan fiduciary net position 18,125,995 (1,438,258) (3,135,032) 10,794,553 7,508,391 6,040,122 Plan fiduciary net position - beginning 125,614,993 143,740,988 142,302,730 139,167,698 149,962,251 157,470,642
Plan fiduciary net position - ending (b) $143,740,988 $142,302,730 $139,167,698 $149,962,251 $157,470,642 $163,510,764
Net pension liability - ending (a)-(b) $53,011,142 $56,568,530 $66,092,378 $77,465,471 $76,505,177 $81,305,364
Plan fiduciary net position as a percentage of the total pension liability 73.06% 71.56% 67.80% 65.94% 67.30% 66.79%
Covered payroll $17,725,581 $17,798,104 $21,409,193 $29,390,370 $23,630,354 $24,993,270
Net pension liability as percentage of covered-employee payroll 299.07% 317.83% 308.71% 263.57% 323.76% 325.31%
Notes to Schedule:
*Fiscal year 2015 was the 1st year of implementation.
Benefit changes: The figures above do not include any liability impact that may have resulted from plan changeswhich occurred after the June 30 valuation date. This applies for voluntary benefit changes as well as any offersof Two Years Additional Service Credit (a.k.a. Golden Handshakes).
Changes in assumptions: GASB 68, paragraph 68 states that the long long-term expected rate of return should be determined net ofpension plan investment expense, but without reduction for pension plan administrative expense. In 2018, there were no changes. In2017, the accounting discount rate reduced from 7.65% to 7.15%. In 2015, amounts reported reflect an adjustment of the discountrate form 7.5% (net of administrative expense) to 7.65% (without a reduction for pension plan administrative expense). In 2014,amounts reported were based on the 7.5% discount rate. All other assumptions for the June 30, 2014 measurement date were thesame as those used for the June 30, 2015 and 2016 measurement dates.
96
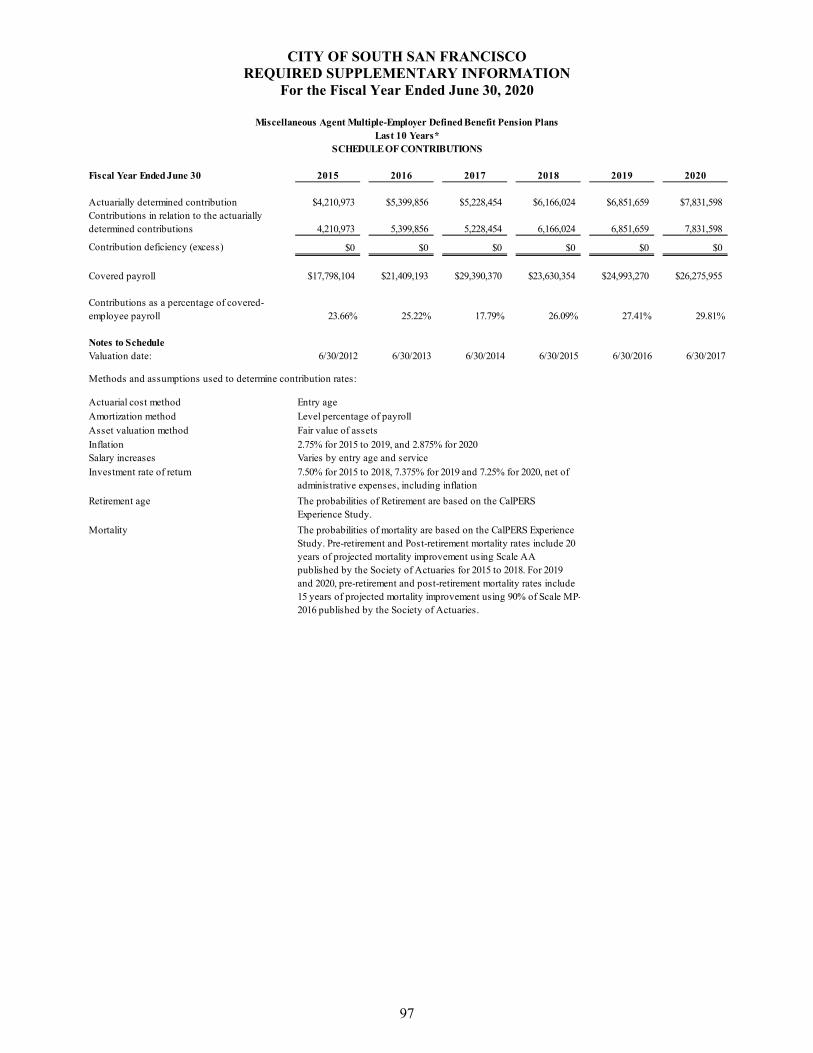
CITY OF SOUTH SAN FRANCISCO REQUIRED SUPPLEMENTARY INFORMATION
For the Fiscal Year Ended June 30, 2020
Miscellaneous Agent Multiple-Employer Defined Benefit Pension PlansLast 10 Years*
SCHEDULE OF CONTRIBUTIONS
Fiscal Year Ended June 30 2015 2016 2017 2018 2019 2020
Actuarially determined contribution $4,210,973 $5,399,856 $5,228,454 $6,166,024 $6,851,659 $7,831,598Contributions in relation to the actuarially determined contributions 4,210,973 5,399,856 5,228,454 6,166,024 6,851,659 7,831,598
Contribution deficiency (excess) $0 $0 $0 $0 $0 $0
Covered payroll $17,798,104 $21,409,193 $29,390,370 $23,630,354 $24,993,270 $26,275,955
Contributions as a percentage of covered-employee payroll 23.66% 25.22% 17.79% 26.09% 27.41% 29.81%
Notes to ScheduleValuation date: 6/30/2012 6/30/2013 6/30/2014 6/30/2015 6/30/2016 6/30/2017
Methods and assumptions used to determine contribution rates:
Actuarial cost method Entry age
Amortization method Level percentage of payrollAsset valuation method Fair value of assets
Inflation 2.75% for 2015 to 2019, and 2.875% for 2020Salary increases
Investment rate of return
Retirement age
Mortality
Varies by entry age and service
7.50% for 2015 to 2018, 7.375% for 2019 and 7.25% for 2020, net of administrative expenses, including inflation
The probabilities of Retirement are based on the CalPERS Experience Study.
The probabilities of mortality are based on the CalPERS Experience Study. Pre-retirement and Post-retirement mortality rates include 20 years of projected mortality improvement using Scale AA published by the Society of Actuaries for 2015 to 2018. For 2019 and 2020, pre-retirement and post-retirement mortality rates include 15 years of projected mortality improvement using 90% of Scale MP-2016 published by the Society of Actuaries.
97
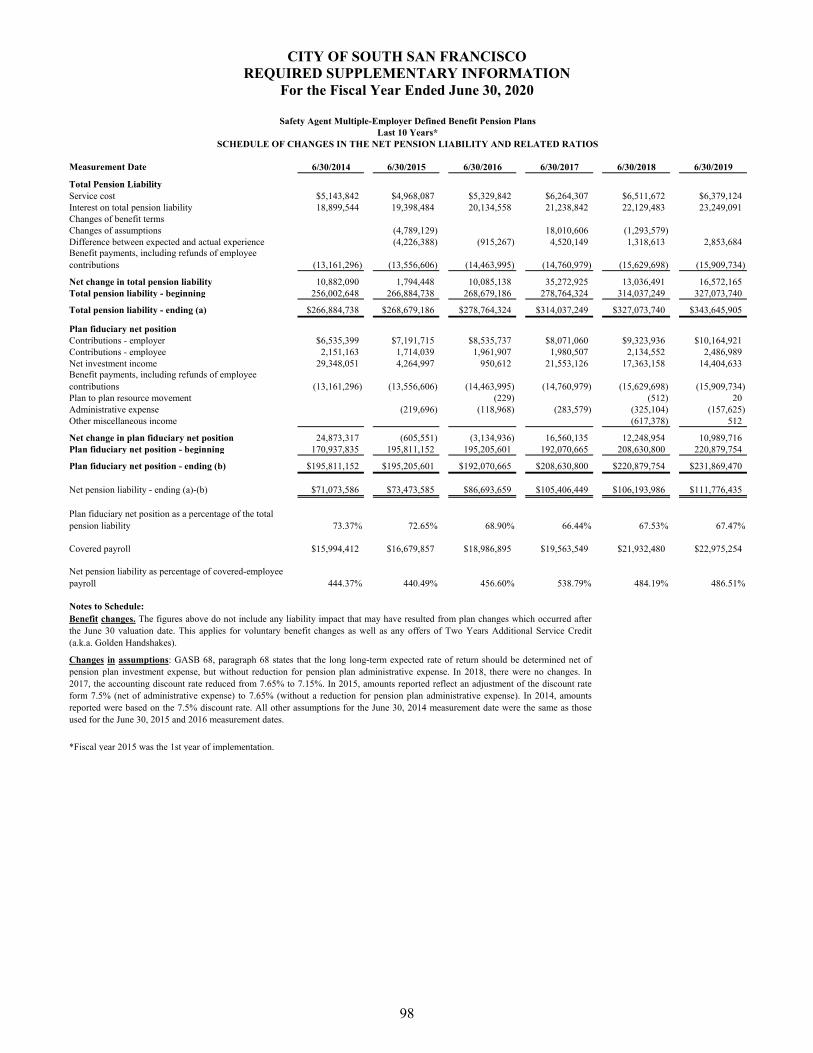
CITY OF SOUTH SAN FRANCISCO REQUIRED SUPPLEMENTARY INFORMATION
For the Fiscal Year Ended June 30, 2020
Safety Agent Multiple-Employer Defined Benefit Pension PlansLast 10 Years*
SCHEDULE OF CHANGES IN THE NET PENSION LIABILITY AND RELATED RATIOS
Measurement Date 6/30/2014 6/30/2015 6/30/2016 6/30/2017 6/30/2018 6/30/2019
Total Pension LiabilityService cost $5,143,842 $4,968,087 $5,329,842 $6,264,307 $6,511,672 $6,379,124Interest on total pension liability 18,899,544 19,398,484 20,134,558 21,238,842 22,129,483 23,249,091Changes of benefit termsChanges of assumptions (4,789,129) 18,010,606 (1,293,579)Difference between expected and actual experience (4,226,388) (915,267) 4,520,149 1,318,613 2,853,684Benefit payments, including refunds of employee contributions (13,161,296) (13,556,606) (14,463,995) (14,760,979) (15,629,698) (15,909,734)
Net change in total pension liability 10,882,090 1,794,448 10,085,138 35,272,925 13,036,491 16,572,165 Total pension liability - beginning 256,002,648 266,884,738 268,679,186 278,764,324 314,037,249 327,073,740
Total pension liability - ending (a) $266,884,738 $268,679,186 $278,764,324 $314,037,249 $327,073,740 $343,645,905
Plan fiduciary net positionContributions - employer $6,535,399 $7,191,715 $8,535,737 $8,071,060 $9,323,936 $10,164,921Contributions - employee 2,151,163 1,714,039 1,961,907 1,980,507 2,134,552 2,486,989 Net investment income 29,348,051 4,264,997 950,612 21,553,126 17,363,158 14,404,633 Benefit payments, including refunds of employee contributions (13,161,296) (13,556,606) (14,463,995) (14,760,979) (15,629,698) (15,909,734) Plan to plan resource movement (229) (512) 20 Administrative expense (219,696) (118,968) (283,579) (325,104) (157,625) Other miscellaneous income (617,378) 512
Net change in plan fiduciary net position 24,873,317 (605,551) (3,134,936) 16,560,135 12,248,954 10,989,716 Plan fiduciary net position - beginning 170,937,835 195,811,152 195,205,601 192,070,665 208,630,800 220,879,754
Plan fiduciary net position - ending (b) $195,811,152 $195,205,601 $192,070,665 $208,630,800 $220,879,754 $231,869,470
Net pension liability - ending (a)-(b) $71,073,586 $73,473,585 $86,693,659 $105,406,449 $106,193,986 $111,776,435
Plan fiduciary net position as a percentage of the total pension liability 73.37% 72.65% 68.90% 66.44% 67.53% 67.47%
Covered payroll $15,994,412 $16,679,857 $18,986,895 $19,563,549 $21,932,480 $22,975,254
Net pension liability as percentage of covered-employee payroll 444.37% 440.49% 456.60% 538.79% 484.19% 486.51%
Notes to Schedule:
*Fiscal year 2015 was the 1st year of implementation.
Benefit changes. The figures above do not include any liability impact that may have resulted from plan changes which occurred afterthe June 30 valuation date. This applies for voluntary benefit changes as well as any offers of Two Years Additional Service Credit(a.k.a. Golden Handshakes).
Changes in assumptions: GASB 68, paragraph 68 states that the long long-term expected rate of return should be determined net ofpension plan investment expense, but without reduction for pension plan administrative expense. In 2018, there were no changes. In2017, the accounting discount rate reduced from 7.65% to 7.15%. In 2015, amounts reported reflect an adjustment of the discount rateform 7.5% (net of administrative expense) to 7.65% (without a reduction for pension plan administrative expense). In 2014, amountsreported were based on the 7.5% discount rate. All other assumptions for the June 30, 2014 measurement date were the same as thoseused for the June 30, 2015 and 2016 measurement dates.
98
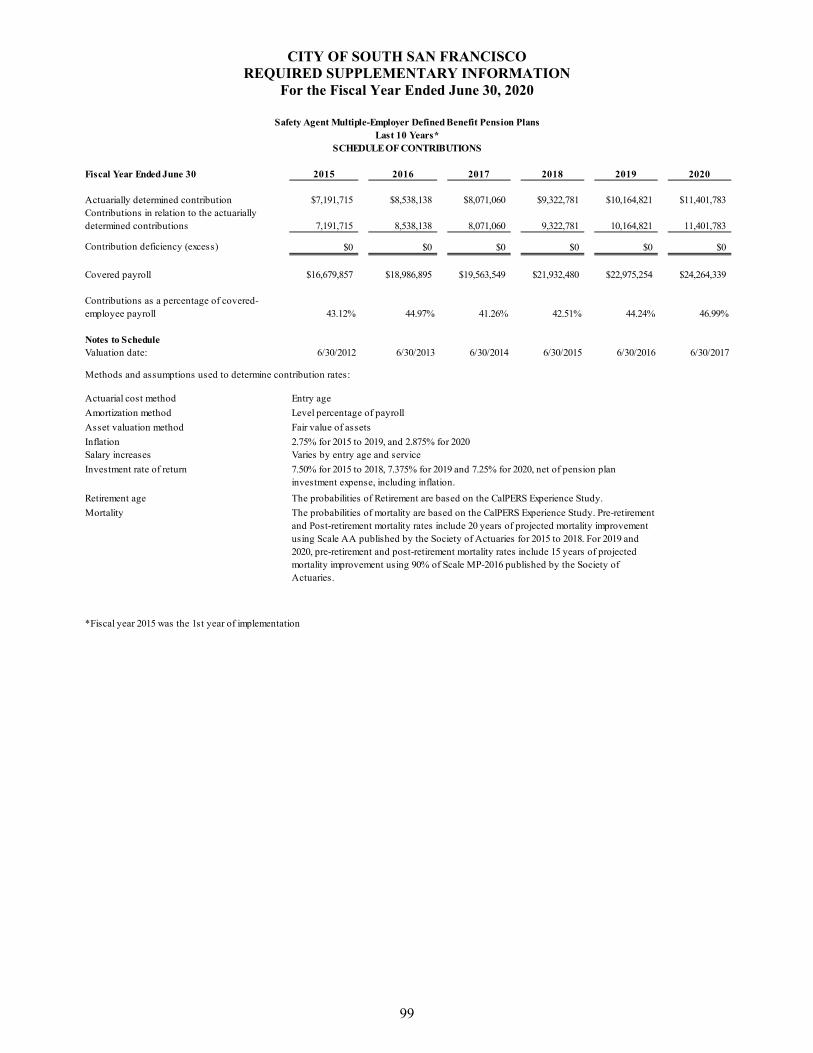
CITY OF SOUTH SAN FRANCISCO REQUIRED SUPPLEMENTARY INFORMATION
For the Fiscal Year Ended June 30, 2020
Safety Agent Multiple-Employer Defined Benefit Pension PlansLast 10 Years*
SCHEDULE OF CONTRIBUTIONS
Fiscal Year Ended June 30 2015 2016 2017 2018 2019 2020
Actuarially determined contribution $7,191,715 $8,538,138 $8,071,060 $9,322,781 $10,164,821 $11,401,783Contributions in relation to the actuarially determined contributions 7,191,715 8,538,138 8,071,060 9,322,781 10,164,821 11,401,783
Contribution deficiency (excess) $0 $0 $0 $0 $0 $0
Covered payroll $16,679,857 $18,986,895 $19,563,549 $21,932,480 $22,975,254 $24,264,339
Contributions as a percentage of covered-employee payroll 43.12% 44.97% 41.26% 42.51% 44.24% 46.99%
Notes to ScheduleValuation date: 6/30/2012 6/30/2013 6/30/2014 6/30/2015 6/30/2016 6/30/2017
Methods and assumptions used to determine contribution rates:
Actuarial cost method Entry age
Amortization method Level percentage of payroll
Asset valuation method Fair value of assets
Inflation 2.75% for 2015 to 2019, and 2.875% for 2020Salary increases
Investment rate of return
Retirement age
Mortality
*Fiscal year 2015 was the 1st year of implementation
Varies by entry age and service
7.50% for 2015 to 2018, 7.375% for 2019 and 7.25% for 2020, net of pension plan investment expense, including inflation.
The probabilities of Retirement are based on the CalPERS Experience Study.
The probabilities of mortality are based on the CalPERS Experience Study. Pre-retirement and Post-retirement mortality rates include 20 years of projected mortality improvement using Scale AA published by the Society of Actuaries for 2015 to 2018. For 2019 and 2020, pre-retirement and post-retirement mortality rates include 15 years of projected mortality improvement using 90% of Scale MP-2016 published by the Society of Actuaries.
99
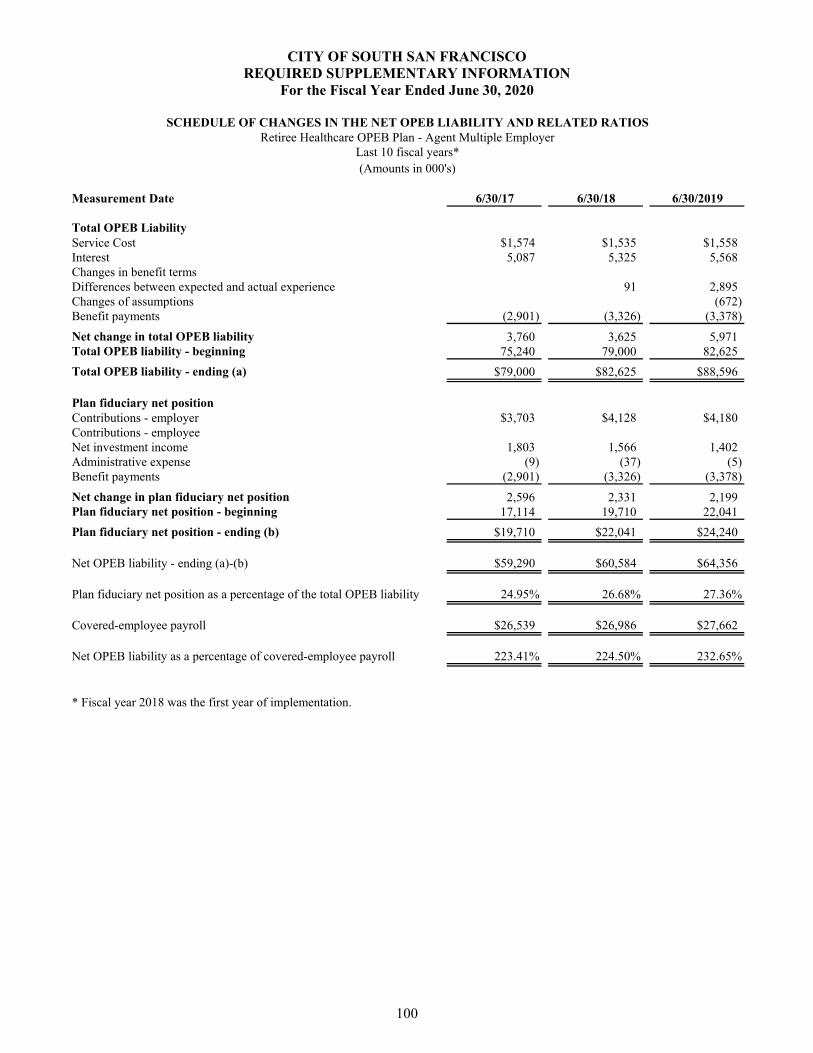
CITY OF SOUTH SAN FRANCISCO REQUIRED SUPPLEMENTARY INFORMATION
For the Fiscal Year Ended June 30, 2020
SCHEDULE OF CHANGES IN THE NET OPEB LIABILITY AND RELATED RATIOSRetiree Healthcare OPEB Plan - Agent Multiple Employer
Last 10 fiscal years*(Amounts in 000's)
Measurement Date 6/30/17 6/30/18 6/30/2019
Total OPEB LiabilityService Cost $1,574 $1,535 $1,558Interest 5,087 5,325 5,568Changes in benefit termsDifferences between expected and actual experience 91 2,895Changes of assumptions (672)Benefit payments (2,901) (3,326) (3,378)
Net change in total OPEB liability 3,760 3,625 5,971Total OPEB liability - beginning 75,240 79,000 82,625
Total OPEB liability - ending (a) $79,000 $82,625 $88,596
Plan fiduciary net positionContributions - employer $3,703 $4,128 $4,180Contributions - employeeNet investment income 1,803 1,566 1,402Administrative expense (9) (37) (5)Benefit payments (2,901) (3,326) (3,378)
Net change in plan fiduciary net position 2,596 2,331 2,199Plan fiduciary net position - beginning 17,114 19,710 22,041
Plan fiduciary net position - ending (b) $19,710 $22,041 $24,240
Net OPEB liability - ending (a)-(b) $59,290 $60,584 $64,356
Plan fiduciary net position as a percentage of the total OPEB liability 24.95% 26.68% 27.36%
Covered-employee payroll $26,539 $26,986 $27,662
Net OPEB liability as a percentage of covered-employee payroll 223.41% 224.50% 232.65%
* Fiscal year 2018 was the first year of implementation.
100
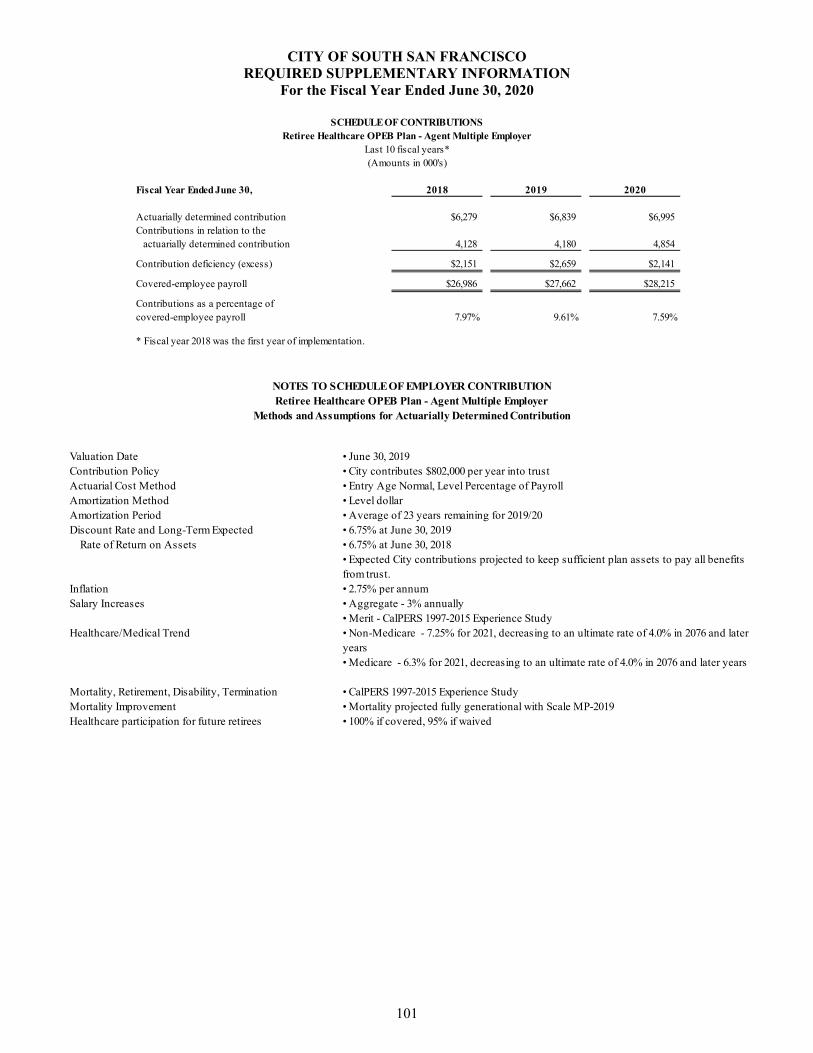
CITY OF SOUTH SAN FRANCISCO REQUIRED SUPPLEMENTARY INFORMATION
For the Fiscal Year Ended June 30, 2020
SCHEDULE OF CONTRIBUTIONSRetiree Healthcare OPEB Plan - Agent Multiple Employer
Last 10 fiscal years*(Amounts in 000's)
Fiscal Year Ended June 30, 2018 2019 2020
Actuarially determined contribution $6,279 $6,839 $6,995Contributions in relation to the
actuarially determined contribution 4,128 4,180 4,854
Contribution deficiency (excess) $2,151 $2,659 $2,141
Covered-employee payroll $26,986 $27,662 $28,215
Contributions as a percentage ofcovered-employee payroll 7.97% 9.61% 7.59%
* Fiscal year 2018 was the first year of implementation.
Valuation Date • June 30, 2019Contribution Policy • City contributes $802,000 per year into trustActuarial Cost Method • Entry Age Normal, Level Percentage of PayrollAmortization Method • Level dollarAmortization Period • Average of 23 years remaining for 2019/20
• 6.75% at June 30, 2019• 6.75% at June 30, 2018• Expected City contributions projected to keep sufficient plan assets to pay all benefitsfrom trust.
Inflation • 2.75% per annumSalary Increases • Aggregate - 3% annually
• Merit - CalPERS 1997-2015 Experience StudyHealthcare/Medical Trend • Non-Medicare - 7.25% for 2021, decreasing to an ultimate rate of 4.0% in 2076 and later
years• Medicare - 6.3% for 2021, decreasing to an ultimate rate of 4.0% in 2076 and later years
Mortality, Retirement, Disability, Termination • CalPERS 1997-2015 Experience StudyMortality Improvement • Mortality projected fully generational with Scale MP-2019Healthcare participation for future retirees • 100% if covered, 95% if waived
Retiree Healthcare OPEB Plan - Agent Multiple EmployerNOTES TO SCHEDULE OF EMPLOYER CONTRIBUTION
Methods and Assumptions for Actuarially Determined Contribution
Discount Rate and Long-Term Expected Rate of Return on Assets
101

This Page Left Intentionally Blank

SUPPLEMENTARY INFORMATION

This Page Left Intentionally Blank
GENERAL FUND
The General Fund is the City’s primary operating fund. It accounts for all financial resources of the general government, except those required to be accounted for in another fund. The General Fund is comprised of the following:
GENERAL PURPOSE FUND
This fund accounts for resources traditionally associated with government, such as administration, public safety, library, parks maintenance, and recreation, outside of those accounted for in other funds.
MEASURE W FUND
This fund accounts for revenue as the result of the voter-approved one-half percent sales and use tax that was passed on November 3, 2015. The tax went into effect April 1, 2016 and will last for 30 years until March 31, 2046. Revenues are committed for maintenance and enhancement of local services.
105
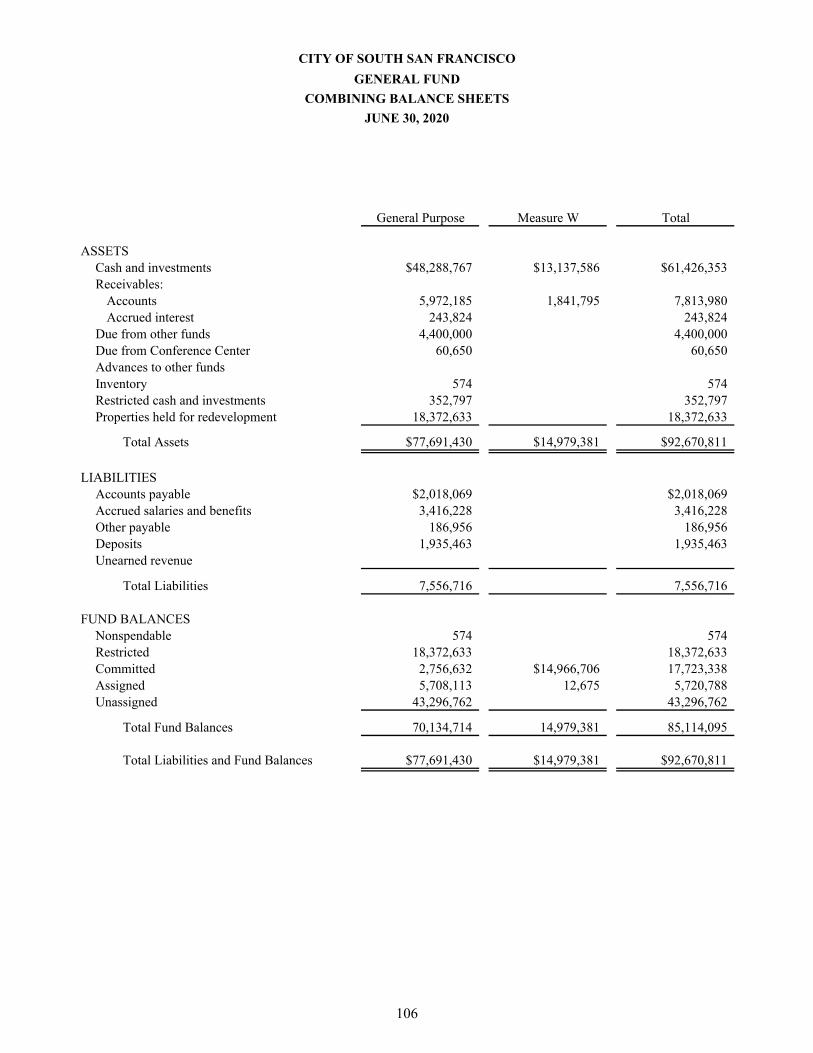
General Purpose Measure W Total
ASSETSCash and investments $48,288,767 $13,137,586 $61,426,353Receivables:
Accounts 5,972,185 1,841,795 7,813,980Accrued interest 243,824 243,824
Due from other funds 4,400,000 4,400,000Due from Conference Center 60,650 60,650Advances to other fundsInventory 574 574Restricted cash and investments 352,797 352,797Properties held for redevelopment 18,372,633 18,372,633
Total Assets $77,691,430 $14,979,381 $92,670,811
LIABILITIESAccounts payable $2,018,069 $2,018,069Accrued salaries and benefits 3,416,228 3,416,228Other payable 186,956 186,956Deposits 1,935,463 1,935,463Unearned revenue
Total Liabilities 7,556,716 7,556,716
FUND BALANCESNonspendable 574 574Restricted 18,372,633 18,372,633Committed 2,756,632 $14,966,706 17,723,338Assigned 5,708,113 12,675 5,720,788Unassigned 43,296,762 43,296,762
Total Fund Balances 70,134,714 14,979,381 85,114,095
Total Liabilities and Fund Balances $77,691,430 $14,979,381 $92,670,811
CITY OF SOUTH SAN FRANCISCO
GENERAL FUND
COMBINING BALANCE SHEETS
JUNE 30, 2020
106
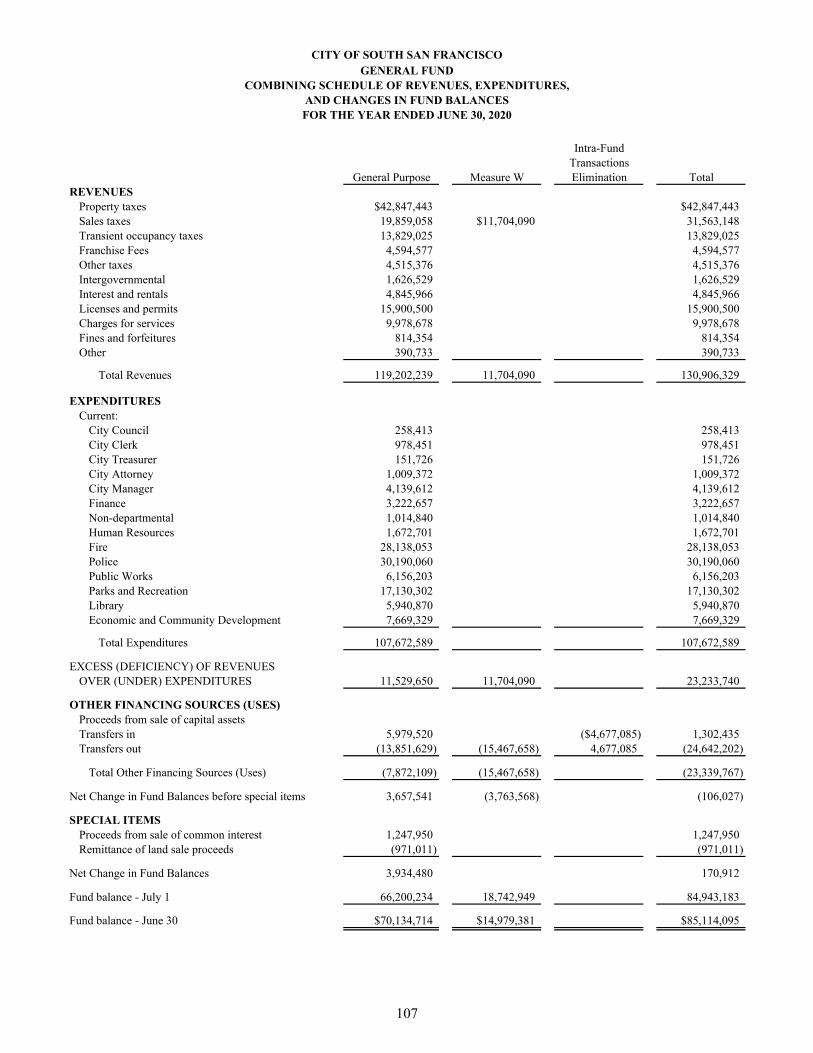
Intra-FundTransactions
General Purpose Measure W Elimination TotalREVENUES
Property taxes $42,847,443 $42,847,443Sales taxes 19,859,058 $11,704,090 31,563,148Transient occupancy taxes 13,829,025 13,829,025Franchise Fees 4,594,577 4,594,577Other taxes 4,515,376 4,515,376Intergovernmental 1,626,529 1,626,529Interest and rentals 4,845,966 4,845,966Licenses and permits 15,900,500 15,900,500Charges for services 9,978,678 9,978,678Fines and forfeitures 814,354 814,354Other 390,733 390,733
Total Revenues 119,202,239 11,704,090 130,906,329
EXPENDITURESCurrent:
City Council 258,413 258,413City Clerk 978,451 978,451City Treasurer 151,726 151,726City Attorney 1,009,372 1,009,372City Manager 4,139,612 4,139,612Finance 3,222,657 3,222,657Non-departmental 1,014,840 1,014,840Human Resources 1,672,701 1,672,701Fire 28,138,053 28,138,053Police 30,190,060 30,190,060Public Works 6,156,203 6,156,203Parks and Recreation 17,130,302 17,130,302Library 5,940,870 5,940,870Economic and Community Development 7,669,329 7,669,329
Total Expenditures 107,672,589 107,672,589
EXCESS (DEFICIENCY) OF REVENUES OVER (UNDER) EXPENDITURES 11,529,650 11,704,090 23,233,740
OTHER FINANCING SOURCES (USES)Proceeds from sale of capital assetsTransfers in 5,979,520 ($4,677,085) 1,302,435Transfers out (13,851,629) (15,467,658) 4,677,085 (24,642,202)
Total Other Financing Sources (Uses) (7,872,109) (15,467,658) (23,339,767)
Net Change in Fund Balances before special items 3,657,541 (3,763,568) (106,027)
SPECIAL ITEMSProceeds from sale of common interest 1,247,950 1,247,950Remittance of land sale proceeds (971,011) (971,011)
Net Change in Fund Balances 3,934,480 170,912
Fund balance - July 1 66,200,234 18,742,949 84,943,183
Fund balance - June 30 $70,134,714 $14,979,381 $85,114,095
CITY OF SOUTH SAN FRANCISCOGENERAL FUND
COMBINING SCHEDULE OF REVENUES, EXPENDITURES,AND CHANGES IN FUND BALANCESFOR THE YEAR ENDED JUNE 30, 2020
107
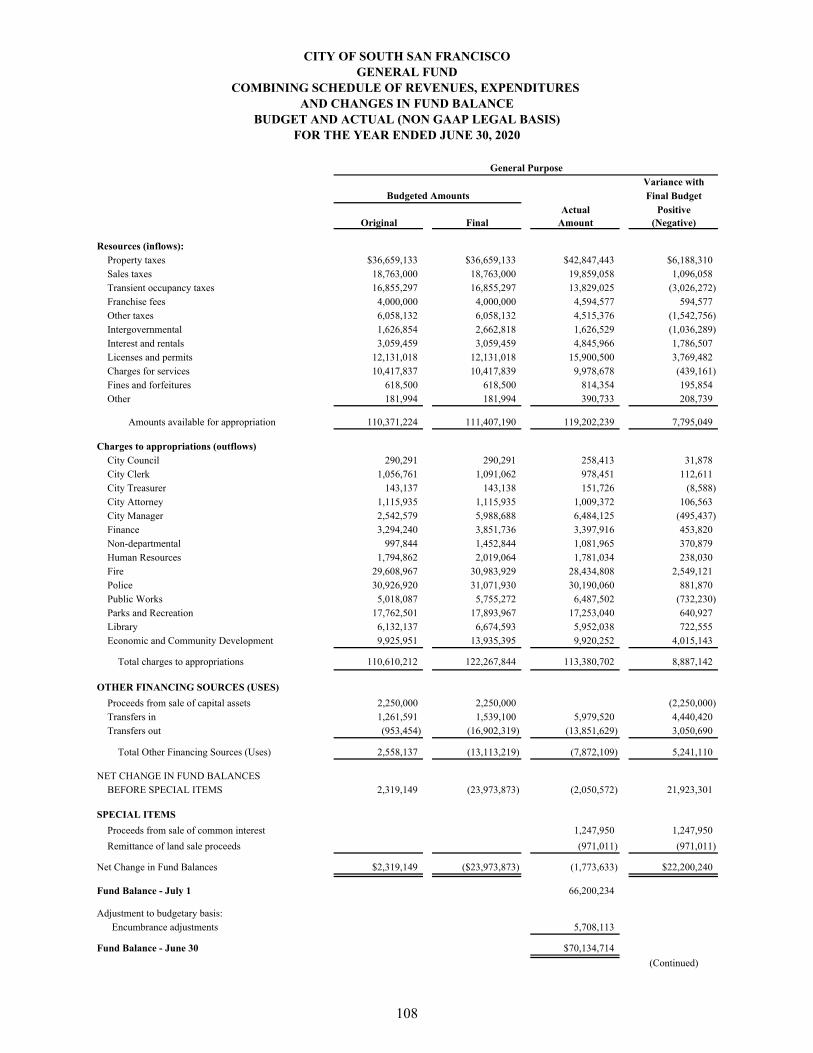
CITY OF SOUTH SAN FRANCISCOGENERAL FUND
COMBINING SCHEDULE OF REVENUES, EXPENDITURES AND CHANGES IN FUND BALANCE
BUDGET AND ACTUAL (NON GAAP LEGAL BASIS)FOR THE YEAR ENDED JUNE 30, 2020
Variance withFinal Budget
Actual PositiveOriginal Final Amount (Negative)
Resources (inflows):Property taxes $36,659,133 $36,659,133 $42,847,443 $6,188,310Sales taxes 18,763,000 18,763,000 19,859,058 1,096,058Transient occupancy taxes 16,855,297 16,855,297 13,829,025 (3,026,272)Franchise fees 4,000,000 4,000,000 4,594,577 594,577Other taxes 6,058,132 6,058,132 4,515,376 (1,542,756)Intergovernmental 1,626,854 2,662,818 1,626,529 (1,036,289)Interest and rentals 3,059,459 3,059,459 4,845,966 1,786,507Licenses and permits 12,131,018 12,131,018 15,900,500 3,769,482Charges for services 10,417,837 10,417,839 9,978,678 (439,161)Fines and forfeitures 618,500 618,500 814,354 195,854Other 181,994 181,994 390,733 208,739
Amounts available for appropriation 110,371,224 111,407,190 119,202,239 7,795,049
Charges to appropriations (outflows)City Council 290,291 290,291 258,413 31,878City Clerk 1,056,761 1,091,062 978,451 112,611City Treasurer 143,137 143,138 151,726 (8,588)City Attorney 1,115,935 1,115,935 1,009,372 106,563City Manager 2,542,579 5,988,688 6,484,125 (495,437)Finance 3,294,240 3,851,736 3,397,916 453,820Non-departmental 997,844 1,452,844 1,081,965 370,879Human Resources 1,794,862 2,019,064 1,781,034 238,030Fire 29,608,967 30,983,929 28,434,808 2,549,121Police 30,926,920 31,071,930 30,190,060 881,870Public Works 5,018,087 5,755,272 6,487,502 (732,230)Parks and Recreation 17,762,501 17,893,967 17,253,040 640,927Library 6,132,137 6,674,593 5,952,038 722,555Economic and Community Development 9,925,951 13,935,395 9,920,252 4,015,143
Total charges to appropriations 110,610,212 122,267,844 113,380,702 8,887,142
OTHER FINANCING SOURCES (USES)
Proceeds from sale of capital assets 2,250,000 2,250,000 (2,250,000)Transfers in 1,261,591 1,539,100 5,979,520 4,440,420Transfers out (953,454) (16,902,319) (13,851,629) 3,050,690
Total Other Financing Sources (Uses) 2,558,137 (13,113,219) (7,872,109) 5,241,110
NET CHANGE IN FUND BALANCESBEFORE SPECIAL ITEMS 2,319,149 (23,973,873) (2,050,572) 21,923,301
SPECIAL ITEMS
Proceeds from sale of common interest 1,247,950 1,247,950
Remittance of land sale proceeds (971,011) (971,011)
Net Change in Fund Balances $2,319,149 ($23,973,873) (1,773,633) $22,200,240
Fund Balance - July 1 66,200,234
Adjustment to budgetary basis: Encumbrance adjustments 5,708,113
Fund Balance - June 30 $70,134,714
(Continued)
Budgeted Amounts
General Purpose
108
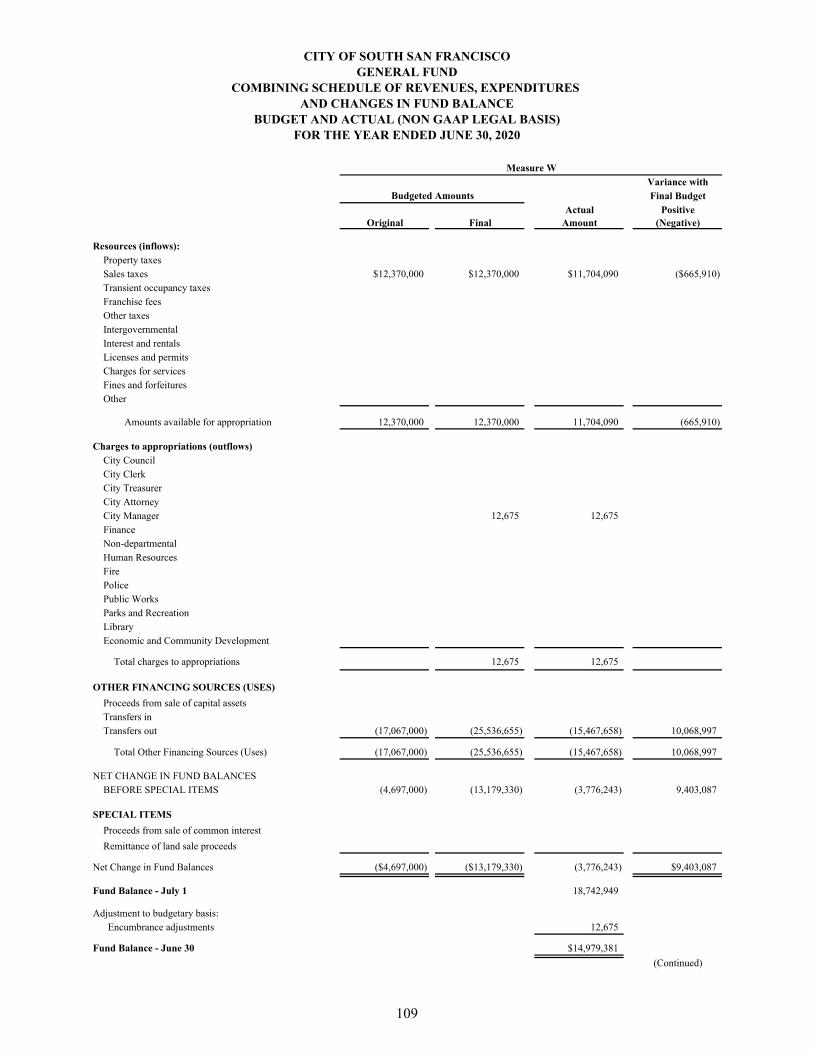
CITY OF SOUTH SAN FRANCISCOGENERAL FUND
COMBINING SCHEDULE OF REVENUES, EXPENDITURES AND CHANGES IN FUND BALANCE
BUDGET AND ACTUAL (NON GAAP LEGAL BASIS)FOR THE YEAR ENDED JUNE 30, 2020
Variance withFinal Budget
Actual PositiveOriginal Final Amount (Negative)
Resources (inflows):Property taxesSales taxes $12,370,000 $12,370,000 $11,704,090 ($665,910)Transient occupancy taxesFranchise feesOther taxesIntergovernmentalInterest and rentalsLicenses and permitsCharges for servicesFines and forfeituresOther
Amounts available for appropriation 12,370,000 12,370,000 11,704,090 (665,910)
Charges to appropriations (outflows)City CouncilCity ClerkCity TreasurerCity AttorneyCity Manager 12,675 12,675FinanceNon-departmentalHuman ResourcesFirePolicePublic WorksParks and RecreationLibraryEconomic and Community Development
Total charges to appropriations 12,675 12,675
OTHER FINANCING SOURCES (USES)
Proceeds from sale of capital assetsTransfers inTransfers out (17,067,000) (25,536,655) (15,467,658) 10,068,997
Total Other Financing Sources (Uses) (17,067,000) (25,536,655) (15,467,658) 10,068,997
NET CHANGE IN FUND BALANCESBEFORE SPECIAL ITEMS (4,697,000) (13,179,330) (3,776,243) 9,403,087
SPECIAL ITEMS
Proceeds from sale of common interest
Remittance of land sale proceeds
Net Change in Fund Balances ($4,697,000) ($13,179,330) (3,776,243) $9,403,087
Fund Balance - July 1 18,742,949
Adjustment to budgetary basis: Encumbrance adjustments 12,675
Fund Balance - June 30 $14,979,381
(Continued)
Budgeted Amounts
Measure W
109
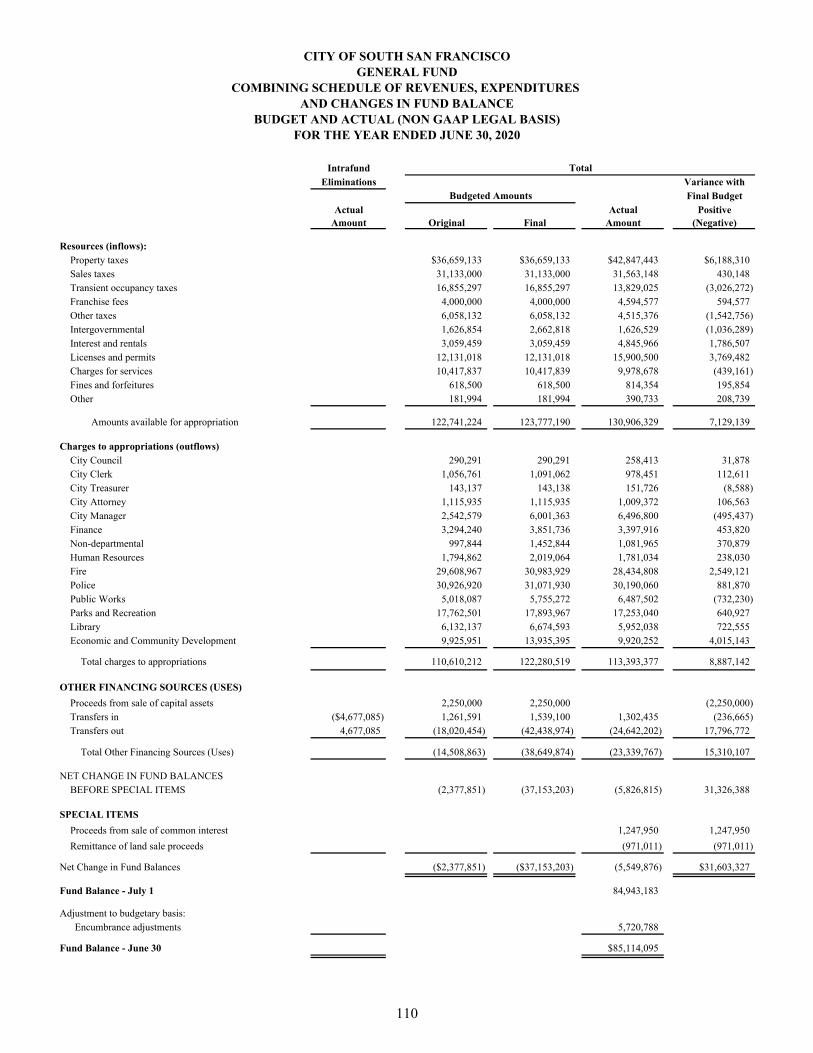
CITY OF SOUTH SAN FRANCISCOGENERAL FUND
COMBINING SCHEDULE OF REVENUES, EXPENDITURES AND CHANGES IN FUND BALANCE
BUDGET AND ACTUAL (NON GAAP LEGAL BASIS)FOR THE YEAR ENDED JUNE 30, 2020
IntrafundEliminations Variance with
Final BudgetActual Actual Positive
Amount Original Final Amount (Negative)
Resources (inflows):Property taxes $36,659,133 $36,659,133 $42,847,443 $6,188,310Sales taxes 31,133,000 31,133,000 31,563,148 430,148Transient occupancy taxes 16,855,297 16,855,297 13,829,025 (3,026,272)Franchise fees 4,000,000 4,000,000 4,594,577 594,577Other taxes 6,058,132 6,058,132 4,515,376 (1,542,756)Intergovernmental 1,626,854 2,662,818 1,626,529 (1,036,289)Interest and rentals 3,059,459 3,059,459 4,845,966 1,786,507Licenses and permits 12,131,018 12,131,018 15,900,500 3,769,482Charges for services 10,417,837 10,417,839 9,978,678 (439,161)Fines and forfeitures 618,500 618,500 814,354 195,854Other 181,994 181,994 390,733 208,739
Amounts available for appropriation 122,741,224 123,777,190 130,906,329 7,129,139
Charges to appropriations (outflows)City Council 290,291 290,291 258,413 31,878City Clerk 1,056,761 1,091,062 978,451 112,611City Treasurer 143,137 143,138 151,726 (8,588)City Attorney 1,115,935 1,115,935 1,009,372 106,563City Manager 2,542,579 6,001,363 6,496,800 (495,437)Finance 3,294,240 3,851,736 3,397,916 453,820Non-departmental 997,844 1,452,844 1,081,965 370,879Human Resources 1,794,862 2,019,064 1,781,034 238,030Fire 29,608,967 30,983,929 28,434,808 2,549,121Police 30,926,920 31,071,930 30,190,060 881,870Public Works 5,018,087 5,755,272 6,487,502 (732,230)Parks and Recreation 17,762,501 17,893,967 17,253,040 640,927Library 6,132,137 6,674,593 5,952,038 722,555Economic and Community Development 9,925,951 13,935,395 9,920,252 4,015,143
Total charges to appropriations 110,610,212 122,280,519 113,393,377 8,887,142
OTHER FINANCING SOURCES (USES)
Proceeds from sale of capital assets 2,250,000 2,250,000 (2,250,000)Transfers in ($4,677,085) 1,261,591 1,539,100 1,302,435 (236,665)Transfers out 4,677,085 (18,020,454) (42,438,974) (24,642,202) 17,796,772
Total Other Financing Sources (Uses) (14,508,863) (38,649,874) (23,339,767) 15,310,107
NET CHANGE IN FUND BALANCESBEFORE SPECIAL ITEMS (2,377,851) (37,153,203) (5,826,815) 31,326,388
SPECIAL ITEMS
Proceeds from sale of common interest 1,247,950 1,247,950
Remittance of land sale proceeds (971,011) (971,011)
Net Change in Fund Balances ($2,377,851) ($37,153,203) (5,549,876) $31,603,327
Fund Balance - July 1 84,943,183
Adjustment to budgetary basis: Encumbrance adjustments 5,720,788
Fund Balance - June 30 $85,114,095
Budgeted Amounts
Total
110
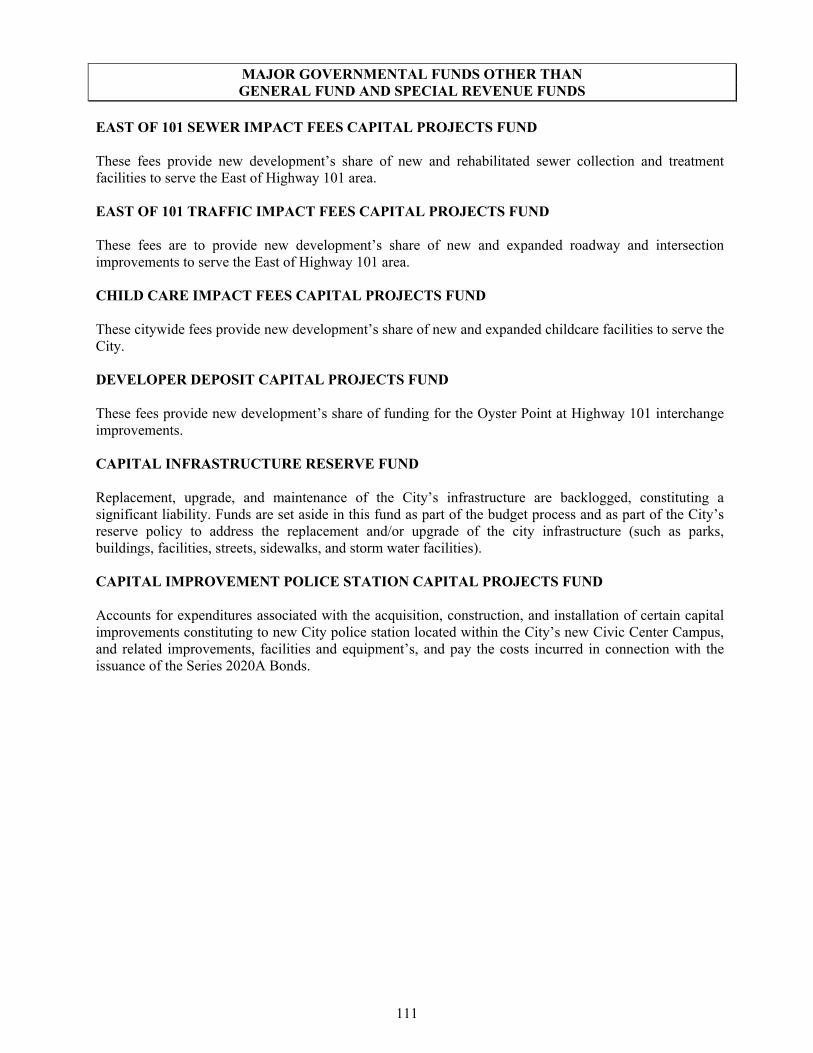
MAJOR GOVERNMENTAL FUNDS OTHER THAN GENERAL FUND AND SPECIAL REVENUE FUNDS
EAST OF 101 SEWER IMPACT FEES CAPITAL PROJECTS FUND These fees provide new development’s share of new and rehabilitated sewer collection and treatment facilities to serve the East of Highway 101 area. EAST OF 101 TRAFFIC IMPACT FEES CAPITAL PROJECTS FUND These fees are to provide new development’s share of new and expanded roadway and intersection improvements to serve the East of Highway 101 area. CHILD CARE IMPACT FEES CAPITAL PROJECTS FUND These citywide fees provide new development’s share of new and expanded childcare facilities to serve the City. DEVELOPER DEPOSIT CAPITAL PROJECTS FUND These fees provide new development’s share of funding for the Oyster Point at Highway 101 interchange improvements. CAPITAL INFRASTRUCTURE RESERVE FUND Replacement, upgrade, and maintenance of the City’s infrastructure are backlogged, constituting a significant liability. Funds are set aside in this fund as part of the budget process and as part of the City’s reserve policy to address the replacement and/or upgrade of the city infrastructure (such as parks, buildings, facilities, streets, sidewalks, and storm water facilities). CAPITAL IMPROVEMENT POLICE STATION CAPITAL PROJECTS FUND Accounts for expenditures associated with the acquisition, construction, and installation of certain capital improvements constituting to new City police station located within the City’s new Civic Center Campus, and related improvements, facilities and equipment’s, and pay the costs incurred in connection with the issuance of the Series 2020A Bonds.
111
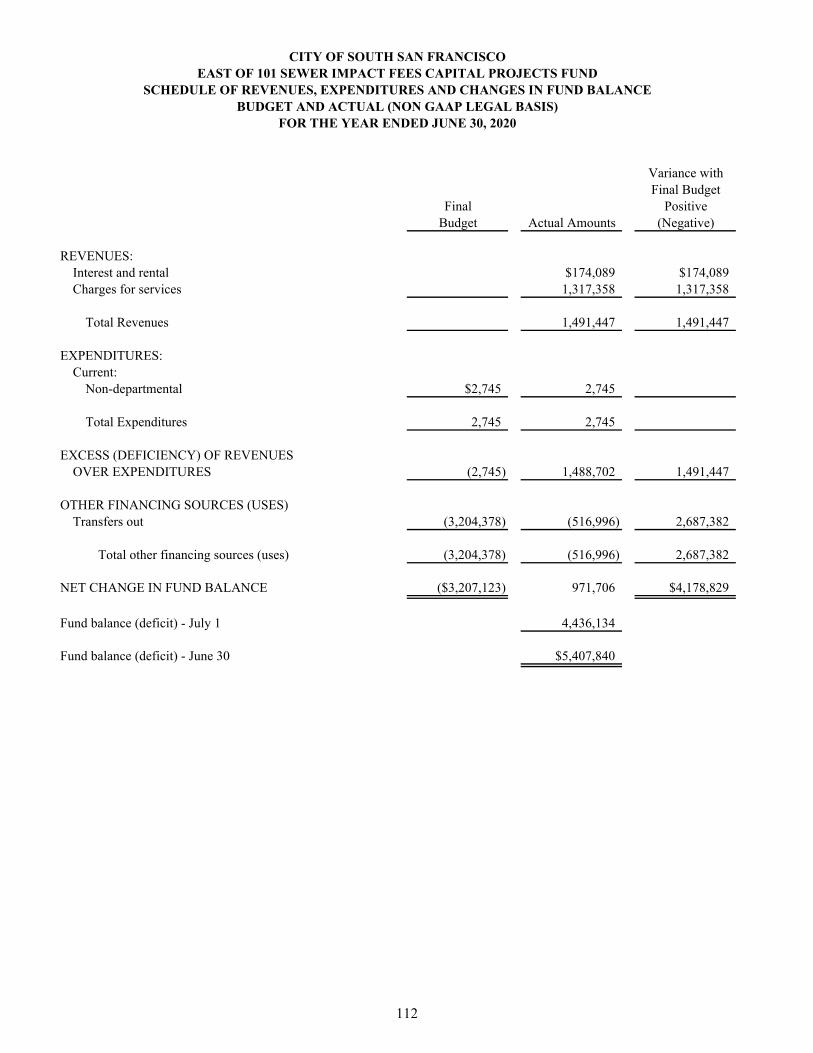
CITY OF SOUTH SAN FRANCISCOEAST OF 101 SEWER IMPACT FEES CAPITAL PROJECTS FUND
SCHEDULE OF REVENUES, EXPENDITURES AND CHANGES IN FUND BALANCEBUDGET AND ACTUAL (NON GAAP LEGAL BASIS)
FOR THE YEAR ENDED JUNE 30, 2020
Variance withFinal Budget
Final PositiveBudget Actual Amounts (Negative)
REVENUES:Interest and rental $174,089 $174,089Charges for services 1,317,358 1,317,358
Total Revenues 1,491,447 1,491,447
EXPENDITURES:Current:
Non-departmental $2,745 2,745
Total Expenditures 2,745 2,745
EXCESS (DEFICIENCY) OF REVENUESOVER EXPENDITURES (2,745) 1,488,702 1,491,447
OTHER FINANCING SOURCES (USES)Transfers out (3,204,378) (516,996) 2,687,382
Total other financing sources (uses) (3,204,378) (516,996) 2,687,382
NET CHANGE IN FUND BALANCE ($3,207,123) 971,706 $4,178,829
Fund balance (deficit) - July 1 4,436,134
Fund balance (deficit) - June 30 $5,407,840
112
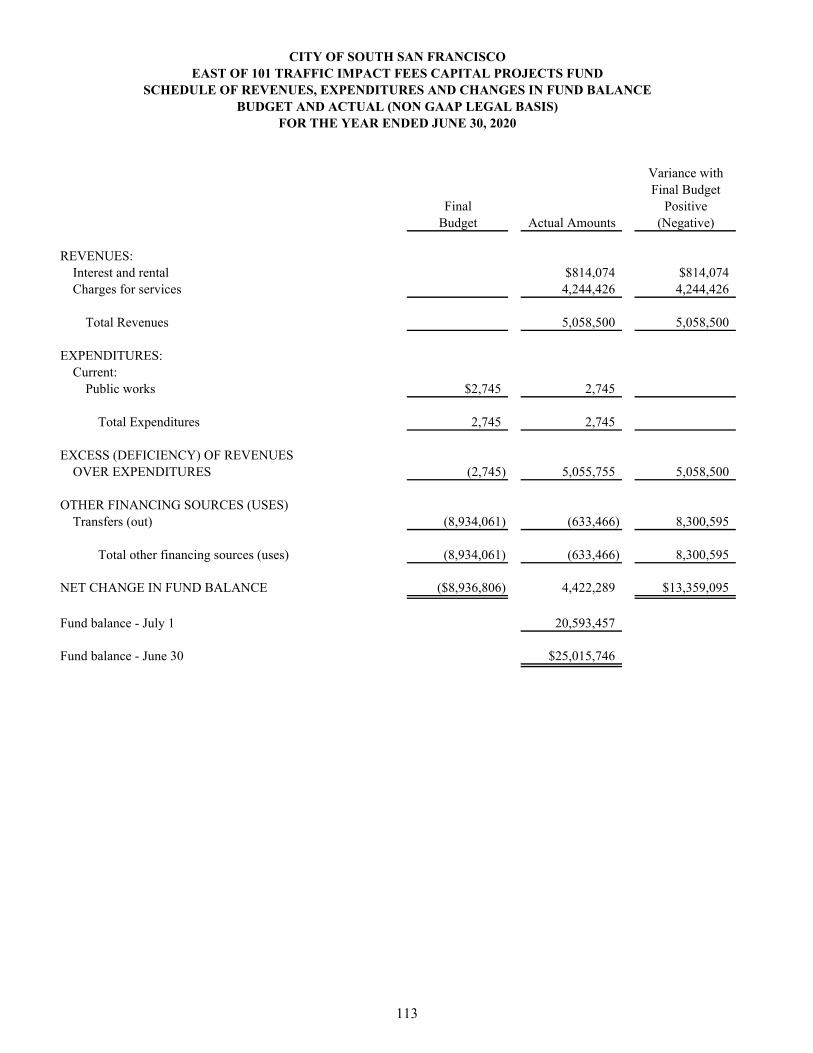
CITY OF SOUTH SAN FRANCISCOEAST OF 101 TRAFFIC IMPACT FEES CAPITAL PROJECTS FUND
SCHEDULE OF REVENUES, EXPENDITURES AND CHANGES IN FUND BALANCEBUDGET AND ACTUAL (NON GAAP LEGAL BASIS)
FOR THE YEAR ENDED JUNE 30, 2020
Variance withFinal Budget
Final PositiveBudget Actual Amounts (Negative)
REVENUES:Interest and rental $814,074 $814,074Charges for services 4,244,426 4,244,426
Total Revenues 5,058,500 5,058,500
EXPENDITURES:Current:
Public works $2,745 2,745
Total Expenditures 2,745 2,745
EXCESS (DEFICIENCY) OF REVENUESOVER EXPENDITURES (2,745) 5,055,755 5,058,500
OTHER FINANCING SOURCES (USES)Transfers (out) (8,934,061) (633,466) 8,300,595
Total other financing sources (uses) (8,934,061) (633,466) 8,300,595
NET CHANGE IN FUND BALANCE ($8,936,806) 4,422,289 $13,359,095
Fund balance - July 1 20,593,457
Fund balance - June 30 $25,015,746
113
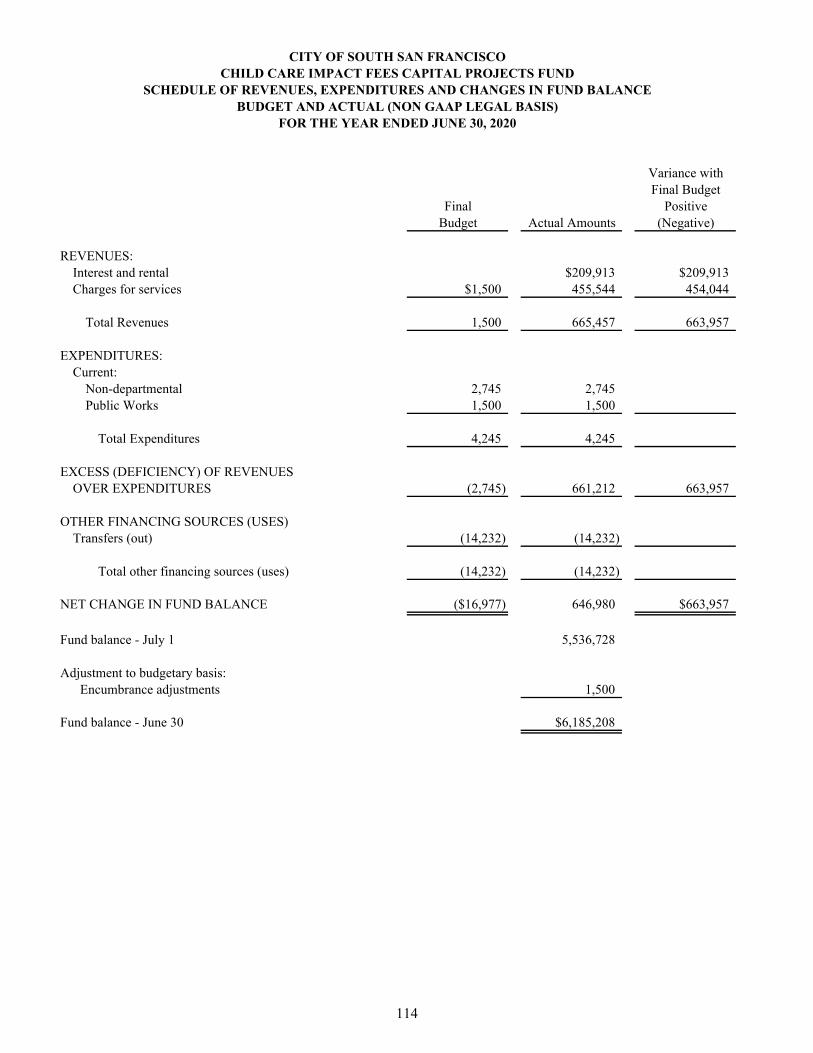
CITY OF SOUTH SAN FRANCISCOCHILD CARE IMPACT FEES CAPITAL PROJECTS FUND
SCHEDULE OF REVENUES, EXPENDITURES AND CHANGES IN FUND BALANCEBUDGET AND ACTUAL (NON GAAP LEGAL BASIS)
FOR THE YEAR ENDED JUNE 30, 2020
Variance withFinal Budget
Final PositiveBudget Actual Amounts (Negative)
REVENUES:Interest and rental $209,913 $209,913Charges for services $1,500 455,544 454,044
Total Revenues 1,500 665,457 663,957
EXPENDITURES:Current:
Non-departmental 2,745 2,745Public Works 1,500 1,500
Total Expenditures 4,245 4,245
EXCESS (DEFICIENCY) OF REVENUESOVER EXPENDITURES (2,745) 661,212 663,957
OTHER FINANCING SOURCES (USES)Transfers (out) (14,232) (14,232)
Total other financing sources (uses) (14,232) (14,232)
NET CHANGE IN FUND BALANCE ($16,977) 646,980 $663,957
Fund balance - July 1 5,536,728
Adjustment to budgetary basis: Encumbrance adjustments 1,500
Fund balance - June 30 $6,185,208
114
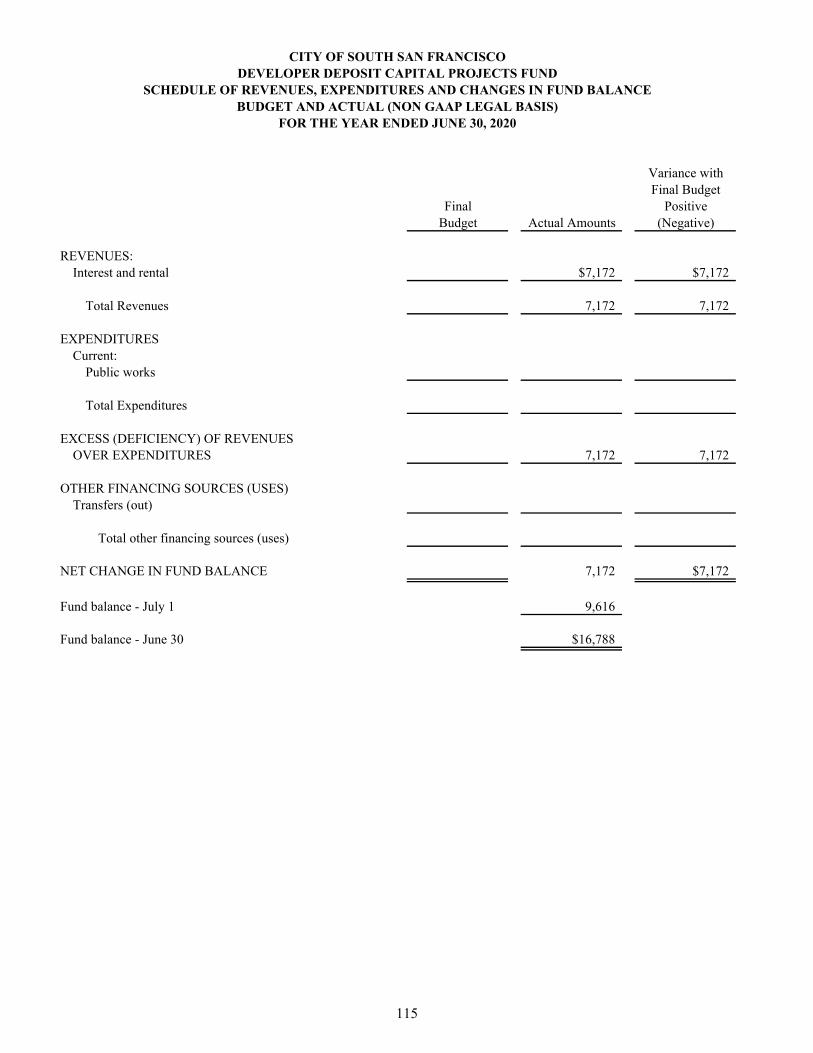
CITY OF SOUTH SAN FRANCISCODEVELOPER DEPOSIT CAPITAL PROJECTS FUND
SCHEDULE OF REVENUES, EXPENDITURES AND CHANGES IN FUND BALANCEBUDGET AND ACTUAL (NON GAAP LEGAL BASIS)
FOR THE YEAR ENDED JUNE 30, 2020
Variance withFinal Budget
Final PositiveBudget Actual Amounts (Negative)
REVENUES:Interest and rental $7,172 $7,172
Total Revenues 7,172 7,172
EXPENDITURESCurrent:
Public works
Total Expenditures
EXCESS (DEFICIENCY) OF REVENUESOVER EXPENDITURES 7,172 7,172
OTHER FINANCING SOURCES (USES)Transfers (out)
Total other financing sources (uses)
NET CHANGE IN FUND BALANCE 7,172 $7,172
Fund balance - July 1 9,616
Fund balance - June 30 $16,788
115
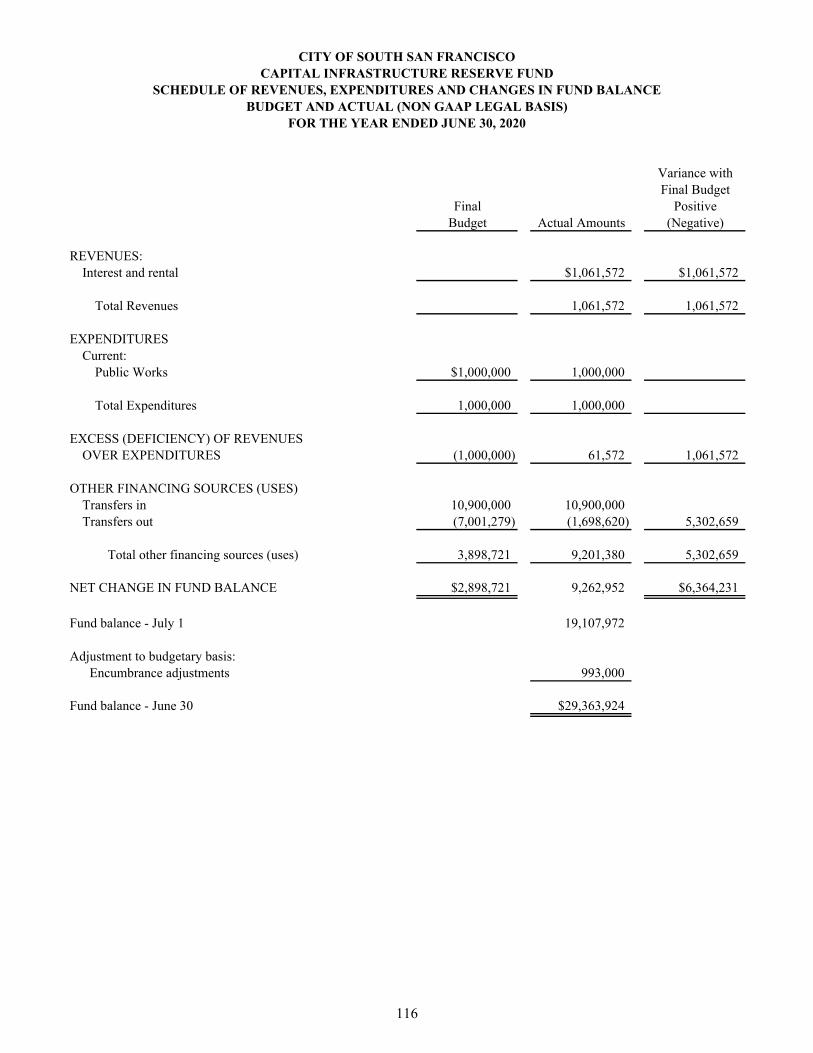
Variance withFinal Budget
Final PositiveBudget Actual Amounts (Negative)
REVENUES:Interest and rental $1,061,572 $1,061,572
Total Revenues 1,061,572 1,061,572
EXPENDITURESCurrent:
Public Works $1,000,000 1,000,000
Total Expenditures 1,000,000 1,000,000
EXCESS (DEFICIENCY) OF REVENUESOVER EXPENDITURES (1,000,000) 61,572 1,061,572
OTHER FINANCING SOURCES (USES)Transfers in 10,900,000 10,900,000Transfers out (7,001,279) (1,698,620) 5,302,659
Total other financing sources (uses) 3,898,721 9,201,380 5,302,659
NET CHANGE IN FUND BALANCE $2,898,721 9,262,952 $6,364,231
Fund balance - July 1 19,107,972
Adjustment to budgetary basis: Encumbrance adjustments 993,000
Fund balance - June 30 $29,363,924
CITY OF SOUTH SAN FRANCISCOCAPITAL INFRASTRUCTURE RESERVE FUND
SCHEDULE OF REVENUES, EXPENDITURES AND CHANGES IN FUND BALANCEBUDGET AND ACTUAL (NON GAAP LEGAL BASIS)
FOR THE YEAR ENDED JUNE 30, 2020
116
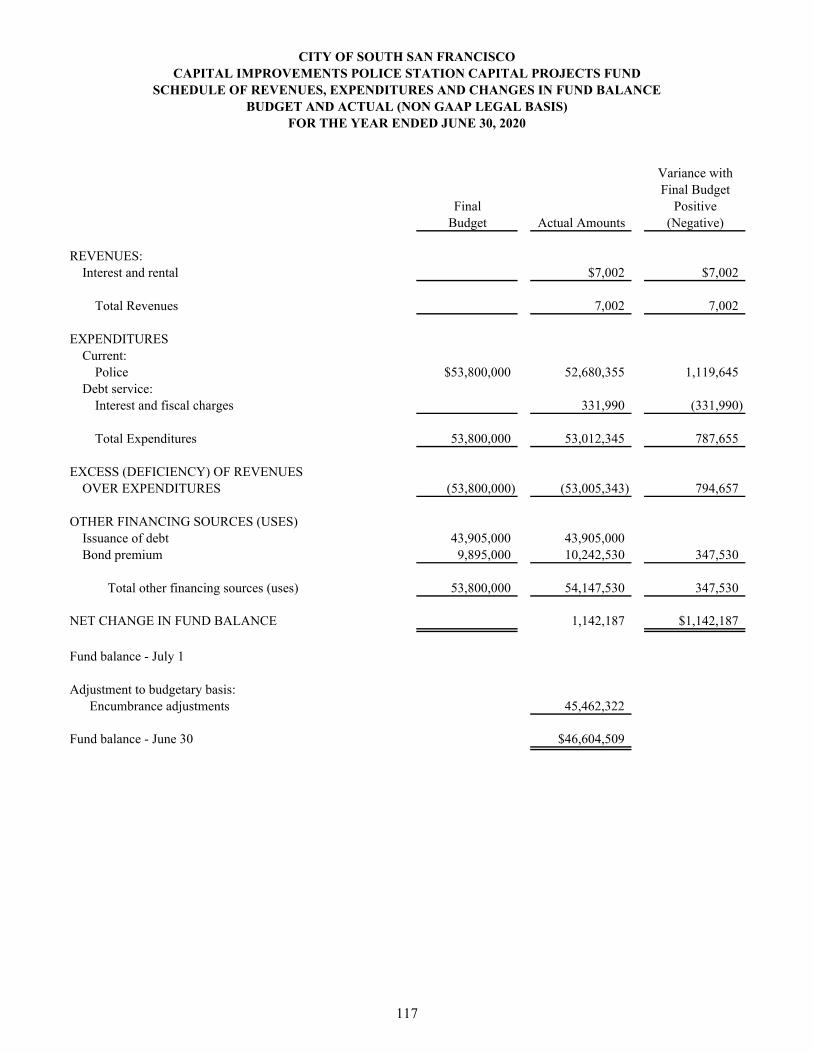
Variance withFinal Budget
Final PositiveBudget Actual Amounts (Negative)
REVENUES:Interest and rental $7,002 $7,002
Total Revenues 7,002 7,002
EXPENDITURESCurrent:
Police $53,800,000 52,680,355 1,119,645Debt service:
Interest and fiscal charges 331,990 (331,990)
Total Expenditures 53,800,000 53,012,345 787,655
EXCESS (DEFICIENCY) OF REVENUESOVER EXPENDITURES (53,800,000) (53,005,343) 794,657
OTHER FINANCING SOURCES (USES)Issuance of debt 43,905,000 43,905,000Bond premium 9,895,000 10,242,530 347,530
Total other financing sources (uses) 53,800,000 54,147,530 347,530
NET CHANGE IN FUND BALANCE 1,142,187 $1,142,187
Fund balance - July 1
Adjustment to budgetary basis: Encumbrance adjustments 45,462,322
Fund balance - June 30 $46,604,509
CITY OF SOUTH SAN FRANCISCOCAPITAL IMPROVEMENTS POLICE STATION CAPITAL PROJECTS FUND
SCHEDULE OF REVENUES, EXPENDITURES AND CHANGES IN FUND BALANCEBUDGET AND ACTUAL (NON GAAP LEGAL BASIS)
FOR THE YEAR ENDED JUNE 30, 2020
117

This Page Left Intentionally Blank
NON-MAJOR GOVERNMENTAL FUNDS
Special revenue funds are used to account for revenue sources that are restricted by law or administrative action to expenditures for specified purposes. Special revenue funds used by the City of South San Francisco include:
Gas Tax – Accounts for State monies received and expended for street improvements, repairs, engineering, and administration under Streets and Highway Code Sections 2105, 2106, 2107, and 2107.5. Includes sales taxes on gasoline received from the State’s Traffic Congestion Relief Fund.
Developer Contributions – Accounts for fees deposited for planning and engineering reviews or for future project development.
Federal Aviation Grant – This fund accounts for federal monies received for insulating structures against airport noise.
Community Development Block Grant – Accounts for Federal monies received to be expended for development of jobs and suitable housing for low-income residents.
Maintenance Districts – Accounts for a portion of property tax dedicated to provide for the maintenance of landscaped areas within housing developments.
Transportation Sales Tax – Accounts for the sales tax that provides resources for street improvements and repairs.
Solid Waste Reduction – Accounts for revenues and expenditures associated with the waste reduction, recycling, composting and household hazardous waste programs for residents and businesses.
Supplemental Law Enforcement Services – Accounts for State monies provided for designated Police department services.
City Programs – Organizations and individuals provide revenues that fund certain programs and services.
Affordable Housing Trust – The inclusionary housing requirement in the City provides that 20% of new residential housing units (for projects of 4 or more units) be affordable. These in-lieu fees (in-lieu of production of affordable housing units by the developer) provide new residential development’s share of affordable housing units.
PEG Equipment and Access – Accounts for the one percent of money set-aside from cable franchise fees that are used to support public, educational and governmental (PEG) channels.
Transit Station Enhancement in-Lieu Fee – Accounts for revenues that are collected as a negotiated community benefit.
Road Maintenance and Rehabilitation – Accounts for State monies received and expended for road maintenance and rehabilitation pursuant to Senate Bill 1, approved in 2017.
San Mateo County (SMC) Measure W ½ Sales Tax – Accounts for the City’s portion of the special half cent sales tax receipts restricted for congestion relief and transit improvements.
119
NON-MAJOR GOVERNMENTAL FUNDS (Continued)
Capital projects funds are used to account for resources used for the acquisition and construction of capital facilities or major capital equipment, except for capital improvements financed by proprietary funds. Capital projects funds used at the City of South San Francisco include:
Non-obligated Capital Projects – Accounts for the construction of assets financed by non-obligated debt. Public Safety Impact Fee – These fees are to provide new development’s share of funding for the replacement of public safety capital equipment, vehicles and facilities.
Oyster Point Improvements Impact Fees – These fees provide new development’s share of funding for the Oyster Point at Highway 101 interchange improvements.
Sewer Capacity Charges – Accounts for cost recovery charged to new development based on
proportional benefit, associated with providing sewer collection and treatment capacity to new development, both through existing infrastructure provided, and through future capital projects not funded by other sources.
Oyster Point Development Impact Fees – Accounts for expenditures associated with the
acquisition, construction, or improvement related to Oyster Point Development. Park Land Acquisition Fee – Accounts for monies received and expended pursuant to SSFMC
Chapter 8.67 and Mitigation Fee Act for park land acquisition. Park Construction Fee – Accounts for monies received and expended pursuant to SSFMC
Chapter 8.67 and Mitigation Fee Act for park construction. Bicycle and Pedestrian Impact Fee – Accounts for monies received and expended pursuant to
SSFMC Chapter 8.68 for mitigation of impacts of new development on bicycle and pedestrian improvements in the City.
Commercial Linkage Impact Fee – Accounts for affordable housing funding created by new commercial development.
Debt service funds are used to account for resources used for the payment of debt service on long-term debt. Debt service funds used at the City of South San Francisco include: 2020A Police Station - Accounts for expenditures associated with the acquisition, construction,
and installation of certain capital improvements constituting the new City police station located within the City’s new Civic Center Campus, and related improvements, facilities and equipment, and pay the costs incurred in connection with the issuance of the Series 2020A Bonds.
120

This Page Left Intentionally Blank
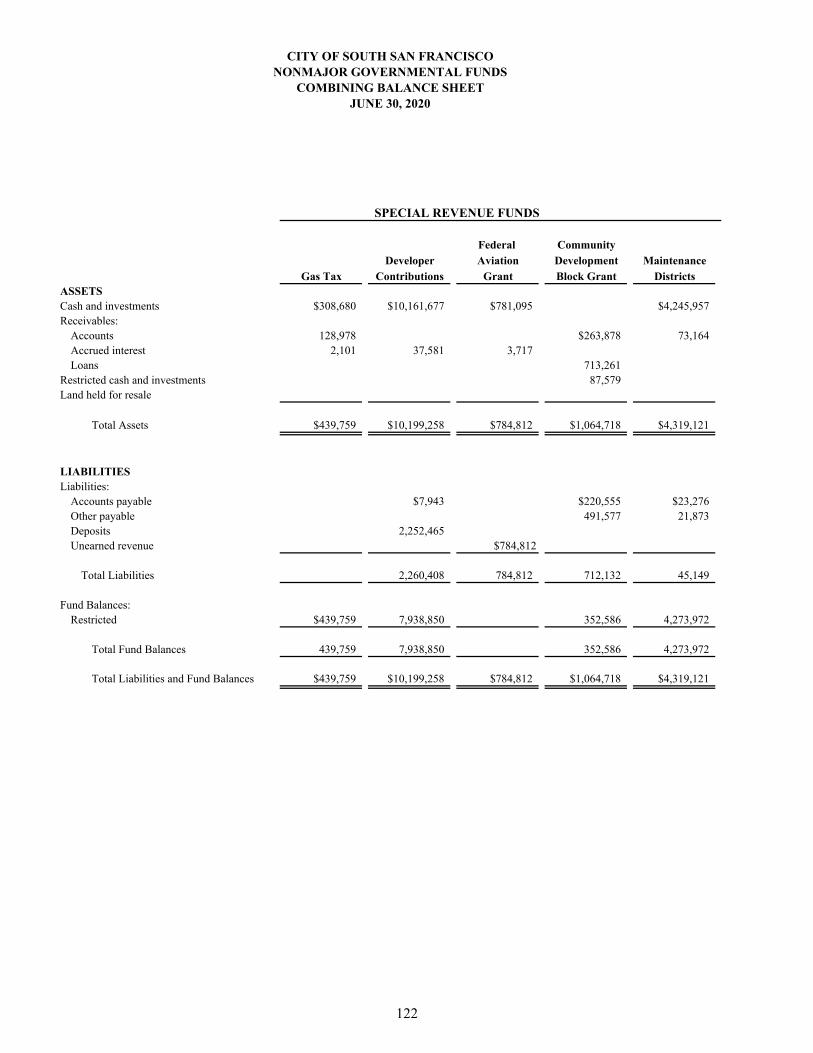
Federal Community
Developer Aviation Development Maintenance
Gas Tax Contributions Grant Block Grant DistrictsASSETSCash and investments $308,680 $10,161,677 $781,095 $4,245,957Receivables:
Accounts 128,978 $263,878 73,164Accrued interest 2,101 37,581 3,717Loans 713,261
Restricted cash and investments 87,579Land held for resale
Total Assets $439,759 $10,199,258 $784,812 $1,064,718 $4,319,121
LIABILITIESLiabilities:
Accounts payable $7,943 $220,555 $23,276Other payable 491,577 21,873Deposits 2,252,465Unearned revenue $784,812
Total Liabilities 2,260,408 784,812 712,132 45,149
Fund Balances:Restricted $439,759 7,938,850 352,586 4,273,972
Total Fund Balances 439,759 7,938,850 352,586 4,273,972
Total Liabilities and Fund Balances $439,759 $10,199,258 $784,812 $1,064,718 $4,319,121
SPECIAL REVENUE FUNDS
CITY OF SOUTH SAN FRANCISCONONMAJOR GOVERNMENTAL FUNDS
COMBINING BALANCE SHEETJUNE 30, 2020
122
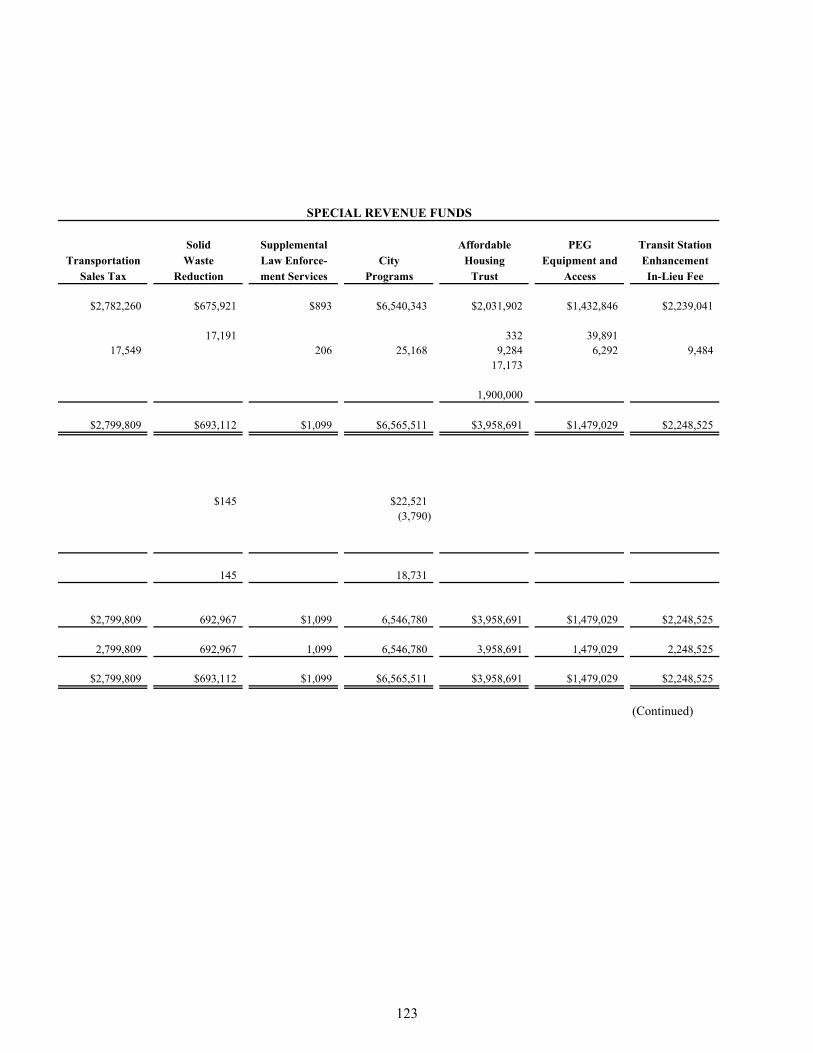
SPECIAL REVENUE FUNDS
Solid Supplemental Affordable PEG Transit Station
Transportation Waste Law Enforce- City Housing Equipment and Enhancement
Sales Tax Reduction ment Services Programs Trust Access In-Lieu Fee
$2,782,260 $675,921 $893 $6,540,343 $2,031,902 $1,432,846 $2,239,041
17,191 332 39,89117,549 206 25,168 9,284 6,292 9,484
17,173
1,900,000
$2,799,809 $693,112 $1,099 $6,565,511 $3,958,691 $1,479,029 $2,248,525
$145 $22,521(3,790)
145 18,731
$2,799,809 692,967 $1,099 6,546,780 $3,958,691 $1,479,029 $2,248,525
2,799,809 692,967 1,099 6,546,780 3,958,691 1,479,029 2,248,525
$2,799,809 $693,112 $1,099 $6,565,511 $3,958,691 $1,479,029 $2,248,525
(Continued)
123
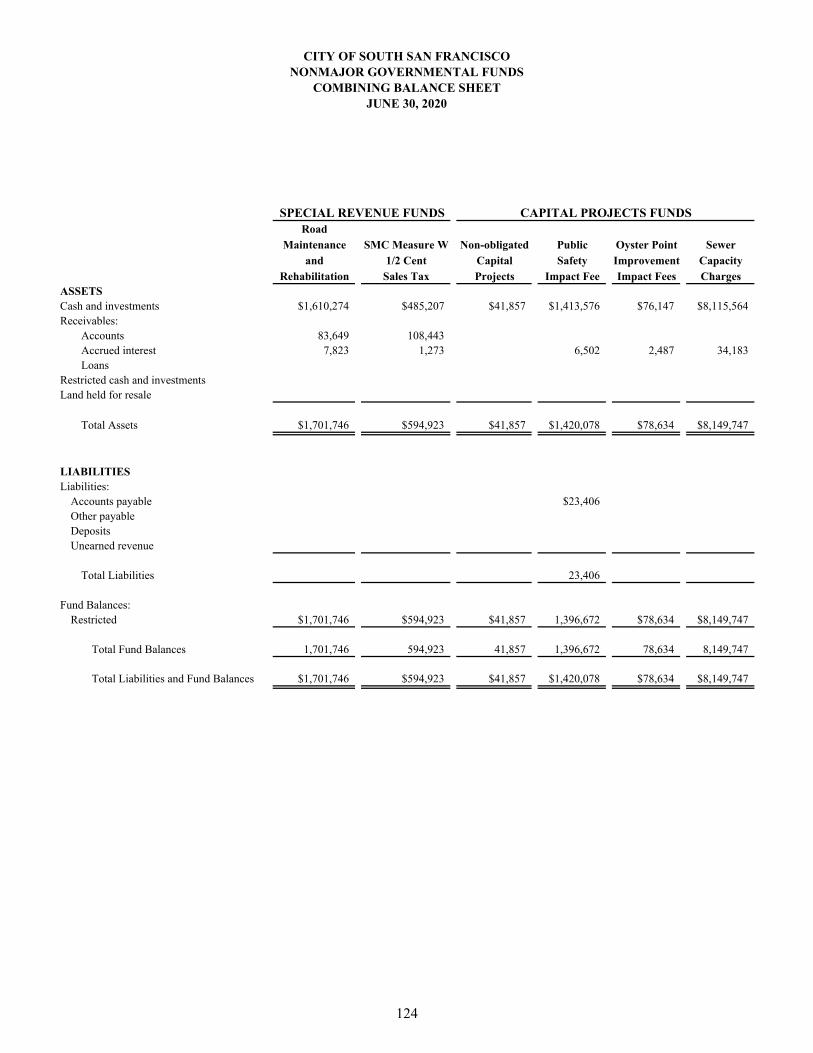
CITY OF SOUTH SAN FRANCISCONONMAJOR GOVERNMENTAL FUNDS
COMBINING BALANCE SHEETJUNE 30, 2020
SPECIAL REVENUE FUNDSRoad
Maintenance SMC Measure W Non-obligated Public Oyster Point Sewer
and 1/2 Cent Capital Safety Improvement Capacity
Rehabilitation Sales Tax Projects Impact Fee Impact Fees ChargesASSETSCash and investments $1,610,274 $485,207 $41,857 $1,413,576 $76,147 $8,115,564Receivables:
Accounts 83,649 108,443Accrued interest 7,823 1,273 6,502 2,487 34,183Loans
Restricted cash and investmentsLand held for resale
Total Assets $1,701,746 $594,923 $41,857 $1,420,078 $78,634 $8,149,747
LIABILITIESLiabilities:
Accounts payable $23,406Other payableDepositsUnearned revenue
Total Liabilities 23,406
Fund Balances:Restricted $1,701,746 $594,923 $41,857 1,396,672 $78,634 $8,149,747
Total Fund Balances 1,701,746 594,923 41,857 1,396,672 78,634 8,149,747
Total Liabilities and Fund Balances $1,701,746 $594,923 $41,857 $1,420,078 $78,634 $8,149,747
CAPITAL PROJECTS FUNDS
124
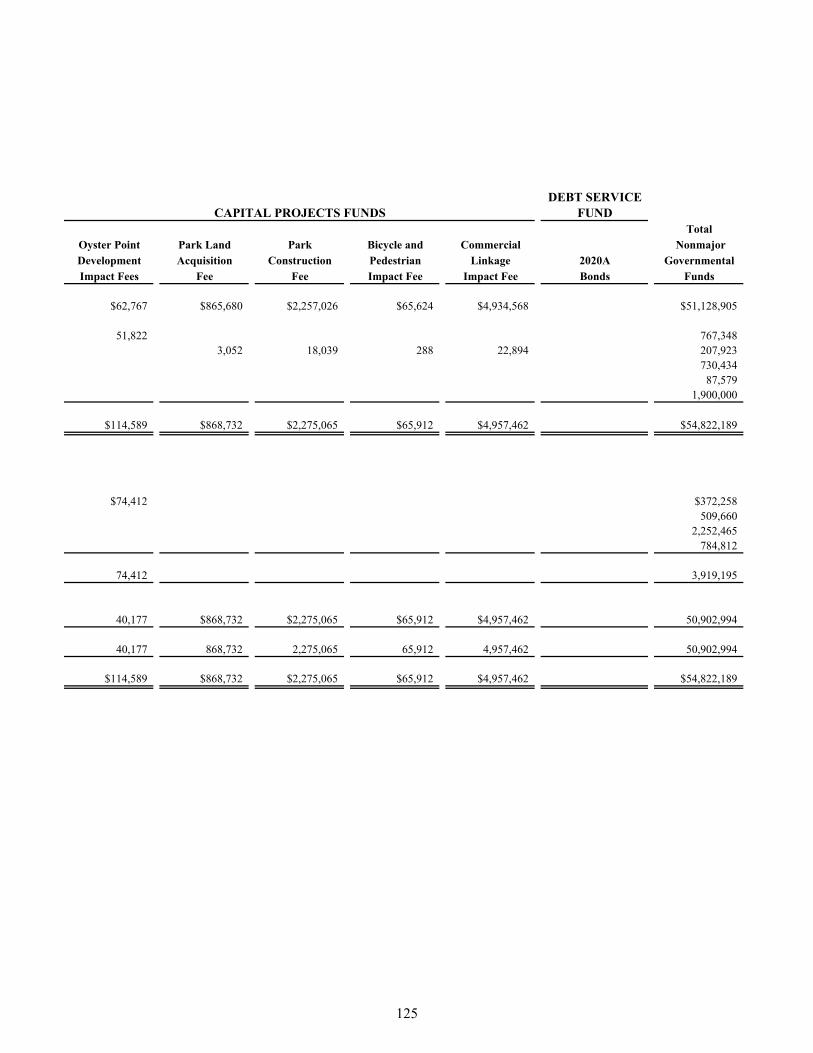
DEBT SERVICECAPITAL PROJECTS FUNDS FUND
Total
Oyster Point Park Land Park Bicycle and Commercial Nonmajor
Development Acquisition Construction Pedestrian Linkage 2020A Governmental
Impact Fees Fee Fee Impact Fee Impact Fee Bonds Funds
$62,767 $865,680 $2,257,026 $65,624 $4,934,568 $51,128,905
51,822 767,3483,052 18,039 288 22,894 207,923
730,43487,579
1,900,000
$114,589 $868,732 $2,275,065 $65,912 $4,957,462 $54,822,189
$74,412 $372,258509,660
2,252,465784,812
74,412 3,919,195
40,177 $868,732 $2,275,065 $65,912 $4,957,462 50,902,994
40,177 868,732 2,275,065 65,912 4,957,462 50,902,994
$114,589 $868,732 $2,275,065 $65,912 $4,957,462 $54,822,189
125
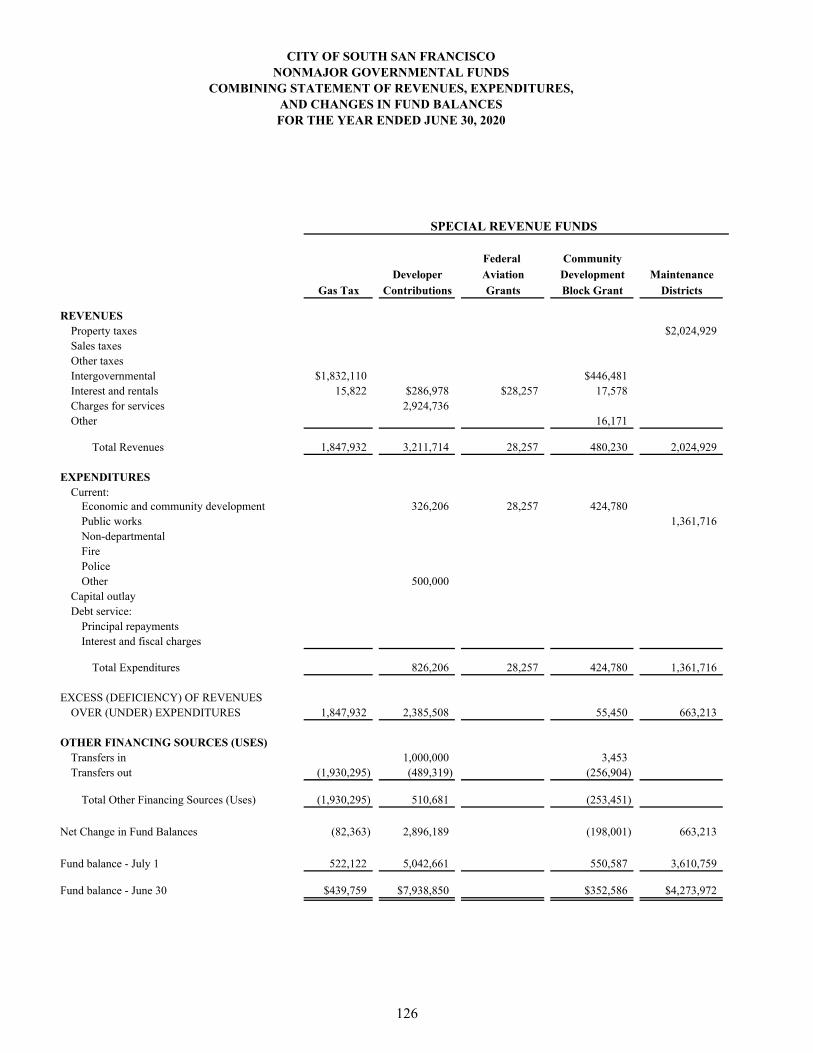
CITY OF SOUTH SAN FRANCISCONONMAJOR GOVERNMENTAL FUNDS
COMBINING STATEMENT OF REVENUES, EXPENDITURES,AND CHANGES IN FUND BALANCESFOR THE YEAR ENDED JUNE 30, 2020
SPECIAL REVENUE FUNDS
Federal Community
Developer Aviation Development Maintenance
Gas Tax Contributions Grants Block Grant Districts
REVENUESProperty taxes $2,024,929Sales taxesOther taxesIntergovernmental $1,832,110 $446,481Interest and rentals 15,822 $286,978 $28,257 17,578Charges for services 2,924,736Other 16,171
Total Revenues 1,847,932 3,211,714 28,257 480,230 2,024,929
EXPENDITURESCurrent:
Economic and community development 326,206 28,257 424,780Public works 1,361,716Non-departmentalFirePoliceOther 500,000
Capital outlayDebt service:
Principal repaymentsInterest and fiscal charges
Total Expenditures 826,206 28,257 424,780 1,361,716
EXCESS (DEFICIENCY) OF REVENUES OVER (UNDER) EXPENDITURES 1,847,932 2,385,508 55,450 663,213
OTHER FINANCING SOURCES (USES)Transfers in 1,000,000 3,453Transfers out (1,930,295) (489,319) (256,904)
Total Other Financing Sources (Uses) (1,930,295) 510,681 (253,451)
Net Change in Fund Balances (82,363) 2,896,189 (198,001) 663,213
Fund balance - July 1 522,122 5,042,661 550,587 3,610,759
Fund balance - June 30 $439,759 $7,938,850 $352,586 $4,273,972
126
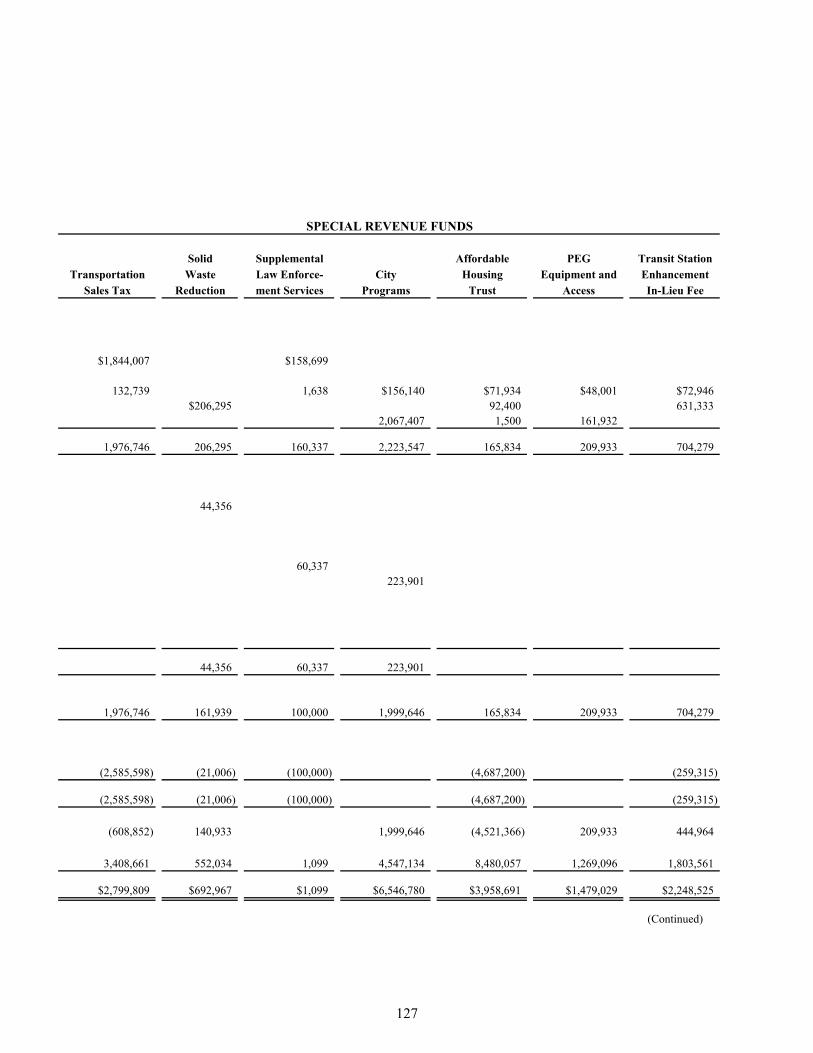
SPECIAL REVENUE FUNDS
Solid Supplemental Affordable PEG Transit Station
Transportation Waste Law Enforce- City Housing Equipment and Enhancement
Sales Tax Reduction ment Services Programs Trust Access In-Lieu Fee
$1,844,007 $158,699
132,739 1,638 $156,140 $71,934 $48,001 $72,946$206,295 92,400 631,333
2,067,407 1,500 161,932
1,976,746 206,295 160,337 2,223,547 165,834 209,933 704,279
44,356
60,337223,901
44,356 60,337 223,901
1,976,746 161,939 100,000 1,999,646 165,834 209,933 704,279
(2,585,598) (21,006) (100,000) (4,687,200) (259,315)
(2,585,598) (21,006) (100,000) (4,687,200) (259,315)
(608,852) 140,933 1,999,646 (4,521,366) 209,933 444,964
3,408,661 552,034 1,099 4,547,134 8,480,057 1,269,096 1,803,561
$2,799,809 $692,967 $1,099 $6,546,780 $3,958,691 $1,479,029 $2,248,525
(Continued)
127
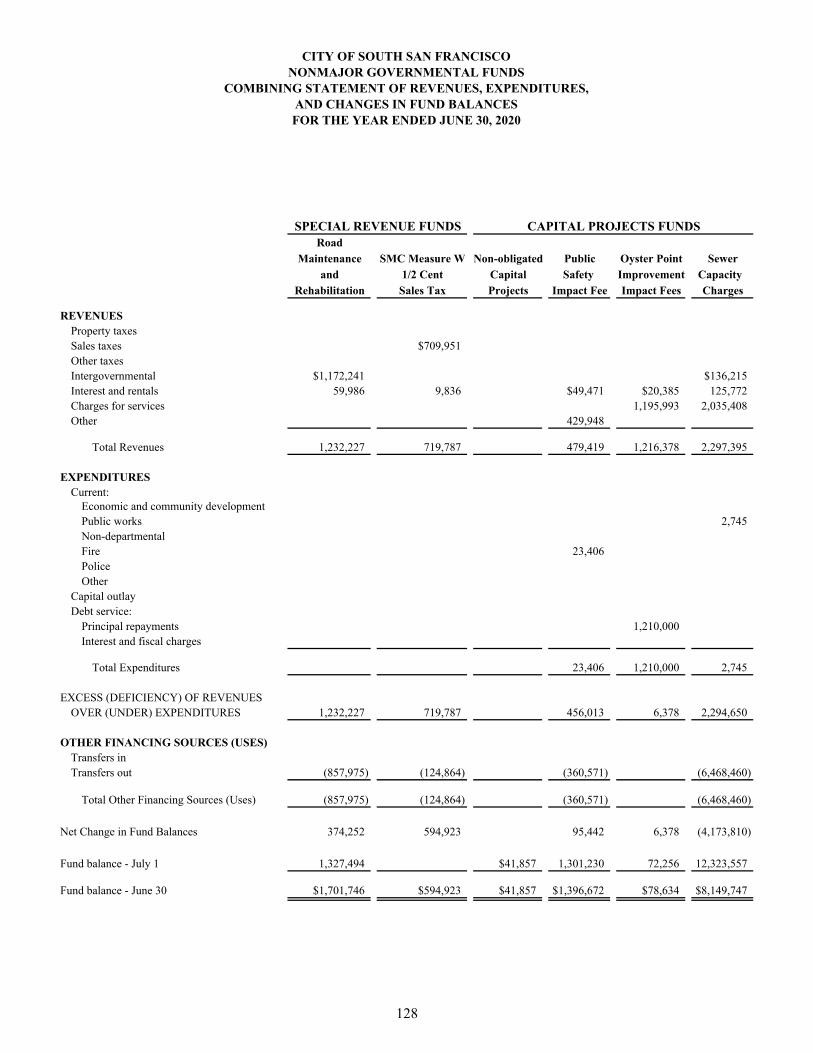
CITY OF SOUTH SAN FRANCISCONONMAJOR GOVERNMENTAL FUNDS
COMBINING STATEMENT OF REVENUES, EXPENDITURES,AND CHANGES IN FUND BALANCESFOR THE YEAR ENDED JUNE 30, 2020
SPECIAL REVENUE FUNDSRoad
Maintenance SMC Measure W Non-obligated Public Oyster Point Sewer
and 1/2 Cent Capital Safety Improvement Capacity
Rehabilitation Sales Tax Projects Impact Fee Impact Fees Charges
REVENUESProperty taxesSales taxes $709,951Other taxesIntergovernmental $1,172,241 $136,215Interest and rentals 59,986 9,836 $49,471 $20,385 125,772Charges for services 1,195,993 2,035,408Other 429,948
Total Revenues 1,232,227 719,787 479,419 1,216,378 2,297,395
EXPENDITURESCurrent:
Economic and community developmentPublic works 2,745Non-departmentalFire 23,406PoliceOther
Capital outlayDebt service:
Principal repayments 1,210,000Interest and fiscal charges
Total Expenditures 23,406 1,210,000 2,745
EXCESS (DEFICIENCY) OF REVENUES OVER (UNDER) EXPENDITURES 1,232,227 719,787 456,013 6,378 2,294,650
OTHER FINANCING SOURCES (USES)Transfers inTransfers out (857,975) (124,864) (360,571) (6,468,460)
Total Other Financing Sources (Uses) (857,975) (124,864) (360,571) (6,468,460)
Net Change in Fund Balances 374,252 594,923 95,442 6,378 (4,173,810)
Fund balance - July 1 1,327,494 $41,857 1,301,230 72,256 12,323,557
Fund balance - June 30 $1,701,746 $594,923 $41,857 $1,396,672 $78,634 $8,149,747
CAPITAL PROJECTS FUNDS
128
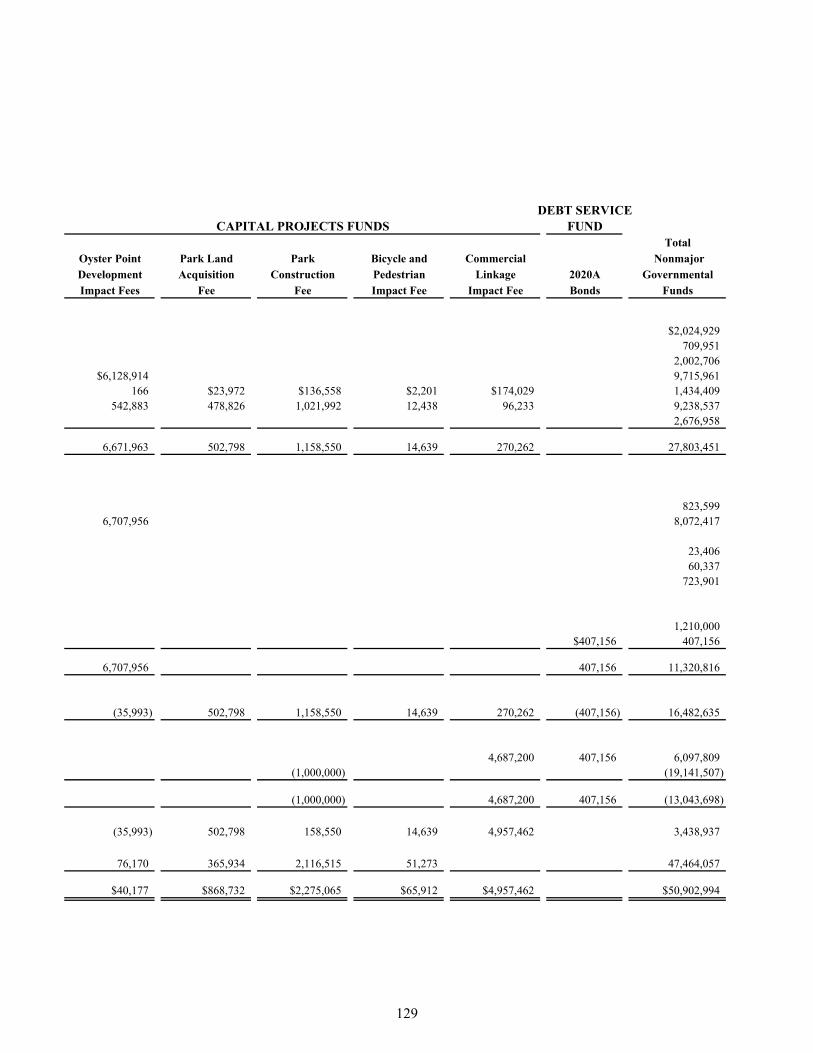
DEBT SERVICECAPITAL PROJECTS FUNDS FUND
Total
Oyster Point Park Land Park Bicycle and Commercial Nonmajor
Development Acquisition Construction Pedestrian Linkage 2020A Governmental
Impact Fees Fee Fee Impact Fee Impact Fee Bonds Funds
$2,024,929709,951
2,002,706$6,128,914 9,715,961
166 $23,972 $136,558 $2,201 $174,029 1,434,409542,883 478,826 1,021,992 12,438 96,233 9,238,537
2,676,958
6,671,963 502,798 1,158,550 14,639 270,262 27,803,451
823,5996,707,956 8,072,417
23,40660,337
723,901
1,210,000$407,156 407,156
6,707,956 407,156 11,320,816
(35,993) 502,798 1,158,550 14,639 270,262 (407,156) 16,482,635
4,687,200 407,156 6,097,809(1,000,000) (19,141,507)
(1,000,000) 4,687,200 407,156 (13,043,698)
(35,993) 502,798 158,550 14,639 4,957,462 3,438,937
76,170 365,934 2,116,515 51,273 47,464,057
$40,177 $868,732 $2,275,065 $65,912 $4,957,462 $50,902,994
129
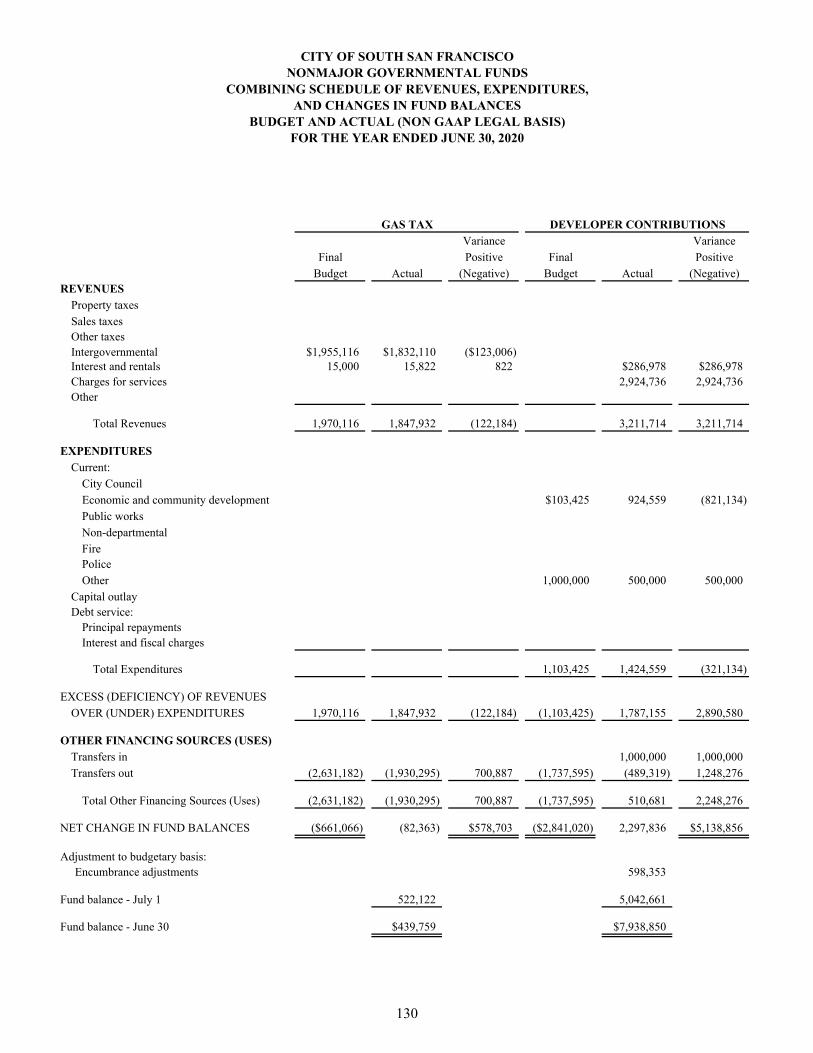
CITY OF SOUTH SAN FRANCISCONONMAJOR GOVERNMENTAL FUNDS
COMBINING SCHEDULE OF REVENUES, EXPENDITURES,AND CHANGES IN FUND BALANCES
BUDGET AND ACTUAL (NON GAAP LEGAL BASIS)FOR THE YEAR ENDED JUNE 30, 2020
GAS TAX DEVELOPER CONTRIBUTIONS
Variance Variance
Final Positive Final Positive
Budget Actual (Negative) Budget Actual (Negative)REVENUES
Property taxes
Sales taxesOther taxesIntergovernmental $1,955,116 $1,832,110 ($123,006)Interest and rentals 15,000 15,822 822 $286,978 $286,978Charges for services 2,924,736 2,924,736Other
Total Revenues 1,970,116 1,847,932 (122,184) 3,211,714 3,211,714
EXPENDITURES
Current:
City Council
Economic and community development $103,425 924,559 (821,134)
Public works
Non-departmental
FirePolice
Other 1,000,000 500,000 500,000
Capital outlayDebt service:
Principal repaymentsInterest and fiscal charges
Total Expenditures 1,103,425 1,424,559 (321,134)
EXCESS (DEFICIENCY) OF REVENUES
OVER (UNDER) EXPENDITURES 1,970,116 1,847,932 (122,184) (1,103,425) 1,787,155 2,890,580
OTHER FINANCING SOURCES (USES)
Transfers in 1,000,000 1,000,000
Transfers out (2,631,182) (1,930,295) 700,887 (1,737,595) (489,319) 1,248,276
Total Other Financing Sources (Uses) (2,631,182) (1,930,295) 700,887 (1,737,595) 510,681 2,248,276
NET CHANGE IN FUND BALANCES ($661,066) (82,363) $578,703 ($2,841,020) 2,297,836 $5,138,856
Adjustment to budgetary basis: Encumbrance adjustments 598,353
Fund balance - July 1 522,122 5,042,661
Fund balance - June 30 $439,759 $7,938,850
130
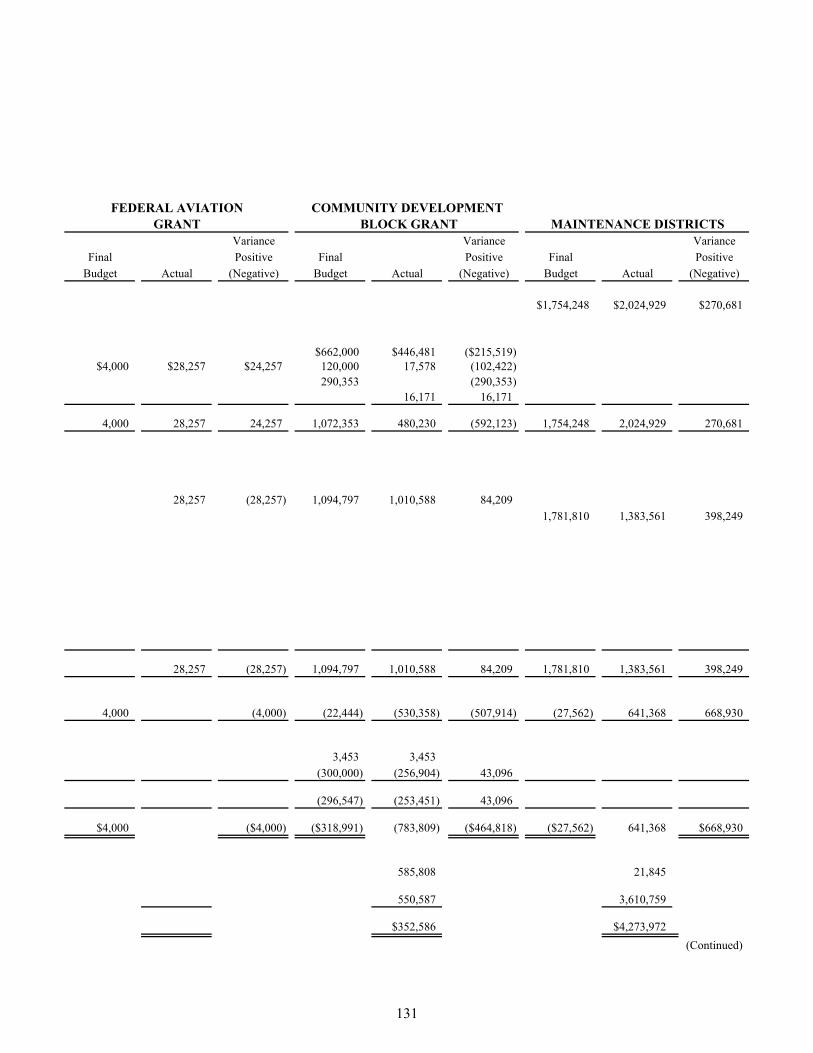
MAINTENANCE DISTRICTSVariance Variance Variance
Final Positive Final Positive Final Positive
Budget Actual (Negative) Budget Actual (Negative) Budget Actual (Negative)
$1,754,248 $2,024,929 $270,681
$662,000 $446,481 ($215,519)$4,000 $28,257 $24,257 120,000 17,578 (102,422)
290,353 (290,353)16,171 16,171
4,000 28,257 24,257 1,072,353 480,230 (592,123) 1,754,248 2,024,929 270,681
28,257 (28,257) 1,094,797 1,010,588 84,209
1,781,810 1,383,561 398,249
28,257 (28,257) 1,094,797 1,010,588 84,209 1,781,810 1,383,561 398,249
4,000 (4,000) (22,444) (530,358) (507,914) (27,562) 641,368 668,930
3,453 3,453
(300,000) (256,904) 43,096
(296,547) (253,451) 43,096
$4,000 ($4,000) ($318,991) (783,809) ($464,818) ($27,562) 641,368 $668,930
585,808 21,845
550,587 3,610,759
$352,586 $4,273,972
(Continued)
GRANT BLOCK GRANTCOMMUNITY DEVELOPMENTFEDERAL AVIATION
131
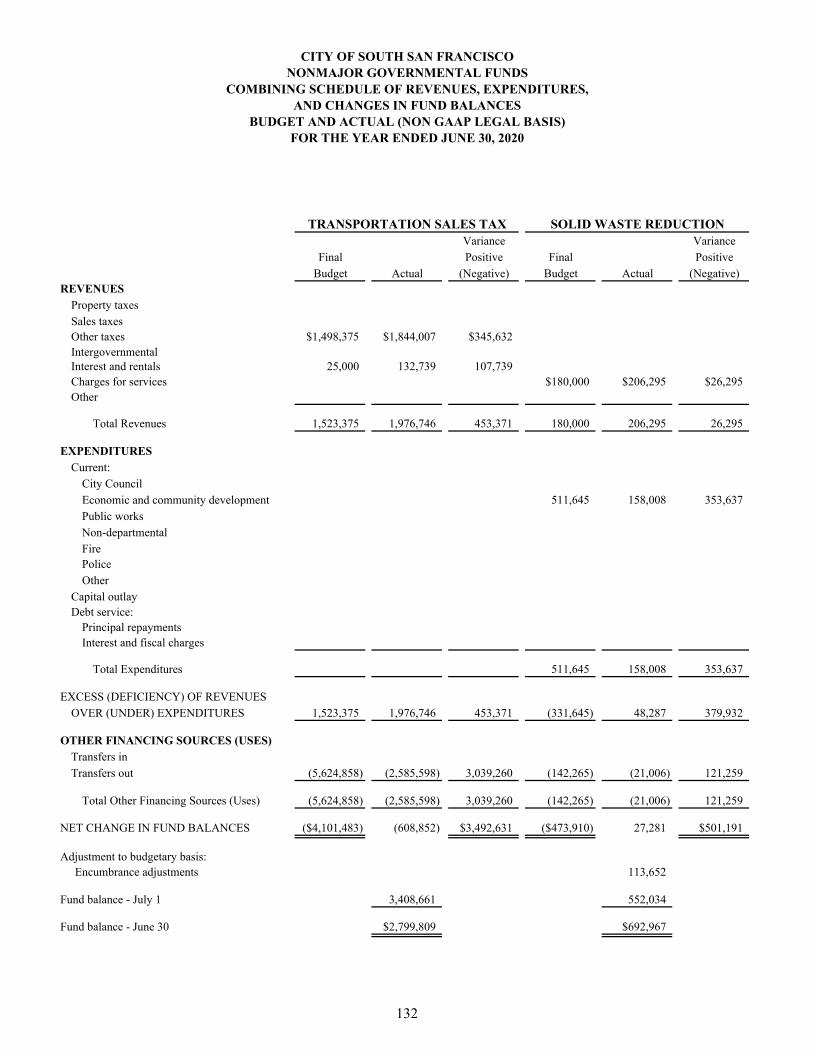
Variance Variance
Final Positive Final Positive
Budget Actual (Negative) Budget Actual (Negative)REVENUES
Property taxes
Sales taxesOther taxes $1,498,375 $1,844,007 $345,632IntergovernmentalInterest and rentals 25,000 132,739 107,739Charges for services $180,000 $206,295 $26,295Other
Total Revenues 1,523,375 1,976,746 453,371 180,000 206,295 26,295
EXPENDITURES
Current:
City Council
Economic and community development 511,645 158,008 353,637
Public works
Non-departmental
FirePolice
Other
Capital outlayDebt service:
Principal repaymentsInterest and fiscal charges
Total Expenditures 511,645 158,008 353,637
EXCESS (DEFICIENCY) OF REVENUES
OVER (UNDER) EXPENDITURES 1,523,375 1,976,746 453,371 (331,645) 48,287 379,932
OTHER FINANCING SOURCES (USES)
Transfers in
Transfers out (5,624,858) (2,585,598) 3,039,260 (142,265) (21,006) 121,259
Total Other Financing Sources (Uses) (5,624,858) (2,585,598) 3,039,260 (142,265) (21,006) 121,259
NET CHANGE IN FUND BALANCES ($4,101,483) (608,852) $3,492,631 ($473,910) 27,281 $501,191
Adjustment to budgetary basis: Encumbrance adjustments 113,652
Fund balance - July 1 3,408,661 552,034
Fund balance - June 30 $2,799,809 $692,967
CITY OF SOUTH SAN FRANCISCONONMAJOR GOVERNMENTAL FUNDS
COMBINING SCHEDULE OF REVENUES, EXPENDITURES,AND CHANGES IN FUND BALANCES
BUDGET AND ACTUAL (NON GAAP LEGAL BASIS)FOR THE YEAR ENDED JUNE 30, 2020
TRANSPORTATION SALES TAX SOLID WASTE REDUCTION
132
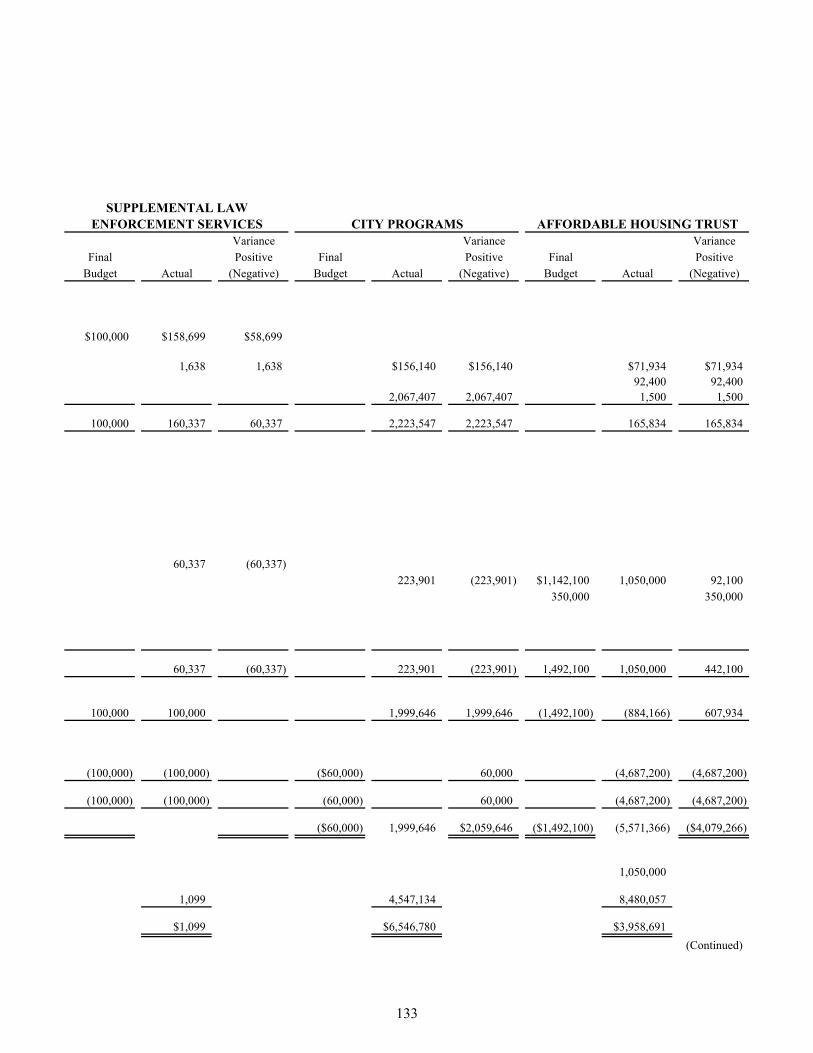
AFFORDABLE HOUSING TRUSTVariance Variance Variance
Final Positive Final Positive Final Positive
Budget Actual (Negative) Budget Actual (Negative) Budget Actual (Negative)
$100,000 $158,699 $58,699
1,638 1,638 $156,140 $156,140 $71,934 $71,93492,400 92,400
2,067,407 2,067,407 1,500 1,500
100,000 160,337 60,337 2,223,547 2,223,547 165,834 165,834
60,337 (60,337)
223,901 (223,901) $1,142,100 1,050,000 92,100
350,000 350,000
60,337 (60,337) 223,901 (223,901) 1,492,100 1,050,000 442,100
100,000 100,000 1,999,646 1,999,646 (1,492,100) (884,166) 607,934
(100,000) (100,000) ($60,000) 60,000 (4,687,200) (4,687,200)
(100,000) (100,000) (60,000) 60,000 (4,687,200) (4,687,200)
($60,000) 1,999,646 $2,059,646 ($1,492,100) (5,571,366) ($4,079,266)
1,050,000
1,099 4,547,134 8,480,057
$1,099 $6,546,780 $3,958,691
(Continued)
CITY PROGRAMSENFORCEMENT SERVICESSUPPLEMENTAL LAW
133
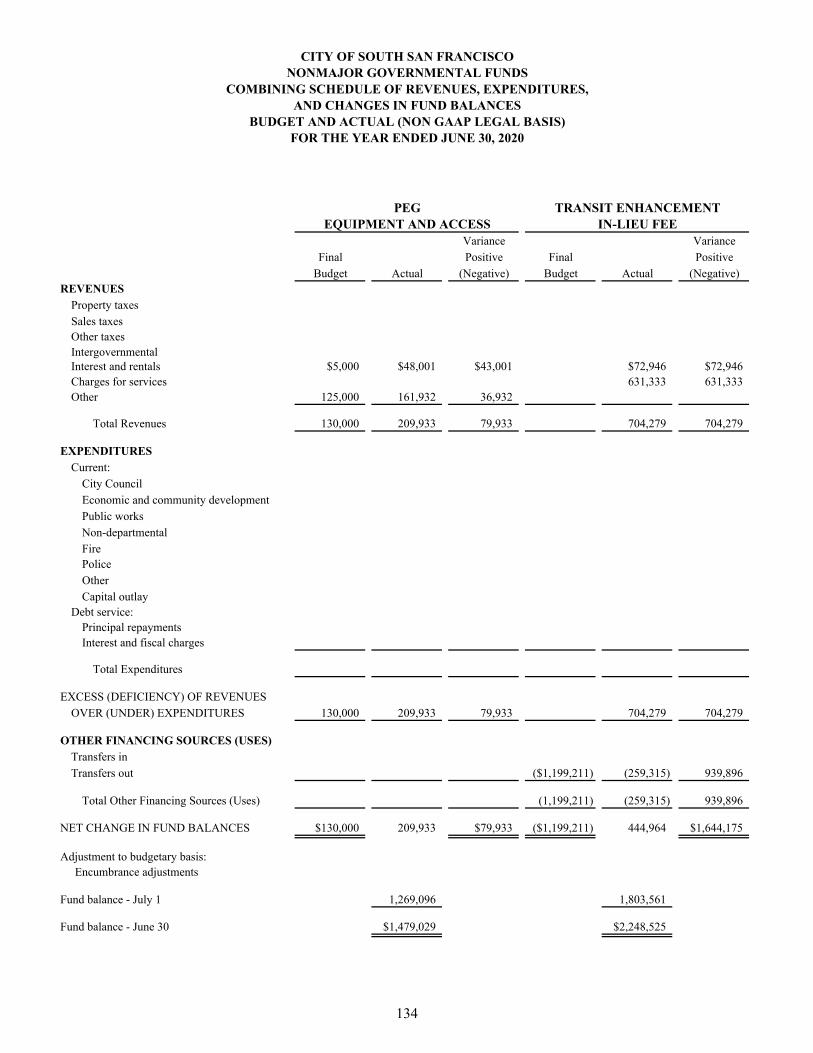
CITY OF SOUTH SAN FRANCISCONONMAJOR GOVERNMENTAL FUNDS
COMBINING SCHEDULE OF REVENUES, EXPENDITURES,AND CHANGES IN FUND BALANCES
BUDGET AND ACTUAL (NON GAAP LEGAL BASIS)FOR THE YEAR ENDED JUNE 30, 2020
Variance Variance
Final Positive Final Positive
Budget Actual (Negative) Budget Actual (Negative)REVENUES
Property taxes
Sales taxesOther taxesIntergovernmentalInterest and rentals $5,000 $48,001 $43,001 $72,946 $72,946Charges for services 631,333 631,333Other 125,000 161,932 36,932
Total Revenues 130,000 209,933 79,933 704,279 704,279
EXPENDITURES
Current:
City Council
Economic and community development
Public works
Non-departmental
FirePolice
Other
Capital outlayDebt service:
Principal repaymentsInterest and fiscal charges
Total Expenditures
EXCESS (DEFICIENCY) OF REVENUES
OVER (UNDER) EXPENDITURES 130,000 209,933 79,933 704,279 704,279
OTHER FINANCING SOURCES (USES)
Transfers in
Transfers out ($1,199,211) (259,315) 939,896
Total Other Financing Sources (Uses) (1,199,211) (259,315) 939,896
NET CHANGE IN FUND BALANCES $130,000 209,933 $79,933 ($1,199,211) 444,964 $1,644,175
Adjustment to budgetary basis: Encumbrance adjustments
Fund balance - July 1 1,269,096 1,803,561
Fund balance - June 30 $1,479,029 $2,248,525
TRANSIT ENHANCEMENTIN-LIEU FEE
PEGEQUIPMENT AND ACCESS
134
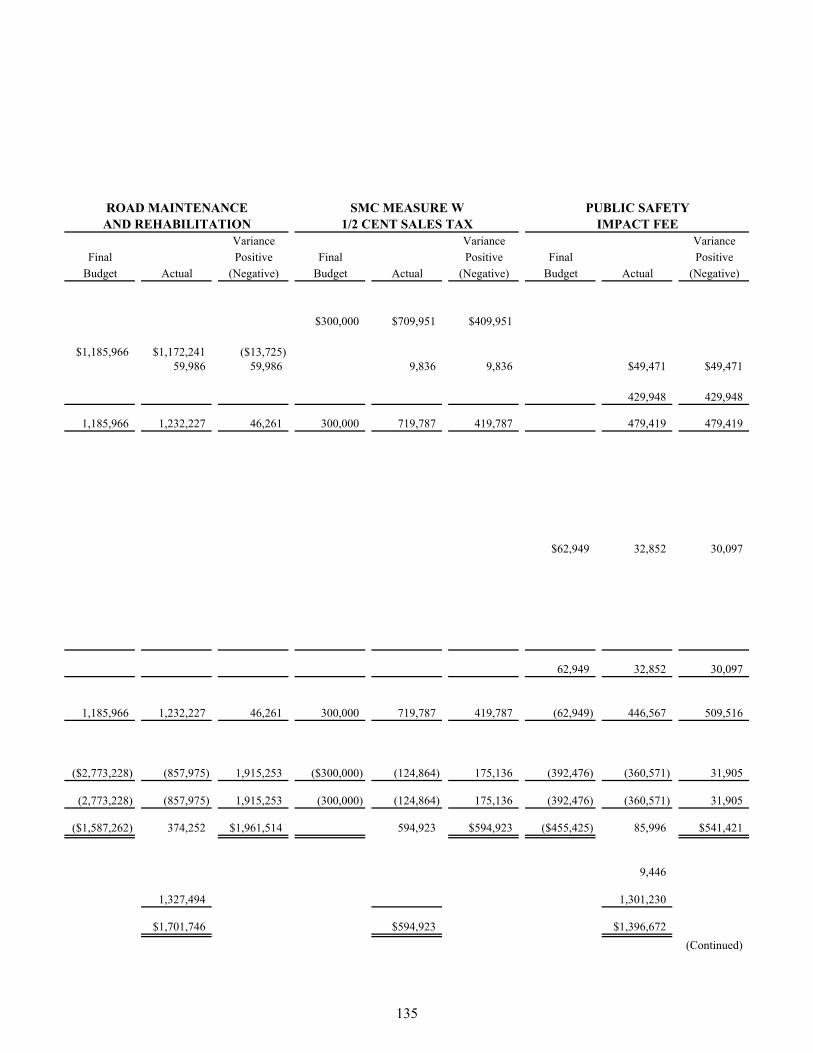
Variance Variance Variance
Final Positive Final Positive Final Positive
Budget Actual (Negative) Budget Actual (Negative) Budget Actual (Negative)
$300,000 $709,951 $409,951
$1,185,966 $1,172,241 ($13,725)59,986 59,986 9,836 9,836 $49,471 $49,471
429,948 429,948
1,185,966 1,232,227 46,261 300,000 719,787 419,787 479,419 479,419
$62,949 32,852 30,097
62,949 32,852 30,097
1,185,966 1,232,227 46,261 300,000 719,787 419,787 (62,949) 446,567 509,516
($2,773,228) (857,975) 1,915,253 ($300,000) (124,864) 175,136 (392,476) (360,571) 31,905
(2,773,228) (857,975) 1,915,253 (300,000) (124,864) 175,136 (392,476) (360,571) 31,905
($1,587,262) 374,252 $1,961,514 594,923 $594,923 ($455,425) 85,996 $541,421
9,446
1,327,494 1,301,230
$1,701,746 $594,923 $1,396,672
(Continued)
PUBLIC SAFETYIMPACT FEE
ROAD MAINTENANCEAND REHABILITATION
SMC MEASURE W1/2 CENT SALES TAX
135
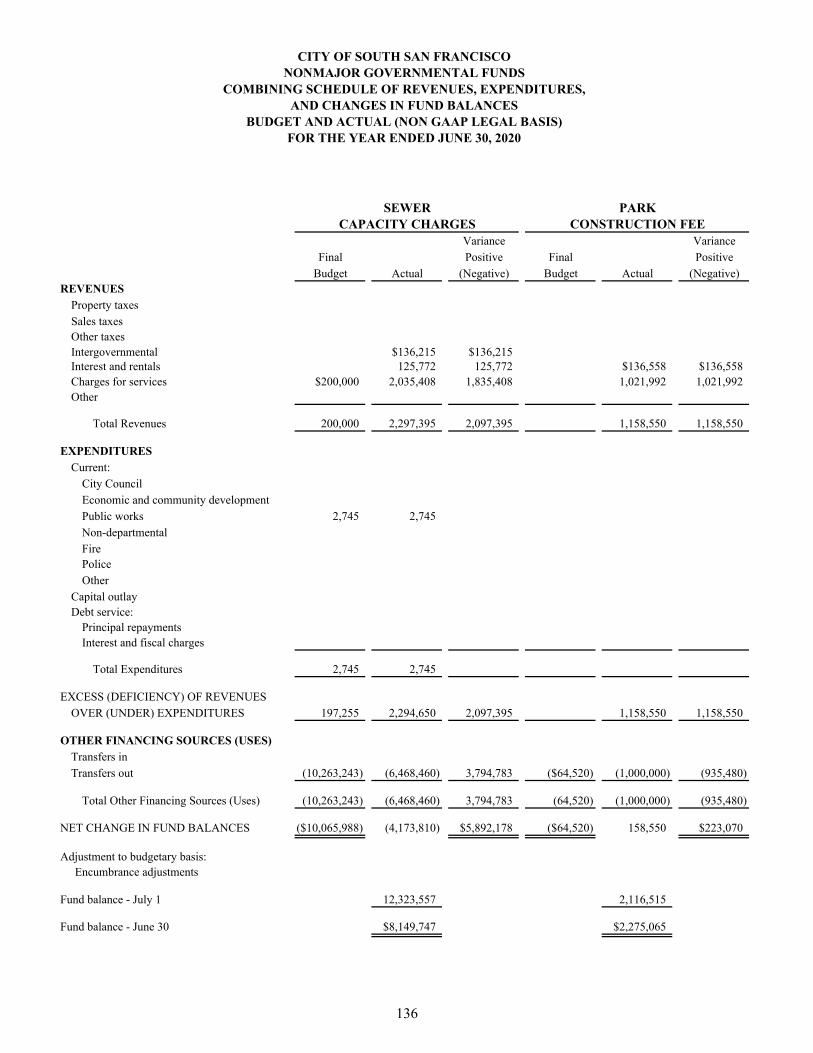
CITY OF SOUTH SAN FRANCISCONONMAJOR GOVERNMENTAL FUNDS
COMBINING SCHEDULE OF REVENUES, EXPENDITURES,AND CHANGES IN FUND BALANCES
BUDGET AND ACTUAL (NON GAAP LEGAL BASIS)FOR THE YEAR ENDED JUNE 30, 2020
SEWERCAPACITY CHARGES
Variance Variance
Final Positive Final Positive
Budget Actual (Negative) Budget Actual (Negative)REVENUES
Property taxes
Sales taxesOther taxesIntergovernmental $136,215 $136,215Interest and rentals 125,772 125,772 $136,558 $136,558Charges for services $200,000 2,035,408 1,835,408 1,021,992 1,021,992Other
Total Revenues 200,000 2,297,395 2,097,395 1,158,550 1,158,550
EXPENDITURES
Current:
City Council
Economic and community development
Public works 2,745 2,745
Non-departmental
FirePolice
Other
Capital outlayDebt service:
Principal repaymentsInterest and fiscal charges
Total Expenditures 2,745 2,745
EXCESS (DEFICIENCY) OF REVENUES
OVER (UNDER) EXPENDITURES 197,255 2,294,650 2,097,395 1,158,550 1,158,550
OTHER FINANCING SOURCES (USES)
Transfers in
Transfers out (10,263,243) (6,468,460) 3,794,783 ($64,520) (1,000,000) (935,480)
Total Other Financing Sources (Uses) (10,263,243) (6,468,460) 3,794,783 (64,520) (1,000,000) (935,480)
NET CHANGE IN FUND BALANCES ($10,065,988) (4,173,810) $5,892,178 ($64,520) 158,550 $223,070
Adjustment to budgetary basis: Encumbrance adjustments
Fund balance - July 1 12,323,557 2,116,515
Fund balance - June 30 $8,149,747 $2,275,065
PARKCONSTRUCTION FEE
136
INTERNAL SERVICE FUNDS
Internal service funds account for department services and financing performed for other departments within the same governmental jurisdiction. Funding comes from charges assessed to the departments benefiting from the service. Internal service funds used at the City include:
City Service – Accounts for vehicle maintenance and information technology services provided to City departments.
Self Insurance – Accounts for workers' compensation, general liability and property damage claim activity and financing is represented in this fund.
Health and Retirement Benefits – Accounts for health and retirement benefits paid on the behalf of eligible City employees.
Equipment Replacement – Accounts for resources set-aside for the future replacement of City vehicles and equipment.
137
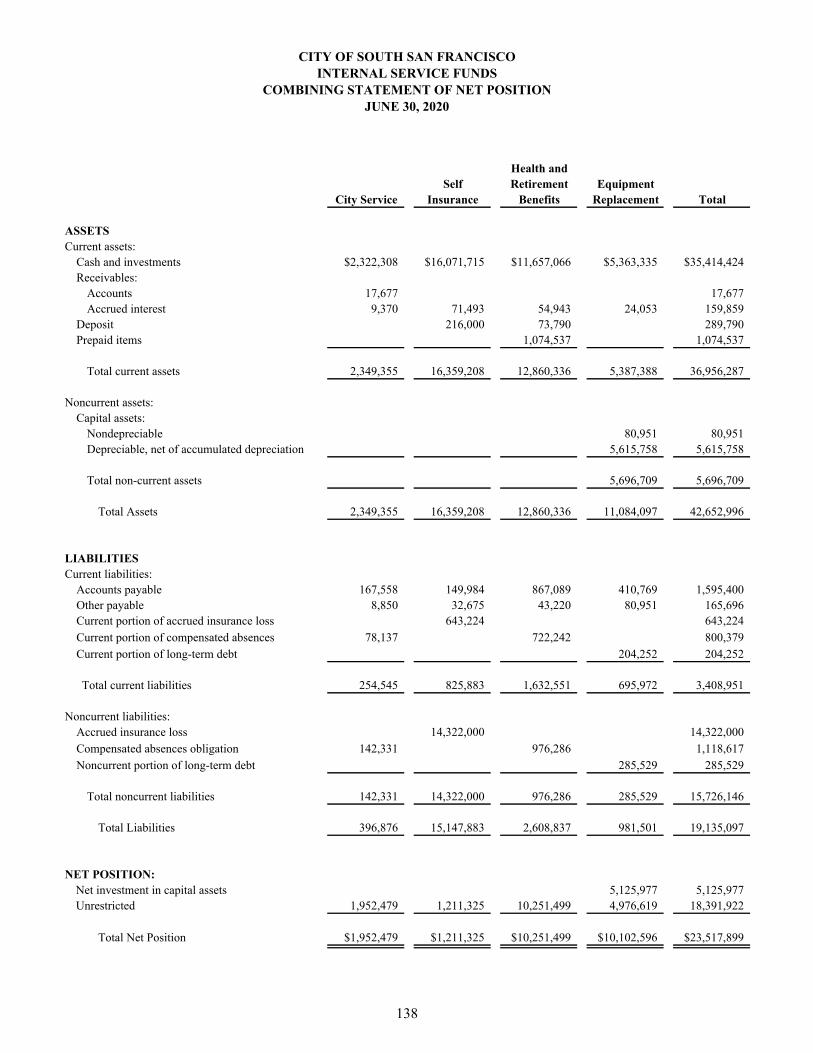
CITY OF SOUTH SAN FRANCISCOINTERNAL SERVICE FUNDS
COMBINING STATEMENT OF NET POSITIONJUNE 30, 2020
Health andSelf Retirement Equipment
City Service Insurance Benefits Replacement Total
ASSETSCurrent assets:
Cash and investments $2,322,308 $16,071,715 $11,657,066 $5,363,335 $35,414,424Receivables:
Accounts 17,677 17,677Accrued interest 9,370 71,493 54,943 24,053 159,859
Deposit 216,000 73,790 289,790Prepaid items 1,074,537 1,074,537
Total current assets 2,349,355 16,359,208 12,860,336 5,387,388 36,956,287
Noncurrent assets:Capital assets:
Nondepreciable 80,951 80,951Depreciable, net of accumulated depreciation 5,615,758 5,615,758
Total non-current assets 5,696,709 5,696,709
Total Assets 2,349,355 16,359,208 12,860,336 11,084,097 42,652,996
LIABILITIESCurrent liabilities:
Accounts payable 167,558 149,984 867,089 410,769 1,595,400Other payable 8,850 32,675 43,220 80,951 165,696Current portion of accrued insurance loss 643,224 643,224
Current portion of compensated absences 78,137 722,242 800,379
Current portion of long-term debt 204,252 204,252
Total current liabilities 254,545 825,883 1,632,551 695,972 3,408,951
Noncurrent liabilities:Accrued insurance loss 14,322,000 14,322,000
Compensated absences obligation 142,331 976,286 1,118,617
Noncurrent portion of long-term debt 285,529 285,529
Total noncurrent liabilities 142,331 14,322,000 976,286 285,529 15,726,146
Total Liabilities 396,876 15,147,883 2,608,837 981,501 19,135,097
NET POSITION:Net investment in capital assets 5,125,977 5,125,977Unrestricted 1,952,479 1,211,325 10,251,499 4,976,619 18,391,922
Total Net Position $1,952,479 $1,211,325 $10,251,499 $10,102,596 $23,517,899
138
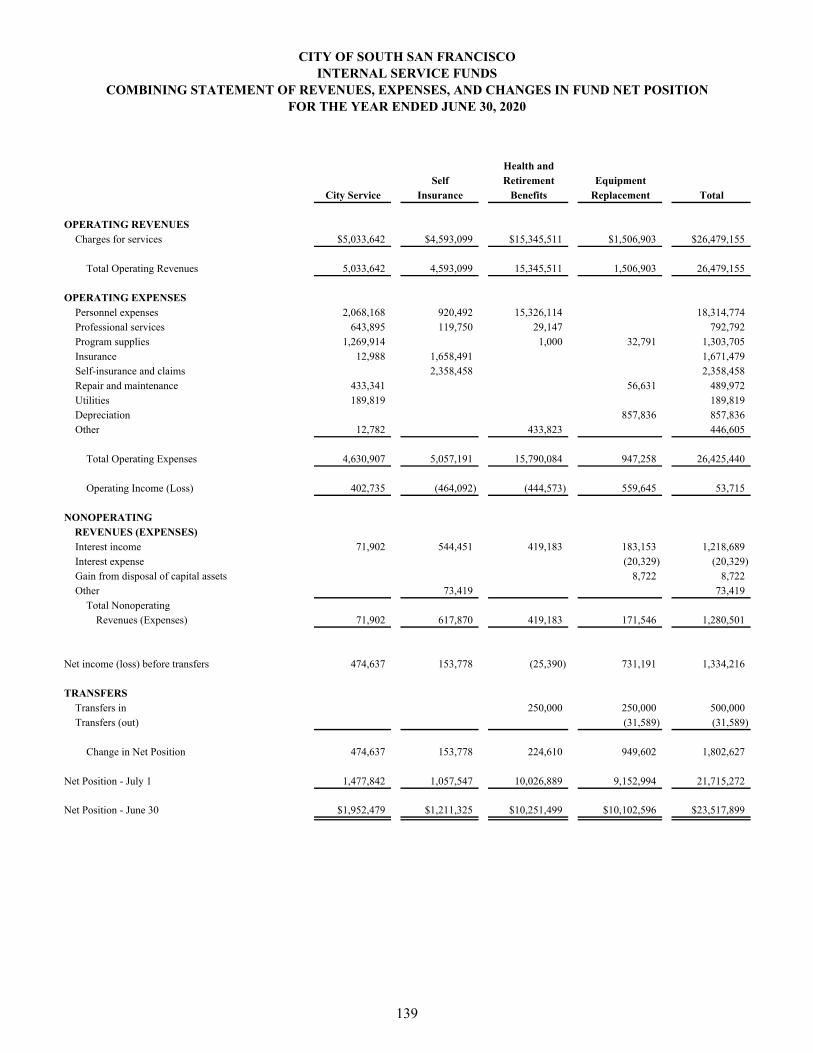
Health andSelf Retirement Equipment
City Service Insurance Benefits Replacement Total
OPERATING REVENUESCharges for services $5,033,642 $4,593,099 $15,345,511 $1,506,903 $26,479,155
Total Operating Revenues 5,033,642 4,593,099 15,345,511 1,506,903 26,479,155
OPERATING EXPENSESPersonnel expenses 2,068,168 920,492 15,326,114 18,314,774Professional services 643,895 119,750 29,147 792,792Program supplies 1,269,914 1,000 32,791 1,303,705Insurance 12,988 1,658,491 1,671,479Self-insurance and claims 2,358,458 2,358,458Repair and maintenance 433,341 56,631 489,972Utilities 189,819 189,819Depreciation 857,836 857,836Other 12,782 433,823 446,605
Total Operating Expenses 4,630,907 5,057,191 15,790,084 947,258 26,425,440
Operating Income (Loss) 402,735 (464,092) (444,573) 559,645 53,715
NONOPERATING REVENUES (EXPENSES)
Interest income 71,902 544,451 419,183 183,153 1,218,689Interest expense (20,329) (20,329)Gain from disposal of capital assets 8,722 8,722Other 73,419 73,419
Total Nonoperating Revenues (Expenses) 71,902 617,870 419,183 171,546 1,280,501
Net income (loss) before transfers 474,637 153,778 (25,390) 731,191 1,334,216
TRANSFERSTransfers in 250,000 250,000 500,000Transfers (out) (31,589) (31,589)
Change in Net Position 474,637 153,778 224,610 949,602 1,802,627
Net Position - July 1 1,477,842 1,057,547 10,026,889 9,152,994 21,715,272
Net Position - June 30 $1,952,479 $1,211,325 $10,251,499 $10,102,596 $23,517,899
INTERNAL SERVICE FUNDSCOMBINING STATEMENT OF REVENUES, EXPENSES, AND CHANGES IN FUND NET POSITION
FOR THE YEAR ENDED JUNE 30, 2020
CITY OF SOUTH SAN FRANCISCO
139
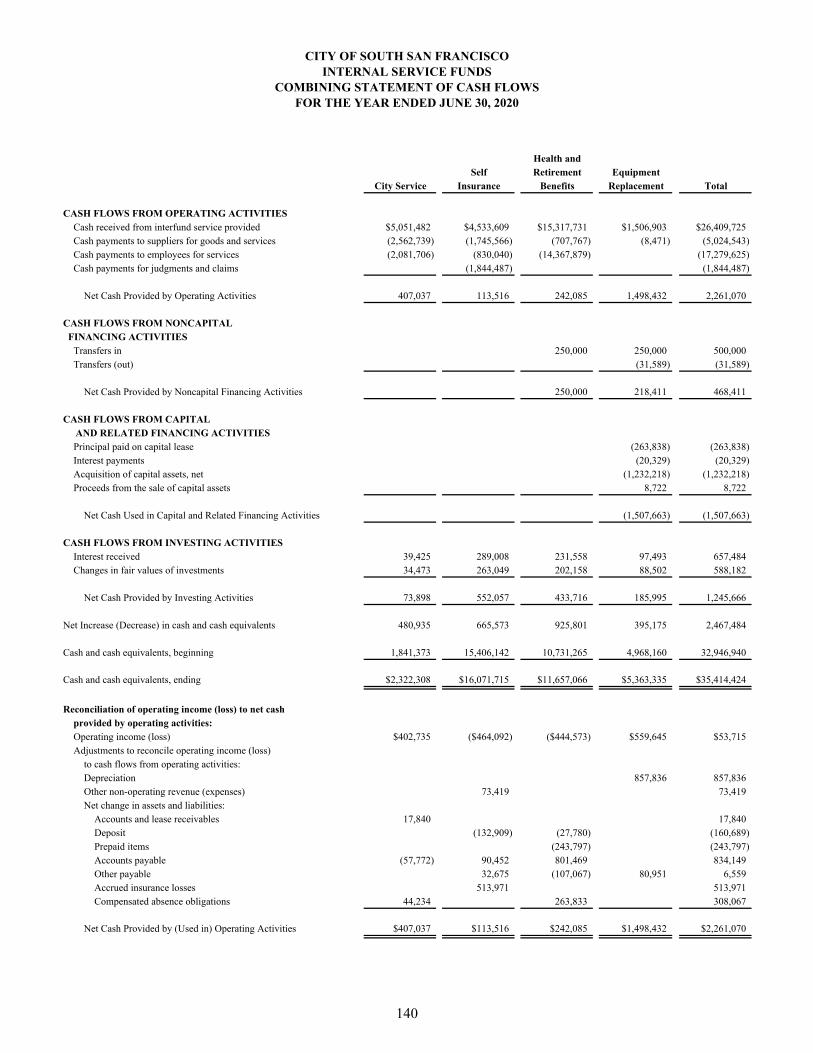
CITY OF SOUTH SAN FRANCISCOINTERNAL SERVICE FUNDS
COMBINING STATEMENT OF CASH FLOWSFOR THE YEAR ENDED JUNE 30, 2020
Health and Self Retirement Equipment
City Service Insurance Benefits Replacement Total
CASH FLOWS FROM OPERATING ACTIVITIESCash received from interfund service provided $5,051,482 $4,533,609 $15,317,731 $1,506,903 $26,409,725Cash payments to suppliers for goods and services (2,562,739) (1,745,566) (707,767) (8,471) (5,024,543)Cash payments to employees for services (2,081,706) (830,040) (14,367,879) (17,279,625)Cash payments for judgments and claims (1,844,487) (1,844,487)
Net Cash Provided by Operating Activities 407,037 113,516 242,085 1,498,432 2,261,070
CASH FLOWS FROM NONCAPITAL FINANCING ACTIVITIES
Transfers in 250,000 250,000 500,000Transfers (out) (31,589) (31,589)
Net Cash Provided by Noncapital Financing Activities 250,000 218,411 468,411
CASH FLOWS FROM CAPITAL AND RELATED FINANCING ACTIVITIES
Principal paid on capital lease (263,838) (263,838)Interest payments (20,329) (20,329)Acquisition of capital assets, net (1,232,218) (1,232,218)Proceeds from the sale of capital assets 8,722 8,722
Net Cash Used in Capital and Related Financing Activities (1,507,663) (1,507,663)
CASH FLOWS FROM INVESTING ACTIVITIESInterest received 39,425 289,008 231,558 97,493 657,484Changes in fair values of investments 34,473 263,049 202,158 88,502 588,182
Net Cash Provided by Investing Activities 73,898 552,057 433,716 185,995 1,245,666
Net Increase (Decrease) in cash and cash equivalents 480,935 665,573 925,801 395,175 2,467,484
Cash and cash equivalents, beginning 1,841,373 15,406,142 10,731,265 4,968,160 32,946,940
Cash and cash equivalents, ending $2,322,308 $16,071,715 $11,657,066 $5,363,335 $35,414,424
Reconciliation of operating income (loss) to net cash provided by operating activities:Operating income (loss) $402,735 ($464,092) ($444,573) $559,645 $53,715Adjustments to reconcile operating income (loss)
to cash flows from operating activities:Depreciation 857,836 857,836Other non-operating revenue (expenses) 73,419 73,419Net change in assets and liabilities:
Accounts and lease receivables 17,840 17,840Deposit (132,909) (27,780) (160,689)Prepaid items (243,797) (243,797)Accounts payable (57,772) 90,452 801,469 834,149Other payable 32,675 (107,067) 80,951 6,559Accrued insurance losses 513,971 513,971Compensated absence obligations 44,234 263,833 308,067
Net Cash Provided by (Used in) Operating Activities $407,037 $113,516 $242,085 $1,498,432 $2,261,070
140
AGENCY FUND
An agency fund is used to account for monies where the City is acting as an agent for another government entity. The agency fund used at the City of South San Francisco consisted of:
SSF Employee Deferred Comp Trust Oversight – This fund is used to pay for the administrative costs of monitoring the Deferred Compensation Funds on behalf of City employees.
141
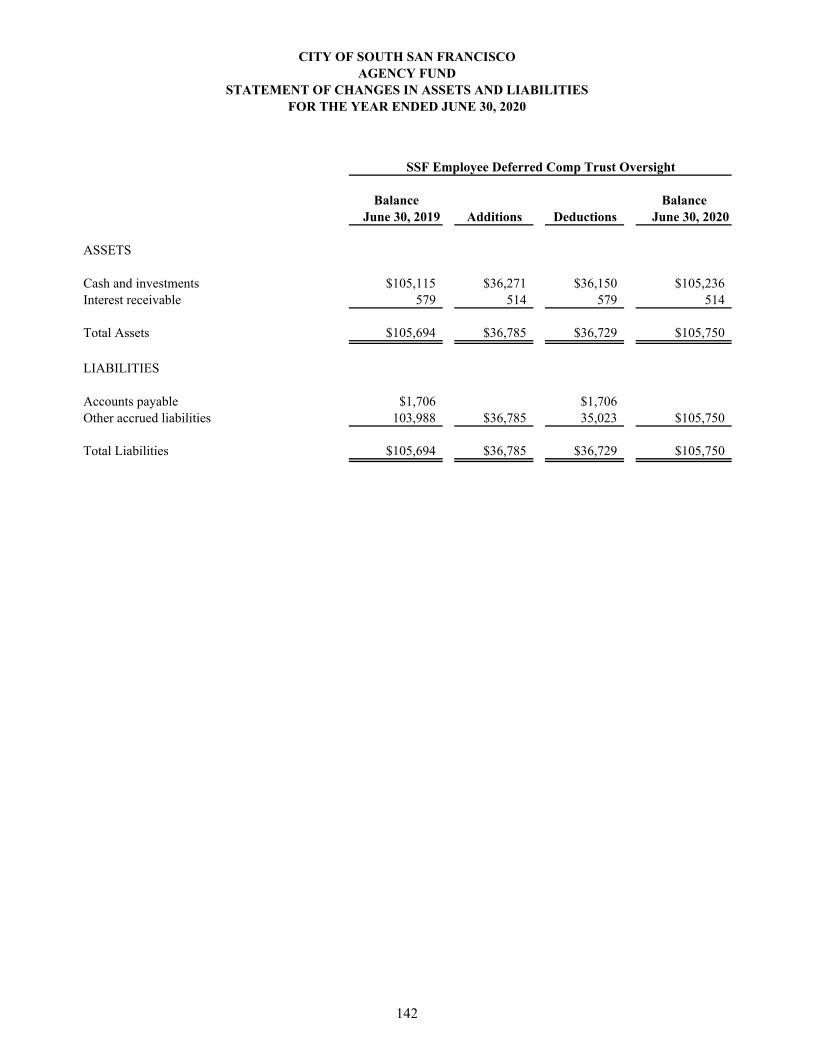
CITY OF SOUTH SAN FRANCISCOAGENCY FUND
STATEMENT OF CHANGES IN ASSETS AND LIABILITIESFOR THE YEAR ENDED JUNE 30, 2020
Balance BalanceJune 30, 2019 Additions Deductions June 30, 2020
ASSETS
Cash and investments $105,115 $36,271 $36,150 $105,236Interest receivable 579 514 579 514
Total Assets $105,694 $36,785 $36,729 $105,750
LIABILITIES
Accounts payable $1,706 $1,706Other accrued liabilities 103,988 $36,785 35,023 $105,750
Total Liabilities $105,694 $36,785 $36,729 $105,750
SSF Employee Deferred Comp Trust Oversight
142
STATISTICAL SECTION
This part of the City’s Comprehensive Annual Financial Report presents detailed information as a context for understanding what the information in the financial statements, note disclosures, and required supplementary information says about the City’s overall financial health. In contrast to the financial section, the statistical section information is not subject to independent audit.
Financial Trends These schedules contain trend information to help the reader understand how the City’s financial performance and well being have changed over time:
1. Net Position by Component2. Changes in Net Position3. Fund Balances of Governmental Funds4. Changes in Fund Balance of Governmental Funds
Revenue Capacity These schedules contain information to help the reader assess the City’s most significant local revenue source, the property tax:
1. Assessed Value and Estimated Market Value of Taxable Property2. All Overlapping Property Tax Rates3. Principal Property Tax Payers4. Property Tax Levies and Collections
Debt Capacity These schedules present information to help the reader assess the affordability of the City’s current levels of outstanding debt and the City’s ability to issue additional debt in the future:
1. Ratio of Outstanding Debt by Type2. Computation of Direct and Overlapping Debt3. Computation of Legal Bonded Debt Margin4. Continuing Disclosure Requirements:
a. Revenue Bond Coverageb. Sewer Debt Service Coveragec. Bonded Debt Pledge Revenue Coverage
Demographic and Economic Information These schedules offer demographic and economic indicators to help the reader understand the environment within which the City’s financial activities take place:
1. Demographic and Economic Statistics2. Principal Employers
Operating Information These schedules contain service and infrastructure data to help the reader understand how the information in the City’s financial report relates to the services the City provides and the activities it performs:
1. Full-Time City Government Employees by Function2. Operating Indicators by Function/Program3. Capital Asset Statistics by Function/Program
143
STATISTICAL SECTION - (Continued) Miscellaneous Information
1. Collection and Use of 1% Special Transient Occupancy Tax Sources Unless otherwise noted, the information in these schedules is derived from the Comprehensive Annual Financial Reports for the relevant year.
144
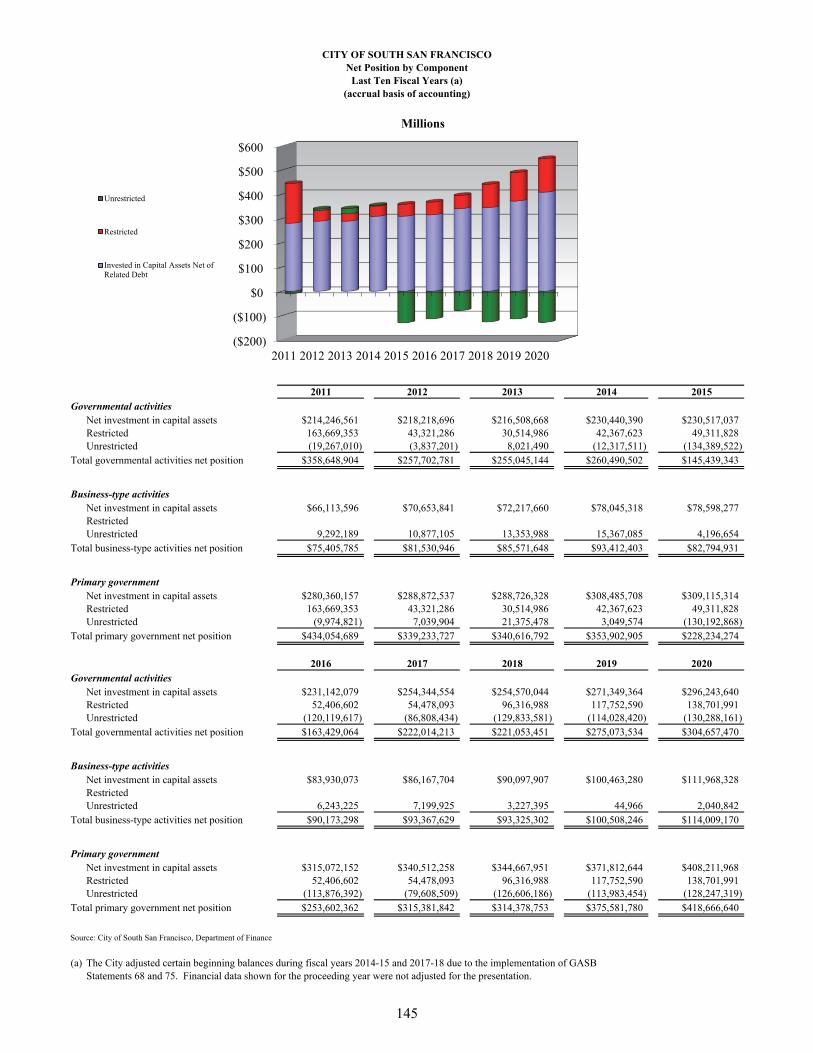
2011 2012 2013 2014 2015
Governmental activitiesNet investment in capital assets $214,246,561 $218,218,696 $216,508,668 $230,440,390 $230,517,037Restricted 163,669,353 43,321,286 30,514,986 42,367,623 49,311,828Unrestricted (19,267,010) (3,837,201) 8,021,490 (12,317,511) (134,389,522)
Total governmental activities net position $358,648,904 $257,702,781 $255,045,144 $260,490,502 $145,439,343
Business-type activitiesNet investment in capital assets $66,113,596 $70,653,841 $72,217,660 $78,045,318 $78,598,277RestrictedUnrestricted 9,292,189 10,877,105 13,353,988 15,367,085 4,196,654
Total business-type activities net position $75,405,785 $81,530,946 $85,571,648 $93,412,403 $82,794,931
Primary governmentNet investment in capital assets $280,360,157 $288,872,537 $288,726,328 $308,485,708 $309,115,314Restricted 163,669,353 43,321,286 30,514,986 42,367,623 49,311,828Unrestricted (9,974,821) 7,039,904 21,375,478 3,049,574 (130,192,868)
Total primary government net position $434,054,689 $339,233,727 $340,616,792 $353,902,905 $228,234,274
2016 2017 2018 2019 2020
Governmental activitiesNet investment in capital assets $231,142,079 $254,344,554 $254,570,044 $271,349,364 $296,243,640Restricted 52,406,602 54,478,093 96,316,988 117,752,590 138,701,991Unrestricted (120,119,617) (86,808,434) (129,833,581) (114,028,420) (130,288,161)
Total governmental activities net position $163,429,064 $222,014,213 $221,053,451 $275,073,534 $304,657,470
Business-type activitiesNet investment in capital assets $83,930,073 $86,167,704 $90,097,907 $100,463,280 $111,968,328RestrictedUnrestricted 6,243,225 7,199,925 3,227,395 44,966 2,040,842
Total business-type activities net position $90,173,298 $93,367,629 $93,325,302 $100,508,246 $114,009,170
Primary governmentNet investment in capital assets $315,072,152 $340,512,258 $344,667,951 $371,812,644 $408,211,968Restricted 52,406,602 54,478,093 96,316,988 117,752,590 138,701,991Unrestricted (113,876,392) (79,608,509) (126,606,186) (113,983,454) (128,247,319)
Total primary government net position $253,602,362 $315,381,842 $314,378,753 $375,581,780 $418,666,640
Source: City of South San Francisco, Department of Finance
(a) The City adjusted certain beginning balances during fiscal years 2014-15 and 2017-18 due to the implementation of GASB Statements 68 and 75. Financial data shown for the proceeding year were not adjusted for the presentation.
CITY OF SOUTH SAN FRANCISCO
(accrual basis of accounting)Last Ten Fiscal Years (a)
Net Position by Component
($200)
($100)
$0
$100
$200
$300
$400
$500
$600
2011 2012 2013 2014 2015 2016 2017 2018 2019 2020
Millions
Unrestricted
Restricted
Invested in Capital Assets Net ofRelated Debt
145
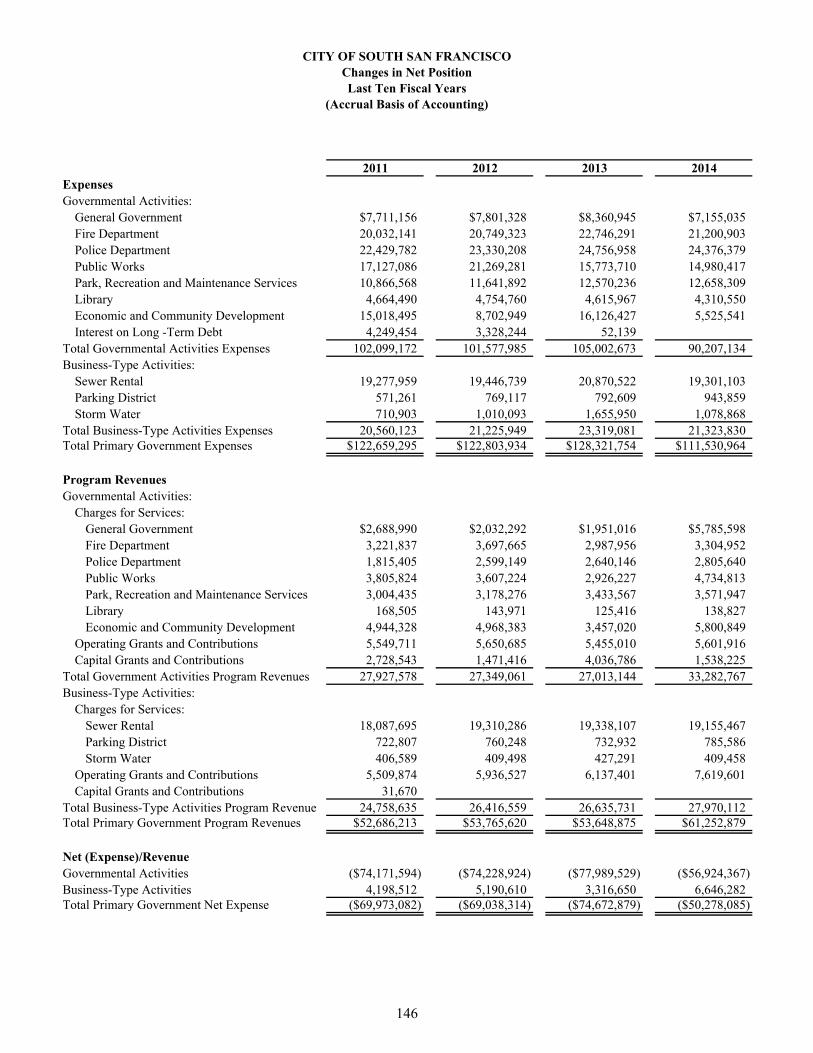
CITY OF SOUTH SAN FRANCISCOChanges in Net PositionLast Ten Fiscal Years
(Accrual Basis of Accounting)
2011 2012 2013 2014ExpensesGovernmental Activities:
General Government $7,711,156 $7,801,328 $8,360,945 $7,155,035Fire Department 20,032,141 20,749,323 22,746,291 21,200,903Police Department 22,429,782 23,330,208 24,756,958 24,376,379Public Works 17,127,086 21,269,281 15,773,710 14,980,417Park, Recreation and Maintenance Services 10,866,568 11,641,892 12,570,236 12,658,309Library 4,664,490 4,754,760 4,615,967 4,310,550Economic and Community Development 15,018,495 8,702,949 16,126,427 5,525,541Interest on Long -Term Debt 4,249,454 3,328,244 52,139
Total Governmental Activities Expenses 102,099,172 101,577,985 105,002,673 90,207,134Business-Type Activities:
Sewer Rental 19,277,959 19,446,739 20,870,522 19,301,103Parking District 571,261 769,117 792,609 943,859Storm Water 710,903 1,010,093 1,655,950 1,078,868
Total Business-Type Activities Expenses 20,560,123 21,225,949 23,319,081 21,323,830Total Primary Government Expenses $122,659,295 $122,803,934 $128,321,754 $111,530,964
Program RevenuesGovernmental Activities:
Charges for Services:General Government $2,688,990 $2,032,292 $1,951,016 $5,785,598Fire Department 3,221,837 3,697,665 2,987,956 3,304,952Police Department 1,815,405 2,599,149 2,640,146 2,805,640Public Works 3,805,824 3,607,224 2,926,227 4,734,813Park, Recreation and Maintenance Services 3,004,435 3,178,276 3,433,567 3,571,947Library 168,505 143,971 125,416 138,827Economic and Community Development 4,944,328 4,968,383 3,457,020 5,800,849
Operating Grants and Contributions 5,549,711 5,650,685 5,455,010 5,601,916Capital Grants and Contributions 2,728,543 1,471,416 4,036,786 1,538,225
Total Government Activities Program Revenues 27,927,578 27,349,061 27,013,144 33,282,767Business-Type Activities:
Charges for Services:Sewer Rental 18,087,695 19,310,286 19,338,107 19,155,467Parking District 722,807 760,248 732,932 785,586Storm Water 406,589 409,498 427,291 409,458
Operating Grants and Contributions 5,509,874 5,936,527 6,137,401 7,619,601Capital Grants and Contributions 31,670
Total Business-Type Activities Program Revenue 24,758,635 26,416,559 26,635,731 27,970,112Total Primary Government Program Revenues $52,686,213 $53,765,620 $53,648,875 $61,252,879
Net (Expense)/RevenueGovernmental Activities ($74,171,594) ($74,228,924) ($77,989,529) ($56,924,367)Business-Type Activities 4,198,512 5,190,610 3,316,650 6,646,282Total Primary Government Net Expense ($69,973,082) ($69,038,314) ($74,672,879) ($50,278,085)
146
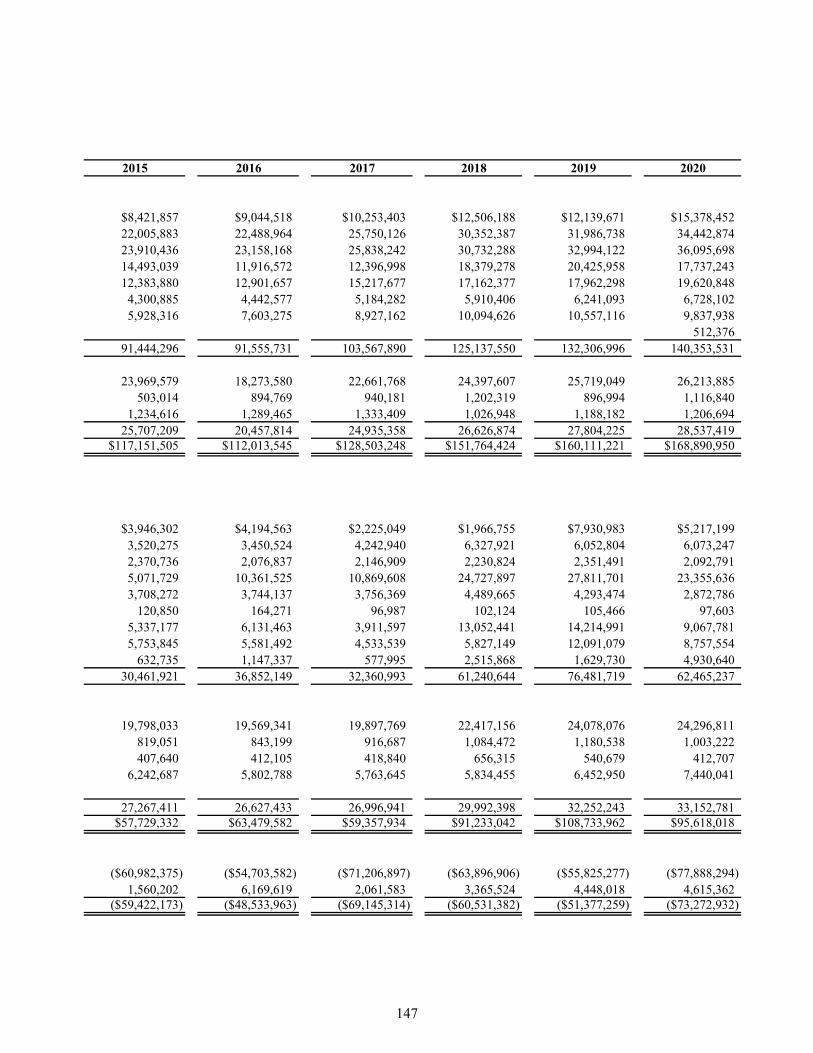
2015 2016 2017 2018 2019 2020
$8,421,857 $9,044,518 $10,253,403 $12,506,188 $12,139,671 $15,378,45222,005,883 22,488,964 25,750,126 30,352,387 31,986,738 34,442,87423,910,436 23,158,168 25,838,242 30,732,288 32,994,122 36,095,69814,493,039 11,916,572 12,396,998 18,379,278 20,425,958 17,737,24312,383,880 12,901,657 15,217,677 17,162,377 17,962,298 19,620,848
4,300,885 4,442,577 5,184,282 5,910,406 6,241,093 6,728,1025,928,316 7,603,275 8,927,162 10,094,626 10,557,116 9,837,938
512,37691,444,296 91,555,731 103,567,890 125,137,550 132,306,996 140,353,531
23,969,579 18,273,580 22,661,768 24,397,607 25,719,049 26,213,885503,014 894,769 940,181 1,202,319 896,994 1,116,840
1,234,616 1,289,465 1,333,409 1,026,948 1,188,182 1,206,69425,707,209 20,457,814 24,935,358 26,626,874 27,804,225 28,537,419
$117,151,505 $112,013,545 $128,503,248 $151,764,424 $160,111,221 $168,890,950
$3,946,302 $4,194,563 $2,225,049 $1,966,755 $7,930,983 $5,217,1993,520,275 3,450,524 4,242,940 6,327,921 6,052,804 6,073,2472,370,736 2,076,837 2,146,909 2,230,824 2,351,491 2,092,7915,071,729 10,361,525 10,869,608 24,727,897 27,811,701 23,355,6363,708,272 3,744,137 3,756,369 4,489,665 4,293,474 2,872,786
120,850 164,271 96,987 102,124 105,466 97,6035,337,177 6,131,463 3,911,597 13,052,441 14,214,991 9,067,7815,753,845 5,581,492 4,533,539 5,827,149 12,091,079 8,757,554
632,735 1,147,337 577,995 2,515,868 1,629,730 4,930,64030,461,921 36,852,149 32,360,993 61,240,644 76,481,719 62,465,237
19,798,033 19,569,341 19,897,769 22,417,156 24,078,076 24,296,811819,051 843,199 916,687 1,084,472 1,180,538 1,003,222407,640 412,105 418,840 656,315 540,679 412,707
6,242,687 5,802,788 5,763,645 5,834,455 6,452,950 7,440,041
27,267,411 26,627,433 26,996,941 29,992,398 32,252,243 33,152,781$57,729,332 $63,479,582 $59,357,934 $91,233,042 $108,733,962 $95,618,018
($60,982,375) ($54,703,582) ($71,206,897) ($63,896,906) ($55,825,277) ($77,888,294)1,560,202 6,169,619 2,061,583 3,365,524 4,448,018 4,615,362
($59,422,173) ($48,533,963) ($69,145,314) ($60,531,382) ($51,377,259) ($73,272,932)
147
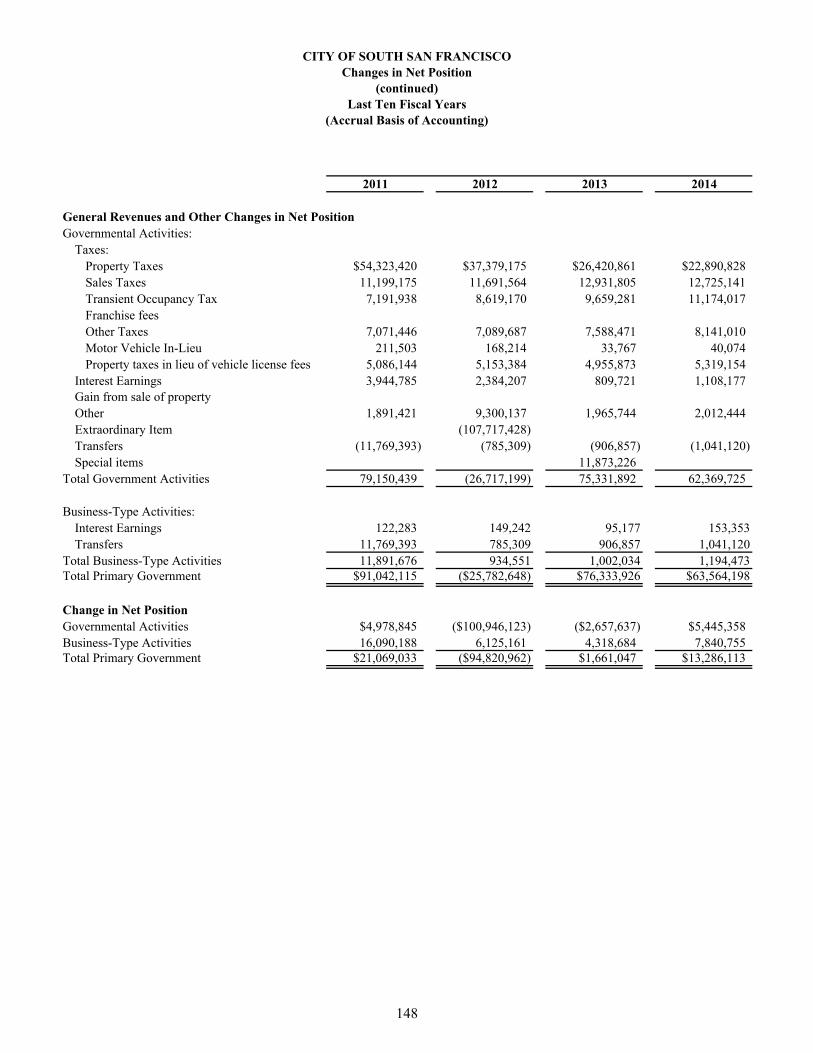
CITY OF SOUTH SAN FRANCISCOChanges in Net Position
(continued)Last Ten Fiscal Years
(Accrual Basis of Accounting)
2011 2012 2013 2014
General Revenues and Other Changes in Net PositionGovernmental Activities:
Taxes:Property Taxes $54,323,420 $37,379,175 $26,420,861 $22,890,828Sales Taxes 11,199,175 11,691,564 12,931,805 12,725,141Transient Occupancy Tax 7,191,938 8,619,170 9,659,281 11,174,017Franchise feesOther Taxes 7,071,446 7,089,687 7,588,471 8,141,010Motor Vehicle In-Lieu 211,503 168,214 33,767 40,074Property taxes in lieu of vehicle license fees 5,086,144 5,153,384 4,955,873 5,319,154
Interest Earnings 3,944,785 2,384,207 809,721 1,108,177Gain from sale of propertyOther 1,891,421 9,300,137 1,965,744 2,012,444Extraordinary Item (107,717,428)Transfers (11,769,393) (785,309) (906,857) (1,041,120)Special items 11,873,226
Total Government Activities 79,150,439 (26,717,199) 75,331,892 62,369,725
Business-Type Activities:Interest Earnings 122,283 149,242 95,177 153,353Transfers 11,769,393 785,309 906,857 1,041,120
Total Business-Type Activities 11,891,676 934,551 1,002,034 1,194,473Total Primary Government $91,042,115 ($25,782,648) $76,333,926 $63,564,198
Change in Net PositionGovernmental Activities $4,978,845 ($100,946,123) ($2,657,637) $5,445,358Business-Type Activities 16,090,188 6,125,161 4,318,684 7,840,755Total Primary Government $21,069,033 ($94,820,962) $1,661,047 $13,286,113
148
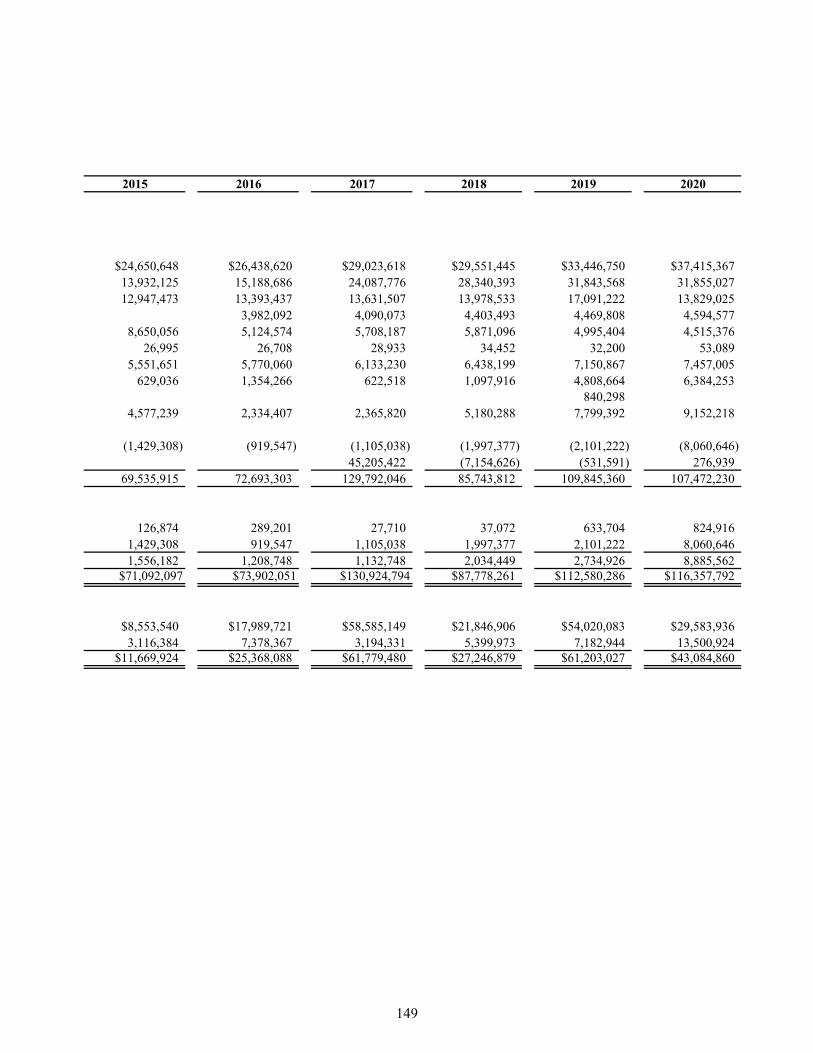
2015 2016 2017 2018 2019 2020
$24,650,648 $26,438,620 $29,023,618 $29,551,445 $33,446,750 $37,415,36713,932,125 15,188,686 24,087,776 28,340,393 31,843,568 31,855,02712,947,473 13,393,437 13,631,507 13,978,533 17,091,222 13,829,025
3,982,092 4,090,073 4,403,493 4,469,808 4,594,5778,650,056 5,124,574 5,708,187 5,871,096 4,995,404 4,515,376
26,995 26,708 28,933 34,452 32,200 53,0895,551,651 5,770,060 6,133,230 6,438,199 7,150,867 7,457,005
629,036 1,354,266 622,518 1,097,916 4,808,664 6,384,253840,298
4,577,239 2,334,407 2,365,820 5,180,288 7,799,392 9,152,218
(1,429,308) (919,547) (1,105,038) (1,997,377) (2,101,222) (8,060,646)45,205,422 (7,154,626) (531,591) 276,939
69,535,915 72,693,303 129,792,046 85,743,812 109,845,360 107,472,230
126,874 289,201 27,710 37,072 633,704 824,9161,429,308 919,547 1,105,038 1,997,377 2,101,222 8,060,6461,556,182 1,208,748 1,132,748 2,034,449 2,734,926 8,885,562
$71,092,097 $73,902,051 $130,924,794 $87,778,261 $112,580,286 $116,357,792
$8,553,540 $17,989,721 $58,585,149 $21,846,906 $54,020,083 $29,583,9363,116,384 7,378,367 3,194,331 5,399,973 7,182,944 13,500,924
$11,669,924 $25,368,088 $61,779,480 $27,246,879 $61,203,027 $43,084,860
149
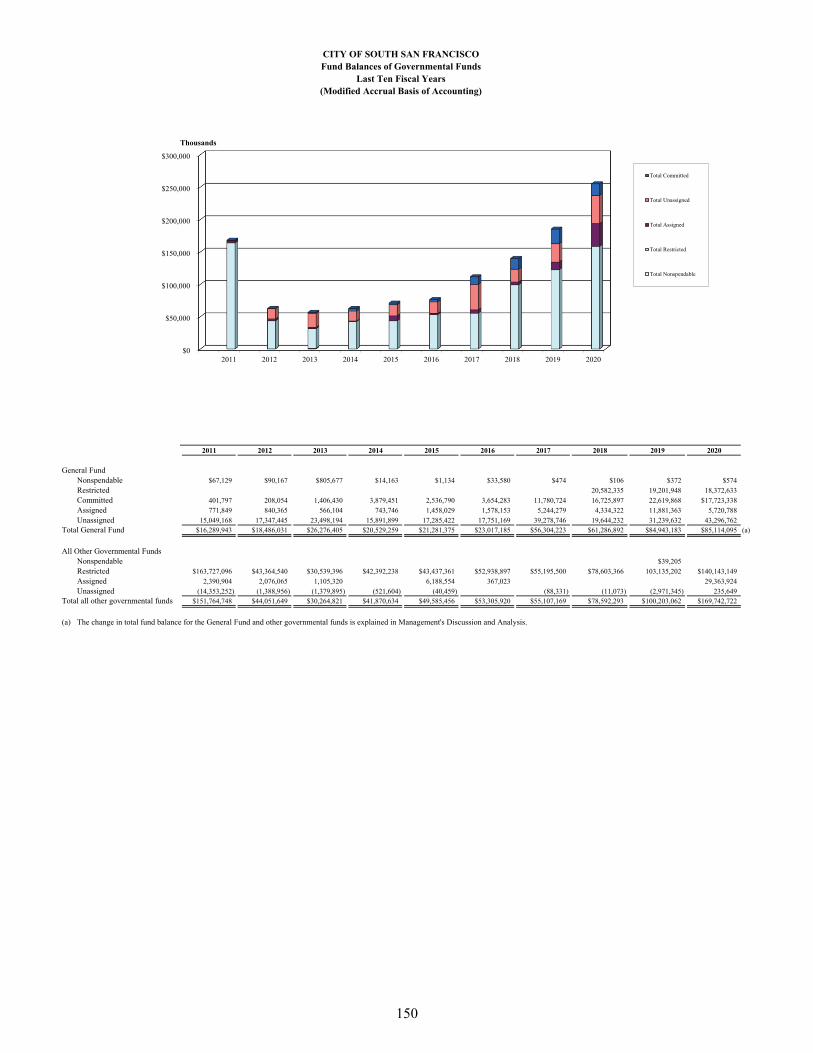
CITY OF SOUTH SAN FRANCISCOFund Balances of Governmental Funds
Last Ten Fiscal Years(Modified Accrual Basis of Accounting)
2011 2012 2013 2014 2015 2016 2017 2018 2019 2020
General FundNonspendable $67,129 $90,167 $805,677 $14,163 $1,134 $33,580 $474 $106 $372 $574
Restricted 20,582,335 19,201,948 18,372,633
Committed 401,797 208,054 1,406,430 3,879,451 2,536,790 3,654,283 11,780,724 16,725,897 22,619,868 $17,723,338
Assigned 771,849 840,365 566,104 743,746 1,458,029 1,578,153 5,244,279 4,334,322 11,881,363 5,720,788
Unassigned 15,049,168 17,347,445 23,498,194 15,891,899 17,285,422 17,751,169 39,278,746 19,644,232 31,239,632 43,296,762Total General Fund $16,289,943 $18,486,031 $26,276,405 $20,529,259 $21,281,375 $23,017,185 $56,304,223 $61,286,892 $84,943,183 $85,114,095 (a)
All Other Governmental FundsNonspendable $39,205
Restricted $163,727,096 $43,364,540 $30,539,396 $42,392,238 $43,437,361 $52,938,897 $55,195,500 $78,603,366 103,135,202 $140,143,149
Assigned 2,390,904 2,076,065 1,105,320 6,188,554 367,023 29,363,924
Unassigned (14,353,252) (1,388,956) (1,379,895) (521,604) (40,459) (88,331) (11,073) (2,971,345) 235,649Total all other governmental funds $151,764,748 $44,051,649 $30,264,821 $41,870,634 $49,585,456 $53,305,920 $55,107,169 $78,592,293 $100,203,062 $169,742,722
#REF! #REF! 168,054,691 62,537,680 56,541,226 56,541,226 62,399,893 111,411,392 254,856,817
(a) The change in total fund balance for the General Fund and other governmental funds is explained in Management's Discussion and Analysis.
$0
$50,000
$100,000
$150,000
$200,000
$250,000
$300,000
2011 2012 2013 2014 2015 2016 2017 2018 2019 2020
Thousands
Total Committed
Total Unassigned
Total Assigned
Total Restricted
Total Nonspendable
150

This Page Left Intentionally Blank
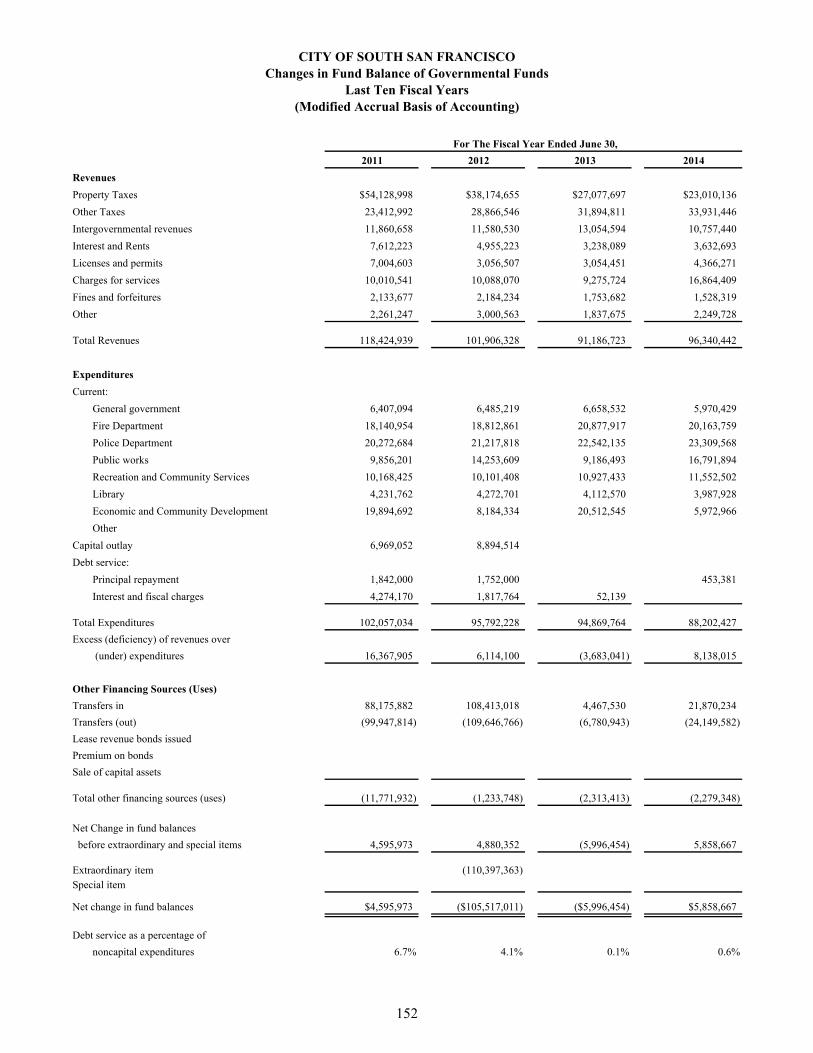
CITY OF SOUTH SAN FRANCISCOChanges in Fund Balance of Governmental Funds
Last Ten Fiscal Years(Modified Accrual Basis of Accounting)
2011 2012 2013 2014
Revenues
Property Taxes $54,128,998 $38,174,655 $27,077,697 $23,010,136
Other Taxes 23,412,992 28,866,546 31,894,811 33,931,446
Intergovernmental revenues 11,860,658 11,580,530 13,054,594 10,757,440
Interest and Rents 7,612,223 4,955,223 3,238,089 3,632,693
Licenses and permits 7,004,603 3,056,507 3,054,451 4,366,271
Charges for services 10,010,541 10,088,070 9,275,724 16,864,409
Fines and forfeitures 2,133,677 2,184,234 1,753,682 1,528,319
Other 2,261,247 3,000,563 1,837,675 2,249,728
Total Revenues 118,424,939 101,906,328 91,186,723 96,340,442
Expenditures
Current:
General government 6,407,094 6,485,219 6,658,532 5,970,429
Fire Department 18,140,954 18,812,861 20,877,917 20,163,759
Police Department 20,272,684 21,217,818 22,542,135 23,309,568
Public works 9,856,201 14,253,609 9,186,493 16,791,894
Recreation and Community Services 10,168,425 10,101,408 10,927,433 11,552,502
Library 4,231,762 4,272,701 4,112,570 3,987,928
Economic and Community Development 19,894,692 8,184,334 20,512,545 5,972,966
Other
Capital outlay 6,969,052 8,894,514
Debt service:
Principal repayment 1,842,000 1,752,000 453,381
Interest and fiscal charges 4,274,170 1,817,764 52,139
Total Expenditures 102,057,034 95,792,228 94,869,764 88,202,427
Excess (deficiency) of revenues over
(under) expenditures 16,367,905 6,114,100 (3,683,041) 8,138,015
Other Financing Sources (Uses)
Transfers in 88,175,882 108,413,018 4,467,530 21,870,234
Transfers (out) (99,947,814) (109,646,766) (6,780,943) (24,149,582)
Lease revenue bonds issued
Premium on bonds
Sale of capital assets
Total other financing sources (uses) (11,771,932) (1,233,748) (2,313,413) (2,279,348)
Net Change in fund balances
before extraordinary and special items 4,595,973 4,880,352 (5,996,454) 5,858,667
Extraordinary item (110,397,363)Special item
Net change in fund balances $4,595,973 ($105,517,011) ($5,996,454) $5,858,667
Debt service as a percentage of
noncapital expenditures 6.7% 4.1% 0.1% 0.6%
For The Fiscal Year Ended June 30,
152
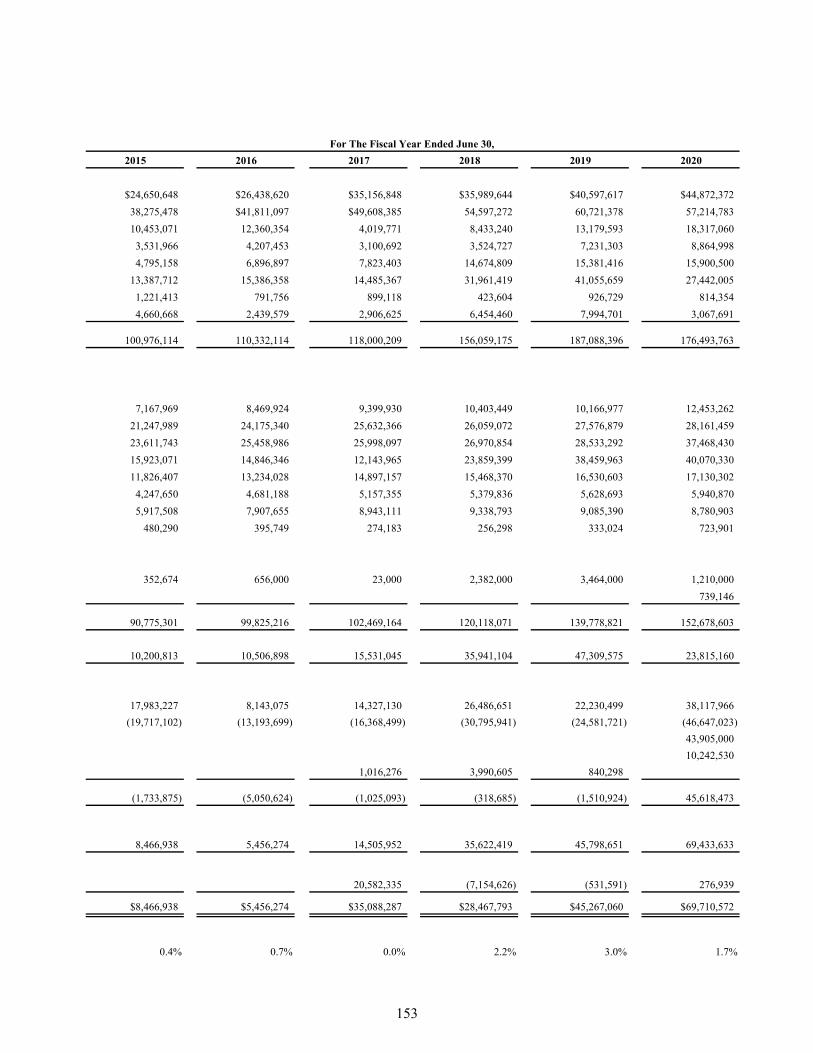
2015 2016 2017 2018 2019 2020
$24,650,648 $26,438,620 $35,156,848 $35,989,644 $40,597,617 $44,872,372
38,275,478 $41,811,097 $49,608,385 54,597,272 60,721,378 57,214,783
10,453,071 12,360,354 4,019,771 8,433,240 13,179,593 18,317,060
3,531,966 4,207,453 3,100,692 3,524,727 7,231,303 8,864,998
4,795,158 6,896,897 7,823,403 14,674,809 15,381,416 15,900,500
13,387,712 15,386,358 14,485,367 31,961,419 41,055,659 27,442,005
1,221,413 791,756 899,118 423,604 926,729 814,354
4,660,668 2,439,579 2,906,625 6,454,460 7,994,701 3,067,691
100,976,114 110,332,114 118,000,209 156,059,175 187,088,396 176,493,763
7,167,969 8,469,924 9,399,930 10,403,449 10,166,977 12,453,262
21,247,989 24,175,340 25,632,366 26,059,072 27,576,879 28,161,459
23,611,743 25,458,986 25,998,097 26,970,854 28,533,292 37,468,430
15,923,071 14,846,346 12,143,965 23,859,399 38,459,963 40,070,330
11,826,407 13,234,028 14,897,157 15,468,370 16,530,603 17,130,302
4,247,650 4,681,188 5,157,355 5,379,836 5,628,693 5,940,870
5,917,508 7,907,655 8,943,111 9,338,793 9,085,390 8,780,903
480,290 395,749 274,183 256,298 333,024 723,901
352,674 656,000 23,000 2,382,000 3,464,000 1,210,000
739,146
90,775,301 99,825,216 102,469,164 120,118,071 139,778,821 152,678,603
10,200,813 10,506,898 15,531,045 35,941,104 47,309,575 23,815,160
17,983,227 8,143,075 14,327,130 26,486,651 22,230,499 38,117,966
(19,717,102) (13,193,699) (16,368,499) (30,795,941) (24,581,721) (46,647,023)
43,905,000
10,242,530
1,016,276 3,990,605 840,298
(1,733,875) (5,050,624) (1,025,093) (318,685) (1,510,924) 45,618,473
8,466,938 5,456,274 14,505,952 35,622,419 45,798,651 69,433,633
20,582,335 (7,154,626) (531,591) 276,939
$8,466,938 $5,456,274 $35,088,287 $28,467,793 $45,267,060 $69,710,572
0.4% 0.7% 0.0% 2.2% 3.0% 1.7%
For The Fiscal Year Ended June 30,
153
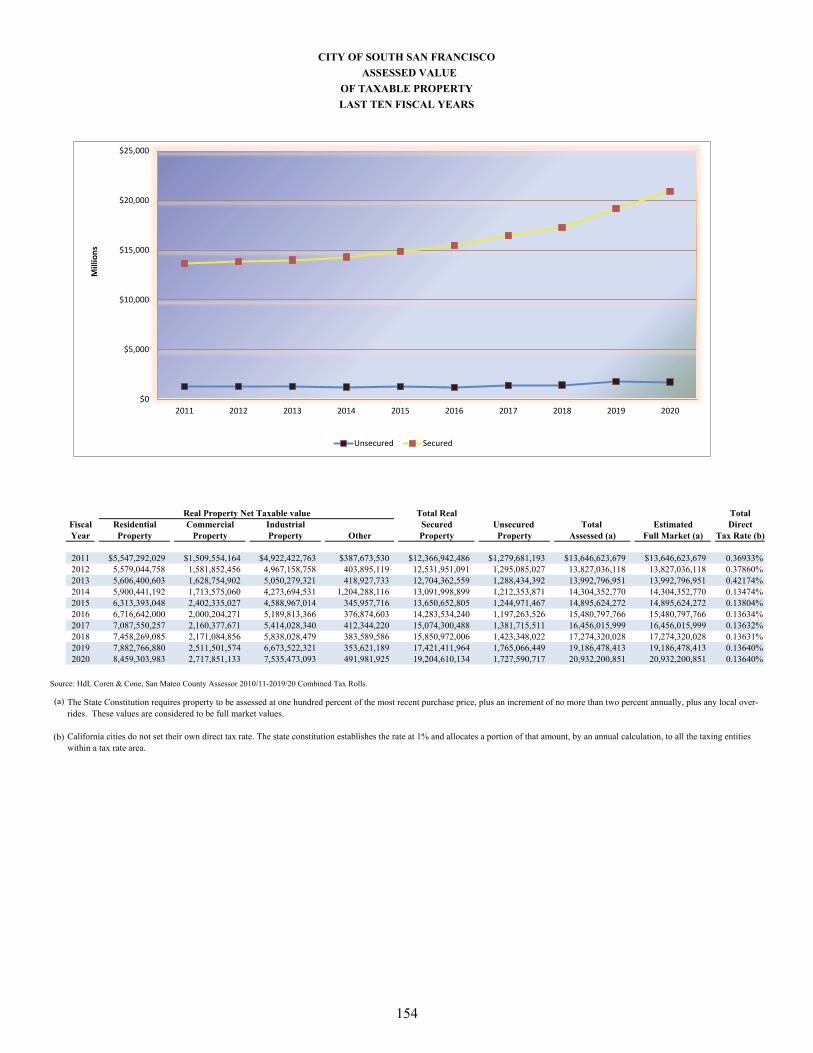
Real Property Net Taxable value Total Real TotalFiscal Residential Commercial Industrial Secured Unsecured Total Estimated DirectYear Property Property Property Other Property Property Assessed (a) Full Market (a) Tax Rate (b)
2011 $5,547,292,029 $1,509,554,164 $4,922,422,763 $387,673,530 $12,366,942,486 $1,279,681,193 $13,646,623,679 $13,646,623,679 0.36933%2012 5,579,044,758 1,581,852,456 4,967,158,758 403,895,119 12,531,951,091 1,295,085,027 13,827,036,118 13,827,036,118 0.37860%2013 5,606,400,603 1,628,754,902 5,050,279,321 418,927,733 12,704,362,559 1,288,434,392 13,992,796,951 13,992,796,951 0.42174%2014 5,900,441,192 1,713,575,060 4,273,694,531 1,204,288,116 13,091,998,899 1,212,353,871 14,304,352,770 14,304,352,770 0.13474%2015 6,313,393,048 2,402,335,027 4,588,967,014 345,957,716 13,650,652,805 1,244,971,467 14,895,624,272 14,895,624,272 0.13804%2016 6,716,642,000 2,000,204,271 5,189,813,366 376,874,603 14,283,534,240 1,197,263,526 15,480,797,766 15,480,797,766 0.13634%2017 7,087,550,257 2,160,377,671 5,414,028,340 412,344,220 15,074,300,488 1,381,715,511 16,456,015,999 16,456,015,999 0.13632%2018 7,458,269,085 2,171,084,856 5,838,028,479 383,589,586 15,850,972,006 1,423,348,022 17,274,320,028 17,274,320,028 0.13631%2019 7,882,766,880 2,511,501,574 6,673,522,321 353,621,189 17,421,411,964 1,765,066,449 19,186,478,413 19,186,478,413 0.13640%2020 8,459,303,983 2,717,851,133 7,535,473,093 491,981,925 19,204,610,134 1,727,590,717 20,932,200,851 20,932,200,851 0.13640%
Source: HdL Coren & Cone, San Mateo County Assessor 2010/11-2019/20 Combined Tax Rolls.
(a)
(b)
CITY OF SOUTH SAN FRANCISCO
The State Constitution requires property to be assessed at one hundred percent of the most recent purchase price, plus an increment of no more than two percent annually, plus any local over-rides. These values are considered to be full market values.
California cities do not set their own direct tax rate. The state constitution establishes the rate at 1% and allocates a portion of that amount, by an annual calculation, to all the taxing entities within a tax rate area.
ASSESSED VALUE
OF TAXABLE PROPERTY
LAST TEN FISCAL YEARS
$0
$5,000
$10,000
$15,000
$20,000
$25,000
2011 2012 2013 2014 2015 2016 2017 2018 2019 2020
Millions
Unsecured Secured
154
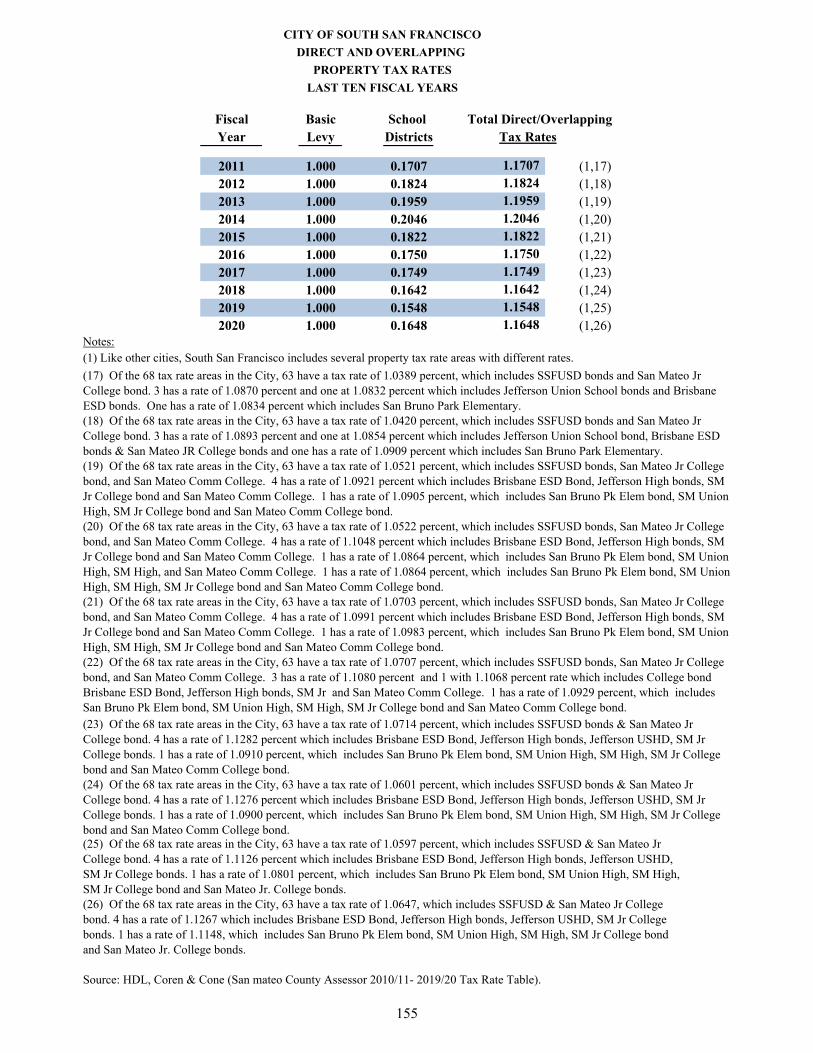
Fiscal Basic School Total Direct/OverlappingYear Levy Districts Tax Rates
2011 1.000 0.1707 1.1707 (1,17)2012 1.000 0.1824 1.1824 (1,18)2013 1.000 0.1959 1.1959 (1,19)2014 1.000 0.2046 1.2046 (1,20)2015 1.000 0.1822 1.1822 (1,21)2016 1.000 0.1750 1.1750 (1,22)2017 1.000 0.1749 1.1749 (1,23)2018 1.000 0.1642 1.1642 (1,24)2019 1.000 0.1548 1.1548 (1,25)2020 1.000 0.1648 1.1648 (1,26)
Notes:
Source: HDL, Coren & Cone (San mateo County Assessor 2010/11- 2019/20 Tax Rate Table).
(26) Of the 68 tax rate areas in the City, 63 have a tax rate of 1.0647, which includes SSFUSD & San Mateo Jr Collegebond. 4 has a rate of 1.1267 which includes Brisbane ESD Bond, Jefferson High bonds, Jefferson USHD, SM Jr Collegebonds. 1 has a rate of 1.1148, which includes San Bruno Pk Elem bond, SM Union High, SM High, SM Jr College bondand San Mateo Jr. College bonds.
CITY OF SOUTH SAN FRANCISCO
DIRECT AND OVERLAPPING
PROPERTY TAX RATES
LAST TEN FISCAL YEARS
(1) Like other cities, South San Francisco includes several property tax rate areas with different rates.
(23) Of the 68 tax rate areas in the City, 63 have a tax rate of 1.0714 percent, which includes SSFUSD bonds & San Mateo JrCollege bond. 4 has a rate of 1.1282 percent which includes Brisbane ESD Bond, Jefferson High bonds, Jefferson USHD, SM JrCollege bonds. 1 has a rate of 1.0910 percent, which includes San Bruno Pk Elem bond, SM Union High, SM High, SM Jr Collegebond and San Mateo Comm College bond.(24) Of the 68 tax rate areas in the City, 63 have a tax rate of 1.0601 percent, which includes SSFUSD bonds & San Mateo JrCollege bond. 4 has a rate of 1.1276 percent which includes Brisbane ESD Bond, Jefferson High bonds, Jefferson USHD, SM JrCollege bonds. 1 has a rate of 1.0900 percent, which includes San Bruno Pk Elem bond, SM Union High, SM High, SM Jr Collegebond and San Mateo Comm College bond.(25) Of the 68 tax rate areas in the City, 63 have a tax rate of 1.0597 percent, which includes SSFUSD & San Mateo JrCollege bond. 4 has a rate of 1.1126 percent which includes Brisbane ESD Bond, Jefferson High bonds, Jefferson USHD,SM Jr College bonds. 1 has a rate of 1.0801 percent, which includes San Bruno Pk Elem bond, SM Union High, SM High,SM Jr College bond and San Mateo Jr. College bonds.
(18) Of the 68 tax rate areas in the City, 63 have a tax rate of 1.0420 percent, which includes SSFUSD bonds and San Mateo JrCollege bond. 3 has a rate of 1.0893 percent and one at 1.0854 percent which includes Jefferson Union School bond, Brisbane ESDbonds & San Mateo JR College bonds and one has a rate of 1.0909 percent which includes San Bruno Park Elementary.
(17) Of the 68 tax rate areas in the City, 63 have a tax rate of 1.0389 percent, which includes SSFUSD bonds and San Mateo JrCollege bond. 3 has a rate of 1.0870 percent and one at 1.0832 percent which includes Jefferson Union School bonds and BrisbaneESD bonds. One has a rate of 1.0834 percent which includes San Bruno Park Elementary.
(19) Of the 68 tax rate areas in the City, 63 have a tax rate of 1.0521 percent, which includes SSFUSD bonds, San Mateo Jr Collegebond, and San Mateo Comm College. 4 has a rate of 1.0921 percent which includes Brisbane ESD Bond, Jefferson High bonds, SMJr College bond and San Mateo Comm College. 1 has a rate of 1.0905 percent, which includes San Bruno Pk Elem bond, SM UnionHigh, SM Jr College bond and San Mateo Comm College bond.(20) Of the 68 tax rate areas in the City, 63 have a tax rate of 1.0522 percent, which includes SSFUSD bonds, San Mateo Jr Collegebond, and San Mateo Comm College. 4 has a rate of 1.1048 percent which includes Brisbane ESD Bond, Jefferson High bonds, SMJr College bond and San Mateo Comm College. 1 has a rate of 1.0864 percent, which includes San Bruno Pk Elem bond, SM UnionHigh, SM High, and San Mateo Comm College. 1 has a rate of 1.0864 percent, which includes San Bruno Pk Elem bond, SM UnionHigh, SM High, SM Jr College bond and San Mateo Comm College bond.(21) Of the 68 tax rate areas in the City, 63 have a tax rate of 1.0703 percent, which includes SSFUSD bonds, San Mateo Jr Collegebond, and San Mateo Comm College. 4 has a rate of 1.0991 percent which includes Brisbane ESD Bond, Jefferson High bonds, SMJr College bond and San Mateo Comm College. 1 has a rate of 1.0983 percent, which includes San Bruno Pk Elem bond, SM UnionHigh, SM High, SM Jr College bond and San Mateo Comm College bond.(22) Of the 68 tax rate areas in the City, 63 have a tax rate of 1.0707 percent, which includes SSFUSD bonds, San Mateo Jr Collegebond, and San Mateo Comm College. 3 has a rate of 1.1080 percent and 1 with 1.1068 percent rate which includes College bondBrisbane ESD Bond, Jefferson High bonds, SM Jr and San Mateo Comm College. 1 has a rate of 1.0929 percent, which includesSan Bruno Pk Elem bond, SM Union High, SM High, SM Jr College bond and San Mateo Comm College bond.
155

This Page Left Intentionally Blank
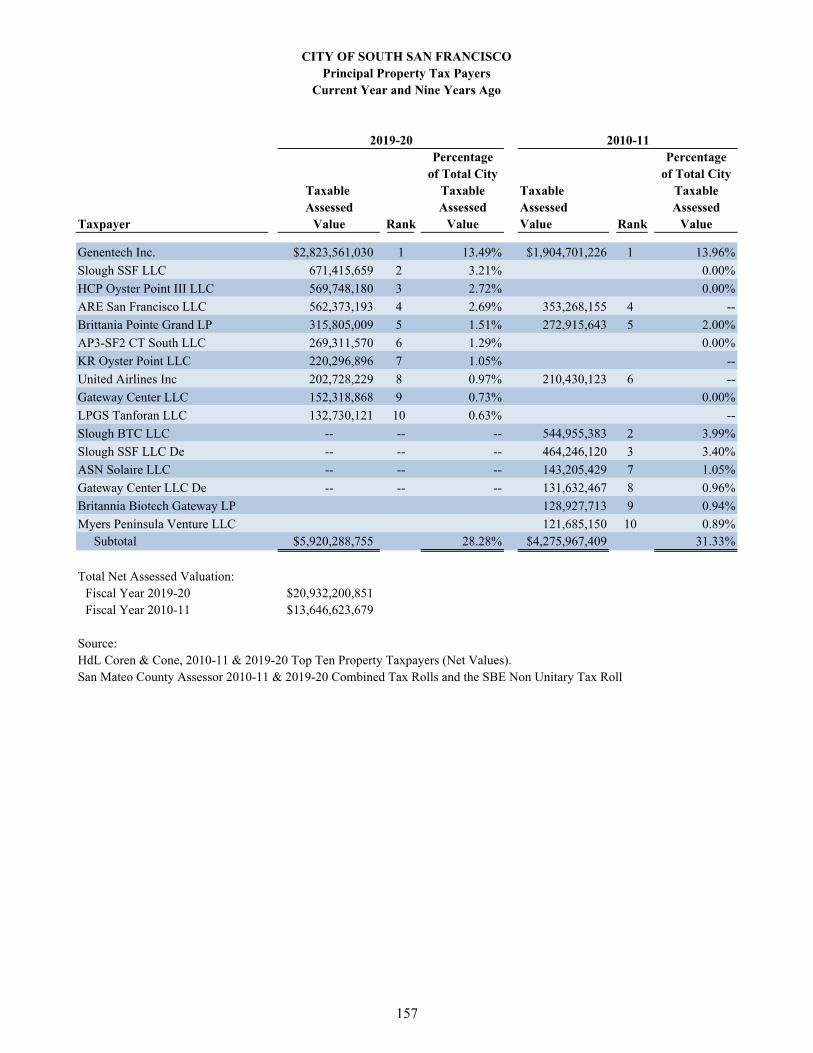
Percentage Percentageof Total City of Total City
Taxable Taxable Taxable TaxableAssessed Assessed Assessed Assessed
Taxpayer Value Rank Value Value Rank Value
Genentech Inc. $2,823,561,030 1 13.49% $1,904,701,226 1 13.96%
Slough SSF LLC 671,415,659 2 3.21% 0.00%
HCP Oyster Point III LLC 569,748,180 3 2.72% 0.00%
ARE San Francisco LLC 562,373,193 4 2.69% 353,268,155 4 --
Brittania Pointe Grand LP 315,805,009 5 1.51% 272,915,643 5 2.00%
AP3-SF2 CT South LLC 269,311,570 6 1.29% 0.00%
KR Oyster Point LLC 220,296,896 7 1.05% --
United Airlines Inc 202,728,229 8 0.97% 210,430,123 6 --
Gateway Center LLC 152,318,868 9 0.73% 0.00%
LPGS Tanforan LLC 132,730,121 10 0.63% --
Slough BTC LLC -- -- -- 544,955,383 2 3.99%
Slough SSF LLC De -- -- -- 464,246,120 3 3.40%
ASN Solaire LLC -- -- -- 143,205,429 7 1.05%
Gateway Center LLC De -- -- -- 131,632,467 8 0.96%
Britannia Biotech Gateway LP 128,927,713 9 0.94%
Myers Peninsula Venture LLC 121,685,150 10 0.89% Subtotal $5,920,288,755 28.28% $4,275,967,409 31.33%
Total Net Assessed Valuation:Fiscal Year 2019-20 $20,932,200,851Fiscal Year 2010-11 $13,646,623,679
HdL Coren & Cone, 2010-11 & 2019-20 Top Ten Property Taxpayers (Net Values).San Mateo County Assessor 2010-11 & 2019-20 Combined Tax Rolls and the SBE Non Unitary Tax Roll
Source:
2019-20 2010-11
CITY OF SOUTH SAN FRANCISCOPrincipal Property Tax Payers
Current Year and Nine Years Ago
157
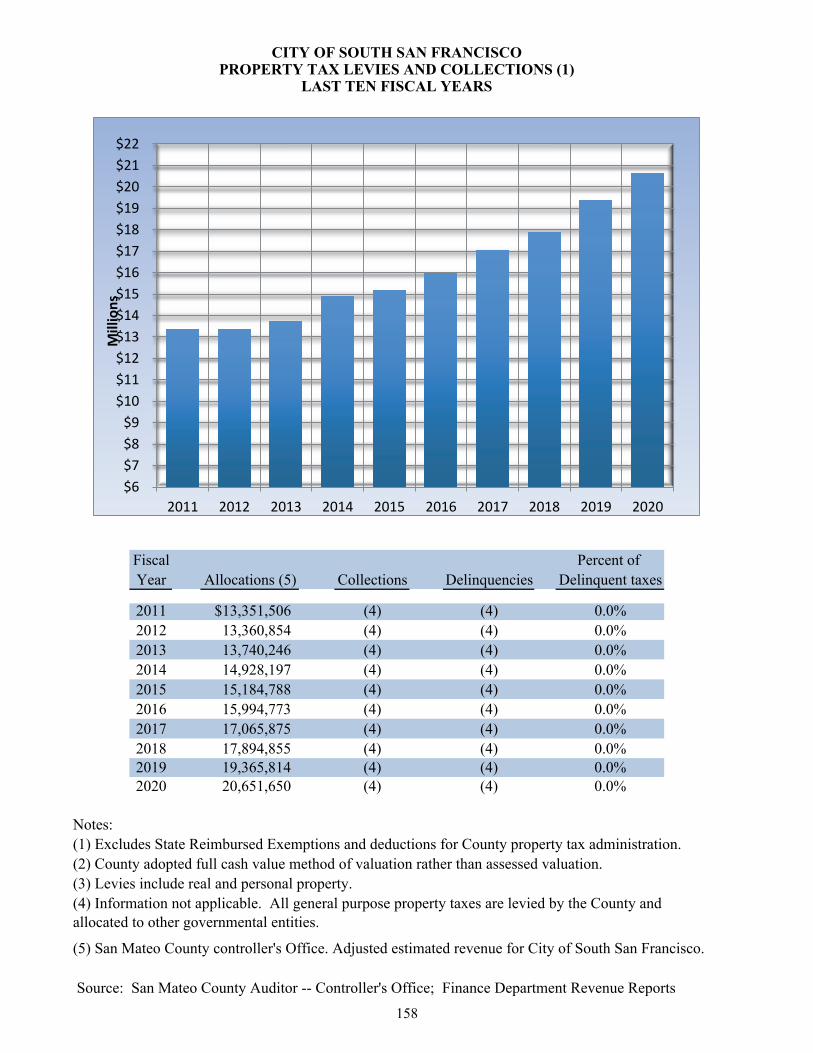
Fiscal Percent of Year Allocations (5) Collections Delinquencies Delinquent taxes
2011 $13,351,506 (4) (4) 0.0%2012 13,360,854 (4) (4) 0.0%2013 13,740,246 (4) (4) 0.0%2014 14,928,197 (4) (4) 0.0%2015 15,184,788 (4) (4) 0.0%2016 15,994,773 (4) (4) 0.0%2017 17,065,875 (4) (4) 0.0%2018 17,894,855 (4) (4) 0.0%2019 19,365,814 (4) (4) 0.0%2020 20,651,650 (4) (4) 0.0%
Notes:(1) Excludes State Reimbursed Exemptions and deductions for County property tax administration. (2) County adopted full cash value method of valuation rather than assessed valuation.(3) Levies include real and personal property.
(5) San Mateo County controller's Office. Adjusted estimated revenue for City of South San Francisco.
Source: San Mateo County Auditor -- Controller's Office; Finance Department Revenue Reports
(4) Information not applicable. All general purpose property taxes are levied by the County and allocated to other governmental entities.
CITY OF SOUTH SAN FRANCISCOPROPERTY TAX LEVIES AND COLLECTIONS (1)
LAST TEN FISCAL YEARS
$6
$7
$8
$9
$10
$11
$12
$13
$14
$15
$16
$17
$18
$19
$20
$21
$22
2011 2012 2013 2014 2015 2016 2017 2018 2019 2020
Millions
158
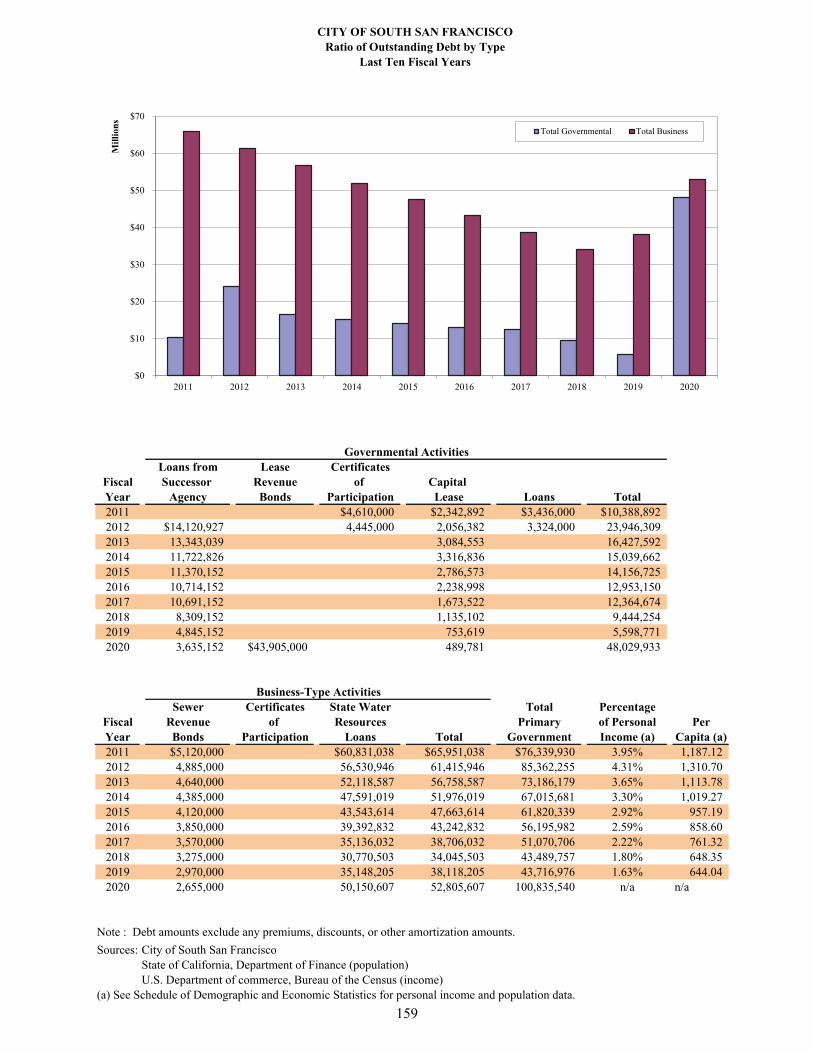
CITY OF SOUTH SAN FRANCISCORatio of Outstanding Debt by Type
Last Ten Fiscal Years
Governmental ActivitiesLoans from Lease Certificates
Fiscal Successor Revenue of Capital Year Agency Bonds Participation Lease Loans Total2011 $4,610,000 $2,342,892 $3,436,000 $10,388,8922012 $14,120,927 4,445,000 2,056,382 3,324,000 23,946,3092013 13,343,039 3,084,553 16,427,5922014 11,722,826 3,316,836 15,039,6622015 11,370,152 2,786,573 14,156,7252016 10,714,152 2,238,998 12,953,1502017 10,691,152 1,673,522 12,364,6742018 8,309,152 1,135,102 9,444,2542019 4,845,152 753,619 5,598,7712020 3,635,152 $43,905,000 489,781 48,029,933
Business-Type ActivitiesSewer Certificates State Water Total Percentage
Fiscal Revenue of Resources Primary of Personal PerYear Bonds Participation Loans Total Government Income (a) Capita (a)2011 $5,120,000 $60,831,038 $65,951,038 $76,339,930 3.95% 1,187.122012 4,885,000 56,530,946 61,415,946 85,362,255 4.31% 1,310.702013 4,640,000 52,118,587 56,758,587 73,186,179 3.65% 1,113.782014 4,385,000 47,591,019 51,976,019 67,015,681 3.30% 1,019.272015 4,120,000 43,543,614 47,663,614 61,820,339 2.92% 957.192016 3,850,000 39,392,832 43,242,832 56,195,982 2.59% 858.602017 3,570,000 35,136,032 38,706,032 51,070,706 2.22% 761.322018 3,275,000 30,770,503 34,045,503 43,489,757 1.80% 648.352019 2,970,000 35,148,205 38,118,205 43,716,976 1.63% 644.042020 2,655,000 50,150,607 52,805,607 100,835,540 n/a n/a
Note : Debt amounts exclude any premiums, discounts, or other amortization amounts.
Sources: City of South San FranciscoState of California, Department of Finance (population)U.S. Department of commerce, Bureau of the Census (income)
(a) See Schedule of Demographic and Economic Statistics for personal income and population data.
$0
$10
$20
$30
$40
$50
$60
$70
2011 2012 2013 2014 2015 2016 2017 2018 2019 2020
Mil
lion
s
Total Governmental Total Business
159
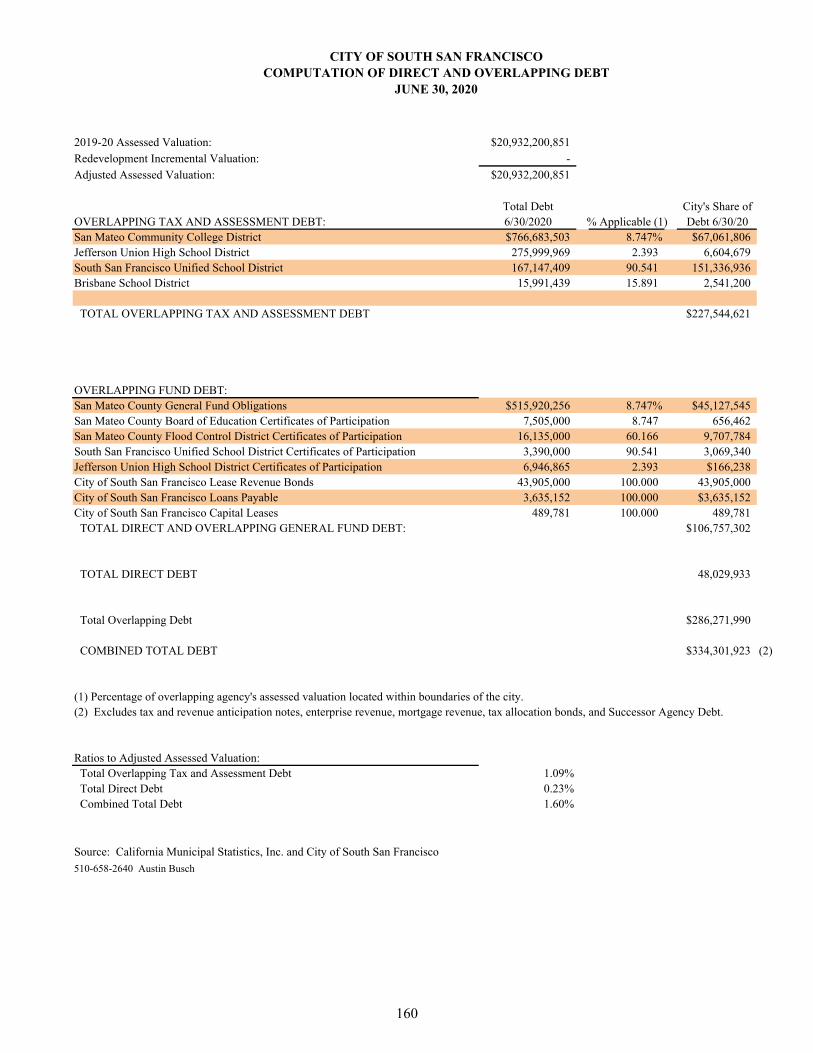
CITY OF SOUTH SAN FRANCISCOCOMPUTATION OF DIRECT AND OVERLAPPING DEBT
JUNE 30, 2020
2019-20 Assessed Valuation: $20,932,200,851
Redevelopment Incremental Valuation: -
Adjusted Assessed Valuation: $20,932,200,851
Total Debt City's Share ofOVERLAPPING TAX AND ASSESSMENT DEBT: 6/30/2020 % Applicable (1) Debt 6/30/20San Mateo Community College District $766,683,503 8.747% $67,061,806Jefferson Union High School District 275,999,969 2.393 6,604,679 South San Francisco Unified School District 167,147,409 90.541 151,336,936 Brisbane School District 15,991,439 15.891 2,541,200
TOTAL OVERLAPPING TAX AND ASSESSMENT DEBT $227,544,621
OVERLAPPING FUND DEBT:San Mateo County General Fund Obligations $515,920,256 8.747% $45,127,545San Mateo County Board of Education Certificates of Participation 7,505,000 8.747 656,462 San Mateo County Flood Control District Certificates of Participation 16,135,000 60.166 9,707,784 South San Francisco Unified School District Certificates of Participation 3,390,000 90.541 3,069,340 Jefferson Union High School District Certificates of Participation 6,946,865 2.393 $166,238City of South San Francisco Lease Revenue Bonds 43,905,000 100.000 43,905,000 City of South San Francisco Loans Payable 3,635,152 100.000 $3,635,152City of South San Francisco Capital Leases 489,781 100.000 489,781 TOTAL DIRECT AND OVERLAPPING GENERAL FUND DEBT: $106,757,302
TOTAL DIRECT DEBT 48,029,933
Total Overlapping Debt $286,271,990
COMBINED TOTAL DEBT $334,301,923 (2)
(1) Percentage of overlapping agency's assessed valuation located within boundaries of the city.
Ratios to Adjusted Assessed Valuation: Total Overlapping Tax and Assessment Debt 1.09% Total Direct Debt 0.23% Combined Total Debt 1.60%
Source: California Municipal Statistics, Inc. and City of South San Francisco
510-658-2640 Austin Busch
(2) Excludes tax and revenue anticipation notes, enterprise revenue, mortgage revenue, tax allocation bonds, and Successor Agency Debt.
160
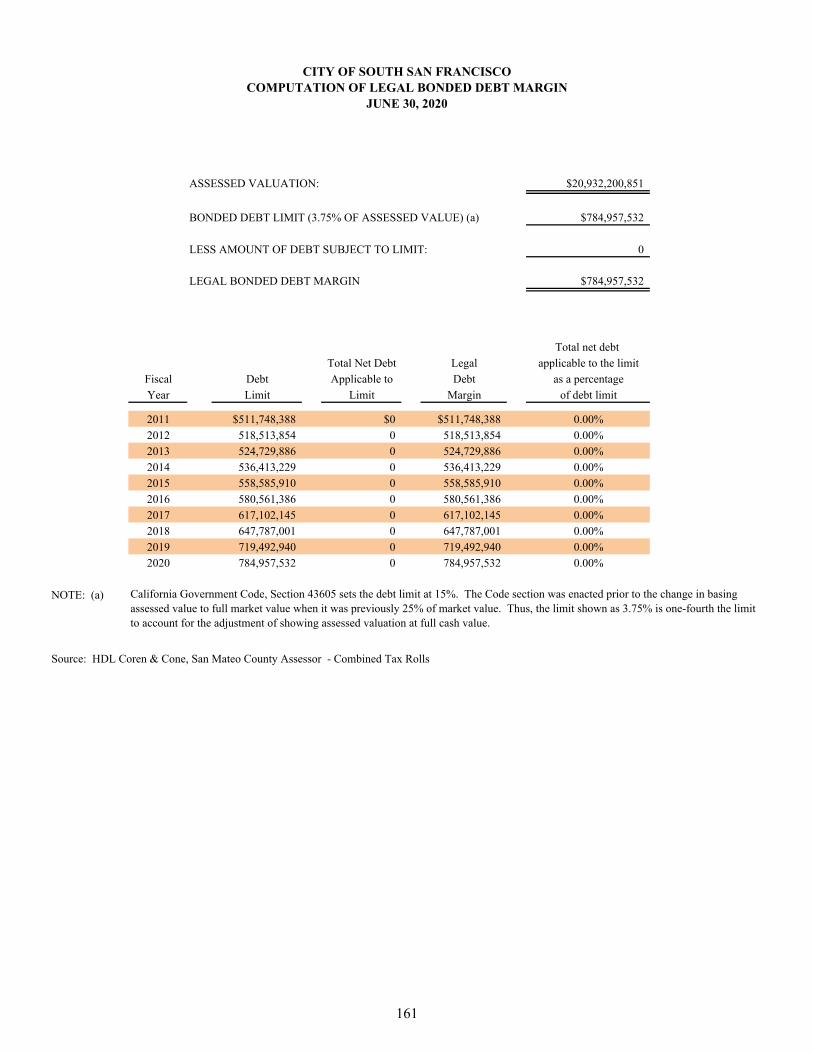
ASSESSED VALUATION: $20,932,200,851
BONDED DEBT LIMIT (3.75% OF ASSESSED VALUE) (a) $784,957,532
LESS AMOUNT OF DEBT SUBJECT TO LIMIT: 0
LEGAL BONDED DEBT MARGIN $784,957,532
Total net debt
Total Net Debt Legal applicable to the limit
Fiscal Debt Applicable to Debt as a percentage
Year Limit Limit Margin of debt limit
2011 $511,748,388 $0 $511,748,388 0.00%
2012 518,513,854 0 518,513,854 0.00%
2013 524,729,886 0 524,729,886 0.00%
2014 536,413,229 0 536,413,229 0.00%
2015 558,585,910 0 558,585,910 0.00%
2016 580,561,386 0 580,561,386 0.00%
2017 617,102,145 0 617,102,145 0.00%
2018 647,787,001 0 647,787,001 0.00%
2019 719,492,940 0 719,492,940 0.00%
2020 784,957,532 0 784,957,532 0.00%
NOTE: (a)
Source: HDL Coren & Cone, San Mateo County Assessor - Combined Tax Rolls
CITY OF SOUTH SAN FRANCISCOCOMPUTATION OF LEGAL BONDED DEBT MARGIN
JUNE 30, 2020
California Government Code, Section 43605 sets the debt limit at 15%. The Code section was enacted prior to the change in basing assessed value to full market value when it was previously 25% of market value. Thus, the limit shown as 3.75% is one-fourth the limit to account for the adjustment of showing assessed valuation at full cash value.
161
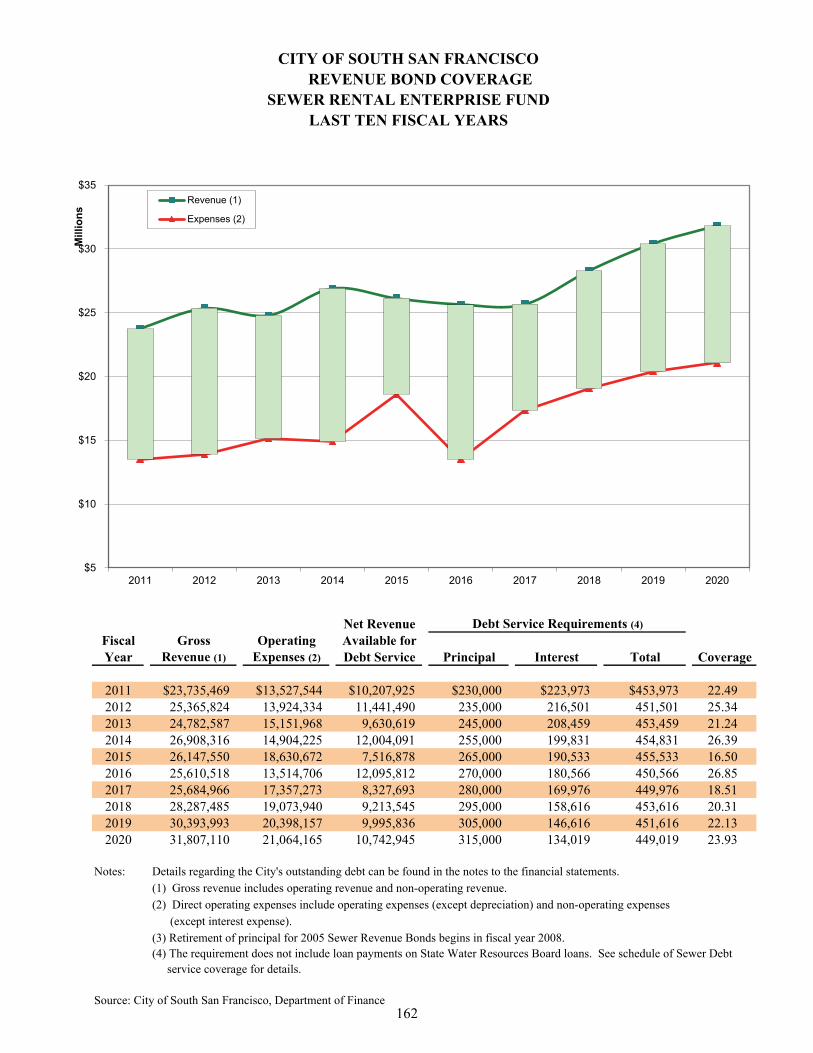
CITY OF SOUTH SAN FRANCISCO REVENUE BOND COVERAGE
SEWER RENTAL ENTERPRISE FUNDLAST TEN FISCAL YEARS
Net Revenue Debt Service Requirements (4)
Fiscal Gross Operating Available forYear Revenue (1) Expenses (2) Debt Service Principal Interest Total Coverage
2011 $23,735,469 $13,527,544 $10,207,925 $230,000 $223,973 $453,973 22.492012 25,365,824 13,924,334 11,441,490 235,000 216,501 451,501 25.342013 24,782,587 15,151,968 9,630,619 245,000 208,459 453,459 21.242014 26,908,316 14,904,225 12,004,091 255,000 199,831 454,831 26.392015 26,147,550 18,630,672 7,516,878 265,000 190,533 455,533 16.502016 25,610,518 13,514,706 12,095,812 270,000 180,566 450,566 26.852017 25,684,966 17,357,273 8,327,693 280,000 169,976 449,976 18.512018 28,287,485 19,073,940 9,213,545 295,000 158,616 453,616 20.312019 30,393,993 20,398,157 9,995,836 305,000 146,616 451,616 22.132020 31,807,110 21,064,165 10,742,945 315,000 134,019 449,019 23.93
Notes: Details regarding the City's outstanding debt can be found in the notes to the financial statements.
(1) Gross revenue includes operating revenue and non-operating revenue.
(2) Direct operating expenses include operating expenses (except depreciation) and non-operating expenses
(except interest expense).
(3) Retirement of principal for 2005 Sewer Revenue Bonds begins in fiscal year 2008.(4) The requirement does not include loan payments on State Water Resources Board loans. See schedule of Sewer Debt
service coverage for details.
Source: City of South San Francisco, Department of Finance
$5
$10
$15
$20
$25
$30
$35
2011 2012 2013 2014 2015 2016 2017 2018 2019 2020
Mill
ion
s
Revenue (1)
Expenses (2)
162
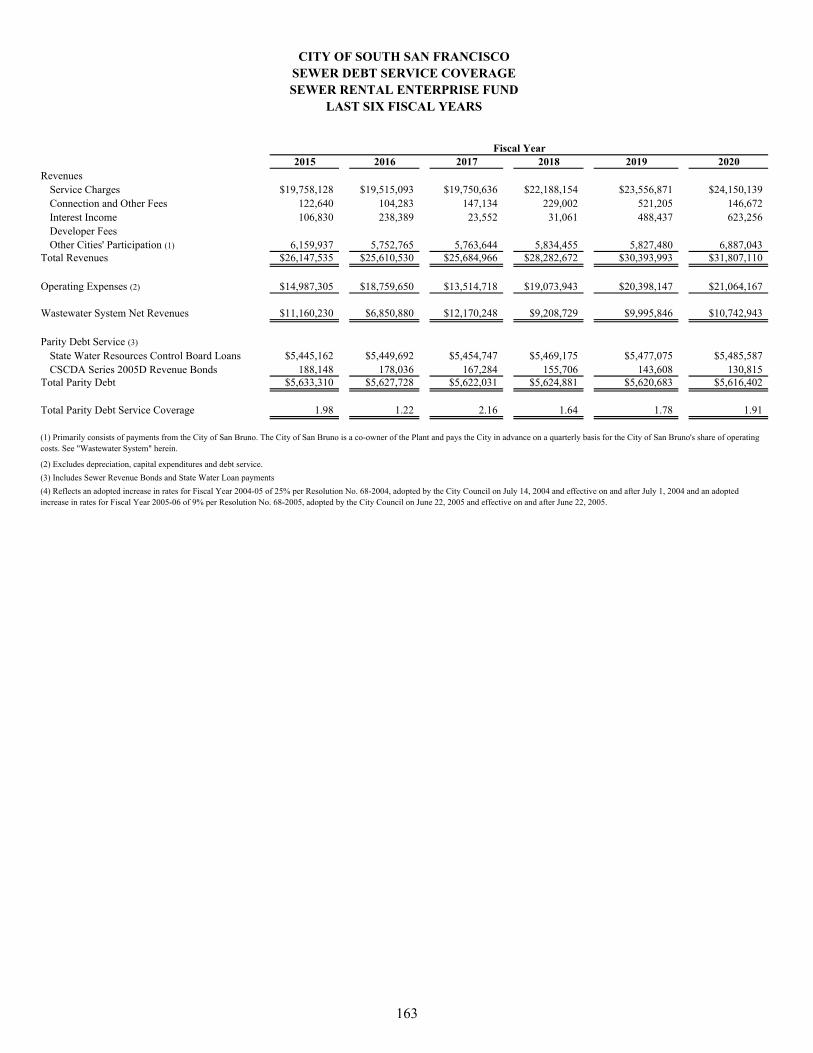
CITY OF SOUTH SAN FRANCISCOSEWER DEBT SERVICE COVERAGESEWER RENTAL ENTERPRISE FUND
LAST SIX FISCAL YEARS
Fiscal Year2015 2016 2017 2018 2019 2020
RevenuesService Charges $19,758,128 $19,515,093 $19,750,636 $22,188,154 $23,556,871 $24,150,139Connection and Other Fees 122,640 104,283 147,134 229,002 521,205 146,672Interest Income 106,830 238,389 23,552 31,061 488,437 623,256Developer FeesOther Cities' Participation (1) 6,159,937 5,752,765 5,763,644 5,834,455 5,827,480 6,887,043
Total Revenues $26,147,535 $25,610,530 $25,684,966 $28,282,672 $30,393,993 $31,807,110
Operating Expenses (2) $14,987,305 $18,759,650 $13,514,718 $19,073,943 $20,398,147 $21,064,167
Wastewater System Net Revenues $11,160,230 $6,850,880 $12,170,248 $9,208,729 $9,995,846 $10,742,943
Parity Debt Service (3)
State Water Resources Control Board Loans $5,445,162 $5,449,692 $5,454,747 $5,469,175 $5,477,075 $5,485,587CSCDA Series 2005D Revenue Bonds 188,148 178,036 167,284 155,706 143,608 130,815
Total Parity Debt $5,633,310 $5,627,728 $5,622,031 $5,624,881 $5,620,683 $5,616,402
Total Parity Debt Service Coverage 1.98 1.22 2.16 1.64 1.78 1.91
10,012,867 10,012,867 10,012,867 10,012,867 10,012,867 10,012,867
(2) Excludes depreciation, capital expenditures and debt service.
(3) Includes Sewer Revenue Bonds and State Water Loan payments
(1) Primarily consists of payments from the City of San Bruno. The City of San Bruno is a co-owner of the Plant and pays the City in advance on a quarterly basis for the City of San Bruno's share of operating costs. See "Wastewater System" herein.
(4) Reflects an adopted increase in rates for Fiscal Year 2004-05 of 25% per Resolution No. 68-2004, adopted by the City Council on July 14, 2004 and effective on and after July 1, 2004 and an adopted increase in rates for Fiscal Year 2005-06 of 9% per Resolution No. 68-2005, adopted by the City Council on June 22, 2005 and effective on and after June 22, 2005.
163
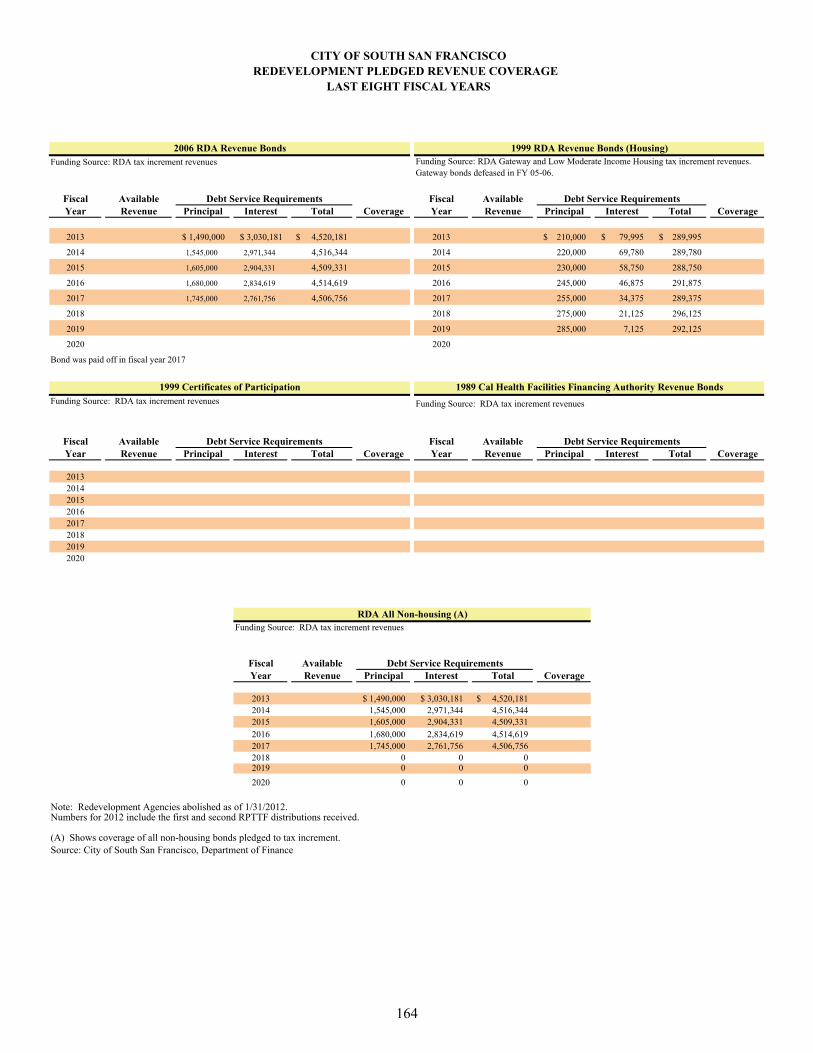
CITY OF SOUTH SAN FRANCISCOREDEVELOPMENT PLEDGED REVENUE COVERAGE
LAST EIGHT FISCAL YEARS
Funding Source: RDA tax increment revenues
Fiscal Available Debt Service Requirements Fiscal Available Debt Service RequirementsYear Revenue Principal Interest Total Coverage Year Revenue Principal Interest Total Coverage
2013 1,490,000$ 3,030,181$ 4,520,181$ 2013 210,000$ 79,995$ 289,995$
2014 1,545,000 2,971,344 4,516,344 2014 220,000 69,780 289,780
2015 1,605,000 2,904,331 4,509,331 2015 230,000 58,750 288,750
2016 1,680,000 2,834,619 4,514,619 2016 245,000 46,875 291,875
2017 1,745,000 2,761,756 4,506,756 2017 255,000 34,375 289,375
2018 2018 275,000 21,125 296,125
2019 2019 285,000 7,125 292,125
2020 2020
Bond was paid off in fiscal year 2017
Funding Source: RDA tax increment revenues Funding Source: RDA tax increment revenues
Fiscal Available Debt Service Requirements Fiscal Available Debt Service RequirementsYear Revenue Principal Interest Total Coverage Year Revenue Principal Interest Total Coverage
20132014201520162017201820192020
Funding Source: RDA tax increment revenues
Fiscal Available Debt Service RequirementsYear Revenue Principal Interest Total Coverage
2013 1,490,000$ 3,030,181$ 4,520,181$ 2014 1,545,000 2,971,344 4,516,3442015 1,605,000 2,904,331 4,509,3312016 1,680,000 2,834,619 4,514,6192017 1,745,000 2,761,756 4,506,7562018 0 0 02019 0 0 0
2020 0 0 0
Note: Redevelopment Agencies abolished as of 1/31/2012.Numbers for 2012 include the first and second RPTTF distributions received.
(A) Shows coverage of all non-housing bonds pledged to tax increment.Source: City of South San Francisco, Department of Finance
RDA All Non-housing (A)
2006 RDA Revenue BondsFunding Source: RDA Gateway and Low Moderate Income Housing tax increment revenues. Gateway bonds defeased in FY 05-06.
1999 RDA Revenue Bonds (Housing)
1989 Cal Health Facilities Financing Authority Revenue Bonds1999 Certificates of Participation
164
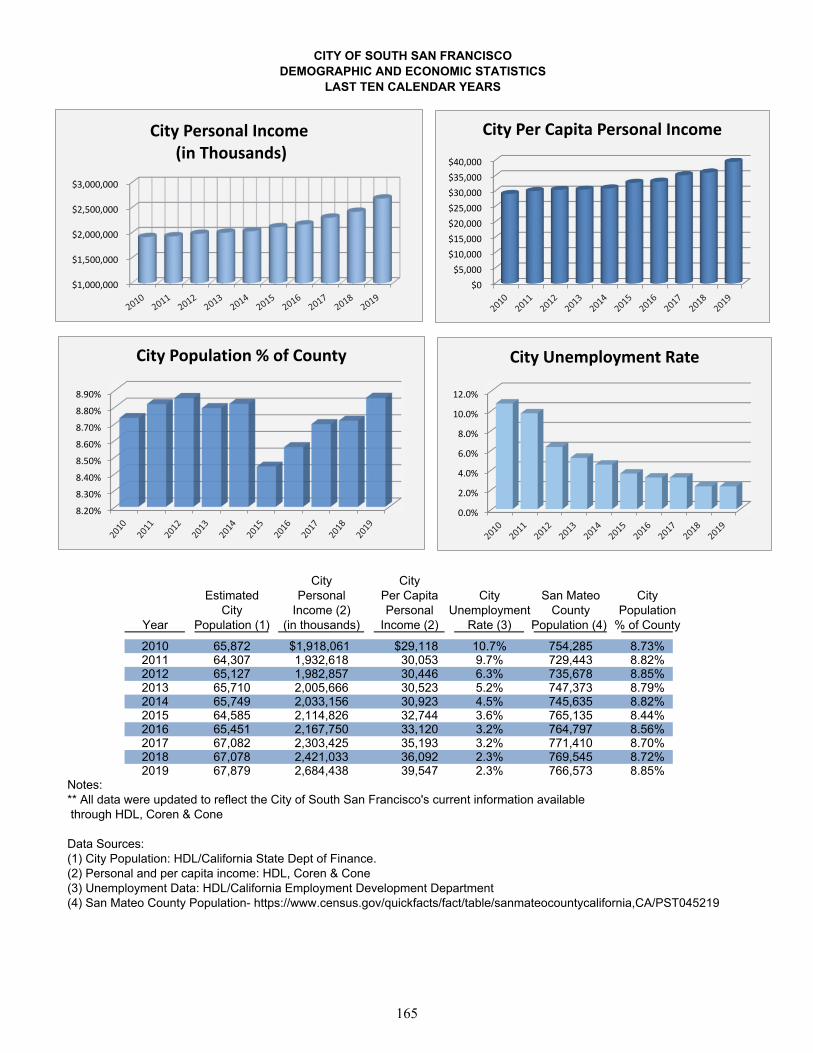
City CityEstimated Personal Per Capita City San Mateo City
City Income (2) Personal Unemployment County PopulationYear Population (1) (in thousands) Income (2) Rate (3) Population (4) % of County
2010 65,872 $1,918,061 $29,118 10.7% 754,285 8.73%2011 64,307 1,932,618 30,053 9.7% 729,443 8.82%2012 65,127 1,982,857 30,446 6.3% 735,678 8.85%2013 65,710 2,005,666 30,523 5.2% 747,373 8.79%2014 65,749 2,033,156 30,923 4.5% 745,635 8.82%2015 64,585 2,114,826 32,744 3.6% 765,135 8.44%2016 65,451 2,167,750 33,120 3.2% 764,797 8.56%2017 67,082 2,303,425 35,193 3.2% 771,410 8.70%2018 67,078 2,421,033 36,092 2.3% 769,545 8.72%2019 67,879 2,684,438 39,547 2.3% 766,573 8.85%
Notes:** All data were updated to reflect the City of South San Francisco's current information available through HDL, Coren & Cone
Data Sources:(1) City Population: HDL/California State Dept of Finance.(2) Personal and per capita income: HDL, Coren & Cone(3) Unemployment Data: HDL/California Employment Development Department(4) San Mateo County Population- https://www.census.gov/quickfacts/fact/table/sanmateocountycalifornia,CA/PST045219
CITY OF SOUTH SAN FRANCISCODEMOGRAPHIC AND ECONOMIC STATISTICS
LAST TEN CALENDAR YEARS
$1,000,000
$1,500,000
$2,000,000
$2,500,000
$3,000,000
City Personal Income(in Thousands)
0.0%
2.0%
4.0%
6.0%
8.0%
10.0%
12.0%
City Unemployment Rate
8.20%
8.30%
8.40%
8.50%
8.60%
8.70%
8.80%
8.90%
City Population % of County
$0
$5,000
$10,000
$15,000
$20,000
$25,000
$30,000
$35,000
$40,000
City Per Capita Personal Income
165
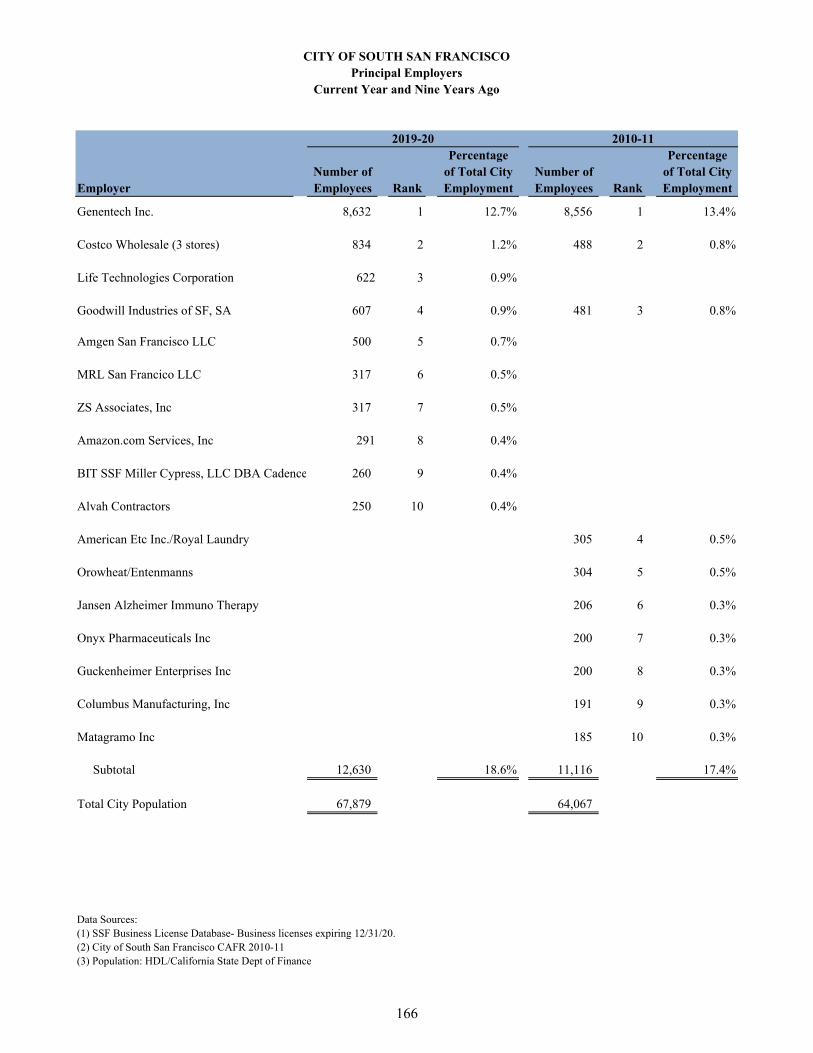
Percentage PercentageNumber of of Total City Number of of Total City
Employer Employees Rank Employment Employees Rank Employment
Genentech Inc. 8,632 1 12.7% 8,556 1 13.4%
Costco Wholesale (3 stores) 834 2 1.2% 488 2 0.8%
Life Technologies Corporation 622 3 0.9%
Goodwill Industries of SF, SA 607 4 0.9% 481 3 0.8%
Amgen San Francisco LLC 500 5 0.7%
MRL San Francico LLC 317 6 0.5%
ZS Associates, Inc 317 7 0.5%
Amazon.com Services, Inc 291 8 0.4%
BIT SSF Miller Cypress, LLC DBA Cadence 260 9 0.4%
Alvah Contractors 250 10 0.4%
American Etc Inc./Royal Laundry 305 4 0.5%
Orowheat/Entenmanns 304 5 0.5%
Jansen Alzheimer Immuno Therapy 206 6 0.3%
Onyx Pharmaceuticals Inc 200 7 0.3%
Guckenheimer Enterprises Inc 200 8 0.3%
Columbus Manufacturing, Inc 191 9 0.3%
Matagramo Inc 185 10 0.3%
Subtotal 12,630 18.6% 11,116 17.4%
Total City Population 67,879 64,067
Data Sources: (1) SSF Business License Database- Business licenses expiring 12/31/20.(2) City of South San Francisco CAFR 2010-11(3) Population: HDL/California State Dept of Finance
2010-112019-20
CITY OF SOUTH SAN FRANCISCOPrincipal Employers
Current Year and Nine Years Ago
166
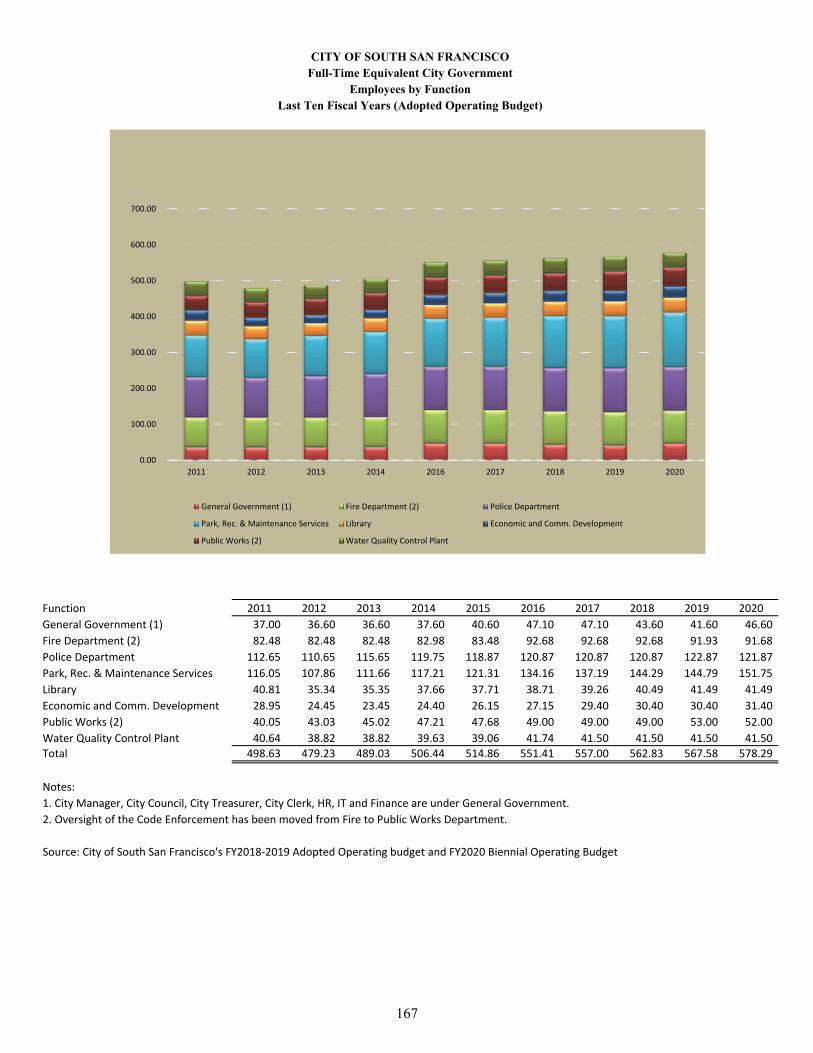
Function 2011 2012 2013 2014 2015 2016 2017 2018 2019 2020
General Government (1) 37.00 36.60 36.60 37.60 40.60 47.10 47.10 43.60 41.60 46.60
Fire Department (2) 82.48 82.48 82.48 82.98 83.48 92.68 92.68 92.68 91.93 91.68
Police Department 112.65 110.65 115.65 119.75 118.87 120.87 120.87 120.87 122.87 121.87
Park, Rec. & Maintenance Services 116.05 107.86 111.66 117.21 121.31 134.16 137.19 144.29 144.79 151.75
Library 40.81 35.34 35.35 37.66 37.71 38.71 39.26 40.49 41.49 41.49
Economic and Comm. Development 28.95 24.45 23.45 24.40 26.15 27.15 29.40 30.40 30.40 31.40
Public Works (2) 40.05 43.03 45.02 47.21 47.68 49.00 49.00 49.00 53.00 52.00
Water Quality Control Plant 40.64 38.82 38.82 39.63 39.06 41.74 41.50 41.50 41.50 41.50
Total 498.63 479.23 489.03 506.44 514.86 551.41 557.00 562.83 567.58 578.29
Notes:
1. City Manager, City Council, City Treasurer, City Clerk, HR, IT and Finance are under General Government.
2. Oversight of the Code Enforcement has been moved from Fire to Public Works Department.
Source: City of South San Francisco's FY2018‐2019 Adopted Operating budget and FY2020 Biennial Operating Budget
CITY OF SOUTH SAN FRANCISCOFull-Time Equivalent City Government
Employees by FunctionLast Ten Fiscal Years (Adopted Operating Budget)
0.00
100.00
200.00
300.00
400.00
500.00
600.00
700.00
2011 2012 2013 2014 2016 2017 2018 2019 2020
General Government (1) Fire Department (2) Police Department
Park, Rec. & Maintenance Services Library Economic and Comm. Development
Public Works (2) Water Quality Control Plant
167
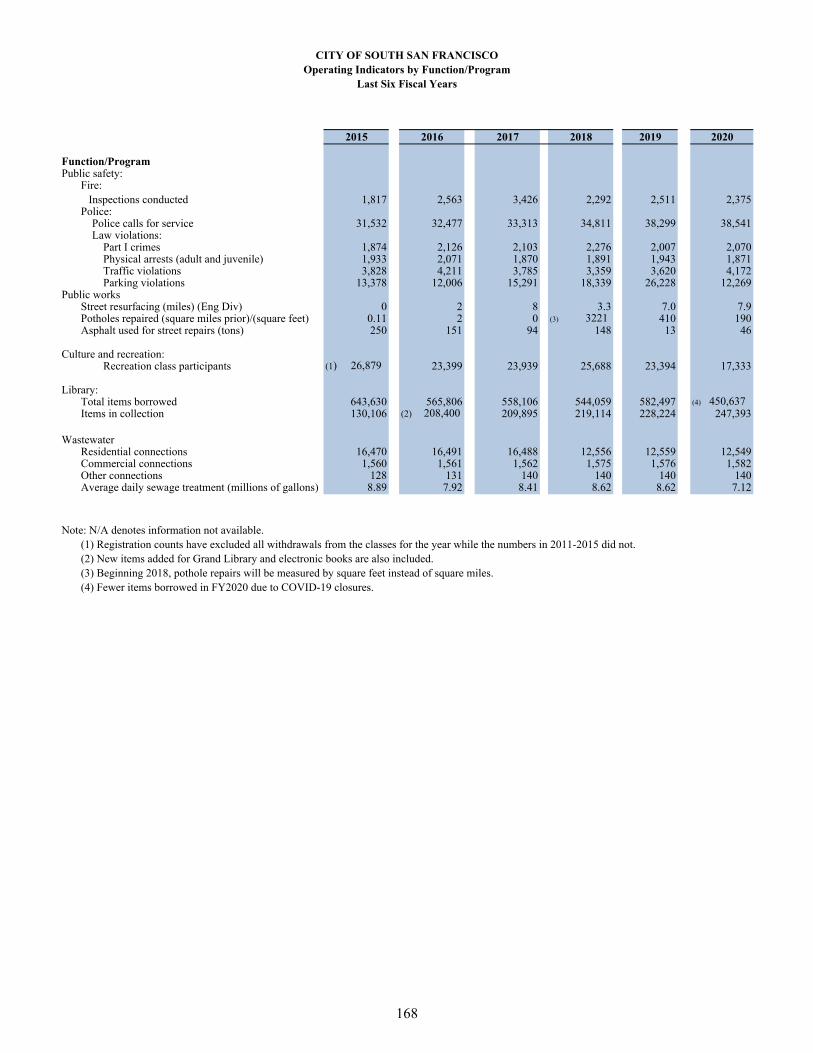
2015 2016 2017 2018 2019 2020
Function/ProgramPublic safety:
Fire:Inspections conducted 1,817 2,563 3,426 2,292 2,511 2,375
Police: Police calls for service 31,532 32,477 33,313 34,811 38,299 38,541 Law violations: Part I crimes 1,874 2,126 2,103 2,276 2,007 2,070 Physical arrests (adult and juvenile) 1,933 2,071 1,870 1,891 1,943 1,871 Traffic violations 3,828 4,211 3,785 3,359 3,620 4,172 Parking violations 13,378 12,006 15,291 18,339 26,228 12,269
Public worksStreet resurfacing (miles) (Eng Div) 0 2 8 3.3 7.0 7.9Potholes repaired (square miles prior)/(square feet) 0.11 2 0 (3) 3221 410 190Asphalt used for street repairs (tons) 250 151 94 148 13 46
Culture and recreation: Recreation class participants (1) 26,879 23,399 23,939 25,688 23,394 17,333
Library:Total items borrowed 643,630 565,806 558,106 544,059 582,497 (4) 450,637Items in collection 130,106 (2) 208,400 209,895 219,114 228,224 247,393
WastewaterResidential connections 16,470 16,491 16,488 12,556 12,559 12,549Commercial connections 1,560 1,561 1,562 1,575 1,576 1,582Other connections 128 131 140 140 140 140Average daily sewage treatment (millions of gallons) 8.89 7.92 8.41 8.62 8.62 7.12
Note: N/A denotes information not available.(1) Registration counts have excluded all withdrawals from the classes for the year while the numbers in 2011-2015 did not.(2) New items added for Grand Library and electronic books are also included.(3) Beginning 2018, pothole repairs will be measured by square feet instead of square miles.(4) Fewer items borrowed in FY2020 due to COVID-19 closures.
CITY OF SOUTH SAN FRANCISCOOperating Indicators by Function/Program
Last Six Fiscal Years
168
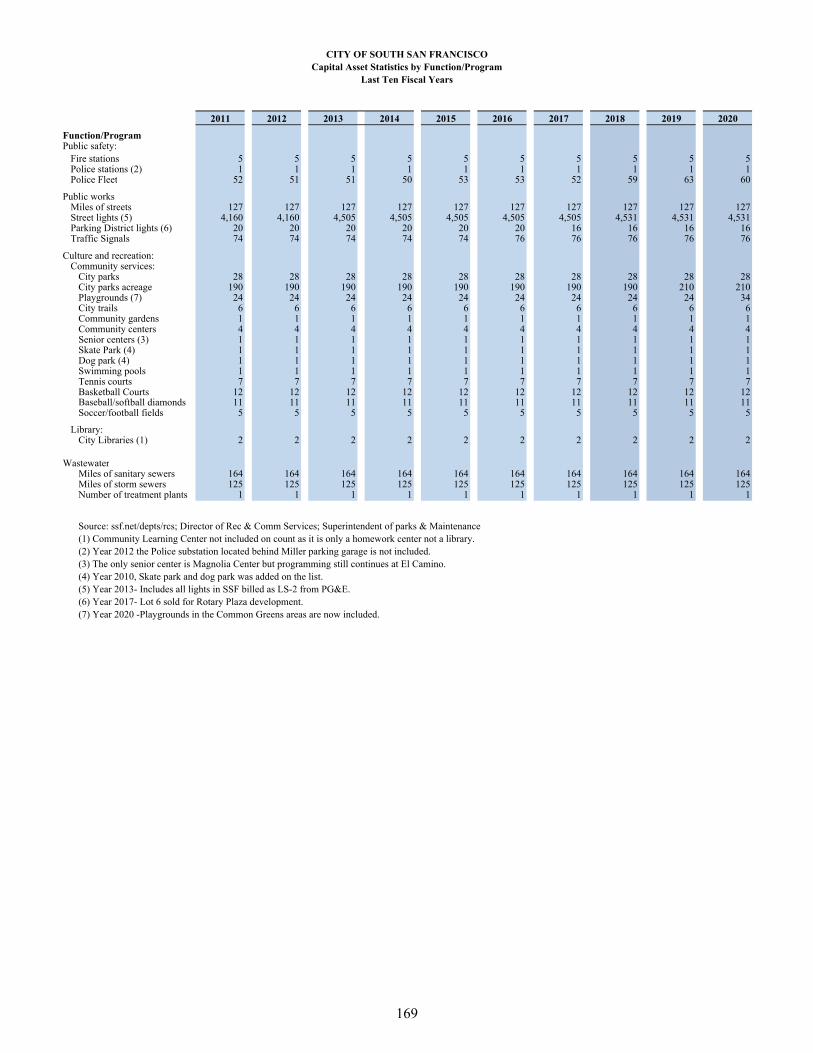
2011 2012 2013 2014 2015 2016 2017 2018 2019 2020
Function/ProgramPublic safety:
Fire stations 5 5 5 5 5 5 5 5 5 5Police stations (2) 1 1 1 1 1 1 1 1 1 1Police Fleet 52 51 51 50 53 53 52 59 63 60
Public worksMiles of streets 127 127 127 127 127 127 127 127 127 127Street lights (5) 4,160 4,160 4,505 4,505 4,505 4,505 4,505 4,531 4,531 4,531Parking District lights (6) 20 20 20 20 20 20 16 16 16 16Traffic Signals 74 74 74 74 74 76 76 76 76 76
Culture and recreation:Community services:
City parks 28 28 28 28 28 28 28 28 28 28City parks acreage 190 190 190 190 190 190 190 190 210 210Playgrounds (7) 24 24 24 24 24 24 24 24 24 34City trails 6 6 6 6 6 6 6 6 6 6Community gardens 1 1 1 1 1 1 1 1 1 1Community centers 4 4 4 4 4 4 4 4 4 4Senior centers (3) 1 1 1 1 1 1 1 1 1 1Skate Park (4) 1 1 1 1 1 1 1 1 1 1Dog park (4) 1 1 1 1 1 1 1 1 1 1Swimming pools 1 1 1 1 1 1 1 1 1 1Tennis courts 7 7 7 7 7 7 7 7 7 7Basketball Courts 12 12 12 12 12 12 12 12 12 12Baseball/softball diamonds 11 11 11 11 11 11 11 11 11 11Soccer/football fields 5 5 5 5 5 5 5 5 5 5
Library:City Libraries (1) 2 2 2 2 2 2 2 2 2 2
WastewaterMiles of sanitary sewers 164 164 164 164 164 164 164 164 164 164Miles of storm sewers 125 125 125 125 125 125 125 125 125 125Number of treatment plants 1 1 1 1 1 1 1 1 1 1
Source: ssf.net/depts/rcs; Director of Rec & Comm Services; Superintendent of parks & Maintenance (1) Community Learning Center not included on count as it is only a homework center not a library.(2) Year 2012 the Police substation located behind Miller parking garage is not included.(3) The only senior center is Magnolia Center but programming still continues at El Camino.(4) Year 2010, Skate park and dog park was added on the list.(5) Year 2013- Includes all lights in SSF billed as LS-2 from PG&E.(6) Year 2017- Lot 6 sold for Rotary Plaza development.(7) Year 2020 -Playgrounds in the Common Greens areas are now included.
CITY OF SOUTH SAN FRANCISCOCapital Asset Statistics by Function/Program
Last Ten Fiscal Years
169
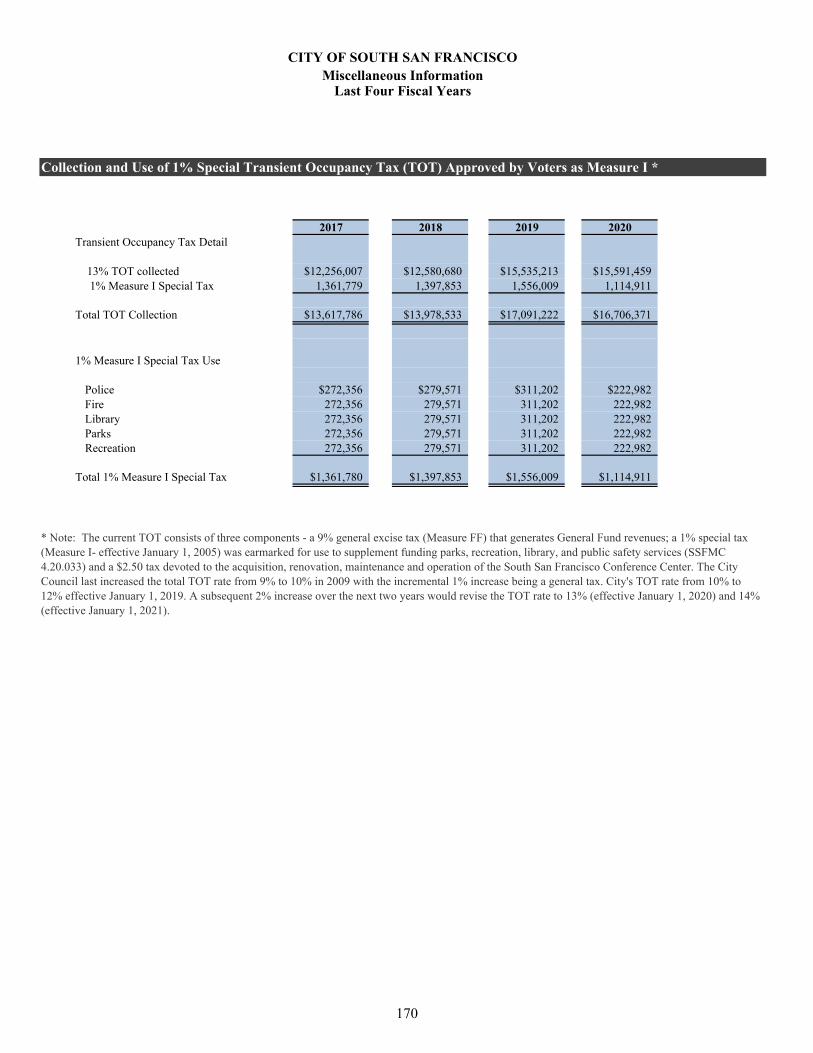
2017 2018 2019 2020Transient Occupancy Tax Detail
13% TOT collected $12,256,007 $12,580,680 $15,535,213 $15,591,459 1% Measure I Special Tax 1,361,779 1,397,853 1,556,009 1,114,911
Total TOT Collection $13,617,786 $13,978,533 $17,091,222 $16,706,371
1% Measure I Special Tax Use
Police $272,356 $279,571 $311,202 $222,982Fire 272,356 279,571 311,202 222,982Library 272,356 279,571 311,202 222,982Parks 272,356 279,571 311,202 222,982Recreation 272,356 279,571 311,202 222,982
Total 1% Measure I Special Tax $1,361,780 $1,397,853 $1,556,009 $1,114,911
* Note: The current TOT consists of three components - a 9% general excise tax (Measure FF) that generates General Fund revenues; a 1% special tax(Measure I- effective January 1, 2005) was earmarked for use to supplement funding parks, recreation, library, and public safety services (SSFMC4.20.033) and a $2.50 tax devoted to the acquisition, renovation, maintenance and operation of the South San Francisco Conference Center. The CityCouncil last increased the total TOT rate from 9% to 10% in 2009 with the incremental 1% increase being a general tax. City's TOT rate from 10% to12% effective January 1, 2019. A subsequent 2% increase over the next two years would revise the TOT rate to 13% (effective January 1, 2020) and 14%(effective January 1, 2021).
CITY OF SOUTH SAN FRANCISCO
Collection and Use of 1% Special Transient Occupancy Tax (TOT) Approved by Voters as Measure I *
Miscellaneous InformationLast Four Fiscal Years
170