Embed Size (px)
Citation preview
i
CITY OF WAUSAU Wausau, Wisconsin
COMPREHENSIVE ANNUAL
FINANCIAL REPORT
For the Year Ended December 31, 2010
Finance Department Maryanne Groat, Finance Director / Treasurer
Richard M. Whalen, Assistant Finance Director
ii
CITY OF WAUSAU, WISCONSIN COMPREHENSIVE ANNUAL FINANCIAL REPORT
For the Year Ended December 31, 2010
TABLE OF CONTENTS INTRODUCTORY SECTION PAGE
Letter of Transmittal ........................................................................................................................ iv Certificate of Achievement for Excellence in Financial Reporting ................................................ vii Organization Chart ........................................................................................................................ viii List of Principal Officials ................................................................................................................ ix
FINANCIAL SECTION Independent Auditor=s Report ........................................................................................................... 1 Management=s Discussion and Analysis ........................................................................................... 3 Basic Financial Statements: Government-wide Financial Statements: Statement of Net Assets ........................................................................................................... 12 Statement of Activities ............................................................................................................ 13 Fund Financial Statements: Balance Sheet - Governmental Funds ...................................................................................... 15 Statement of Revenues, Expenditures and Changes in Fund Balances - Governmental Funds .......................................................................................... 16 Reconciliation of the Statement of Revenues, Expenditures and Changes in Fund Balances of Governmental Funds to the Statement of Activities ............................ 17 Statement of Net Assets - Proprietary Funds ........................................................................... 18 Statement of Revenues, Expenses and Changes in Net Assets - Proprietary Funds ................ 20 Statement of Cash Flows - Proprietary Funds .......................................................................... 21 Statement of Fiduciary Net Assets - Fiduciary Funds .............................................................. 23 Statement of Changes in Fiduciary Net Assets - Fiduciary Funds ........................................... 24 Notes to the Financial Statements ................................................................................................ 25
Required Supplementary Information: Schedule of Revenue, Expenditures and Changes in Fund Balance - Budget and Actual - General Fund................................................................................................... 65
Other Postemployment Benefits Plan – Schedule of Funding Progress ................................... 66
Combining and Individual Fund Statements and Schedules: Combining Balance Sheet - Nonmajor Governmental Funds ...................................................... 67 Combining Statement of Revenues, Expenditures and Changes in Fund Balances - Nonmajor Governmental Funds ............................................................................. 72 Budgetary Comparison Schedule - Nonmajor Budgeted Governmental Funds ........................... 77 Schedule of Revenues and Other Financing Sources - Budget and Actual - General Fund ......... 82 Schedule of Expenditures - Budget and Actual - General Fund .................................................. 84 Schedule of Revenue, Expenditures and Changes in Fund Balance - Budget And Actual - Debt Service Fund .............................................................................................. 86 Schedule of Revenue, Expenditures and Changes in Fund Balance - Budget And Actual - TID #3 Downtown Development Fund ............................................................... 87 Schedule of Revenue, Expenditures and Changes in Fund Balance - Budget And Actual - Capital Improvements Fund ................................................................................ 88 Combining Statement of Net Assets – Internal Service Funds ....................................................... 89 Combining Statement of Revenues, Expenses and Changes in Fund Net Assets – Internal Service Funds ................................................................................................ 90
iii
TABLE OF CONTENTS (Continued)
FINANCIAL SECTION (Continued) PAGE
Combining Statement of Cash Flows – Internal Service Funds ...................................................... 91 Combining Statement of Fiduciary Net Assets - Agency Funds ..................................................... 92 Combining Statement of Changes in Assets and Liabilities - Agency Funds ................................. 93 Capital Assets Used in the Operation of Governmental Funds: Schedule by Function and Activity .......................................................................................... 94
Schedule of Changes by Function and Activity ....................................................................... 95 STATISTICAL SECTION Index to the Statistical Section ........................................................................................................ 96
Schedules: 1 Net Assets by Component Last Eight Fiscal Years............................................... 97
2 Changes in Net Assets Last Eight Fiscal Years .................................................... 98 3 Program Revenues by Function/Program Last Eight Fiscal Years ..................... 100 4 Fund Balances – Governmental Funds ............................................................... 101 5 Changes in Fund Balances – Governmental Funds ............................................ 102 6 Assessed Value and Estimated Actual Value (Equalized Value) of Taxable Property ....................................................................................... 104 7 Property Tax Rates – Direct and Overlapping Governments Last Ten Fiscal Years .................................................................................... 105 8 Principal Taxpayers, Current Year and Nine Years Prior ................................... 107 9 Property Tax Levies and Collections Last Ten Fiscal Years .............................. 108 10 Direct and Overlapping Sales Tax Rates Last Ten Fiscal Years ......................... 109 11 Outstanding Debt by Type Last Ten Fiscal Years .............................................. 110 12 General Obligation Debt Last Ten Fiscal Years ................................................. 111 13 Computation of Direct and Overlapping General Obligation Debt .................... 112 14 Legal Debt Margin Calculation .......................................................................... 113 15 Mortgage Revenue Bond Coverage Last Ten Fiscal Years ................................ 114 16 Demographic Statistics Last Ten Fiscal Years .................................................... 116 17 Principal Employers Current Year and Nine Years Prior ................................... 117 18 Budgeted Full-Time Equivalent Personnel Positions Last Ten Fiscal Years ...... 118 19 Operating Indicators by Function/Program ......................................................... 119 20 Capital Asset Statistics by Function/Program ..................................................... 120

INTRODUCTORY SECTION
iv
June 10, 2011 To the Honorable Mayor, Members of the Common Council, and Citizens of the City of Wausau: The Comprehensive Annual Financial Report of the City of Wausau for the fiscal year ended December 31, 2010 is hereby submitted. Management Representations Responsibility for both the accuracy of the data and the completeness and fairness of the presentation, including disclosures, rests with the City. To the best of our knowledge and belief, the enclosed data is accurate in all material respects and is reported in a manner designed to present fairly the financial position and results of operations of the City. In addition, we are not aware of any financial policies that had a significant impact on the current year’s financial statements. All disclosures necessary to enable the reader to gain an understanding of the City’s financial activities have been included. The Reporting Entity The City of Wausau provides a full range of municipal services, including police, fire protection, paramedic, sanitation, water and wastewater, recreation, public works, and administrative support services. In addition, the City facilitates economic and neighborhood development. These services are funded from various sources which include: property taxes, room tax, cable franchise fee, grants, user fees, and revenues from municipally owned utilities. These activities are under the direct oversight responsibility of the Mayor and constitute the primary governmental functions of the City of Wausau. In addition, the City of Wausau is also financially accountable for a legally separate Community Development Authority, which is reported separately as a discretely presented component unit, within the City of Wausau’s financial statements. Profile of the Government The City of Wausau was incorporated as a city on April 2, 1872. The City is located in north central Wisconsin, approximately 185 miles northwest of Milwaukee, Wisconsin and 175 miles east of Minneapolis/St. Paul, Minnesota. Wausau is the county seat of Marathon County, which is Wisconsin’s largest county, covering 1,584 square miles. The City of Wausau covers 18.27 square miles with approximately 239.0 miles of streets. County population per the 2000 census was 125,834 which includes the City’s census population of 38,936. The City operates under the mayoral form of government. Policy making and legislative authority are vested in a governing council consisting of twelve alderpersons, elected by district, who serve two-year terms. The elected mayor serves a four-year term. Financial Information Management of the City is responsible for establishing and maintaining an internal control structure designed to ensure that the assets of the City are protected from loss, theft or misuse and to ensure that adequate accounting data are compiled to allow for the preparation of financial statements in conformity with General Accepted Accounting Principles. The internal control structure is designed to provide reasonable, but not absolute, assurance that these objectives are met. The concept of reasonable assurance recognizes that: (1) the cost of a control should not exceed the benefits likely to be derived, and (2) the valuation of costs and benefits requires estimates and judgments by management. Budgetary Controls The annual budget serves as the foundation for the City of Wausau’s financial planning and control. Activities of the general fund, certain special revenue funds, debt service fund, capital projects funds and proprietary funds (exclusive of the discretely presented component unit) are included in the City’s annual budget. City departments submit their annual budget requests for the ensuing year to the Mayor.
v
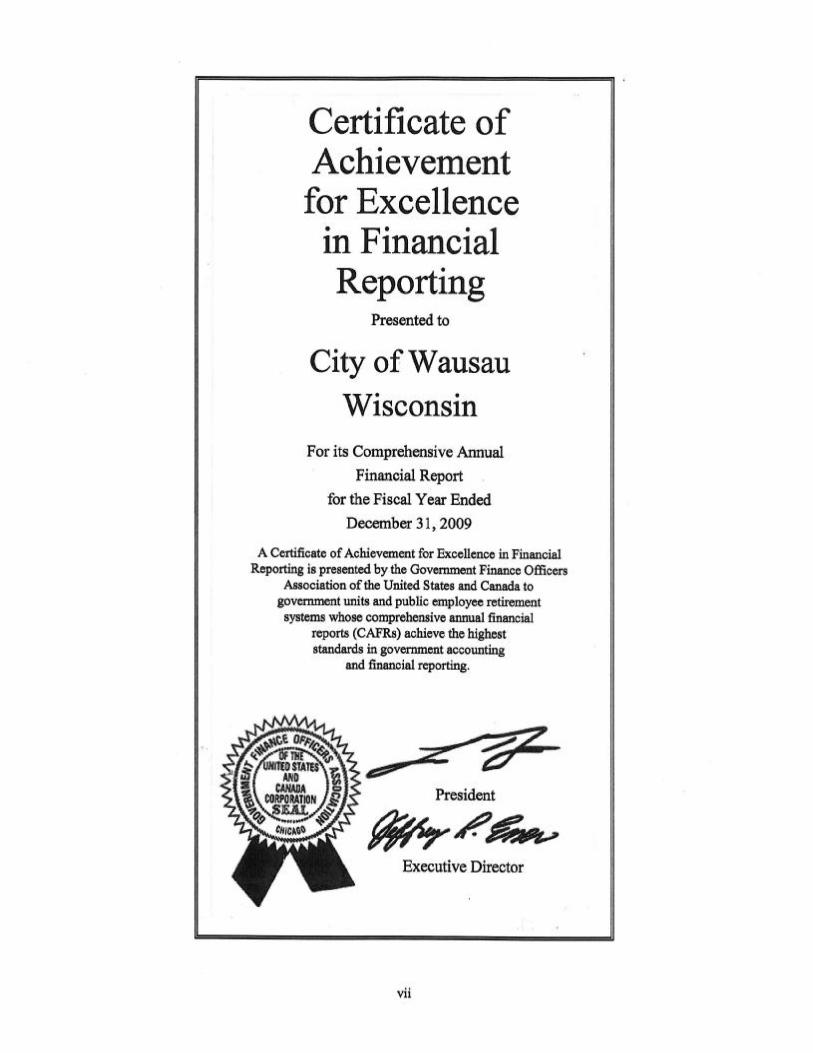
After all requests have been reviewed, services prioritized and available resources evaluated, the Mayor submits the budget to the Finance Committee for review and recommendation to the Common Council. After conducting a public hearing of the budget, the Common Council adopts the budget no later than the fourth Tuesday in November. The budget as adopted includes total expenditures at the cost center level. A cost center can be a fund, department, program or other activity for which control of expenditures is considered desirable. Cost centers are defined as follows: General Fund at department level, Special Revenue and Capital Projects at program level and Debt Service at total fund level. Expenditures cannot legally exceed appropriations at this level. The City’s Finance Director and Mayor may authorize transfers of budgeted amounts within expenditures of a cost center up to $2,500 for the General Fund and Special Revenue Funds and up to $20,000 for the Capital Projects Funds. Transfers of all other appropriations require two-thirds (2/3) Common Council approval to amend the budget. The budget represents a multi-year strategy including a two year operating plan and a five year capital plan. The information presented in the financial statements is perhaps best understood when it is considered from the broader perspective of the specific environment within which the City of Wausau operates. Economic Condition and Outlook/Major Initiatives Wausau is a significant regional center for the insurance industry, paper manufacturing, medical facilities, and home construction industry. In the past few years the City of Wausau and the surrounding area within the County have become appreciated as a travel/tourist destination. The area is ranked 11th in the state for traveler tourism spending. The Wisconsin Trails Magazine recently rated Wausau second in the state to live in for quality of life and outdoor activity options. The City has been fortunate that commercial and residential development continue to show signs of improvement. There are currently two residential developments underway in the downtown area. The first entails the redevelopment of the historic Federal Building. Upon completion, this building will contain 21 artist style loft apartments. North of the central business district an apartment complex containing 40 units is also under construction. Recent commercial developments include about $8.2 million in retail, $2.5 million in medical facilities and $2 million in banking. The total valuation construction for 2010 was $31,353,375 compared to $31,971,791 in the prior year. Independent Audit City policy is in accordance with state and federal requirements to provide for an annual audit by independent certified public accountants. The accounting firm of Schenck SC was selected by the City. The independent auditors’ report is included in the Financial Section of this report. As part of the examination, the independent auditor is also issuing an internal control letter covering their review of the City’s system of internal control. Awards and Acknowledgements The Government Finance Officers Association of the United States and Canada (GFOA) awarded a Certificate of Achievement for Excellence in Financial Reporting to the City of Wausau for its comprehensive annual financial report (CAFR) for the fiscal year ended December 31, 2009. The Certificate of Achievement is a prestigious national award recognizing the conformance with the highest standards for preparation of the state and local government financial reports. In order to be awarded a Certificate of Achievement, a government unit must publish an easily readable and efficiently organized comprehensive annual financial report, whose contents conform to program standards. The CAFR must satisfy both generally accepted accounting principles and applicable legal requirements. A Certificate of Achievement is valid for a period of one year only. This is the tenth year the City has received a Certificate of Achievement. We believe our current report continues to conform to the Certificate of Achievement program requirements and will submit this report to the GFOA.
viii
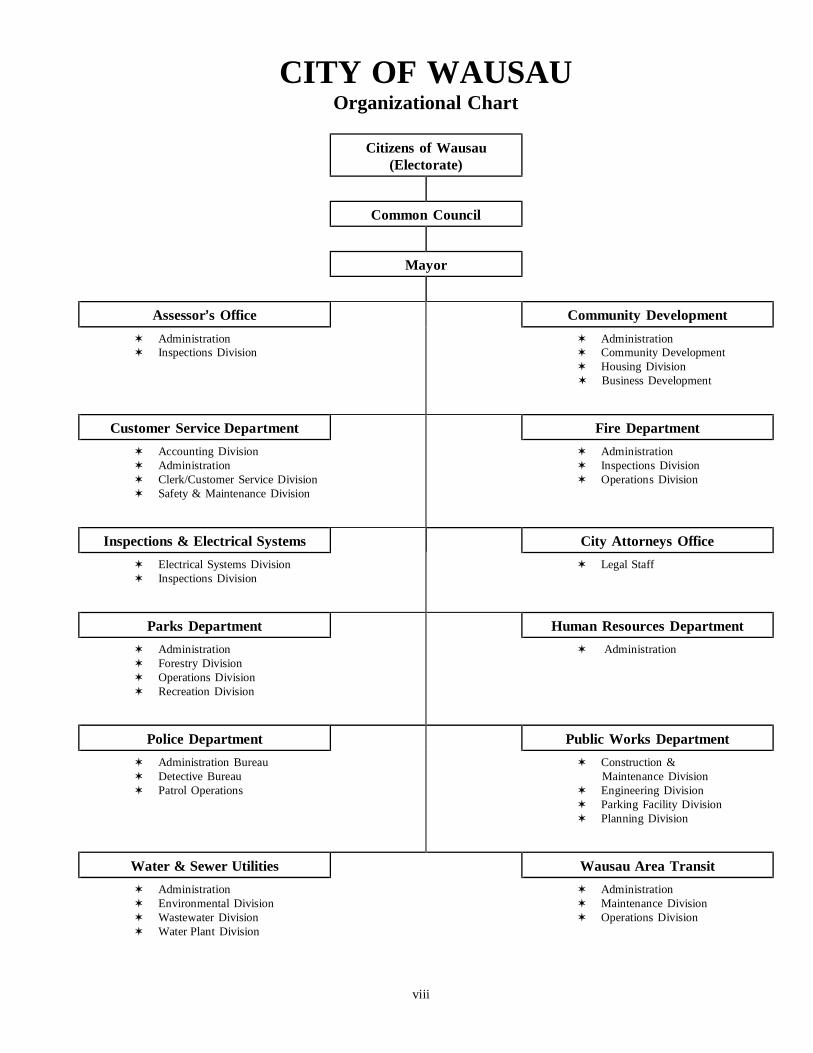
CITY OF WAUSAU
Organizational Chart
Citizens of Wausau
(Electorate)
Common Council
Mayor
Assessor=s Office
Community Development
w Administration w Inspections Division
w Administration w Community Development w Housing Division
w Business Development
Customer Service Department
Fire Department
w Accounting Division w Administration w Clerk/Customer Service Division w Safety & Maintenance Division
w Administration w Inspections Division w Operations Division
Inspections & Electrical Systems
City Attorneys Office
w Electrical Systems Division w Inspections Division
w Legal Staff
Parks Department
Human Resources Department
w Administration w Forestry Division w Operations Division w Recreation Division
w Administration
Police Department
Public Works Department
w Administration Bureau w Detective Bureau w Patrol Operations
w Construction &
Maintenance Division w Engineering Division w Parking Facility Division w Planning Division
Water & Sewer Utilities
Wausau Area Transit
w Administration w Environmental Division w Wastewater Division w Water Plant Division
w Administration w Maintenance Division w Operations Division
ix
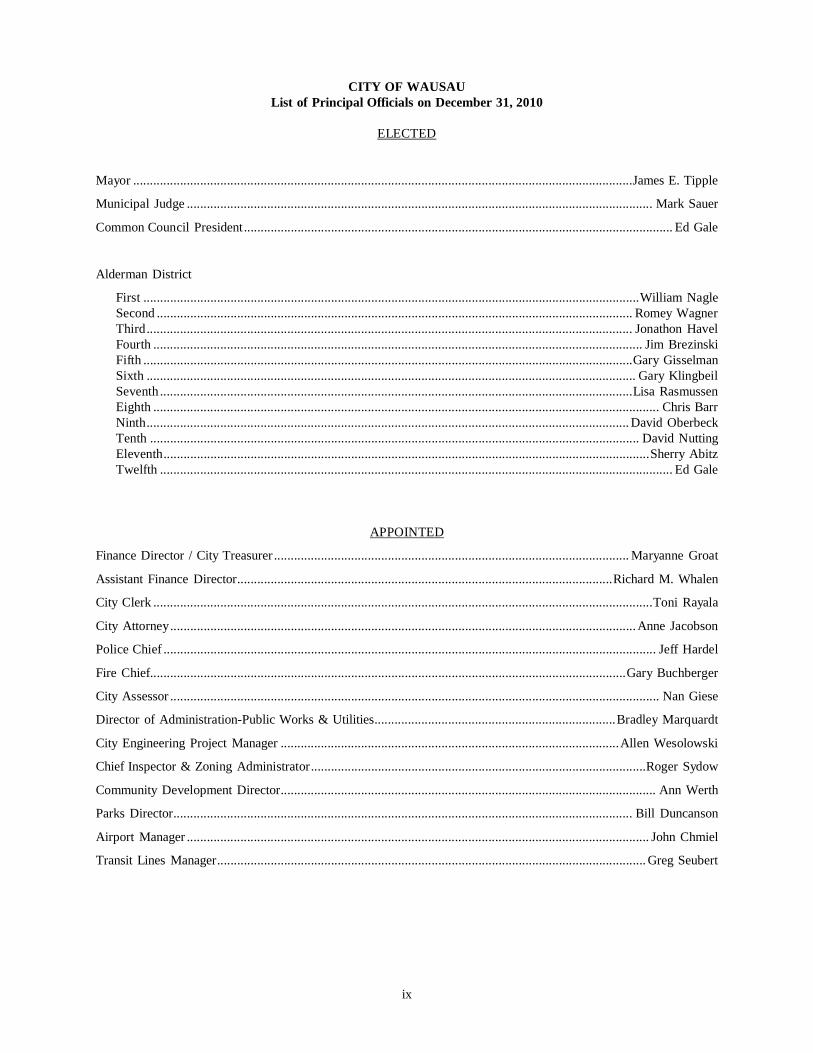
CITY OF WAUSAU List of Principal Officials on December 31, 2010 ELECTED
Mayor ..................................................................................................................................................... James E. Tipple
Municipal Judge ........................................................................................................................................... Mark Sauer
Common Council President ................................................................................................................................ Ed Gale
Alderman District
First .................................................................................................................................................... William Nagle Second .............................................................................................................................................. Romey Wagner Third ................................................................................................................................................. Jonathon Havel Fourth .................................................................................................................................................. Jim Brezinski Fifth .................................................................................................................................................. Gary Gisselman Sixth .................................................................................................................................................. Gary Klingbeil Seventh ............................................................................................................................................. Lisa Rasmussen Eighth ....................................................................................................................................................... Chris Barr Ninth ................................................................................................................................................ David Oberbeck Tenth .................................................................................................................................................. David Nutting Eleventh ................................................................................................................................................. Sherry Abitz Twelfth ......................................................................................................................................................... Ed Gale
APPOINTED
Finance Director / City Treasurer .......................................................................................................... Maryanne Groat
Assistant Finance Director ................................................................................................................ Richard M. Whalen
City Clerk ..................................................................................................................................................... Toni Rayala
City Attorney ........................................................................................................................................... Anne Jacobson
Police Chief ................................................................................................................................................... Jeff Hardel
Fire Chief .............................................................................................................................................. Gary Buchberger
City Assessor .................................................................................................................................................. Nan Giese
Director of Administration-Public Works & Utilities ........................................................................ Bradley Marquardt
City Engineering Project Manager ..................................................................................................... Allen Wesolowski
Chief Inspector & Zoning Administrator ....................................................................................................Roger Sydow
Community Development Director ................................................................................................................ Ann Werth
Parks Director ......................................................................................................................................... Bill Duncanson
Airport Manager .......................................................................................................................................... John Chmiel
Transit Lines Manager ................................................................................................................................ Greg Seubert

FINANCIAL SECTION
3
CITY OF WAUSAU, WISCONSIN MANAGEMENT’S DISCUSSION AND ANALYSIS
The City of Wausau (City) presents the following discussion and analysis of the City’s financial performance during the fiscal year ended December 31, 2010. This discussion and analysis is intended to assist readers in focusing on significant financial issues, changes in the City’s financial position, and identifying any significant variances from the adopted budget. We encourage readers to consider the information presented here in conjunction with additional information that we have furnished in our letter of transmittal and the financial statements provided in this report.
FINANCIAL HIGHLIGHTS • The assets of the City exceeded its liabilities at the close of the most recent fiscal year by $185,762,637.
• The City’s total net assets increased by $11,614,514.
• As of the end of the current fiscal year, the City’s governmental funds reported combined ending fund
balances of $19,480,679, an increase of $1,188,233 from the prior year. The total unreserved fund balance of $14,622,755 is available for spending at the City’s discretion.
• At the end of the current fiscal year, unreserved fund balance for the general fund was $7,059,133, or 24.21%
of expenditures. Of this amount, $1,513,496 is designated and $5,545,637 is undesignated. The General Fund is in compliance with the City’s fund balance policy at December 31, 2010.
• The City of Wausau’s total general obligation debt decreased $2,579,398, or 4.93%. The majority of this total
is related to a decrease in debt issued for capital improvement purposes throughout the City and within the City’s tax incremental financing districts.
OVERVIEW OF THE FINANCIAL STATEMENTS
This discussion and analysis is intended to serve as an introduction to the City’s basic financial statements. The City’s basic financial statements are comprised of three components: 1) government-wide financial statements, 2) fund financial statements and 3) notes to the financial statements. This report also contains other supplementary information in addition to the basic financial statements themselves.
Government-Wide Statements
The government-wide financial statements are designed to provide readers with a broad overview of the City’s finances, in a manner similar to a private-sector business.
The Statement of Net Assets presents information on all of the City’s assets and liabilities, with the difference between the two reported as net assets. Over time, increases or decreases in net assets may serve as a useful indicator of whether the financial position of the City is improving or deteriorating. To assess the overall health of the City you need to consider additional non-financial factors, such as changes in the City’s property tax base and the condition of the City’s infrastructure.
The Statement of Activities presents information showing how the City’s net assets changed during the fiscal year. All changes in net assets are reported when the underlying event giving rise to the change occurs, regardless of the timing of the related cash flows. Thus, revenues and expenses are reported in this statement for some items that will only result in cash flows in the future fiscal periods (examples include: uncollected taxes and earned but unused compensated absences.) An important purpose of the design of the Statement of Activities is to show the financial reliance of the City’s distinct activities or functions on revenues provided by the City’s taxpayers.
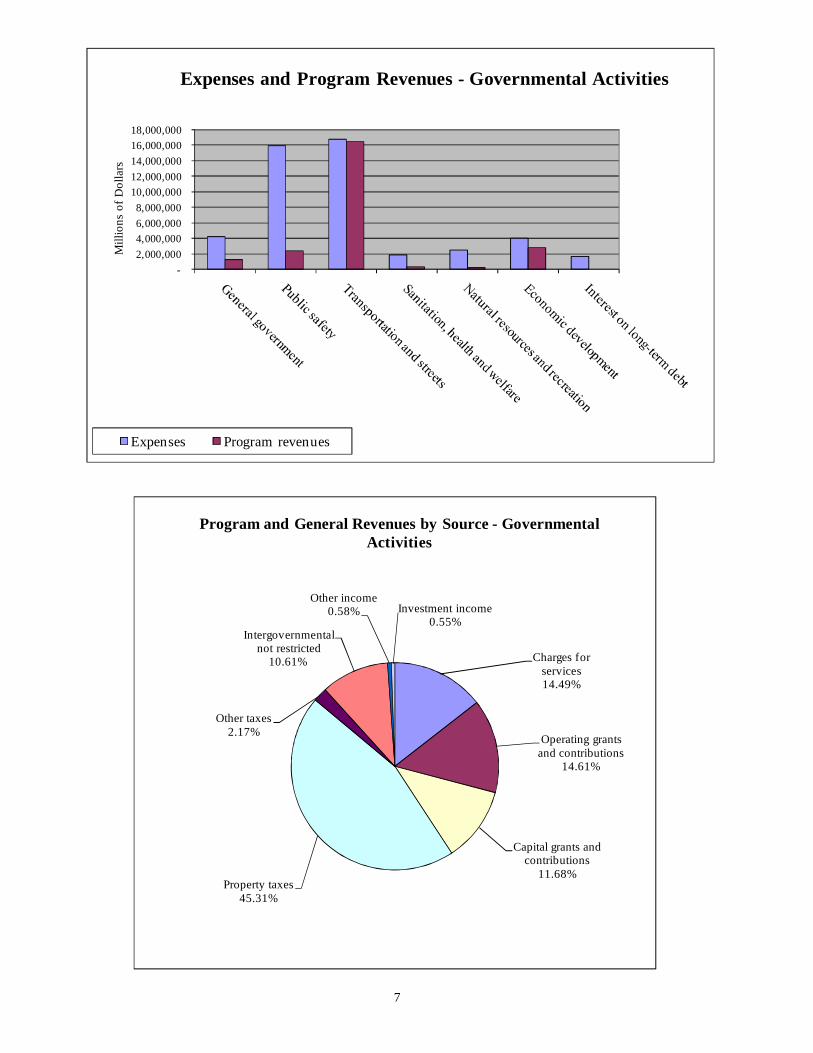
Both of the government-wide financial statements distinguish functions of the City that are principally supported by taxes and intergovernmental revenues (governmental activities) from functions that are intended to recover all or a significant portion of their costs through user fees and charges (business-type activities). The governmental activities of the City include general government, public safety, transportation and streets, sanitation health and welfare, natural resources and recreation, and economic development. Business-type activities include: water, wastewater and parking utilities.
4
The City’s financial reporting includes the funds of the City (primary government) but also a legally separate Community Development Authority for which the City of Wausau is financially accountable. Financial information for this component unit is reported separately from the financial information presented for the primary government itself. The government-wide financial statements are presented on pages 12-14 of this report. Fund Financial Statements The accounts of the City are organized on the basis of funds, each of which is considered a separate accounting entity. Government resources are allocated to and accounted for in individual funds based upon the purposes for which they are to be spent and the means by which spending activities are controlled. Fund accounting is also used to ensure and demonstrate compliance with finance related legal requirements placed on resources. Fund financial statements are used to present financial information detailing resources that have been identified for specific activities. Within the basic financial statements, fund financial statements focus on the City’s most significant funds rather than the City as a whole. Major funds are reported separately, while all others are combined into a single, aggregate presentation. Individual fund data for non-major funds is provided in the form of combining statements in the supplementary statements. The City has three kinds of funds: Governmental Funds are reported in the fund financial statements and encompass essentially the same functions reported as governmental activities in the government-wide financial statements. However, unlike the government-wide statement, governmental fund financial statements focus on the near-term inflows and outflows of spendable resources, as well as on balances of spendable resources available at the end of the fiscal year. Such information may be useful in evaluating annual financing requirements of government programs and the commitment of spendable resources for the near-term. Since the government-wide focus includes the long-term view, comparisons between these two perspectives may provide insight into the long-term impact of short-term financing decisions. Both the governmental fund balance sheet and the governmental fund statement of revenues, expenditures, and changes in fund balances provide a reconciliation to assist in understanding the differences between these two perspectives. The City of Wausau maintains twenty-three individual governmental funds. Information is presented separately in the governmental fund balance sheet and in the governmental fund statement of revenues, expenditures, and changes in fund balances for the General Fund, the Debt Service Fund, TID #3 Downtown Development Fund and the Capital Improvements Fund, all of which are considered to be major funds. Data for the other nineteen governmental funds is combined into a single, aggregated presentation. Individual fund data for each of these nonmajor governmental funds is provided in the form of combining statements elsewhere in the supplementary statements. Budgetary comparison information for the general fund is included in the required supplementary information. This statement demonstrates compliance with the City’s adopted and final revised budget. The basic governmental fund financial statements are presented on pages 15-17 of this report. Proprietary Funds are reported in the fund financial statements and generally report services for which the City charges customers a fee. The City maintains two types of proprietary funds. Enterprise funds are used to report the functions presented in business-type activities in the government-wide financial statements. Services are provided to customers external to the City organization and include the water, wastewater and parking funds. The City’s internal service funds, the Motor Pool and Insurance Funds, are used to accumulate and allocate costs internally among the City’s various functions. Because the City’s internal service funds primarily serve governmental functions, they have been included within the governmental activities of the government-wide financial statements. Proprietary fund financial statements provide separate and more detailed information for the water, wastewater and parking enterprise funds and the two internal service funds. Individual fund data for each of the internal service funds is provided in combining statements elsewhere in the supplementary statements. The basic proprietary fund financial statements can be found on pages 18-22 of this report.
5
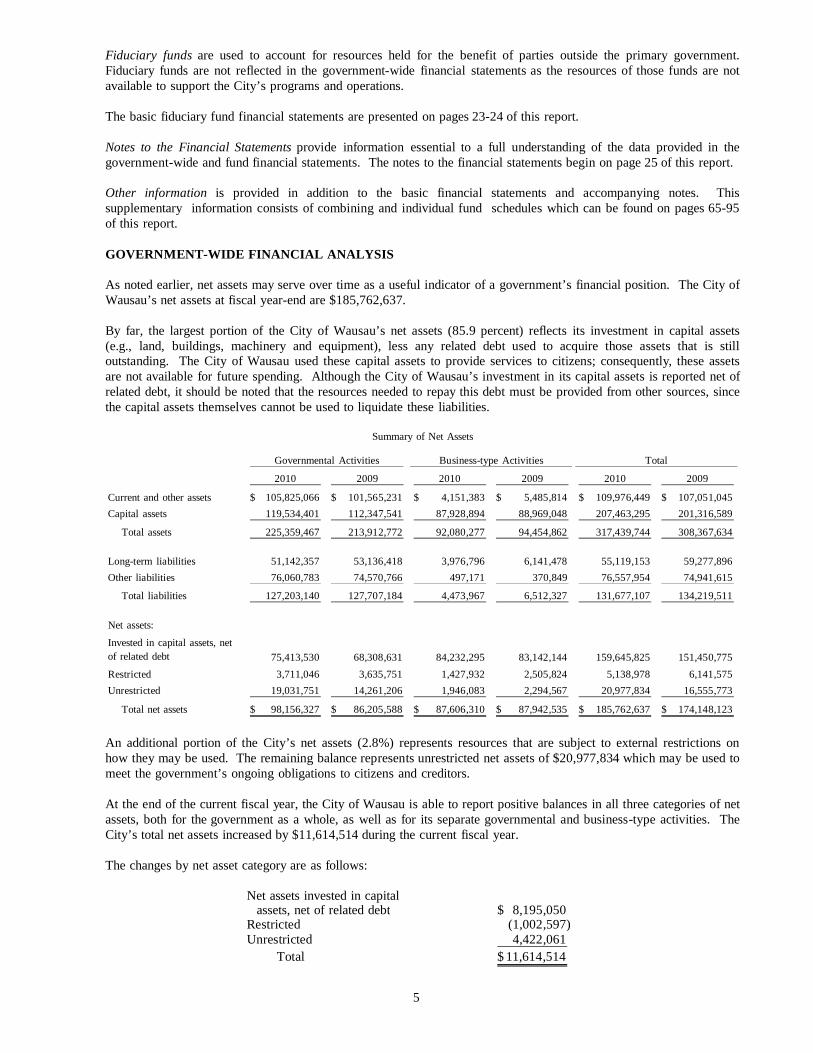
Fiduciary funds are used to account for resources held for the benefit of parties outside the primary government. Fiduciary funds are not reflected in the government-wide financial statements as the resources of those funds are not available to support the City’s programs and operations. The basic fiduciary fund financial statements are presented on pages 23-24 of this report. Notes to the Financial Statements provide information essential to a full understanding of the data provided in the government-wide and fund financial statements. The notes to the financial statements begin on page 25 of this report. Other information is provided in addition to the basic financial statements and accompanying notes. This supplementary information consists of combining and individual fund schedules which can be found on pages 65-95 of this report. GOVERNMENT-WIDE FINANCIAL ANALYSIS As noted earlier, net assets may serve over time as a useful indicator of a government’s financial position. The City of Wausau’s net assets at fiscal year-end are $185,762,637. By far, the largest portion of the City of Wausau’s net assets (85.9 percent) reflects its investment in capital assets (e.g., land, buildings, machinery and equipment), less any related debt used to acquire those assets that is still outstanding. The City of Wausau used these capital assets to provide services to citizens; consequently, these assets are not available for future spending. Although the City of Wausau’s investment in its capital assets is reported net of related debt, it should be noted that the resources needed to repay this debt must be provided from other sources, since the capital assets themselves cannot be used to liquidate these liabilities.
Summary of Net Assets
Governmental Activities Business-type Activities Total
2010 2009 2010 2009 2010 2009
Current and other assets 105,825,066$ 101,565,231$ 4,151,383$ 5,485,814$ 109,976,449$ 107,051,045$ Capital assets 119,534,401 112,347,541 87,928,894 88,969,048 207,463,295 201,316,589
Total assets 225,359,467 213,912,772 92,080,277 94,454,862 317,439,744 308,367,634
Long-term liabilities 51,142,357 53,136,418 3,976,796 6,141,478 55,119,153 59,277,896 Other liabilities 76,060,783 74,570,766 497,171 370,849 76,557,954 74,941,615
Total liabilities 127,203,140 127,707,184 4,473,967 6,512,327 131,677,107 134,219,511
Net assets:
Invested in capital assets, net of related debt 75,413,530 68,308,631 84,232,295 83,142,144 159,645,825 151,450,775 Restricted 3,711,046 3,635,751 1,427,932 2,505,824 5,138,978 6,141,575 Unrestricted 19,031,751 14,261,206 1,946,083 2,294,567 20,977,834 16,555,773
Total net assets 98,156,327$ 86,205,588$ 87,606,310$ 87,942,535$ 185,762,637$ 174,148,123$ An additional portion of the City’s net assets (2.8%) represents resources that are subject to external restrictions on how they may be used. The remaining balance represents unrestricted net assets of $20,977,834 which may be used to meet the government’s ongoing obligations to citizens and creditors. At the end of the current fiscal year, the City of Wausau is able to report positive balances in all three categories of net assets, both for the government as a whole, as well as for its separate governmental and business-type activities. The City’s total net assets increased by $11,614,514 during the current fiscal year. The changes by net asset category are as follows:
Net assets invested in capital assets, net of related debt 8,195,050$ Restricted (1,002,597) Unrestricted 4,422,061 Total 11,614,514$
6
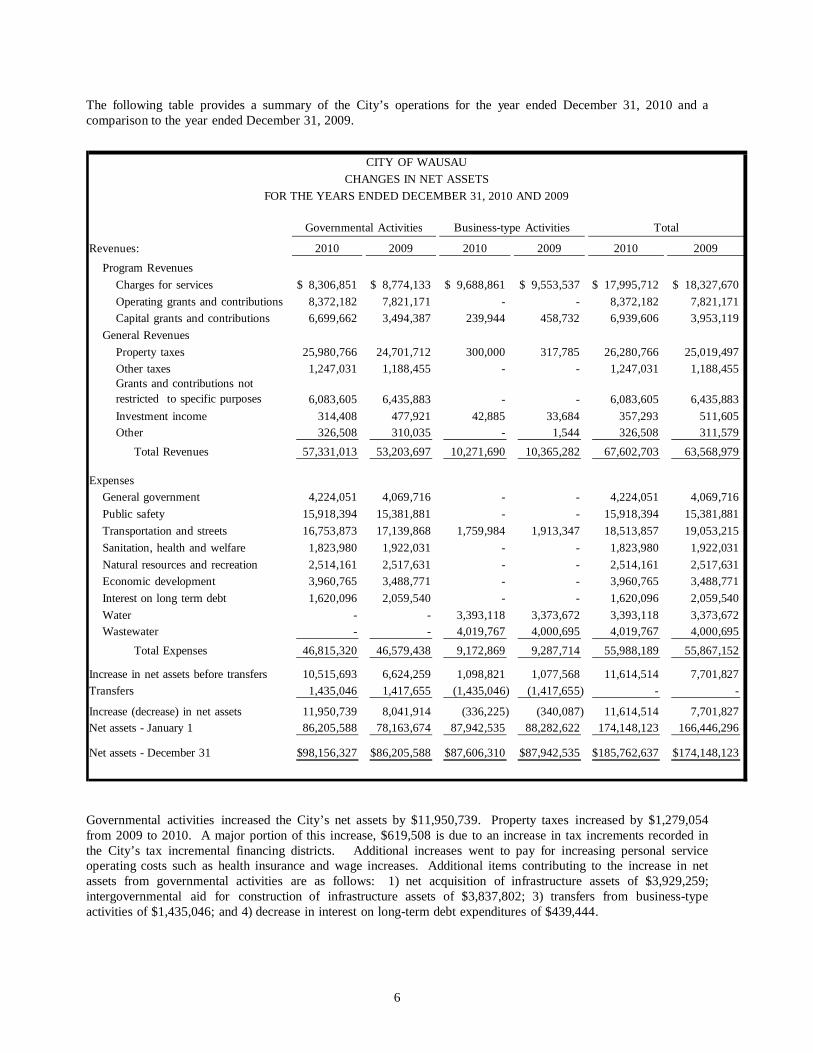
The following table provides a summary of the City’s operations for the year ended December 31, 2010 and a comparison to the year ended December 31, 2009.
CITY OF WAUSAUCHANGES IN NET ASSETS
FOR THE YEARS ENDED DECEMBER 31, 2010 AND 2009
Governmental Activities Business-type Activities Total
Revenues: 2010 2009 2010 2009 2010 2009
Program RevenuesCharges for services 8,306,851$ 8,774,133$ 9,688,861$ 9,553,537$ 17,995,712$ 18,327,670$ Operating grants and contributions 8,372,182 7,821,171 - - 8,372,182 7,821,171 Capital grants and contributions 6,699,662 3,494,387 239,944 458,732 6,939,606 3,953,119
General RevenuesProperty taxes 25,980,766 24,701,712 300,000 317,785 26,280,766 25,019,497 Other taxes 1,247,031 1,188,455 - - 1,247,031 1,188,455 Grants and contributions not restricted to specific purposes 6,083,605 6,435,883 - - 6,083,605 6,435,883 Investment income 314,408 477,921 42,885 33,684 357,293 511,605 Other 326,508 310,035 - 1,544 326,508 311,579 Total Revenues 57,331,013 53,203,697 10,271,690 10,365,282 67,602,703 63,568,979
ExpensesGeneral government 4,224,051 4,069,716 - - 4,224,051 4,069,716 Public safety 15,918,394 15,381,881 - - 15,918,394 15,381,881 Transportation and streets 16,753,873 17,139,868 1,759,984 1,913,347 18,513,857 19,053,215 Sanitation, health and welfare 1,823,980 1,922,031 - - 1,823,980 1,922,031 Natural resources and recreation 2,514,161 2,517,631 - - 2,514,161 2,517,631 Economic development 3,960,765 3,488,771 - - 3,960,765 3,488,771 Interest on long term debt 1,620,096 2,059,540 - - 1,620,096 2,059,540 Water - - 3,393,118 3,373,672 3,393,118 3,373,672 Wastewater - - 4,019,767 4,000,695 4,019,767 4,000,695
Total Expenses 46,815,320 46,579,438 9,172,869 9,287,714 55,988,189 55,867,152
Increase in net assets before transfers 10,515,693 6,624,259 1,098,821 1,077,568 11,614,514 7,701,827 Transfers 1,435,046 1,417,655 (1,435,046) (1,417,655) - -
Increase (decrease) in net assets 11,950,739 8,041,914 (336,225) (340,087) 11,614,514 7,701,827 Net assets - January 1 86,205,588 78,163,674 87,942,535 88,282,622 174,148,123 166,446,296
Net assets - December 31 98,156,327$ 86,205,588$ 87,606,310$ 87,942,535$ 185,762,637$ 174,148,123$
Governmental activities increased the City’s net assets by $11,950,739. Property taxes increased by $1,279,054 from 2009 to 2010. A major portion of this increase, $619,508 is due to an increase in tax increments recorded in the City’s tax incremental financing districts. Additional increases went to pay for increasing personal service operating costs such as health insurance and wage increases. Additional items contributing to the increase in net assets from governmental activities are as follows: 1) net acquisition of infrastructure assets of $3,929,259; intergovernmental aid for construction of infrastructure assets of $3,837,802; 3) transfers from business-type activities of $1,435,046; and 4) decrease in interest on long-term debt expenditures of $439,444.
7
-2,000,000 4,000,000 6,000,000 8,000,000
10,000,000 12,000,000 14,000,000 16,000,000 18,000,000
Mill
ions
of D
olla
rs
Expenses and Program Revenues - Governmental Activities
Expenses Program revenues
Charges for services14.49%
Operating grants and contributions
14.61%
Capital grants and contributions
11.68%Property taxes
45.31%
Other taxes2.17%
Intergovernmental not restricted
10.61%
Other income0.58% Investment income
0.55%
Program and General Revenues by Source - Governmental Activities
8
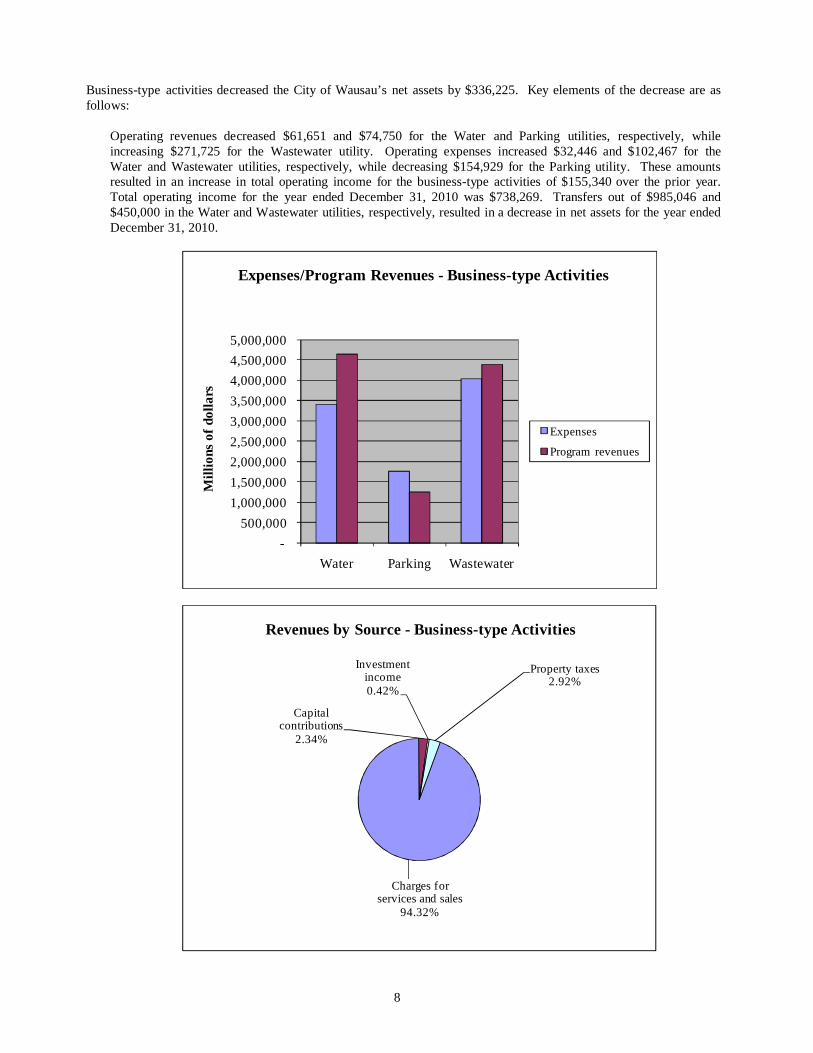
Business-type activities decreased the City of Wausau’s net assets by $336,225. Key elements of the decrease are as follows:
Operating revenues decreased $61,651 and $74,750 for the Water and Parking utilities, respectively, while increasing $271,725 for the Wastewater utility. Operating expenses increased $32,446 and $102,467 for the Water and Wastewater utilities, respectively, while decreasing $154,929 for the Parking utility. These amounts resulted in an increase in total operating income for the business-type activities of $155,340 over the prior year. Total operating income for the year ended December 31, 2010 was $738,269. Transfers out of $985,046 and $450,000 in the Water and Wastewater utilities, respectively, resulted in a decrease in net assets for the year ended December 31, 2010.
-500,000
1,000,000 1,500,000 2,000,000 2,500,000 3,000,000 3,500,000 4,000,000 4,500,000 5,000,000
Water Parking Wastewater
Mill
ions
of d
olla
rs
Expenses/Program Revenues - Business-type Activities
Expenses
Program revenues
Charges for services and sales
94.32%
Capital contributions
2.34%
Investment income0.42%
Property taxes2.92%
Revenues by Source - Business-type Activities
9
FINANCIAL ANALYSIS OF THE CITY’S FUNDS Governmental Funds As discussed, the focus of governmental funds is to provide information on near-term inflows, outflows, and balances of spendable resources. This information is useful in assessing resources available at the end of the year in comparison with upcoming financing requirements. In particular, unreserved fund balance may serve as a useful measure of a government’s net resources available for spending at the end of the fiscal year. At the end of the current fiscal year, the City of Wausau’s governmental funds reported combined ending fund balance of $19,480,679, an increase of $1,188,233 from the prior year. The total unreserved fund balance of $14,622,755 is available for spending at the City’s discretion. The remainder of the fund balance is reserved to indicate that it is not available for new spending because it has already been committed to: offset long term advances to other funds $1,839,138, offset inventories and prepayments $568,716, committed to service debt $1,818,620 and committed to trust purposes $631,450. Major Governmental Funds The General Fund is the City’s primary operating fund and the largest source of day-to-day service delivery. The fund balance of the General Fund decreased $62,641 to $9,262,995. This is a planned decrease as the City has been annually applying available fund balance to reduce the amount of taxes levied for general operations. The decrease in fund balance was $917,359 less than anticipated in the final budget. General operations have not had a significant negative impact on the undesignated fund balance, which was $5,545,637 at year-end. Undesignated fund balance decreased by $503,304 from 2009, the majority of which was due to an increase in the reserve for advances to other funds of $375,233. As a measure of the General Fund’s liquidity, it may be useful to compare both unreserved fund balance and total fund balance to total fund expenditures. Unreserved fund balances represents 24.21 percent of general fund expenditures, while total fund balance represents 31.77 percent of the same amount. The Debt Service fund balance of $57,045 at year end represents a $35,434 decrease in fund balance from the previous year. This available balance will be utilized in subsequent years’ budgets. TID #3 Downtown Development fund balance of $1,312,643 has been generated through subsidies from other tax increment districts and transfers from the General Fund. It is anticipated that these funds will be depleted as projects are completed. If revenues generated are sufficient to cover all expenditures, contributions from the General Fund will be returned. Capital Improvements fund balance of $4,211,788 represents unexpended capital projects in process. These projects will be completed in 2011. Proprietary Funds The proprietary fund statements share the same focus as the government-wide statements, reporting both short-term and long-term information about financial status. Factors concerning the finances of these funds have already been addressed in the discussion of the City of Wausau’s business-type activities. General Fund Budgetary Highlights
• General Fund expenditures were $1,765,200 under budget for the current fiscal year. Major cost savings occurred in the Police department, Ambulance, Roadways and streets, and Parks and recreation which were under budget by $180,145, $149,563, $396,828 and $146,439, respectively.
• General Fund revenues and other financing sources were less than budget expectations by $359,245. The
most significant positive budget variances occurred in taxes $131,691 and intergovernmental grants and aids of $179,116. These positive variances were offset by shortcomings in public charges for services $135,874, commercial revenues $225,129 and operating transfers of $379,954.
10
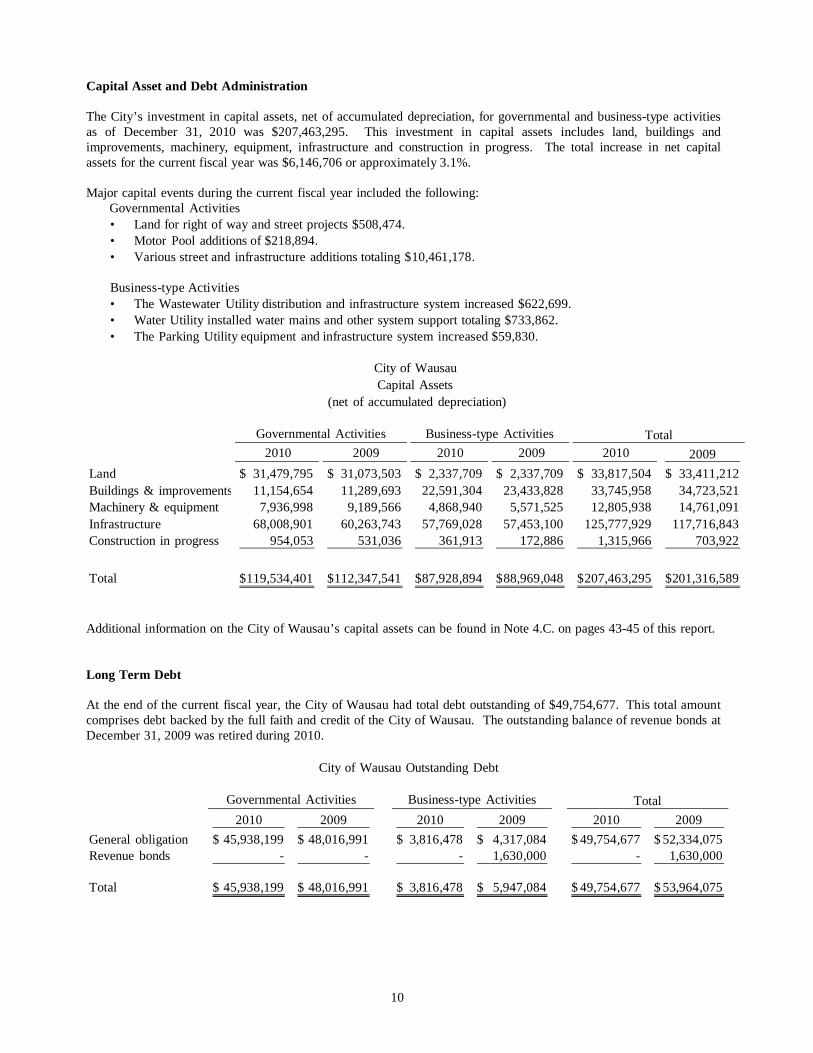
Capital Asset and Debt Administration The City’s investment in capital assets, net of accumulated depreciation, for governmental and business-type activities as of December 31, 2010 was $207,463,295. This investment in capital assets includes land, buildings and improvements, machinery, equipment, infrastructure and construction in progress. The total increase in net capital assets for the current fiscal year was $6,146,706 or approximately 3.1%. Major capital events during the current fiscal year included the following: Governmental Activities
• Land for right of way and street projects $508,474. • Motor Pool additions of $218,894. • Various street and infrastructure additions totaling $10,461,178. Business-type Activities • The Wastewater Utility distribution and infrastructure system increased $622,699. • Water Utility installed water mains and other system support totaling $733,862. • The Parking Utility equipment and infrastructure system increased $59,830.
City of Wausau Capital Assets
(net of accumulated depreciation)
Governmental Activities Business-type Activities Total 2010 2009 2010 2009 2010 2009
Land 31,479,795$ 31,073,503$ 2,337,709$ 2,337,709$ 33,817,504$ 33,411,212$ Buildings & improvements 11,154,654 11,289,693 22,591,304 23,433,828 33,745,958 34,723,521 Machinery & equipment 7,936,998 9,189,566 4,868,940 5,571,525 12,805,938 14,761,091 Infrastructure 68,008,901 60,263,743 57,769,028 57,453,100 125,777,929 117,716,843 Construction in progress 954,053 531,036 361,913 172,886 1,315,966 703,922
Total 119,534,401$ 112,347,541$ 87,928,894$ 88,969,048$ 207,463,295$ 201,316,589$ Additional information on the City of Wausau’s capital assets can be found in Note 4.C. on pages 43-45 of this report.
Long Term Debt At the end of the current fiscal year, the City of Wausau had total debt outstanding of $49,754,677. This total amount comprises debt backed by the full faith and credit of the City of Wausau. The outstanding balance of revenue bonds at December 31, 2009 was retired during 2010.
City of Wausau Outstanding Debt
Governmental Activities Business-type Activities Total2010 2009 2010 2009 2010 2009
General obligation 45,938,199$ 48,016,991$ 3,816,478$ 4,317,084$ 49,754,677$ 52,334,075$ Revenue bonds - - - 1,630,000 - 1,630,000
Total 45,938,199$ 48,016,991$ 3,816,478$ 5,947,084$ 49,754,677$ 53,964,075$
11
In 2010 the City issued debt as follows:
• 2010 Promissory Note Series A $5,145,000; this debt financed the City’s capital improvements as outlined by the Capital Improvement Plan adopted by the common council.
• 2010 Promissory Note Series B $3,145,000; this debt issue refunded $710,000 in outstanding principal of the Series 2003C note issue, $670,000 of the Series 2004B note issue and $1,777,740 of outstanding State trust fund loans.
The City received an Aa2 rating from Moody’s Investors Service for these general obligation issues. The City of Wausau Sewer System Refunding Revenue Bonds issued in 2001 received a Moody’s rating of A1. Additional information regarding the City of Wausau’s long-term debt can be found in Note 4.E. on pages 47-50 of this report. Economic Factors and the Next Year’s Budgets and Rates Wausau is characterized by a broad economic base of diverse industrial and commercial businesses. The area is a significant regional center for the insurance industry, paper manufacturing, medical facilities and home construction industry. The City actively uses tax increment financing to forward its development goals. Inflationary trends in the region compare favorably to national indices and equalized values have remained steady. These factors were considered in preparing the 2011 budget for the City of Wausau. At the end of the current fiscal year, unreserved – undesignated fund balance within the general fund was $5,545,637. The City of Wausau appropriated $854,496 of surplus for spending in the adopted 2011 budget. It is intended that this use of available fund balance will stabilize the tax rate during 2011. Requests for Information This financial report is designed to provide a general overview of the City of Wausau’s finances, comply with finance-related laws and regulations, and demonstrate the City’s commitment to public accountability. If you have questions about this report or would like to request additional information, contact the City’s Finance Department, at 407 Grant Street, Wausau, Wisconsin 54403 or by calling 715-261-6640.
BASIC FINANCIAL STATEMENTS
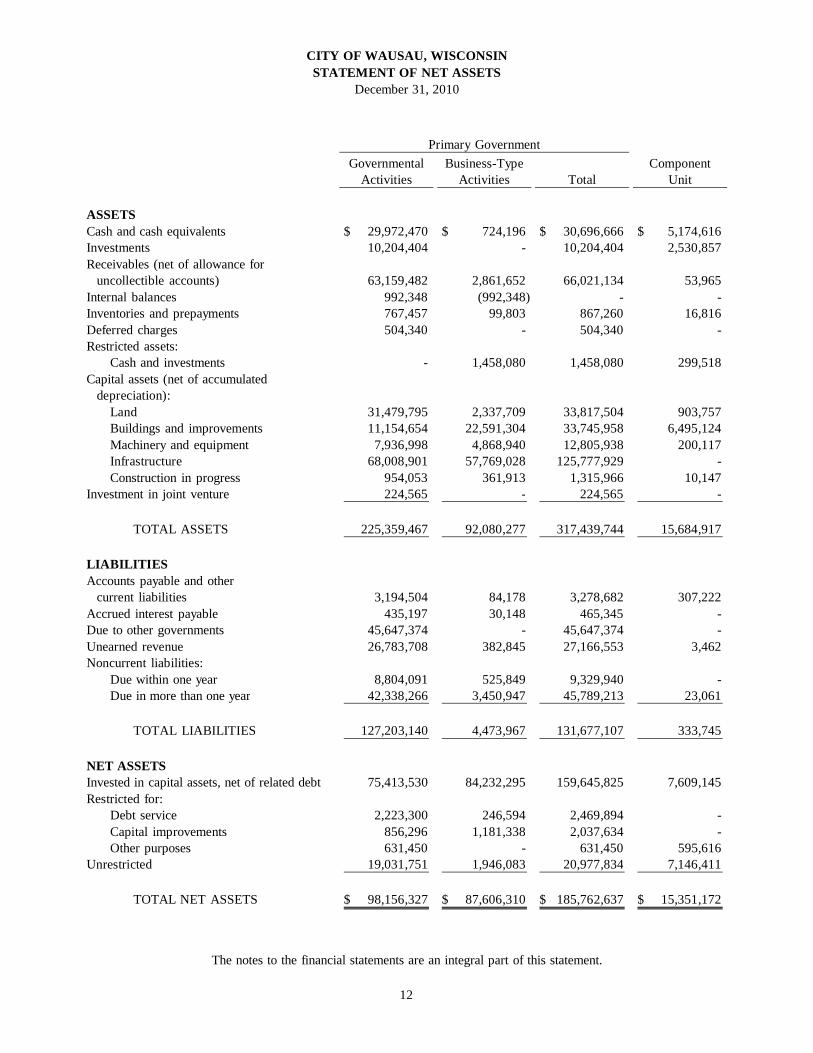
CITY OF WAUSAU, WISCONSINSTATEMENT OF NET ASSETS
December 31, 2010
Primary GovernmentGovernmental Business-Type Component
Activities Activities Total Unit
ASSETSCash and cash equivalents 29,972,470$ 724,196$ 30,696,666$ 5,174,616$ Investments 10,204,404 - 10,204,404 2,530,857 Receivables (net of allowance for uncollectible accounts) 63,159,482 2,861,652 66,021,134 53,965 Internal balances 992,348 (992,348) - - Inventories and prepayments 767,457 99,803 867,260 16,816 Deferred charges 504,340 - 504,340 - Restricted assets: Cash and investments - 1,458,080 1,458,080 299,518 Capital assets (net of accumulated depreciation): Land 31,479,795 2,337,709 33,817,504 903,757 Buildings and improvements 11,154,654 22,591,304 33,745,958 6,495,124 Machinery and equipment 7,936,998 4,868,940 12,805,938 200,117 Infrastructure 68,008,901 57,769,028 125,777,929 - Construction in progress 954,053 361,913 1,315,966 10,147 Investment in joint venture 224,565 - 224,565 -
TOTAL ASSETS 225,359,467 92,080,277 317,439,744 15,684,917
LIABILITIESAccounts payable and other current liabilities 3,194,504 84,178 3,278,682 307,222 Accrued interest payable 435,197 30,148 465,345 - Due to other governments 45,647,374 - 45,647,374 - Unearned revenue 26,783,708 382,845 27,166,553 3,462 Noncurrent liabilities: Due within one year 8,804,091 525,849 9,329,940 - Due in more than one year 42,338,266 3,450,947 45,789,213 23,061
TOTAL LIABILITIES 127,203,140 4,473,967 131,677,107 333,745
NET ASSETSInvested in capital assets, net of related debt 75,413,530 84,232,295 159,645,825 7,609,145 Restricted for: Debt service 2,223,300 246,594 2,469,894 - Capital improvements 856,296 1,181,338 2,037,634 - Other purposes 631,450 - 631,450 595,616 Unrestricted 19,031,751 1,946,083 20,977,834 7,146,411
TOTAL NET ASSETS 98,156,327$ 87,606,310$ 185,762,637$ 15,351,172$
The notes to the financial statements are an integral part of this statement.
12
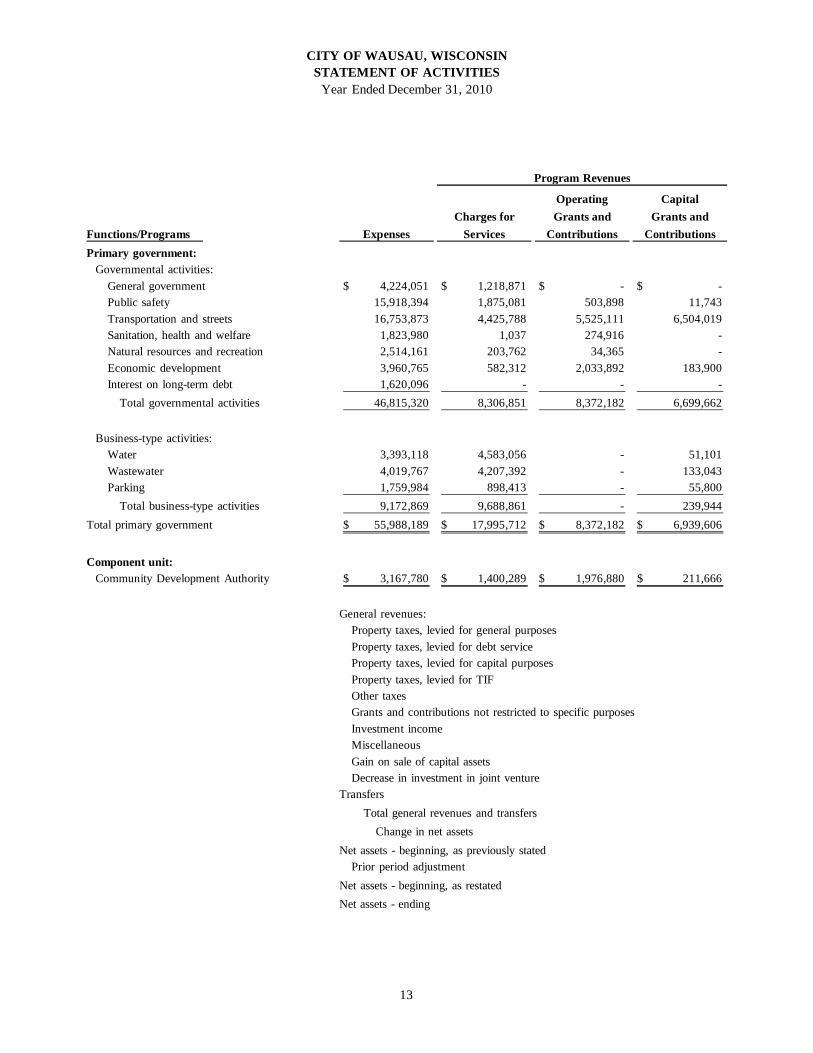
CITY OF WAUSAU, WISCONSINSTATEMENT OF ACTIVITIES
Year Ended December 31, 2010
Program Revenues
Operating CapitalCharges for Grants and Grants and
Functions/Programs Expenses Services Contributions ContributionsPrimary government: Governmental activities: General government 4,224,051$ 1,218,871$ -$ -$ Public safety 15,918,394 1,875,081 503,898 11,743 Transportation and streets 16,753,873 4,425,788 5,525,111 6,504,019 Sanitation, health and welfare 1,823,980 1,037 274,916 - Natural resources and recreation 2,514,161 203,762 34,365 - Economic development 3,960,765 582,312 2,033,892 183,900 Interest on long-term debt 1,620,096 - - - Total governmental activities 46,815,320 8,306,851 8,372,182 6,699,662
Business-type activities: Water 3,393,118 4,583,056 - 51,101 Wastewater 4,019,767 4,207,392 - 133,043 Parking 1,759,984 898,413 - 55,800 Total business-type activities 9,172,869 9,688,861 - 239,944 Total primary government 55,988,189$ 17,995,712$ 8,372,182$ 6,939,606$
Component unit: Community Development Authority 3,167,780$ 1,400,289$ 1,976,880$ 211,666$
General revenues: Property taxes, levied for general purposes Property taxes, levied for debt service Property taxes, levied for capital purposes Property taxes, levied for TIF Other taxes Grants and contributions not restricted to specific purposes Investment income Miscellaneous Gain on sale of capital assets Decrease in investment in joint ventureTransfers Total general revenues and transfers Change in net assetsNet assets - beginning, as previously stated Prior period adjustmentNet assets - beginning, as restatedNet assets - ending
13
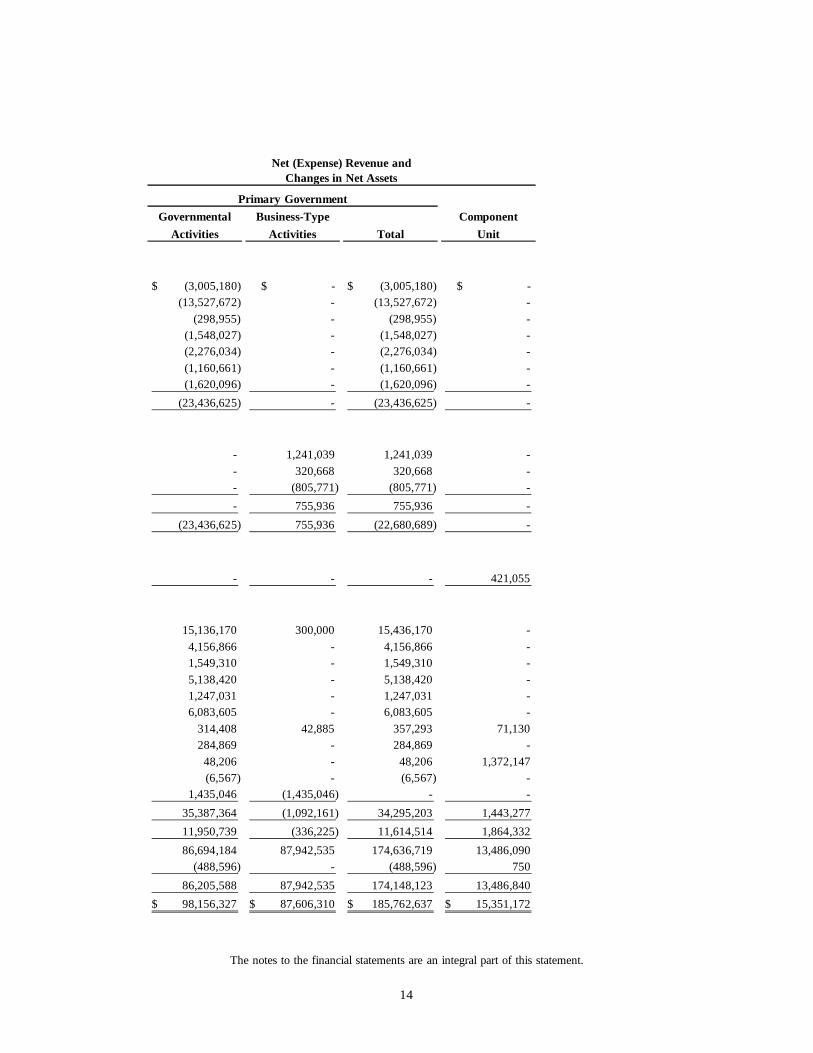
Net (Expense) Revenue andChanges in Net Assets
Primary GovernmentGovernmental Business-Type Component
Activities Activities Total Unit
(3,005,180)$ $ - (3,005,180)$ $ -(13,527,672) - (13,527,672) -
(298,955) - (298,955) -(1,548,027) - (1,548,027) -(2,276,034) - (2,276,034) -(1,160,661) - (1,160,661) -(1,620,096) - (1,620,096) -
(23,436,625) - (23,436,625) -
- 1,241,039 1,241,039 -- 320,668 320,668 - - (805,771) (805,771) -- 755,936 755,936 -
(23,436,625) 755,936 (22,680,689) -
- - - 421,055
15,136,170 300,000 15,436,170 -4,156,866 - 4,156,866 -1,549,310 - 1,549,310 -5,138,420 - 5,138,420 -1,247,031 - 1,247,031 -6,083,605 - 6,083,605 -
314,408 42,885 357,293 71,130 284,869 - 284,869 -
48,206 - 48,206 1,372,147 (6,567) - (6,567) -
1,435,046 (1,435,046) - -35,387,364 (1,092,161) 34,295,203 1,443,277 11,950,739 (336,225) 11,614,514 1,864,332 86,694,184 87,942,535 174,636,719 13,486,090
(488,596) - (488,596) 750 86,205,588 87,942,535 174,148,123 13,486,840 98,156,327$ 87,606,310$ 185,762,637$ 15,351,172$
The notes to the financial statements are an integral part of this statement.
14
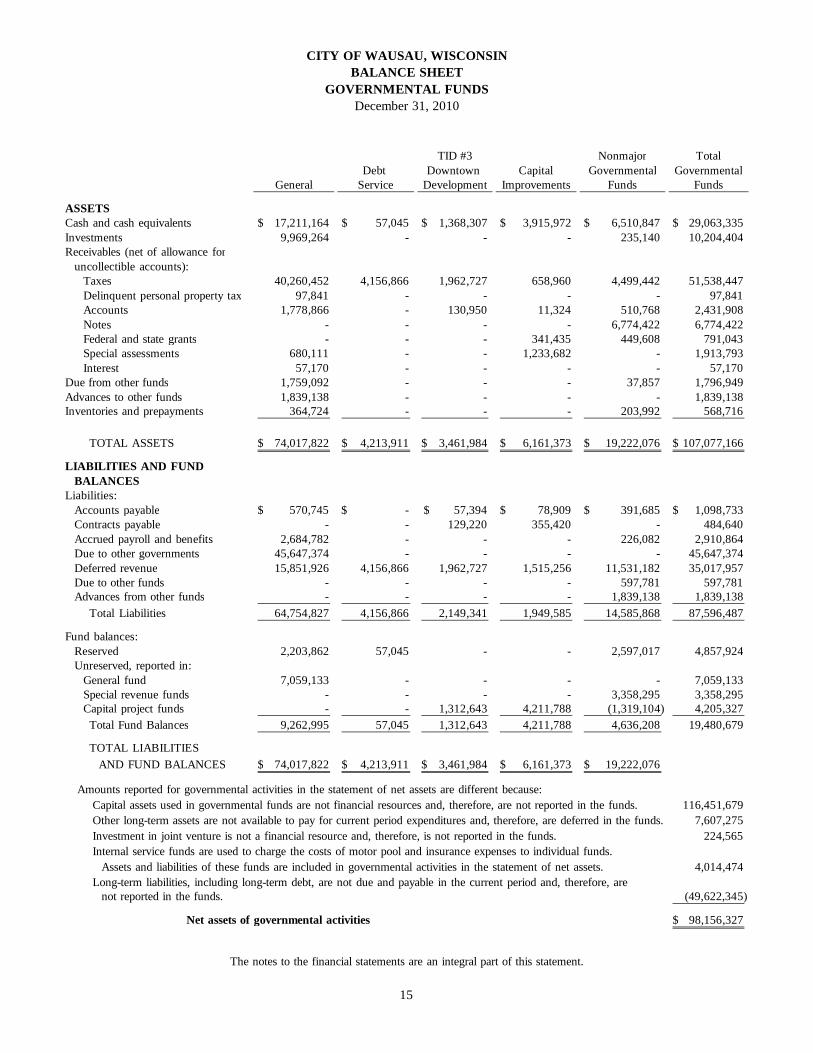
CITY OF WAUSAU, WISCONSINBALANCE SHEET
GOVERNMENTAL FUNDSDecember 31, 2010
TID #3 Nonmajor TotalDebt Downtown Capital Governmental Governmental
General Service Development Improvements Funds Funds
ASSETSCash and cash equivalents 17,211,164$ 57,045$ 1,368,307$ 3,915,972$ 6,510,847$ 29,063,335$ Investments 9,969,264 - - - 235,140 10,204,404 Receivables (net of allowance for uncollectible accounts): Taxes 40,260,452 4,156,866 1,962,727 658,960 4,499,442 51,538,447 Delinquent personal property tax 97,841 - - - - 97,841 Accounts 1,778,866 - 130,950 11,324 510,768 2,431,908 Notes - - - - 6,774,422 6,774,422 Federal and state grants - - - 341,435 449,608 791,043 Special assessments 680,111 - - 1,233,682 - 1,913,793 Interest 57,170 - - - - 57,170 Due from other funds 1,759,092 - - - 37,857 1,796,949 Advances to other funds 1,839,138 - - - - 1,839,138 Inventories and prepayments 364,724 - - - 203,992 568,716
TOTAL ASSETS 74,017,822$ 4,213,911$ 3,461,984$ 6,161,373$ 19,222,076$ 107,077,166$
LIABILITIES AND FUND BALANCESLiabilities: Accounts payable 570,745$ -$ 57,394$ 78,909$ 391,685$ 1,098,733$ Contracts payable - - 129,220 355,420 - 484,640 Accrued payroll and benefits 2,684,782 - - - 226,082 2,910,864 Due to other governments 45,647,374 - - - - 45,647,374 Deferred revenue 15,851,926 4,156,866 1,962,727 1,515,256 11,531,182 35,017,957 Due to other funds - - - - 597,781 597,781 Advances from other funds - - - - 1,839,138 1,839,138 Total Liabilities 64,754,827 4,156,866 2,149,341 1,949,585 14,585,868 87,596,487
Fund balances: Reserved 2,203,862 57,045 - - 2,597,017 4,857,924 Unreserved, reported in: General fund 7,059,133 - - - - 7,059,133 Special revenue funds - - - - 3,358,295 3,358,295 Capital project funds - - 1,312,643 4,211,788 (1,319,104) 4,205,327 Total Fund Balances 9,262,995 57,045 1,312,643 4,211,788 4,636,208 19,480,679
TOTAL LIABILITIES AND FUND BALANCES 74,017,822$ 4,213,911$ 3,461,984$ 6,161,373$ 19,222,076$
Amounts reported for governmental activities in the statement of net assets are different because: Capital assets used in governmental funds are not financial resources and, therefore, are not reported in the funds. 116,451,679 Other long-term assets are not available to pay for current period expenditures and, therefore, are deferred in the funds. 7,607,275 Investment in joint venture is not a financial resource and, therefore, is not reported in the funds. 224,565 Internal service funds are used to charge the costs of motor pool and insurance expenses to individual funds. Assets and liabilities of these funds are included in governmental activities in the statement of net assets. 4,014,474 Long-term liabilities, including long-term debt, are not due and payable in the current period and, therefore, are not reported in the funds. (49,622,345)
Net assets of governmental activities 98,156,327$
The notes to the financial statements are an integral part of this statement.
15
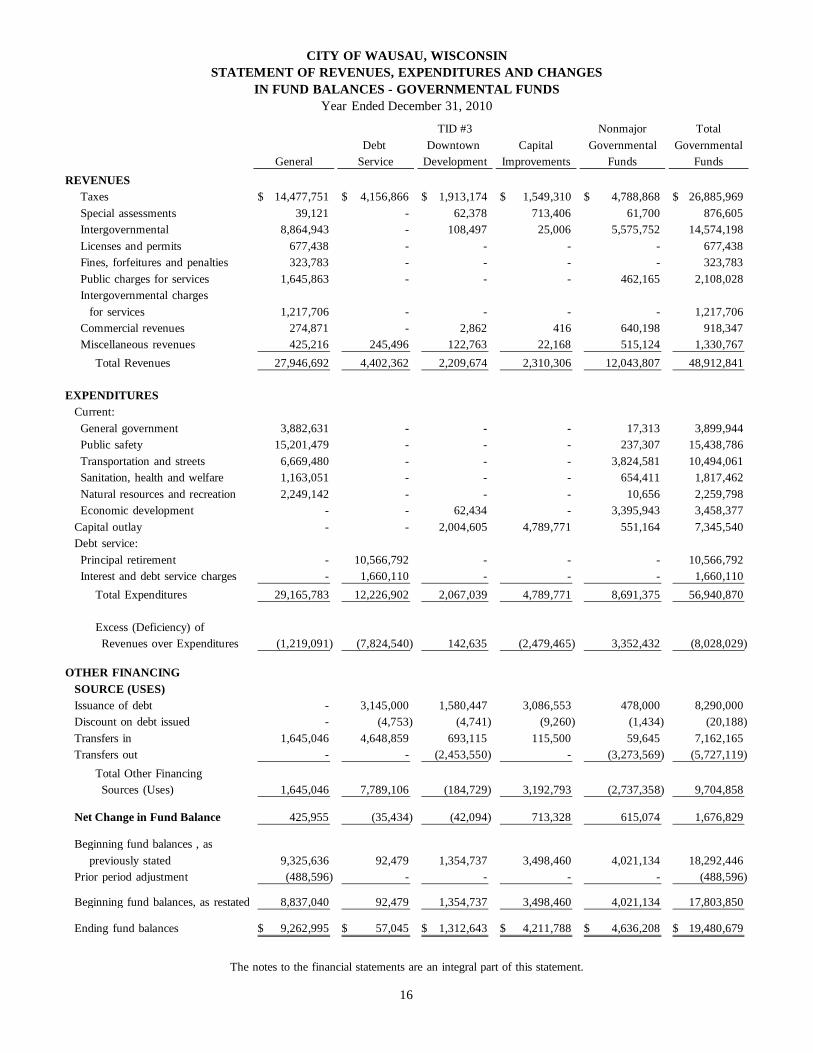
CITY OF WAUSAU, WISCONSINSTATEMENT OF REVENUES, EXPENDITURES AND CHANGES
IN FUND BALANCES - GOVERNMENTAL FUNDSYear Ended December 31, 2010
TID #3 Nonmajor TotalDebt Downtown Capital Governmental Governmental
General Service Development Improvements Funds FundsREVENUES Taxes 14,477,751$ 4,156,866$ 1,913,174$ 1,549,310$ 4,788,868$ 26,885,969$ Special assessments 39,121 - 62,378 713,406 61,700 876,605 Intergovernmental 8,864,943 - 108,497 25,006 5,575,752 14,574,198 Licenses and permits 677,438 - - - - 677,438 Fines, forfeitures and penalties 323,783 - - - - 323,783 Public charges for services 1,645,863 - - - 462,165 2,108,028 Intergovernmental charges for services 1,217,706 - - - - 1,217,706 Commercial revenues 274,871 - 2,862 416 640,198 918,347 Miscellaneous revenues 425,216 245,496 122,763 22,168 515,124 1,330,767 Total Revenues 27,946,692 4,402,362 2,209,674 2,310,306 12,043,807 48,912,841 EXPENDITURES Current: General government 3,882,631 - - - 17,313 3,899,944 Public safety 15,201,479 - - - 237,307 15,438,786 Transportation and streets 6,669,480 - - - 3,824,581 10,494,061 Sanitation, health and welfare 1,163,051 - - - 654,411 1,817,462 Natural resources and recreation 2,249,142 - - - 10,656 2,259,798 Economic development - - 62,434 - 3,395,943 3,458,377 Capital outlay - - 2,004,605 4,789,771 551,164 7,345,540 Debt service: Principal retirement - 10,566,792 - - - 10,566,792 Interest and debt service charges - 1,660,110 - - - 1,660,110 Total Expenditures 29,165,783 12,226,902 2,067,039 4,789,771 8,691,375 56,940,870
Excess (Deficiency) of Revenues over Expenditures (1,219,091) (7,824,540) 142,635 (2,479,465) 3,352,432 (8,028,029)
OTHER FINANCING SOURCE (USES) Issuance of debt - 3,145,000 1,580,447 3,086,553 478,000 8,290,000 Discount on debt issued - (4,753) (4,741) (9,260) (1,434) (20,188) Transfers in 1,645,046 4,648,859 693,115 115,500 59,645 7,162,165 Transfers out - - (2,453,550) - (3,273,569) (5,727,119) Total Other Financing Sources (Uses) 1,645,046 7,789,106 (184,729) 3,192,793 (2,737,358) 9,704,858
Net Change in Fund Balance 425,955 (35,434) (42,094) 713,328 615,074 1,676,829
Beginning fund balances , as previously stated 9,325,636 92,479 1,354,737 3,498,460 4,021,134 18,292,446 Prior period adjustment (488,596) - - - - (488,596)
Beginning fund balances, as restated 8,837,040 92,479 1,354,737 3,498,460 4,021,134 17,803,850
Ending fund balances 9,262,995$ 57,045$ 1,312,643$ 4,211,788$ 4,636,208$ 19,480,679$
The notes to the financial statements are an integral part of this statement.
16
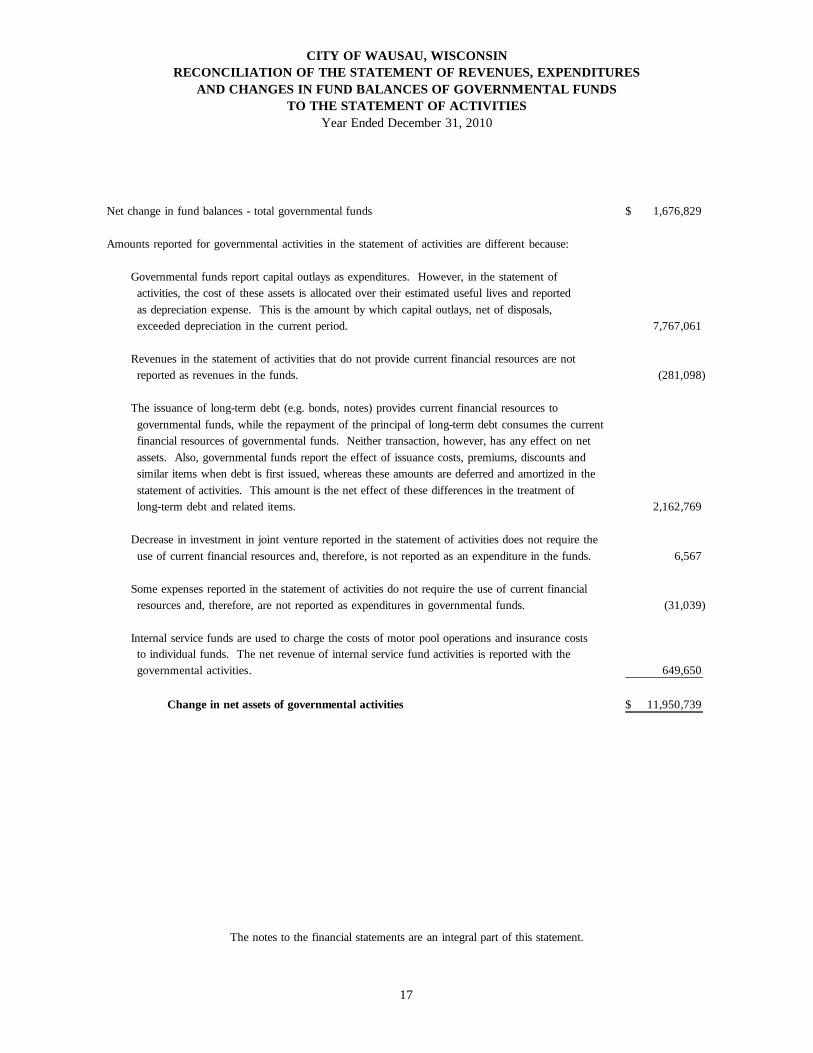
CITY OF WAUSAU, WISCONSINRECONCILIATION OF THE STATEMENT OF REVENUES, EXPENDITURES
AND CHANGES IN FUND BALANCES OF GOVERNMENTAL FUNDSTO THE STATEMENT OF ACTIVITIES
Year Ended December 31, 2010
Net change in fund balances - total governmental funds 1,676,829$
Amounts reported for governmental activities in the statement of activities are different because:
Governmental funds report capital outlays as expenditures. However, in the statement of activities, the cost of these assets is allocated over their estimated useful lives and reported as depreciation expense. This is the amount by which capital outlays, net of disposals, exceeded depreciation in the current period. 7,767,061
Revenues in the statement of activities that do not provide current financial resources are not reported as revenues in the funds. (281,098)
The issuance of long-term debt (e.g. bonds, notes) provides current financial resources to governmental funds, while the repayment of the principal of long-term debt consumes the current financial resources of governmental funds. Neither transaction, however, has any effect on net assets. Also, governmental funds report the effect of issuance costs, premiums, discounts and similar items when debt is first issued, whereas these amounts are deferred and amortized in the statement of activities. This amount is the net effect of these differences in the treatment of long-term debt and related items. 2,162,769
Decrease in investment in joint venture reported in the statement of activities does not require the use of current financial resources and, therefore, is not reported as an expenditure in the funds. 6,567
Some expenses reported in the statement of activities do not require the use of current financial resources and, therefore, are not reported as expenditures in governmental funds. (31,039)
Internal service funds are used to charge the costs of motor pool operations and insurance costs to individual funds. The net revenue of internal service fund activities is reported with the governmental activities. 649,650
Change in net assets of governmental activities 11,950,739$
The notes to the financial statements are an integral part of this statement.
17
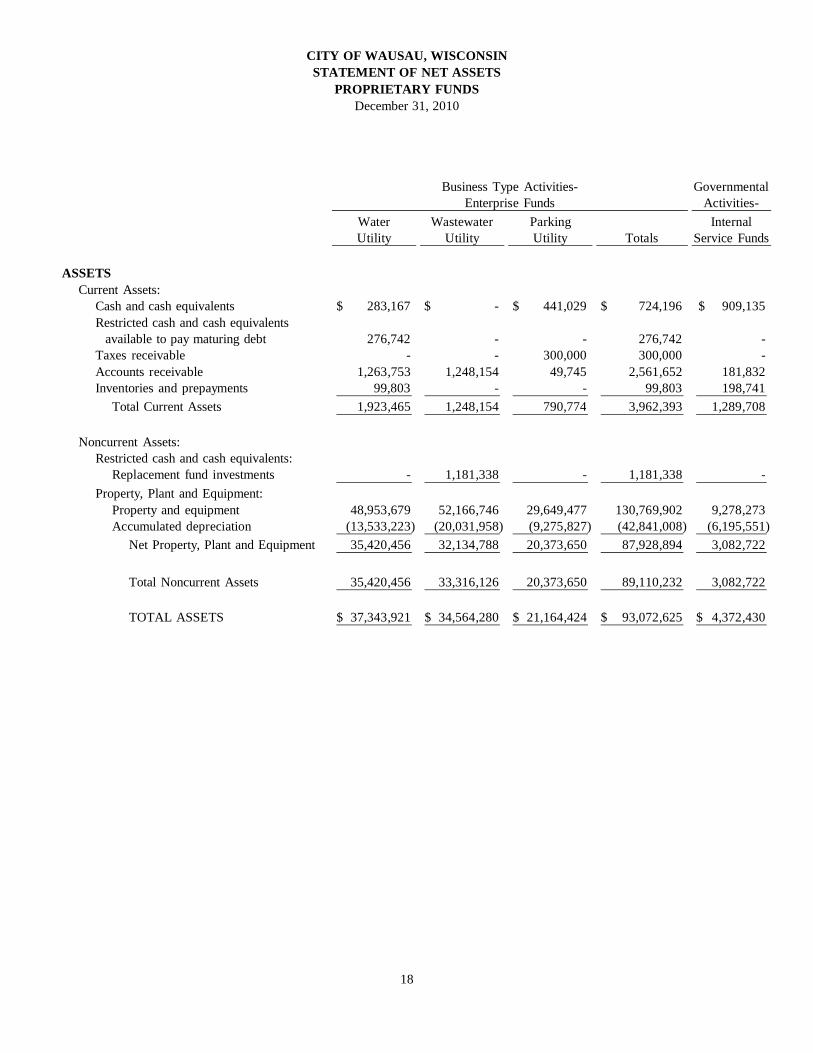
CITY OF WAUSAU, WISCONSINSTATEMENT OF NET ASSETS
PROPRIETARY FUNDSDecember 31, 2010
Business Type Activities- GovernmentalEnterprise Funds Activities-
Water Wastewater Parking InternalUtility Utility Utility Totals Service Funds
ASSETS Current Assets: Cash and cash equivalents 283,167$ -$ 441,029$ 724,196$ 909,135$ Restricted cash and cash equivalents available to pay maturing debt 276,742 - - 276,742 - Taxes receivable - - 300,000 300,000 - Accounts receivable 1,263,753 1,248,154 49,745 2,561,652 181,832 Inventories and prepayments 99,803 - - 99,803 198,741 Total Current Assets 1,923,465 1,248,154 790,774 3,962,393 1,289,708
Noncurrent Assets: Restricted cash and cash equivalents: Replacement fund investments - 1,181,338 - 1,181,338 - Property, Plant and Equipment: Property and equipment 48,953,679 52,166,746 29,649,477 130,769,902 9,278,273 Accumulated depreciation (13,533,223) (20,031,958) (9,275,827) (42,841,008) (6,195,551) Net Property, Plant and Equipment 35,420,456 32,134,788 20,373,650 87,928,894 3,082,722
Total Noncurrent Assets 35,420,456 33,316,126 20,373,650 89,110,232 3,082,722
TOTAL ASSETS 37,343,921$ 34,564,280$ 21,164,424$ 93,072,625$ 4,372,430$
18
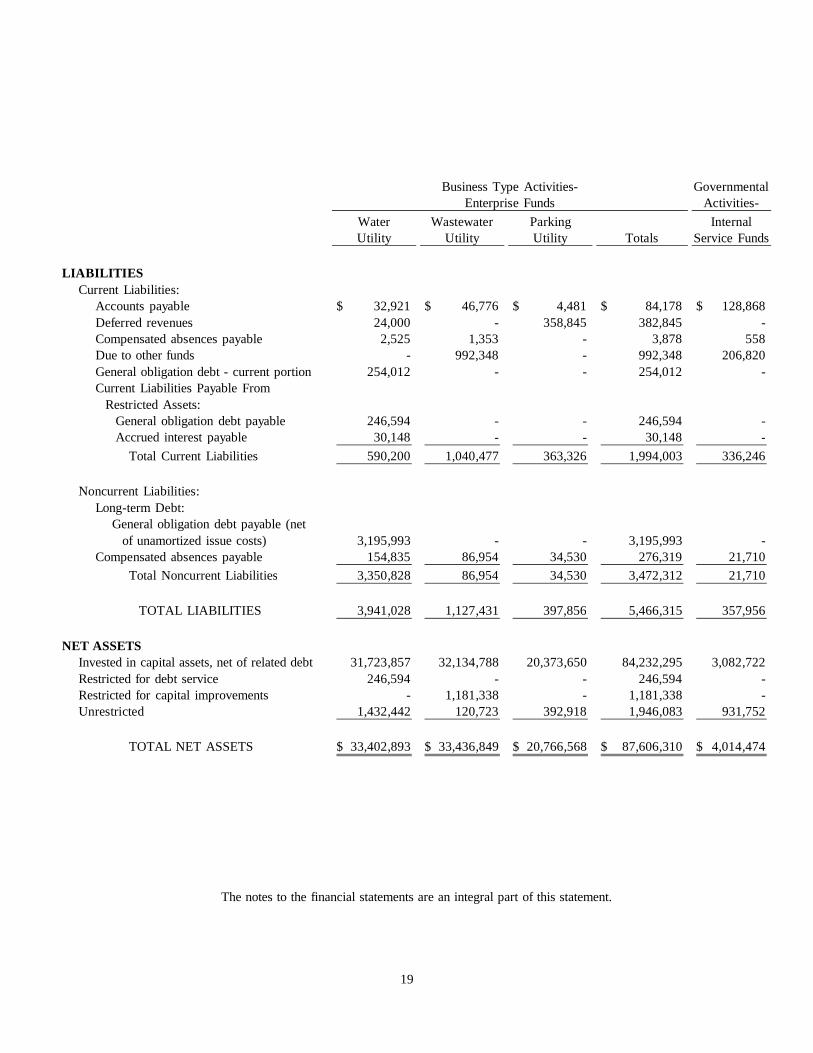
Business Type Activities- GovernmentalEnterprise Funds Activities-
Water Wastewater Parking InternalUtility Utility Utility Totals Service Funds
LIABILITIES Current Liabilities: Accounts payable 32,921$ 46,776$ 4,481$ 84,178$ 128,868$ Deferred revenues 24,000 - 358,845 382,845 - Compensated absences payable 2,525 1,353 - 3,878 558 Due to other funds - 992,348 - 992,348 206,820 General obligation debt - current portion 254,012 - - 254,012 - Current Liabilities Payable From Restricted Assets: General obligation debt payable 246,594 - - 246,594 - Accrued interest payable 30,148 - - 30,148 - Total Current Liabilities 590,200 1,040,477 363,326 1,994,003 336,246
Noncurrent Liabilities: Long-term Debt: General obligation debt payable (net of unamortized issue costs) 3,195,993 - - 3,195,993 - Compensated absences payable 154,835 86,954 34,530 276,319 21,710 Total Noncurrent Liabilities 3,350,828 86,954 34,530 3,472,312 21,710
TOTAL LIABILITIES 3,941,028 1,127,431 397,856 5,466,315 357,956
NET ASSETS Invested in capital assets, net of related debt 31,723,857 32,134,788 20,373,650 84,232,295 3,082,722 Restricted for debt service 246,594 - - 246,594 - Restricted for capital improvements - 1,181,338 - 1,181,338 - Unrestricted 1,432,442 120,723 392,918 1,946,083 931,752
TOTAL NET ASSETS 33,402,893$ 33,436,849$ 20,766,568$ 87,606,310$ 4,014,474$
The notes to the financial statements are an integral part of this statement.
19
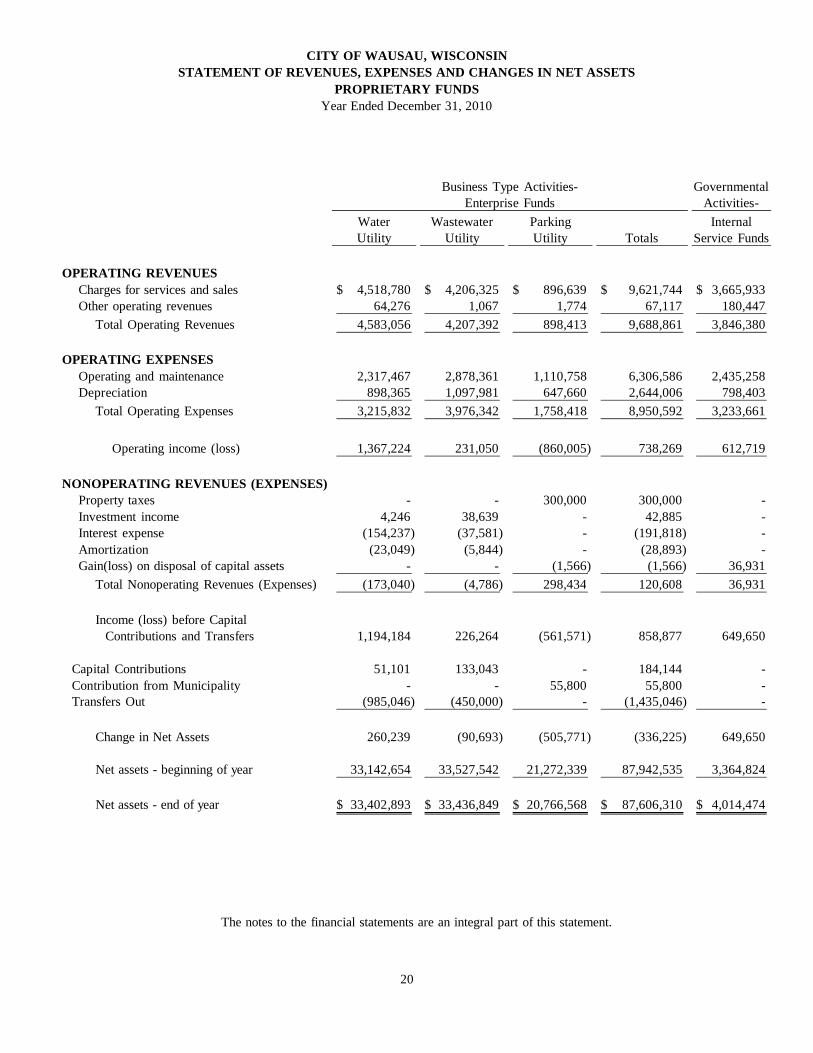
CITY OF WAUSAU, WISCONSINSTATEMENT OF REVENUES, EXPENSES AND CHANGES IN NET ASSETS
PROPRIETARY FUNDSYear Ended December 31, 2010
Business Type Activities- GovernmentalEnterprise Funds Activities-
Water Wastewater Parking InternalUtility Utility Utility Totals Service Funds
OPERATING REVENUES Charges for services and sales 4,518,780$ 4,206,325$ 896,639$ 9,621,744$ 3,665,933$ Other operating revenues 64,276 1,067 1,774 67,117 180,447 Total Operating Revenues 4,583,056 4,207,392 898,413 9,688,861 3,846,380
OPERATING EXPENSES Operating and maintenance 2,317,467 2,878,361 1,110,758 6,306,586 2,435,258 Depreciation 898,365 1,097,981 647,660 2,644,006 798,403 Total Operating Expenses 3,215,832 3,976,342 1,758,418 8,950,592 3,233,661
Operating income (loss) 1,367,224 231,050 (860,005) 738,269 612,719
NONOPERATING REVENUES (EXPENSES) Property taxes - - 300,000 300,000 - Investment income 4,246 38,639 - 42,885 - Interest expense (154,237) (37,581) - (191,818) - Amortization (23,049) (5,844) - (28,893) - Gain(loss) on disposal of capital assets - - (1,566) (1,566) 36,931 Total Nonoperating Revenues (Expenses) (173,040) (4,786) 298,434 120,608 36,931
Income (loss) before Capital Contributions and Transfers 1,194,184 226,264 (561,571) 858,877 649,650
Capital Contributions 51,101 133,043 - 184,144 - Contribution from Municipality - - 55,800 55,800 - Transfers Out (985,046) (450,000) - (1,435,046) -
Change in Net Assets 260,239 (90,693) (505,771) (336,225) 649,650
Net assets - beginning of year 33,142,654 33,527,542 21,272,339 87,942,535 3,364,824
Net assets - end of year 33,402,893$ 33,436,849$ 20,766,568$ 87,606,310$ 4,014,474$
The notes to the financial statements are an integral part of this statement.
20
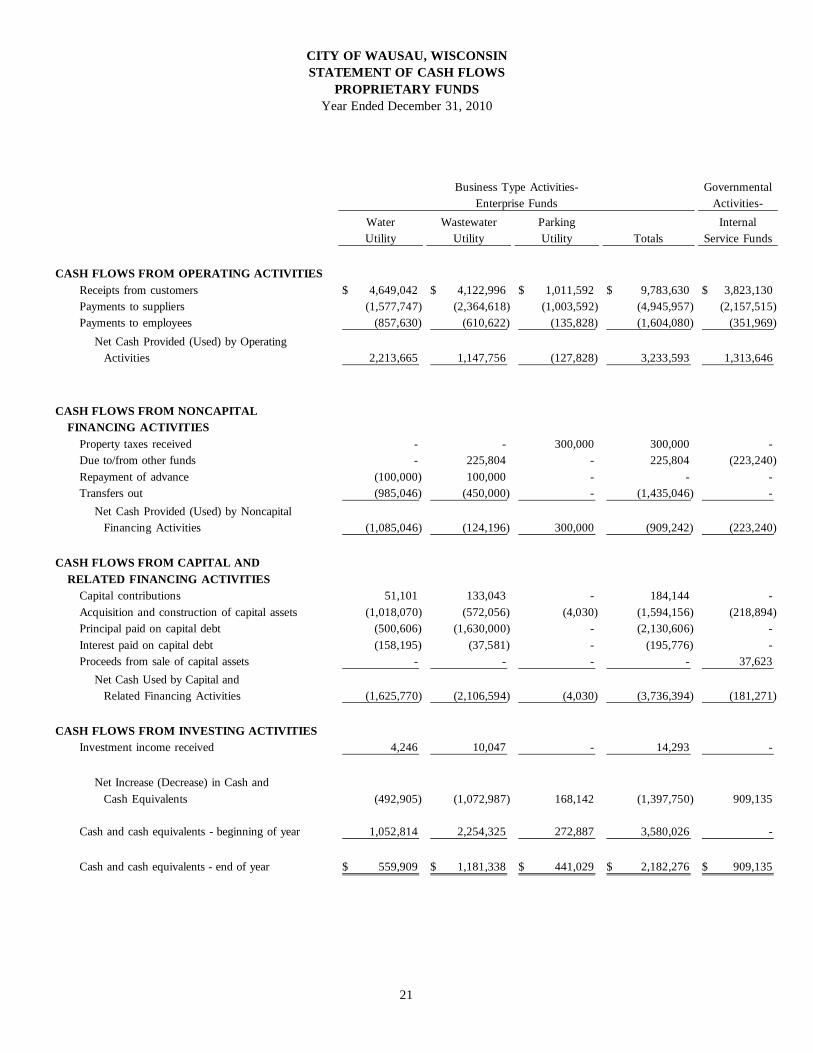
CITY OF WAUSAU, WISCONSINSTATEMENT OF CASH FLOWS
PROPRIETARY FUNDSYear Ended December 31, 2010
Business Type Activities- GovernmentalEnterprise Funds Activities-
Water Wastewater Parking InternalUtility Utility Utility Totals Service Funds
CASH FLOWS FROM OPERATING ACTIVITIES Receipts from customers 4,649,042$ 4,122,996$ 1,011,592$ 9,783,630$ 3,823,130$ Payments to suppliers (1,577,747) (2,364,618) (1,003,592) (4,945,957) (2,157,515) Payments to employees (857,630) (610,622) (135,828) (1,604,080) (351,969) Net Cash Provided (Used) by Operating Activities 2,213,665 1,147,756 (127,828) 3,233,593 1,313,646
CASH FLOWS FROM NONCAPITAL FINANCING ACTIVITIES Property taxes received - - 300,000 300,000 - Due to/from other funds - 225,804 - 225,804 (223,240) Repayment of advance (100,000) 100,000 - - - Transfers out (985,046) (450,000) - (1,435,046) - Net Cash Provided (Used) by Noncapital Financing Activities (1,085,046) (124,196) 300,000 (909,242) (223,240)
CASH FLOWS FROM CAPITAL AND RELATED FINANCING ACTIVITIES Capital contributions 51,101 133,043 - 184,144 - Acquisition and construction of capital assets (1,018,070) (572,056) (4,030) (1,594,156) (218,894) Principal paid on capital debt (500,606) (1,630,000) - (2,130,606) - Interest paid on capital debt (158,195) (37,581) - (195,776) - Proceeds from sale of capital assets - - - - 37,623 Net Cash Used by Capital and Related Financing Activities (1,625,770) (2,106,594) (4,030) (3,736,394) (181,271)
CASH FLOWS FROM INVESTING ACTIVITIES Investment income received 4,246 10,047 - 14,293 -
Net Increase (Decrease) in Cash and Cash Equivalents (492,905) (1,072,987) 168,142 (1,397,750) 909,135
Cash and cash equivalents - beginning of year 1,052,814 2,254,325 272,887 3,580,026 -
Cash and cash equivalents - end of year 559,909$ 1,181,338$ 441,029$ 2,182,276$ 909,135$
21
Business Type Activities- GovernmentalEnterprise Funds Activities-
Water Wastewater Parking InternalUtility Utility Utility Totals Service Funds
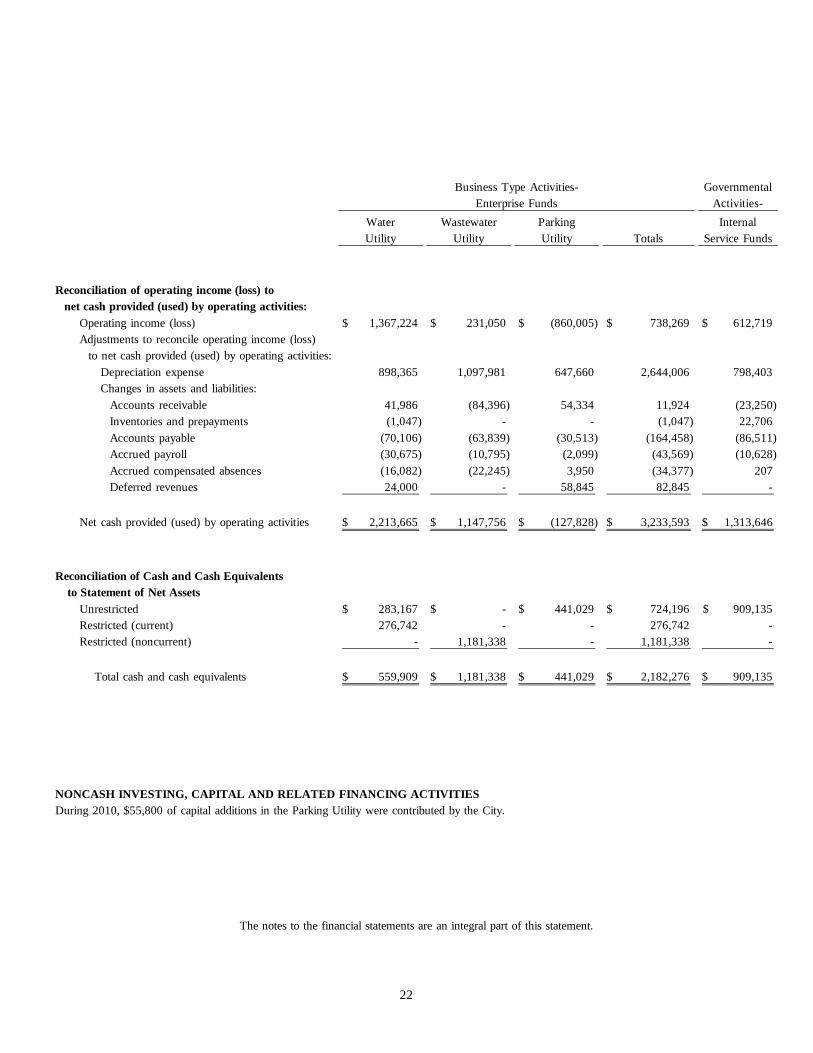
Reconciliation of operating income (loss) to net cash provided (used) by operating activities: Operating income (loss) 1,367,224$ 231,050$ (860,005)$ 738,269$ 612,719$ Adjustments to reconcile operating income (loss) to net cash provided (used) by operating activities: Depreciation expense 898,365 1,097,981 647,660 2,644,006 798,403 Changes in assets and liabilities: Accounts receivable 41,986 (84,396) 54,334 11,924 (23,250) Inventories and prepayments (1,047) - - (1,047) 22,706 Accounts payable (70,106) (63,839) (30,513) (164,458) (86,511) Accrued payroll (30,675) (10,795) (2,099) (43,569) (10,628) Accrued compensated absences (16,082) (22,245) 3,950 (34,377) 207 Deferred revenues 24,000 - 58,845 82,845 -
Net cash provided (used) by operating activities 2,213,665$ 1,147,756$ (127,828)$ 3,233,593$ 1,313,646$
Reconciliation of Cash and Cash Equivalents to Statement of Net Assets Unrestricted 283,167$ -$ 441,029$ 724,196$ 909,135$ Restricted (current) 276,742 - - 276,742 - Restricted (noncurrent) - 1,181,338 - 1,181,338 -
Total cash and cash equivalents 559,909$ 1,181,338$ 441,029$ 2,182,276$ 909,135$
NONCASH INVESTING, CAPITAL AND RELATED FINANCING ACTIVITIESDuring 2010, $55,800 of capital additions in the Parking Utility were contributed by the City.
The notes to the financial statements are an integral part of this statement.
22
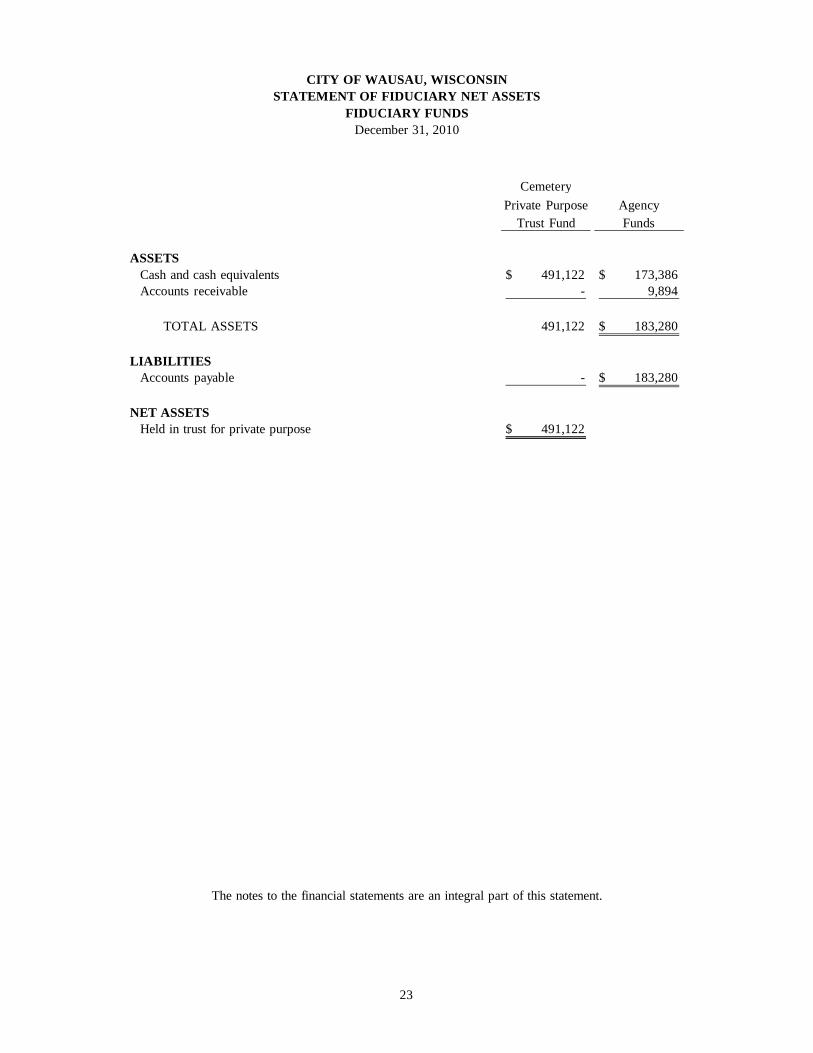
CITY OF WAUSAU, WISCONSINSTATEMENT OF FIDUCIARY NET ASSETS
FIDUCIARY FUNDSDecember 31, 2010
CemeteryPrivate Purpose Agency
Trust Fund Funds
ASSETS Cash and cash equivalents 491,122$ 173,386$ Accounts receivable - 9,894
TOTAL ASSETS 491,122 183,280$
LIABILITIES Accounts payable - 183,280$
NET ASSETS Held in trust for private purpose 491,122$
The notes to the financial statements are an integral part of this statement.
23
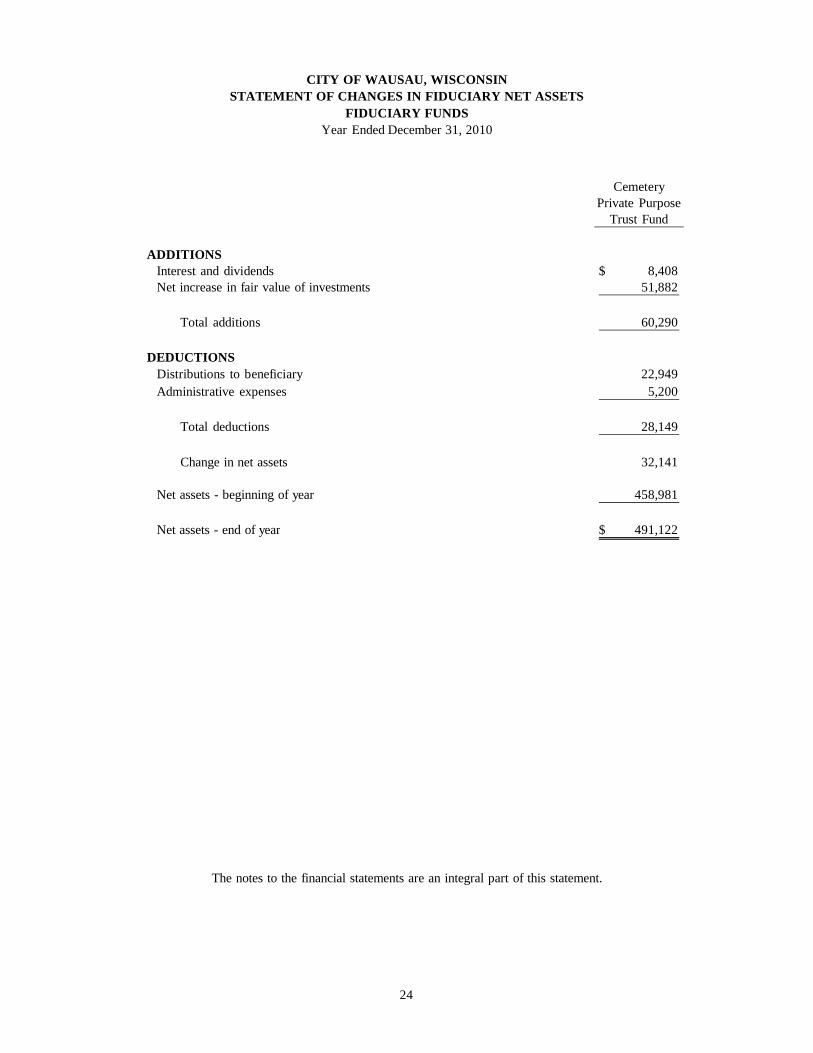
CITY OF WAUSAU, WISCONSINSTATEMENT OF CHANGES IN FIDUCIARY NET ASSETS
FIDUCIARY FUNDSYear Ended December 31, 2010
CemeteryPrivate Purpose
Trust Fund
ADDITIONS Interest and dividends 8,408$ Net increase in fair value of investments 51,882
Total additions 60,290
DEDUCTIONS Distributions to beneficiary 22,949 Administrative expenses 5,200
Total deductions 28,149
Change in net assets 32,141
Net assets - beginning of year 458,981
Net assets - end of year 491,122$
The notes to the financial statements are an integral part of this statement.
24
25
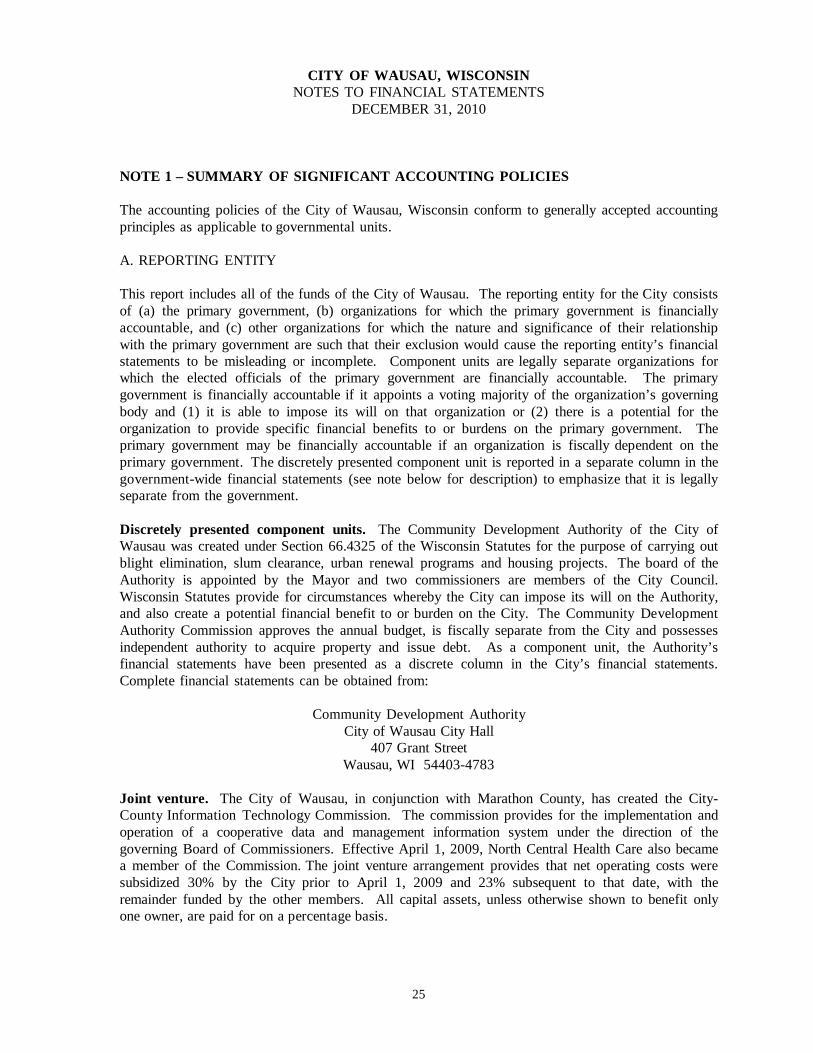
CITY OF WAUSAU, WISCONSIN NOTES TO FINANCIAL STATEMENTS
DECEMBER 31, 2010 NOTE 1 – SUMMARY OF SIGNIFICANT ACCOUNTING POLICIES The accounting policies of the City of Wausau, Wisconsin conform to generally accepted accounting principles as applicable to governmental units. A. REPORTING ENTITY This report includes all of the funds of the City of Wausau. The reporting entity for the City consists of (a) the primary government, (b) organizations for which the primary government is financially accountable, and (c) other organizations for which the nature and significance of their relationship with the primary government are such that their exclusion would cause the reporting entity’s financial statements to be misleading or incomplete. Component units are legally separate organizations for which the elected officials of the primary government are financially accountable. The primary government is financially accountable if it appoints a voting majority of the organization’s governing body and (1) it is able to impose its will on that organization or (2) there is a potential for the organization to provide specific financial benefits to or burdens on the primary government. The primary government may be financially accountable if an organization is fiscally dependent on the primary government. The discretely presented component unit is reported in a separate column in the government-wide financial statements (see note below for description) to emphasize that it is legally separate from the government.
Discretely presented component units. The Community Development Authority of the City of Wausau was created under Section 66.4325 of the Wisconsin Statutes for the purpose of carrying out blight elimination, slum clearance, urban renewal programs and housing projects. The board of the Authority is appointed by the Mayor and two commissioners are members of the City Council. Wisconsin Statutes provide for circumstances whereby the City can impose its will on the Authority, and also create a potential financial benefit to or burden on the City. The Community Development Authority Commission approves the annual budget, is fiscally separate from the City and possesses independent authority to acquire property and issue debt. As a component unit, the Authority’s financial statements have been presented as a discrete column in the City’s financial statements. Complete financial statements can be obtained from:
Community Development Authority
City of Wausau City Hall 407 Grant Street
Wausau, WI 54403-4783 Joint venture. The City of Wausau, in conjunction with Marathon County, has created the City-County Information Technology Commission. The commission provides for the implementation and operation of a cooperative data and management information system under the direction of the governing Board of Commissioners. Effective April 1, 2009, North Central Health Care also became a member of the Commission. The joint venture arrangement provides that net operating costs were subsidized 30% by the City prior to April 1, 2009 and 23% subsequent to that date, with the remainder funded by the other members. All capital assets, unless otherwise shown to benefit only one owner, are paid for on a percentage basis.
26
CITY OF WAUSAU, WISCONSIN NOTES TO FINANCIAL STATEMENTS
DECEMBER 31, 2010 NOTE 1 – SUMMARY OF SIGNIFICANT ACCOUNTING POLICIES (Continued) B. GOVERNMENT-WIDE FINANCIAL STATEMENTS The government-wide financial statements (i.e., the statement of net assets and the statement of activities) report information on all funds of the reporting entity except for fiduciary funds. The statements distinguish between governmental and business-type activities. Governmental activities generally are financed through taxes, intergovernmental revenues and other nonexchange revenues. Business-type activities are financed in whole or in part by fees charged to external parties for goods or services. Likewise, the primary government is reported separately from a legally separate component unit for which the primary government is financially accountable.
The statement of activities demonstrates the degree to which the direct expenses of a given function or segment are offset by program revenues. Direct expenses are those that are clearly identifiable with a specific function or segment. The City does not allocate indirect expenses to functions in the statement of activities. Program revenues include (1) charges to customers or applicants who purchase, use or directly benefit from goods, services or privileges provided by a given function or segment, and (2) grants and contributions that are restricted to meeting the operational or capital requirements of a particular function or segment. Taxes and other items not included among program revenues are reported as general revenues. Financial statements of the reporting entity are organized into funds each of which is considered to be a separate accounting entity. Each fund is accounted for by providing a separate set of self-balancing accounts, which constitute its assets, liabilities, net assets/fund equity, revenues and expenditures/expenses. Separate financial statements are provided for governmental funds, proprietary funds and fiduciary funds, even though the latter are excluded from the government-wide financial statements. Major individual governmental funds and major individual enterprise funds are reported as separate columns in the fund financial statements. Funds are organized as major funds or non-major funds within the governmental and proprietary statements. An emphasis is placed on major funds within the governmental and proprietary categories. A fund is considered major if it is the primary operating fund of the City or meets the following criteria:
a. Total assets, liabilities, revenues or expenditures/expenses of that individual governmental or enterprise fund are at least 10 percent of the corresponding total for all funds of that category or type, and
b. The same element of the individual governmental fund or enterprise fund that met the 10 percent test is at least 5 percent of the corresponding total for all governmental and enterprise funds combined.
c. In addition, any other governmental or proprietary fund that the City believes is particularly important to financial statement users may be reported as a major fund.
27
CITY OF WAUSAU, WISCONSIN NOTES TO FINANCIAL STATEMENTS
DECEMBER 31, 2010
NOTE 1 – SUMMARY OF SIGNIFICANT ACCOUNTING POLICIES (Continued) B. GOVERNMENT-WIDE FINANCIAL STATEMENTS (Continued) The City reports the following major governmental funds:
General Fund – The General Fund is the general operating fund of the City. It is used to account for all financial resources except those required to be accounted for in another fund.
Debt Service Fund – This fund is used to account for the accumulation of resources for and the payment of general obligation debt principal, interest and related costs. Sources of revenue are property taxes, interest earnings and reimbursements from other entities and departments for debt payments. TID #3 Downtown Development Fund – This fund is used to account for general obligation debt proceeds used to finance property acquisition and development within the downtown. Capital Improvements Fund – This fund is used to account for expenditures relating to the City’s annual capital improvements plan. The expenditures are financed by general property taxes, special assessments and proceeds of general obligation debt.
The City reports the following major enterprise funds:
Water Utility – This fund accounts for the financing of the construction, operation and maintenance of the City-owned water facilities.
Wastewater Utility – This fund accounts for the financing of the construction, operation and maintenance of the City-owned wastewater facilities. Parking Utility – This fund accounts for the financing of the operation and maintenance of the City-owned parking facilities.
The City reports the following non-major governmental funds:
Non-major Governmental Funds – Special Revenue Funds – These funds are used to account for the proceeds of specific revenue sources (other than major capital projects) that are legally restricted to expenditures for specified purposes.
Grants Fund Room Tax Fund HUD Mortgage Fund Public Access Cable Fund DLAD Mortgage Program Fund Recycling Fund Industrial Park Fund Wausau Area Transit System Fund Federal Rent Rehabilitation Fund TID #2 Industrial Park Fund WRRP Rehabilitation Fund EMS Grant Fund Holtz-Krause Clean Up Fund Trust Accounts Fund Hazardous Materials Emergency Response Fund
28
CITY OF WAUSAU, WISCONSIN NOTES TO FINANCIAL STATEMENTS
DECEMBER 31, 2010
NOTE 1 – SUMMARY OF SIGNIFICANT ACCOUNTING POLICIES (Continued) B. GOVERNMENT-WIDE FINANCIAL STATEMENTS (Continued)
Capital Project Funds – These funds are used to account for financial resources to be used for the acquisition or construction of equipment and/or major capital facilities.
TID #4 Industrial Park Fund TID #5 Industrial Park Fund TID #6 West Side Development Fund TID #7 West Side Development Fund Additionally, the City reports the following fund types:
Internal Service Funds - The Motor Pool Internal Service Fund is used to account for Motor Pool services provided by one department to other departments or agencies of the City, or to other governmental units, on a cost-reimbursement basis. The Insurance Fund is used to account for accumulation of charges for and allocation of costs associated with insurance premiums and claims paid.
The Private-purpose Trust Fund is used to account for resources legally held in trust for use by a non-profit organization to provide for cemetery perpetual care. All resources of the fund, including any earnings on invested resources, may be used to support the organization’s activities.
Agency Funds are used to account for assets held by the City in a trustee capacity or as an agent for Wausau Area Events, Inc., Main Street Wausau, Inc. and the Business Improvement District generated to provide for area-wide events and local promotion, and for the Wausau Business Incubator generated through industrial development.
C. MEASUREMENT FOCUS, BASIS OF ACCOUNTING AND FINANCIAL STATEMENT PRESENTATION The government-wide financial statements are reported using the economic resources measurement focus and the accrual basis of accounting, as are the proprietary fund and fiduciary fund financial statements. Agency funds, however, only report assets and liabilities and, consequently, do not have a measurement focus. Under the accrual basis of accounting, revenues are recorded when earned and expenses are recorded when a liability is incurred or economic asset used. Revenues, expenses, gains, losses, assets and liabilities resulting from exchange and exchange-like transactions are recognized when the exchange takes place. Property taxes are recognized as revenues in the year for which they are levied. Taxes receivable for the following year are recorded as receivables and unearned revenue. Grants and similar items are recognized as revenue as soon as all eligibility requirements imposed by the provider have been met. Special assessments are recorded as revenue when earned. Unbilled receivables are recorded as revenues when services are provided. The business-type activities follow all pronouncements of the Governmental Accounting Standards Board, and have elected not to follow Financial Accounting Standards Board pronouncements issued after November 30, 1989.
29
CITY OF WAUSAU, WISCONSIN NOTES TO FINANCIAL STATEMENTS
DECEMBER 31, 2010
NOTE 1 – SUMMARY OF SIGNIFICANT ACCOUNTING POLICIES (Continued) C. MEASUREMENT FOCUS, BASIS OF ACCOUNTING AND FINANCIAL STATEMENT PRESENTATION (Continued) Governmental fund financial statements are reported using the current financial resources measurement focus and the modified accrual basis of accounting. Revenues are recognized as soon as they are both measurable and available. Revenues are considered to be available when they are collectible within the current period or soon enough thereafter to pay liabilities of the current period. For this purpose, the government considers revenues to be available if they are collected within 60 days of the end of the current fiscal period. Expenditures generally are recorded when a liability is incurred, as under accrual accounting. However, unmatured interest on long-term debt, as well as expenditures related to compensated absences and claims and judgments, are recorded only when payment is expected to be paid with available expendable financial resources. Property taxes are recorded in the year levied as receivables and deferred revenues. They are recognized as revenues in the succeeding year when services financed by the levy are being provided. Intergovernmental grants and aids are recognized as revenues in the period the City is entitled to the resources and the amounts are available. Amounts owed to the City that are not currently available are recorded as receivables and deferred revenues. Amounts received prior to the entitlement period are also recorded as deferred revenues. Long-term receivables, such as special assessments, notes and mortgages, are recorded as receivables and deferred revenues. In subsequent periods, when revenue recognition criteria are met or when the City has a legal claim to the resources, revenues are recorded. Revenues susceptible to accrual include property taxes, miscellaneous taxes, public charges for services, special assessments and interest. Other general revenues, such as licenses and permits, fines and forfeitures, and miscellaneous revenues, are recognized when payment is received or when measurable and available under the criteria described above. The City reports deferred revenues on its governmental funds balance sheet. For governmental fund financial statements, deferred revenues arise when a potential revenue source does not meet both the “measurable” and “available” criteria for recognition in the current period. Deferred revenues also arise when resources are received before the City has a legal claim to them, as when grant monies are received prior to the incurrence of qualifying expenditures. In subsequent periods, when both revenue recognition criteria are met, or when the City has a legal claim to the resources, the liability for deferred revenue is removed from the balance sheet and revenue is recognized. As a general rule, the effect of interfund activity has been eliminated from the government-wide financial statements. Exceptions to this general rule are charges between the City’s water and wastewater utilities and various other functions of the government. Elimination of these charges would distort the direct costs and program revenues reported for the various functions concerned.
30
CITY OF WAUSAU, WISCONSIN NOTES TO FINANCIAL STATEMENTS
DECEMBER 31, 2010
NOTE 1 – SUMMARY OF SIGNIFICANT ACCOUNTING POLICIES (Continued) C. MEASUREMENT FOCUS, BASIS OF ACCOUNTING AND FINANCIAL STATEMENT PRESENTATION (Continued) Amounts reported as program revenues include (1) charges to customers or applicants for goods, services or privileges provided, (2) operating grants and contributions, and (3) capital grants and contributions, including special assessments. Internally dedicated resources are reported as general revenues rather than as program revenues. Likewise, general revenues include all taxes. Proprietary funds distinguish operating revenues and expenses from nonoperating items. Operating revenues and expenses generally result from providing services and producing and delivering goods in connection with a proprietary fund’s principal ongoing operations. The principal operating revenues of the Water, Wastewater and Parking utilities are charges to customers for sales and services. Operating expenses for enterprise funds and internal service funds include the cost of sales and services, administrative expenses and depreciation on capital assets. All revenues and expenses not meeting this definition are reported as nonoperating revenues and expenses. The preparation of financial statements in conformity with generally accepted accounting principles requires management to make estimates and assumptions that affect the reported amounts of assets and liabilities and disclosure of contingent assets and liabilities at the date of the financial statements and the reported amounts of revenues and expenditures/expenses during the reporting period. Actual results could differ from those estimates. D. ASSETS, LIABILITIES AND NET ASSETS OR EQUITY 1. Deposits and Investments The City maintains separate and distinct accounts for the Cemetery Private-purpose Trust Fund, Community Development Department and Community Development Authority (a discretely presented component unit). All other funds share common accounts to facilitate the management of cash. Cash applicable to a particular fund is readily identifiable. The City is required to invest its funds in accordance with Wisconsin Statutes 66.0603 and 67.11 (2). These statutes authorize the City to invest in obligations of the U.S. Treasury, agencies and instrumentalities, obligations of Wisconsin governmental units; time deposits, repurchase agreements; certain qualities of commercial paper; the State of Wisconsin Local Government Investment Pool; and certain money market mutual funds. Investments are stated at fair value consistent with the provisions of GASB Statement No. 31. Fair values are based on quoted market prices. Adjustments necessary to record investments at fair value are recorded in the operating statement as increases or decreases in investment income. For purposes of the statement of cash flows, the City considers all highly liquid investments with an initial maturity of three months or less when acquired to be cash equivalents.
31
CITY OF WAUSAU, WISCONSIN NOTES TO FINANCIAL STATEMENTS
DECEMBER 31, 2010
NOTE 1 – SUMMARY OF SIGNIFICANT ACCOUNTING POLICIES (Continued) D. ASSETS, LIABILITIES AND NET ASSETS OR EQUITY (Continued) 1. Deposits and Investments (Continued) The Wisconsin Local Government Investment Pool (LGIP) is part of the State Investment Fund (SIF) and is managed by the State of Wisconsin Investment Board. The SIF is not registered with the Securities and Exchange Commission, but operates under the statutory authority of Wisconsin chapter 25. The SIF reports the fair value of its underlying assets annually. Participants in the LGIP have the right to withdraw their funds in total on one day’s notice. At December 31, 2010, the fair value of the LGIP’s assets was substantially equal to the City’s share as reported in these statements. 2. Receivable and Payables During the course of operations, numerous transactions occur between individual funds for goods provided or services rendered. These receivables and payables are classified as either “due from/due to other funds” (current portion) or “advances to/from other funds” (non-current portion). Any residual balances outstanding between the governmental activities and business-type activities are reported in the government-wide financial statements as “internal balances”. Advances between funds are offset by a fund balance reserve account in applicable governmental funds to indicate that they are not available for appropriation and are not expendable available financial resources. Accounts receivable in the governmental activities are shown net of an allowance for uncollectible accounts. No allowance for uncollectible accounts has been provided for the Water and Wastewater Utilities since they are able to place delinquent bills on the tax roll. Estimated unbilled revenues from the Water and Wastewater Utility Funds are recognized at the end of the year based on billings during the month following the close of the fiscal year. Property taxes consist of taxes on real estate and personal property. Property taxes are levied in December of each year based on assessed value as of January 1 of that year and become an enforceable lien on the property the following January 1. The amount levied is applicable to the budget of the ensuing calendar year and become due as of January 1 of that year. Collections are made by the City through July 31. In addition to property taxes for the City, taxes are also collected for and remitted to the state and county governments as well as local school and technical college districts. The City settles with all entities on the 15th of January, February, May and August based on the taxes collected through the end of each preceding month. Payment due dates are full payment by January 31 or partial payments by January 31, April 30 and July 31 of each year. At year end, the property taxes levied for each fund are recorded as taxes receivable and deferred revenues.
32
CITY OF WAUSAU, WISCONSIN NOTES TO FINANCIAL STATEMENTS
DECEMBER 31, 2010
NOTE 1 – SUMMARY OF SIGNIFICANT ACCOUNTING POLICIES (Continued) D. ASSETS, LIABILITIES AND NET ASSETS OR EQUITY (Continued)
3. Inventories and Prepayments
Inventories consist of expendable supplies held for consumption. Inventories are stated at cost with value being determined on the “first-in, first-out” basis of accounting. The cost is recorded as an expenditure or an expense at the time the individual inventory items are consumed rather than when purchased. Payments made to vendors for services that will benefit periods beyond the end of the current year are recorded as prepayments in both government-wide and fund financial statements. Inventories and prepayments of governmental fund types are offset by a fund balance reserve which indicated that assets do not represent spendable available financial resources. 4. Restricted Assets Restricted assets consist of cash and investments restricted for the Wastewater Fund plant replacement. In addition, designated funds have also been restricted in the discretely presented component unit. Current liabilities payable from these restricted assets are so classified. 5. Capital Assets Capital assets, which include property, plant, equipment and infrastructure assets (e.g., roads, bridges, sidewalks and similar items), are reported in the applicable governmental activities or business-type activities columns in the government-wide financial statements. Capital assets are defined by the government as assets with an initial, individual cost of more than $5,000 and an estimated useful life in excess of two years. Such assets are recorded at historical cost or estimated historical cost if purchased or constructed. Donated capital assets are recorded at estimated fair market value at the date of donation. The costs of normal maintenance and repairs that do not add to the value of the asset or materially extend assets lives are not capitalized. In accordance with GASB 34, the City has reported its major networks of infrastructure assets as of January 1, 2007. Major outlays for capital assets and improvements are capitalized as projects are constructed. Net interest incurred during the construction phase of capital assets of business-type activities is included as part of the capitalized value of the assets constructed. Total interest expense incurred by the Water and Wastewater Utilities during the current fiscal year was $191,818, none of which was capitalized. Depreciation of all exhaustible capital assets of the City, as well as its component unit, is recorded as an expense in the statement of activities, with accumulated depreciation reflected in the statement of net assets. Depreciation is provided over the estimated useful lives using the straight-line method. The range of estimated useful lives by type of asset is as follows:
33
CITY OF WAUSAU, WISCONSIN NOTES TO FINANCIAL STATEMENTS
DECEMBER 31, 2010
NOTE 1 – SUMMARY OF SIGNIFICANT ACCOUNTING POLICIES (Continued) D. ASSETS, LIABILITIES AND NET ASSETS OR EQUITY (Continued)
5. Capital Assets (Continued) Buildings 25-50 Years Improvements other than buildings 15-150 Years Machinery and equipment 3-25 Years Infrastructure 20-50 Years In the fund financial statements, capital assets used in governmental fund operations are accounted for as capital outlay expenditures of the governmental fund upon acquisition. 6. Other Assets In governmental funds, debt issuance related costs are recognized as expenditures in the current period. For the government-wide and proprietary fund type financial statements, debt issuance costs are deferred and amortized over the term of the related debt issue. 7. Compensated Absences Under terms of employment, employees are granted sick leave and vacation. Varying amounts of the unused accumulated sick pay vests upon meeting specific requirements and is convertible into health insurance upon retirement. The City’s policy is to allow employees to vest any unused vacation credits. Only benefits considered to be vested are disclosed in these statements. All vested vacation and sick leave pay is accrued when incurred in the government-wide and proprietary fund financial statements. A liability for these amounts is reported in governmental funds only if they have matured, for example, as a result of employee terminations and/or retirements or are payable with expendable available resources. 8. Long-Term Obligations In the government-wide financial statements, and proprietary fund types in the fund financial statements, long-term debt and other long-term obligations are reported as liabilities in the applicable governmental activities, business-type activities or proprietary fund type statement of net assets. Bond premiums and discounts, as well as issuance costs, are reported as deferred charges and amortized over the term of the related debt. In the fund financial statements, governmental fund types recognize bond issuance costs during the current period. The face amount of debt issued (plus any premiums) is reported as other financing sources. Issuance costs, whether or not withheld from the actual debt proceeds received, are reported as debt service expenditures.
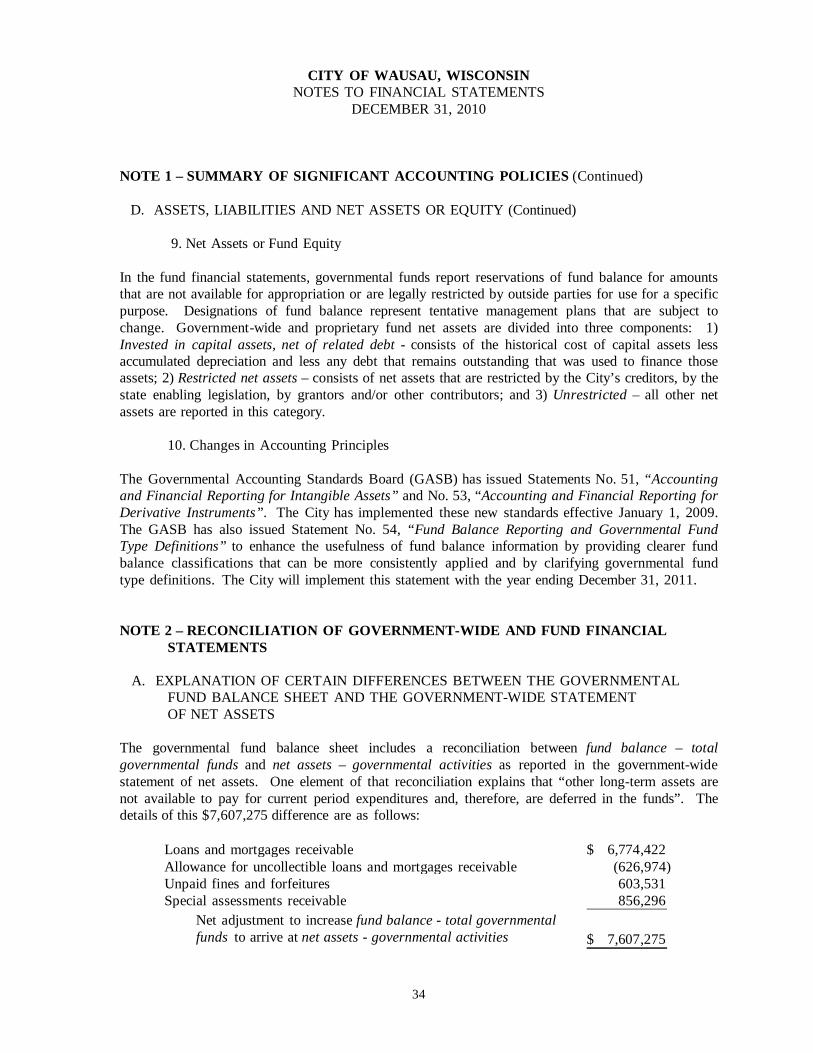
34
CITY OF WAUSAU, WISCONSIN NOTES TO FINANCIAL STATEMENTS
DECEMBER 31, 2010
NOTE 1 – SUMMARY OF SIGNIFICANT ACCOUNTING POLICIES (Continued) D. ASSETS, LIABILITIES AND NET ASSETS OR EQUITY (Continued)
9. Net Assets or Fund Equity In the fund financial statements, governmental funds report reservations of fund balance for amounts that are not available for appropriation or are legally restricted by outside parties for use for a specific purpose. Designations of fund balance represent tentative management plans that are subject to change. Government-wide and proprietary fund net assets are divided into three components: 1) Invested in capital assets, net of related debt - consists of the historical cost of capital assets less accumulated depreciation and less any debt that remains outstanding that was used to finance those assets; 2) Restricted net assets – consists of net assets that are restricted by the City’s creditors, by the state enabling legislation, by grantors and/or other contributors; and 3) Unrestricted – all other net assets are reported in this category. 10. Changes in Accounting Principles The Governmental Accounting Standards Board (GASB) has issued Statements No. 51, “Accounting and Financial Reporting for Intangible Assets” and No. 53, “Accounting and Financial Reporting for Derivative Instruments”. The City has implemented these new standards effective January 1, 2009. The GASB has also issued Statement No. 54, “Fund Balance Reporting and Governmental Fund Type Definitions” to enhance the usefulness of fund balance information by providing clearer fund balance classifications that can be more consistently applied and by clarifying governmental fund type definitions. The City will implement this statement with the year ending December 31, 2011. NOTE 2 – RECONCILIATION OF GOVERNMENT-WIDE AND FUND FINANCIAL STATEMENTS
A. EXPLANATION OF CERTAIN DIFFERENCES BETWEEN THE GOVERNMENTAL FUND BALANCE SHEET AND THE GOVERNMENT-WIDE STATEMENT OF NET ASSETS
The governmental fund balance sheet includes a reconciliation between fund balance – total governmental funds and net assets – governmental activities as reported in the government-wide statement of net assets. One element of that reconciliation explains that “other long-term assets are not available to pay for current period expenditures and, therefore, are deferred in the funds”. The details of this $7,607,275 difference are as follows:
Loans and mortgages receivable 6,774,422$ Allowance for uncollectible loans and mortgages receivable (626,974) Unpaid fines and forfeitures 603,531 Special assessments receivable 856,296
Net adjustment to increase fund balance - total governmentalfunds to arrive at net assets - governmental activities 7,607,275$
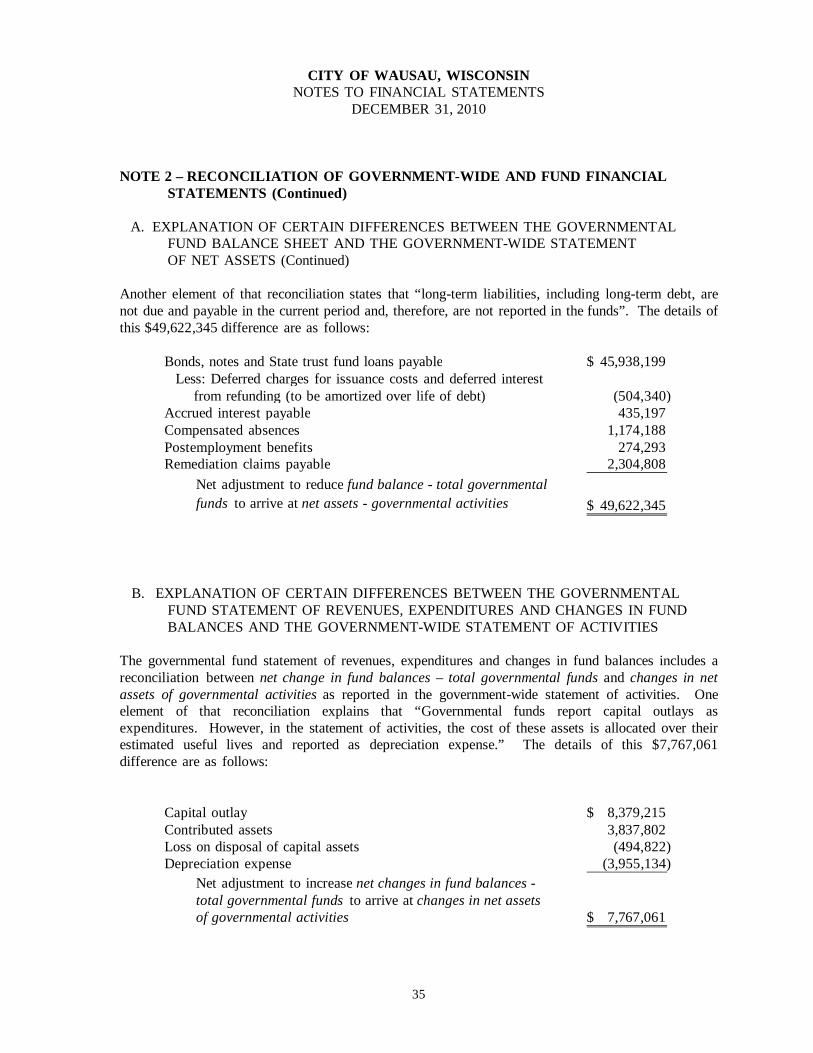
35
CITY OF WAUSAU, WISCONSIN NOTES TO FINANCIAL STATEMENTS
DECEMBER 31, 2010 NOTE 2 – RECONCILIATION OF GOVERNMENT-WIDE AND FUND FINANCIAL STATEMENTS (Continued) A. EXPLANATION OF CERTAIN DIFFERENCES BETWEEN THE GOVERNMENTAL FUND BALANCE SHEET AND THE GOVERNMENT-WIDE STATEMENT OF NET ASSETS (Continued) Another element of that reconciliation states that “long-term liabilities, including long-term debt, are not due and payable in the current period and, therefore, are not reported in the funds”. The details of this $49,622,345 difference are as follows:
Bonds, notes and State trust fund loans payable 45,938,199$ Less: Deferred charges for issuance costs and deferred interest from refunding (to be amortized over life of debt) (504,340) Accrued interest payable 435,197 Compensated absences 1,174,188 Postemployment benefits 274,293 Remediation claims payable 2,304,808
Net adjustment to reduce fund balance - total governmentalfunds to arrive at net assets - governmental activities 49,622,345$
B. EXPLANATION OF CERTAIN DIFFERENCES BETWEEN THE GOVERNMENTAL FUND STATEMENT OF REVENUES, EXPENDITURES AND CHANGES IN FUND BALANCES AND THE GOVERNMENT-WIDE STATEMENT OF ACTIVITIES
The governmental fund statement of revenues, expenditures and changes in fund balances includes a reconciliation between net change in fund balances – total governmental funds and changes in net assets of governmental activities as reported in the government-wide statement of activities. One element of that reconciliation explains that “Governmental funds report capital outlays as expenditures. However, in the statement of activities, the cost of these assets is allocated over their estimated useful lives and reported as depreciation expense.” The details of this $7,767,061 difference are as follows:
Capital outlay 8,379,215$ Contributed assets 3,837,802 Loss on disposal of capital assets (494,822) Depreciation expense (3,955,134)
Net adjustment to increase net changes in fund balances -total governmental funds to arrive at changes in net assetsof governmental activities 7,767,061$
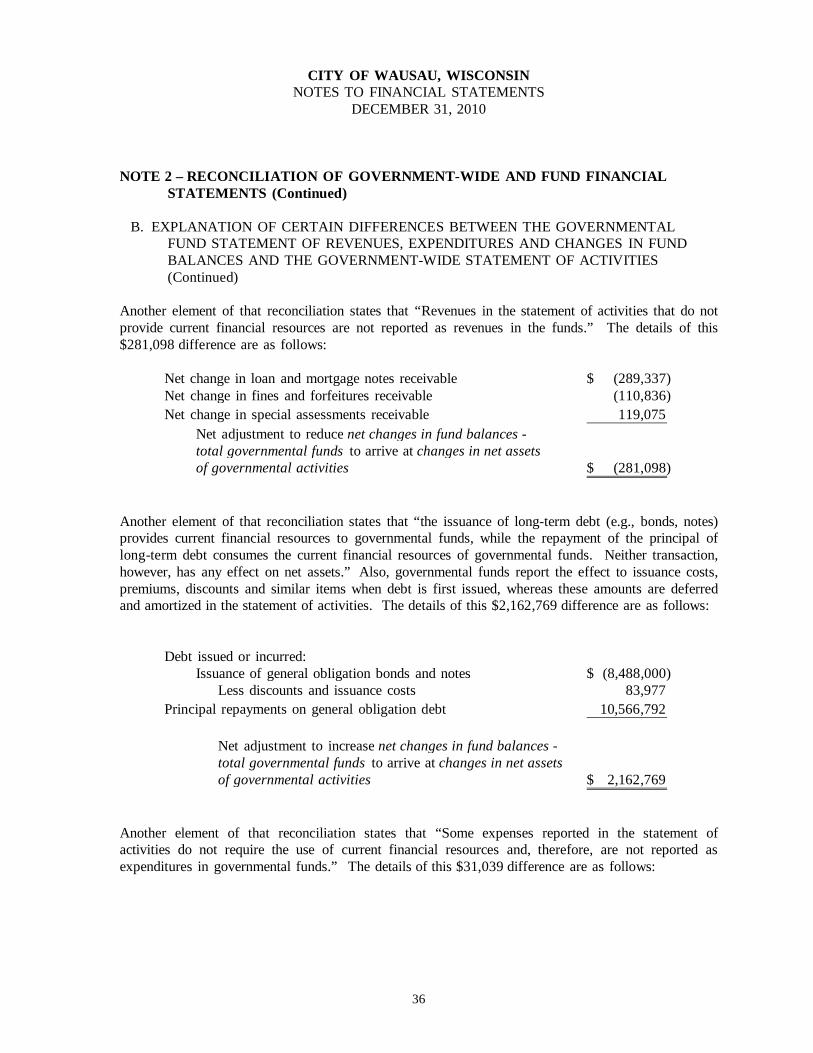
36
CITY OF WAUSAU, WISCONSIN NOTES TO FINANCIAL STATEMENTS
DECEMBER 31, 2010 NOTE 2 – RECONCILIATION OF GOVERNMENT-WIDE AND FUND FINANCIAL STATEMENTS (Continued) B. EXPLANATION OF CERTAIN DIFFERENCES BETWEEN THE GOVERNMENTAL FUND STATEMENT OF REVENUES, EXPENDITURES AND CHANGES IN FUND BALANCES AND THE GOVERNMENT-WIDE STATEMENT OF ACTIVITIES (Continued) Another element of that reconciliation states that “Revenues in the statement of activities that do not provide current financial resources are not reported as revenues in the funds.” The details of this $281,098 difference are as follows:
Net change in loan and mortgage notes receivable (289,337)$ Net change in fines and forfeitures receivable (110,836) Net change in special assessments receivable 119,075
Net adjustment to reduce net changes in fund balances - total governmental funds to arrive at changes in net assetsof governmental activities (281,098)$
Another element of that reconciliation states that “the issuance of long-term debt (e.g., bonds, notes) provides current financial resources to governmental funds, while the repayment of the principal of long-term debt consumes the current financial resources of governmental funds. Neither transaction, however, has any effect on net assets.” Also, governmental funds report the effect to issuance costs, premiums, discounts and similar items when debt is first issued, whereas these amounts are deferred and amortized in the statement of activities. The details of this $2,162,769 difference are as follows:
Debt issued or incurred:Issuance of general obligation bonds and notes (8,488,000)$ Less discounts and issuance costs 83,977
Principal repayments on general obligation debt 10,566,792
Net adjustment to increase net changes in fund balances - total governmental funds to arrive at changes in net assets of governmental activities 2,162,769$
Another element of that reconciliation states that “Some expenses reported in the statement of activities do not require the use of current financial resources and, therefore, are not reported as expenditures in governmental funds.” The details of this $31,039 difference are as follows:
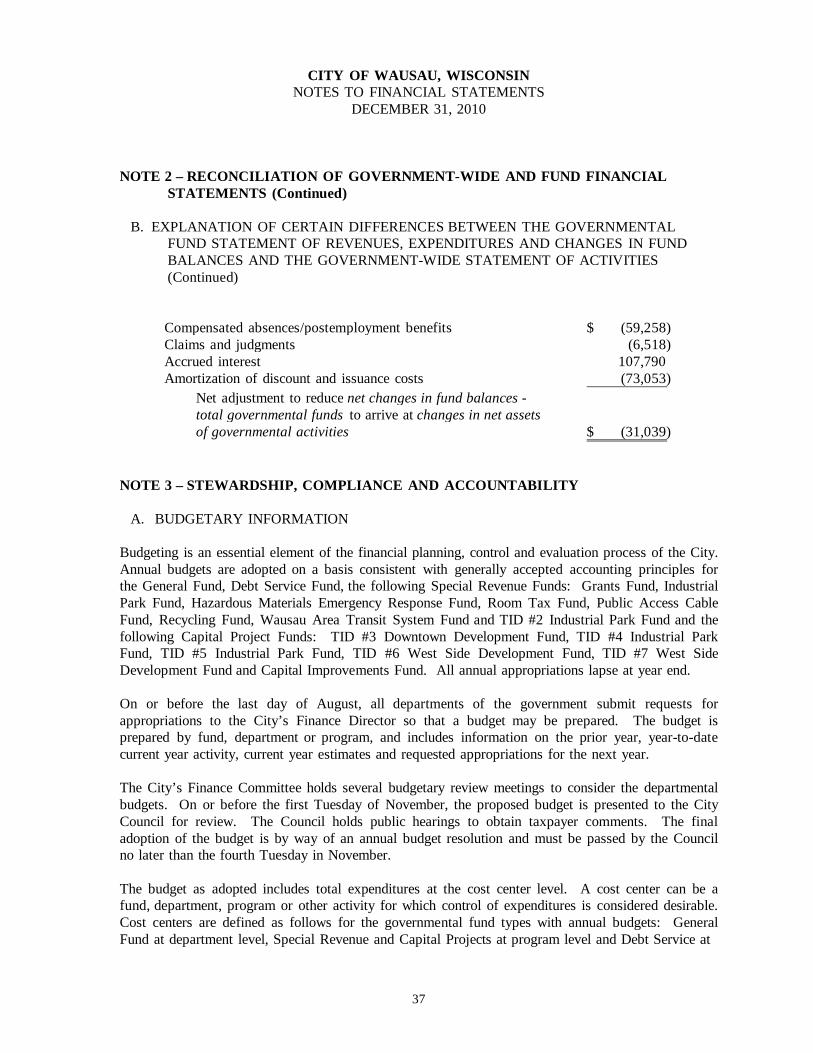
37
CITY OF WAUSAU, WISCONSIN NOTES TO FINANCIAL STATEMENTS
DECEMBER 31, 2010 NOTE 2 – RECONCILIATION OF GOVERNMENT-WIDE AND FUND FINANCIAL STATEMENTS (Continued) B. EXPLANATION OF CERTAIN DIFFERENCES BETWEEN THE GOVERNMENTAL FUND STATEMENT OF REVENUES, EXPENDITURES AND CHANGES IN FUND BALANCES AND THE GOVERNMENT-WIDE STATEMENT OF ACTIVITIES (Continued)
Compensated absences/postemployment benefits (59,258)$ Claims and judgments (6,518) Accrued interest 107,790 Amortization of discount and issuance costs (73,053)
Net adjustment to reduce net changes in fund balances -total governmental funds to arrive at changes in net assetsof governmental activities (31,039)$
NOTE 3 – STEWARDSHIP, COMPLIANCE AND ACCOUNTABILITY A. BUDGETARY INFORMATION Budgeting is an essential element of the financial planning, control and evaluation process of the City. Annual budgets are adopted on a basis consistent with generally accepted accounting principles for the General Fund, Debt Service Fund, the following Special Revenue Funds: Grants Fund, Industrial Park Fund, Hazardous Materials Emergency Response Fund, Room Tax Fund, Public Access Cable Fund, Recycling Fund, Wausau Area Transit System Fund and TID #2 Industrial Park Fund and the following Capital Project Funds: TID #3 Downtown Development Fund, TID #4 Industrial Park Fund, TID #5 Industrial Park Fund, TID #6 West Side Development Fund, TID #7 West Side Development Fund and Capital Improvements Fund. All annual appropriations lapse at year end. On or before the last day of August, all departments of the government submit requests for appropriations to the City’s Finance Director so that a budget may be prepared. The budget is prepared by fund, department or program, and includes information on the prior year, year-to-date current year activity, current year estimates and requested appropriations for the next year. The City’s Finance Committee holds several budgetary review meetings to consider the departmental budgets. On or before the first Tuesday of November, the proposed budget is presented to the City Council for review. The Council holds public hearings to obtain taxpayer comments. The final adoption of the budget is by way of an annual budget resolution and must be passed by the Council no later than the fourth Tuesday in November. The budget as adopted includes total expenditures at the cost center level. A cost center can be a fund, department, program or other activity for which control of expenditures is considered desirable. Cost centers are defined as follows for the governmental fund types with annual budgets: General Fund at department level, Special Revenue and Capital Projects at program level and Debt Service at
38
CITY OF WAUSAU, WISCONSIN
NOTES TO FINANCIAL STATEMENTS DECEMBER 31, 2010
NOTE 3 – STEWARDSHIP, COMPLIANCE AND ACCOUNTABILITY (Continued) A. BUDGETARY INFORMATION (Continued) total fund level. The City’s Finance Director and Mayor may authorize transfers of budgeted amounts within expenditures of a cost center up to $2,500 for the General and Special Revenue Funds and up to $20,000 for the Capital Projects Funds. Transfers of all other appropriations require two-thirds (2/3) Council approval to amend the budget. Supplemental appropriations were necessary during the year but were not material in relation to the original appropriation. All such supplemental appropriations were properly authorized by the Common Council. Budget data presented in the financial statements reflect any adjustments made. The Council may amend the budget resolution in two respects: (a) it may transfer appropriations from one particular fund to another fund or it may add new objects within a fund. The Council may do this by means of a resolution; (b) it may increase the aggregate total of appropriations in order to reflect changes in financial circumstances either not contemplated in the annual budget resolution or due to financial circumstances which by their very nature are difficult to estimate with exactness at the time of the enactment of the annual budget resolution. The Council may do this by means of a resolution adopted by a two-thirds vote of the members. The Council may, by resolution, appropriate money from its contingent fund for any lawful purpose. It is the responsibility of the Finance Director of the City of Wausau to administer the budget in accordance with Wisconsin statutes and instructions of the City Council.
B. EXCESS OF EXPENDITURES OVER APPROPRIATIONS For the year ended December 31, 2010, expenditures exceeded appropriations for the following departmental cost centers in the General Fund: City promotion by $19,710, Municipal court by $3,649, Tax adjustment/bad debts by $63,590 and Weed control by $56,726; the TID #2 Industrial Park special revenue fund by $10,150; and in the TID #4 Industrial Park, TID #5 Industrial Park, TID #6 West Side Development and TID #7 West Side Development capital project funds by $1,671, $58,913, $275,872 and $50,352, respectively. Excess expenditures in the general fund and special revenue funds were funded by greater than anticipated revenues and by available fund balance. Those incurred in the capital project funds were funded with debt proceeds and short-term advances from the General Fund. C. DEFICIT FUND EQUITY The TID #4 Industrial Park and TID #7 West Side Development capital project funds had deficit fund equity of $1,447,489 and $736,276 respectively, as of December 31, 2010. The City intends to fund the above fund balance deficits from future operation of these funds.
39
CITY OF WAUSAU, WISCONSIN NOTES TO FINANCIAL STATEMENTS
DECEMBER 31, 2010 NOTE 4 – DETAILED NOTES ON ALL FUNDS A. CASH AND INVESTMENTS Cash and investments as of December 31, 2010 are classified in the accompanying financial statements as follows:
Statement of net assets - Cash and cash equivalents 30,696,666$ Investments 10,204,404 Restricted assets - cash and cash equivalents 1,458,080 Statement of net assets - fiduciary funds Cash and cash equivalents
Cemetery Private Purpose Trust Fund 491,122 Agency Funds 173,386
Total 43,023,658$
Cash on hand 14,884$ Deposits with financial institutions 24,678,095 Investments 18,330,679
Total 43,023,658$ Investments Authorized by the State of Wisconsin and the City’s Investment Policy The City’s investment policy as governed by Wisconsin State Statutes authorizes the following types of investments:
• U.S. Government agency bonds or securities; • Certificates of deposit and repurchase agreements; • Bonds or securities of any county, city, drainage district, vocational, technical and adult
education district, village, town or school district in the state; • Bankers acceptances issued by domestic banks which are eligible for purchase by the
Federal Reserve System; • Commercial paper rated in the highest short-term rating categories by rating agencies; • Medium term corporate notes issued by corporations organized and operating within the
U.S. or by depository institutions licensed by the U.S. or any state and operating in the U.S.;
• Money market mutual funds regulated by the Securities and Exchange Commission whose portfolios consist of U.S. Treasury or government obligations; and,
• State of Wisconsin Local Government Investment Pool.
40
CITY OF WAUSAU, WISCONSIN NOTES TO FINANCIAL STATEMENTS
DECEMBER 31, 2010 NOTE 4 – DETAILED NOTES ON ALL FUNDS (Continued) A. CASH AND INVESTMENTS (Continued) Interest Rate Risk Interest rate risk is the risk that changes in market interest rates will adversely affect the fair value of an investment. Generally, the longer the maturity of an investment, the greater the sensitivity of its fair value to changes in market interest rates. The City’s policy for managing its exposure to interest rate risk is to purchase a combination of shorter term and longer term investments and to time cash flows from maturities so that a portion of the portfolio is maturing or coming close to maturity evenly over time as necessary to provide the cash flow and liquidity needed for operations. Information about the sensitivity of the fair values of the City’s investments to fluctuating interest rates is provided by the following table that shows distribution of the City’s investments by maturity:
Investment Maturities (in Years)Investment Type Fair Value Less Than One 1-3 4-5
U.S. Agencies 8,985,081$ -$ 2,986,531$ 5,998,550$ Local Government Investment Pool 7,394,782 7,394,782 - -Money Market Mutual Funds 439,720 439,720 - -External investment pools 1,511,096 1,511,096 - -
18,330,679$ 9,345,598$ 2,986,531$ 5,998,550$
Credit Risk Credit risk is the risk that an issuer of an investment will not fulfill its obligation to the holder of the investment. This is measured by the assignment of a rating by a nationally recognized statistical rating organization. The City will minimize credit risk by limiting the type of investments to U.S. treasury obligations, U.S. government agency obligations, money market mutual funds, certificates of deposit and local government investment pools. The City will also diversify its investment portfolio so as to minimize losses from any one type of security or from any one individual issuer. As of December 31, 2010, the City’s investments were rated as follows:
Moody'sStandard Fitch Investor
Investment type Investment & Poors Ratings ServiceMoney market mutual funds Federated Government Obligations AAAm AAA AaaMoney market mutual funds Federated Treasury Obligations AAAm N/A AaaMoney market mutual funds AIM Government & Agency AAAm AAA Aaa
41
CITY OF WAUSAU, WISCONSIN NOTES TO FINANCIAL STATEMENTS
DECEMBER 31, 2010 NOTE 4 – DETAILED NOTES ON ALL FUNDS (Continued) A. CASH AND INVESTMENTS (Continued) The City had investments in the Local Government Investment Pool and Wells Fargo Treasury Money Market Fund which were not rated. In addition, the City held investments in U.S. agency securities that were not rated. Concentration of Credit Risk Concentration of credit risk refers to risk of loss attributed to the City’s investment in a single issuer. The City’s investment policy addresses this risk by requiring diversification of investments by security type and institution. With the exception of U.S. Treasury securities, no more than 50% of the City’s total investment portfolio will be invested in a single type of security or with a single financial institution. At December 31, 2010, the investment portfolio was concentrated as follows:
PercentageInvestment type Issuer of Portfolio
U.S. Agencies Federal National Mortgage Association 10.8%U.S. Agencies Federal Home Loan Bank 16.4%U.S. Agencies Federal Home Loan Mortgage Corporation 21.8%
Custodial Credit Risk Custodial credit risk for deposits is the risk that in the event of the failure of a depository financial institution, the City will not be able to recover deposits or will not be able to recover collateral securities that are in the possession of an outside party. The custodial credit risk for investments is the risk that, in the event of the failure of the counterparty to a transaction, the City will not be able to recover the value of investment or collateral securities that are in the possession of an outside party. The City’s investment policy does not contain legal or policy requirements that would limit the exposure to custodial credit risk for deposits or investments, other than the following provisions for deposits: The City’s investment policy requires collateralization on certificates of deposit and repurchase agreements at a level of 105% of the market value less amounts covered by the FDIC; and, the City Council approves and designates a list of authorized depository institutions based on evaluation and recommendation of the Finance Committee and City Finance Director.
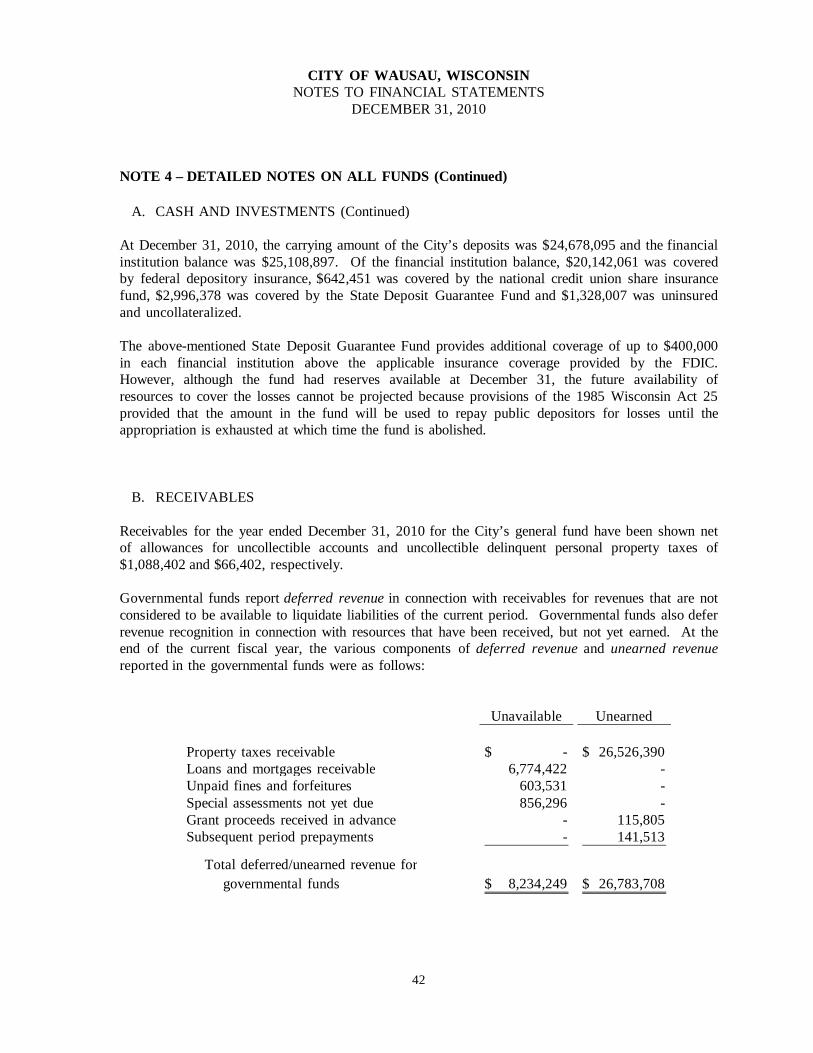
42
CITY OF WAUSAU, WISCONSIN NOTES TO FINANCIAL STATEMENTS
DECEMBER 31, 2010 NOTE 4 – DETAILED NOTES ON ALL FUNDS (Continued)
A. CASH AND INVESTMENTS (Continued) At December 31, 2010, the carrying amount of the City’s deposits was $24,678,095 and the financial institution balance was $25,108,897. Of the financial institution balance, $20,142,061 was covered by federal depository insurance, $642,451 was covered by the national credit union share insurance fund, $2,996,378 was covered by the State Deposit Guarantee Fund and $1,328,007 was uninsured and uncollateralized. The above-mentioned State Deposit Guarantee Fund provides additional coverage of up to $400,000 in each financial institution above the applicable insurance coverage provided by the FDIC. However, although the fund had reserves available at December 31, the future availability of resources to cover the losses cannot be projected because provisions of the 1985 Wisconsin Act 25 provided that the amount in the fund will be used to repay public depositors for losses until the appropriation is exhausted at which time the fund is abolished.
B. RECEIVABLES Receivables for the year ended December 31, 2010 for the City’s general fund have been shown net of allowances for uncollectible accounts and uncollectible delinquent personal property taxes of $1,088,402 and $66,402, respectively. Governmental funds report deferred revenue in connection with receivables for revenues that are not considered to be available to liquidate liabilities of the current period. Governmental funds also defer revenue recognition in connection with resources that have been received, but not yet earned. At the end of the current fiscal year, the various components of deferred revenue and unearned revenue reported in the governmental funds were as follows:
Unavailable Unearned
Property taxes receivable -$ 26,526,390$ Loans and mortgages receivable 6,774,422 - Unpaid fines and forfeitures 603,531 - Special assessments not yet due 856,296 - Grant proceeds received in advance - 115,805 Subsequent period prepayments - 141,513
Total deferred/unearned revenue for governmental funds 8,234,249$ 26,783,708$
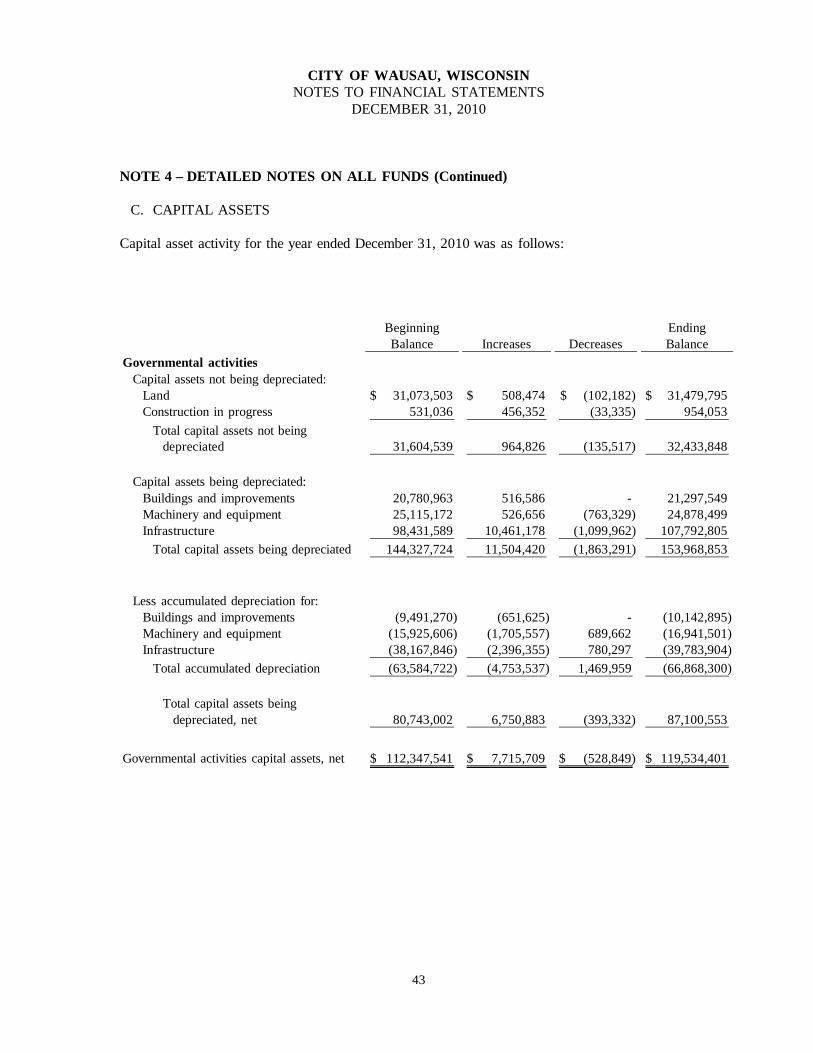
43
CITY OF WAUSAU, WISCONSIN NOTES TO FINANCIAL STATEMENTS
DECEMBER 31, 2010 NOTE 4 – DETAILED NOTES ON ALL FUNDS (Continued) C. CAPITAL ASSETS Capital asset activity for the year ended December 31, 2010 was as follows:
Beginning EndingBalance Increases Decreases Balance
Governmental activities Capital assets not being depreciated: Land 31,073,503$ 508,474$ (102,182)$ 31,479,795$ Construction in progress 531,036 456,352 (33,335) 954,053 Total capital assets not being depreciated 31,604,539 964,826 (135,517) 32,433,848
Capital assets being depreciated: Buildings and improvements 20,780,963 516,586 - 21,297,549 Machinery and equipment 25,115,172 526,656 (763,329) 24,878,499 Infrastructure 98,431,589 10,461,178 (1,099,962) 107,792,805 Total capital assets being depreciated 144,327,724 11,504,420 (1,863,291) 153,968,853
Less accumulated depreciation for: Buildings and improvements (9,491,270) (651,625) - (10,142,895) Machinery and equipment (15,925,606) (1,705,557) 689,662 (16,941,501) Infrastructure (38,167,846) (2,396,355) 780,297 (39,783,904) Total accumulated depreciation (63,584,722) (4,753,537) 1,469,959 (66,868,300)
Total capital assets being depreciated, net 80,743,002 6,750,883 (393,332) 87,100,553
Governmental activities capital assets, net 112,347,541$ 7,715,709$ (528,849)$ 119,534,401$
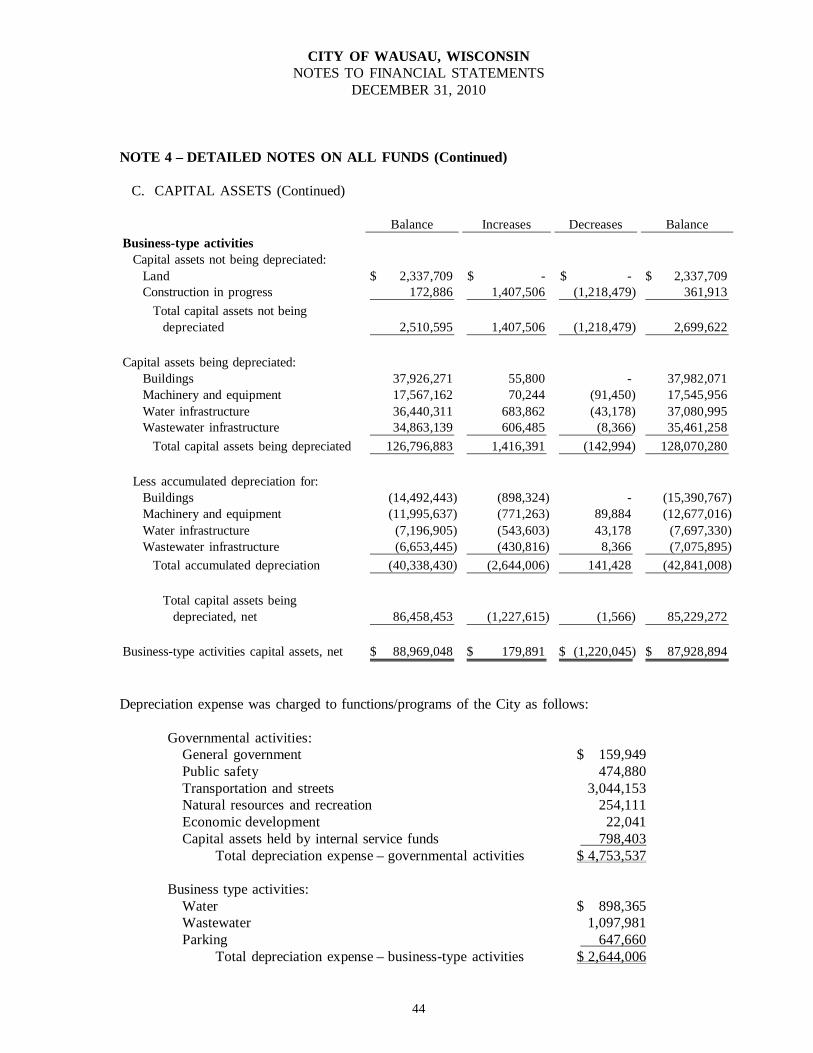
44
CITY OF WAUSAU, WISCONSIN NOTES TO FINANCIAL STATEMENTS
DECEMBER 31, 2010 NOTE 4 – DETAILED NOTES ON ALL FUNDS (Continued)
C. CAPITAL ASSETS (Continued)
Balance Increases Decreases BalanceBusiness-type activities Capital assets not being depreciated: Land 2,337,709$ -$ -$ 2,337,709$ Construction in progress 172,886 1,407,506 (1,218,479) 361,913 Total capital assets not being depreciated 2,510,595 1,407,506 (1,218,479) 2,699,622
Capital assets being depreciated: Buildings 37,926,271 55,800 - 37,982,071 Machinery and equipment 17,567,162 70,244 (91,450) 17,545,956 Water infrastructure 36,440,311 683,862 (43,178) 37,080,995 Wastewater infrastructure 34,863,139 606,485 (8,366) 35,461,258 Total capital assets being depreciated 126,796,883 1,416,391 (142,994) 128,070,280
Less accumulated depreciation for: Buildings (14,492,443) (898,324) - (15,390,767) Machinery and equipment (11,995,637) (771,263) 89,884 (12,677,016) Water infrastructure (7,196,905) (543,603) 43,178 (7,697,330) Wastewater infrastructure (6,653,445) (430,816) 8,366 (7,075,895) Total accumulated depreciation (40,338,430) (2,644,006) 141,428 (42,841,008)
Total capital assets being depreciated, net 86,458,453 (1,227,615) (1,566) 85,229,272
Business-type activities capital assets, net 88,969,048$ 179,891$ (1,220,045)$ 87,928,894$
Depreciation expense was charged to functions/programs of the City as follows: Governmental activities: General government $ 159,949 Public safety 474,880 Transportation and streets 3,044,153 Natural resources and recreation 254,111 Economic development 22,041 Capital assets held by internal service funds 798,403 Total depreciation expense – governmental activities $ 4,753,537 Business type activities: Water $ 898,365 Wastewater 1,097,981 Parking 647,660 Total depreciation expense – business-type activities $ 2,644,006
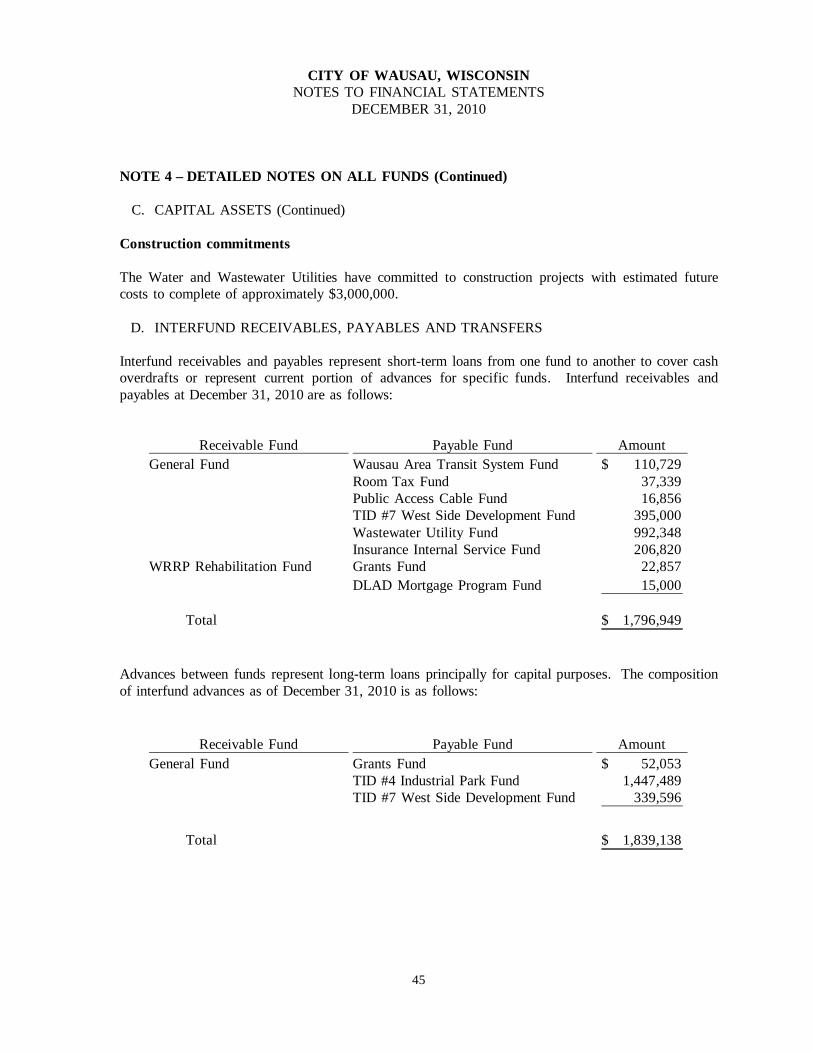
45
CITY OF WAUSAU, WISCONSIN NOTES TO FINANCIAL STATEMENTS
DECEMBER 31, 2010 NOTE 4 – DETAILED NOTES ON ALL FUNDS (Continued)
C. CAPITAL ASSETS (Continued) Construction commitments The Water and Wastewater Utilities have committed to construction projects with estimated future costs to complete of approximately $3,000,000. D. INTERFUND RECEIVABLES, PAYABLES AND TRANSFERS Interfund receivables and payables represent short-term loans from one fund to another to cover cash overdrafts or represent current portion of advances for specific funds. Interfund receivables and payables at December 31, 2010 are as follows:
Receivable Fund Payable Fund AmountGeneral Fund Wausau Area Transit System Fund 110,729$
Room Tax Fund 37,339 Public Access Cable Fund 16,856 TID #7 West Side Development Fund 395,000 Wastewater Utility Fund 992,348 Insurance Internal Service Fund 206,820
WRRP Rehabilitation Fund Grants Fund 22,857 DLAD Mortgage Program Fund 15,000
Total 1,796,949$ Advances between funds represent long-term loans principally for capital purposes. The composition of interfund advances as of December 31, 2010 is as follows:
Receivable Fund Payable Fund AmountGeneral Fund Grants Fund 52,053$
TID #4 Industrial Park Fund 1,447,489 TID #7 West Side Development Fund 339,596
Total 1,839,138$
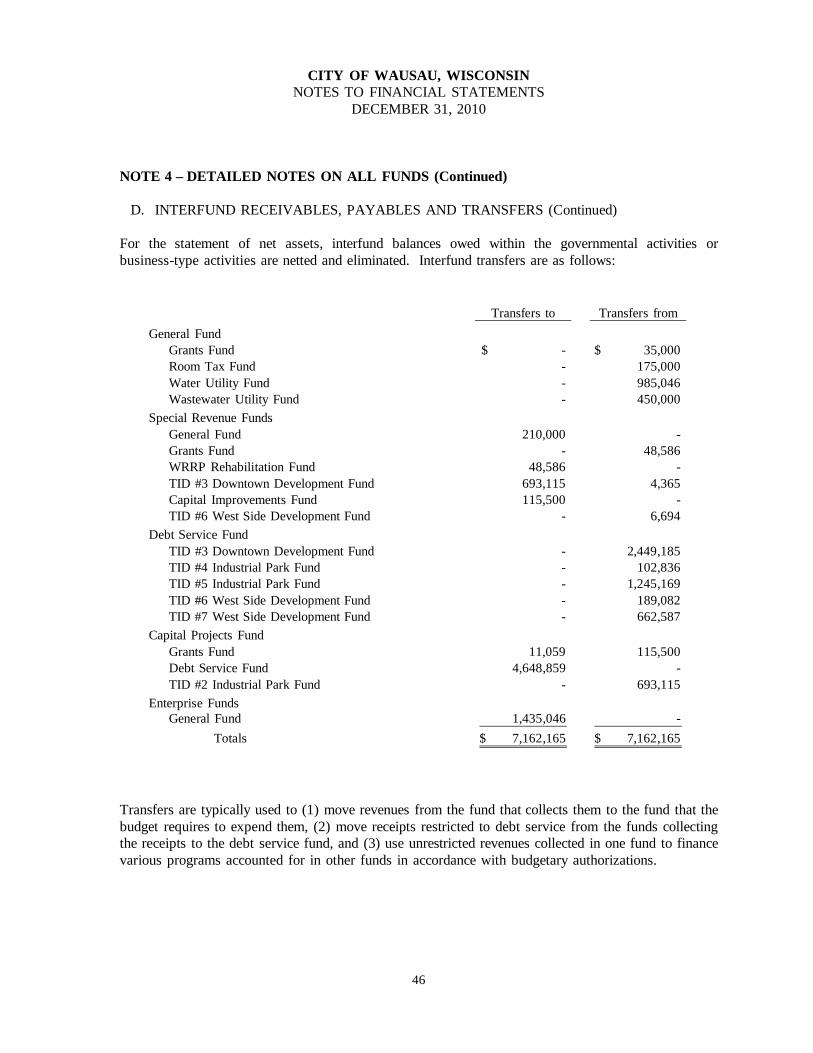
46
CITY OF WAUSAU, WISCONSIN NOTES TO FINANCIAL STATEMENTS
DECEMBER 31, 2010 NOTE 4 – DETAILED NOTES ON ALL FUNDS (Continued) D. INTERFUND RECEIVABLES, PAYABLES AND TRANSFERS (Continued) For the statement of net assets, interfund balances owed within the governmental activities or business-type activities are netted and eliminated. Interfund transfers are as follows:
Transfers to Transfers fromGeneral Fund Grants Fund -$ 35,000$ Room Tax Fund - 175,000 Water Utility Fund - 985,046 Wastewater Utility Fund - 450,000 Special Revenue Funds General Fund 210,000 - Grants Fund - 48,586 WRRP Rehabilitation Fund 48,586 - TID #3 Downtown Development Fund 693,115 4,365 Capital Improvements Fund 115,500 - TID #6 West Side Development Fund - 6,694 Debt Service Fund TID #3 Downtown Development Fund - 2,449,185 TID #4 Industrial Park Fund - 102,836 TID #5 Industrial Park Fund - 1,245,169 TID #6 West Side Development Fund - 189,082 TID #7 West Side Development Fund - 662,587 Capital Projects Fund Grants Fund 11,059 115,500 Debt Service Fund 4,648,859 - TID #2 Industrial Park Fund - 693,115 Enterprise Funds General Fund 1,435,046 -
Totals 7,162,165$ 7,162,165$
Transfers are typically used to (1) move revenues from the fund that collects them to the fund that the budget requires to expend them, (2) move receipts restricted to debt service from the funds collecting the receipts to the debt service fund, and (3) use unrestricted revenues collected in one fund to finance various programs accounted for in other funds in accordance with budgetary authorizations.
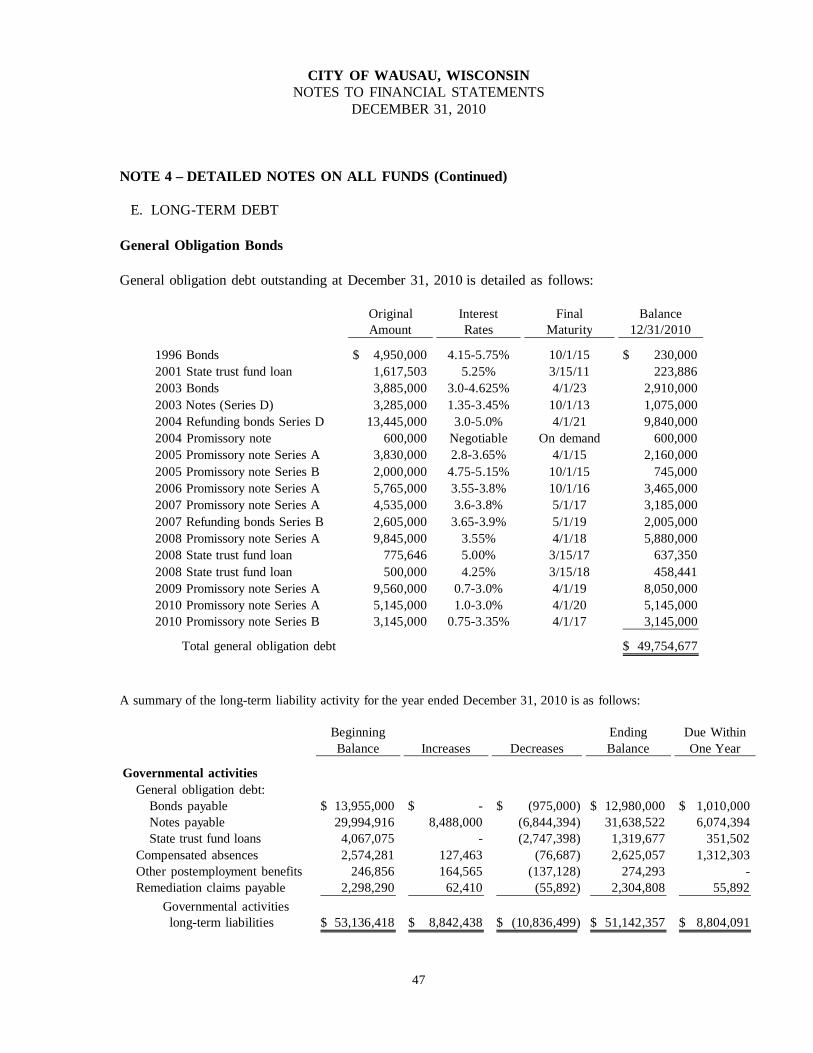
47
CITY OF WAUSAU, WISCONSIN NOTES TO FINANCIAL STATEMENTS
DECEMBER 31, 2010 NOTE 4 – DETAILED NOTES ON ALL FUNDS (Continued) E. LONG-TERM DEBT General Obligation Bonds General obligation debt outstanding at December 31, 2010 is detailed as follows:
Original Interest Final BalanceAmount Rates Maturity 12/31/2010
1996 Bonds 4,950,000$ 4.15-5.75% 10/1/15 230,000$ 2001 State trust fund loan 1,617,503 5.25% 3/15/11 223,886 2003 Bonds 3,885,000 3.0-4.625% 4/1/23 2,910,000 2003 Notes (Series D) 3,285,000 1.35-3.45% 10/1/13 1,075,000 2004 Refunding bonds Series D 13,445,000 3.0-5.0% 4/1/21 9,840,000 2004 Promissory note 600,000 Negotiable On demand 600,000 2005 Promissory note Series A 3,830,000 2.8-3.65% 4/1/15 2,160,000 2005 Promissory note Series B 2,000,000 4.75-5.15% 10/1/15 745,000 2006 Promissory note Series A 5,765,000 3.55-3.8% 10/1/16 3,465,000 2007 Promissory note Series A 4,535,000 3.6-3.8% 5/1/17 3,185,000 2007 Refunding bonds Series B 2,605,000 3.65-3.9% 5/1/19 2,005,000 2008 Promissory note Series A 9,845,000 3.55% 4/1/18 5,880,000 2008 State trust fund loan 775,646 5.00% 3/15/17 637,350 2008 State trust fund loan 500,000 4.25% 3/15/18 458,441 2009 Promissory note Series A 9,560,000 0.7-3.0% 4/1/19 8,050,000 2010 Promissory note Series A 5,145,000 1.0-3.0% 4/1/20 5,145,000 2010 Promissory note Series B 3,145,000 0.75-3.35% 4/1/17 3,145,000
Total general obligation debt 49,754,677$
A summary of the long-term liability activity for the year ended December 31, 2010 is as follows:
Beginning Ending Due WithinBalance Increases Decreases Balance One Year
Governmental activities General obligation debt: Bonds payable 13,955,000$ -$ (975,000)$ 12,980,000$ 1,010,000$ Notes payable 29,994,916 8,488,000 (6,844,394) 31,638,522 6,074,394 State trust fund loans 4,067,075 - (2,747,398) 1,319,677 351,502 Compensated absences 2,574,281 127,463 (76,687) 2,625,057 1,312,303 Other postemployment benefits 246,856 164,565 (137,128) 274,293 - Remediation claims payable 2,298,290 62,410 (55,892) 2,304,808 55,892 Governmental activities long-term liabilities 53,136,418$ 8,842,438$ (10,836,499)$ 51,142,357$ 8,804,091$
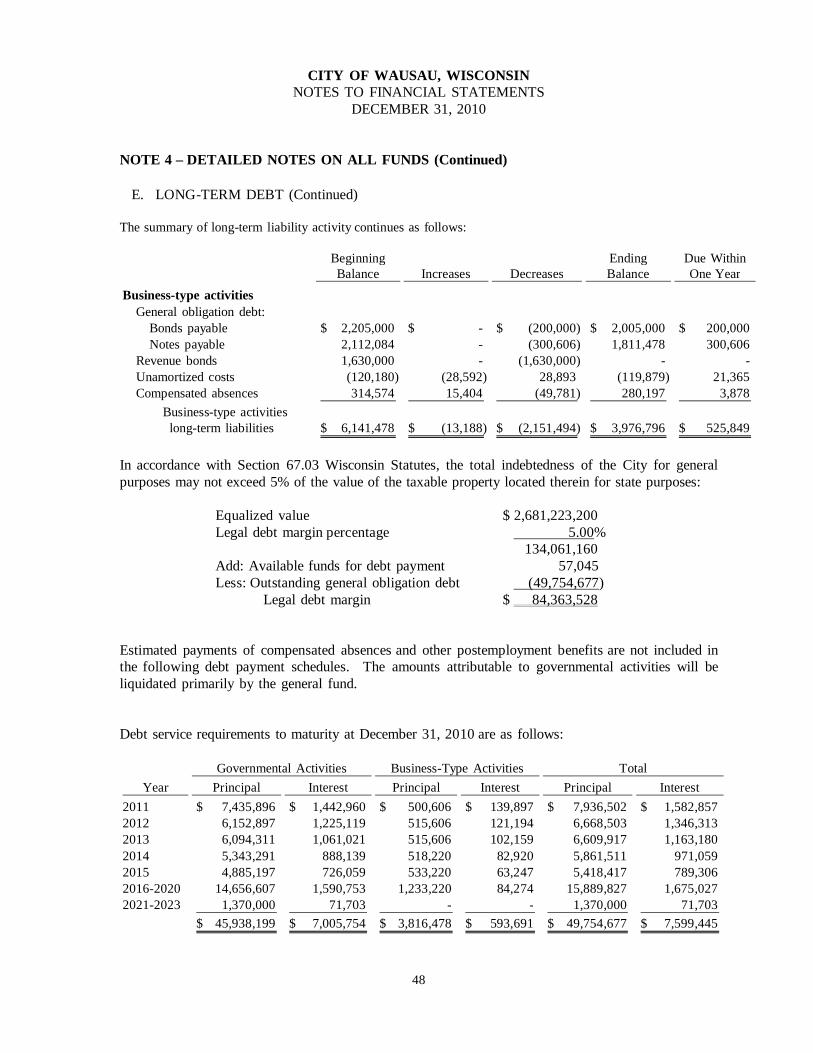
48
CITY OF WAUSAU, WISCONSIN NOTES TO FINANCIAL STATEMENTS
DECEMBER 31, 2010 NOTE 4 – DETAILED NOTES ON ALL FUNDS (Continued)
E. LONG-TERM DEBT (Continued) The summary of long-term liability activity continues as follows:
Beginning Ending Due WithinBalance Increases Decreases Balance One Year
Business-type activities General obligation debt: Bonds payable 2,205,000$ -$ (200,000)$ 2,005,000$ 200,000$ Notes payable 2,112,084 - (300,606) 1,811,478 300,606 Revenue bonds 1,630,000 - (1,630,000) - - Unamortized costs (120,180) (28,592) 28,893 (119,879) 21,365 Compensated absences 314,574 15,404 (49,781) 280,197 3,878 Business-type activities long-term liabilities 6,141,478$ (13,188)$ (2,151,494)$ 3,976,796$ 525,849$ In accordance with Section 67.03 Wisconsin Statutes, the total indebtedness of the City for general purposes may not exceed 5% of the value of the taxable property located therein for state purposes: Equalized value $ 2,681,223,200 Legal debt margin percentage 5.00% 134,061,160 Add: Available funds for debt payment 57,045 Less: Outstanding general obligation debt (49,754,677) Legal debt margin $ 84,363,528 Estimated payments of compensated absences and other postemployment benefits are not included in the following debt payment schedules. The amounts attributable to governmental activities will be liquidated primarily by the general fund. Debt service requirements to maturity at December 31, 2010 are as follows:
Governmental Activities Business-Type Activities TotalYear Principal Interest Principal Interest Principal Interest
2011 7,435,896$ 1,442,960$ 500,606$ 139,897$ 7,936,502$ 1,582,857$ 2012 6,152,897 1,225,119 515,606 121,194 6,668,503 1,346,313 2013 6,094,311 1,061,021 515,606 102,159 6,609,917 1,163,180 2014 5,343,291 888,139 518,220 82,920 5,861,511 971,059 2015 4,885,197 726,059 533,220 63,247 5,418,417 789,306 2016-2020 14,656,607 1,590,753 1,233,220 84,274 15,889,827 1,675,027 2021-2023 1,370,000 71,703 - - 1,370,000 71,703
45,938,199$ 7,005,754$ 3,816,478$ 593,691$ 49,754,677$ 7,599,445$
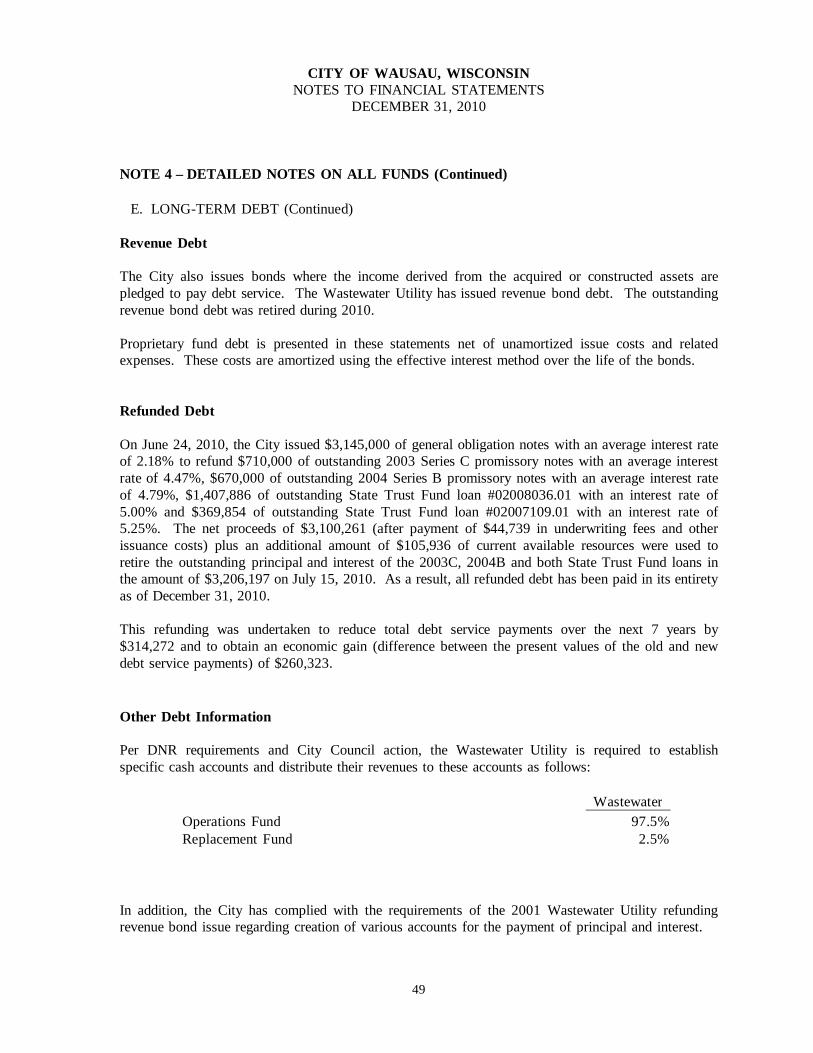
49
CITY OF WAUSAU, WISCONSIN
NOTES TO FINANCIAL STATEMENTS DECEMBER 31, 2010
NOTE 4 – DETAILED NOTES ON ALL FUNDS (Continued) E. LONG-TERM DEBT (Continued) Revenue Debt The City also issues bonds where the income derived from the acquired or constructed assets are pledged to pay debt service. The Wastewater Utility has issued revenue bond debt. The outstanding revenue bond debt was retired during 2010. Proprietary fund debt is presented in these statements net of unamortized issue costs and related expenses. These costs are amortized using the effective interest method over the life of the bonds. Refunded Debt On June 24, 2010, the City issued $3,145,000 of general obligation notes with an average interest rate of 2.18% to refund $710,000 of outstanding 2003 Series C promissory notes with an average interest rate of 4.47%, $670,000 of outstanding 2004 Series B promissory notes with an average interest rate of 4.79%, $1,407,886 of outstanding State Trust Fund loan #02008036.01 with an interest rate of 5.00% and $369,854 of outstanding State Trust Fund loan #02007109.01 with an interest rate of 5.25%. The net proceeds of $3,100,261 (after payment of $44,739 in underwriting fees and other issuance costs) plus an additional amount of $105,936 of current available resources were used to retire the outstanding principal and interest of the 2003C, 2004B and both State Trust Fund loans in the amount of $3,206,197 on July 15, 2010. As a result, all refunded debt has been paid in its entirety as of December 31, 2010. This refunding was undertaken to reduce total debt service payments over the next 7 years by $314,272 and to obtain an economic gain (difference between the present values of the old and new debt service payments) of $260,323. Other Debt Information Per DNR requirements and City Council action, the Wastewater Utility is required to establish specific cash accounts and distribute their revenues to these accounts as follows:
WastewaterOperations Fund 97.5%Replacement Fund 2.5%
In addition, the City has complied with the requirements of the 2001 Wastewater Utility refunding revenue bond issue regarding creation of various accounts for the payment of principal and interest.
50
CITY OF WAUSAU, WISCONSIN NOTES TO FINANCIAL STATEMENTS
DECEMBER 31, 2010 NOTE 4 – DETAILED NOTES ON ALL FUNDS (Continued)
E. LONG-TERM DEBT (Continued) Conduit Debt Obligations From time to time, the City has issued Industrial Revenue Bonds to provide financial assistance to private-sector entities for acquisition and construction of industrial and commercial facilities deemed to be in the public interest. The bonds are secured by the property financed and are payable solely from payments received on the underlying mortgage loans. Upon repayment of the bonds, ownership of the acquired facilities transfers to the private entity served by the bond issuance. Neither the City, the State, nor any political subdivision thereof is obligated in any manner for repayment of the bonds. Accordingly, the bonds are not reported as liabilities in the accompanying financial statements. As of December 31, 2010, there were five series of Industrial Revenue Bonds outstanding. Total principal amount payable could not be determined, however, original issue amounts totaled $19,200,000.
F. SEGMENT INFORMATION The City maintains three Enterprise Funds providing for the operation of the Water, Wastewater and Parking Utilities. As previously noted, the Wastewater Utility has issued revenue bonds to finance acquisition and construction of assets. Investors in the revenue bonds rely solely on the revenue generated by the individual activities for repayment. All Enterprise funds have been presented as major funds in the City’s government-wide financial statements.
G. RESTRICTED NET ASSETS/FUND BALANCES Governmental activities restricted assets reported in the government-wide statement of net assets at December 31, 2010 includes the following:
Net assets restricted for : Capital assets, net of related debt 75,413,530$ Debt service 2,223,300 Capital improvements 856,296 Trust purposes 631,450
Total governmental activities restricted net assets 79,124,576$
51
CITY OF WAUSAU, WISCONSIN NOTES TO FINANCIAL STATEMENTS
DECEMBER 31, 2010 NOTE 4 – DETAILED NOTES ON ALL FUNDS (Continued) G. RESTRICTED NET ASSETS/FUND BALANCES (Continued) Portions of fund balances reported on the fund financial statements at December 31, 2010 that are reserved and not available for current appropriation or expenditure are as follows:
Major funds: General Fund Reserved for advances 1,839,138$ Reserved for inventories and prepayments 364,724
Total General Fund 2,203,862
Debt Service Fund Reserved for debt service 57,045
Nonmajor funds: Special revenue funds Holtz-Krause Clean-Up Fund
Reserved for debt service 1,761,575 Wausau Area Transit System Fund
Reserved for inventories and prepayments 203,992 Trust Accounts Fund
Reserved for trust purposes 631,450 Total Nonmajor funds 2,597,017
Total Reserved Fund Balance 4,857,924$
Unreserved fund balance as of December 31, 2010 for major funds includes the following items:
Major funds: General Fund Designated for contingencies 500,000$ Designated for subsequent year's expenditures 1,013,496 Undesignated 5,545,637
Total General Fund 7,059,133$
TID #3 Downtown Development Fund Designated for subsequent year's expenditures 1,312,643$
Capital Improvements Fund Designated for subsequent year's expenditures 4,211,788$
52
CITY OF WAUSAU, WISCONSIN NOTES TO FINANCIAL STATEMENTS
DECEMBER 31, 2010 NOTE 4 – DETAILED NOTES ON ALL FUNDS (Continued) G. RESTRICTED NET ASSETS/FUND BALANCES (Continued) Unreserved fund balance for nonmajor funds as of December 31, 2010 includes the following items:
Nonmajor funds: Special revenue funds Designated for:
Grants 1,617,416$ HUD mortgage program 19,359 DLAD mortgage program 445,159 Industrial park 116,205 Federal rent rehabilitation 356,580 WRRP rehabilitation 789,736 Hazardous materials emergency response 95,637 Room tax 58,789 Public access cable 23,144 EMS grant 40,262
UndesignatedWausau Area Transit System (deficit) (203,992) Total special revenue funds 3,358,295$
Capital project funds Designated for:
TID #5 Industrial Park 311,963$ TID #6 West Side Development 552,698
UndesignatedTID #4 Industrial Park (deficit) (1,447,489) TID #7 West Side Development (deficit) (736,276) Total capital project funds (1,319,104)$
H. RESTRICTED ASSETS
The balances of the restricted asset accounts in the Enterprise Funds are as follows:
Water WastewaterUtility Utility
General obligation debt redemption account 276,742$ -$ Depreciation/Replacement accounts - 1,181,338 Total restricted assets 276,742$ 1,181,338$
53
CITY OF WAUSAU, WISCONSIN NOTES TO FINANCIAL STATEMENTS
DECEMBER 31, 2010 NOTE 4 – DETAILED NOTES ON ALL FUNDS (Continued)
I. COMPONENT UNIT
The financial records of the City of Wausau Community Development Authority (CDA) are maintained in accordance with the accounting practices prescribed by the United States Department of Housing and Urban Development (HUD). Financial information for the Authority is presented as a discrete column in the statement of net assets and statement of activities. In addition to the basic financial statements and the preceding applicable notes to the financial statements, the following additional disclosures are considered necessary for fair presentation.
a. The Authority follows the full accrual basis of accounting and the flow of economic resources measurement focus.
b. The composition of cash, cash equivalents and investments at December 31, 2010 is as
follows:
Deposits 5,473,939$ Certificates of deposit 2,530,857 Petty cash 195
Total 8,004,991$
Financial statement presentation: Cash and cash equivalents 5,174,616$ Cash and cash equivalents - restricted 299,518 Investments 2,530,857
Total 8,004,991$
Custodial Credit Risk for Deposits Custodial credit risk for deposits is the risk that in the event of the failure of a depository financial institution, the CDA will not be able to recover deposits or will not be able to recover collateral securities that are in the possession of an outside party. The CDA requires all funds in excess of federal depository insurance coverage to be secured. At year end, the carrying value of the Community Development Authority’s deposits was $8,004,991 and the financial institution balance was $8,023,080. Of the financial institution balance, $1,183,233 was covered by federal depository insurance and $6,839,847 was in excess of federal depository insurance limits and collateralized by securities held by the pledging institution or its trust department or agent but not in the CDA’s name.
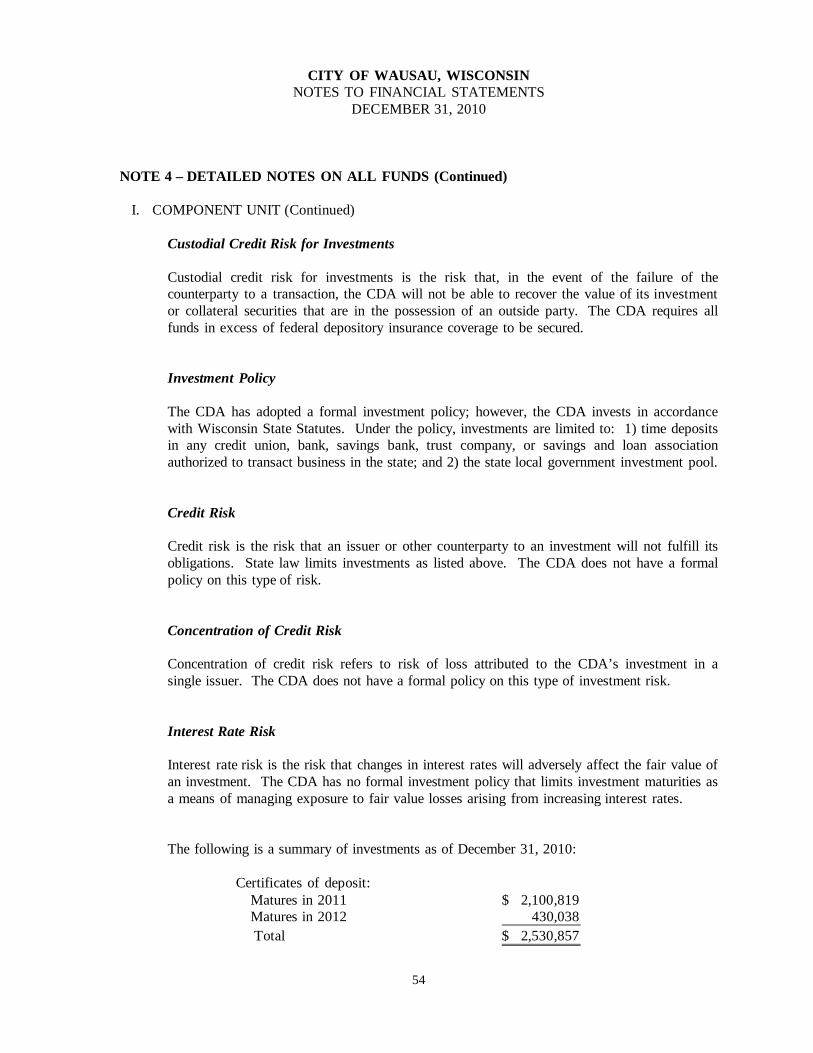
54
CITY OF WAUSAU, WISCONSIN NOTES TO FINANCIAL STATEMENTS
DECEMBER 31, 2010 NOTE 4 – DETAILED NOTES ON ALL FUNDS (Continued)
I. COMPONENT UNIT (Continued)
Custodial Credit Risk for Investments Custodial credit risk for investments is the risk that, in the event of the failure of the counterparty to a transaction, the CDA will not be able to recover the value of its investment or collateral securities that are in the possession of an outside party. The CDA requires all funds in excess of federal depository insurance coverage to be secured. Investment Policy The CDA has adopted a formal investment policy; however, the CDA invests in accordance with Wisconsin State Statutes. Under the policy, investments are limited to: 1) time deposits in any credit union, bank, savings bank, trust company, or savings and loan association authorized to transact business in the state; and 2) the state local government investment pool. Credit Risk Credit risk is the risk that an issuer or other counterparty to an investment will not fulfill its obligations. State law limits investments as listed above. The CDA does not have a formal policy on this type of risk. Concentration of Credit Risk
Concentration of credit risk refers to risk of loss attributed to the CDA’s investment in a single issuer. The CDA does not have a formal policy on this type of investment risk. Interest Rate Risk
Interest rate risk is the risk that changes in interest rates will adversely affect the fair value of an investment. The CDA has no formal investment policy that limits investment maturities as a means of managing exposure to fair value losses arising from increasing interest rates. The following is a summary of investments as of December 31, 2010:
Certificates of deposit: Matures in 2011 2,100,819$ Matures in 2012 430,038 Total 2,530,857$
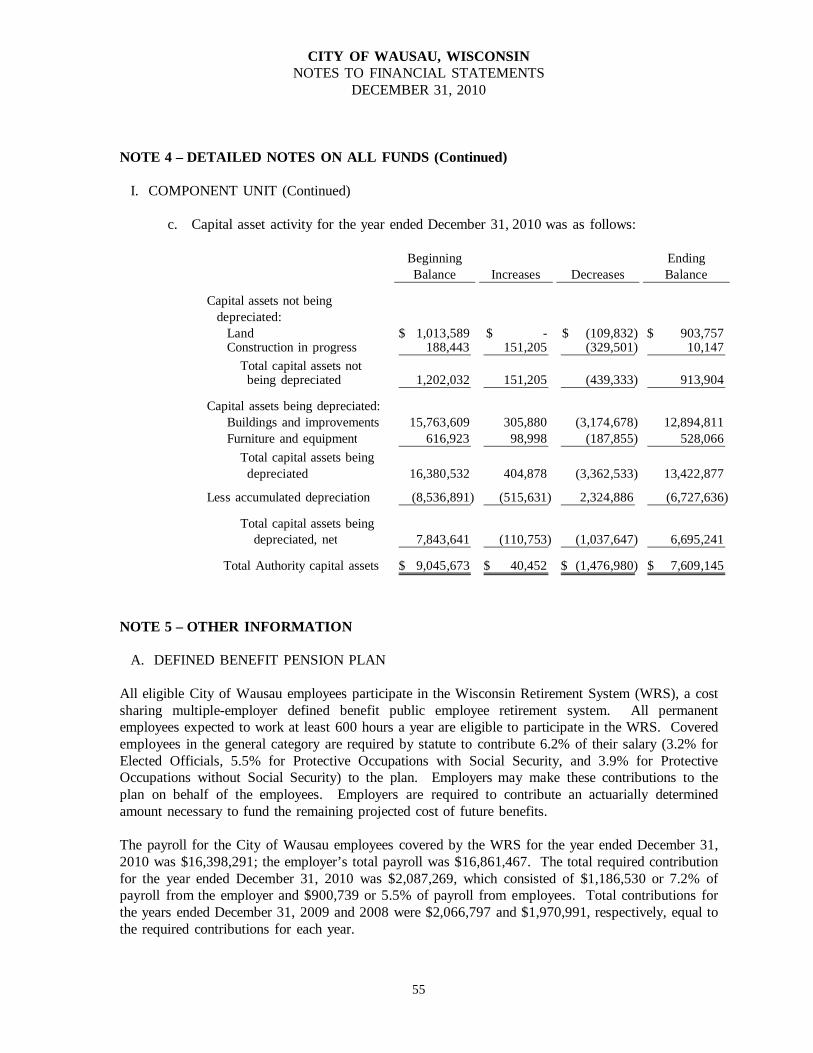
55
CITY OF WAUSAU, WISCONSIN NOTES TO FINANCIAL STATEMENTS
DECEMBER 31, 2010 NOTE 4 – DETAILED NOTES ON ALL FUNDS (Continued) I. COMPONENT UNIT (Continued)
c. Capital asset activity for the year ended December 31, 2010 was as follows:
Beginning EndingBalance Increases Decreases Balance
Capital assets not being depreciated: Land 1,013,589$ -$ (109,832)$ 903,757$ Construction in progress 188,443 151,205 (329,501) 10,147 Total capital assets not being depreciated 1,202,032 151,205 (439,333) 913,904
Capital assets being depreciated: Buildings and improvements 15,763,609 305,880 (3,174,678) 12,894,811 Furniture and equipment 616,923 98,998 (187,855) 528,066 Total capital assets being depreciated 16,380,532 404,878 (3,362,533) 13,422,877
Less accumulated depreciation (8,536,891) (515,631) 2,324,886 (6,727,636)
Total capital assets being depreciated, net 7,843,641 (110,753) (1,037,647) 6,695,241
Total Authority capital assets 9,045,673$ 40,452$ (1,476,980)$ 7,609,145$
NOTE 5 – OTHER INFORMATION A. DEFINED BENEFIT PENSION PLAN All eligible City of Wausau employees participate in the Wisconsin Retirement System (WRS), a cost sharing multiple-employer defined benefit public employee retirement system. All permanent employees expected to work at least 600 hours a year are eligible to participate in the WRS. Covered employees in the general category are required by statute to contribute 6.2% of their salary (3.2% for Elected Officials, 5.5% for Protective Occupations with Social Security, and 3.9% for Protective Occupations without Social Security) to the plan. Employers may make these contributions to the plan on behalf of the employees. Employers are required to contribute an actuarially determined amount necessary to fund the remaining projected cost of future benefits. The payroll for the City of Wausau employees covered by the WRS for the year ended December 31, 2010 was $16,398,291; the employer’s total payroll was $16,861,467. The total required contribution for the year ended December 31, 2010 was $2,087,269, which consisted of $1,186,530 or 7.2% of payroll from the employer and $900,739 or 5.5% of payroll from employees. Total contributions for the years ended December 31, 2009 and 2008 were $2,066,797 and $1,970,991, respectively, equal to the required contributions for each year.
56
CITY OF WAUSAU, WISCONSIN NOTES TO FINANCIAL STATEMENTS
DECEMBER 31, 2010 NOTE 5 – OTHER INFORMATION (Continued) A. DEFINED BENEFIT PENSION PLAN (Continued) Employees who retire at or after age 65 (62 for elected officials and 54 for protective occupation employees with less than 25 years of service, 53 for protective occupation employees with more than 25 years of service) are entitled to receive retirement benefits. Employees may retire at age 55 (50 for protective occupation employees) and receive actuarially reduced benefits. The factors influencing the benefit are: (1) final average earnings, (2) years of creditable service, and (3) a formula factor. Final Average Earnings is the average of the employees’ three highest years earnings. Employees terminating covered employment and submitting application before becoming eligible for retirement benefits may withdraw their contributions and, by doing so, forfeit all rights to any subsequent benefits. For employees beginning participation on or after January 1, 1990, and no longer actively employed on or after April 24, 1998, creditable service in each of five years is required for eligibility for a retirement annuity. Participants employed prior to 1990 and on or after April 24, 1998 are immediately vested. The WRS also provides death and disability benefits for employees. Eligibility for and the amount of all benefits are determined under Chapter 40 of the Wisconsin Statutes. The WRS issues an annual financial report that may be obtained by writing to the Department of Employee Trust Funds, PO Box 7931, Madison, WI 53707-7931. In addition to the above-mentioned retirement fund, the State of Wisconsin administers a plan for nine (9) employees who retired prior to the consolidation with the WRS. The total estimated future cost to the City of this plan as of December 31, 2010, was approximately $270,525, substantially all of which relates to prior services. The current portion of the estimated liability of $57,487 is provided for in the General Fund. The liability will be reduced as the City funds the benefit payments. The estimated remaining period of amortization is six years.
B. COMMITMENTS AND CONTINGENCIES LITIGATION The City is currently involved in several legal proceedings. The City intends to vigorously defend any litigation. It is the opinion of management and the City’s legal counsel that the ultimate outcome of any litigation will not have a material adverse effect on the City’s financial position. RISK MANAGEMENT The City is exposed to various risks of loss related to torts; theft of, damage to and destruction of assets; errors and omission; injuries to employees; and natural disasters. The City purchases commercial insurance to protect against these potential losses. No significant reductions in prior year insurance coverage has occurred. Settled claims have not exceeded commercial coverage in any of the past three fiscal years.
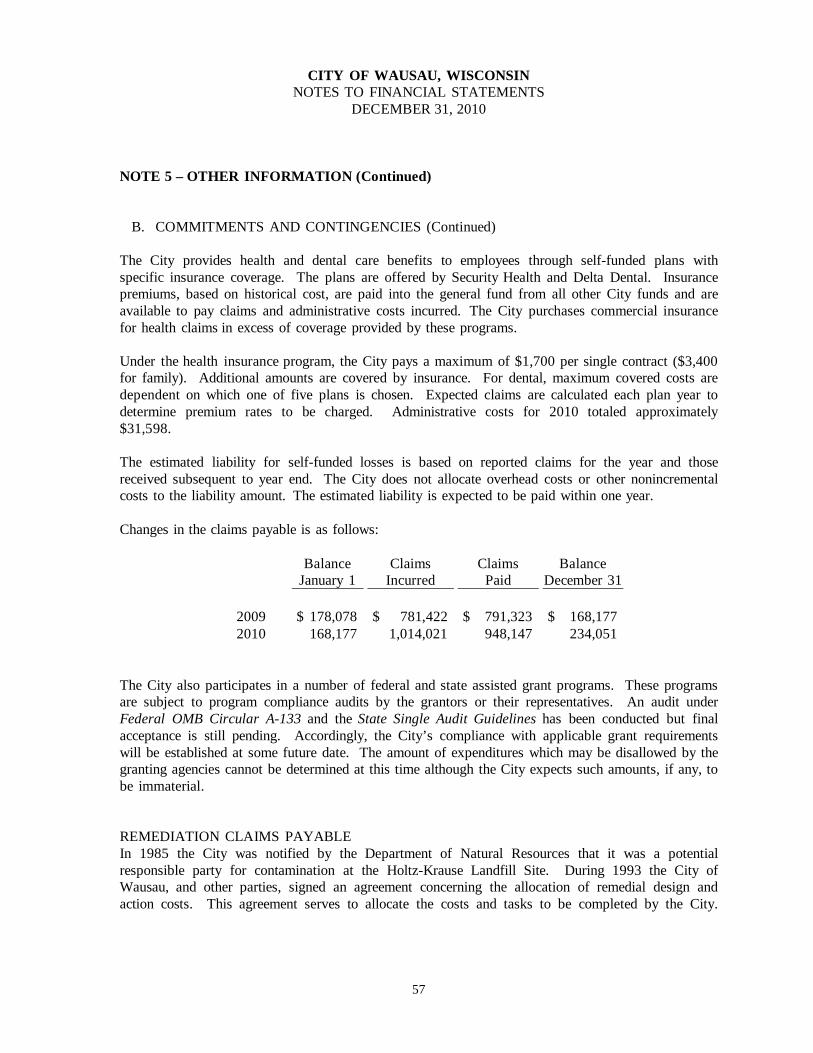
57
CITY OF WAUSAU, WISCONSIN NOTES TO FINANCIAL STATEMENTS
DECEMBER 31, 2010 NOTE 5 – OTHER INFORMATION (Continued)
B. COMMITMENTS AND CONTINGENCIES (Continued) The City provides health and dental care benefits to employees through self-funded plans with specific insurance coverage. The plans are offered by Security Health and Delta Dental. Insurance premiums, based on historical cost, are paid into the general fund from all other City funds and are available to pay claims and administrative costs incurred. The City purchases commercial insurance for health claims in excess of coverage provided by these programs. Under the health insurance program, the City pays a maximum of $1,700 per single contract ($3,400 for family). Additional amounts are covered by insurance. For dental, maximum covered costs are dependent on which one of five plans is chosen. Expected claims are calculated each plan year to determine premium rates to be charged. Administrative costs for 2010 totaled approximately $31,598. The estimated liability for self-funded losses is based on reported claims for the year and those received subsequent to year end. The City does not allocate overhead costs or other nonincremental costs to the liability amount. The estimated liability is expected to be paid within one year. Changes in the claims payable is as follows:
Balance Claims Claims BalanceJanuary 1 Incurred Paid December 31
2009 178,078$ 781,422$ 791,323$ 168,177$ 2010 168,177 1,014,021 948,147 234,051
The City also participates in a number of federal and state assisted grant programs. These programs are subject to program compliance audits by the grantors or their representatives. An audit under Federal OMB Circular A-133 and the State Single Audit Guidelines has been conducted but final acceptance is still pending. Accordingly, the City’s compliance with applicable grant requirements will be established at some future date. The amount of expenditures which may be disallowed by the granting agencies cannot be determined at this time although the City expects such amounts, if any, to be immaterial. REMEDIATION CLAIMS PAYABLE In 1985 the City was notified by the Department of Natural Resources that it was a potential responsible party for contamination at the Holtz-Krause Landfill Site. During 1993 the City of Wausau, and other parties, signed an agreement concerning the allocation of remedial design and action costs. This agreement serves to allocate the costs and tasks to be completed by the City.
58
CITY OF WAUSAU, WISCONSIN NOTES TO FINANCIAL STATEMENTS
DECEMBER 31, 2010
NOTE 5 – OTHER INFORMATION (Continued)
B. COMMITMENTS AND CONTINGENCIES (Continued) The City’s responsibility is to perform various operations and maintenance of the groundwater monitoring up to a cap of the equivalent of a contribution of $1.8 million dollars deposited in a bank on January 1, 1994, bearing interest of one percentage above the Local Government Investment Pool rate. If the total amount is not utilized in the operation and maintenance, the balance will revert to the City. Based upon this agreement, the City shall be held harmless relating to any future claims arising from the Consent Decree. This item has been recorded as a long-term liability in these financial statements. The balance at December 31, 2010 is $2,304,808. This balance represents the original $1.8 million adjusted for interest income and expenses incurred. The City has negotiated a structured settlement agreement with its insurance carrier to recover anticipated costs. Contract payments are recorded as revenue in the year received.
C. ACCUMULATED UNPAID EMPLOYEE BENEFITS City employees generally earn vacation and sick leave at different rates depending upon years of service. Vacation and sick leave accumulate on a biweekly basis. A liability for accrued vacation benefits of $987,055 has been recorded in the government-wide statement of net assets. When an employee retires or is forced to retire due to medical disability and meets specified requirements, a maximum of 60% (100% for management employees with at least 30 years of service) of the remaining accumulated sick pay (employee’s hourly rate, exclusive of longevity and shift differential) is used to pay premiums toward the hospital and surgical program then in effect for the employee. The liability for these benefits for current employees was $1,294,873 at December 31, 2010, and has also been recorded in the statement of net assets. The employee may use the foregoing benefit until such time as one of the following occurs:
1. The fund is depleted, 2. The employee dies, or 3. The employee becomes employed and/or eligible for other comparable hospital and
surgical programs from another source. In order to be eligible for the above-described benefit, the employee must meet all the following conditions:
1. Apply for Wisconsin Retirement Fund benefits within thirty (30) days of the last day of work, and
2. Whenever possible, in cases of voluntary retirement, give the employer notice of retirement and intent to utilize the benefits by December 1 preceding the retirement date.
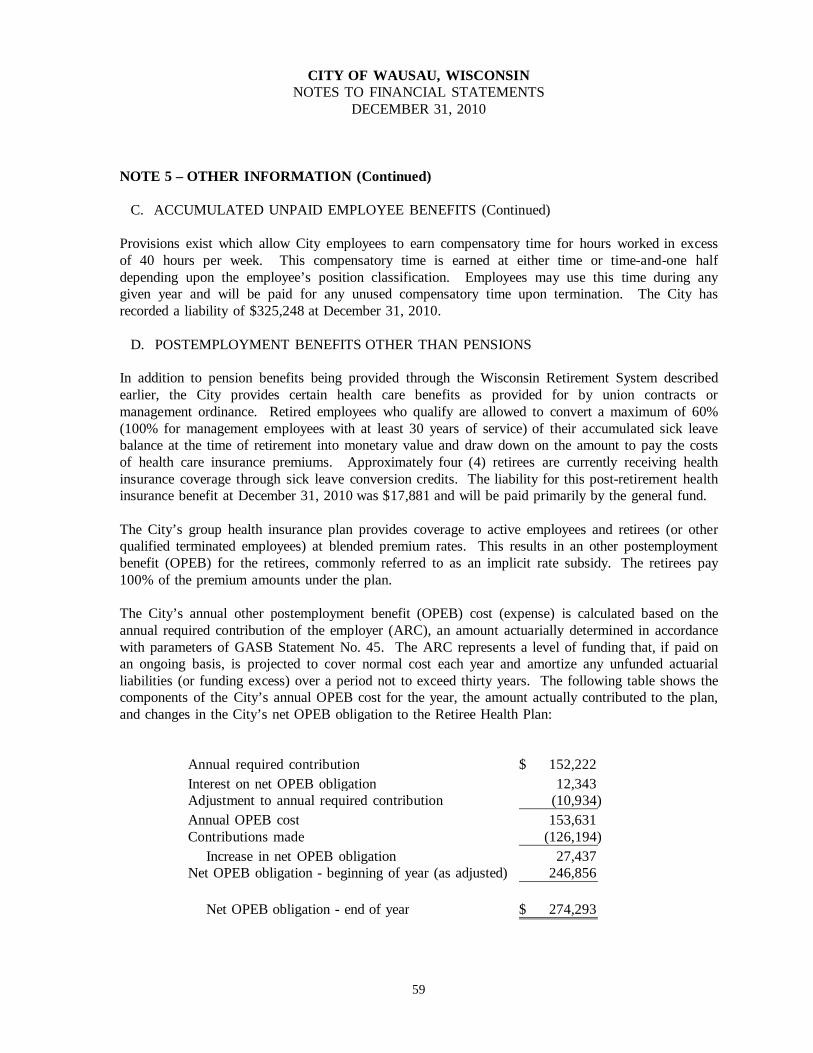
59
CITY OF WAUSAU, WISCONSIN NOTES TO FINANCIAL STATEMENTS
DECEMBER 31, 2010
NOTE 5 – OTHER INFORMATION (Continued) C. ACCUMULATED UNPAID EMPLOYEE BENEFITS (Continued)
Provisions exist which allow City employees to earn compensatory time for hours worked in excess of 40 hours per week. This compensatory time is earned at either time or time-and-one half depending upon the employee’s position classification. Employees may use this time during any given year and will be paid for any unused compensatory time upon termination. The City has recorded a liability of $325,248 at December 31, 2010. D. POSTEMPLOYMENT BENEFITS OTHER THAN PENSIONS In addition to pension benefits being provided through the Wisconsin Retirement System described earlier, the City provides certain health care benefits as provided for by union contracts or management ordinance. Retired employees who qualify are allowed to convert a maximum of 60% (100% for management employees with at least 30 years of service) of their accumulated sick leave balance at the time of retirement into monetary value and draw down on the amount to pay the costs of health care insurance premiums. Approximately four (4) retirees are currently receiving health insurance coverage through sick leave conversion credits. The liability for this post-retirement health insurance benefit at December 31, 2010 was $17,881 and will be paid primarily by the general fund. The City’s group health insurance plan provides coverage to active employees and retirees (or other qualified terminated employees) at blended premium rates. This results in an other postemployment benefit (OPEB) for the retirees, commonly referred to as an implicit rate subsidy. The retirees pay 100% of the premium amounts under the plan. The City’s annual other postemployment benefit (OPEB) cost (expense) is calculated based on the annual required contribution of the employer (ARC), an amount actuarially determined in accordance with parameters of GASB Statement No. 45. The ARC represents a level of funding that, if paid on an ongoing basis, is projected to cover normal cost each year and amortize any unfunded actuarial liabilities (or funding excess) over a period not to exceed thirty years. The following table shows the components of the City’s annual OPEB cost for the year, the amount actually contributed to the plan, and changes in the City’s net OPEB obligation to the Retiree Health Plan:
Annual required contribution 152,222$ Interest on net OPEB obligation 12,343 Adjustment to annual required contribution (10,934) Annual OPEB cost 153,631 Contributions made (126,194) Increase in net OPEB obligation 27,437 Net OPEB obligation - beginning of year (as adjusted) 246,856
Net OPEB obligation - end of year 274,293$
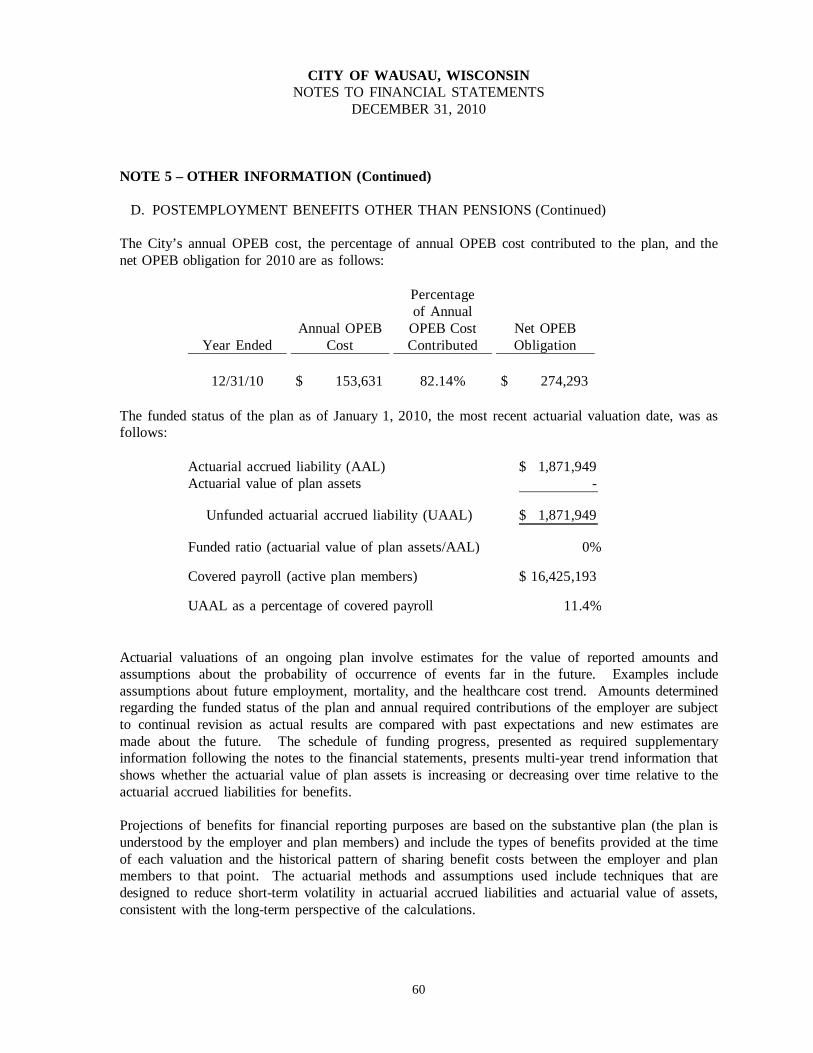
60
CITY OF WAUSAU, WISCONSIN NOTES TO FINANCIAL STATEMENTS
DECEMBER 31, 2010 NOTE 5 – OTHER INFORMATION (Continued) D. POSTEMPLOYMENT BENEFITS OTHER THAN PENSIONS (Continued) The City’s annual OPEB cost, the percentage of annual OPEB cost contributed to the plan, and the net OPEB obligation for 2010 are as follows:
Percentageof Annual
Annual OPEB OPEB Cost Net OPEBYear Ended Cost Contributed Obligation
12/31/10 153,631$ 82.14% 274,293$ The funded status of the plan as of January 1, 2010, the most recent actuarial valuation date, was as follows:
Actuarial accrued liability (AAL) 1,871,949$ Actuarial value of plan assets -
Unfunded actuarial accrued liability (UAAL) 1,871,949$
Funded ratio (actuarial value of plan assets/AAL) 0%
Covered payroll (active plan members) 16,425,193$
UAAL as a percentage of covered payroll 11.4% Actuarial valuations of an ongoing plan involve estimates for the value of reported amounts and assumptions about the probability of occurrence of events far in the future. Examples include assumptions about future employment, mortality, and the healthcare cost trend. Amounts determined regarding the funded status of the plan and annual required contributions of the employer are subject to continual revision as actual results are compared with past expectations and new estimates are made about the future. The schedule of funding progress, presented as required supplementary information following the notes to the financial statements, presents multi-year trend information that shows whether the actuarial value of plan assets is increasing or decreasing over time relative to the actuarial accrued liabilities for benefits. Projections of benefits for financial reporting purposes are based on the substantive plan (the plan is understood by the employer and plan members) and include the types of benefits provided at the time of each valuation and the historical pattern of sharing benefit costs between the employer and plan members to that point. The actuarial methods and assumptions used include techniques that are designed to reduce short-term volatility in actuarial accrued liabilities and actuarial value of assets, consistent with the long-term perspective of the calculations.
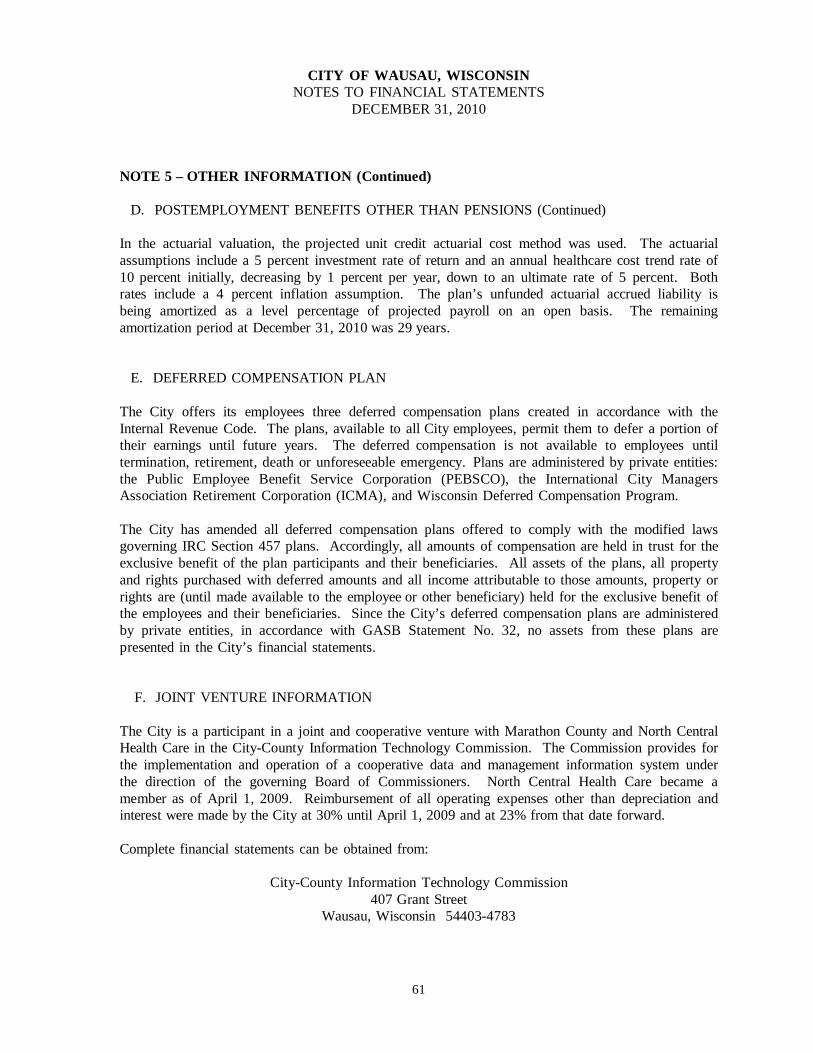
61
CITY OF WAUSAU, WISCONSIN NOTES TO FINANCIAL STATEMENTS
DECEMBER 31, 2010 NOTE 5 – OTHER INFORMATION (Continued) D. POSTEMPLOYMENT BENEFITS OTHER THAN PENSIONS (Continued) In the actuarial valuation, the projected unit credit actuarial cost method was used. The actuarial assumptions include a 5 percent investment rate of return and an annual healthcare cost trend rate of 10 percent initially, decreasing by 1 percent per year, down to an ultimate rate of 5 percent. Both rates include a 4 percent inflation assumption. The plan’s unfunded actuarial accrued liability is being amortized as a level percentage of projected payroll on an open basis. The remaining amortization period at December 31, 2010 was 29 years. E. DEFERRED COMPENSATION PLAN The City offers its employees three deferred compensation plans created in accordance with the Internal Revenue Code. The plans, available to all City employees, permit them to defer a portion of their earnings until future years. The deferred compensation is not available to employees until termination, retirement, death or unforeseeable emergency. Plans are administered by private entities: the Public Employee Benefit Service Corporation (PEBSCO), the International City Managers Association Retirement Corporation (ICMA), and Wisconsin Deferred Compensation Program. The City has amended all deferred compensation plans offered to comply with the modified laws governing IRC Section 457 plans. Accordingly, all amounts of compensation are held in trust for the exclusive benefit of the plan participants and their beneficiaries. All assets of the plans, all property and rights purchased with deferred amounts and all income attributable to those amounts, property or rights are (until made available to the employee or other beneficiary) held for the exclusive benefit of the employees and their beneficiaries. Since the City’s deferred compensation plans are administered by private entities, in accordance with GASB Statement No. 32, no assets from these plans are presented in the City’s financial statements. F. JOINT VENTURE INFORMATION The City is a participant in a joint and cooperative venture with Marathon County and North Central Health Care in the City-County Information Technology Commission. The Commission provides for the implementation and operation of a cooperative data and management information system under the direction of the governing Board of Commissioners. North Central Health Care became a member as of April 1, 2009. Reimbursement of all operating expenses other than depreciation and interest were made by the City at 30% until April 1, 2009 and at 23% from that date forward. Complete financial statements can be obtained from:
City-County Information Technology Commission 407 Grant Street
Wausau, Wisconsin 54403-4783
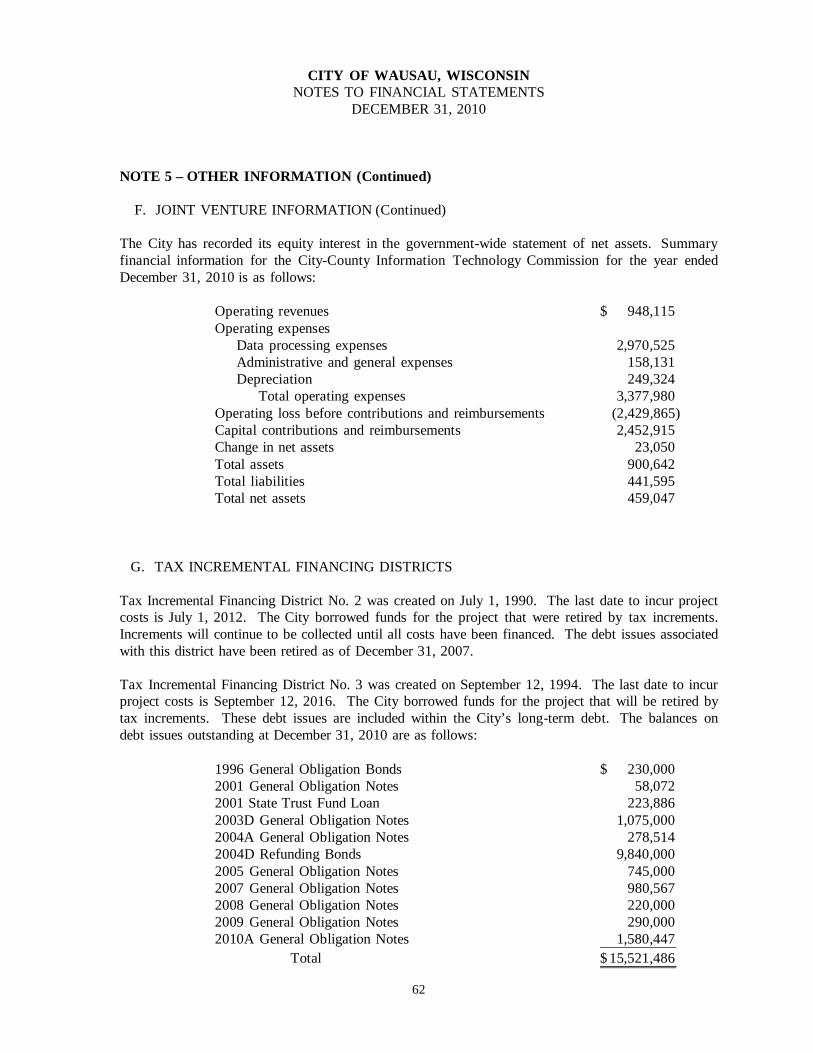
62
CITY OF WAUSAU, WISCONSIN NOTES TO FINANCIAL STATEMENTS
DECEMBER 31, 2010
NOTE 5 – OTHER INFORMATION (Continued) F. JOINT VENTURE INFORMATION (Continued) The City has recorded its equity interest in the government-wide statement of net assets. Summary financial information for the City-County Information Technology Commission for the year ended December 31, 2010 is as follows:
Operating revenues 948,115$ Operating expenses Data processing expenses 2,970,525 Administrative and general expenses 158,131 Depreciation 249,324 Total operating expenses 3,377,980 Operating loss before contributions and reimbursements (2,429,865) Capital contributions and reimbursements 2,452,915 Change in net assets 23,050 Total assets 900,642 Total liabilities 441,595 Total net assets 459,047
G. TAX INCREMENTAL FINANCING DISTRICTS Tax Incremental Financing District No. 2 was created on July 1, 1990. The last date to incur project costs is July 1, 2012. The City borrowed funds for the project that were retired by tax increments. Increments will continue to be collected until all costs have been financed. The debt issues associated with this district have been retired as of December 31, 2007. Tax Incremental Financing District No. 3 was created on September 12, 1994. The last date to incur project costs is September 12, 2016. The City borrowed funds for the project that will be retired by tax increments. These debt issues are included within the City’s long-term debt. The balances on debt issues outstanding at December 31, 2010 are as follows:
1996 General Obligation Bonds 230,000$ 2001 General Obligation Notes 58,072 2001 State Trust Fund Loan 223,886 2003D General Obligation Notes 1,075,000 2004A General Obligation Notes 278,514 2004D Refunding Bonds 9,840,000 2005 General Obligation Notes 745,000 2007 General Obligation Notes 980,567 2008 General Obligation Notes 220,000 2009 General Obligation Notes 290,000 2010A General Obligation Notes 1,580,447
Total 15,521,486$
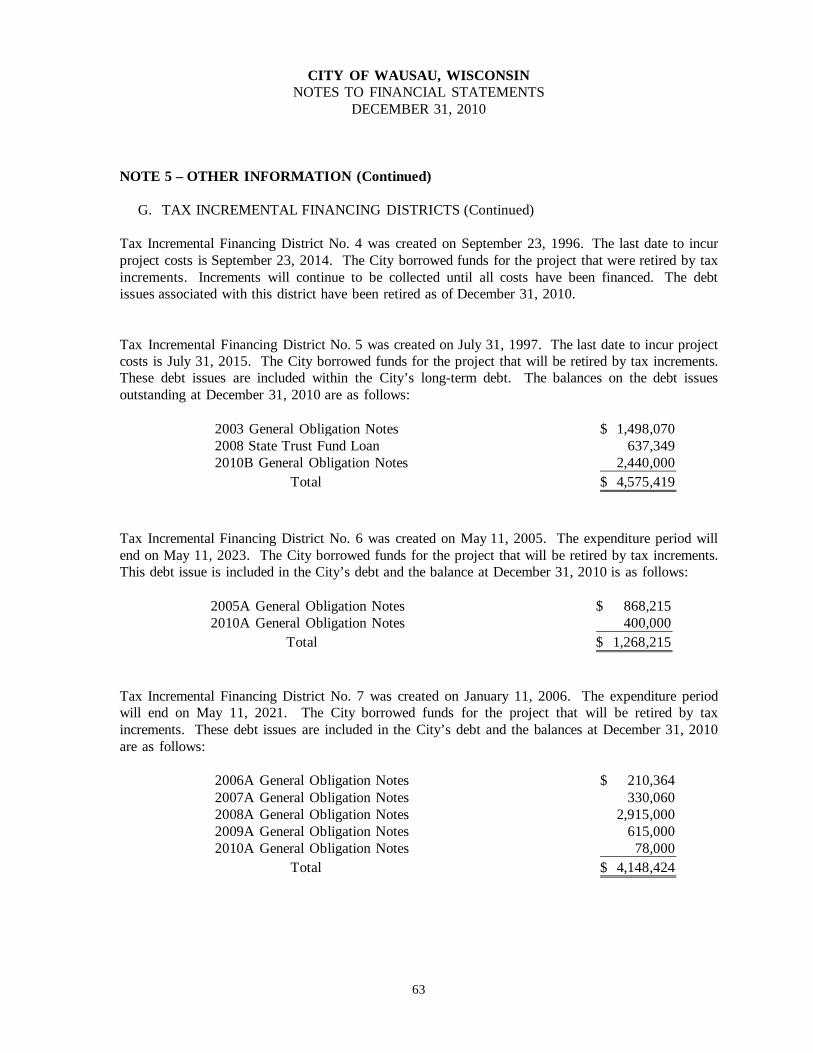
63
CITY OF WAUSAU, WISCONSIN NOTES TO FINANCIAL STATEMENTS
DECEMBER 31, 2010
NOTE 5 – OTHER INFORMATION (Continued) G. TAX INCREMENTAL FINANCING DISTRICTS (Continued) Tax Incremental Financing District No. 4 was created on September 23, 1996. The last date to incur project costs is September 23, 2014. The City borrowed funds for the project that were retired by tax increments. Increments will continue to be collected until all costs have been financed. The debt issues associated with this district have been retired as of December 31, 2010. Tax Incremental Financing District No. 5 was created on July 31, 1997. The last date to incur project costs is July 31, 2015. The City borrowed funds for the project that will be retired by tax increments. These debt issues are included within the City’s long-term debt. The balances on the debt issues outstanding at December 31, 2010 are as follows:
2003 General Obligation Notes 1,498,070$ 2008 State Trust Fund Loan 637,349 2010B General Obligation Notes 2,440,000
Total 4,575,419$
Tax Incremental Financing District No. 6 was created on May 11, 2005. The expenditure period will end on May 11, 2023. The City borrowed funds for the project that will be retired by tax increments. This debt issue is included in the City’s debt and the balance at December 31, 2010 is as follows:
2005A General Obligation Notes 868,215$ 2010A General Obligation Notes 400,000
Total 1,268,215$ Tax Incremental Financing District No. 7 was created on January 11, 2006. The expenditure period will end on May 11, 2021. The City borrowed funds for the project that will be retired by tax increments. These debt issues are included in the City’s debt and the balances at December 31, 2010 are as follows:
2006A General Obligation Notes 210,364$ 2007A General Obligation Notes 330,060 2008A General Obligation Notes 2,915,000 2009A General Obligation Notes 615,000 2010A General Obligation Notes 78,000
Total 4,148,424$
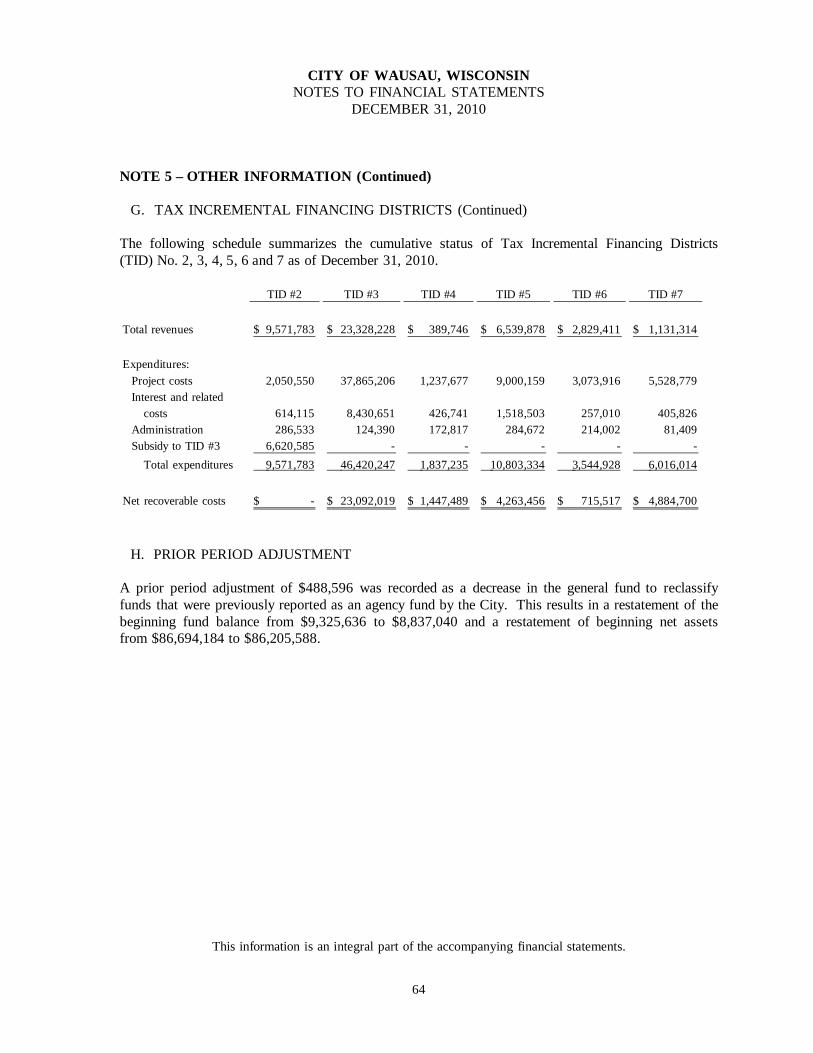
64
CITY OF WAUSAU, WISCONSIN NOTES TO FINANCIAL STATEMENTS
DECEMBER 31, 2010
NOTE 5 – OTHER INFORMATION (Continued) G. TAX INCREMENTAL FINANCING DISTRICTS (Continued)
The following schedule summarizes the cumulative status of Tax Incremental Financing Districts (TID) No. 2, 3, 4, 5, 6 and 7 as of December 31, 2010.
TID #2 TID #3 TID #4 TID #5 TID #6 TID #7
Total revenues 9,571,783$ 23,328,228$ 389,746$ 6,539,878$ 2,829,411$ 1,131,314$
Expenditures: Project costs 2,050,550 37,865,206 1,237,677 9,000,159 3,073,916 5,528,779 Interest and related costs 614,115 8,430,651 426,741 1,518,503 257,010 405,826 Administration 286,533 124,390 172,817 284,672 214,002 81,409 Subsidy to TID #3 6,620,585 - - - - - Total expenditures 9,571,783 46,420,247 1,837,235 10,803,334 3,544,928 6,016,014
Net recoverable costs -$ 23,092,019$ 1,447,489$ 4,263,456$ 715,517$ 4,884,700$
H. PRIOR PERIOD ADJUSTMENT A prior period adjustment of $488,596 was recorded as a decrease in the general fund to reclassify funds that were previously reported as an agency fund by the City. This results in a restatement of the beginning fund balance from $9,325,636 to $8,837,040 and a restatement of beginning net assets from $86,694,184 to $86,205,588.
This information is an integral part of the accompanying financial statements.
REQUIRED SUPPLEMENTARY INFORMATION
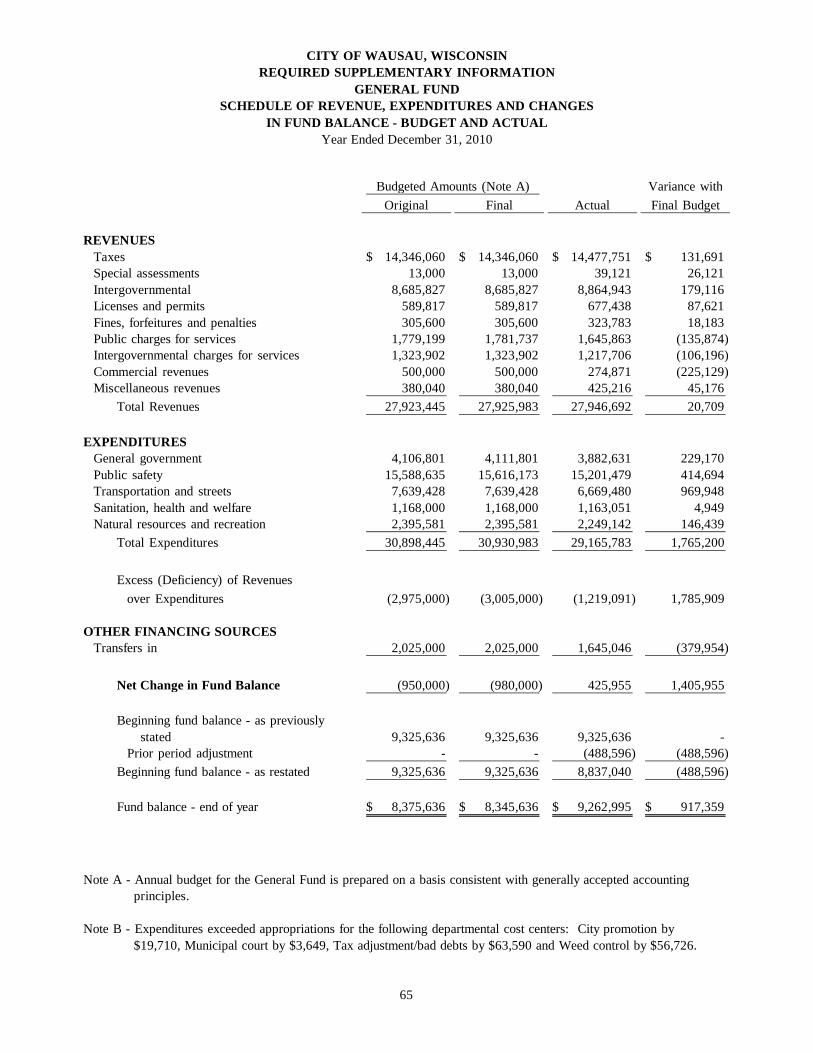
CITY OF WAUSAU, WISCONSINREQUIRED SUPPLEMENTARY INFORMATION
GENERAL FUNDSCHEDULE OF REVENUE, EXPENDITURES AND CHANGES
IN FUND BALANCE - BUDGET AND ACTUALYear Ended December 31, 2010
Budgeted Amounts (Note A) Variance withOriginal Final Actual Final Budget
REVENUES Taxes 14,346,060$ 14,346,060$ 14,477,751$ 131,691$ Special assessments 13,000 13,000 39,121 26,121 Intergovernmental 8,685,827 8,685,827 8,864,943 179,116 Licenses and permits 589,817 589,817 677,438 87,621 Fines, forfeitures and penalties 305,600 305,600 323,783 18,183 Public charges for services 1,779,199 1,781,737 1,645,863 (135,874) Intergovernmental charges for services 1,323,902 1,323,902 1,217,706 (106,196) Commercial revenues 500,000 500,000 274,871 (225,129) Miscellaneous revenues 380,040 380,040 425,216 45,176 Total Revenues 27,923,445 27,925,983 27,946,692 20,709
EXPENDITURES General government 4,106,801 4,111,801 3,882,631 229,170 Public safety 15,588,635 15,616,173 15,201,479 414,694 Transportation and streets 7,639,428 7,639,428 6,669,480 969,948 Sanitation, health and welfare 1,168,000 1,168,000 1,163,051 4,949 Natural resources and recreation 2,395,581 2,395,581 2,249,142 146,439 Total Expenditures 30,898,445 30,930,983 29,165,783 1,765,200
Excess (Deficiency) of Revenues over Expenditures (2,975,000) (3,005,000) (1,219,091) 1,785,909
OTHER FINANCING SOURCES Transfers in 2,025,000 2,025,000 1,645,046 (379,954)
Net Change in Fund Balance (950,000) (980,000) 425,955 1,405,955
Beginning fund balance - as previously stated 9,325,636 9,325,636 9,325,636 - Prior period adjustment - - (488,596) (488,596) Beginning fund balance - as restated 9,325,636 9,325,636 8,837,040 (488,596)
Fund balance - end of year 8,375,636$ 8,345,636$ 9,262,995$ 917,359$
Note A - Annual budget for the General Fund is prepared on a basis consistent with generally accepted accounting principles.
Note B - Expenditures exceeded appropriations for the following departmental cost centers: City promotion by $19,710, Municipal court by $3,649, Tax adjustment/bad debts by $63,590 and Weed control by $56,726.
65
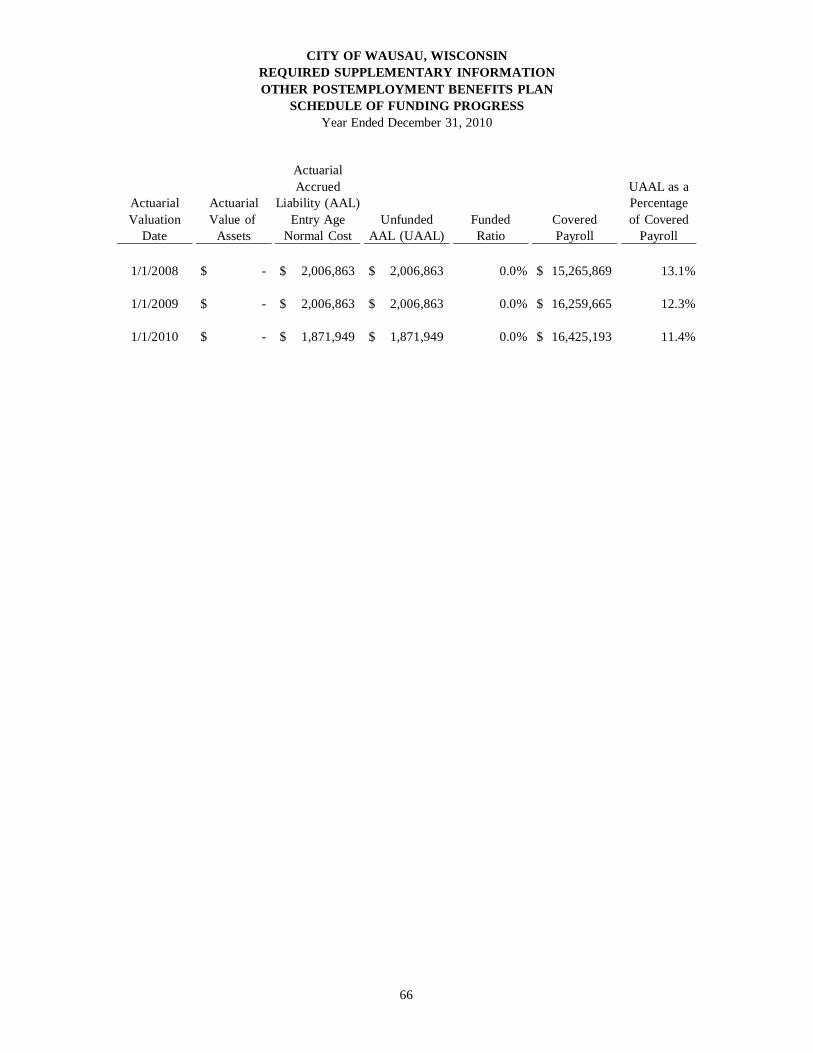
CITY OF WAUSAU, WISCONSINREQUIRED SUPPLEMENTARY INFORMATIONOTHER POSTEMPLOYMENT BENEFITS PLAN
SCHEDULE OF FUNDING PROGRESSYear Ended December 31, 2010
ActuarialAccrued UAAL as a
Actuarial Actuarial Liability (AAL) PercentageValuation Value of Entry Age Unfunded Funded Covered of Covered
Date Assets Normal Cost AAL (UAAL) Ratio Payroll Payroll
1/1/2008 -$ 2,006,863$ 2,006,863$ 0.0% 15,265,869$ 13.1%
1/1/2009 -$ 2,006,863$ 2,006,863$ 0.0% 16,259,665$ 12.3%
1/1/2010 -$ 1,871,949$ 1,871,949$ 0.0% 16,425,193$ 11.4%
66
COMBINING AND INDIVIDUAL FUND STATEMENTS AND SCHEDULES
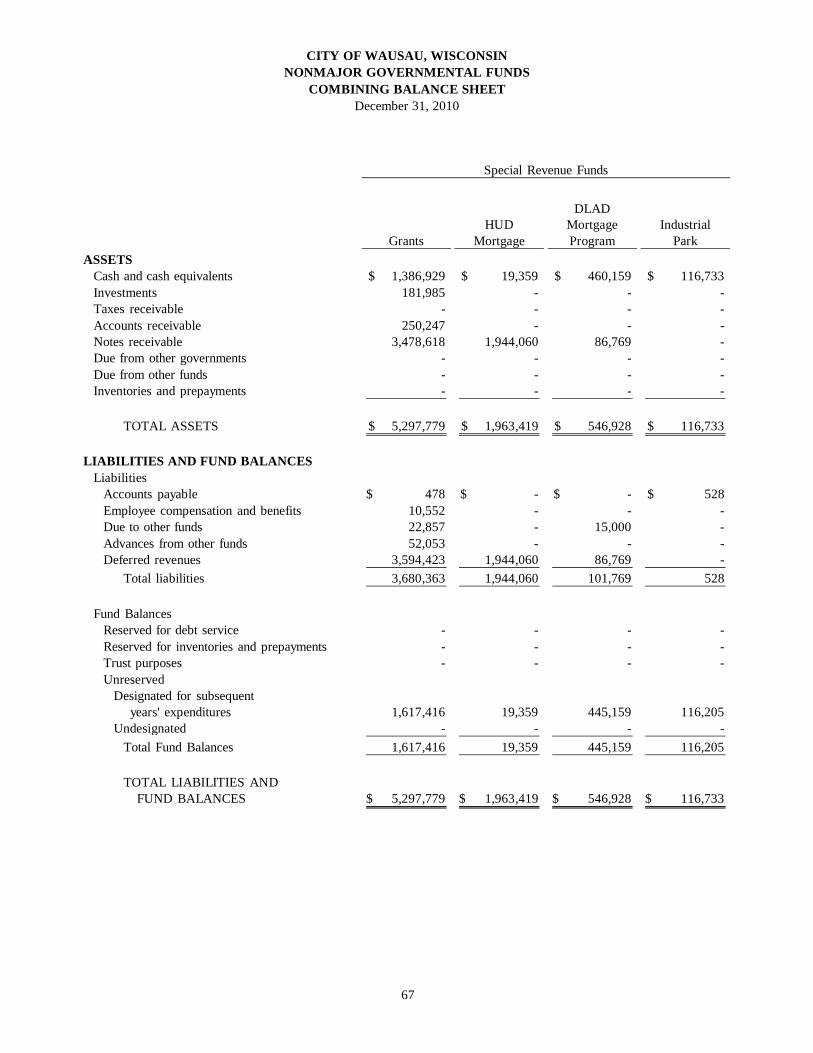
CITY OF WAUSAU, WISCONSINNONMAJOR GOVERNMENTAL FUNDS
COMBINING BALANCE SHEETDecember 31, 2010
Special Revenue Funds
DLADHUD Mortgage Industrial
Grants Mortgage Program ParkASSETS Cash and cash equivalents 1,386,929$ 19,359$ 460,159$ 116,733$ Investments 181,985 - - - Taxes receivable - - - - Accounts receivable 250,247 - - - Notes receivable 3,478,618 1,944,060 86,769 - Due from other governments - - - - Due from other funds - - - - Inventories and prepayments - - - -
TOTAL ASSETS 5,297,779$ 1,963,419$ 546,928$ 116,733$
LIABILITIES AND FUND BALANCES Liabilities Accounts payable 478$ -$ -$ 528$ Employee compensation and benefits 10,552 - - - Due to other funds 22,857 - 15,000 - Advances from other funds 52,053 - - - Deferred revenues 3,594,423 1,944,060 86,769 - Total liabilities 3,680,363 1,944,060 101,769 528
Fund Balances Reserved for debt service - - - - Reserved for inventories and prepayments - - - - Trust purposes - - - - Unreserved Designated for subsequent years' expenditures 1,617,416 19,359 445,159 116,205 Undesignated - - - - Total Fund Balances 1,617,416 19,359 445,159 116,205
TOTAL LIABILITIES AND FUND BALANCES 5,297,779$ 1,963,419$ 546,928$ 116,733$
67
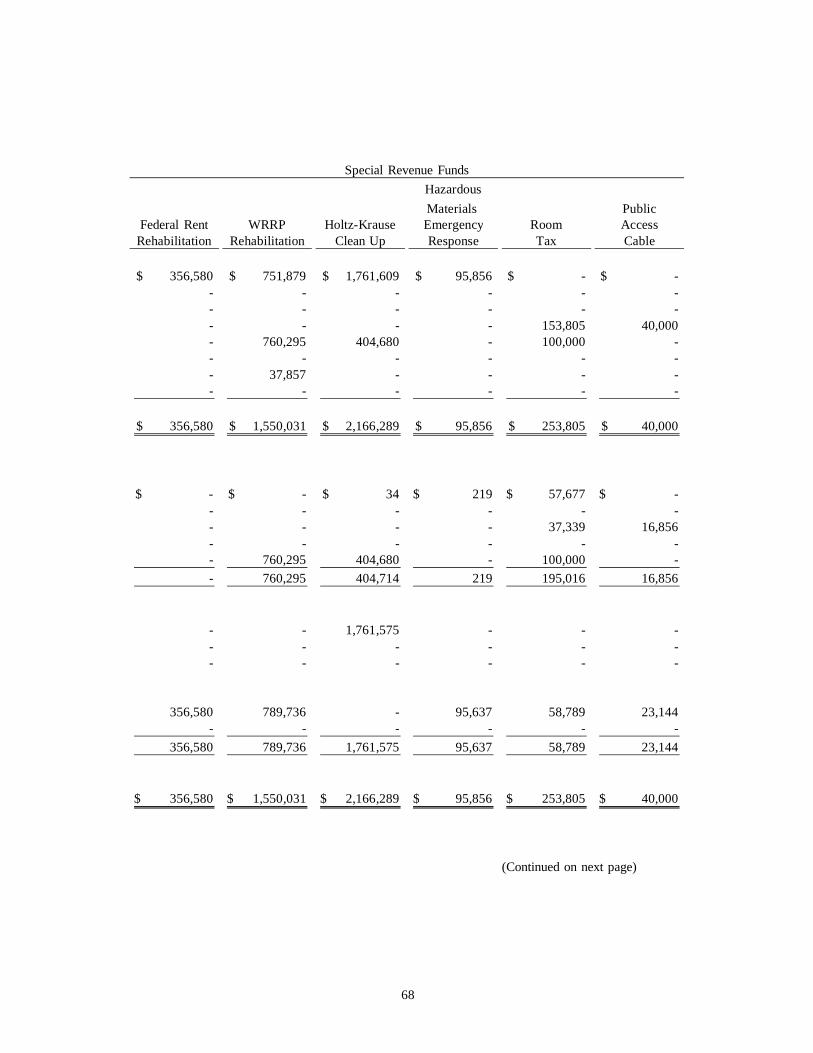
Special Revenue FundsHazardousMaterials Public
Federal Rent WRRP Holtz-Krause Emergency Room AccessRehabilitation Rehabilitation Clean Up Response Tax Cable
356,580$ 751,879$ 1,761,609$ 95,856$ -$ -$ - - - - - -- - - - - -- - - - 153,805 40,000 - 760,295 404,680 - 100,000 -- - - - - -- 37,857 - - - -- - - - - -
356,580$ 1,550,031$ 2,166,289$ 95,856$ 253,805$ 40,000$
$ - -$ 34$ 219$ 57,677$ -$ - - - - - - - - - - 37,339 16,856 - - - - - -- 760,295 404,680 - 100,000 -- 760,295 404,714 219 195,016 16,856
- - 1,761,575 - - -- - - - - -- - - - - -
356,580 789,736 - 95,637 58,789 23,144 - - - - - -
356,580 789,736 1,761,575 95,637 58,789 23,144
356,580$ 1,550,031$ 2,166,289$ 95,856$ 253,805$ 40,000$
(Continued on next page)
68
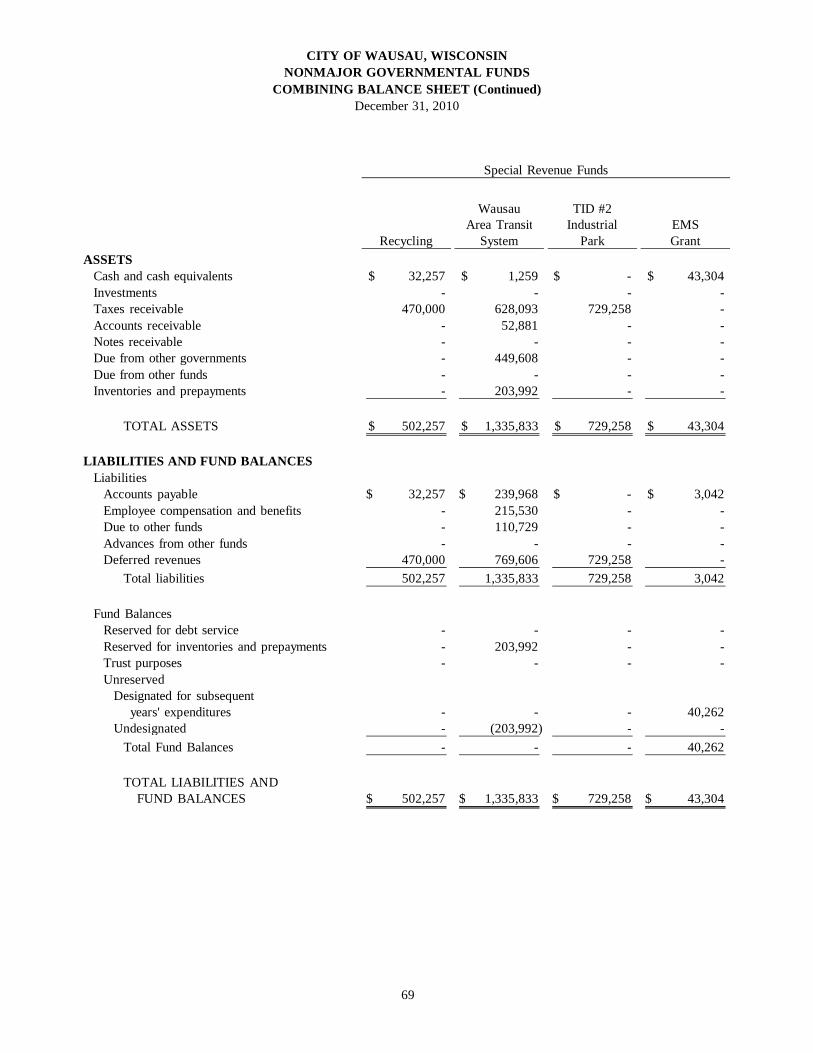
CITY OF WAUSAU, WISCONSINNONMAJOR GOVERNMENTAL FUNDS
COMBINING BALANCE SHEET (Continued)December 31, 2010
ASSETS Cash and cash equivalents Investments Taxes receivable Accounts receivable Notes receivable Due from other governments Due from other funds Inventories and prepayments
TOTAL ASSETS
LIABILITIES AND FUND BALANCES Liabilities Accounts payable Employee compensation and benefits Due to other funds Advances from other funds Deferred revenues Total liabilities
Fund Balances Reserved for debt service Reserved for inventories and prepayments Trust purposes Unreserved Designated for subsequent years' expenditures Undesignated Total Fund Balances
TOTAL LIABILITIES AND FUND BALANCES
Special Revenue Funds
Wausau TID #2Area Transit Industrial EMS
Recycling System Park Grant
32,257$ 1,259$ $ - 43,304$ - - - -
470,000 628,093 729,258 - - 52,881 - -- - - -- 449,608 - -- - - -- 203,992 - -
502,257$ 1,335,833$ 729,258$ 43,304$
32,257$ 239,968$ $ - 3,042$ - 215,530 - -- 110,729 - -- - - -
470,000 769,606 729,258 - 502,257 1,335,833 729,258 3,042
- - - -- 203,992 - -- - - -
- - - 40,262 - (203,992) - -- - - 40,262
502,257$ 1,335,833$ 729,258$ 43,304$
69
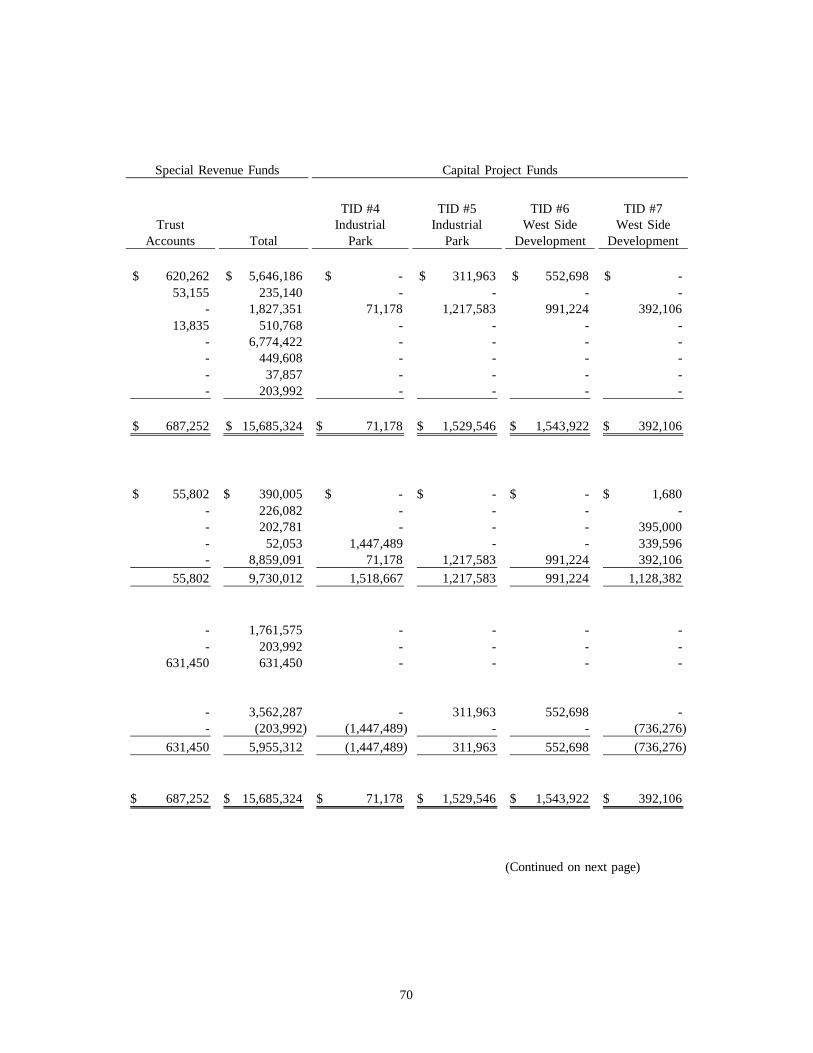
Special Revenue Funds Capital Project Funds
TID #4 TID #5 TID #6 TID #7Trust Industrial Industrial West Side West Side
Accounts Total Park Park Development Development
620,262$ 5,646,186$ $ - 311,963$ 552,698$ -$ 53,155 235,140 - - - -
- 1,827,351 71,178 1,217,583 991,224 392,106 13,835 510,768 - - - -
- 6,774,422 - - - -- 449,608 - - - -- 37,857 - - - -- 203,992 - - - -
687,252$ 15,685,324$ 71,178$ 1,529,546$ 1,543,922$ 392,106$
55,802$ 390,005$ $ - -$ -$ 1,680$ - 226,082 - - - -- 202,781 - - - 395,000 - 52,053 1,447,489 - - 339,596 - 8,859,091 71,178 1,217,583 991,224 392,106
55,802 9,730,012 1,518,667 1,217,583 991,224 1,128,382
- 1,761,575 - - - -- 203,992 - - - -
631,450 631,450 - - - -
- 3,562,287 - 311,963 552,698 -- (203,992) (1,447,489) - - (736,276)
631,450 5,955,312 (1,447,489) 311,963 552,698 (736,276)
687,252$ 15,685,324$ 71,178$ 1,529,546$ 1,543,922$ 392,106$
(Continued on next page)
70
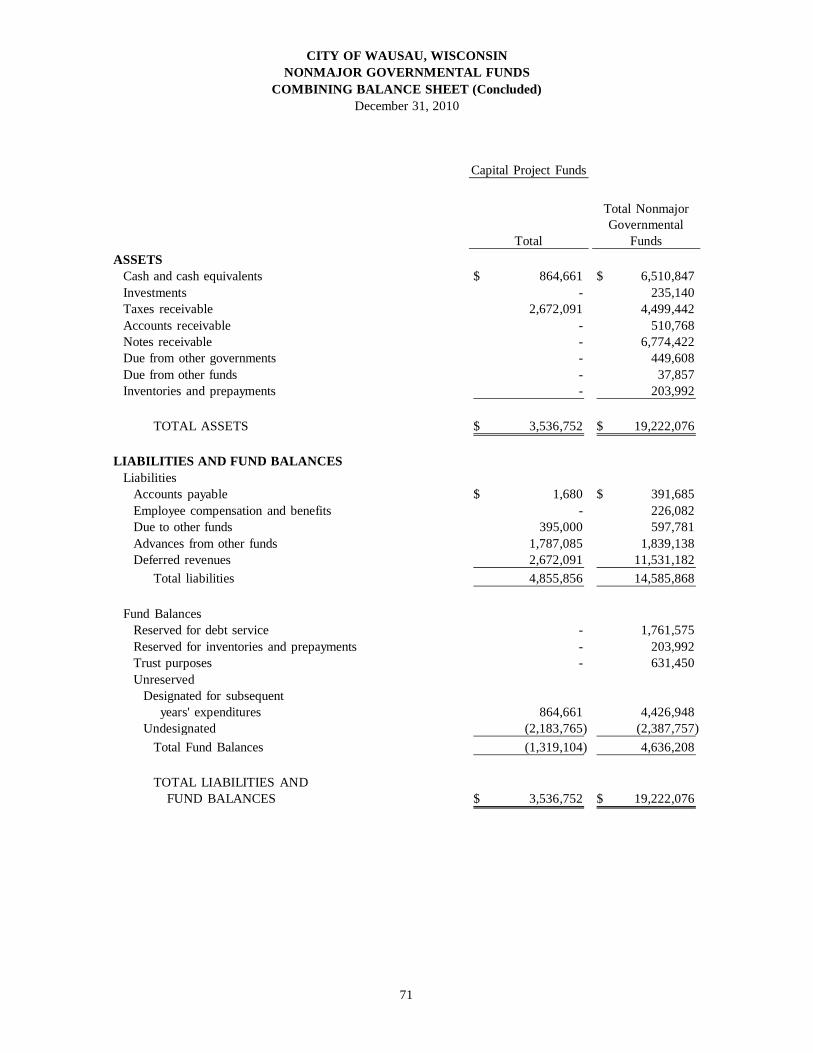
CITY OF WAUSAU, WISCONSINNONMAJOR GOVERNMENTAL FUNDS
COMBINING BALANCE SHEET (Concluded)December 31, 2010
ASSETS Cash and cash equivalents Investments Taxes receivable Accounts receivable Notes receivable Due from other governments Due from other funds Inventories and prepayments
TOTAL ASSETS
LIABILITIES AND FUND BALANCES Liabilities Accounts payable Employee compensation and benefits Due to other funds Advances from other funds Deferred revenues Total liabilities
Fund Balances Reserved for debt service Reserved for inventories and prepayments Trust purposes Unreserved Designated for subsequent years' expenditures Undesignated Total Fund Balances
TOTAL LIABILITIES AND FUND BALANCES
Capital Project Funds
Total NonmajorGovernmental
Total Funds
864,661$ 6,510,847$ - 235,140
2,672,091 4,499,442 - 510,768 - 6,774,422 - 449,608 - 37,857 - 203,992
3,536,752$ 19,222,076$
1,680$ 391,685$ - 226,082
395,000 597,781 1,787,085 1,839,138 2,672,091 11,531,182 4,855,856 14,585,868
- 1,761,575 - 203,992 - 631,450
864,661 4,426,948 (2,183,765) (2,387,757) (1,319,104) 4,636,208
3,536,752$ 19,222,076$
71
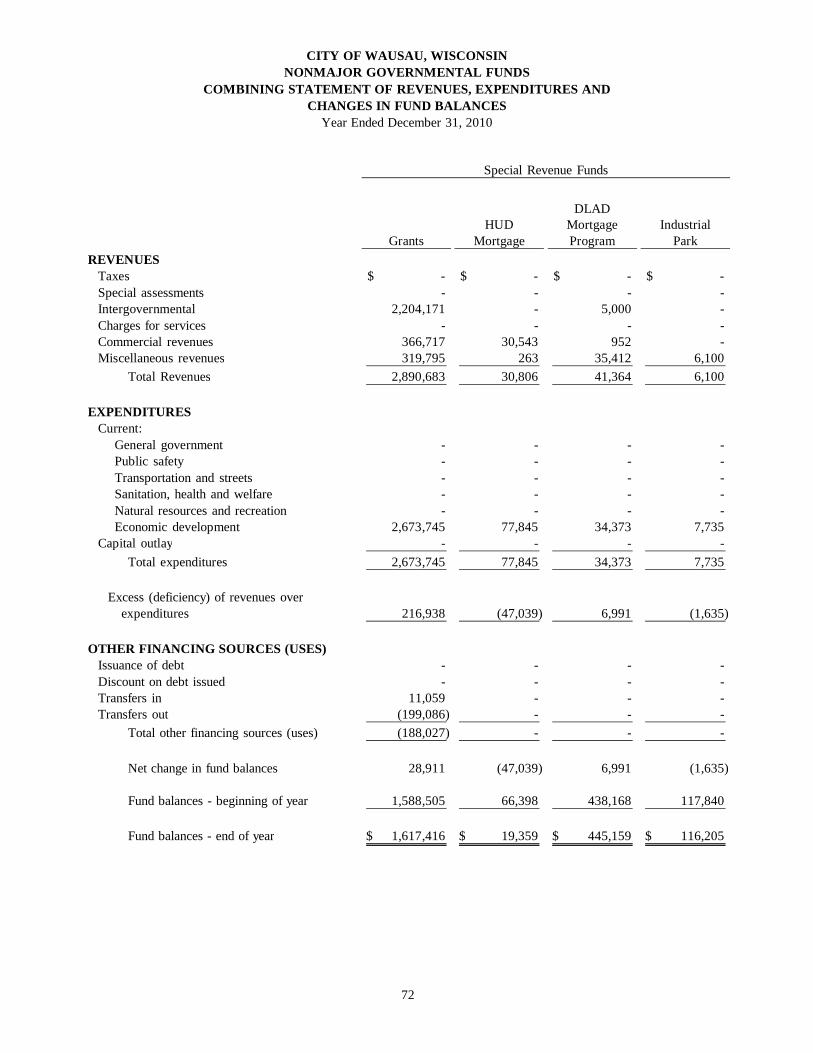
CITY OF WAUSAU, WISCONSINNONMAJOR GOVERNMENTAL FUNDS
COMBINING STATEMENT OF REVENUES, EXPENDITURES ANDCHANGES IN FUND BALANCES
Year Ended December 31, 2010
Special Revenue Funds
DLADHUD Mortgage Industrial
Grants Mortgage Program ParkREVENUES Taxes $ - $ - $ - $ - Special assessments - - - - Intergovernmental 2,204,171 - 5,000 - Charges for services - - - - Commercial revenues 366,717 30,543 952 - Miscellaneous revenues 319,795 263 35,412 6,100 Total Revenues 2,890,683 30,806 41,364 6,100
EXPENDITURES Current: General government - - - - Public safety - - - - Transportation and streets - - - - Sanitation, health and welfare - - - - Natural resources and recreation - - - - Economic development 2,673,745 77,845 34,373 7,735 Capital outlay - - - - Total expenditures 2,673,745 77,845 34,373 7,735
Excess (deficiency) of revenues over expenditures 216,938 (47,039) 6,991 (1,635)
OTHER FINANCING SOURCES (USES) Issuance of debt - - - - Discount on debt issued - - - - Transfers in 11,059 - - - Transfers out (199,086) - - - Total other financing sources (uses) (188,027) - - -
Net change in fund balances 28,911 (47,039) 6,991 (1,635)
Fund balances - beginning of year 1,588,505 66,398 438,168 117,840
Fund balances - end of year 1,617,416$ 19,359$ 445,159$ 116,205$
72
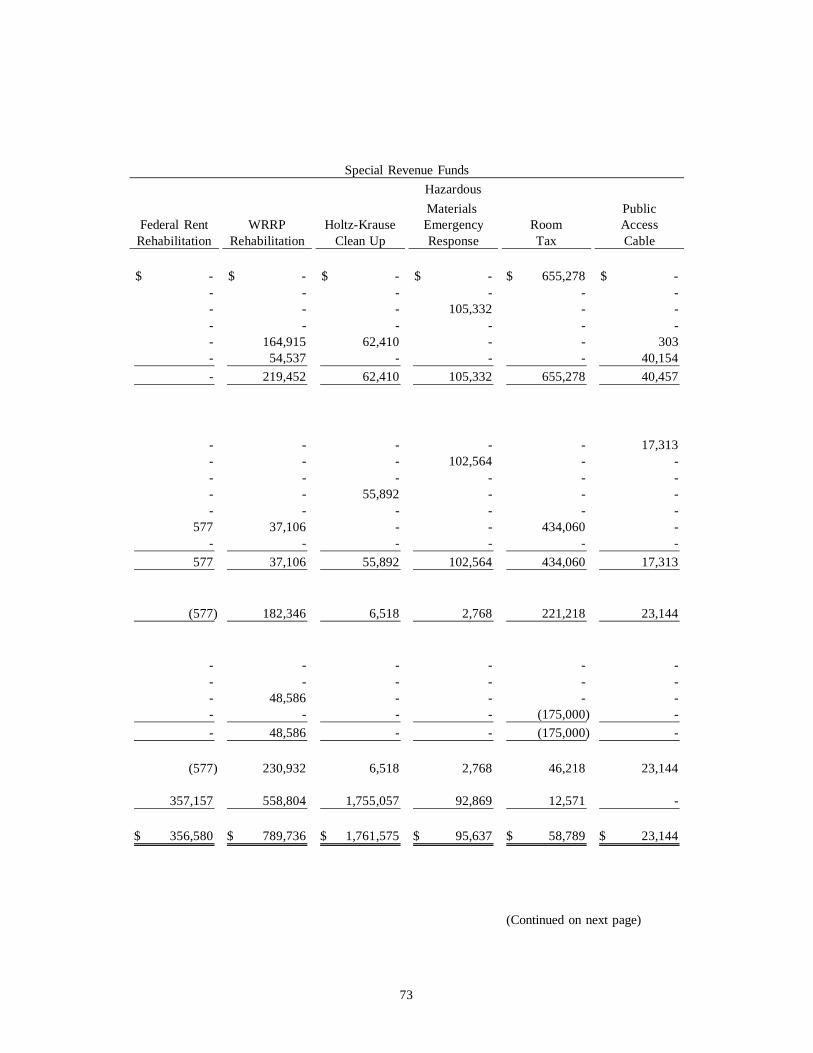
Special Revenue FundsHazardousMaterials Public
Federal Rent WRRP Holtz-Krause Emergency Room AccessRehabilitation Rehabilitation Clean Up Response Tax Cable
$ - $ - $ - $ - 655,278$ $ -- - - - - -- - - 105,332 - -- - - - - - - 164,915 62,410 - - 303 - 54,537 - - - 40,154 - 219,452 62,410 105,332 655,278 40,457
- - - - - 17,313 - - - 102,564 - -- - - - - -- - 55,892 - - -- - - - - -
577 37,106 - - 434,060 -- - - - - -
577 37,106 55,892 102,564 434,060 17,313
(577) 182,346 6,518 2,768 221,218 23,144
- - - - - -- - - - - -- 48,586 - - - - - - - - (175,000) -- 48,586 - - (175,000) -
(577) 230,932 6,518 2,768 46,218 23,144
357,157 558,804 1,755,057 92,869 12,571 -
356,580$ 789,736$ 1,761,575$ 95,637$ 58,789$ 23,144$
(Continued on next page)
73
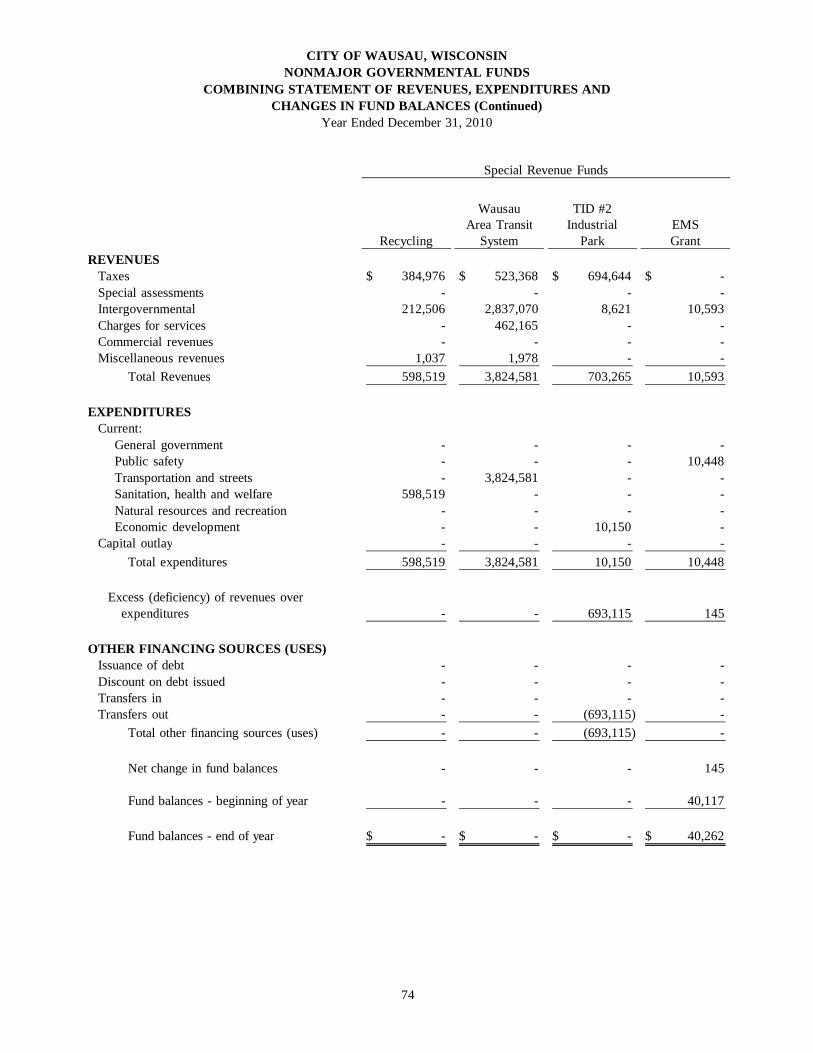
CITY OF WAUSAU, WISCONSINNONMAJOR GOVERNMENTAL FUNDS
COMBINING STATEMENT OF REVENUES, EXPENDITURES ANDCHANGES IN FUND BALANCES (Continued)
Year Ended December 31, 2010
REVENUES Taxes Special assessments Intergovernmental Charges for services Commercial revenues Miscellaneous revenues Total Revenues
EXPENDITURES Current: General government Public safety Transportation and streets Sanitation, health and welfare Natural resources and recreation Economic development Capital outlay Total expenditures
Excess (deficiency) of revenues over expenditures
OTHER FINANCING SOURCES (USES) Issuance of debt Discount on debt issued Transfers in Transfers out Total other financing sources (uses)
Net change in fund balances
Fund balances - beginning of year
Fund balances - end of year
Special Revenue Funds
Wausau TID #2Area Transit Industrial EMS
Recycling System Park Grant
384,976$ 523,368$ 694,644$ -$ - - - -
212,506 2,837,070 8,621 10,593 - 462,165 - -- - - -
1,037 1,978 - - 598,519 3,824,581 703,265 10,593
- - - -- - - 10,448 - 3,824,581 - -
598,519 - - -- - - - - - 10,150 -- - - -
598,519 3,824,581 10,150 10,448
- - 693,115 145
- - - -- - - -- - - - - - (693,115) - - - (693,115) -
- - - 145
- - - 40,117
-$ -$ -$ 40,262$
74
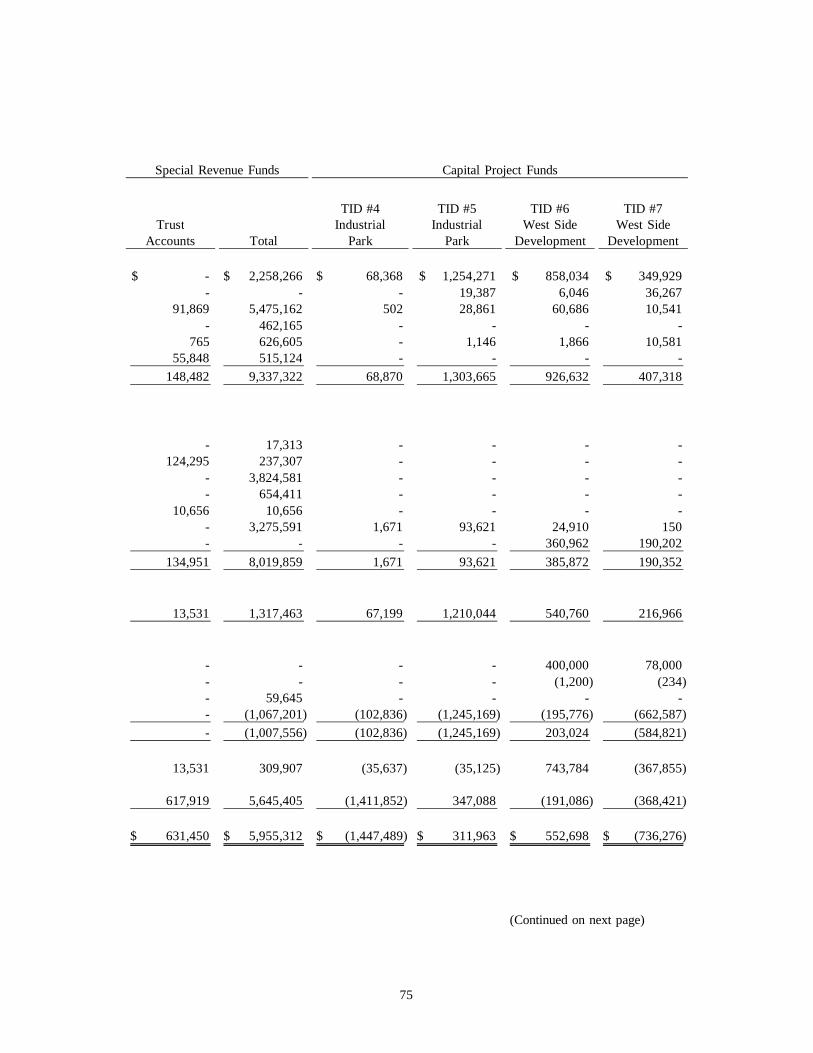
Special Revenue Funds Capital Project Funds
TID #4 TID #5 TID #6 TID #7Trust Industrial Industrial West Side West Side
Accounts Total Park Park Development Development
$ - 2,258,266$ 68,368$ 1,254,271$ 858,034$ 349,929$ - - - 19,387 6,046 36,267
91,869 5,475,162 502 28,861 60,686 10,541 - 462,165 - - - -
765 626,605 - 1,146 1,866 10,581 55,848 515,124 - - - -
148,482 9,337,322 68,870 1,303,665 926,632 407,318
- 17,313 - - - -124,295 237,307 - - - -
- 3,824,581 - - - -- 654,411 - - - -
10,656 10,656 - - - -- 3,275,591 1,671 93,621 24,910 150 - - - - 360,962 190,202
134,951 8,019,859 1,671 93,621 385,872 190,352
13,531 1,317,463 67,199 1,210,044 540,760 216,966
- - - - 400,000 78,000 - - - - (1,200) (234) - 59,645 - - - - - (1,067,201) (102,836) (1,245,169) (195,776) (662,587) - (1,007,556) (102,836) (1,245,169) 203,024 (584,821)
13,531 309,907 (35,637) (35,125) 743,784 (367,855)
617,919 5,645,405 (1,411,852) 347,088 (191,086) (368,421)
631,450$ 5,955,312$ (1,447,489)$ 311,963$ 552,698$ (736,276)$
(Continued on next page)
75
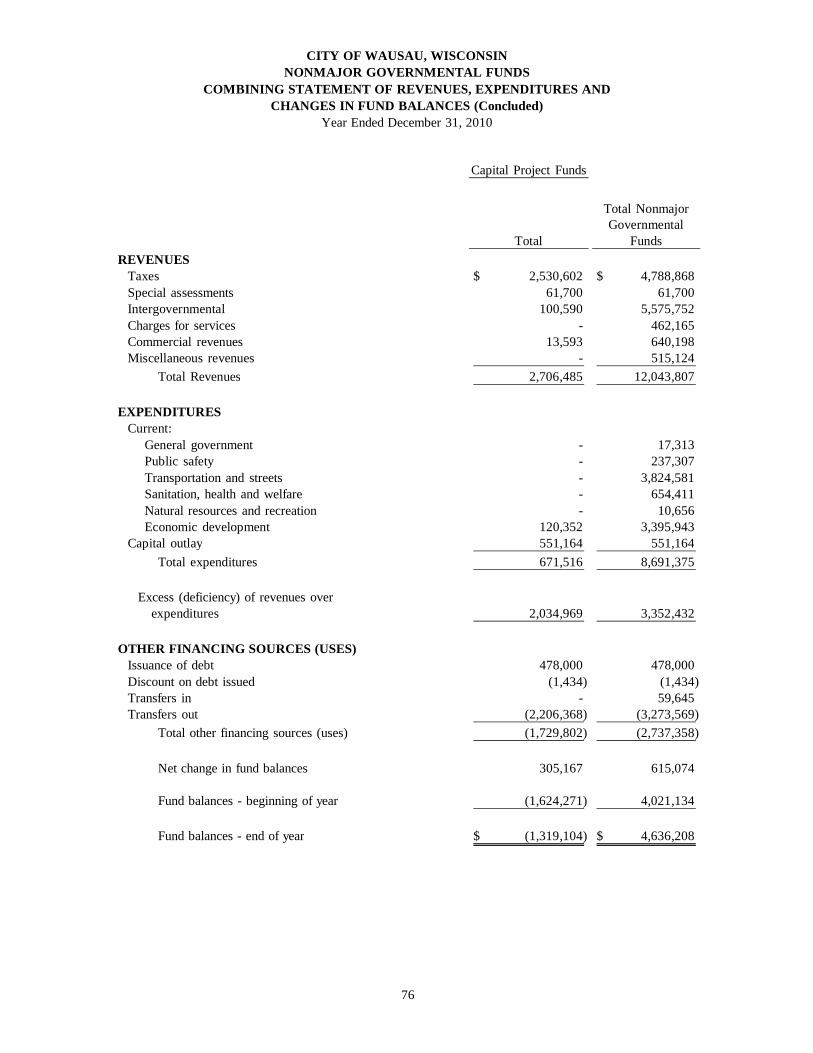
CITY OF WAUSAU, WISCONSINNONMAJOR GOVERNMENTAL FUNDS
COMBINING STATEMENT OF REVENUES, EXPENDITURES ANDCHANGES IN FUND BALANCES (Concluded)
Year Ended December 31, 2010
REVENUES Taxes Special assessments Intergovernmental Charges for services Commercial revenues Miscellaneous revenues Total Revenues
EXPENDITURES Current: General government Public safety Transportation and streets Sanitation, health and welfare Natural resources and recreation Economic development Capital outlay Total expenditures
Excess (deficiency) of revenues over expenditures
OTHER FINANCING SOURCES (USES) Issuance of debt Discount on debt issued Transfers in Transfers out Total other financing sources (uses)
Net change in fund balances
Fund balances - beginning of year
Fund balances - end of year
Capital Project Funds
Total NonmajorGovernmental
Total Funds
2,530,602$ 4,788,868$ 61,700 61,700
100,590 5,575,752 - 462,165
13,593 640,198 - 515,124
2,706,485 12,043,807
- 17,313 - 237,307 - 3,824,581 - 654,411 - 10,656
120,352 3,395,943 551,164 551,164 671,516 8,691,375
2,034,969 3,352,432
478,000 478,000 (1,434) (1,434)
- 59,645 (2,206,368) (3,273,569) (1,729,802) (2,737,358)
305,167 615,074
(1,624,271) 4,021,134
(1,319,104)$ 4,636,208$
76
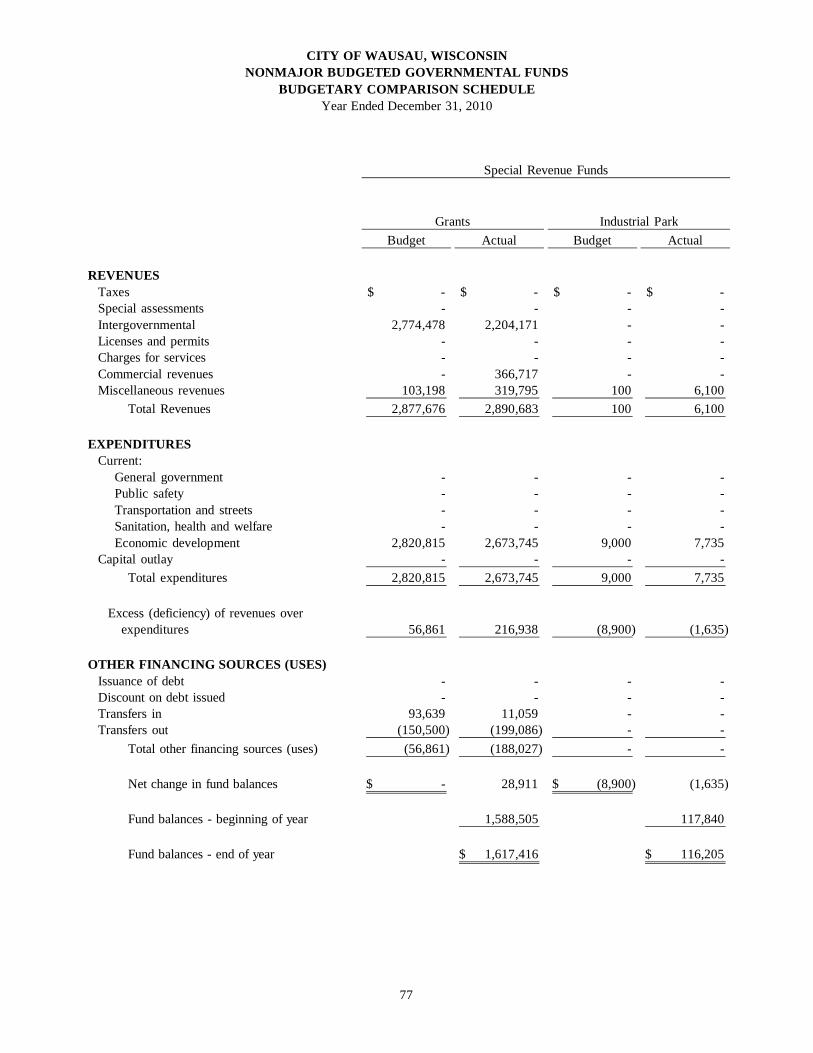
CITY OF WAUSAU, WISCONSINNONMAJOR BUDGETED GOVERNMENTAL FUNDS
BUDGETARY COMPARISON SCHEDULEYear Ended December 31, 2010
Special Revenue Funds
Grants Industrial ParkBudget Actual Budget Actual
REVENUES Taxes $ - $ - $ - $ - Special assessments - - - - Intergovernmental 2,774,478 2,204,171 - - Licenses and permits - - - - Charges for services - - - - Commercial revenues - 366,717 - - Miscellaneous revenues 103,198 319,795 100 6,100 Total Revenues 2,877,676 2,890,683 100 6,100
EXPENDITURES Current: General government - - - - Public safety - - - - Transportation and streets - - - - Sanitation, health and welfare - - - - Economic development 2,820,815 2,673,745 9,000 7,735 Capital outlay - - - - Total expenditures 2,820,815 2,673,745 9,000 7,735
Excess (deficiency) of revenues over expenditures 56,861 216,938 (8,900) (1,635)
OTHER FINANCING SOURCES (USES) Issuance of debt - - - - Discount on debt issued - - - - Transfers in 93,639 11,059 - - Transfers out (150,500) (199,086) - - Total other financing sources (uses) (56,861) (188,027) - -
Net change in fund balances -$ 28,911 (8,900)$ (1,635)
Fund balances - beginning of year 1,588,505 117,840
Fund balances - end of year 1,617,416$ 116,205$
77
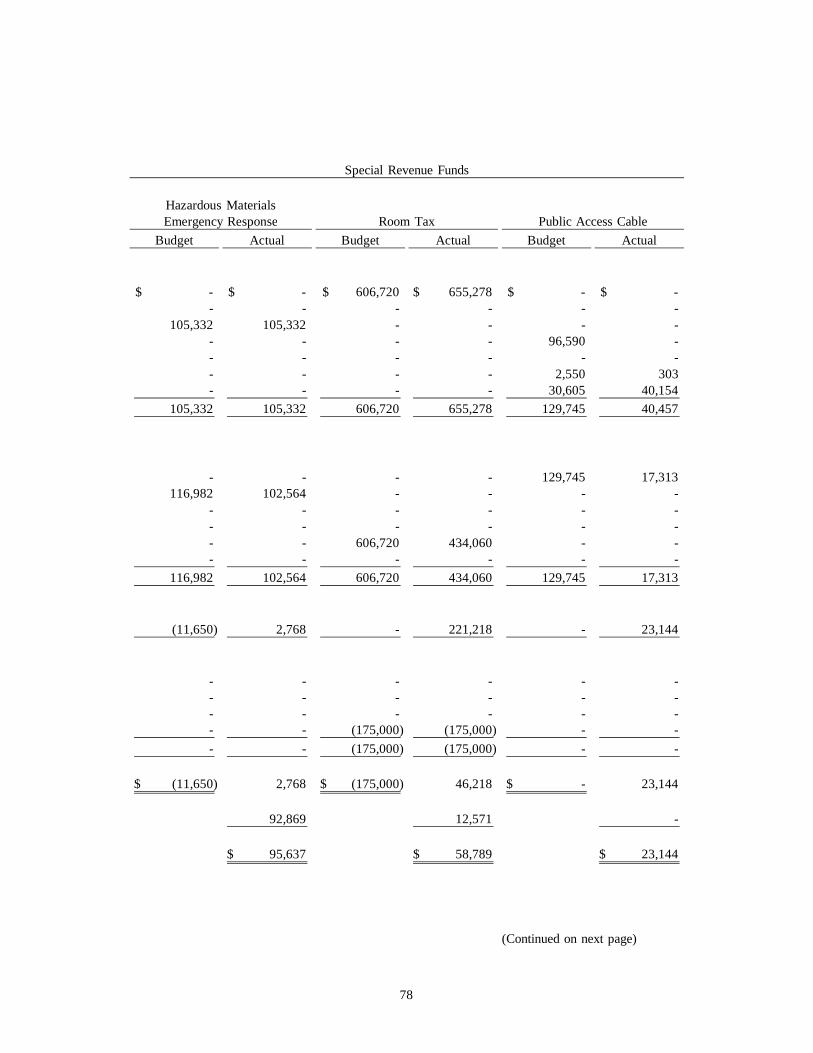
Special Revenue Funds
Hazardous MaterialsEmergency Response Room Tax Public Access Cable
Budget Actual Budget Actual Budget Actual
$ - $ - 606,720$ 655,278$ $ - $ -- - - - - -
105,332 105,332 - - - -- - - - 96,590 - - - - - - - - - - - 2,550 303 - - - - 30,605 40,154
105,332 105,332 606,720 655,278 129,745 40,457
- - - - 129,745 17,313 116,982 102,564 - - - -
- - - - - -- - - - - -- - 606,720 434,060 - -- - - - - -
116,982 102,564 606,720 434,060 129,745 17,313
(11,650) 2,768 - 221,218 - 23,144
- - - - - -- - - - - -- - - - - - - - (175,000) (175,000) - -- - (175,000) (175,000) - -
(11,650)$ 2,768 (175,000)$ 46,218 -$ 23,144
92,869 12,571 -
95,637$ 58,789$ 23,144$
(Continued on next page)
78
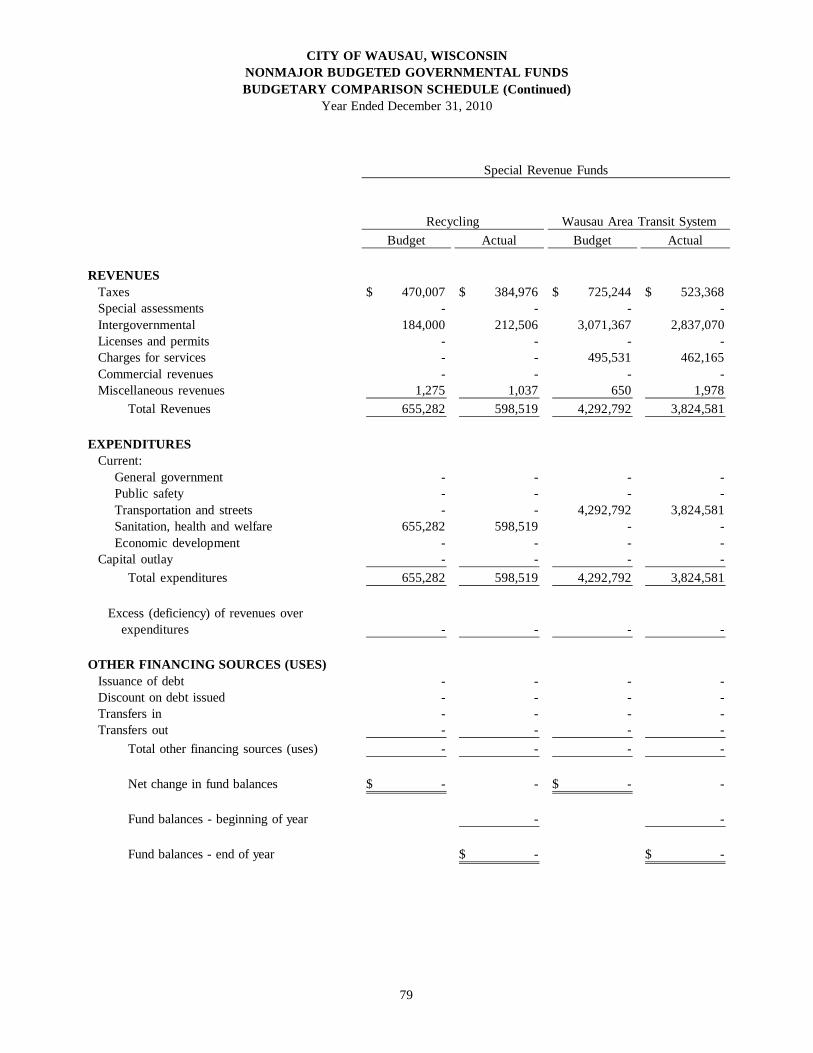
CITY OF WAUSAU, WISCONSINNONMAJOR BUDGETED GOVERNMENTAL FUNDSBUDGETARY COMPARISON SCHEDULE (Continued)
Year Ended December 31, 2010
REVENUES Taxes Special assessments Intergovernmental Licenses and permits Charges for services Commercial revenues Miscellaneous revenues Total Revenues
EXPENDITURES Current: General government Public safety Transportation and streets Sanitation, health and welfare Economic development Capital outlay Total expenditures
Excess (deficiency) of revenues over expenditures
OTHER FINANCING SOURCES (USES) Issuance of debt Discount on debt issued Transfers in Transfers out Total other financing sources (uses)
Net change in fund balances
Fund balances - beginning of year
Fund balances - end of year
Special Revenue Funds
Recycling Wausau Area Transit SystemBudget Actual Budget Actual
470,007$ 384,976$ 725,244$ 523,368$ - - - -
184,000 212,506 3,071,367 2,837,070 - - - -- - 495,531 462,165 - - - -
1,275 1,037 650 1,978 655,282 598,519 4,292,792 3,824,581
- - - -- - - -- - 4,292,792 3,824,581
655,282 598,519 - -- - - -- - - -
655,282 598,519 4,292,792 3,824,581
- - - -
- - - -- - - -- - - - - - - -- - - -
-$ - -$ -
- -
-$ -$
79
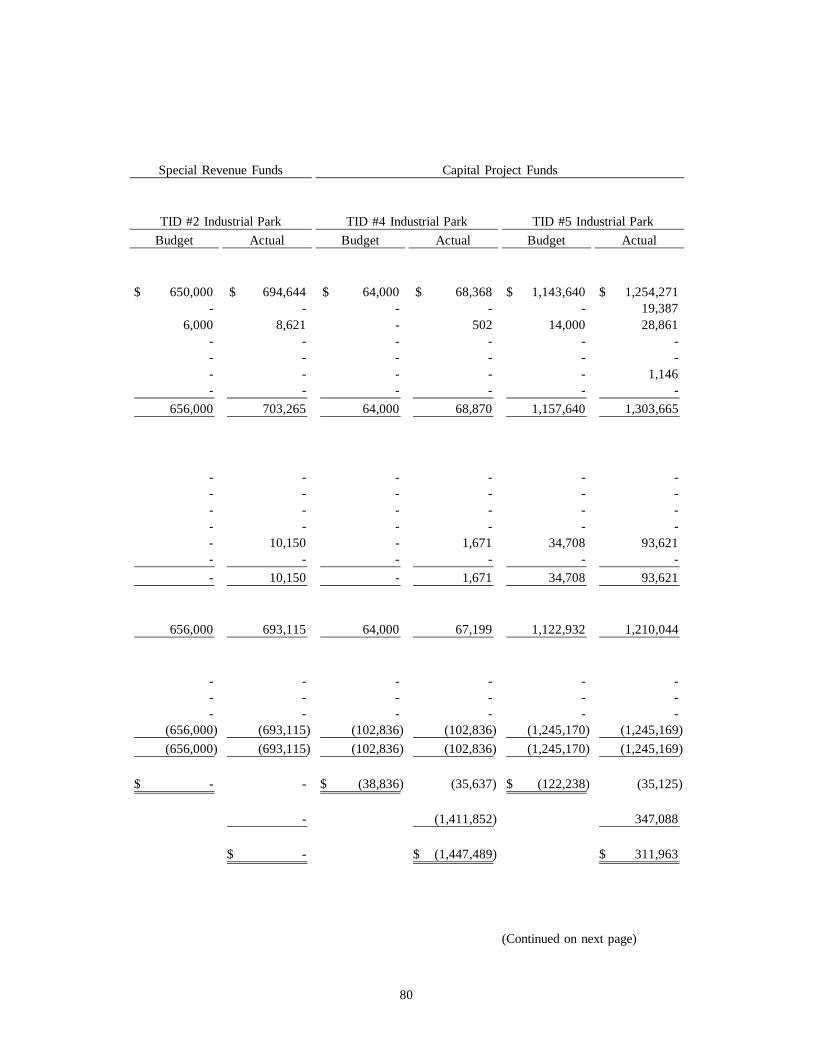
Special Revenue Funds Capital Project Funds
TID #2 Industrial Park TID #4 Industrial Park TID #5 Industrial ParkBudget Actual Budget Actual Budget Actual
650,000$ 694,644$ 64,000$ 68,368$ 1,143,640$ 1,254,271$ - - - - - 19,387
6,000 8,621 - 502 14,000 28,861 - - - - - -- - - - - -- - - - - 1,146 - - - - - -
656,000 703,265 64,000 68,870 1,157,640 1,303,665
- - - - - -- - - - - -- - - - - -- - - - - -- 10,150 - 1,671 34,708 93,621 - - - - - - - 10,150 - 1,671 34,708 93,621
656,000 693,115 64,000 67,199 1,122,932 1,210,044
- - - - - - - - - - - - - - - - - -
(656,000) (693,115) (102,836) (102,836) (1,245,170) (1,245,169) (656,000) (693,115) (102,836) (102,836) (1,245,170) (1,245,169)
-$ - (38,836)$ (35,637) (122,238)$ (35,125)
- (1,411,852) 347,088
-$ (1,447,489)$ 311,963$
(Continued on next page)
80
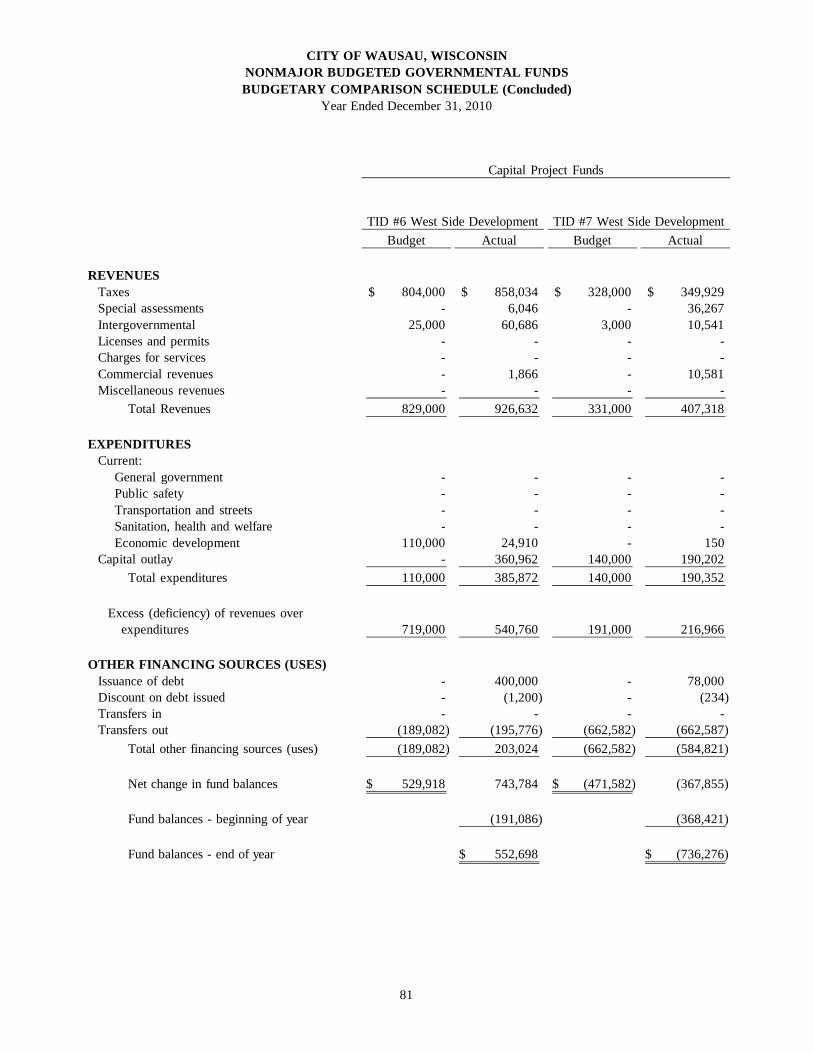
CITY OF WAUSAU, WISCONSINNONMAJOR BUDGETED GOVERNMENTAL FUNDSBUDGETARY COMPARISON SCHEDULE (Concluded)
Year Ended December 31, 2010
REVENUES Taxes Special assessments Intergovernmental Licenses and permits Charges for services Commercial revenues Miscellaneous revenues Total Revenues
EXPENDITURES Current: General government Public safety Transportation and streets Sanitation, health and welfare Economic development Capital outlay Total expenditures
Excess (deficiency) of revenues over expenditures
OTHER FINANCING SOURCES (USES) Issuance of debt Discount on debt issued Transfers in Transfers out Total other financing sources (uses)
Net change in fund balances
Fund balances - beginning of year
Fund balances - end of year
Capital Project Funds
TID #6 West Side Development TID #7 West Side DevelopmentBudget Actual Budget Actual
804,000$ 858,034$ 328,000$ 349,929$ - 6,046 - 36,267
25,000 60,686 3,000 10,541 - - - -- - - -- 1,866 - 10,581 - - - -
829,000 926,632 331,000 407,318
- - - -- - - -- - - -- - - -
110,000 24,910 - 150 - 360,962 140,000 190,202
110,000 385,872 140,000 190,352
719,000 540,760 191,000 216,966
- 400,000 - 78,000 - (1,200) - (234) - - - -
(189,082) (195,776) (662,582) (662,587) (189,082) 203,024 (662,582) (584,821)
529,918$ 743,784 (471,582)$ (367,855)
(191,086) (368,421)
552,698$ (736,276)$
81
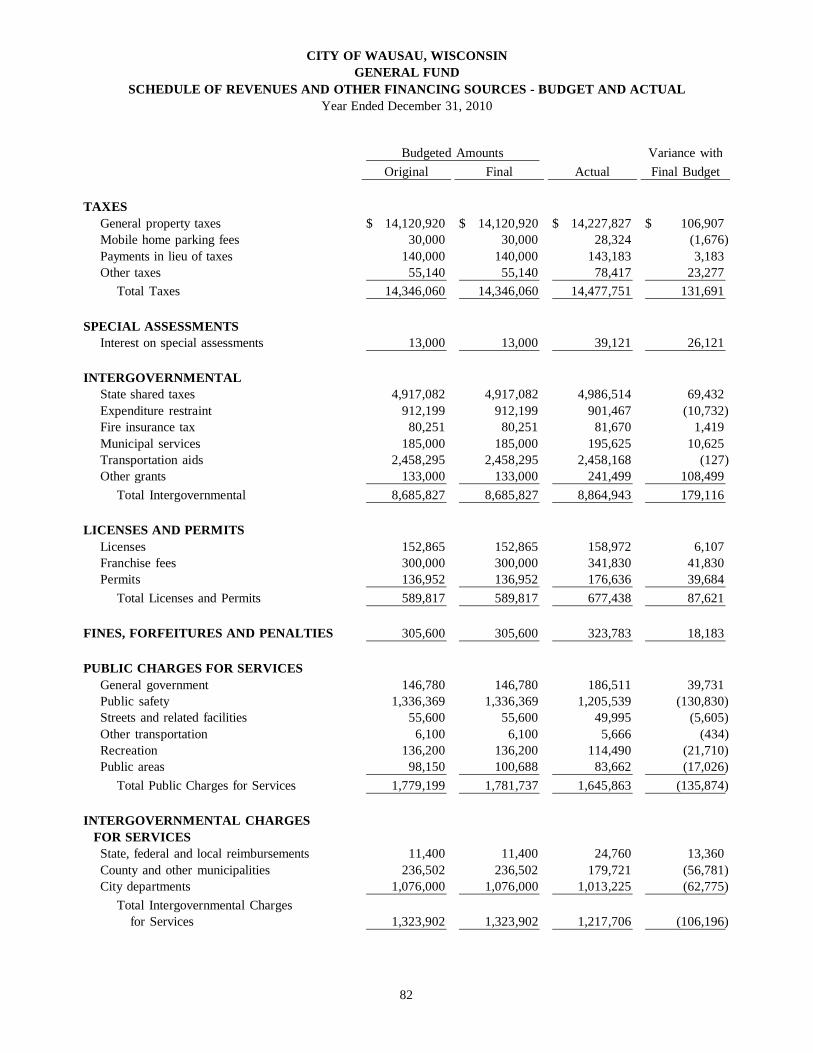
CITY OF WAUSAU, WISCONSINGENERAL FUND
SCHEDULE OF REVENUES AND OTHER FINANCING SOURCES - BUDGET AND ACTUALYear Ended December 31, 2010
Budgeted Amounts Variance withOriginal Final Actual Final Budget
TAXES General property taxes 14,120,920$ 14,120,920$ 14,227,827$ 106,907$ Mobile home parking fees 30,000 30,000 28,324 (1,676) Payments in lieu of taxes 140,000 140,000 143,183 3,183 Other taxes 55,140 55,140 78,417 23,277 Total Taxes 14,346,060 14,346,060 14,477,751 131,691
SPECIAL ASSESSMENTS Interest on special assessments 13,000 13,000 39,121 26,121
INTERGOVERNMENTAL State shared taxes 4,917,082 4,917,082 4,986,514 69,432 Expenditure restraint 912,199 912,199 901,467 (10,732) Fire insurance tax 80,251 80,251 81,670 1,419 Municipal services 185,000 185,000 195,625 10,625 Transportation aids 2,458,295 2,458,295 2,458,168 (127) Other grants 133,000 133,000 241,499 108,499 Total Intergovernmental 8,685,827 8,685,827 8,864,943 179,116
LICENSES AND PERMITS Licenses 152,865 152,865 158,972 6,107 Franchise fees 300,000 300,000 341,830 41,830 Permits 136,952 136,952 176,636 39,684 Total Licenses and Permits 589,817 589,817 677,438 87,621
FINES, FORFEITURES AND PENALTIES 305,600 305,600 323,783 18,183
PUBLIC CHARGES FOR SERVICES General government 146,780 146,780 186,511 39,731 Public safety 1,336,369 1,336,369 1,205,539 (130,830) Streets and related facilities 55,600 55,600 49,995 (5,605) Other transportation 6,100 6,100 5,666 (434) Recreation 136,200 136,200 114,490 (21,710) Public areas 98,150 100,688 83,662 (17,026) Total Public Charges for Services 1,779,199 1,781,737 1,645,863 (135,874)
INTERGOVERNMENTAL CHARGES FOR SERVICES State, federal and local reimbursements 11,400 11,400 24,760 13,360 County and other municipalities 236,502 236,502 179,721 (56,781) City departments 1,076,000 1,076,000 1,013,225 (62,775) Total Intergovernmental Charges for Services 1,323,902 1,323,902 1,217,706 (106,196)
82
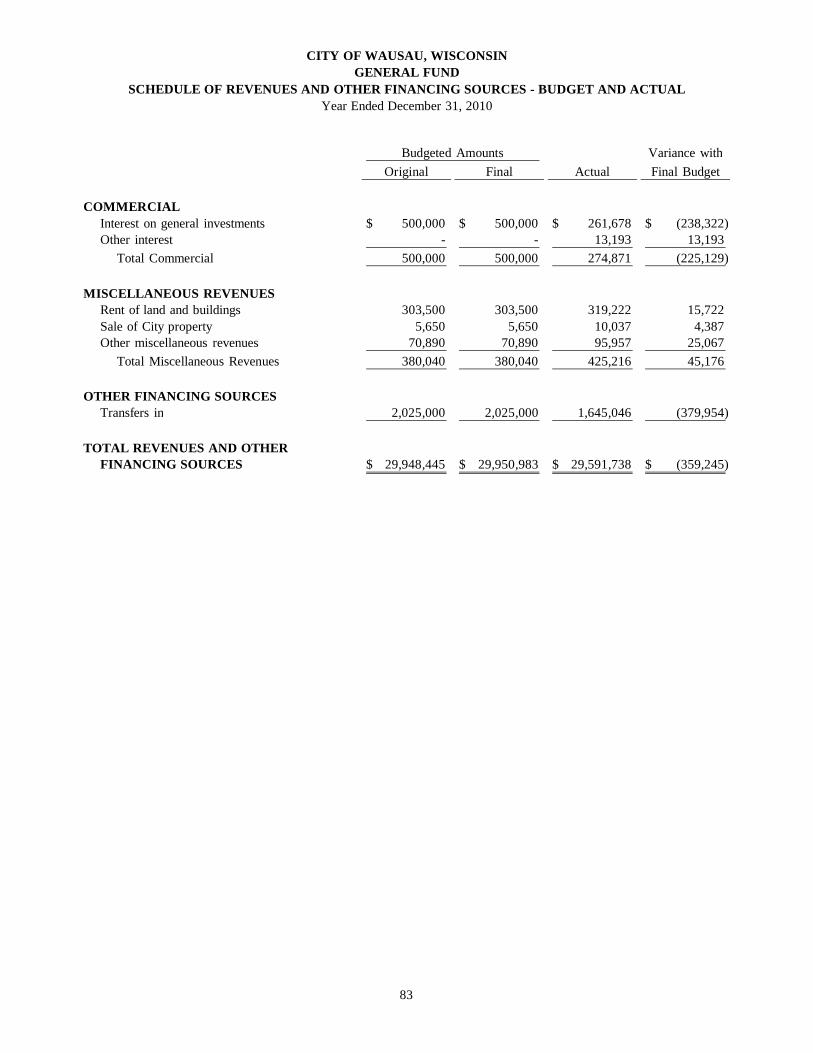
CITY OF WAUSAU, WISCONSINGENERAL FUND
SCHEDULE OF REVENUES AND OTHER FINANCING SOURCES - BUDGET AND ACTUALYear Ended December 31, 2010
Budgeted Amounts Variance withOriginal Final Actual Final Budget
COMMERCIAL Interest on general investments 500,000$ 500,000$ 261,678$ (238,322)$ Other interest - - 13,193 13,193 Total Commercial 500,000 500,000 274,871 (225,129)
MISCELLANEOUS REVENUES Rent of land and buildings 303,500 303,500 319,222 15,722 Sale of City property 5,650 5,650 10,037 4,387 Other miscellaneous revenues 70,890 70,890 95,957 25,067 Total Miscellaneous Revenues 380,040 380,040 425,216 45,176
OTHER FINANCING SOURCES Transfers in 2,025,000 2,025,000 1,645,046 (379,954)
TOTAL REVENUES AND OTHER FINANCING SOURCES 29,948,445$ 29,950,983$ 29,591,738$ (359,245)$
83
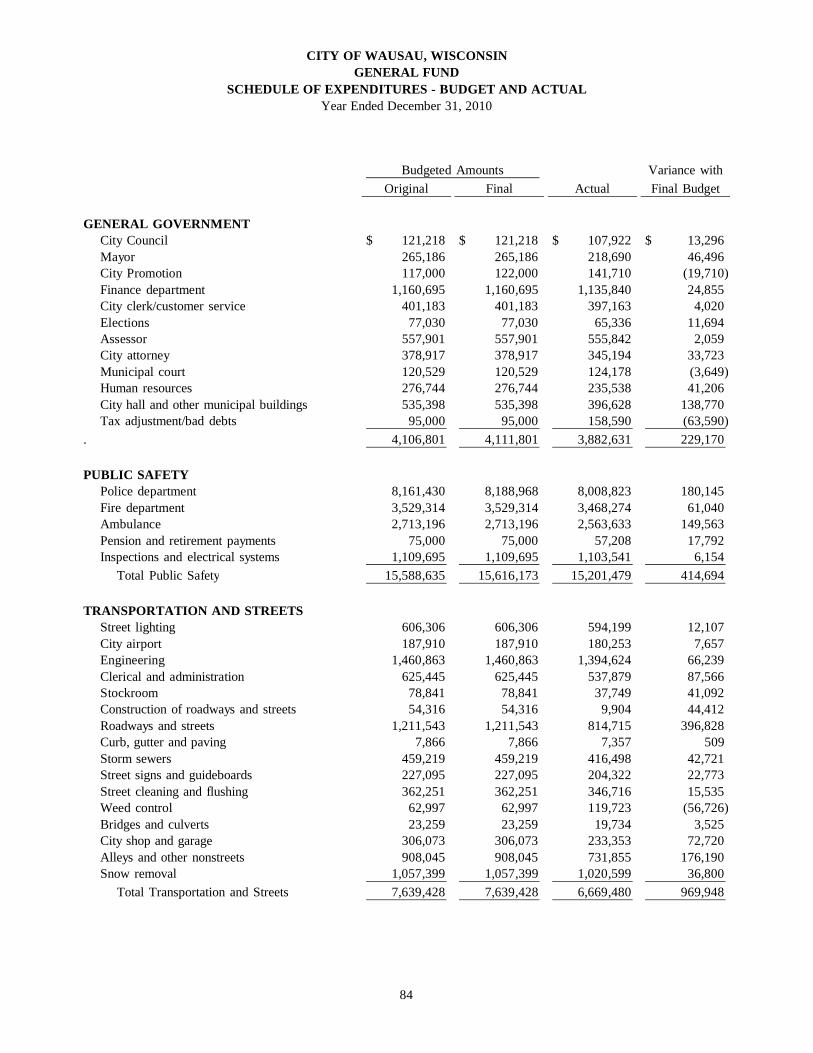
CITY OF WAUSAU, WISCONSINGENERAL FUND
SCHEDULE OF EXPENDITURES - BUDGET AND ACTUALYear Ended December 31, 2010
Budgeted Amounts Variance withOriginal Final Actual Final Budget
GENERAL GOVERNMENT City Council 121,218$ 121,218$ 107,922$ 13,296$ Mayor 265,186 265,186 218,690 46,496 City Promotion 117,000 122,000 141,710 (19,710) Finance department 1,160,695 1,160,695 1,135,840 24,855 City clerk/customer service 401,183 401,183 397,163 4,020 Elections 77,030 77,030 65,336 11,694 Assessor 557,901 557,901 555,842 2,059 City attorney 378,917 378,917 345,194 33,723 Municipal court 120,529 120,529 124,178 (3,649) Human resources 276,744 276,744 235,538 41,206 City hall and other municipal buildings 535,398 535,398 396,628 138,770 Tax adjustment/bad debts 95,000 95,000 158,590 (63,590) . 4,106,801 4,111,801 3,882,631 229,170
PUBLIC SAFETY Police department 8,161,430 8,188,968 8,008,823 180,145 Fire department 3,529,314 3,529,314 3,468,274 61,040 Ambulance 2,713,196 2,713,196 2,563,633 149,563 Pension and retirement payments 75,000 75,000 57,208 17,792 Inspections and electrical systems 1,109,695 1,109,695 1,103,541 6,154 Total Public Safety 15,588,635 15,616,173 15,201,479 414,694
TRANSPORTATION AND STREETS Street lighting 606,306 606,306 594,199 12,107 City airport 187,910 187,910 180,253 7,657 Engineering 1,460,863 1,460,863 1,394,624 66,239 Clerical and administration 625,445 625,445 537,879 87,566 Stockroom 78,841 78,841 37,749 41,092 Construction of roadways and streets 54,316 54,316 9,904 44,412 Roadways and streets 1,211,543 1,211,543 814,715 396,828 Curb, gutter and paving 7,866 7,866 7,357 509 Storm sewers 459,219 459,219 416,498 42,721 Street signs and guideboards 227,095 227,095 204,322 22,773 Street cleaning and flushing 362,251 362,251 346,716 15,535 Weed control 62,997 62,997 119,723 (56,726) Bridges and culverts 23,259 23,259 19,734 3,525 City shop and garage 306,073 306,073 233,353 72,720 Alleys and other nonstreets 908,045 908,045 731,855 176,190 Snow removal 1,057,399 1,057,399 1,020,599 36,800 Total Transportation and Streets 7,639,428 7,639,428 6,669,480 969,948
84
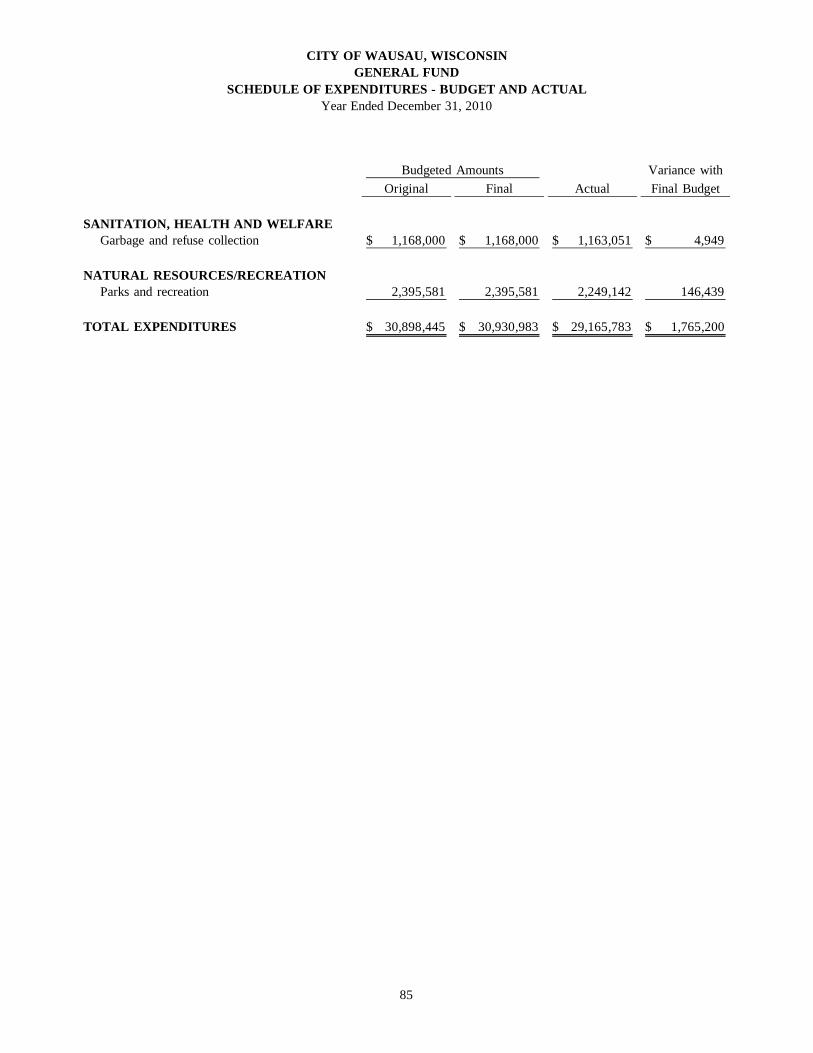
CITY OF WAUSAU, WISCONSINGENERAL FUND
SCHEDULE OF EXPENDITURES - BUDGET AND ACTUALYear Ended December 31, 2010
Budgeted Amounts Variance withOriginal Final Actual Final Budget
SANITATION, HEALTH AND WELFARE Garbage and refuse collection 1,168,000$ 1,168,000$ 1,163,051$ 4,949$
NATURAL RESOURCES/RECREATION Parks and recreation 2,395,581 2,395,581 2,249,142 146,439
TOTAL EXPENDITURES 30,898,445$ 30,930,983$ 29,165,783$ 1,765,200$
85
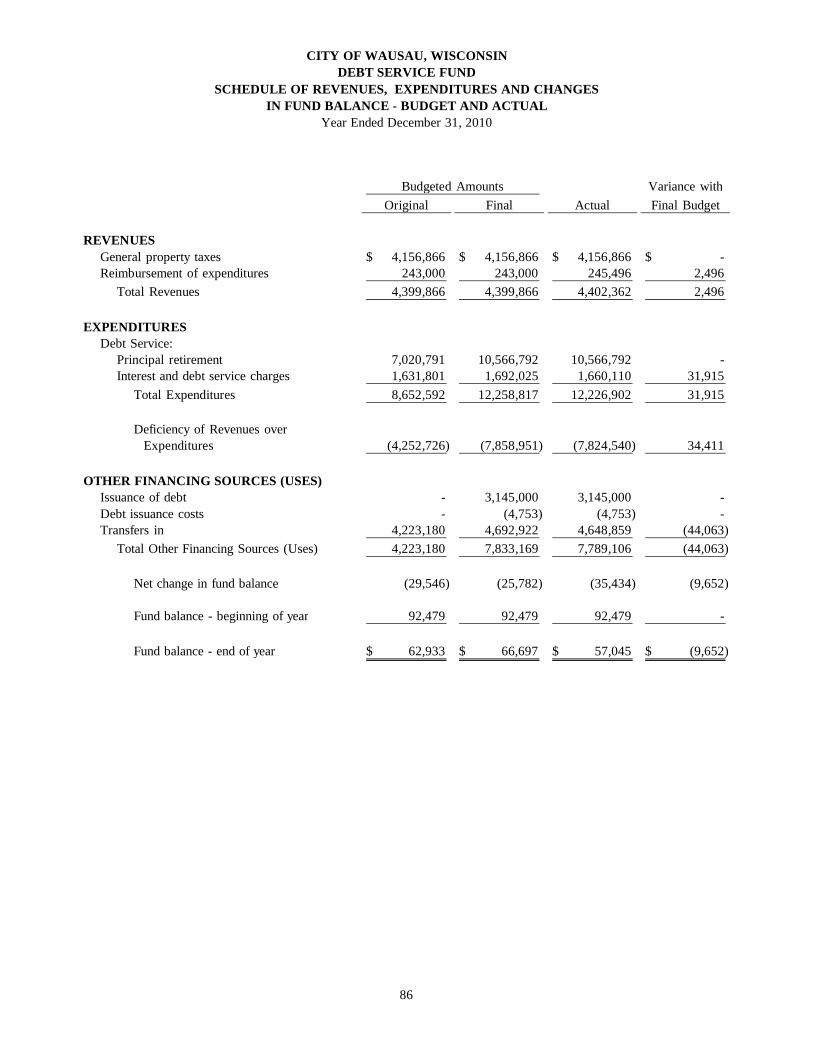
CITY OF WAUSAU, WISCONSINDEBT SERVICE FUND
SCHEDULE OF REVENUES, EXPENDITURES AND CHANGESIN FUND BALANCE - BUDGET AND ACTUAL
Year Ended December 31, 2010
Budgeted Amounts Variance withOriginal Final Actual Final Budget
REVENUES General property taxes 4,156,866$ 4,156,866$ 4,156,866$ -$ Reimbursement of expenditures 243,000 243,000 245,496 2,496 Total Revenues 4,399,866 4,399,866 4,402,362 2,496
EXPENDITURES Debt Service: Principal retirement 7,020,791 10,566,792 10,566,792 - Interest and debt service charges 1,631,801 1,692,025 1,660,110 31,915 Total Expenditures 8,652,592 12,258,817 12,226,902 31,915
Deficiency of Revenues over Expenditures (4,252,726) (7,858,951) (7,824,540) 34,411
OTHER FINANCING SOURCES (USES) Issuance of debt - 3,145,000 3,145,000 - Debt issuance costs - (4,753) (4,753) - Transfers in 4,223,180 4,692,922 4,648,859 (44,063) Total Other Financing Sources (Uses) 4,223,180 7,833,169 7,789,106 (44,063)
Net change in fund balance (29,546) (25,782) (35,434) (9,652)
Fund balance - beginning of year 92,479 92,479 92,479 -
Fund balance - end of year 62,933$ 66,697$ 57,045$ (9,652)$
86
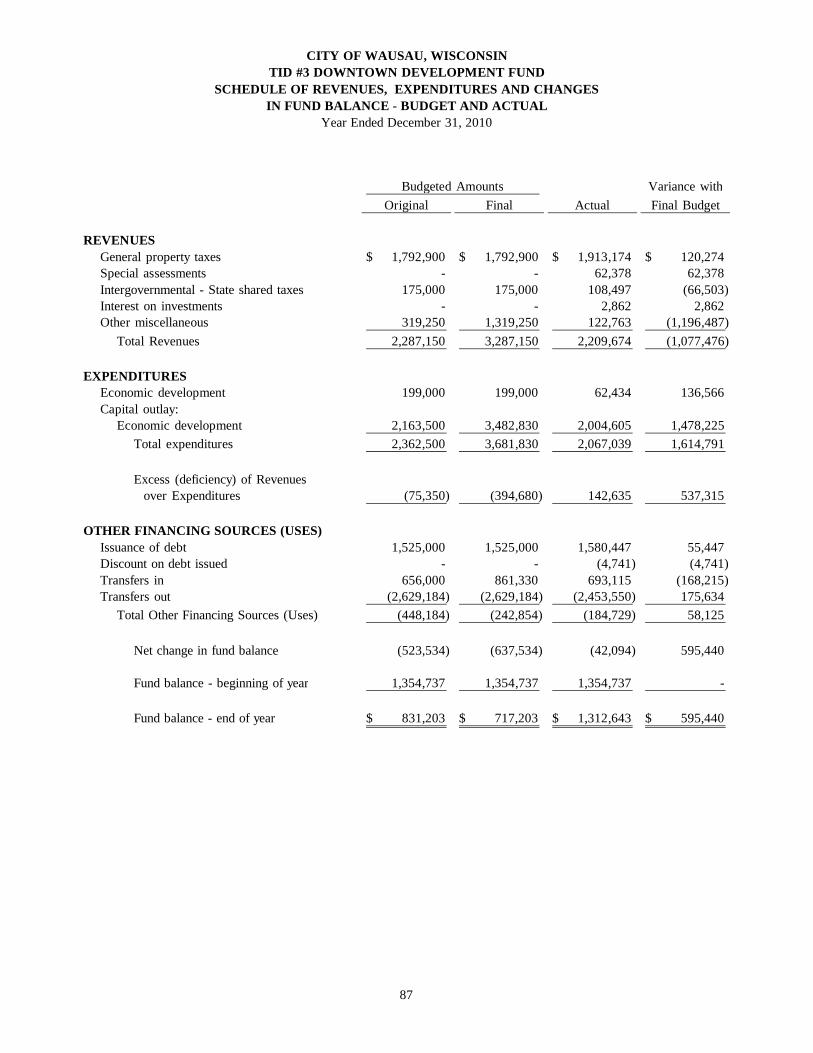
CITY OF WAUSAU, WISCONSINTID #3 DOWNTOWN DEVELOPMENT FUND
SCHEDULE OF REVENUES, EXPENDITURES AND CHANGESIN FUND BALANCE - BUDGET AND ACTUAL
Year Ended December 31, 2010
Budgeted Amounts Variance withOriginal Final Actual Final Budget
REVENUES General property taxes 1,792,900$ 1,792,900$ 1,913,174$ 120,274$ Special assessments - - 62,378 62,378 Intergovernmental - State shared taxes 175,000 175,000 108,497 (66,503) Interest on investments - - 2,862 2,862 Other miscellaneous 319,250 1,319,250 122,763 (1,196,487) Total Revenues 2,287,150 3,287,150 2,209,674 (1,077,476)
EXPENDITURES Economic development 199,000 199,000 62,434 136,566 Capital outlay: Economic development 2,163,500 3,482,830 2,004,605 1,478,225 Total expenditures 2,362,500 3,681,830 2,067,039 1,614,791 Excess (deficiency) of Revenues over Expenditures (75,350) (394,680) 142,635 537,315
OTHER FINANCING SOURCES (USES) Issuance of debt 1,525,000 1,525,000 1,580,447 55,447 Discount on debt issued - - (4,741) (4,741) Transfers in 656,000 861,330 693,115 (168,215) Transfers out (2,629,184) (2,629,184) (2,453,550) 175,634 Total Other Financing Sources (Uses) (448,184) (242,854) (184,729) 58,125
Net change in fund balance (523,534) (637,534) (42,094) 595,440
Fund balance - beginning of year 1,354,737 1,354,737 1,354,737 -
Fund balance - end of year 831,203$ 717,203$ 1,312,643$ 595,440$
87
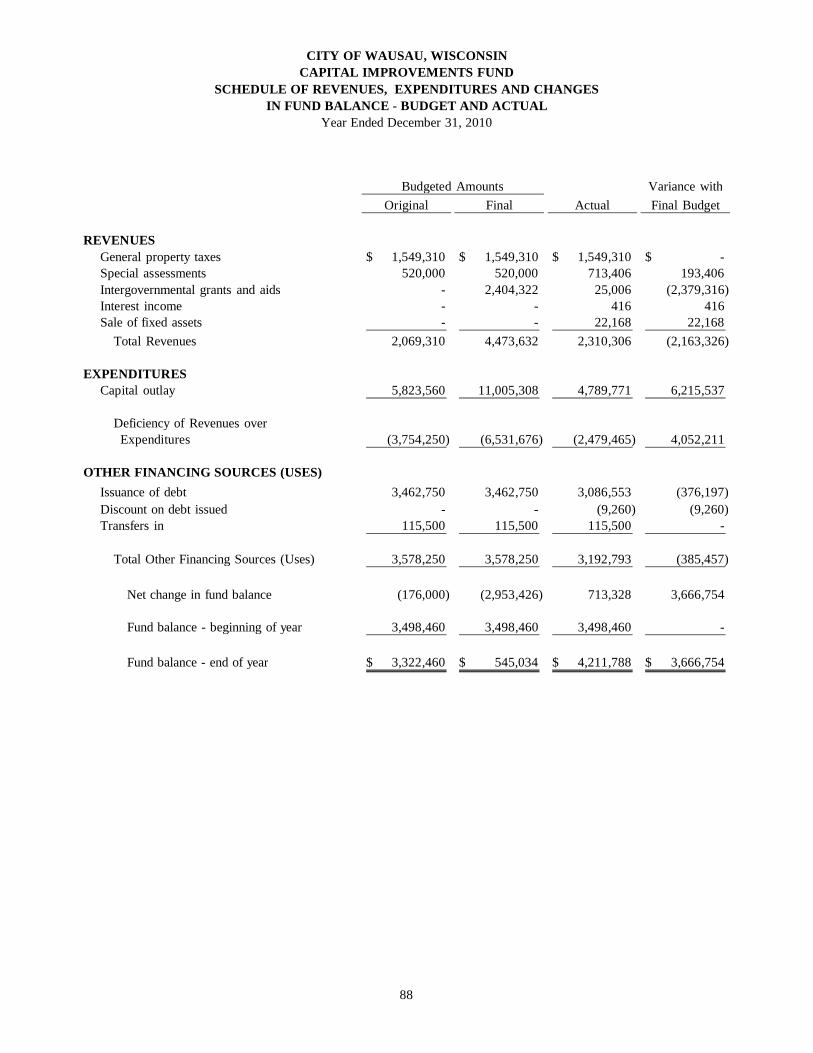
CITY OF WAUSAU, WISCONSINCAPITAL IMPROVEMENTS FUND
SCHEDULE OF REVENUES, EXPENDITURES AND CHANGESIN FUND BALANCE - BUDGET AND ACTUAL
Year Ended December 31, 2010
Budgeted Amounts Variance withOriginal Final Actual Final Budget
REVENUES General property taxes 1,549,310$ 1,549,310$ 1,549,310$ -$ Special assessments 520,000 520,000 713,406 193,406 Intergovernmental grants and aids - 2,404,322 25,006 (2,379,316) Interest income - - 416 416 Sale of fixed assets - - 22,168 22,168 Total Revenues 2,069,310 4,473,632 2,310,306 (2,163,326)
EXPENDITURES Capital outlay 5,823,560 11,005,308 4,789,771 6,215,537
Deficiency of Revenues over Expenditures (3,754,250) (6,531,676) (2,479,465) 4,052,211
OTHER FINANCING SOURCES (USES) Issuance of debt 3,462,750 3,462,750 3,086,553 (376,197) Discount on debt issued - - (9,260) (9,260) Transfers in 115,500 115,500 115,500 -
Total Other Financing Sources (Uses) 3,578,250 3,578,250 3,192,793 (385,457)
Net change in fund balance (176,000) (2,953,426) 713,328 3,666,754
Fund balance - beginning of year 3,498,460 3,498,460 3,498,460 -
Fund balance - end of year 3,322,460$ 545,034$ 4,211,788$ 3,666,754$
88
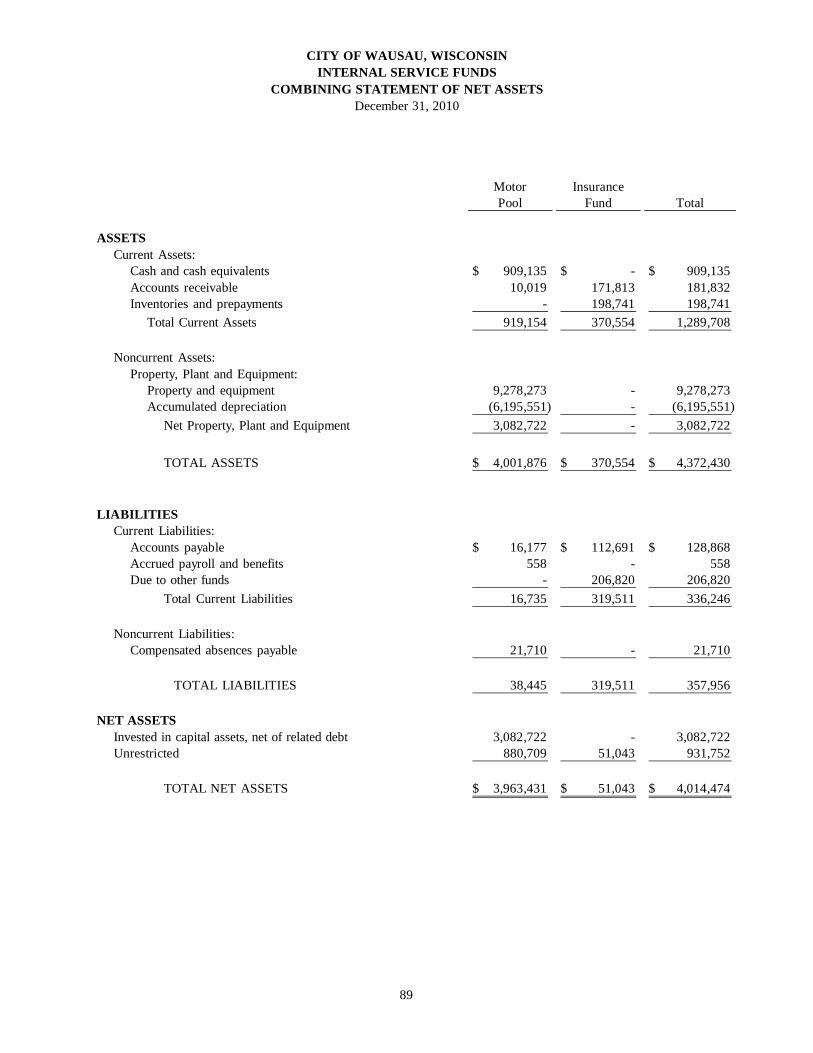
CITY OF WAUSAU, WISCONSININTERNAL SERVICE FUNDS
COMBINING STATEMENT OF NET ASSETSDecember 31, 2010
Motor InsurancePool Fund Total
ASSETS Current Assets: Cash and cash equivalents 909,135$ -$ 909,135$ Accounts receivable 10,019 171,813 181,832 Inventories and prepayments - 198,741 198,741 Total Current Assets 919,154 370,554 1,289,708
Noncurrent Assets: Property, Plant and Equipment: Property and equipment 9,278,273 - 9,278,273 Accumulated depreciation (6,195,551) - (6,195,551) Net Property, Plant and Equipment 3,082,722 - 3,082,722
TOTAL ASSETS 4,001,876$ 370,554$ 4,372,430$
LIABILITIES Current Liabilities: Accounts payable 16,177$ 112,691$ 128,868$ Accrued payroll and benefits 558 - 558 Due to other funds - 206,820 206,820 Total Current Liabilities 16,735 319,511 336,246
Noncurrent Liabilities: Compensated absences payable 21,710 - 21,710
TOTAL LIABILITIES 38,445 319,511 357,956
NET ASSETS Invested in capital assets, net of related debt 3,082,722 - 3,082,722 Unrestricted 880,709 51,043 931,752
TOTAL NET ASSETS 3,963,431$ 51,043$ 4,014,474$
89
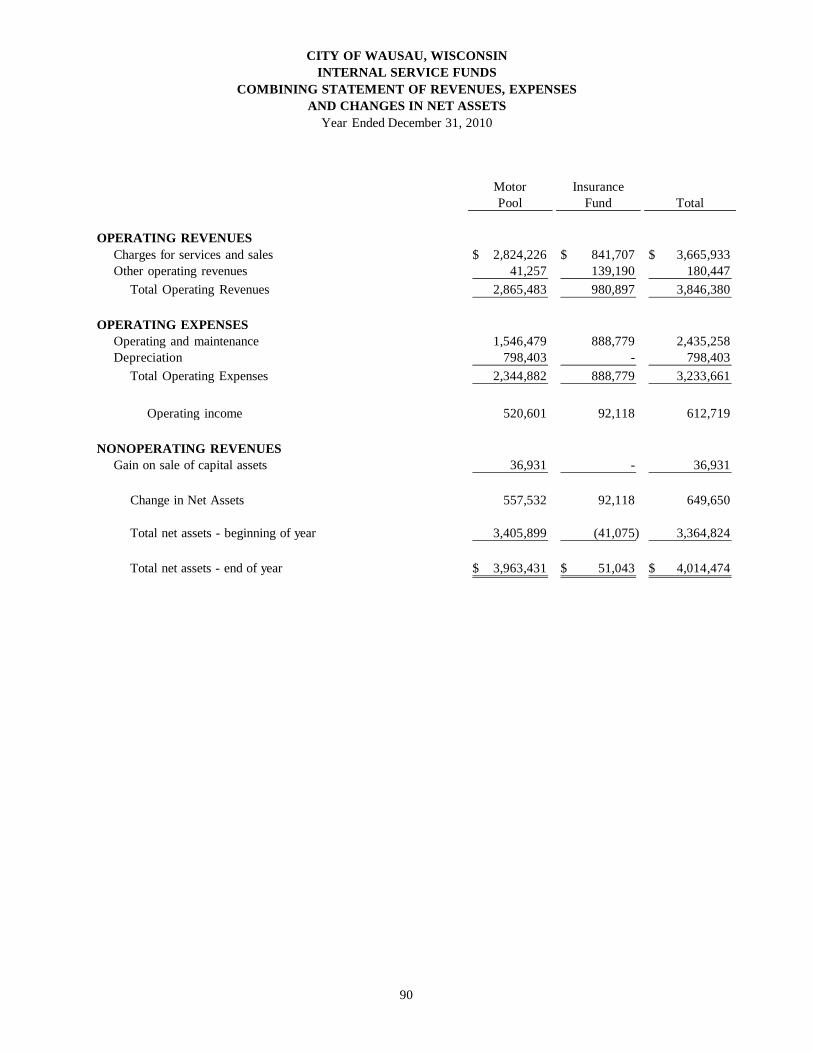
CITY OF WAUSAU, WISCONSININTERNAL SERVICE FUNDS
COMBINING STATEMENT OF REVENUES, EXPENSESAND CHANGES IN NET ASSETS
Year Ended December 31, 2010
Motor InsurancePool Fund Total
OPERATING REVENUES Charges for services and sales 2,824,226$ 841,707$ 3,665,933$ Other operating revenues 41,257 139,190 180,447 Total Operating Revenues 2,865,483 980,897 3,846,380
OPERATING EXPENSES Operating and maintenance 1,546,479 888,779 2,435,258 Depreciation 798,403 - 798,403 Total Operating Expenses 2,344,882 888,779 3,233,661
Operating income 520,601 92,118 612,719
NONOPERATING REVENUES Gain on sale of capital assets 36,931 - 36,931
Change in Net Assets 557,532 92,118 649,650
Total net assets - beginning of year 3,405,899 (41,075) 3,364,824
Total net assets - end of year 3,963,431$ 51,043$ 4,014,474$
90
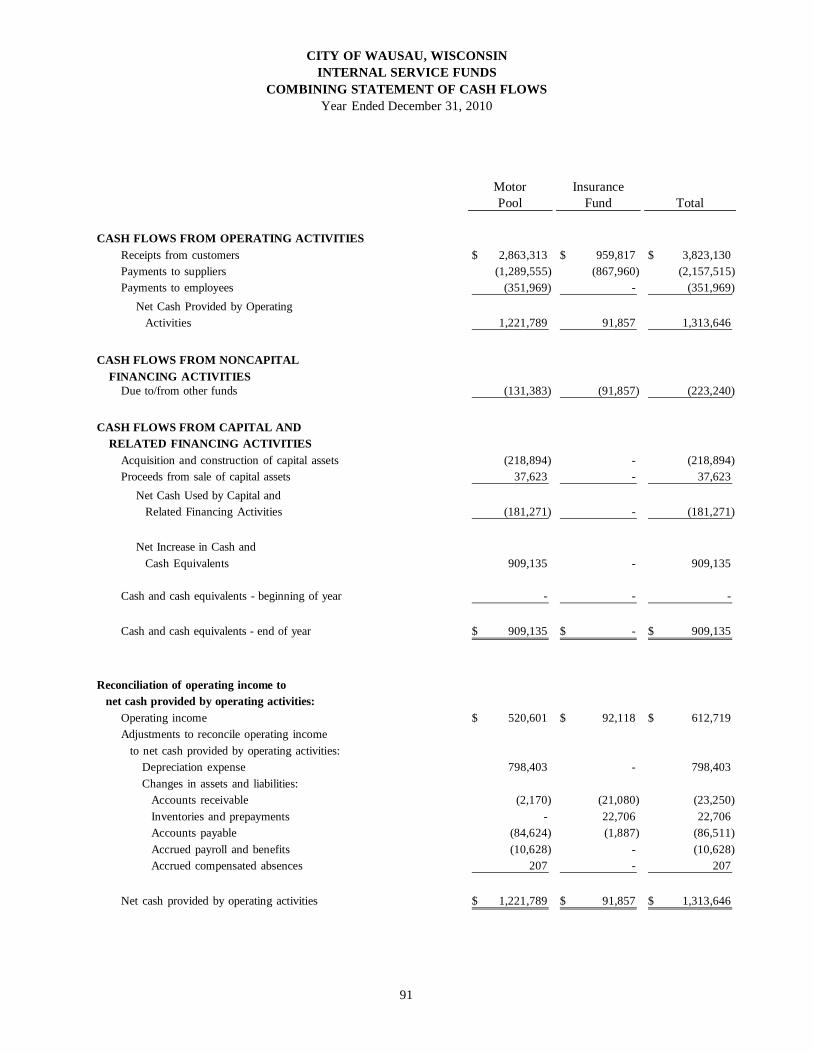
CITY OF WAUSAU, WISCONSININTERNAL SERVICE FUNDS
COMBINING STATEMENT OF CASH FLOWSYear Ended December 31, 2010
Motor InsurancePool Fund Total
CASH FLOWS FROM OPERATING ACTIVITIES Receipts from customers 2,863,313$ 959,817$ 3,823,130$ Payments to suppliers (1,289,555) (867,960) (2,157,515) Payments to employees (351,969) - (351,969) Net Cash Provided by Operating Activities 1,221,789 91,857 1,313,646
CASH FLOWS FROM NONCAPITAL FINANCING ACTIVITIES Due to/from other funds (131,383) (91,857) (223,240)
CASH FLOWS FROM CAPITAL AND RELATED FINANCING ACTIVITIES Acquisition and construction of capital assets (218,894) - (218,894) Proceeds from sale of capital assets 37,623 - 37,623 Net Cash Used by Capital and Related Financing Activities (181,271) - (181,271)
Net Increase in Cash and Cash Equivalents 909,135 - 909,135
Cash and cash equivalents - beginning of year - - -
Cash and cash equivalents - end of year 909,135$ -$ 909,135$
Reconciliation of operating income to net cash provided by operating activities: Operating income 520,601$ 92,118$ 612,719$ Adjustments to reconcile operating income to net cash provided by operating activities: Depreciation expense 798,403 - 798,403 Changes in assets and liabilities: Accounts receivable (2,170) (21,080) (23,250) Inventories and prepayments - 22,706 22,706 Accounts payable (84,624) (1,887) (86,511) Accrued payroll and benefits (10,628) - (10,628) Accrued compensated absences 207 - 207
Net cash provided by operating activities 1,221,789$ 91,857$ 1,313,646$
91
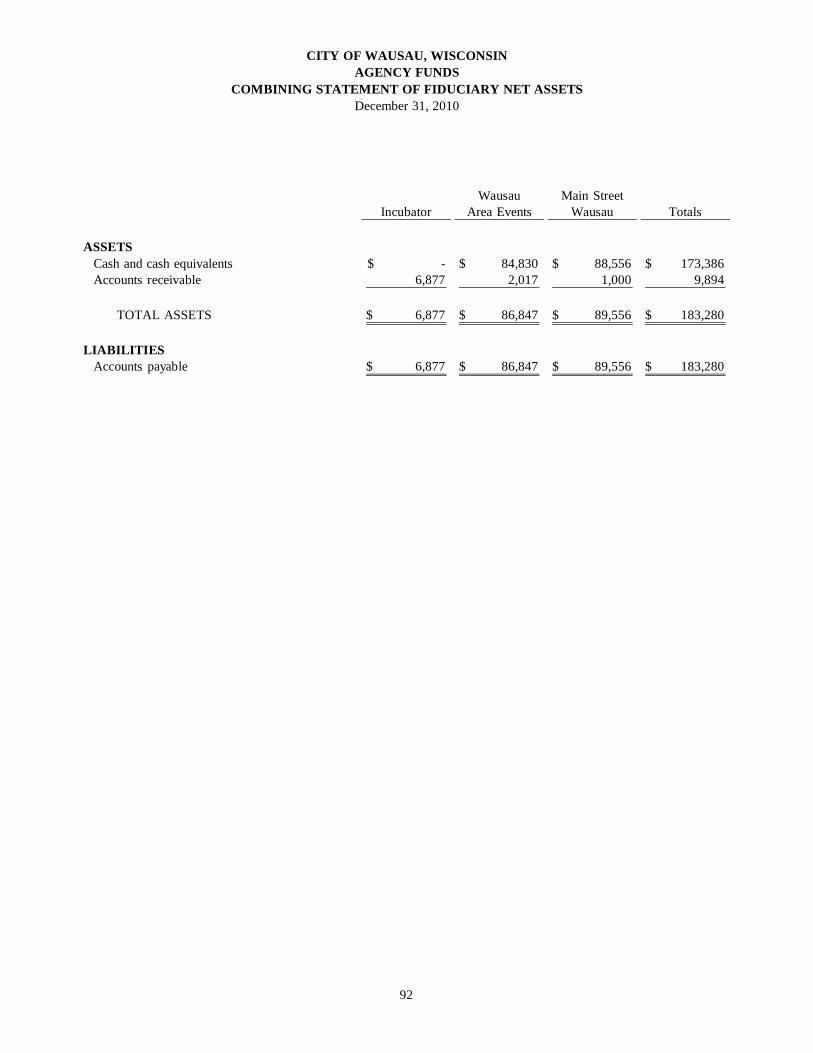
CITY OF WAUSAU, WISCONSINAGENCY FUNDS
COMBINING STATEMENT OF FIDUCIARY NET ASSETSDecember 31, 2010
Wausau Main StreetIncubator Area Events Wausau Totals
ASSETS Cash and cash equivalents -$ 84,830$ 88,556$ 173,386$ Accounts receivable 6,877 2,017 1,000 9,894
TOTAL ASSETS 6,877$ 86,847$ 89,556$ 183,280$
LIABILITIES Accounts payable 6,877$ 86,847$ 89,556$ 183,280$
92
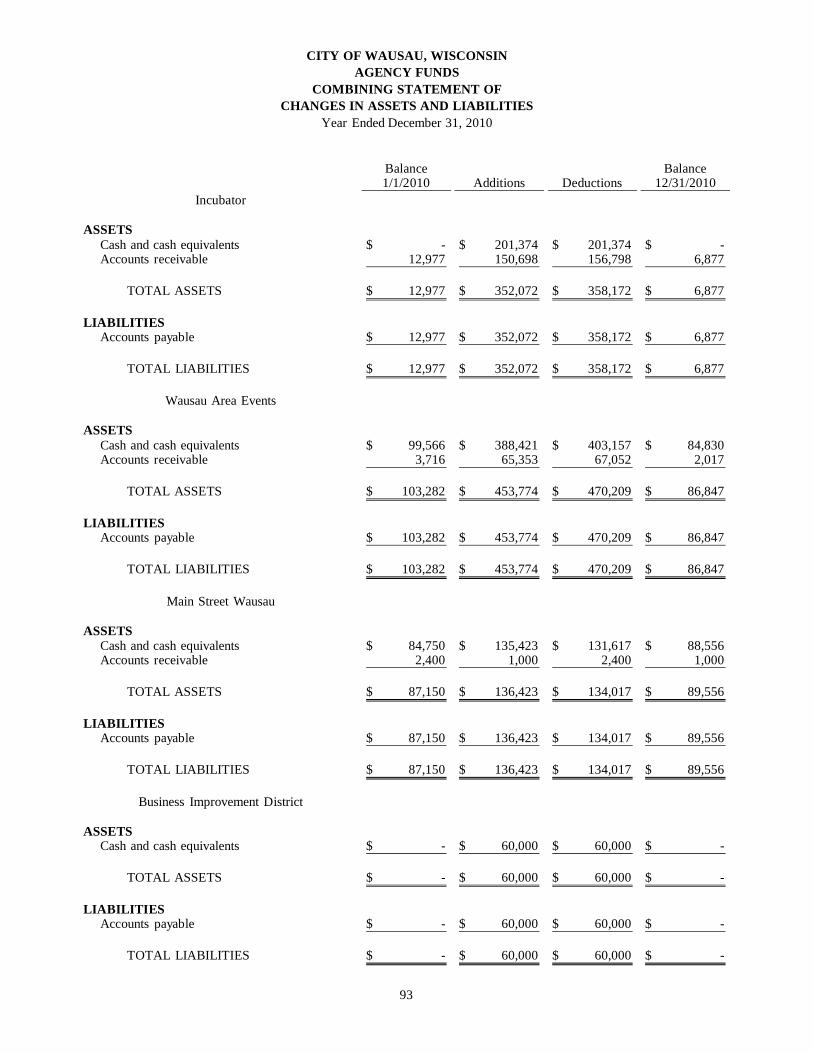
CITY OF WAUSAU, WISCONSINAGENCY FUNDS
COMBINING STATEMENT OFCHANGES IN ASSETS AND LIABILITIES
Year Ended December 31, 2010
Balance Balance1/1/2010 Additions Deductions 12/31/2010
Incubator
ASSETS Cash and cash equivalents -$ 201,374$ 201,374$ -$ Accounts receivable 12,977 150,698 156,798 6,877
TOTAL ASSETS 12,977$ 352,072$ 358,172$ 6,877$
LIABILITIES Accounts payable 12,977$ 352,072$ 358,172$ 6,877$
TOTAL LIABILITIES 12,977$ 352,072$ 358,172$ 6,877$
Wausau Area Events
ASSETS Cash and cash equivalents 99,566$ 388,421$ 403,157$ 84,830$ Accounts receivable 3,716 65,353 67,052 2,017
TOTAL ASSETS 103,282$ 453,774$ 470,209$ 86,847$
LIABILITIES Accounts payable 103,282$ 453,774$ 470,209$ 86,847$
TOTAL LIABILITIES 103,282$ 453,774$ 470,209$ 86,847$
Main Street Wausau
ASSETS Cash and cash equivalents 84,750$ 135,423$ 131,617$ 88,556$ Accounts receivable 2,400 1,000 2,400 1,000
TOTAL ASSETS 87,150$ 136,423$ 134,017$ 89,556$
LIABILITIES Accounts payable 87,150$ 136,423$ 134,017$ 89,556$
TOTAL LIABILITIES 87,150$ 136,423$ 134,017$ 89,556$
Business Improvement District
ASSETS Cash and cash equivalents -$ 60,000$ 60,000$ -$
TOTAL ASSETS -$ 60,000$ 60,000$ -$
LIABILITIES Accounts payable -$ 60,000$ 60,000$ -$
TOTAL LIABILITIES -$ 60,000$ 60,000$ -$
93
CAPITAL ASSETS USED IN THE OPERATION OF GOVERNMENTAL FUNDS
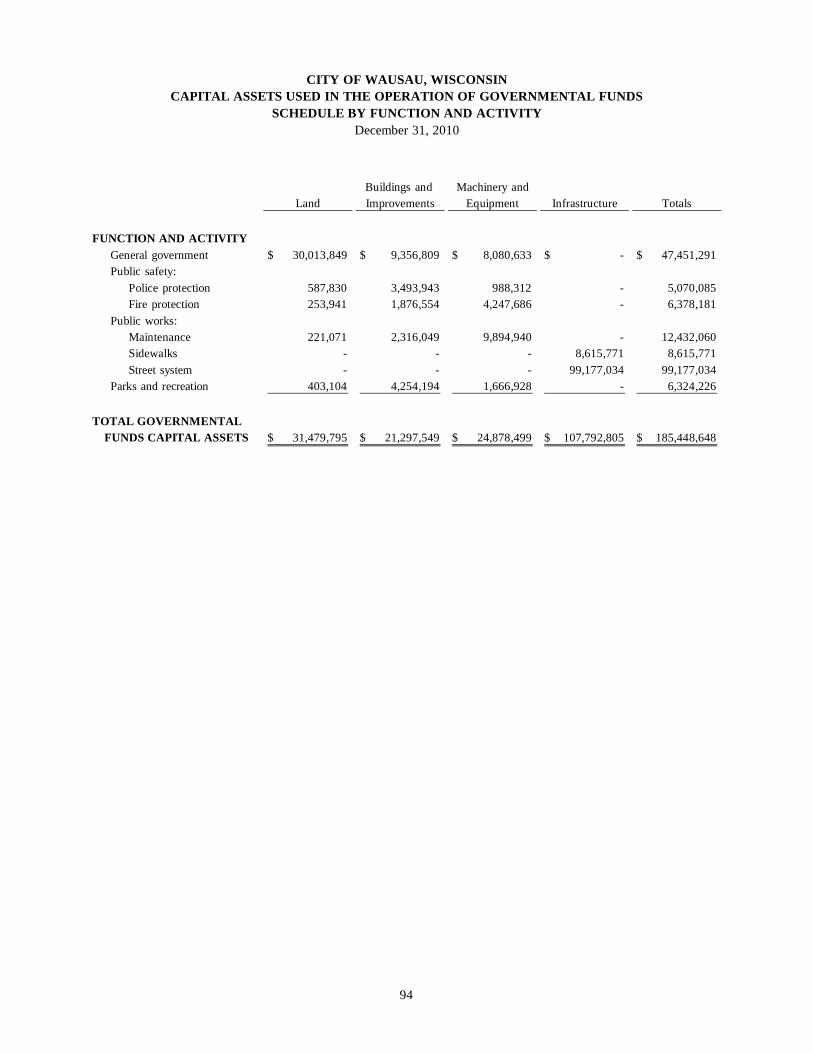
CITY OF WAUSAU, WISCONSINCAPITAL ASSETS USED IN THE OPERATION OF GOVERNMENTAL FUNDS
SCHEDULE BY FUNCTION AND ACTIVITYDecember 31, 2010
Buildings and Machinery andLand Improvements Equipment Infrastructure Totals
FUNCTION AND ACTIVITY General government 30,013,849$ 9,356,809$ 8,080,633$ -$ 47,451,291$ Public safety: Police protection 587,830 3,493,943 988,312 - 5,070,085 Fire protection 253,941 1,876,554 4,247,686 - 6,378,181 Public works: Maintenance 221,071 2,316,049 9,894,940 - 12,432,060 Sidewalks - - - 8,615,771 8,615,771 Street system - - - 99,177,034 99,177,034 Parks and recreation 403,104 4,254,194 1,666,928 - 6,324,226
TOTAL GOVERNMENTAL FUNDS CAPITAL ASSETS 31,479,795$ 21,297,549$ 24,878,499$ 107,792,805$ 185,448,648$
94
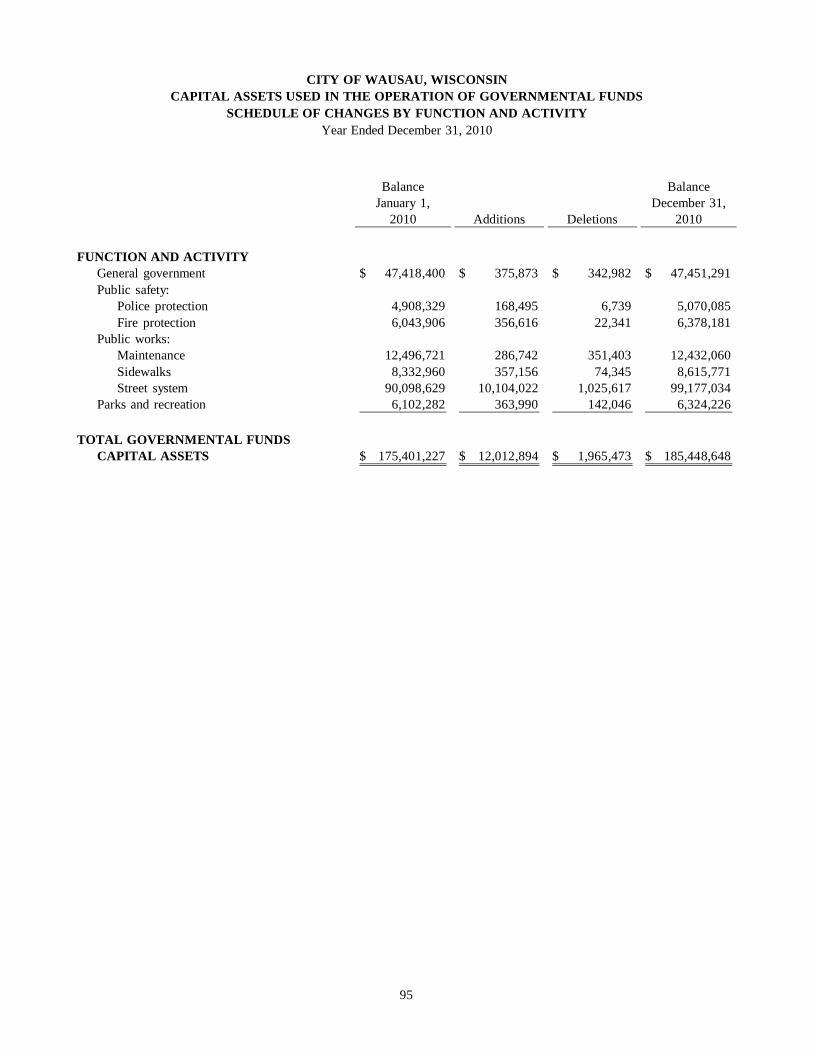
CITY OF WAUSAU, WISCONSINCAPITAL ASSETS USED IN THE OPERATION OF GOVERNMENTAL FUNDS
SCHEDULE OF CHANGES BY FUNCTION AND ACTIVITYYear Ended December 31, 2010
Balance BalanceJanuary 1, December 31,
2010 Additions Deletions 2010
FUNCTION AND ACTIVITY General government 47,418,400$ 375,873$ 342,982$ 47,451,291$ Public safety: Police protection 4,908,329 168,495 6,739 5,070,085 Fire protection 6,043,906 356,616 22,341 6,378,181 Public works: Maintenance 12,496,721 286,742 351,403 12,432,060 Sidewalks 8,332,960 357,156 74,345 8,615,771 Street system 90,098,629 10,104,022 1,025,617 99,177,034 Parks and recreation 6,102,282 363,990 142,046 6,324,226
TOTAL GOVERNMENTAL FUNDS CAPITAL ASSETS 175,401,227$ 12,012,894$ 1,965,473$ 185,448,648$
95
STATISTICAL SECTION
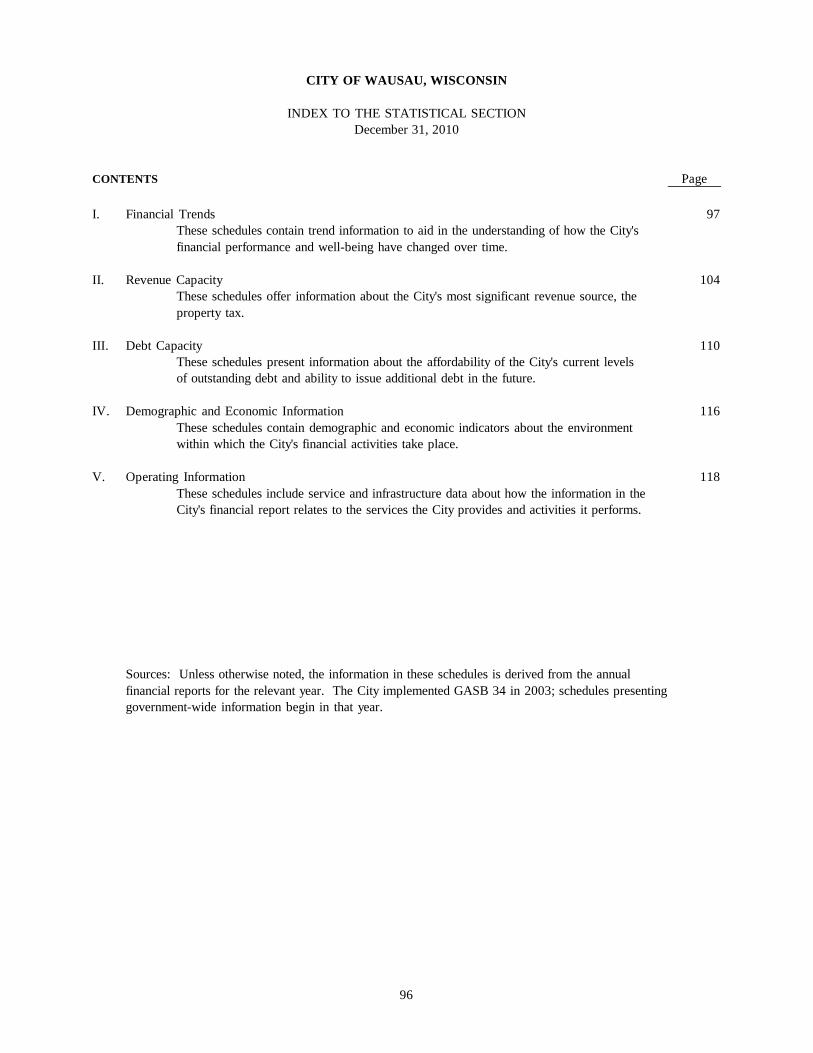
CITY OF WAUSAU, WISCONSIN
INDEX TO THE STATISTICAL SECTIONDecember 31, 2010
CONTENTS Page
I. Financial Trends 97These schedules contain trend information to aid in the understanding of how the City'sfinancial performance and well-being have changed over time.
II. Revenue Capacity 104These schedules offer information about the City's most significant revenue source, theproperty tax.
III. Debt Capacity 110These schedules present information about the affordability of the City's current levelsof outstanding debt and ability to issue additional debt in the future.
IV. Demographic and Economic Information 116These schedules contain demographic and economic indicators about the environmentwithin which the City's financial activities take place.
V. Operating Information 118These schedules include service and infrastructure data about how the information in theCity's financial report relates to the services the City provides and activities it performs.
Sources: Unless otherwise noted, the information in these schedules is derived from the annualfinancial reports for the relevant year. The City implemented GASB 34 in 2003; schedules presentinggovernment-wide information begin in that year.
96
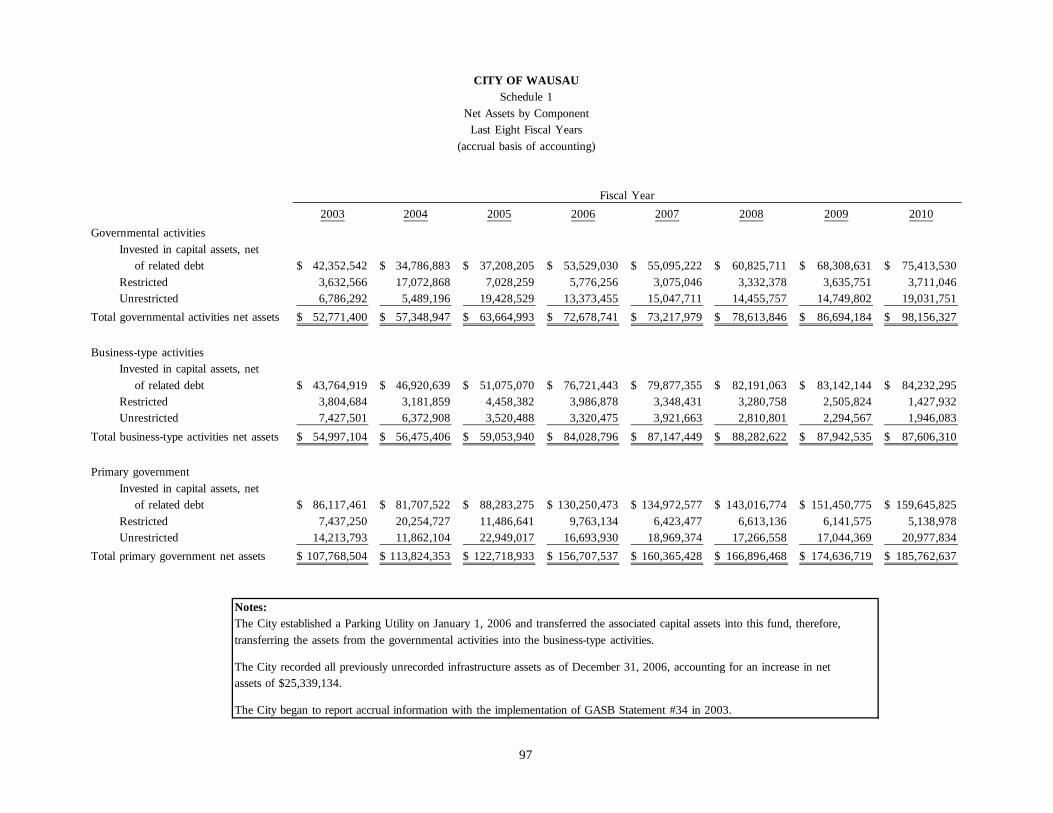
CITY OF WAUSAUSchedule 1
Net Assets by ComponentLast Eight Fiscal Years
(accrual basis of accounting)
Fiscal Year2003 2004 2005 2006 2007 2008 2009 2010
Governmental activitiesInvested in capital assets, net of related debt 42,352,542$ 34,786,883$ 37,208,205$ 53,529,030$ 55,095,222$ 60,825,711$ 68,308,631$ 75,413,530$ Restricted 3,632,566 17,072,868 7,028,259 5,776,256 3,075,046 3,332,378 3,635,751 3,711,046 Unrestricted 6,786,292 5,489,196 19,428,529 13,373,455 15,047,711 14,455,757 14,749,802 19,031,751
Total governmental activities net assets 52,771,400$ 57,348,947$ 63,664,993$ 72,678,741$ 73,217,979$ 78,613,846$ 86,694,184$ 98,156,327$
Business-type activitiesInvested in capital assets, net of related debt 43,764,919$ 46,920,639$ 51,075,070$ 76,721,443$ 79,877,355$ 82,191,063$ 83,142,144$ 84,232,295$ Restricted 3,804,684 3,181,859 4,458,382 3,986,878 3,348,431 3,280,758 2,505,824 1,427,932 Unrestricted 7,427,501 6,372,908 3,520,488 3,320,475 3,921,663 2,810,801 2,294,567 1,946,083
Total business-type activities net assets 54,997,104$ 56,475,406$ 59,053,940$ 84,028,796$ 87,147,449$ 88,282,622$ 87,942,535$ 87,606,310$
Primary governmentInvested in capital assets, net of related debt 86,117,461$ 81,707,522$ 88,283,275$ 130,250,473$ 134,972,577$ 143,016,774$ 151,450,775$ 159,645,825$ Restricted 7,437,250 20,254,727 11,486,641 9,763,134 6,423,477 6,613,136 6,141,575 5,138,978 Unrestricted 14,213,793 11,862,104 22,949,017 16,693,930 18,969,374 17,266,558 17,044,369 20,977,834
Total primary government net assets 107,768,504$ 113,824,353$ 122,718,933$ 156,707,537$ 160,365,428$ 166,896,468$ 174,636,719$ 185,762,637$
Notes:The City established a Parking Utility on January 1, 2006 and transferred the associated capital assets into this fund, therefore,transferring the assets from the governmental activities into the business-type activities.
The City recorded all previously unrecorded infrastructure assets as of December 31, 2006, accounting for an increase in netassets of $25,339,134.
The City began to report accrual information with the implementation of GASB Statement #34 in 2003.
97
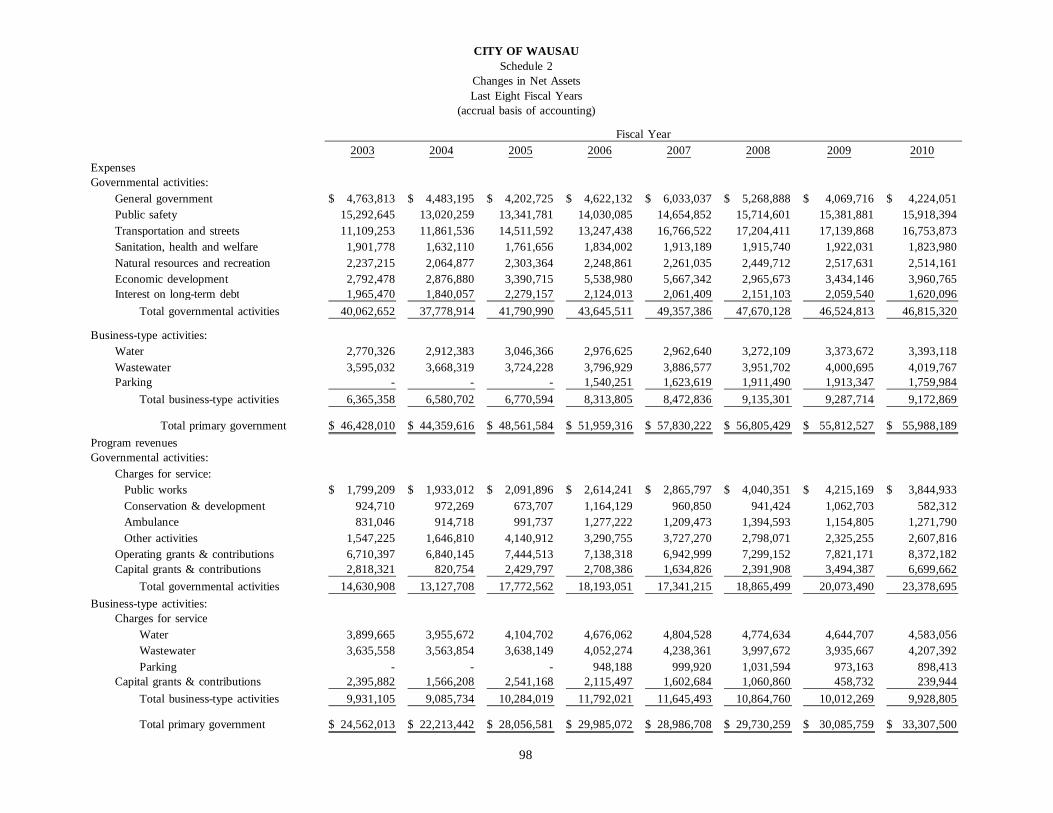
CITY OF WAUSAUSchedule 2
Changes in Net AssetsLast Eight Fiscal Years
(accrual basis of accounting)
Fiscal Year2003 2004 2005 2006 2007 2008 2009 2010
ExpensesGovernmental activities:
General government 4,763,813$ 4,483,195$ 4,202,725$ 4,622,132$ 6,033,037$ 5,268,888$ 4,069,716$ 4,224,051$ Public safety 15,292,645 13,020,259 13,341,781 14,030,085 14,654,852 15,714,601 15,381,881 15,918,394 Transportation and streets 11,109,253 11,861,536 14,511,592 13,247,438 16,766,522 17,204,411 17,139,868 16,753,873 Sanitation, health and welfare 1,901,778 1,632,110 1,761,656 1,834,002 1,913,189 1,915,740 1,922,031 1,823,980 Natural resources and recreation 2,237,215 2,064,877 2,303,364 2,248,861 2,261,035 2,449,712 2,517,631 2,514,161 Economic development 2,792,478 2,876,880 3,390,715 5,538,980 5,667,342 2,965,673 3,434,146 3,960,765 Interest on long-term debt 1,965,470 1,840,057 2,279,157 2,124,013 2,061,409 2,151,103 2,059,540 1,620,096
Total governmental activities 40,062,652 37,778,914 41,790,990 43,645,511 49,357,386 47,670,128 46,524,813 46,815,320
Business-type activities:Water 2,770,326 2,912,383 3,046,366 2,976,625 2,962,640 3,272,109 3,373,672 3,393,118 Wastewater 3,595,032 3,668,319 3,724,228 3,796,929 3,886,577 3,951,702 4,000,695 4,019,767 Parking - - - 1,540,251 1,623,619 1,911,490 1,913,347 1,759,984
Total business-type activities 6,365,358 6,580,702 6,770,594 8,313,805 8,472,836 9,135,301 9,287,714 9,172,869
Total primary government 46,428,010$ 44,359,616$ 48,561,584$ 51,959,316$ 57,830,222$ 56,805,429$ 55,812,527$ 55,988,189$ Program revenuesGovernmental activities:
Charges for service: Public works 1,799,209$ 1,933,012$ 2,091,896$ 2,614,241$ 2,865,797$ 4,040,351$ 4,215,169$ 3,844,933$ Conservation & development 924,710 972,269 673,707 1,164,129 960,850 941,424 1,062,703 582,312 Ambulance 831,046 914,718 991,737 1,277,222 1,209,473 1,394,593 1,154,805 1,271,790 Other activities 1,547,225 1,646,810 4,140,912 3,290,755 3,727,270 2,798,071 2,325,255 2,607,816 Operating grants & contributions 6,710,397 6,840,145 7,444,513 7,138,318 6,942,999 7,299,152 7,821,171 8,372,182 Capital grants & contributions 2,818,321 820,754 2,429,797 2,708,386 1,634,826 2,391,908 3,494,387 6,699,662
Total governmental activities 14,630,908 13,127,708 17,772,562 18,193,051 17,341,215 18,865,499 20,073,490 23,378,695 Business-type activities:
Charges for serviceWater 3,899,665 3,955,672 4,104,702 4,676,062 4,804,528 4,774,634 4,644,707 4,583,056 Wastewater 3,635,558 3,563,854 3,638,149 4,052,274 4,238,361 3,997,672 3,935,667 4,207,392 Parking - - - 948,188 999,920 1,031,594 973,163 898,413
Capital grants & contributions 2,395,882 1,566,208 2,541,168 2,115,497 1,602,684 1,060,860 458,732 239,944 Total business-type activities 9,931,105 9,085,734 10,284,019 11,792,021 11,645,493 10,864,760 10,012,269 9,928,805
Total primary government 24,562,013$ 22,213,442$ 28,056,581$ 29,985,072$ 28,986,708$ 29,730,259$ 30,085,759$ 33,307,500$
98
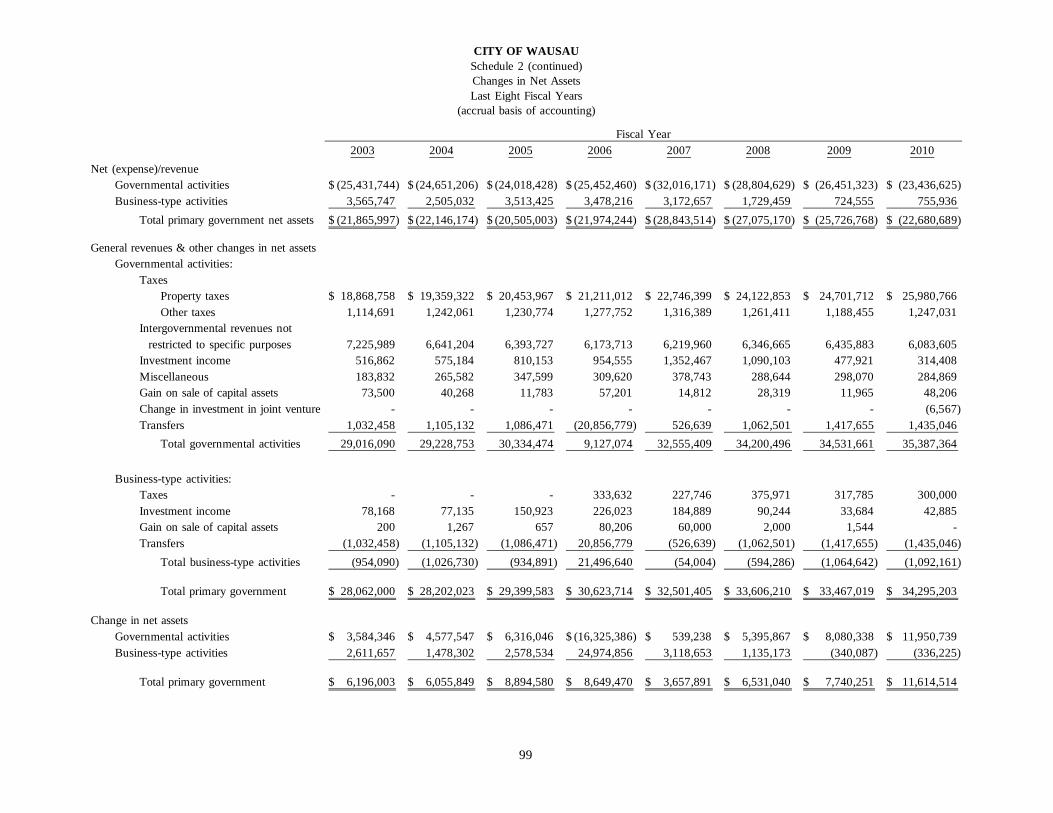
CITY OF WAUSAUSchedule 2 (continued)Changes in Net AssetsLast Eight Fiscal Years
(accrual basis of accounting)
Fiscal Year2003 2004 2005 2006 2007 2008 2009 2010
Net (expense)/revenueGovernmental activities (25,431,744)$ (24,651,206)$ (24,018,428)$ (25,452,460)$ (32,016,171)$ (28,804,629)$ (26,451,323)$ (23,436,625)$ Business-type activities 3,565,747 2,505,032 3,513,425 3,478,216 3,172,657 1,729,459 724,555 755,936
Total primary government net assets (21,865,997)$ (22,146,174)$ (20,505,003)$ (21,974,244)$ (28,843,514)$ (27,075,170)$ (25,726,768)$ (22,680,689)$
General revenues & other changes in net assetsGovernmental activities:
TaxesProperty taxes 18,868,758$ 19,359,322$ 20,453,967$ 21,211,012$ 22,746,399$ 24,122,853$ 24,701,712$ 25,980,766$ Other taxes 1,114,691 1,242,061 1,230,774 1,277,752 1,316,389 1,261,411 1,188,455 1,247,031
Intergovernmental revenues not restricted to specific purposes 7,225,989 6,641,204 6,393,727 6,173,713 6,219,960 6,346,665 6,435,883 6,083,605 Investment income 516,862 575,184 810,153 954,555 1,352,467 1,090,103 477,921 314,408 Miscellaneous 183,832 265,582 347,599 309,620 378,743 288,644 298,070 284,869 Gain on sale of capital assets 73,500 40,268 11,783 57,201 14,812 28,319 11,965 48,206 Change in investment in joint venture - - - - - - - (6,567) Transfers 1,032,458 1,105,132 1,086,471 (20,856,779) 526,639 1,062,501 1,417,655 1,435,046
Total governmental activities 29,016,090 29,228,753 30,334,474 9,127,074 32,555,409 34,200,496 34,531,661 35,387,364
Business-type activities:Taxes - - - 333,632 227,746 375,971 317,785 300,000 Investment income 78,168 77,135 150,923 226,023 184,889 90,244 33,684 42,885 Gain on sale of capital assets 200 1,267 657 80,206 60,000 2,000 1,544 - Transfers (1,032,458) (1,105,132) (1,086,471) 20,856,779 (526,639) (1,062,501) (1,417,655) (1,435,046)
Total business-type activities (954,090) (1,026,730) (934,891) 21,496,640 (54,004) (594,286) (1,064,642) (1,092,161)
Total primary government 28,062,000$ 28,202,023$ 29,399,583$ 30,623,714$ 32,501,405$ 33,606,210$ 33,467,019$ 34,295,203$
Change in net assetsGovernmental activities 3,584,346$ 4,577,547$ 6,316,046$ (16,325,386)$ 539,238$ 5,395,867$ 8,080,338$ 11,950,739$ Business-type activities 2,611,657 1,478,302 2,578,534 24,974,856 3,118,653 1,135,173 (340,087) (336,225)
Total primary government 6,196,003$ 6,055,849$ 8,894,580$ 8,649,470$ 3,657,891$ 6,531,040$ 7,740,251$ 11,614,514$
99
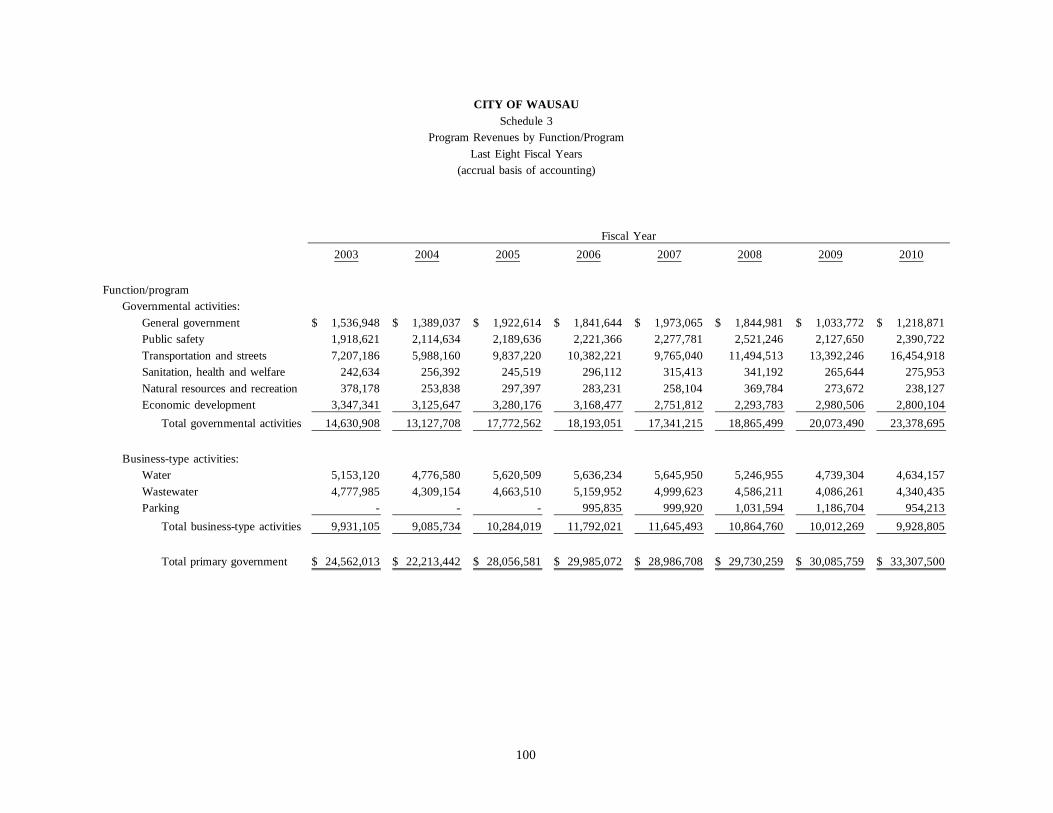
CITY OF WAUSAUSchedule 3
Program Revenues by Function/ProgramLast Eight Fiscal Years
(accrual basis of accounting)
Fiscal Year2003 2004 2005 2006 2007 2008 2009 2010
Function/programGovernmental activities:
General government 1,536,948$ 1,389,037$ 1,922,614$ 1,841,644$ 1,973,065$ 1,844,981$ 1,033,772$ 1,218,871$ Public safety 1,918,621 2,114,634 2,189,636 2,221,366 2,277,781 2,521,246 2,127,650 2,390,722 Transportation and streets 7,207,186 5,988,160 9,837,220 10,382,221 9,765,040 11,494,513 13,392,246 16,454,918 Sanitation, health and welfare 242,634 256,392 245,519 296,112 315,413 341,192 265,644 275,953 Natural resources and recreation 378,178 253,838 297,397 283,231 258,104 369,784 273,672 238,127 Economic development 3,347,341 3,125,647 3,280,176 3,168,477 2,751,812 2,293,783 2,980,506 2,800,104
Total governmental activities 14,630,908 13,127,708 17,772,562 18,193,051 17,341,215 18,865,499 20,073,490 23,378,695
Business-type activities:Water 5,153,120 4,776,580 5,620,509 5,636,234 5,645,950 5,246,955 4,739,304 4,634,157 Wastewater 4,777,985 4,309,154 4,663,510 5,159,952 4,999,623 4,586,211 4,086,261 4,340,435 Parking - - - 995,835 999,920 1,031,594 1,186,704 954,213
Total business-type activities 9,931,105 9,085,734 10,284,019 11,792,021 11,645,493 10,864,760 10,012,269 9,928,805
Total primary government 24,562,013$ 22,213,442$ 28,056,581$ 29,985,072$ 28,986,708$ 29,730,259$ 30,085,759$ 33,307,500$
100
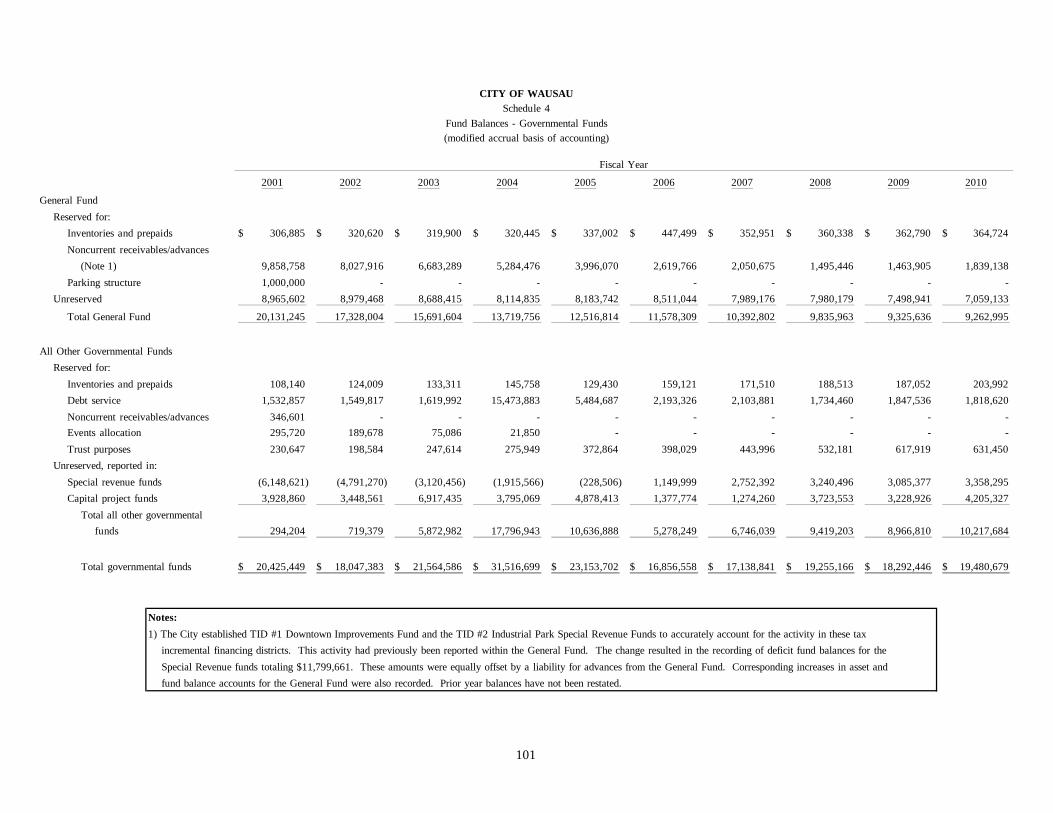
CITY OF WAUSAUSchedule 4
Fund Balances - Governmental Funds(modified accrual basis of accounting)
Fiscal Year
2001 2002 2003 2004 2005 2006 2007 2008 2009 2010
General FundReserved for:
Inventories and prepaids 306,885$ 320,620$ 319,900$ 320,445$ 337,002$ 447,499$ 352,951$ 360,338$ 362,790$ 364,724$ Noncurrent receivables/advances (Note 1) 9,858,758 8,027,916 6,683,289 5,284,476 3,996,070 2,619,766 2,050,675 1,495,446 1,463,905 1,839,138 Parking structure 1,000,000 - - - - - - - - -
Unreserved 8,965,602 8,979,468 8,688,415 8,114,835 8,183,742 8,511,044 7,989,176 7,980,179 7,498,941 7,059,133
Total General Fund 20,131,245 17,328,004 15,691,604 13,719,756 12,516,814 11,578,309 10,392,802 9,835,963 9,325,636 9,262,995
All Other Governmental FundsReserved for:
Inventories and prepaids 108,140 124,009 133,311 145,758 129,430 159,121 171,510 188,513 187,052 203,992 Debt service 1,532,857 1,549,817 1,619,992 15,473,883 5,484,687 2,193,326 2,103,881 1,734,460 1,847,536 1,818,620 Noncurrent receivables/advances 346,601 - - - - - - - - - Events allocation 295,720 189,678 75,086 21,850 - - - - - - Trust purposes 230,647 198,584 247,614 275,949 372,864 398,029 443,996 532,181 617,919 631,450
Unreserved, reported in:Special revenue funds (6,148,621) (4,791,270) (3,120,456) (1,915,566) (228,506) 1,149,999 2,752,392 3,240,496 3,085,377 3,358,295 Capital project funds 3,928,860 3,448,561 6,917,435 3,795,069 4,878,413 1,377,774 1,274,260 3,723,553 3,228,926 4,205,327
Total all other governmental funds 294,204 719,379 5,872,982 17,796,943 10,636,888 5,278,249 6,746,039 9,419,203 8,966,810 10,217,684
Total governmental funds 20,425,449$ 18,047,383$ 21,564,586$ 31,516,699$ 23,153,702$ 16,856,558$ 17,138,841$ 19,255,166$ 18,292,446$ 19,480,679$
Notes:1) The City established TID #1 Downtown Improvements Fund and the TID #2 Industrial Park Special Revenue Funds to accurately account for the activity in these tax incremental financing districts. This activity had previously been reported within the General Fund. The change resulted in the recording of deficit fund balances for the Special Revenue funds totaling $11,799,661. These amounts were equally offset by a liability for advances from the General Fund. Corresponding increases in asset and fund balance accounts for the General Fund were also recorded. Prior year balances have not been restated.
101
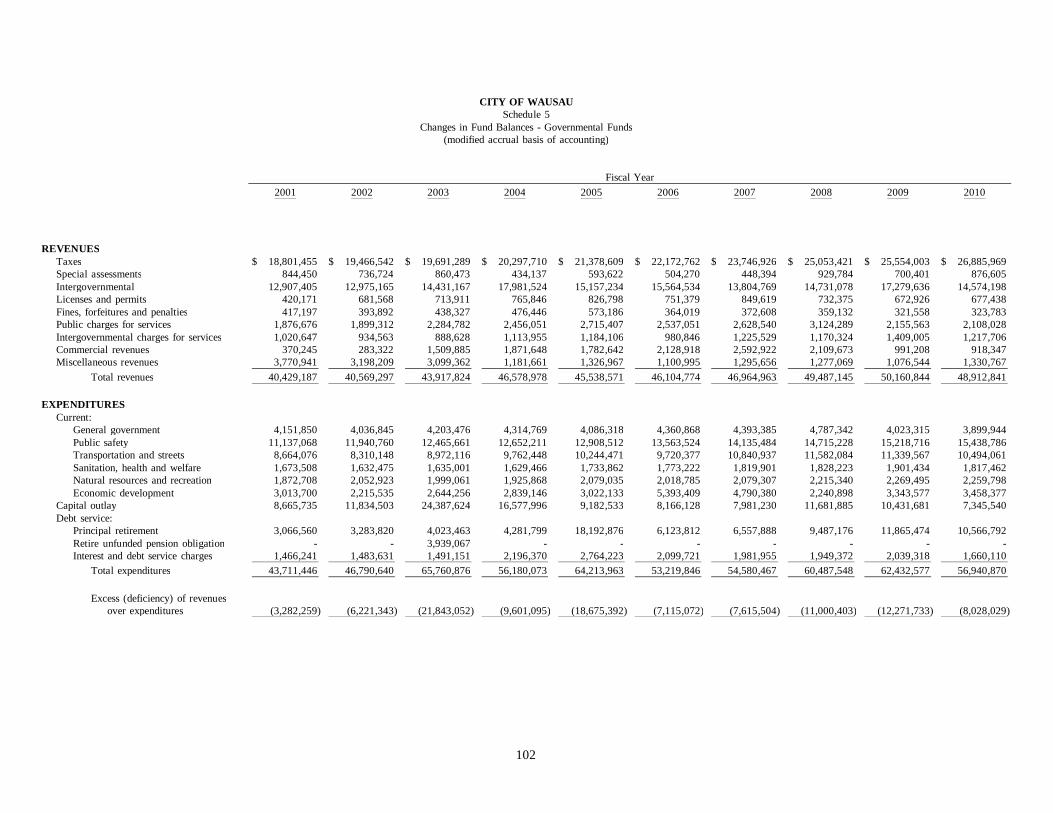
CITY OF WAUSAUSchedule 5
Changes in Fund Balances - Governmental Funds(modified accrual basis of accounting)
Fiscal Year2001 2002 2003 2004 2005 2006 2007 2008 2009 2010
REVENUESTaxes 18,801,455$ 19,466,542$ 19,691,289$ 20,297,710$ 21,378,609$ 22,172,762$ 23,746,926$ 25,053,421$ 25,554,003$ 26,885,969$ Special assessments 844,450 736,724 860,473 434,137 593,622 504,270 448,394 929,784 700,401 876,605 Intergovernmental 12,907,405 12,975,165 14,431,167 17,981,524 15,157,234 15,564,534 13,804,769 14,731,078 17,279,636 14,574,198 Licenses and permits 420,171 681,568 713,911 765,846 826,798 751,379 849,619 732,375 672,926 677,438 Fines, forfeitures and penalties 417,197 393,892 438,327 476,446 573,186 364,019 372,608 359,132 321,558 323,783 Public charges for services 1,876,676 1,899,312 2,284,782 2,456,051 2,715,407 2,537,051 2,628,540 3,124,289 2,155,563 2,108,028 Intergovernmental charges for services 1,020,647 934,563 888,628 1,113,955 1,184,106 980,846 1,225,529 1,170,324 1,409,005 1,217,706 Commercial revenues 370,245 283,322 1,509,885 1,871,648 1,782,642 2,128,918 2,592,922 2,109,673 991,208 918,347 Miscellaneous revenues 3,770,941 3,198,209 3,099,362 1,181,661 1,326,967 1,100,995 1,295,656 1,277,069 1,076,544 1,330,767
Total revenues 40,429,187 40,569,297 43,917,824 46,578,978 45,538,571 46,104,774 46,964,963 49,487,145 50,160,844 48,912,841
EXPENDITURESCurrent:
General government 4,151,850 4,036,845 4,203,476 4,314,769 4,086,318 4,360,868 4,393,385 4,787,342 4,023,315 3,899,944 Public safety 11,137,068 11,940,760 12,465,661 12,652,211 12,908,512 13,563,524 14,135,484 14,715,228 15,218,716 15,438,786 Transportation and streets 8,664,076 8,310,148 8,972,116 9,762,448 10,244,471 9,720,377 10,840,937 11,582,084 11,339,567 10,494,061 Sanitation, health and welfare 1,673,508 1,632,475 1,635,001 1,629,466 1,733,862 1,773,222 1,819,901 1,828,223 1,901,434 1,817,462 Natural resources and recreation 1,872,708 2,052,923 1,999,061 1,925,868 2,079,035 2,018,785 2,079,307 2,215,340 2,269,495 2,259,798 Economic development 3,013,700 2,215,535 2,644,256 2,839,146 3,022,133 5,393,409 4,790,380 2,240,898 3,343,577 3,458,377
Capital outlay 8,665,735 11,834,503 24,387,624 16,577,996 9,182,533 8,166,128 7,981,230 11,681,885 10,431,681 7,345,540 Debt service:
Principal retirement 3,066,560 3,283,820 4,023,463 4,281,799 18,192,876 6,123,812 6,557,888 9,487,176 11,865,474 10,566,792 Retire unfunded pension obligation - - 3,939,067 - - - - - - - Interest and debt service charges 1,466,241 1,483,631 1,491,151 2,196,370 2,764,223 2,099,721 1,981,955 1,949,372 2,039,318 1,660,110
Total expenditures 43,711,446 46,790,640 65,760,876 56,180,073 64,213,963 53,219,846 54,580,467 60,487,548 62,432,577 56,940,870
Excess (deficiency) of revenues over expenditures (3,282,259) (6,221,343) (21,843,052) (9,601,095) (18,675,392) (7,115,072) (7,615,504) (11,000,403) (12,271,733) (8,028,029)
102
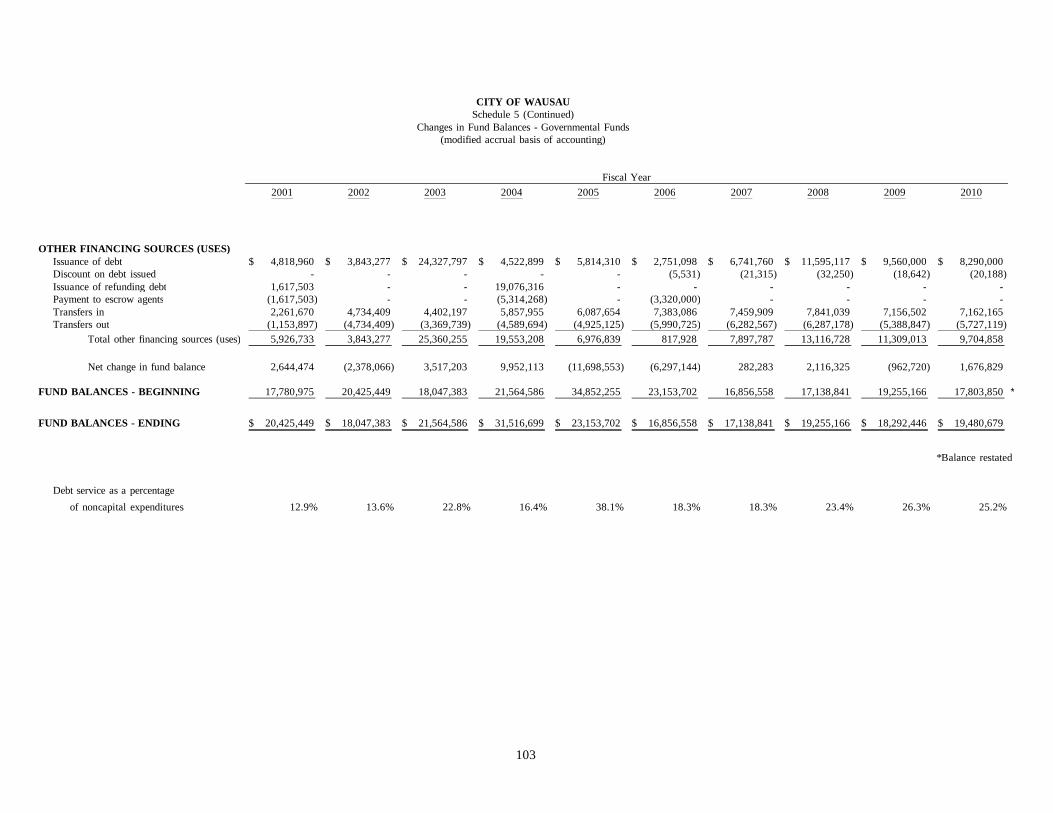
CITY OF WAUSAUSchedule 5 (Continued)
Changes in Fund Balances - Governmental Funds(modified accrual basis of accounting)
Fiscal Year2001 2002 2003 2004 2005 2006 2007 2008 2009 2010
OTHER FINANCING SOURCES (USES)Issuance of debt 4,818,960$ 3,843,277$ 24,327,797$ 4,522,899$ 5,814,310$ 2,751,098$ 6,741,760$ 11,595,117$ 9,560,000$ 8,290,000$ Discount on debt issued - - - - - (5,531) (21,315) (32,250) (18,642) (20,188) Issuance of refunding debt 1,617,503 - - 19,076,316 - - - - - - Payment to escrow agents (1,617,503) - - (5,314,268) - (3,320,000) - - - - Transfers in 2,261,670 4,734,409 4,402,197 5,857,955 6,087,654 7,383,086 7,459,909 7,841,039 7,156,502 7,162,165 Transfers out (1,153,897) (4,734,409) (3,369,739) (4,589,694) (4,925,125) (5,990,725) (6,282,567) (6,287,178) (5,388,847) (5,727,119)
Total other financing sources (uses) 5,926,733 3,843,277 25,360,255 19,553,208 6,976,839 817,928 7,897,787 13,116,728 11,309,013 9,704,858
Net change in fund balance 2,644,474 (2,378,066) 3,517,203 9,952,113 (11,698,553) (6,297,144) 282,283 2,116,325 (962,720) 1,676,829
FUND BALANCES - BEGINNING 17,780,975 20,425,449 18,047,383 21,564,586 34,852,255 23,153,702 16,856,558 17,138,841 19,255,166 17,803,850 *
FUND BALANCES - ENDING 20,425,449$ 18,047,383$ 21,564,586$ 31,516,699$ 23,153,702$ 16,856,558$ 17,138,841$ 19,255,166$ 18,292,446$ 19,480,679$
*Balance restated
Debt service as a percentageof noncapital expenditures 12.9% 13.6% 22.8% 16.4% 38.1% 18.3% 18.3% 23.4% 26.3% 25.2%
103
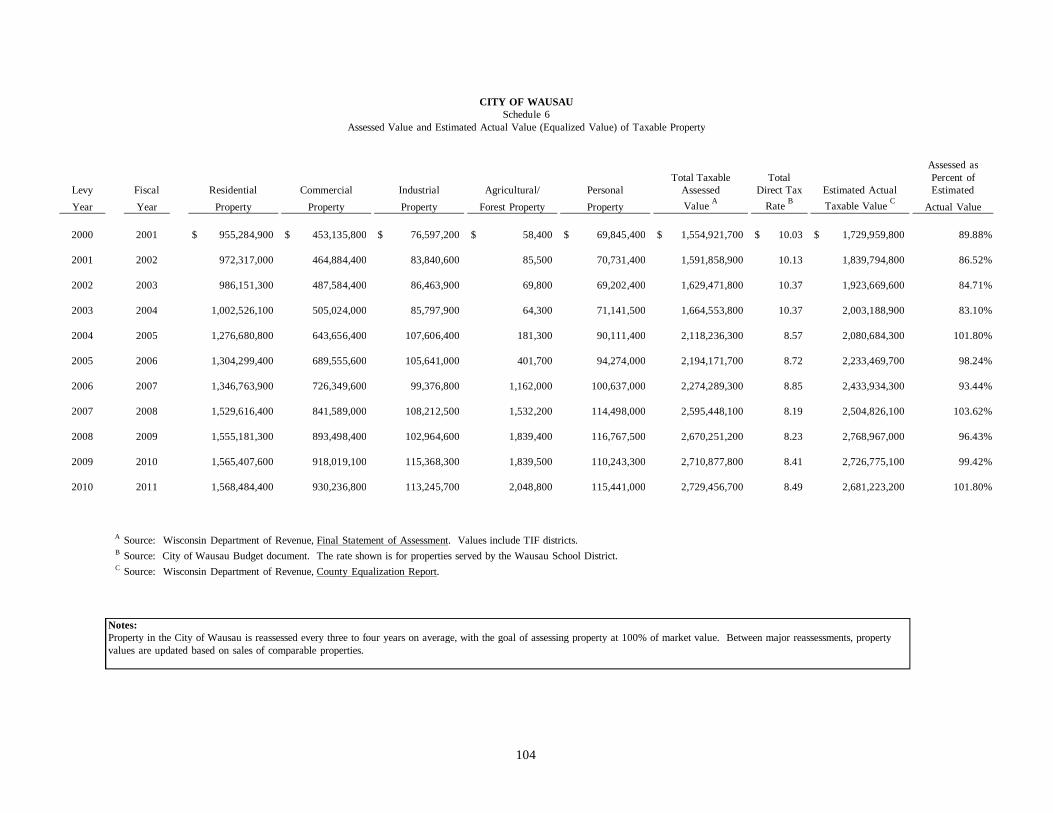
CITY OF WAUSAUSchedule 6
Assessed Value and Estimated Actual Value (Equalized Value) of Taxable Property
Assessed asTotal Taxable Total Percent of
Levy Fiscal Residential Commercial Industrial Agricultural/ Personal Assessed Direct Tax Estimated Actual EstimatedYear Year Property Property Property Forest Property Property Value A Rate B Taxable Value C Actual Value
2000 2001 955,284,900$ 453,135,800$ 76,597,200$ 58,400$ 69,845,400$ 1,554,921,700$ 10.03$ 1,729,959,800$ 89.88%
2001 2002 972,317,000 464,884,400 83,840,600 85,500 70,731,400 1,591,858,900 10.13 1,839,794,800 86.52%
2002 2003 986,151,300 487,584,400 86,463,900 69,800 69,202,400 1,629,471,800 10.37 1,923,669,600 84.71%
2003 2004 1,002,526,100 505,024,000 85,797,900 64,300 71,141,500 1,664,553,800 10.37 2,003,188,900 83.10%
2004 2005 1,276,680,800 643,656,400 107,606,400 181,300 90,111,400 2,118,236,300 8.57 2,080,684,300 101.80%
2005 2006 1,304,299,400 689,555,600 105,641,000 401,700 94,274,000 2,194,171,700 8.72 2,233,469,700 98.24%
2006 2007 1,346,763,900 726,349,600 99,376,800 1,162,000 100,637,000 2,274,289,300 8.85 2,433,934,300 93.44%
2007 2008 1,529,616,400 841,589,000 108,212,500 1,532,200 114,498,000 2,595,448,100 8.19 2,504,826,100 103.62%
2008 2009 1,555,181,300 893,498,400 102,964,600 1,839,400 116,767,500 2,670,251,200 8.23 2,768,967,000 96.43%
2009 2010 1,565,407,600 918,019,100 115,368,300 1,839,500 110,243,300 2,710,877,800 8.41 2,726,775,100 99.42%
2010 2011 1,568,484,400 930,236,800 113,245,700 2,048,800 115,441,000 2,729,456,700 8.49 2,681,223,200 101.80%
A Source: Wisconsin Department of Revenue, Final Statement of Assessment. Values include TIF districts.B Source: City of Wausau Budget document. The rate shown is for properties served by the Wausau School District.C Source: Wisconsin Department of Revenue, County Equalization Report.
Notes: Property in the City of Wausau is reassessed every three to four years on average, with the goal of assessing property at 100% of market value. Between major reassessments, propertyvalues are updated based on sales of comparable properties.
104
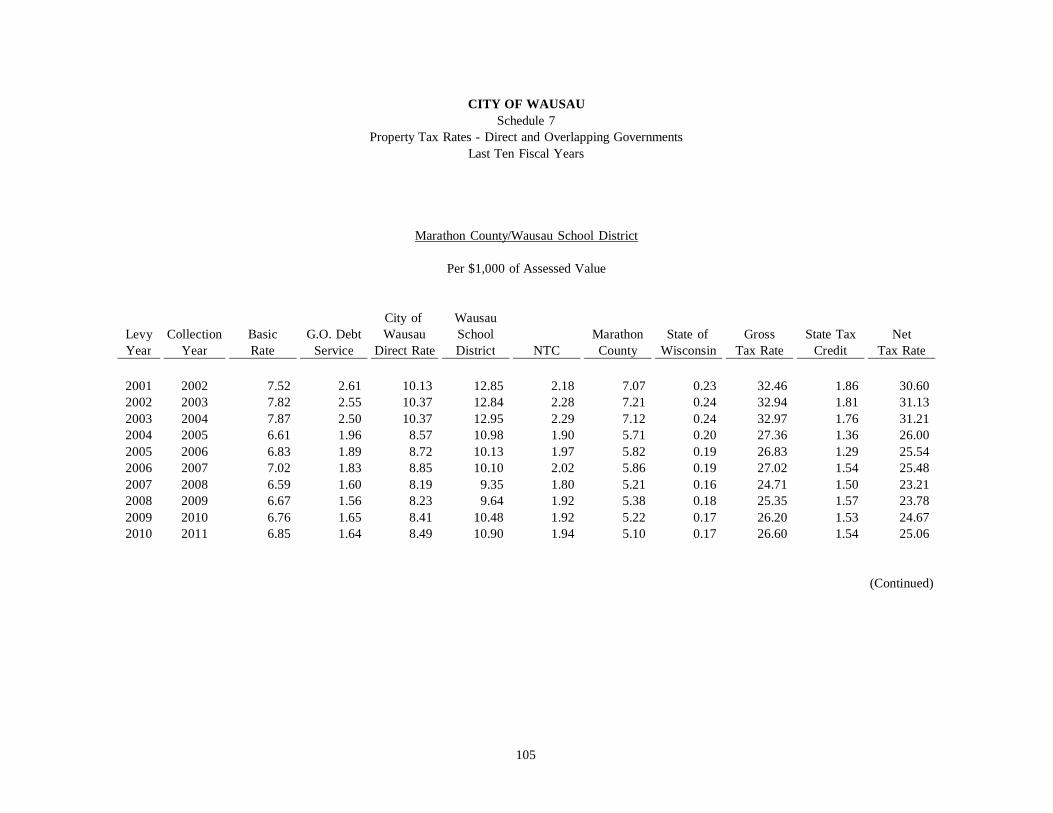
CITY OF WAUSAUSchedule 7
Property Tax Rates - Direct and Overlapping GovernmentsLast Ten Fiscal Years
Marathon County/Wausau School District
Per $1,000 of Assessed Value
City of WausauLevy Collection Basic G.O. Debt Wausau School Marathon State of Gross State Tax NetYear Year Rate Service Direct Rate District NTC County Wisconsin Tax Rate Credit Tax Rate
2001 2002 7.52 2.61 10.13 12.85 2.18 7.07 0.23 32.46 1.86 30.60 2002 2003 7.82 2.55 10.37 12.84 2.28 7.21 0.24 32.94 1.81 31.13 2003 2004 7.87 2.50 10.37 12.95 2.29 7.12 0.24 32.97 1.76 31.21 2004 2005 6.61 1.96 8.57 10.98 1.90 5.71 0.20 27.36 1.36 26.00 2005 2006 6.83 1.89 8.72 10.13 1.97 5.82 0.19 26.83 1.29 25.54 2006 2007 7.02 1.83 8.85 10.10 2.02 5.86 0.19 27.02 1.54 25.48 2007 2008 6.59 1.60 8.19 9.35 1.80 5.21 0.16 24.71 1.50 23.21 2008 2009 6.67 1.56 8.23 9.64 1.92 5.38 0.18 25.35 1.57 23.78 2009 2010 6.76 1.65 8.41 10.48 1.92 5.22 0.17 26.20 1.53 24.67 2010 2011 6.85 1.64 8.49 10.90 1.94 5.10 0.17 26.60 1.54 25.06
(Continued)
105
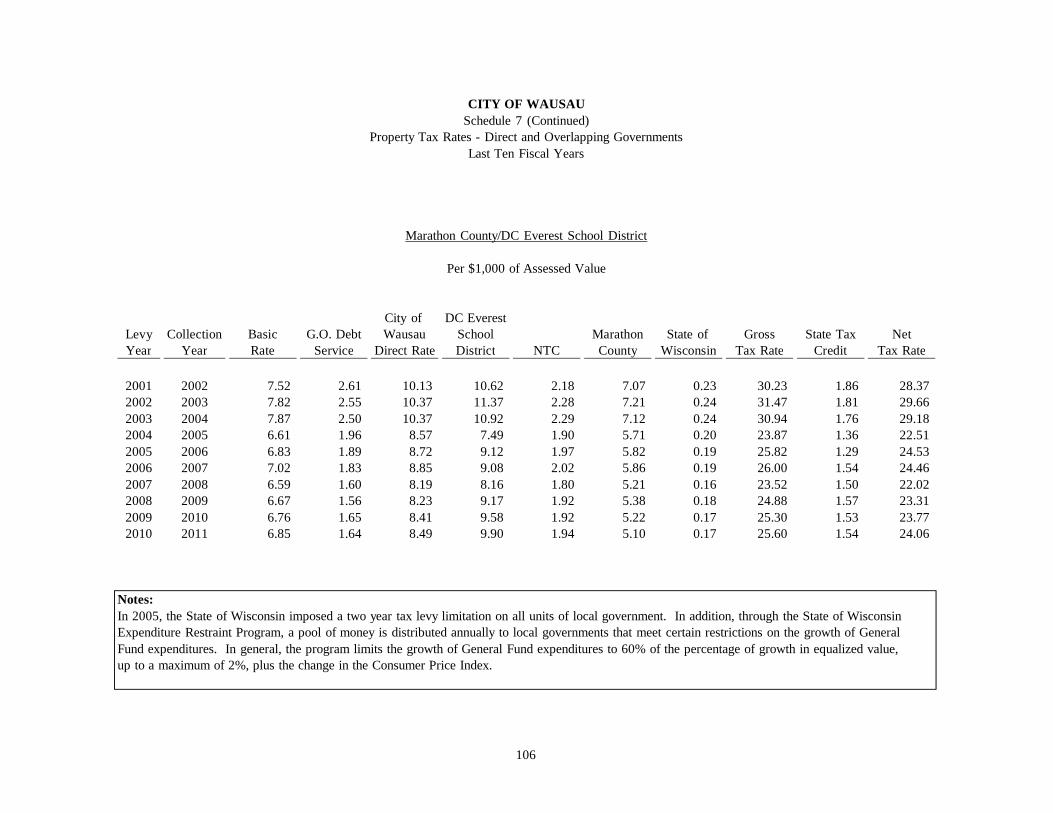
CITY OF WAUSAUSchedule 7 (Continued)
Property Tax Rates - Direct and Overlapping GovernmentsLast Ten Fiscal Years
Marathon County/DC Everest School District
Per $1,000 of Assessed Value
City of DC EverestLevy Collection Basic G.O. Debt Wausau School Marathon State of Gross State Tax NetYear Year Rate Service Direct Rate District NTC County Wisconsin Tax Rate Credit Tax Rate
2001 2002 7.52 2.61 10.13 10.62 2.18 7.07 0.23 30.23 1.86 28.37 2002 2003 7.82 2.55 10.37 11.37 2.28 7.21 0.24 31.47 1.81 29.66 2003 2004 7.87 2.50 10.37 10.92 2.29 7.12 0.24 30.94 1.76 29.18 2004 2005 6.61 1.96 8.57 7.49 1.90 5.71 0.20 23.87 1.36 22.51 2005 2006 6.83 1.89 8.72 9.12 1.97 5.82 0.19 25.82 1.29 24.53 2006 2007 7.02 1.83 8.85 9.08 2.02 5.86 0.19 26.00 1.54 24.46 2007 2008 6.59 1.60 8.19 8.16 1.80 5.21 0.16 23.52 1.50 22.02 2008 2009 6.67 1.56 8.23 9.17 1.92 5.38 0.18 24.88 1.57 23.31 2009 2010 6.76 1.65 8.41 9.58 1.92 5.22 0.17 25.30 1.53 23.77 2010 2011 6.85 1.64 8.49 9.90 1.94 5.10 0.17 25.60 1.54 24.06
Notes:In 2005, the State of Wisconsin imposed a two year tax levy limitation on all units of local government. In addition, through the State of WisconsinExpenditure Restraint Program, a pool of money is distributed annually to local governments that meet certain restrictions on the growth of GeneralFund expenditures. In general, the program limits the growth of General Fund expenditures to 60% of the percentage of growth in equalized value,up to a maximum of 2%, plus the change in the Consumer Price Index.
106
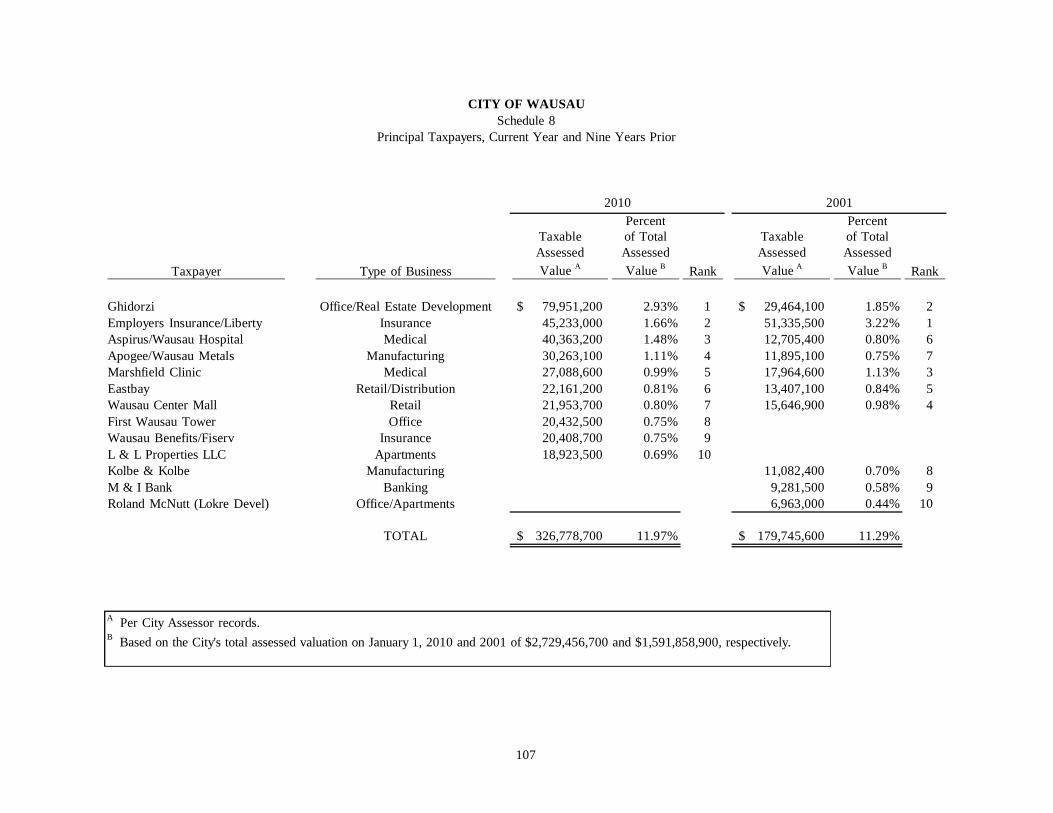
CITY OF WAUSAUSchedule 8
Principal Taxpayers, Current Year and Nine Years Prior
2010 2001Percent Percent
Taxable of Total Taxable of TotalAssessed Assessed Assessed Assessed
Taxpayer Type of Business Value A Value B Rank Value A Value B Rank
Ghidorzi Office/Real Estate Development 79,951,200$ 2.93% 1 29,464,100$ 1.85% 2Employers Insurance/Liberty Insurance 45,233,000 1.66% 2 51,335,500 3.22% 1Aspirus/Wausau Hospital Medical 40,363,200 1.48% 3 12,705,400 0.80% 6Apogee/Wausau Metals Manufacturing 30,263,100 1.11% 4 11,895,100 0.75% 7Marshfield Clinic Medical 27,088,600 0.99% 5 17,964,600 1.13% 3Eastbay Retail/Distribution 22,161,200 0.81% 6 13,407,100 0.84% 5Wausau Center Mall Retail 21,953,700 0.80% 7 15,646,900 0.98% 4First Wausau Tower Office 20,432,500 0.75% 8Wausau Benefits/Fiserv Insurance 20,408,700 0.75% 9L & L Properties LLC Apartments 18,923,500 0.69% 10Kolbe & Kolbe Manufacturing 11,082,400 0.70% 8M & I Bank Banking 9,281,500 0.58% 9Roland McNutt (Lokre Devel) Office/Apartments 6,963,000 0.44% 10
TOTAL 326,778,700$ 11.97% 179,745,600$ 11.29%
A Per City Assessor records.B Based on the City's total assessed valuation on January 1, 2010 and 2001 of $2,729,456,700 and $1,591,858,900, respectively.
107
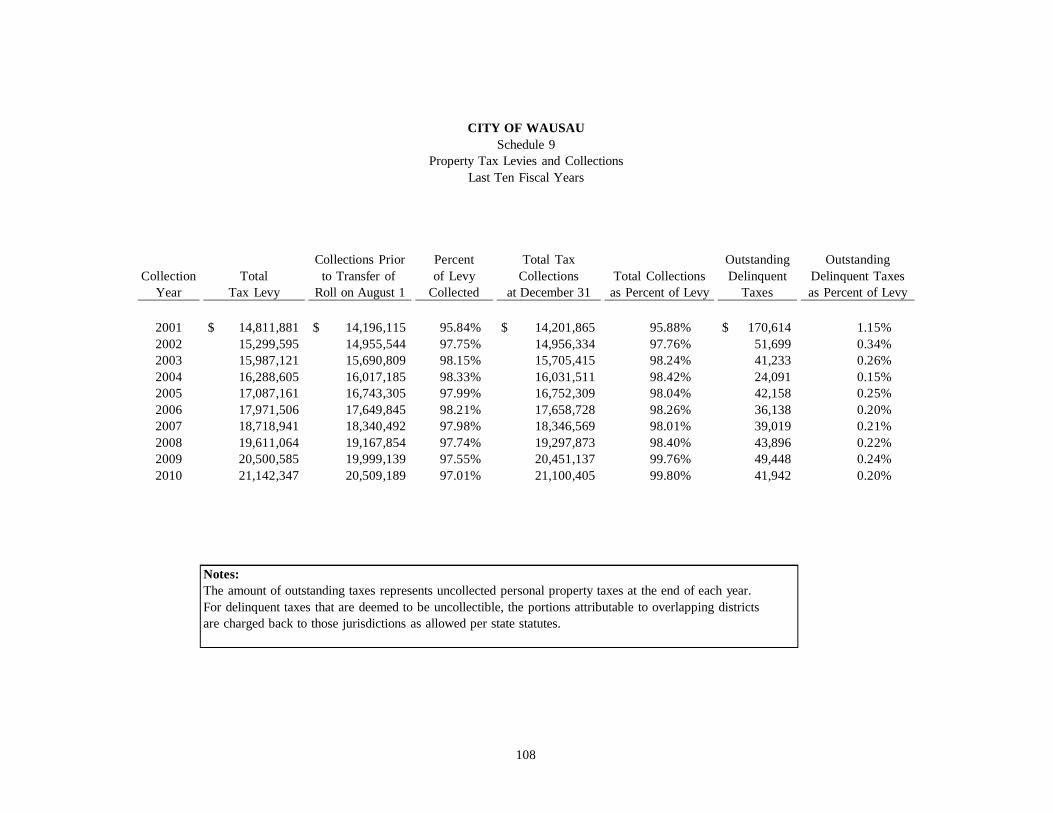
CITY OF WAUSAUSchedule 9
Property Tax Levies and CollectionsLast Ten Fiscal Years
Collections Prior Percent Total Tax Outstanding OutstandingCollection Total to Transfer of of Levy Collections Total Collections Delinquent Delinquent Taxes
Year Tax Levy Roll on August 1 Collected at December 31 as Percent of Levy Taxes as Percent of Levy
2001 14,811,881$ 14,196,115$ 95.84% 14,201,865$ 95.88% 170,614$ 1.15%2002 15,299,595 14,955,544 97.75% 14,956,334 97.76% 51,699 0.34%2003 15,987,121 15,690,809 98.15% 15,705,415 98.24% 41,233 0.26%2004 16,288,605 16,017,185 98.33% 16,031,511 98.42% 24,091 0.15%2005 17,087,161 16,743,305 97.99% 16,752,309 98.04% 42,158 0.25%2006 17,971,506 17,649,845 98.21% 17,658,728 98.26% 36,138 0.20%2007 18,718,941 18,340,492 97.98% 18,346,569 98.01% 39,019 0.21%2008 19,611,064 19,167,854 97.74% 19,297,873 98.40% 43,896 0.22%2009 20,500,585 19,999,139 97.55% 20,451,137 99.76% 49,448 0.24%2010 21,142,347 20,509,189 97.01% 21,100,405 99.80% 41,942 0.20%
Notes:The amount of outstanding taxes represents uncollected personal property taxes at the end of each year.For delinquent taxes that are deemed to be uncollectible, the portions attributable to overlapping districts are charged back to those jurisdictions as allowed per state statutes.
108
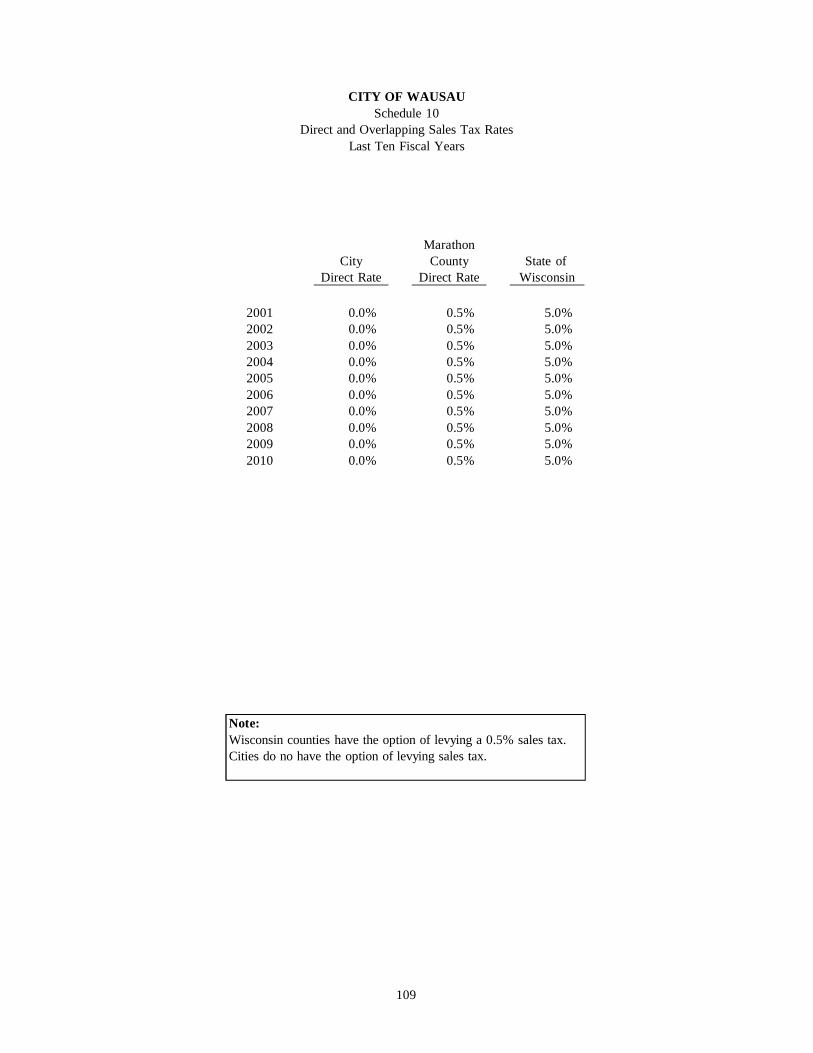
CITY OF WAUSAUSchedule 10
Direct and Overlapping Sales Tax RatesLast Ten Fiscal Years
MarathonCity County State of
Direct Rate Direct Rate Wisconsin
2001 0.0% 0.5% 5.0%2002 0.0% 0.5% 5.0%2003 0.0% 0.5% 5.0%2004 0.0% 0.5% 5.0%2005 0.0% 0.5% 5.0%2006 0.0% 0.5% 5.0%2007 0.0% 0.5% 5.0%2008 0.0% 0.5% 5.0%2009 0.0% 0.5% 5.0%2010 0.0% 0.5% 5.0%
Note:Wisconsin counties have the option of levying a 0.5% sales tax.Cities do no have the option of levying sales tax.
109
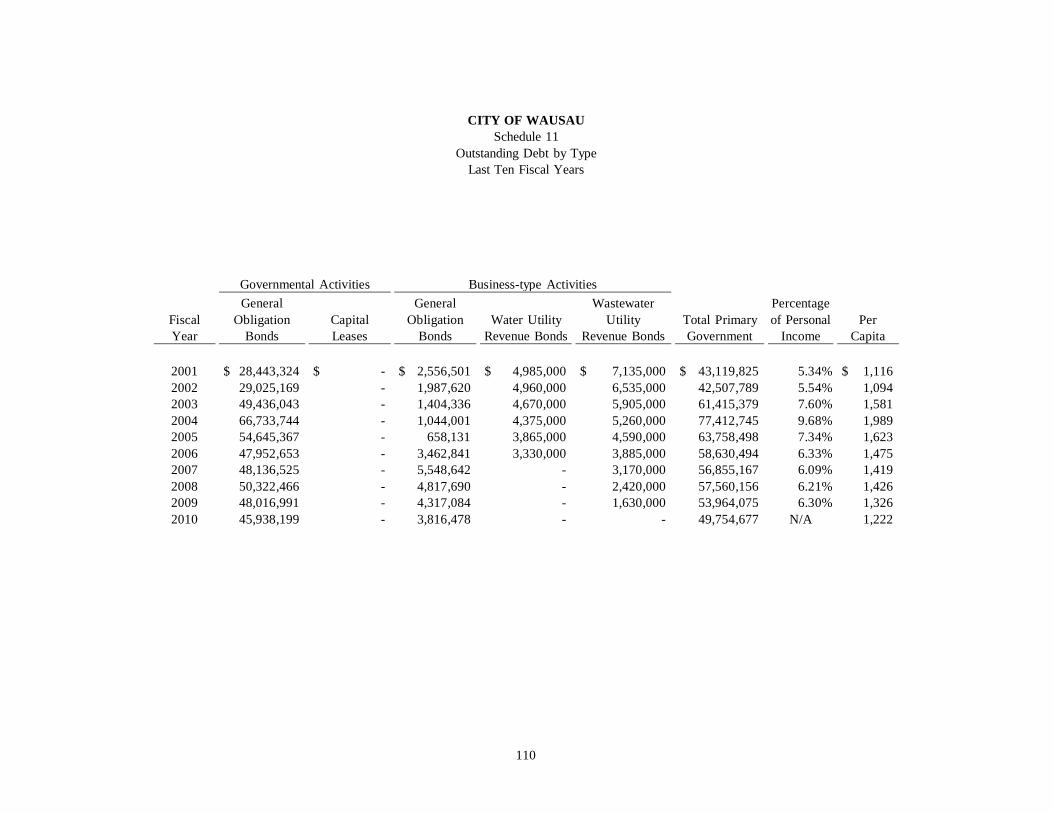
CITY OF WAUSAUSchedule 11
Outstanding Debt by TypeLast Ten Fiscal Years
Governmental Activities Business-type ActivitiesGeneral General Wastewater Percentage
Fiscal Obligation Capital Obligation Water Utility Utility Total Primary of Personal PerYear Bonds Leases Bonds Revenue Bonds Revenue Bonds Government Income Capita
2001 28,443,324$ -$ 2,556,501$ 4,985,000$ 7,135,000$ 43,119,825$ 5.34% 1,116$ 2002 29,025,169 - 1,987,620 4,960,000 6,535,000 42,507,789 5.54% 1,094 2003 49,436,043 - 1,404,336 4,670,000 5,905,000 61,415,379 7.60% 1,581 2004 66,733,744 - 1,044,001 4,375,000 5,260,000 77,412,745 9.68% 1,989 2005 54,645,367 - 658,131 3,865,000 4,590,000 63,758,498 7.34% 1,623 2006 47,952,653 - 3,462,841 3,330,000 3,885,000 58,630,494 6.33% 1,475 2007 48,136,525 - 5,548,642 - 3,170,000 56,855,167 6.09% 1,419 2008 50,322,466 - 4,817,690 - 2,420,000 57,560,156 6.21% 1,426 2009 48,016,991 - 4,317,084 - 1,630,000 53,964,075 6.30% 1,326 2010 45,938,199 - 3,816,478 - - 49,754,677 N/A 1,222
110
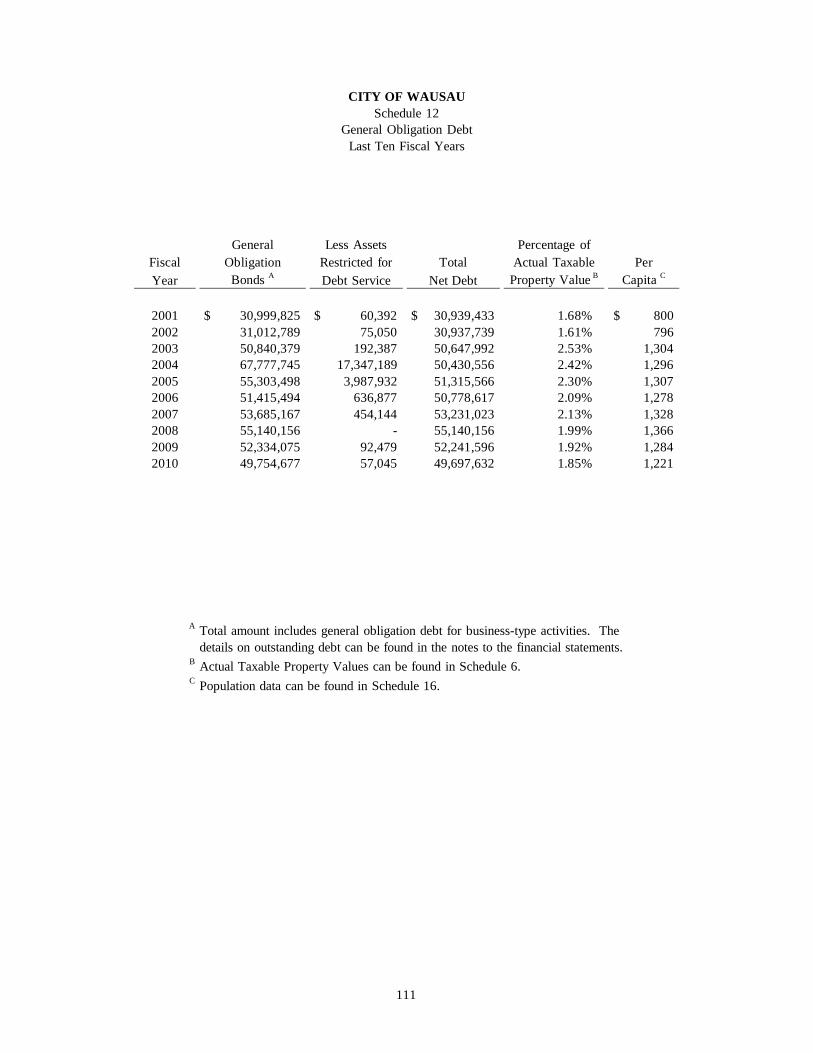
CITY OF WAUSAUSchedule 12
General Obligation DebtLast Ten Fiscal Years
General Less Assets Percentage ofFiscal Obligation Restricted for Total Actual Taxable PerYear Bonds A Debt Service Net Debt Property Value B Capita C
2001 30,999,825$ 60,392$ 30,939,433$ 1.68% 800$ 2002 31,012,789 75,050 30,937,739 1.61% 796 2003 50,840,379 192,387 50,647,992 2.53% 1,304 2004 67,777,745 17,347,189 50,430,556 2.42% 1,296 2005 55,303,498 3,987,932 51,315,566 2.30% 1,307 2006 51,415,494 636,877 50,778,617 2.09% 1,278 2007 53,685,167 454,144 53,231,023 2.13% 1,328 2008 55,140,156 - 55,140,156 1.99% 1,366 2009 52,334,075 92,479 52,241,596 1.92% 1,284 2010 49,754,677 57,045 49,697,632 1.85% 1,221
A Total amount includes general obligation debt for business-type activities. Thedetails on outstanding debt can be found in the notes to the financial statements.
B Actual Taxable Property Values can be found in Schedule 6.C Population data can be found in Schedule 16.
111
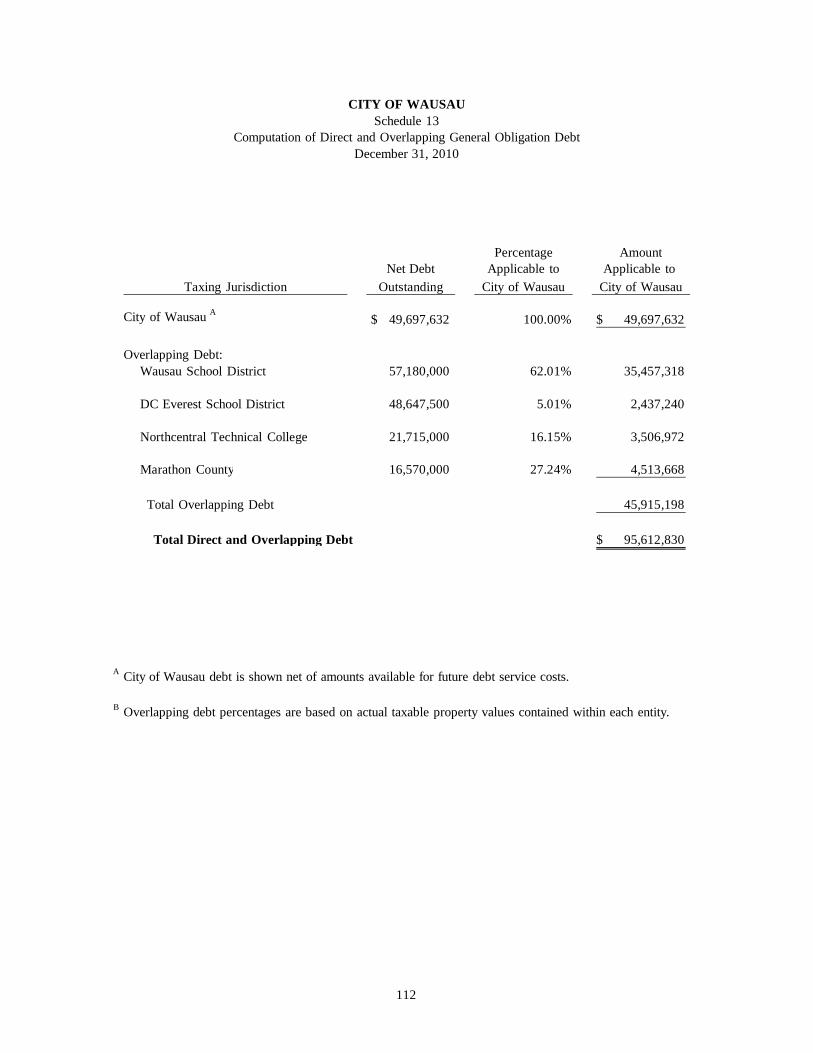
CITY OF WAUSAUSchedule 13
Computation of Direct and Overlapping General Obligation DebtDecember 31, 2010
Percentage AmountNet Debt Applicable to Applicable to
Taxing Jurisdiction Outstanding City of Wausau City of Wausau
City of Wausau A 49,697,632$ 100.00% 49,697,632$
Overlapping Debt: Wausau School District 57,180,000 62.01% 35,457,318
DC Everest School District 48,647,500 5.01% 2,437,240
Northcentral Technical College 21,715,000 16.15% 3,506,972
Marathon County 16,570,000 27.24% 4,513,668
Total Overlapping Debt 45,915,198
Total Direct and Overlapping Debt 95,612,830$
A City of Wausau debt is shown net of amounts available for future debt service costs.
B Overlapping debt percentages are based on actual taxable property values contained within each entity.
112
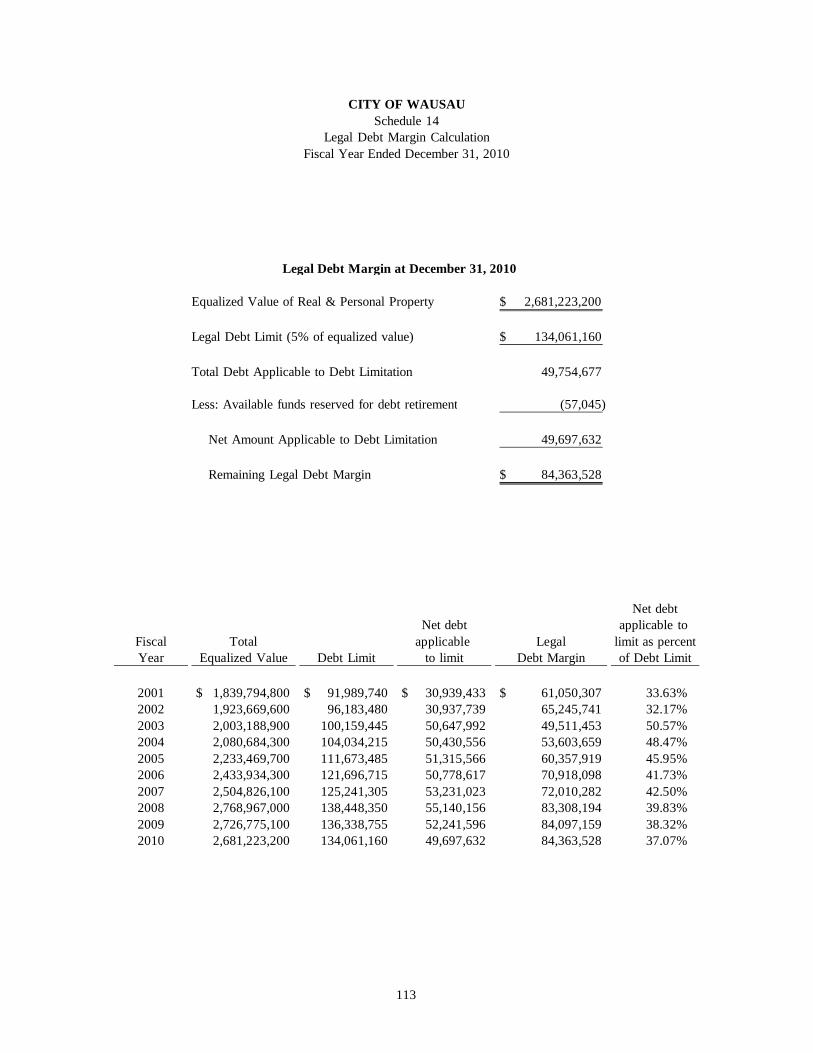
CITY OF WAUSAUSchedule 14
Legal Debt Margin CalculationFiscal Year Ended December 31, 2010
Legal Debt Margin at December 31, 2010
Equalized Value of Real & Personal Property 2,681,223,200$
Legal Debt Limit (5% of equalized value) 134,061,160$
Total Debt Applicable to Debt Limitation 49,754,677
Less: Available funds reserved for debt retirement (57,045)
Net Amount Applicable to Debt Limitation 49,697,632
Remaining Legal Debt Margin 84,363,528$
Net debtNet debt applicable to
Fiscal Total applicable Legal limit as percentYear Equalized Value Debt Limit to limit Debt Margin of Debt Limit
2001 1,839,794,800$ 91,989,740$ 30,939,433$ 61,050,307$ 33.63%2002 1,923,669,600 96,183,480 30,937,739 65,245,741 32.17%2003 2,003,188,900 100,159,445 50,647,992 49,511,453 50.57%2004 2,080,684,300 104,034,215 50,430,556 53,603,659 48.47%2005 2,233,469,700 111,673,485 51,315,566 60,357,919 45.95%2006 2,433,934,300 121,696,715 50,778,617 70,918,098 41.73%2007 2,504,826,100 125,241,305 53,231,023 72,010,282 42.50%2008 2,768,967,000 138,448,350 55,140,156 83,308,194 39.83%2009 2,726,775,100 136,338,755 52,241,596 84,097,159 38.32%2010 2,681,223,200 134,061,160 49,697,632 84,363,528 37.07%
113
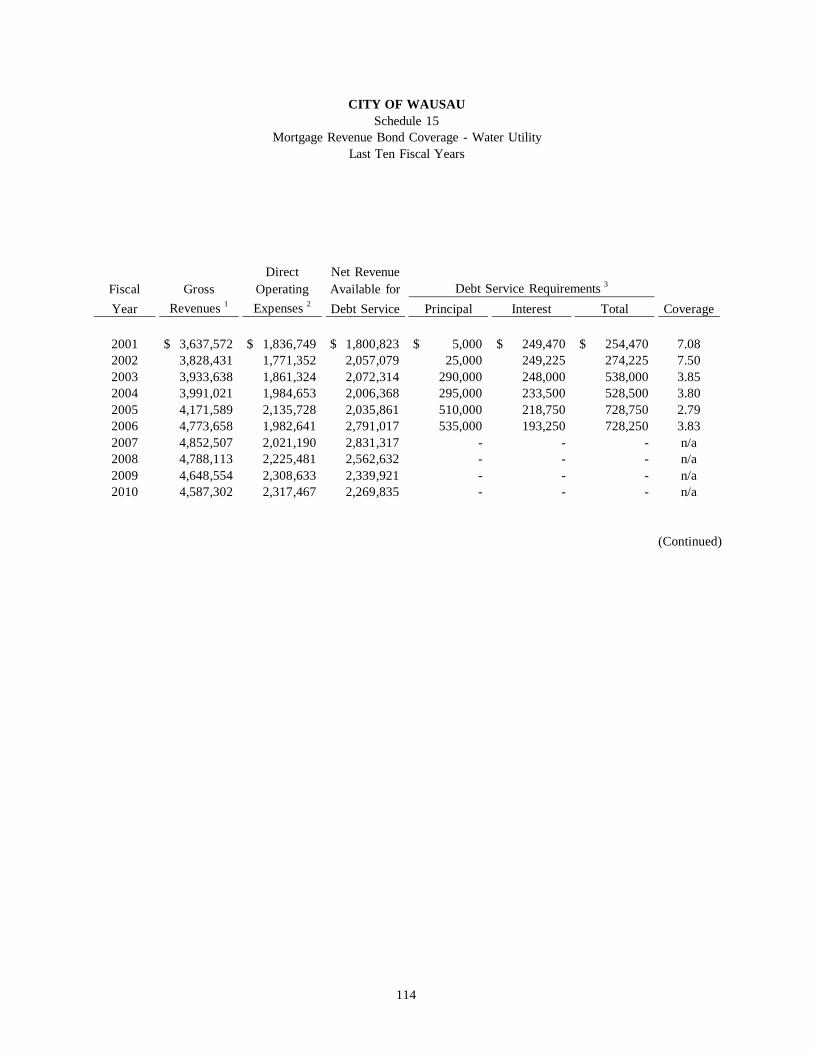
CITY OF WAUSAUSchedule 15
Mortgage Revenue Bond Coverage - Water UtilityLast Ten Fiscal Years
Direct Net RevenueFiscal Gross Operating Available for Debt Service Requirements 3
Year Revenues 1 Expenses 2 Debt Service Principal Interest Total Coverage
2001 3,637,572$ 1,836,749$ 1,800,823$ 5,000$ 249,470$ 254,470$ 7.082002 3,828,431 1,771,352 2,057,079 25,000 249,225 274,225 7.502003 3,933,638 1,861,324 2,072,314 290,000 248,000 538,000 3.852004 3,991,021 1,984,653 2,006,368 295,000 233,500 528,500 3.802005 4,171,589 2,135,728 2,035,861 510,000 218,750 728,750 2.792006 4,773,658 1,982,641 2,791,017 535,000 193,250 728,250 3.832007 4,852,507 2,021,190 2,831,317 - - - n/a2008 4,788,113 2,225,481 2,562,632 - - - n/a2009 4,648,554 2,308,633 2,339,921 - - - n/a2010 4,587,302 2,317,467 2,269,835 - - - n/a
(Continued)
114
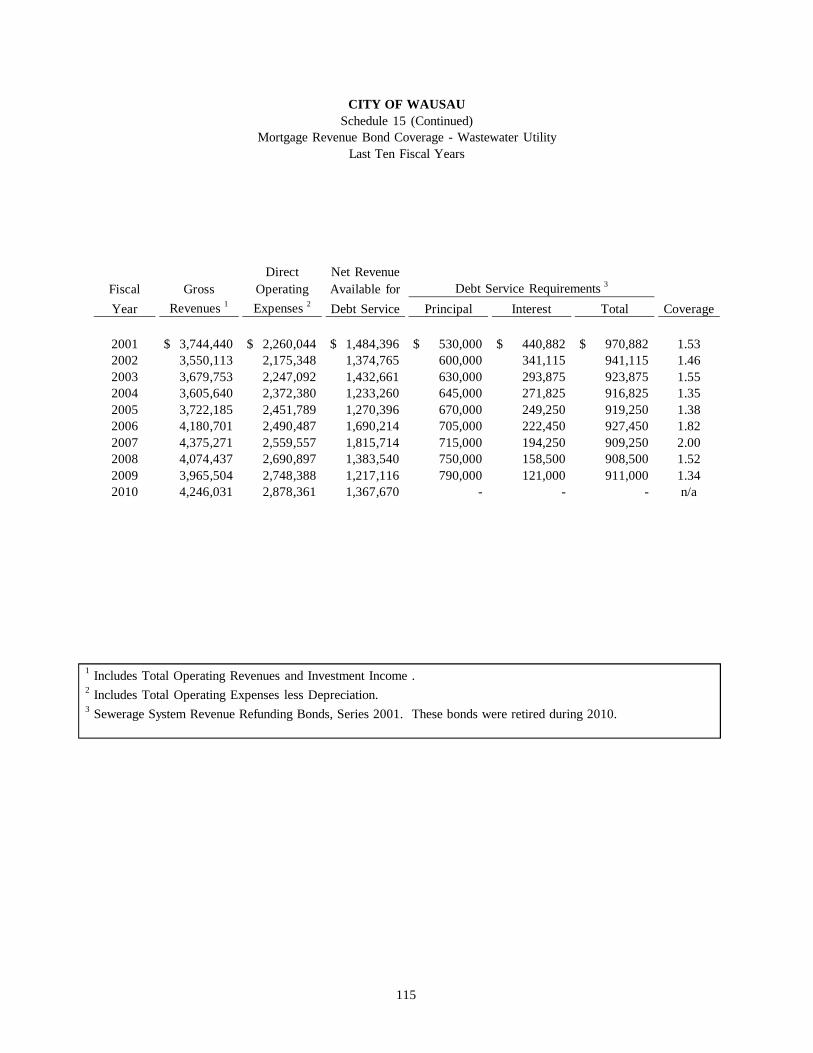
CITY OF WAUSAUSchedule 15 (Continued)
Mortgage Revenue Bond Coverage - Wastewater UtilityLast Ten Fiscal Years
Direct Net RevenueFiscal Gross Operating Available for Debt Service Requirements 3
Year Revenues 1 Expenses 2 Debt Service Principal Interest Total Coverage
2001 3,744,440$ 2,260,044$ 1,484,396$ 530,000$ 440,882$ 970,882$ 1.532002 3,550,113 2,175,348 1,374,765 600,000 341,115 941,115 1.462003 3,679,753 2,247,092 1,432,661 630,000 293,875 923,875 1.552004 3,605,640 2,372,380 1,233,260 645,000 271,825 916,825 1.352005 3,722,185 2,451,789 1,270,396 670,000 249,250 919,250 1.382006 4,180,701 2,490,487 1,690,214 705,000 222,450 927,450 1.822007 4,375,271 2,559,557 1,815,714 715,000 194,250 909,250 2.002008 4,074,437 2,690,897 1,383,540 750,000 158,500 908,500 1.522009 3,965,504 2,748,388 1,217,116 790,000 121,000 911,000 1.342010 4,246,031 2,878,361 1,367,670 - - - n/a
1 Includes Total Operating Revenues and Investment Income .2 Includes Total Operating Expenses less Depreciation.3 Sewerage System Revenue Refunding Bonds, Series 2001. These bonds were retired during 2010.
115
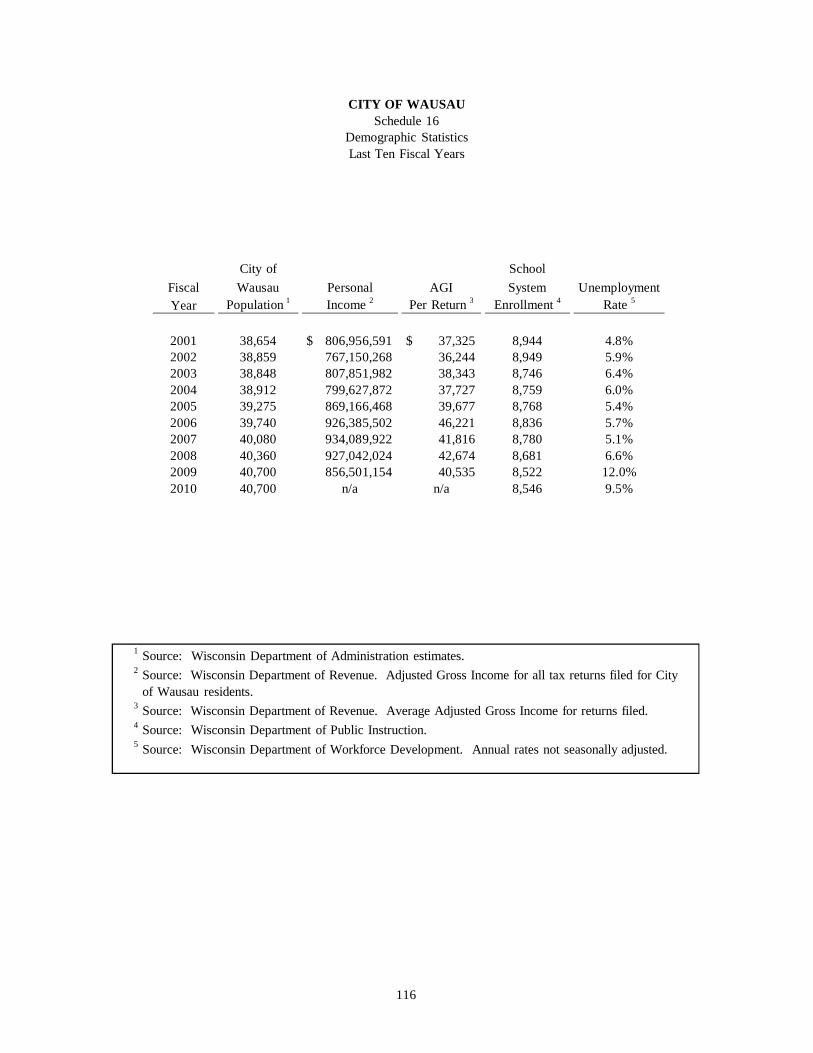
CITY OF WAUSAUSchedule 16
Demographic StatisticsLast Ten Fiscal Years
City of SchoolFiscal Wausau Personal AGI System UnemploymentYear Population 1 Income 2 Per Return 3 Enrollment 4 Rate 5
2001 38,654 806,956,591$ 37,325$ 8,944 4.8%2002 38,859 767,150,268 36,244 8,949 5.9%2003 38,848 807,851,982 38,343 8,746 6.4%2004 38,912 799,627,872 37,727 8,759 6.0%2005 39,275 869,166,468 39,677 8,768 5.4%2006 39,740 926,385,502 46,221 8,836 5.7%2007 40,080 934,089,922 41,816 8,780 5.1%2008 40,360 927,042,024 42,674 8,681 6.6%2009 40,700 856,501,154 40,535 8,522 12.0%2010 40,700 n/a n/a 8,546 9.5%
1 Source: Wisconsin Department of Administration estimates.2 Source: Wisconsin Department of Revenue. Adjusted Gross Income for all tax returns filed for City
of Wausau residents.3 Source: Wisconsin Department of Revenue. Average Adjusted Gross Income for returns filed.4 Source: Wisconsin Department of Public Instruction.5 Source: Wisconsin Department of Workforce Development. Annual rates not seasonally adjusted.
116
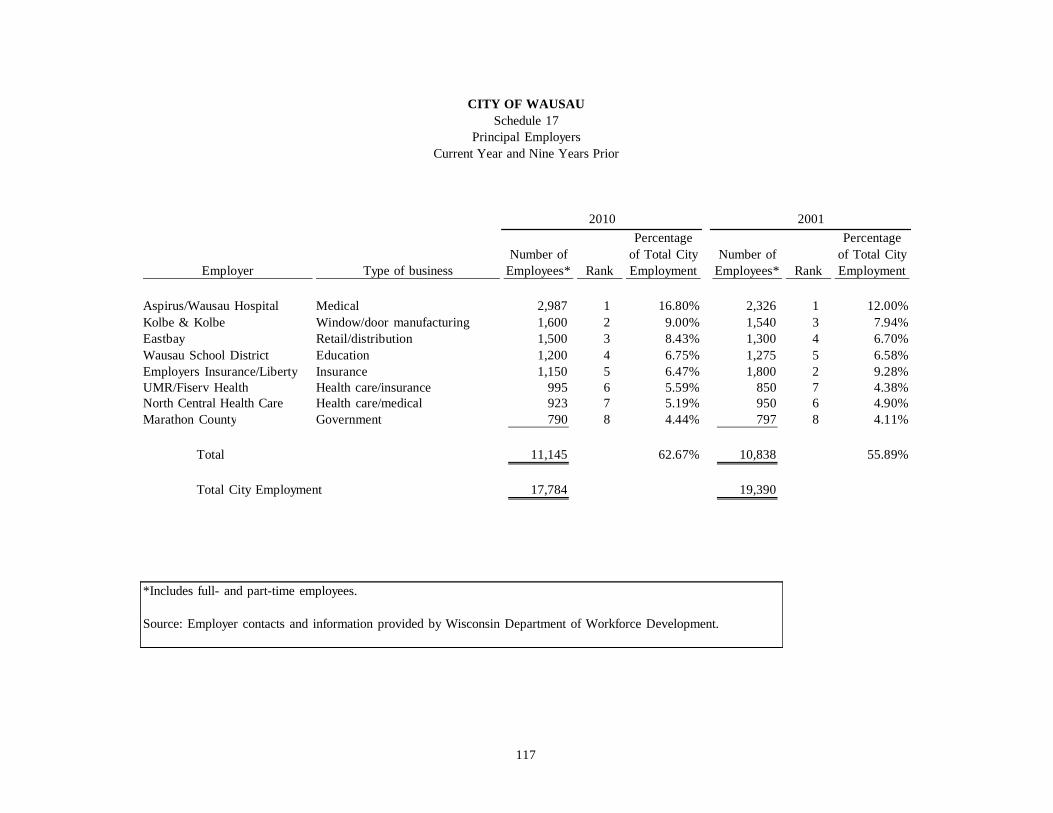
CITY OF WAUSAUSchedule 17
Principal EmployersCurrent Year and Nine Years Prior
2010 2001Percentage Percentage
Number of of Total City Number of of Total CityEmployer Type of business Employees* Rank Employment Employees* Rank Employment
Aspirus/Wausau Hospital Medical 2,987 1 16.80% 2,326 1 12.00%Kolbe & Kolbe Window/door manufacturing 1,600 2 9.00% 1,540 3 7.94%Eastbay Retail/distribution 1,500 3 8.43% 1,300 4 6.70%Wausau School District Education 1,200 4 6.75% 1,275 5 6.58%Employers Insurance/Liberty Insurance 1,150 5 6.47% 1,800 2 9.28%UMR/Fiserv Health Health care/insurance 995 6 5.59% 850 7 4.38%North Central Health Care Health care/medical 923 7 5.19% 950 6 4.90%Marathon County Government 790 8 4.44% 797 8 4.11%
Total 11,145 62.67% 10,838 55.89%
Total City Employment 17,784 19,390
*Includes full- and part-time employees.
Source: Employer contacts and information provided by Wisconsin Department of Workforce Development.
117
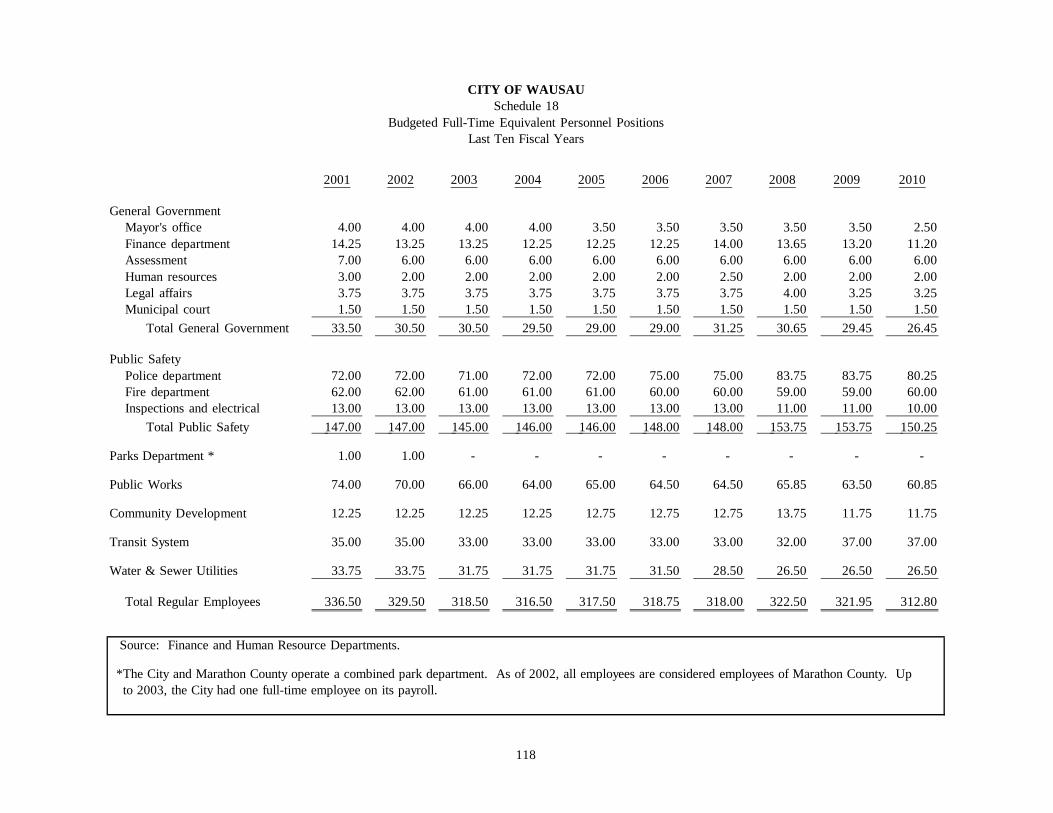
CITY OF WAUSAUSchedule 18
Budgeted Full-Time Equivalent Personnel PositionsLast Ten Fiscal Years
2001 2002 2003 2004 2005 2006 2007 2008 2009 2010
General GovernmentMayor's office 4.00 4.00 4.00 4.00 3.50 3.50 3.50 3.50 3.50 2.50 Finance department 14.25 13.25 13.25 12.25 12.25 12.25 14.00 13.65 13.20 11.20 Assessment 7.00 6.00 6.00 6.00 6.00 6.00 6.00 6.00 6.00 6.00 Human resources 3.00 2.00 2.00 2.00 2.00 2.00 2.50 2.00 2.00 2.00 Legal affairs 3.75 3.75 3.75 3.75 3.75 3.75 3.75 4.00 3.25 3.25 Municipal court 1.50 1.50 1.50 1.50 1.50 1.50 1.50 1.50 1.50 1.50
Total General Government 33.50 30.50 30.50 29.50 29.00 29.00 31.25 30.65 29.45 26.45
Public SafetyPolice department 72.00 72.00 71.00 72.00 72.00 75.00 75.00 83.75 83.75 80.25 Fire department 62.00 62.00 61.00 61.00 61.00 60.00 60.00 59.00 59.00 60.00 Inspections and electrical 13.00 13.00 13.00 13.00 13.00 13.00 13.00 11.00 11.00 10.00
Total Public Safety 147.00 147.00 145.00 146.00 146.00 148.00 148.00 153.75 153.75 150.25
Parks Department * 1.00 1.00 - - - - - - - -
Public Works 74.00 70.00 66.00 64.00 65.00 64.50 64.50 65.85 63.50 60.85
Community Development 12.25 12.25 12.25 12.25 12.75 12.75 12.75 13.75 11.75 11.75
Transit System 35.00 35.00 33.00 33.00 33.00 33.00 33.00 32.00 37.00 37.00
Water & Sewer Utilities 33.75 33.75 31.75 31.75 31.75 31.50 28.50 26.50 26.50 26.50
Total Regular Employees 336.50 329.50 318.50 316.50 317.50 318.75 318.00 322.50 321.95 312.80
Source: Finance and Human Resource Departments.
*The City and Marathon County operate a combined park department. As of 2002, all employees are considered employees of Marathon County. Up to 2003, the City had one full-time employee on its payroll.
118
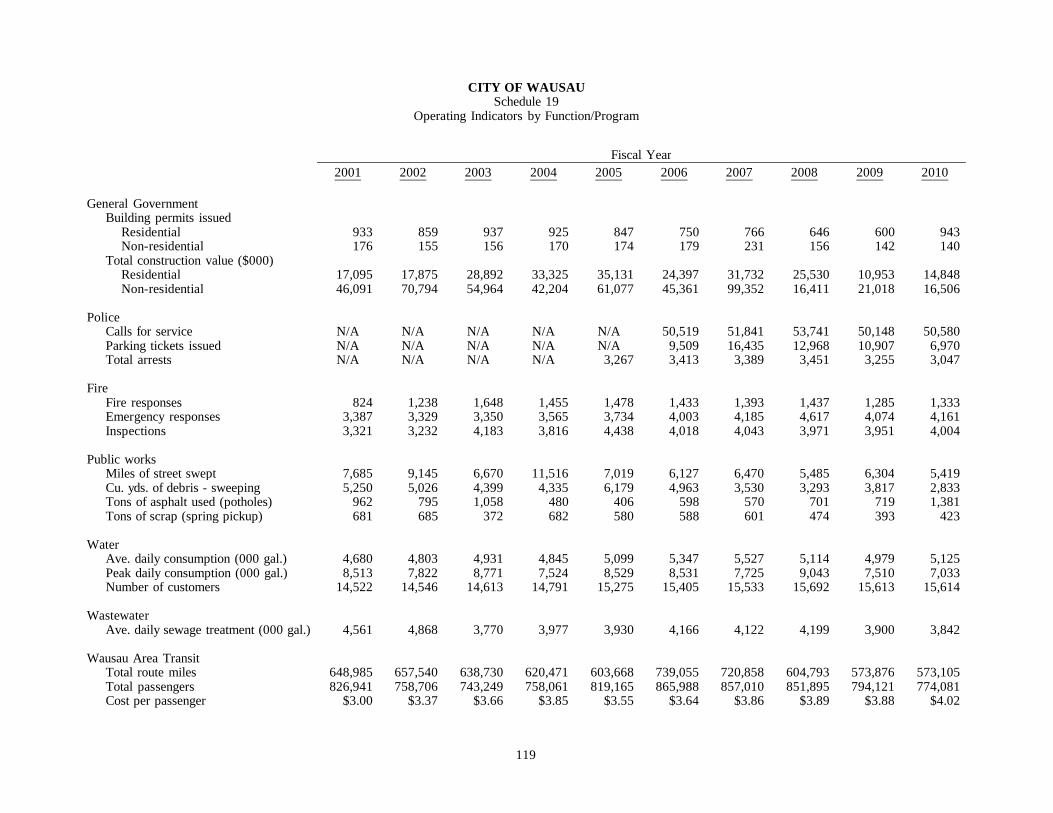
CITY OF WAUSAUSchedule 19
Operating Indicators by Function/Program
Fiscal Year2001 2002 2003 2004 2005 2006 2007 2008 2009 2010
General GovernmentBuilding permits issued
Residential 933 859 937 925 847 750 766 646 600 943 Non-residential 176 155 156 170 174 179 231 156 142 140
Total construction value ($000)Residential 17,095 17,875 28,892 33,325 35,131 24,397 31,732 25,530 10,953 14,848 Non-residential 46,091 70,794 54,964 42,204 61,077 45,361 99,352 16,411 21,018 16,506
PoliceCalls for service N/A N/A N/A N/A N/A 50,519 51,841 53,741 50,148 50,580 Parking tickets issued N/A N/A N/A N/A N/A 9,509 16,435 12,968 10,907 6,970 Total arrests N/A N/A N/A N/A 3,267 3,413 3,389 3,451 3,255 3,047
FireFire responses 824 1,238 1,648 1,455 1,478 1,433 1,393 1,437 1,285 1,333 Emergency responses 3,387 3,329 3,350 3,565 3,734 4,003 4,185 4,617 4,074 4,161 Inspections 3,321 3,232 4,183 3,816 4,438 4,018 4,043 3,971 3,951 4,004
Public worksMiles of street swept 7,685 9,145 6,670 11,516 7,019 6,127 6,470 5,485 6,304 5,419 Cu. yds. of debris - sweeping 5,250 5,026 4,399 4,335 6,179 4,963 3,530 3,293 3,817 2,833 Tons of asphalt used (potholes) 962 795 1,058 480 406 598 570 701 719 1,381 Tons of scrap (spring pickup) 681 685 372 682 580 588 601 474 393 423
WaterAve. daily consumption (000 gal.) 4,680 4,803 4,931 4,845 5,099 5,347 5,527 5,114 4,979 5,125 Peak daily consumption (000 gal.) 8,513 7,822 8,771 7,524 8,529 8,531 7,725 9,043 7,510 7,033 Number of customers 14,522 14,546 14,613 14,791 15,275 15,405 15,533 15,692 15,613 15,614
WastewaterAve. daily sewage treatment (000 gal.) 4,561 4,868 3,770 3,977 3,930 4,166 4,122 4,199 3,900 3,842
Wausau Area TransitTotal route miles 648,985 657,540 638,730 620,471 603,668 739,055 720,858 604,793 573,876 573,105 Total passengers 826,941 758,706 743,249 758,061 819,165 865,988 857,010 851,895 794,121 774,081 Cost per passenger $3.00 $3.37 $3.66 $3.85 $3.55 $3.64 $3.86 $3.89 $3.88 $4.02
119
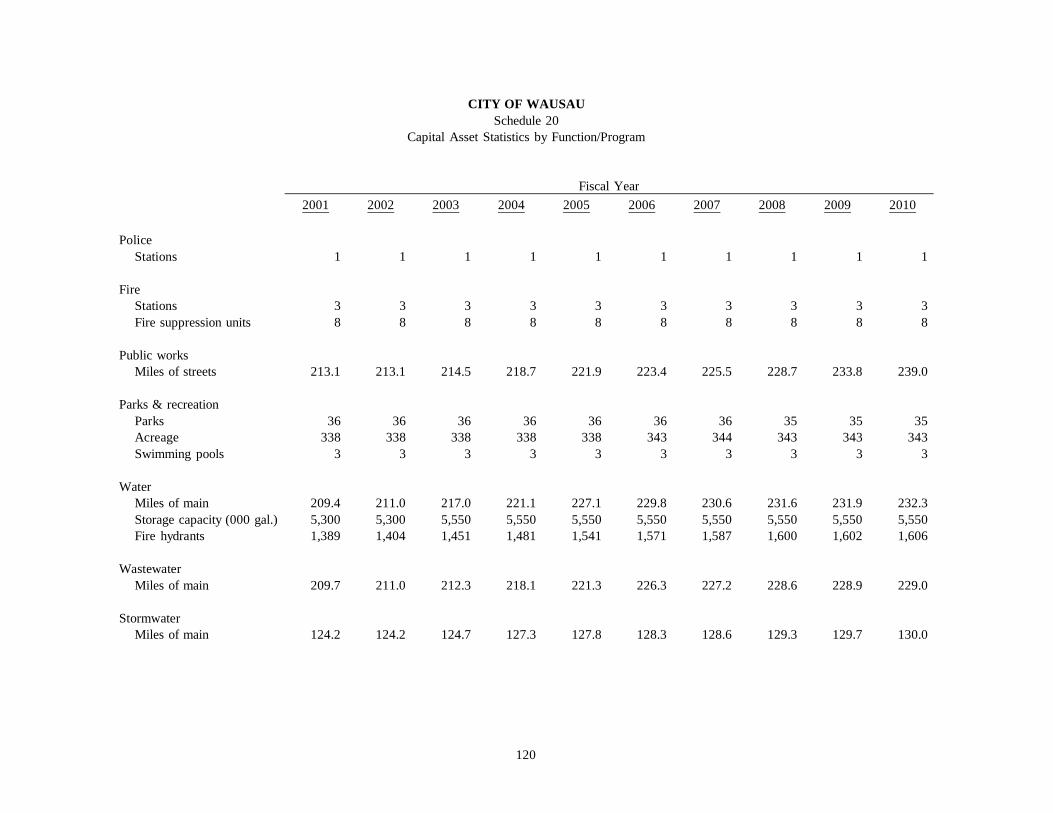
CITY OF WAUSAUSchedule 20
Capital Asset Statistics by Function/Program
Fiscal Year2001 2002 2003 2004 2005 2006 2007 2008 2009 2010
PoliceStations 1 1 1 1 1 1 1 1 1 1
FireStations 3 3 3 3 3 3 3 3 3 3 Fire suppression units 8 8 8 8 8 8 8 8 8 8
Public worksMiles of streets 213.1 213.1 214.5 218.7 221.9 223.4 225.5 228.7 233.8 239.0
Parks & recreationParks 36 36 36 36 36 36 36 35 35 35 Acreage 338 338 338 338 338 343 344 343 343 343 Swimming pools 3 3 3 3 3 3 3 3 3 3
WaterMiles of main 209.4 211.0 217.0 221.1 227.1 229.8 230.6 231.6 231.9 232.3 Storage capacity (000 gal.) 5,300 5,300 5,550 5,550 5,550 5,550 5,550 5,550 5,550 5,550 Fire hydrants 1,389 1,404 1,451 1,481 1,541 1,571 1,587 1,600 1,602 1,606
WastewaterMiles of main 209.7 211.0 212.3 218.1 221.3 226.3 227.2 228.6 228.9 229.0
StormwaterMiles of main 124.2 124.2 124.7 127.3 127.8 128.3 128.6 129.3 129.7 130.0
120


![1RQSUR¿W 2UJDQL]DWLRQ U.S. POSTAGE PAID...2 Wisconsin 2014 Agricultural Statistics Wisconsin Agriculture and Economics Wisconsin farm production expenditures totaled $11.4 billion](https://img.pdfslide.net/doc/110x75/5faa1ba6f49c0b78ad785828/1rqsurw-2ujdqldwlrq-us-postage-paid-2-wisconsin-2014-agricultural-statistics.jpg)