Embed Size (px)
Citation preview

City, University of London Institutional Repository
Citation: Marshall, C., Jones, A., Fastelli, A., Atkinson, J., Botting, N. and Morgan, G. (2017). Semantic fluency in deaf children who use spoken and signed language, in comparison to hearing peers. International Journal of Language and Communication Disorders, doi: 10.1111/1460-6984.12333
This is the published version of the paper.
This version of the publication may differ from the final published version.
Permanent repository link: http://openaccess.city.ac.uk/17499/
Link to published version: http://dx.doi.org/10.1111/1460-6984.12333
Copyright and reuse: City Research Online aims to make research outputs of City, University of London available to a wider audience. Copyright and Moral Rights remain with the author(s) and/or copyright holders. URLs from City Research Online may be freely distributed and linked to.
City Research Online: http://openaccess.city.ac.uk/ [email protected]
City Research Online

INT J LANG COMMUN DISORD, XXXX 2017,VOL. 00, NO. 0, 1–14
Research Report
Semantic fluency in deaf children who use spoken and signed languagein comparison with hearing peersC. R. Marshall†, A. Jones‡, A. Fastelli§, J. Atkinson‡, N. Botting¶ and G. Morgan‡¶†UCL Institute of Education, University College London, London, UK‡UCL Deafness, Cognition and Language Research Centre, University College London, London, UK§University of Padua, Padua, Italy¶Language and Communication Science, School of Health Sciences, City University of London, London, UK
(Received December 2016; accepted May 2017)
Abstract
Background: Deafness has an adverse impact on children’s ability to acquire spoken languages. Signed languagesoffer a more accessible input for deaf children, but because the vast majority are born to hearing parents who donot sign, their early exposure to sign language is limited. Deaf children as a whole are therefore at high risk oflanguage delays.Aims: We compared deaf and hearing children’s performance on a semantic fluency task. Optimal performance onthis task requires a systematic search of the mental lexicon, the retrieval of words within a subcategory and, whenthat subcategory is exhausted, switching to a new subcategory. We compared retrieval patterns between groups,and also compared the responses of deaf children who used British Sign Language (BSL) with those who usedspoken English. We investigated how semantic fluency performance related to children’s expressive vocabulary andexecutive function skills, and also retested semantic fluency in the majority of the children nearly 2 years later, inorder to investigate how much progress they had made in that time.Methods & Procedures: Participants were deaf children aged 6–11 years (N = 106, comprising 69 users of spokenEnglish, 29 users of BSL and eight users of Sign Supported English—SSE) compared with hearing children (N =120) of the same age who used spoken English. Semantic fluency was tested for the category ‘animals’. We codedfor errors, clusters (e.g., ‘pets’, ‘farm animals’) and switches. Participants also completed the Expressive One-WordPicture Vocabulary Test and a battery of six non-verbal executive function tasks. In addition, we collected follow-upsemantic fluency data for 70 deaf and 74 hearing children, nearly 2 years after they were first tested.Outcomes & Results: Deaf children, whether using spoken or signed language, produced fewer items in the semanticfluency task than hearing children, but they showed similar patterns of responses for items most commonlyproduced, clustering of items into subcategories and switching between subcategories. Both vocabulary andexecutive function scores predicted the number of correct items produced. Follow-up data from deaf participantsshowed continuing delays relative to hearing children 2 years later.Conclusions & Implications: We conclude that semantic fluency can be used experimentally to investigate lexicalorganization in deaf children, and that it potentially has clinical utility across the heterogeneous deaf population.We present normative data to aid clinicians who wish to use this task with deaf children.
Keywords: deaf, semantic fluency, vocabulary, lexicon, executive functions, British Sign Language (BSL).
What this paper addsWhat is already known on the subjectThe semantic fluency task, particularly involving the semantic category ‘animals’, is widely used as a research andclinical tool across the lifespan. Little is known, however, about how deaf children perform on this task, or whetherthere are differences between deaf children who use spoken language and those who sign.
Address correspondence to: C. R. Marshall, UCL Institute of Education, University College London, 20 Bedford Way, London WC1H 0AL,UK; e-mail: [email protected]
This is an open access article under the terms of the Creative Commons Attribution License, which permits use, distribution and reproductionin any medium, provided the original work is properly cited.
International Journal of Language & Communication DisordersISSN 1368-2822 print/ISSN 1460-6984 online C© 2017 The Authors International Journal of Language & Communication Disorders published by John Wiley & Sons Ltd on behalf
of Royal College of Speech and Language TherapistsDOI: 10.1111/1460-6984.12333

2 C. R. Marshall et al.
What this paper adds to existing knowledgeOur study of 106 deaf children aged 6–11 years from the UK revealed that deaf children on average produced fewerresponses compared with hearing children, although there was substantial overlap between the two groups. Therewere also similarities in the two groups’ patterns of performance, suggesting that the task measures the same cognitiveprocesses in both groups, regardless of the language that the deaf children responded in (BSL, spoken English orSSE).
What are the potential or actual clinical implications of this work?The data from this study, which investigates semantic fluency in the largest sample of deaf children to date, suggestthat semantic fluency could have value both as a research tool for investigating deaf children’s vocabulary and executivefunctions, and as a clinical assessment tool. The normative data for deaf children aged 6–11 years that are includedin this paper will aid clinicians to use the task with deaf children in that age range.
Introduction
Deafness impacts adversely on children’s ability to pro-cess and acquire spoken languages. Signed languagesprovide a more easily accessible language input, and forthe small proportion of deaf children who are born todeaf signing parents (‘native signers’) signed languagedevelopment can proceed with very similar milestonesand timescale to spoken language acquisition in hear-ing children (Anderson and Reilly 2002, Mayberry andSquires 2006, Newport and Meier 1985). However, thevast majority of deaf children—approximately 95%—are born to hearing parents who do not sign (Mitchelland Karchmer 2004) and so they do not usually haveaccess to sign language, at least during the early stagesof language acquisition (Lu et al. 2016). Deaf childrenas a group are therefore at high risk of language delays.This in turn has implications for other areas of devel-opment, and lower academic achievement and poorersocial, emotional and mental well-being outcomes arereported (Convertino et al. 2009, Vaccari and Marschark1997, van Eldik et al. 2004).
This paper focuses on vocabulary, a fundamentalpart of language whose development is closely relatedto the development of grammar, narrative ability andliteracy (Duff et al. 2015, Fenson et al. 1994, Lee 2011,Paul et al. 1997). There is considerable variability in therate of vocabulary development even in hearing children(Duff et al. 2015, Fenson et al. 1994), but this variabil-ity is particularly marked in the case of deaf children,and is increased by heterogeneity in communication ap-proaches and quality of language input. Native signersgenerally outperform non-native signers on measuresof sign vocabulary (Hermans et al. 2008, Schick andHoffmeister 2001), but even native signers have beenshown to know fewer lexical items than hearing children(Rinaldi et al. 2014). Deaf children who use spoken lan-guage also tend to have lower vocabulary levels than theirhearing peers (Convertino et al. 2014, Yoshinaga-Itanoet al. 2010, Ziv et al. 2013). Even though rapid advancesin hearing technologies such as hearing aids and early
cochlear implantation generally yield good progress inimproving deaf children’s access to the sounds of spo-ken language (Yoshinaga-Itano et al. 2010), many deafchildren still do not reach age-equivalent vocabulary ca-pabilities for either expressive or receptive vocabulary(see Lund 2016 for a recent meta-analysis).
Children’s vocabulary abilities can be investigated indifferent ways. In this study we used the semantic fluencytask, which has been employed to investigate lexicalorganization and retrieval across the lifespan. Semanticfluency requires participants to name as many exemplarsas they can from a particular semantic category (such as‘foods’, ‘animals’ or ‘household objects’) in a limitedperiod of time. Given the limited time for responding(most usually just 1 min), the task does not provide anexhaustive list of the words that a participant knows,but it does reveal those words that come most readily tomind.
The semantic fluency task provides a measure oftwo things: lexical organization and executive functions(EFs; Ardila et al. 2006, Bose et al. 2017). With re-spect to lexical organization, if participants can generateexemplars in response to a superordinate label, e.g., ‘an-imals’, then this suggests that their semantic knowledgeis organized taxonomically. When a word is spoken (orsigned), it is assumed that this will in turn activate otherwords or concepts that are semantically similar or re-lated to it. Hence, it is also assumed that the order inwhich words are produced will indicate, indirectly, theirproximity to each other in the lexicon. Characteristicfindings for this task are that items are produced in clus-ters of semantically related words (e.g., ‘farm animals’,‘pets’, ‘sea animals’), and that more prototypical cate-gory exemplars are produced more frequently than lesstypical ones (see Marshall et al. 2013 for a review ofthe relevant literature). With respect to EFs, the task re-quires the use of word-retrieval strategies, which in turnrely on executive abilities, namely cognitive flexibility(i.e., set-shifting between different clusters), workingmemory (to keep track of items that have already been
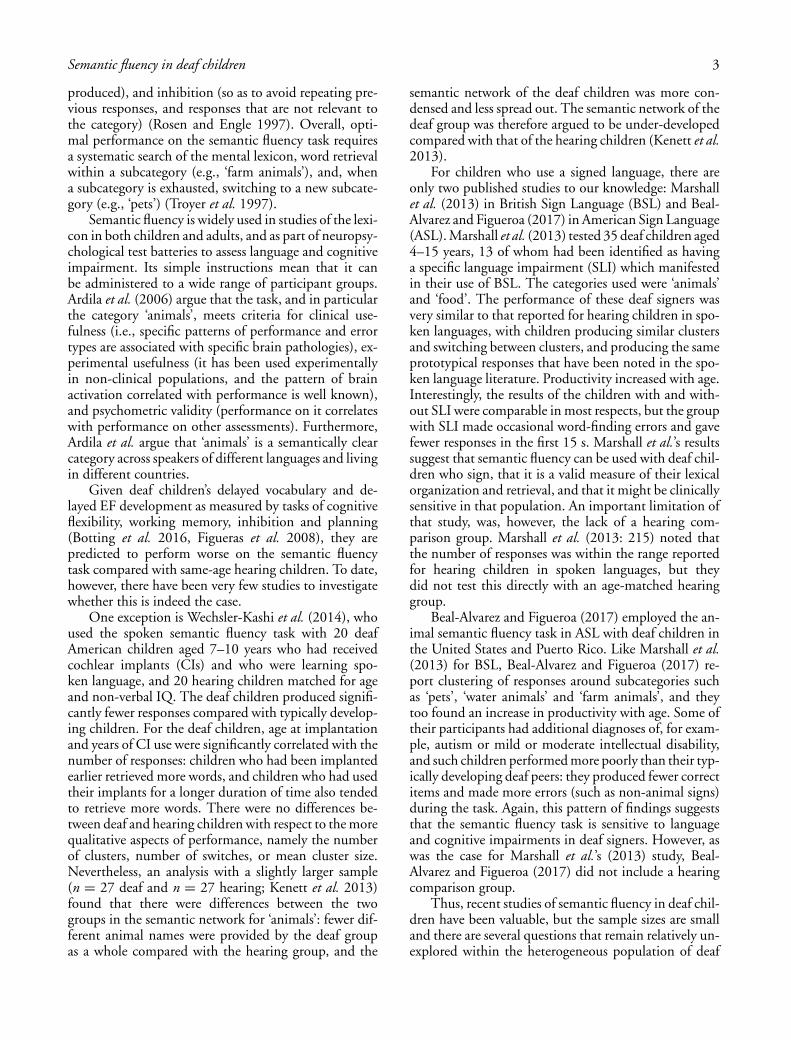
Semantic fluency in deaf children 3
produced), and inhibition (so as to avoid repeating pre-vious responses, and responses that are not relevant tothe category) (Rosen and Engle 1997). Overall, opti-mal performance on the semantic fluency task requiresa systematic search of the mental lexicon, word retrievalwithin a subcategory (e.g., ‘farm animals’), and, whena subcategory is exhausted, switching to a new subcate-gory (e.g., ‘pets’) (Troyer et al. 1997).
Semantic fluency is widely used in studies of the lexi-con in both children and adults, and as part of neuropsy-chological test batteries to assess language and cognitiveimpairment. Its simple instructions mean that it canbe administered to a wide range of participant groups.Ardila et al. (2006) argue that the task, and in particularthe category ‘animals’, meets criteria for clinical use-fulness (i.e., specific patterns of performance and errortypes are associated with specific brain pathologies), ex-perimental usefulness (it has been used experimentallyin non-clinical populations, and the pattern of brainactivation correlated with performance is well known),and psychometric validity (performance on it correlateswith performance on other assessments). Furthermore,Ardila et al. argue that ‘animals’ is a semantically clearcategory across speakers of different languages and livingin different countries.
Given deaf children’s delayed vocabulary and de-layed EF development as measured by tasks of cognitiveflexibility, working memory, inhibition and planning(Botting et al. 2016, Figueras et al. 2008), they arepredicted to perform worse on the semantic fluencytask compared with same-age hearing children. To date,however, there have been very few studies to investigatewhether this is indeed the case.
One exception is Wechsler-Kashi et al. (2014), whoused the spoken semantic fluency task with 20 deafAmerican children aged 7–10 years who had receivedcochlear implants (CIs) and who were learning spo-ken language, and 20 hearing children matched for ageand non-verbal IQ. The deaf children produced signifi-cantly fewer responses compared with typically develop-ing children. For the deaf children, age at implantationand years of CI use were significantly correlated with thenumber of responses: children who had been implantedearlier retrieved more words, and children who had usedtheir implants for a longer duration of time also tendedto retrieve more words. There were no differences be-tween deaf and hearing children with respect to the morequalitative aspects of performance, namely the numberof clusters, number of switches, or mean cluster size.Nevertheless, an analysis with a slightly larger sample(n = 27 deaf and n = 27 hearing; Kenett et al. 2013)found that there were differences between the twogroups in the semantic network for ‘animals’: fewer dif-ferent animal names were provided by the deaf groupas a whole compared with the hearing group, and the
semantic network of the deaf children was more con-densed and less spread out. The semantic network of thedeaf group was therefore argued to be under-developedcompared with that of the hearing children (Kenett et al.2013).
For children who use a signed language, there areonly two published studies to our knowledge: Marshallet al. (2013) in British Sign Language (BSL) and Beal-Alvarez and Figueroa (2017) in American Sign Language(ASL). Marshall et al. (2013) tested 35 deaf children aged4–15 years, 13 of whom had been identified as havinga specific language impairment (SLI) which manifestedin their use of BSL. The categories used were ‘animals’and ‘food’. The performance of these deaf signers wasvery similar to that reported for hearing children in spo-ken languages, with children producing similar clustersand switching between clusters, and producing the sameprototypical responses that have been noted in the spo-ken language literature. Productivity increased with age.Interestingly, the results of the children with and with-out SLI were comparable in most respects, but the groupwith SLI made occasional word-finding errors and gavefewer responses in the first 15 s. Marshall et al.’s resultssuggest that semantic fluency can be used with deaf chil-dren who sign, that it is a valid measure of their lexicalorganization and retrieval, and that it might be clinicallysensitive in that population. An important limitation ofthat study, was, however, the lack of a hearing com-parison group. Marshall et al. (2013: 215) noted thatthe number of responses was within the range reportedfor hearing children in spoken languages, but theydid not test this directly with an age-matched hearinggroup.
Beal-Alvarez and Figueroa (2017) employed the an-imal semantic fluency task in ASL with deaf children inthe United States and Puerto Rico. Like Marshall et al.(2013) for BSL, Beal-Alvarez and Figueroa (2017) re-port clustering of responses around subcategories suchas ‘pets’, ‘water animals’ and ‘farm animals’, and theytoo found an increase in productivity with age. Some oftheir participants had additional diagnoses of, for exam-ple, autism or mild or moderate intellectual disability,and such children performed more poorly than their typ-ically developing deaf peers: they produced fewer correctitems and made more errors (such as non-animal signs)during the task. Again, this pattern of findings suggeststhat the semantic fluency task is sensitive to languageand cognitive impairments in deaf signers. However, aswas the case for Marshall et al.’s (2013) study, Beal-Alvarez and Figueroa (2017) did not include a hearingcomparison group.
Thus, recent studies of semantic fluency in deaf chil-dren have been valuable, but the sample sizes are smalland there are several questions that remain relatively un-explored within the heterogeneous population of deaf

4 C. R. Marshall et al.
Table 1. Participant details: hearing status, deaf group membership, sample sizes, gender and age
Deaf Hearingn = 106 (boys = 59) n = 120 (boys = 66)
Mean age = 8;10 Mean age = 8;11SD = 1;8 SD = 1;6
BSL Spoken English SSEn = 29 (boys = 18) n = 69 (boys = 37) n = 8 (boys = 4)
Mean age = 9;1 Mean age = 8;6 Mean age = 9;5SD: 1;7 SD: 1;7 SD: 1;6
Native BSL Non-native BSLn = 9 (boys = 6) n = 20 (boys = 12)
Age = 8;1 Age = 9;6SD = 0;9 SD = 1;7
Note: BSL, British Sign Language; SSE, Sign-Supported English.
children that includes those who sign and who use spo-ken language:
� How does the semantic fluency performance ofdeaf children compare with that of hearing chil-dren, and does it differ between groups of deafchildren who sign or use spoken language tocommunicate?
� How does semantic fluency performance relate tochildren’s expressive vocabulary and EFs?
� Do any group differences between deaf and hear-ing children’s semantic fluency performance per-sist as they get older?
If the semantic fluency task is to be useful as a clini-cal and experimental tool in the deaf population thesequestions need to be investigated for both signed andspoken language.
Methods
Participants
Participants were 226 children (106 deaf, 120 hearing)living in the UK and Ireland and who had English,BSL or Sign-Supported English (SSE; i.e., the simulta-neous use of sign and spoken English) as their primarymethod of communication. None of the children hadany known developmental disorders such as autism, at-tention deficit/hyperactivity disorder (ADHD) or cere-bral palsy. They had previously been recruited as partof a larger sample in order to study the relationship be-tween language and EFs in deaf and hearing children.Language and EF data from the majority of that grouphave been presented by Botting et al. (2016), who didnot present the semantic fluency data that are the focusof the current paper. Data from seven deaf and 11 hear-ing participants of Botting et al.’s group were not usedhere because they did not do the semantic fluency task,while data from an additional group of five deaf and six
hearing children were not included in Botting et al. butwere tested as part of the same study and are includedhere. The groups in both studies therefore overlap to avery high degree. To gain a sample that is representa-tive of deaf children’s varied educational and languageexperiences, deaf participants were recruited from bothspecialist deaf (day and residential schools) and main-stream schools (with and without a specialist hearingunit).
Table 1 provides details of participants’ hearing sta-tus (deaf or hearing), gender, age and deaf group mem-bership. Group membership was defined according tothe language in which participants completed the se-mantic fluency task and the Expressive One-Word Pic-ture Vocabulary Test (Brownell 2000), and which waseither BSL, spoken English or SSE; BSL users were thensubgrouped according to whether they were native ornon-native signers. The deaf group as a whole was well-matched to the hearing group for age, t(224) = 0.342,p = .746. On a test of non-verbal cognitive ability (thematrix reasoning subtest of the Wechsler AbbreviatedScale of Intelligence; Wechsler 1999), the mean T-scoreof the deaf group was 50.21 (SD = 10.47) and ofthe hearing group was 54.50 (9.74). The deaf grouptherefore scored within the normal range (mean = 50,SD = 10), but an independent samples t-test neverthe-less revealed that it scored lower than the hearing group,t(224) = 3.192, p = .002.
The majority of deaf children were severely (n = 31)or profoundly (n = 54) deaf. Two were mildly and 14moderately deaf, with data missing from five children.Seventy children used a hearing aid, and 39 a CI (thisadds up to more than the 106 children in the groupbecause some children had both). For those childrenwith a CI, the mean age of implantation was 3;3 andranged between 3 months and 10 years of age (SD =1;10).
A subgroup of 70 deaf and 74 hearing participantswere tested a second time, an average of 21 months(SD = 2 months) after first testing. The mean age of

Semantic fluency in deaf children 5
the deaf group at retest was 10;2 (SD = 1;8) and of thehearing group was 10;5 (SD = 1;6).
Procedure
The study was approved by the UCL Research EthicsCommittee. Informed consent was obtained from allparticipating families prior to testing, and children gaveverbal consent with the option to opt out at any timeduring the testing session.
Testing took place in a quiet room in either thechild’s school or home. Each session was video recordedand lasted between 60 and 75 min. Children couldopt to take short breaks when necessary. Children wereassessed by one of two lead researchers, who were sup-ported by a research assistant. One lead researcher wasa hearing native user of BSL and their research assistantwas a deaf native signer, both very experienced in com-municating with deaf children. These researchers usedBSL to present all task instructions to deaf childrenfor whom BSL was the preferred language. The secondlead researcher and research assistant, both hearing butwith competent signing skills, tested all hearing childrenand deaf children whose preferred language was spokenEnglish or SSE.
Tasks
Semantic Fluency task
The category ‘animals’ was used for the Semantic Flu-ency task. The instructions were straightforward: ‘Pleasetell me the names of as many animals as you can. Be asquick as possible. You have one minute. Ready? Go.’ Itwas rarely necessary to give examples, but when a childseemed unsure a couple of examples (cat and dog) weregiven. These items were then excluded if the child re-peated them during the task. Instructions were given inspoken English, BSL or SSE, depending on the languagechoice of the child.
Expressive One-Word Picture Vocabulary Test(EOWPVT)
Single word production was tested using the EOWPVT(Brownell 2000) following the standardized adminis-tration guidelines. Children are required to name singlepictures (mostly simple nouns, e.g., ‘goat’, but also verbs,e.g., ‘writing’, and category labels, e.g., ‘lights’). The testwas adapted by substituting three of the test items withalternative pictures to make it more suitable for chil-dren in the UK (e.g., ‘badger’ replaced ‘raccoon’). Kyleet al. (2016) previously ascertained appropriate signedresponses (in BSL); however, in order to ensure that theEOWPVT could be used to assess the vocabulary of both
hearing and signing deaf children, 15 test items that donot exist in BSL (e.g., ‘cactus’, ‘banjo’) were removedafter administration and an adjusted EOWPVT scorewas calculated for analysis that excluded these items.
Six EF tasks were chosen for their low languagedemands, meaning they were less likely to disadvantagechildren with low language levels.
Odd One Out Span
The Odd One Out Span (Henry 2001) is a measureof executive-loaded visuospatial working memory. Thechild is instructed to identify which shape is the oddone out and remember its location. At the end of a trial,the child has to recall the location of all of the odd shapesby pointing to the correct box in a sequence of emptygrids. There are four trials within a block, beginningwith one item to recall. Each block of trials increases inthe number of shape locations to recall, with a maximumof six. The test is terminated when two errors are madewithin the same block. A score is calculated by totallingthe number of correctly recalled shape locations.
Backwards Spatial Span task
The Backwards Spatial Span task (Wechsler NonverbalScale of Ability; Wechsler and Naglieri 2006) is also atest of executive-loaded visuospatial working memory.The experimenter taps a sequence of blocks and thechild is instructed to tap this sequence in reverse. Eachtrial increases the number of blocks in the sequence toa maximum of nine. The test is terminated after twoerrors at the same span length, and scored by tallyingthe number of correct sequences.
Design Fluency task
The Design Fluency task (NEPSY; Korkman et al. 1998)contains a series of dot arrays. Children are required togenerate as many different designs as possible in 1 minby connecting two or more dots with straight lines. Theassessment measures visuospatial cognitive fluency andis scored by adding the total number of original designs.
Children’s Colour Trails Test 1 and 2
The Children’s Colour Trails Test 1 and 2 (Llorente et al.2003) is a test of cognitive shifting. For test 1, the chil-dren are timed drawing a line connecting the numberedcircles from 1 to 15. In test 2, two sets of numberedcircles are printed, one set filled with pink and the otheryellow. Children are required to join the numbers inascending order, alternating between colours. In thisstudy, an interference score was calculated, showing theadditional time taken in test 2.
6 C. R. Marshall et al.
Tower of London
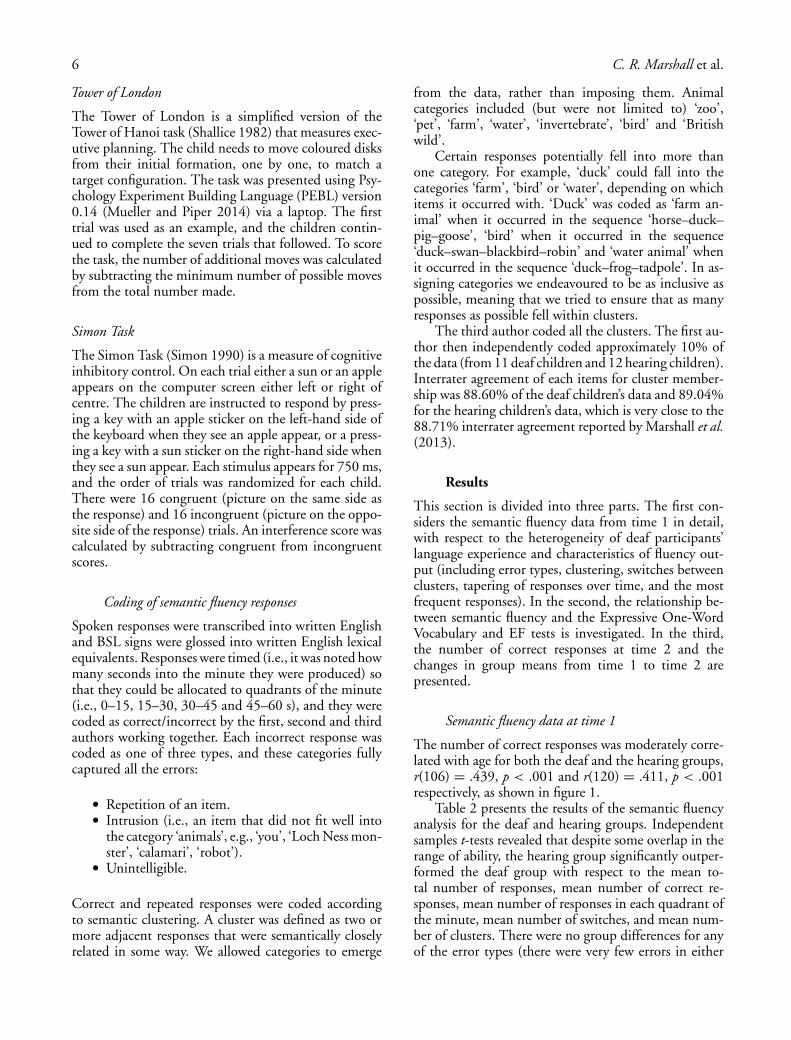
The Tower of London is a simplified version of theTower of Hanoi task (Shallice 1982) that measures exec-utive planning. The child needs to move coloured disksfrom their initial formation, one by one, to match atarget configuration. The task was presented using Psy-chology Experiment Building Language (PEBL) version0.14 (Mueller and Piper 2014) via a laptop. The firsttrial was used as an example, and the children contin-ued to complete the seven trials that followed. To scorethe task, the number of additional moves was calculatedby subtracting the minimum number of possible movesfrom the total number made.
Simon Task
The Simon Task (Simon 1990) is a measure of cognitiveinhibitory control. On each trial either a sun or an appleappears on the computer screen either left or right ofcentre. The children are instructed to respond by press-ing a key with an apple sticker on the left-hand side ofthe keyboard when they see an apple appear, or a press-ing a key with a sun sticker on the right-hand side whenthey see a sun appear. Each stimulus appears for 750 ms,and the order of trials was randomized for each child.There were 16 congruent (picture on the same side asthe response) and 16 incongruent (picture on the oppo-site side of the response) trials. An interference score wascalculated by subtracting congruent from incongruentscores.
Coding of semantic fluency responses
Spoken responses were transcribed into written Englishand BSL signs were glossed into written English lexicalequivalents. Responses were timed (i.e., it was noted howmany seconds into the minute they were produced) sothat they could be allocated to quadrants of the minute(i.e., 0–15, 15–30, 30–45 and 45–60 s), and they werecoded as correct/incorrect by the first, second and thirdauthors working together. Each incorrect response wascoded as one of three types, and these categories fullycaptured all the errors:
� Repetition of an item.� Intrusion (i.e., an item that did not fit well into
the category ‘animals’, e.g., ‘you’, ‘Loch Ness mon-ster’, ‘calamari’, ‘robot’).
� Unintelligible.
Correct and repeated responses were coded accordingto semantic clustering. A cluster was defined as two ormore adjacent responses that were semantically closelyrelated in some way. We allowed categories to emerge
from the data, rather than imposing them. Animalcategories included (but were not limited to) ‘zoo’,‘pet’, ‘farm’, ‘water’, ‘invertebrate’, ‘bird’ and ‘Britishwild’.
Certain responses potentially fell into more thanone category. For example, ‘duck’ could fall into thecategories ‘farm’, ‘bird’ or ‘water’, depending on whichitems it occurred with. ‘Duck’ was coded as ‘farm an-imal’ when it occurred in the sequence ‘horse–duck–pig–goose’, ‘bird’ when it occurred in the sequence‘duck–swan–blackbird–robin’ and ‘water animal’ whenit occurred in the sequence ‘duck–frog–tadpole’. In as-signing categories we endeavoured to be as inclusive aspossible, meaning that we tried to ensure that as manyresponses as possible fell within clusters.
The third author coded all the clusters. The first au-thor then independently coded approximately 10% ofthe data (from 11 deaf children and 12 hearing children).Interrater agreement of each items for cluster member-ship was 88.60% of the deaf children’s data and 89.04%for the hearing children’s data, which is very close to the88.71% interrater agreement reported by Marshall et al.(2013).
Results
This section is divided into three parts. The first con-siders the semantic fluency data from time 1 in detail,with respect to the heterogeneity of deaf participants’language experience and characteristics of fluency out-put (including error types, clustering, switches betweenclusters, tapering of responses over time, and the mostfrequent responses). In the second, the relationship be-tween semantic fluency and the Expressive One-WordVocabulary and EF tests is investigated. In the third,the number of correct responses at time 2 and thechanges in group means from time 1 to time 2 arepresented.
Semantic fluency data at time 1
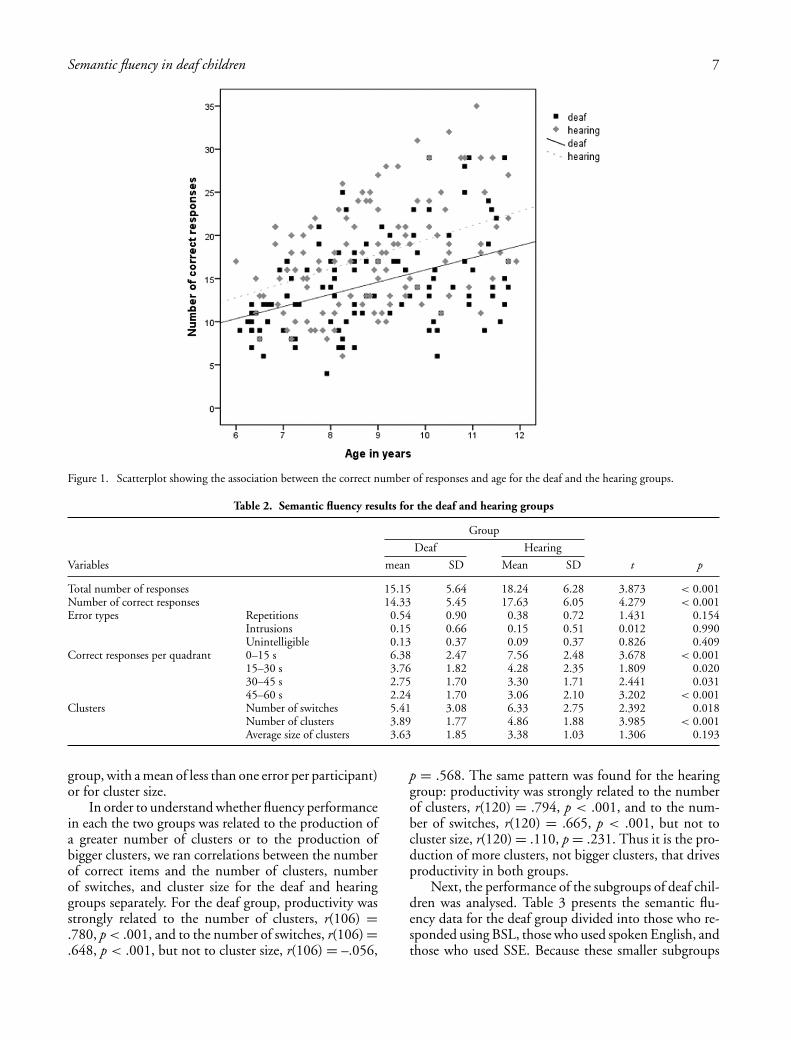
The number of correct responses was moderately corre-lated with age for both the deaf and the hearing groups,r(106) = .439, p < .001 and r(120) = .411, p < .001respectively, as shown in figure 1.
Table 2 presents the results of the semantic fluencyanalysis for the deaf and hearing groups. Independentsamples t-tests revealed that despite some overlap in therange of ability, the hearing group significantly outper-formed the deaf group with respect to the mean to-tal number of responses, mean number of correct re-sponses, mean number of responses in each quadrant ofthe minute, mean number of switches, and mean num-ber of clusters. There were no group differences for anyof the error types (there were very few errors in either
Semantic fluency in deaf children 7
Figure 1. Scatterplot showing the association between the correct number of responses and age for the deaf and the hearing groups.
Table 2. Semantic fluency results for the deaf and hearing groups
Group
Deaf Hearing
Variables mean SD Mean SD t p
Total number of responses 15.15 5.64 18.24 6.28 3.873 < 0.001Number of correct responses 14.33 5.45 17.63 6.05 4.279 < 0.001Error types Repetitions 0.54 0.90 0.38 0.72 1.431 0.154
Intrusions 0.15 0.66 0.15 0.51 0.012 0.990Unintelligible 0.13 0.37 0.09 0.37 0.826 0.409
Correct responses per quadrant 0–15 s 6.38 2.47 7.56 2.48 3.678 < 0.00115–30 s 3.76 1.82 4.28 2.35 1.809 0.02030–45 s 2.75 1.70 3.30 1.71 2.441 0.03145–60 s 2.24 1.70 3.06 2.10 3.202 < 0.001
Clusters Number of switches 5.41 3.08 6.33 2.75 2.392 0.018Number of clusters 3.89 1.77 4.86 1.88 3.985 < 0.001Average size of clusters 3.63 1.85 3.38 1.03 1.306 0.193
group, with a mean of less than one error per participant)or for cluster size.
In order to understand whether fluency performancein each the two groups was related to the production ofa greater number of clusters or to the production ofbigger clusters, we ran correlations between the numberof correct items and the number of clusters, numberof switches, and cluster size for the deaf and hearinggroups separately. For the deaf group, productivity wasstrongly related to the number of clusters, r(106) =.780, p < .001, and to the number of switches, r(106) =.648, p < .001, but not to cluster size, r(106) = –.056,
p = .568. The same pattern was found for the hearinggroup: productivity was strongly related to the numberof clusters, r(120) = .794, p < .001, and to the num-ber of switches, r(120) = .665, p < .001, but not tocluster size, r(120) = .110, p = .231. Thus it is the pro-duction of more clusters, not bigger clusters, that drivesproductivity in both groups.
Next, the performance of the subgroups of deaf chil-dren was analysed. Table 3 presents the semantic flu-ency data for the deaf group divided into those who re-sponded using BSL, those who used spoken English, andthose who used SSE. Because these smaller subgroups

8 C. R. Marshall et al.
Tabl
e3.
Sem
anti
cfl
uenc
yre
sult
sfo
rth
eth
ree
deaf
(BSL
,spo
ken
Eng
lish
and
SSE
)gr
oups
and
the
hear
ing
grou
p
Gro
up
Dea
f
BSL
Spok
enE
nglis
hSS
EH
eari
ng
Var
iabl
ese.
m.m
ean
e.SE
e.m
.mea
ne.
SEe.
m.m
ean
e.SE
e.m
.mea
ne.
SEPa
irw
ise
com
pari
sons
wit
hhe
arin
ggr
oup
p
Tota
lnum
ber
ofre
spon
ses
14.3
51.
0015
.85
0.65
12.8
41.
9118
.19
0.49
BSL
∗∗0.
004
Spok
enE
nglis
h∗0.
028
SSE
∗0.
044
Num
ber
ofco
rrec
tres
pons
es13
.45
0.97
15.1
00.
6311
.65
1.85
17.5
70.
47B
SL∗∗
0.00
1Sp
oken
Eng
lish
∗0.
012
SSE
∗0.
013
Diff
eren
terr
orty
pes
Rep
etit
ions
0.58
0.15
0.55
0.10
0.35
0.29
0.38
0.07
BSL
1.00
0Sp
oken
Eng
lish
1.00
0SS
E1.
000
Intr
usio
ns0.
120.
110.
090.
070.
840.
200.
150.
05B
SL1.
000
Spok
enE
nglis
h1.
000
SSE
∗0.
006
Uni
ntel
ligib
le0.
210.
070.
120.
040.
002
0.13
0.09
0.03
BSL
0.76
9Sp
oken
Eng
lish
1.00
0SS
E1.
000
Cor
rect
resp
onse
spe
rqu
adra
nt0–
15s
5.58
0.41
6.67
0.27
5.12
0.78
7.39
0.20
BSL
∗∗0.
001
Spok
enE
nglis
h0.
198
SSE
∗0.
031
15–3
0s
3.58
0.38
3.53
0.25
3.02
0.73
4.15
0.19
BSL
1.00
0Sp
oken
Eng
lish
0.29
6SS
E0.
815
30–4
5s
2.51
0.31
2.62
0.20
2.71
0.59
3.08
0.15
BSL
0.62
5Sp
oken
Eng
lish
0.43
9SS
E1.
000
45–6
0s
1.74
0.34
2.30
0.22
0.68
0.64
2.95
0.17
BSL
∗∗0.
008
Spok
enE
nglis
h0.
106
SSE
∗∗0.
004
Clu
ster
sN
umbe
rof
swit
ches
5.69
0.51
5.37
0.33
4.99
0.98
6.31
0.25
BSL
1.00
0Sp
oken
Eng
lish
0.14
8SS
E1.
000
Num
ber
ofcl
uste
rs3.
950.
323.
940.
213.
370.
614.
850.
16B
SL0.
078
Spok
enE
nglis
h∗∗
0.00
4SS
E0.
121
Ave
rage
size
ofcl
uste
rs3.
200.
273.
870.
183.
100.
523.
380.
13B
SL1.
000
Spok
enE
nglis
h0.
160
SSE
1.00
0
Not
es:B
SL,B
riti
shSi
gnLa
ngua
ge;S
SE,S
ign-
Supp
orte
dE
nglis
h;e.
m.m
ean,
esti
mat
edm
argi
nalm
ean;
e.SE
,est
imat
edst
anda
rder
ror.
∗ p<
.05,
∗∗p
<.0
1,∗∗
∗ p<
.001
.

Semantic fluency in deaf children 9
Table 4. Semantic fluency results for the deaf native and non-native users of BSL
Deaf BSL
Native Non-native
Variables e.m. mean e. SE e.m. mean e. SE F p
Total number of responses 16.93 1.15 13.88 0.74 4.545∗ 0.043Number of correct responses 15.93 1.11 12.98 0.72 4.573∗ 0.042Different error types Repetitions 0.72 0.31 0.53 0.20 0.256 0.617
Intrusions 0.19 0.16 0.12 0.10 0.124 0.728Unintelligible 0.10 0.15 0.25 0.10 0.637 0.432
Correct responses per quadrant 0–15 s 6.41 0.62 5.47 0.40 1.501 0.23115–30 s 3.91 0.63 3.59 0.41 0.160 0.69230–45 s 3.32 0.45 2.26 0.29 3.595 0.06945–60 s 2.22 0.51 1.65 0.33 0.808 0.377
Clusters Number of switches 5.80 0.90 5.89 0.58 0.007 0.932Number of clusters 4.96 0.53 3.67 0.34 3.825 0.061Average size of clusters 3.75 0.48 2.94 0.31 1.928 0.117
Note: ∗p < .05, ∗∗p < .01, ∗∗∗p < .001.
were not as well matched for age to the hearing groupas the entire deaf group had been (table 1), we par-tialled out age in an analysis of covariance (ANCOVA).Table 3 therefore reports estimated marginal means andestimated standard error. Pairwise comparisons (Bonfer-roni corrected) were also computed comparing each ofthe deaf groups with one another and with the hear-ing group. These comparisons revealed no significantdifferences between any of the deaf groups on any ofthe variables (all ps > .05), and for the sake of keep-ing table 6 as simple as possible, those null results arenot reported. Therefore, while hearing status predictsperformance on the fluency task (table 6), the type oflanguage used by the deaf children does not.
In table 4 we report the data for the native andnon-native signers. Again, because the groups were
not well matched for age, we partialled out age in anANCOVA and report estimated marginal means andestimated standard error. The data must be treatedwith caution because of the small number of nativesigners (n = 9), but findings indicate that the nativesigners produced more items overall and more cor-rect items. No other comparisons reached statisticalsignificance.
Next we consider the nature of the lexical items pro-duced by the deaf group as a whole and by the hearinggroup. The deaf children produced 196 different typesof animals, and the hearing children produced 297.Figures 2 and 3 show the responses which were pro-duced by 33% or more of the children in each group(following Marshall et al. 2013). For each group thereare 10 such responses, and of those, nine were produced
8178
64 6458 57
49
3835 34
0
10
20
30
40
50
60
70
80
90
100
% o
f dea
f chi
ldre
n w
hopr
oduc
ed th
is re
spon
se
Figure 2. Most frequent responses from the deaf group (all responses given by 33% or more of the group).

10 C. R. Marshall et al.
71 6964
60
41 4136 36 36 36
0
10
20
30
40
50
60
70
80
90
100
% o
f hea
ring
child
ren
who
prod
uced
this
resp
onse
Figure 3. Most frequent responses from the hearing group (all responses given by 33% or more of the group).
by both groups (‘cat’, ‘dog’, ‘elephant’, ‘fish’, ‘giraffe’,‘lion’, ‘monkey’, ‘pig’, ‘tiger’). A positive association be-tween lexical frequency and the frequency of responsesin the fluency task would be predicted, but is rarelyinvestigated. In order to determine whether a lexicalfrequency effect exists in deaf children’s responses andis similar to magnitude to any effect found in hear-ing children, the frequency of the full set of responsesin the two groups was correlated with the log of theirlexical frequencies as reported in the CELEX database(Baayen et al. 1995). For both groups, a moderate ef-fect of lexical frequency was found that was very similarin magnitude for the deaf children, rs(155) = .522,p < .001, and for the hearing children, rs(208) = .554,p < .001.
Finally in this part of the results section, table 5presents the percentile scores for the deaf children’snumber of correct responses, broken down by 2-yearage bands. The aim of table 5 is to provide nor-mative data should clinicians or researchers wish touse the semantic fluency test with deaf children inthe 6–11 age group. As there were no significantdifferences in performance among the deaf sub-groups, normative data for the whole deaf group arereported.
Relationships between semantic fluency, expressivevocabulary and executive function
In this second part of the results section, the relation-ships between semantic fluency and the EOWPVT andEF tasks are investigated. The group comparisons be-tween the deaf and hearing groups for the EOWPVTand EF tasks were reported in Botting et al. (2016). Tosummarize the results of that paper, the hearing groupsignificantly outperformed the deaf group on all mea-sures except for design fluency.1
Table 6 presents the partial correlations (control-ling for age) between the number of correct items pro-duced in the semantic fluency task, and the scores forthe individual EF tasks and the EOWPVT. Given thegroup differences in T-scores on the Wechsler Abbrevi-ated Scale of Intelligence (WASI) matrix reasoning taskidentified in the Participants section, partial correlationsbetween WASI scores and semantic fluency are also pre-sented. Correlations are reported for the deaf and hear-ing groups separately, and for all the children combined.EOWPVT, the two working memory tasks (Odd OneOut and Backwards Spans) and the Design Fluency taskcorrelated most strongly with semantic fluency in bothgroups separately and the two groups combined. Towerof London performance correlated significantly with
Table 5. Age band percentile scoresa for deaf participants’ semantic fluency
Percentile scores
Age band (years) N Mean (SD) Minimum–maximum 1st 2nd 5th 10th 20th 30th 40th 50th 60th 70th 80th 90th 95th
6–7 37 11.65 (4.16) 4–23 4 4 6 7 8 9 10 11 12 13 15 17 218–9 39 14.87 (4.51) 7–25 7 7 7 8 11 12 13 16 17 17 18 21 23
10–11 30 16.93 (6.54) 6–29 6 6 8 9 12 13 14 15 17 20 24 28 29
Note: aScores are rounded to the nearest whole number.

Semantic fluency in deaf children 11
Table 6. Partial correlations (controlling for age) between semantic fluency and each EF task or vocabulary task
Deaf Hearing All children
r p r p r p
Working memory: Odd One Out Span .443∗∗∗ < .001 .450∗∗∗ < .001 .500∗∗∗ < .001Working memory: Backwards Spatial Span .409∗∗∗ < .001 .254∗ .013 .400∗∗∗ < .001Non-verbal fluency: Design Fluency task .383∗∗∗ < .001 .421∗∗∗ < .001 .474∗∗∗ < .001Cognitive flexibility: Colour Trails Test −.169 .103 −.002 .986 –.167∗ .021Planning: Tower of London –.404∗∗∗ < .001 –.174 .092 –.327∗∗∗ < .001Inhibition: Simon Task .097 .353 .048 .645 .126 .083Expressive vocabulary: EOWPVT .565∗∗∗ < .001 .493∗∗∗ < .001 .592∗∗∗ < .001WASI: matrix reasoning .321∗∗ .001 .360∗∗∗ < .001 .376∗∗∗ < .001
Notes: EOWPVT, Expressive One-Word Picture Vocabulary Test (EOWPVT); WASI, Wechsler Abbreviated Scale of Intelligence.∗p < .05, ∗∗p < .01, ∗∗∗p < .001.
semantic fluency in the deaf group but not for the hear-ing group. WASI matrix reasoning score correlated sig-nificantly with semantic fluency in both groups and thetwo groups combined.
In order to investigate further the relationship be-tween these variables, z-scores for the EF tasks (whichcorrelated sufficiently highly with one another) were cal-culated and combined into a single, composite, score,as was done in the study by Botting et al. (2016). Re-gression analyses were then carried out with semanticfluency scores as the dependent variable, and age, ma-trix reasoning, vocabulary score, the EF composite score,and group (deaf or hearing) as the predictors. Age andmatrix reasoning scores were entered simultaneously inthe first block, then vocabulary and EF composite scoressimultaneously in the second block, and finally group inthe third block.
The model with just age and matrix reasoning wassignificant, F(2,188) = 33.053, p < .001. This model ac-counted for 26.2% of the variance in semantic fluencyscores. Both variables were significant predictors; age:Beta = .426, t = 6.685, p < .001; matrix reasoning:Beta = .359, t = 5.635, p < .001. Adding vocabu-lary and EF composite scores to the model explained
an additional 23.4% of the variance, F(4,188) = 45.354,p < .001. Both vocabulary and EF composite scoreswere significant predictors in this model; vocabulary:Beta = .381, t = 5.272, p < .001; EF composite:Beta = .314, t = 3.982, p < .001. The third modelwith group added, however, did not explain any addi-tional variance (0.0%) in semantic fluency scores.
Repeating the same regression analysis on the deafand hearing group separately revealed exactly the samepattern. The results demonstrate that, alongside age andnon-verbal reasoning skills, EF and vocabulary scoreswere both unique and significant predictors of semanticfluency scores in both groups.
Semantic fluency data at time 2
The majority of the participants (70 deaf and 74 hear-ing) were retested on the semantic fluency task nearly2 years later. For this analysis, the data for the deaf chil-dren were not subgrouped by language use (BSL, spokenEnglish or SSE) because of its lack of effect on semanticfluency at time 1. Figure 4 presents the mean number ofcorrect responses for each group at time 1 and time 2.A 2 × 2 ANOVA, with time (Time 1, Time 2) as the
0
5
10
15
20
25
30
2emiT1emiT
Num
ber o
f cor
rect
resp
onse
s
Deaf Hearing
Figure 4. Correct responses on the semantic fluency task at times 1 and 2 (vertical bars indicate standard deviations).

12 C. R. Marshall et al.
within-subjects factor and group (Deaf, Hearing) as thebetween-subjects factor revealed a significant effect oftime, F(1,142) = 68.208, p < .001, partial eta squared =.324 (a large effect size; Cohen 1988), and of group,F(1,142) = 12.470, p = .001, partial eta squared = .081(a medium effect size). These analyses indicate that chil-dren produced significantly more correct responses attime 2 compared with time 1, and that the hearing chil-dren produced significantly more correct responses thanthe deaf children. The interaction between time andgroup was not significant, F(1,142) = 2.440, p = .120,partial eta squared = .017 (a small effect size), indicat-ing that the gap between the two groups did not changeover time.
Discussion
The aims of this study were to investigate semantic flu-ency in deaf children aged 6–11 by comparing deaf andhearing children’s lexical retrieval patterns, and by com-paring the responses of deaf children who used BSLwith those who used spoken English and SSE. We in-vestigated how semantic fluency performance is relatedto children’s expressive vocabulary and EF skills, and wealso tested the semantic fluency of a subset of the par-ticipants nearly 2 years later, in order to investigate howmuch progress they had made in that period.
The semantic fluency category used in this study, asin many others, was ‘animals’. Deaf children producedfewer responses than hearing children of the same age,and this was the case for all four quadrants of the minute.A further difference was that deaf children drew on asmaller set of lexical items than hearing children. How-ever, there were also similarities: neither group producedmany errors (repetitions, intrusions, and unintelligibleresponses), average cluster size did not differ signifi-cantly between the two groups, both groups shared nineof their ten most frequent responses (cat, dog, elephant,fish, giraffe, lion, monkey, pig, tiger), and both groupsshowed a significant correlation between response fre-quency and the log of lexical frequencies reported inthe CELEX database (Baayen et al. 1995). For bothgroups, productivity was driven by cluster number andthe number of switches rather than cluster size.
Our deaf group was heterogeneous with respect tolanguage experience, and we sought to understand theeffect of language mode on semantic fluency perfor-mance by comparing the performance of children whoresponded using BSL, spoken English and SSE. Thesample size of the group who used SSE was small,so their results should be treated with caution. Nev-ertheless, whether children used BSL, spoken English orSSE seemed to have no influence on their semantic flu-ency performance: all produced fewer responses than thehearing children, but did not differ from one another.
Within the signing group, however, native signers (i.e.,children who had been exposed to BSL from birth) pro-duced more items than non-native signers (i.e., childrenwho had only been exposed to BSL later in childhood).Hence although the type of language used does notappear to influence fluency performance, language pro-ficiency does. Again, these results must be treated withcaution because of the small sample size of the nativesigner group. Nevertheless, that language proficiency af-fects fluency performance is consistent with the resultsof our finding that expressive vocabulary in either spo-ken English or BSL is a significant predictor of semanticfluency scores. Our data suggest that deaf children gen-erate fewer items than hearing children partly becausethey have a smaller pool of items to draw from in theirlexicon. Furthermore, we have also shown that semanticfluency performance is related to a composite of EF tasksthat included the Design Fluency task, Working Mem-ory task and the Tower of London. Previous work onhearing populations has shown that semantic fluency re-quires both vocabulary and EFs (e.g., Ardila et al. 2006,Bose et al. 2017), and our data directly support the samefinding for deaf children, indicating that semantic flu-ency is measuring equivalent cognitive abilities and hasconstruct validity across both groups.
Our final analysis compared semantic fluency per-formance in a subset of children at two different testingtimes, 21 months apart. Both groups produced moreresponses at time 2 compared with time 1, showingdevelopment over the course of the study. There wasno interaction between group and time, indicating thatwhile the deaf children did not catch up with the hearingchildren during that time, neither did the gap betweenthem widen. Both groups showed a similar rate of de-velopment on the task but the deaf group had a lowerstarting point.
Our results are consistent with the few studies thathave previously investigated semantic fluency in deafchildren. As in the study by Wechsler-Kashi et al. (2014)of deaf children with CIs, deaf children in our studyproduced fewer items compared with hearing childrenof the same age. With respect to deaf children whoused sign, our results replicate the findings of Marshallet al. (2013) and Beal-Alvarez and Figueroa (2017) thatthe same ‘cognitive signatures’ that characterize chil-dren’s semantic fluency responses in spoken languages—namely clustering of responses, the slowdown in re-sponse rate during the course of the minute, and theproduction of prototypical items—also characterize re-sponses in a signed language. More cross-linguistic workon other signed languages is needed, but studies of deafadults who use ASL (Beal-Alvarez and Figueroa 2017),Portuguese Sign Language (Moita and Nunes 2017) andGreek Sign Language (Vletsi et al. 2012) reveal similarpatterns of responses to those found with deaf adults

Semantic fluency in deaf children 13
who use BSL (Marshall et al. 2014), indicating that, justas the semantic fluency task has utility across differentspoken languages (Ardila et al. 2006), so it does acrosssigned languages.
Our study provides comprehensive data on deafchildren’s performance on one specific semantic task—animal fluency—from the largest sample to date, andis the first to consider development on this task overtime using a longitudinal paradigm. Limitations are thesmall numbers of children who were native users of BSLand who used SSE, and the use of just one semanticcategory (albeit, the most widely used category in se-mantic fluency research, ‘animals’). Future research isneeded to confirm the patterns of responses and to pro-vide normative data for other semantic categories. Theresults should be treated with appropriate caution be-cause the language-learning opportunities open to deafchildren in the UK are changing rapidly: access to uni-versal newborn hearing screening and advances in CItechnology are resulting in improved access to spokenlanguage, but the increase in deaf children being ed-ucated in mainstream schools with no specialist pro-vision and no exposure to skilled signers means thatthey have reduced knowledge of sign language (Consor-tium for Research in Deaf Education (CRIDE) 2016).This means that the population of deaf children whoparticipated in our study might not be representativeof the deaf children in UK primary schools in thefuture.
Conclusions
Our findings confirm that semantic fluency is struc-tured in a similar way across spoken and sign languages,and that hearing and deaf children approach the taskusing the same strategies. This means that a tool thathas long been used with the hearing population can beused experimentally to investigate lexical organizationin deaf children, and clinically using our normative datato investigate impairments in their language or EFs. Afurther strength of this study is that it shows that se-mantic fluency has equivalent validity across groups ofdeaf children using different forms of spoken and signedcommunication, thus enabling simpler and more confi-dent assessment of semantic fluency in this highly het-erogeneous population.
Acknowledgements
This research was funded by the Economic and Social ResearchCouncil (ESRC), Deafness, Cognition and Language Research Cen-tre (DCAL) (grant number RES-620-28-0002). Ambra Fastelli wassupported by an Erasmus + traineeship at the UCL Institute ofEducation. The authors are very grateful to all participating chil-dren, parents and schools. They also thank Tanya Denmark, MischaCooke and Kathryn Mason for their support with the data collection.
Declaration of interest: The authors report no conflicts of interest.The authors alone are responsible for the content and writing of thepaper.
Note
1. As explained previously, the sample does not overlap exactly withthe sample included in Botting et al. (2016), but the same pat-tern of EF and vocabulary results that they report holds for thissample.
References
ANDERSON, D. and REILLY, J., 2002, The MacArthur Communica-tive Development Inventory: normative data for AmericanSign Language. Journal of Deaf Studies and Deaf Education, 7,83–106.
ARDILA, A., OSTROSKY-SOLIS, F. and BERNAL, B., 2006, Cognitivetesting toward the future: the example of semantic verbal flu-ency (animals). International Journal of Psychology, 41, 324–332.
BAAYEN, R., PIEPENBROCK, R. and GULIKERS, L., 1995, CELEX2LDC96L14. Web Download (Philadelphia, PA: LinguisticData Consortium).
BEAL-ALVAREZ, J. S. and FIGUEROA, D. M., 2017, Generationof signs within semantic and phonological categories: datafrom deaf adults and children who use American SignLanguage. Journal of Deaf Studies and Deaf Education, 22,219–232.
BOSE, A., WOOD, R. and KIRAN, S., 2017, Semantic fluency inaphasia: clustering and switching in the course of 1 minute.International Journal of Language and Communication Disor-ders, 52, 334–345.
BOTTING, N., JONES, A., MARSHALL, C. R., DENMARK, T.,ATKINSON, J. and MORGAN, G., 2016, Nonverbal ex-ecutive function is mediated by language: a study ofdeaf and hearing children. Child Development. https://doi.org/10.1111/cdev.12659
BROWNELL, R. (2000). Expressive One Word Picture Vocabulary Test(3rd ed.). Novato, CA: Academic Therapy.
COHEN, J., 1988, Statistical Power Analysis for the Behavioral Sciences,2nd edn (Hillsdale, NJ: Erlbaum).
CONSORTIUM FOR RESEARCH IN DEAF EDUCATION (CRIDE), 2016,CRIDE Report on 2015 Survey on Educational Provision forDeaf Children (available at: www.ndcs.org.uk/CRIDE).
CONVERTINO, C., BORGNA, G., MARSCHARK, M. and DURKIN, A.,2014, Word and world knowledge among deaf learners withand without cochlear implants. Journal of Deaf Studies andDeaf Education, 19, 471–483.
CONVERTINO, C., MARSCHARK, M., SAPERE, P., SARCHET, T. andZUPAN, M., 2009, Predicting academic success among deafcollege students. Journal of Deaf Studies and Deaf Education,14, 324–343.
DUFF, F., REEN, G., PLUNKETT, K. and NATION, K., 2015, Doinfant vocabulary skills predict school-age language and liter-acy outcomes? Journal of Child Psychology and Psychiatry, 56,848–856.
FENSON, L., DALE, P., REZNICK, S., BATES, E., THAL, D., PETHICK,S., TOMASELLO, M., MERVIS, C. and STILES, J., 1994,Variability in early communicative development. Monographsof the Society for Research in Child Development, 59(5),1–185.

14 C. R. Marshall et al.
FIGUERAS, B., EDWARDS, L. and LANGDON, D., 2008, Executivefunction and language in deaf children. Journal of Deaf Studiesand Deaf Education, 13, 362–377.
HENRY, L. A., 2001, How does the severity of a learning disabilityaffect working memory performance? Memory, 9, 233–247.
HERMANS, D., KNOORS, H., ORMEL, E. and VERHOEVEN, L., 2008,The relationship between the reading and signing skills ofdeaf children in bilingual education programs. Journal of DeafStudies and Deaf Education, 13, 518–530.
KENETT, Y. N., WECHSLER-KASHI, D., KENETT, D. Y., SCHWARTZ,R. G., BEN-JACOB, E. and FAUST, M., 2013, Semantic orga-nization in children with cochlear implants: computationalanalysis of verbal fluency. Frontiers in Psychology, 4, 1–11.https://doi.org/10.3389/fpsyg.2013.00543
KORKMAN, M., KIRK, U. and KEMP, S., 1998, NEPSY: A Develop-mental Neuropsychological Assessment (San Antonio, TX: Psy-chological Corporation).
KYLE, F. E., CAMPBELL, R. and MACSWEENEY, M., 2016, The relativecontributions of speechreading and vocabulary to deaf andhearing children’s reading ability. Research in DevelopmentalDisabilities, 48, 13–24.
LEE, J., 2011, Size matters: early vocabulary as a predictor of languageand literacy competence. Applied Psycholinguistics, 32, 69–92.
LLORENTE, A. M., WILLIAMS, J., SATZ, P. and D’ELIA, L., 2003,Children’s Color Trails Test (CCTT) (Odessa, FL: PsychologicalAssessment Resources).
LU, J., JONES, A. and MORGAN, G., 2016, The impact of inputquality on early sign development in native and non-nativelanguage learners. Journal of Child Language, 43(3), 537–552.
LUND, E., 2016, Vocabulary knowledge of children with cochlearimplants: a meta-analysis. Journal of Deaf Studies and DeafEducation, 21, 107–121.
MARSHALL, C. R., ROWLEY, K. and ATKINSON, J., 2014, Modality-dependent and -independent factors in the organization ofthe signed language lexicon: insights from semantic andphonological fluency tasks in BSL. Journal of PsycholinguisticResearch, 43, 587–610.
MARSHALL, C. R., ROWLEY, K., MASON, K., HERMAN, R. andMORGAN, G., 2013, Lexical organisation in deaf childrenwho use British Sign Language: evidence from a semanticfluency task. Journal of Child Language, 40, 193–220.
MAYBERRY, R. I. and SQUIRES, B., 2006, Sign language: acquisi-tion. In K. Brown (ed.-in-chief ), Encyclopedia of Language& Linguistics, Second Edition (Oxford: Elsevier), vol. 11,pp. 291–296.
MITCHELL, R. E. and KARCHMER, M. A., 2004, Chasing the mythicalten percent: parental hearing status of deaf and hard of hearingstudents in the United States. Sign Language Studies, 4, 138–163.
MOITA, M. and NUNES, M. V., 2017, Disentangling linguisticmodality effects in semantic processing. Journal of Psycholin-guistic Research, 46, 311–328.
MUELLER, S. T. and PIPER, B. J. (2014). The Psychology ExperimentBuilding Language (PEBL) and PEBL Test Battery. Journalof Neuroscience Methods, 222, 250–259.
NEWPORT, E. L. and MEIER, R., 1985, The acquisition of AmericanSign Language. In D. I. Slobin (ed.), The Crosslinguistic Study
of Language Acquisition. 1: The Data (Hillsdale, NJ: LawrenceErlbaum Associates), pp. 881–938.
PAUL, R., HERNANDEZ, R., TAYLOR, L. and JOHNSON, K.,1997, Narrative development in late talkers: early schoolage. Journal of Speech and Hearing Research, 39, 1295–1303.
RINALDI, P., CASELLI, M. C., DI RENZO, A., GULLI, T. and VOLTERRA,V., 2014, Sign vocabulary in deaf toddlers exposed to sign lan-guage since birth. Journal of Deaf Studies and Deaf Education,19, 303–318.
ROSEN, V. M. and ENGLE, R. W., 1997, The role of working mem-ory capacity in retrieval. Journal of Experimental Psychology:General, 126, 211–227.
SCHICK, B. and HOFFMEISTER, R., 2001, ASL skills in deaf childrenof deaf parents and of hearing parents. Paper presented atthe Society for Research in Child Development InternationalConference, Minneapolis, MN, USA.
SHALLICE, T., 1982, Specific impairments of planning. PhilosophicalTransactions of the Royal Society of London B: Biological Sciences,298(1089), 199–209.
SIMON, J. R., 1990, The effects of an irrelevant directional cue onhuman information processing. Advances in Psychology, 65,31–86.
TROYER, A. K., MOSCOVITCH, M. and WINOCUR, G., 1997, Clus-tering and switching as two components of verbal fluency:evidence from younger and older healthy adults. Neuropsy-chology, 11, 138–146.
VACCARI, C. and MARSCHARK, M., 1997, Communication betweenparents and deaf children: implications for social–emotionaldevelopment. Journal of Child Psychology and Psychiatry, 38,793–801.
VAN ELDIK, T., TREFFERS, P., WEERMAN, J. and VERHULST, F., 2004,Mental health problems of deaf Dutch children as indi-cated by parents’ responses to the Child Behavior Checklist.American Annals of the Deaf, 148, 390–395.
VLETSI, E., STAVRAKAKI, S., LIAPI, I. H., MARSHALL, C. R. andGROUISOS, G., 2012, Assessing verbal fluency in Greek SignLanguage. In Proceedings of the 10th International Confer-ence of Greek Linguistics, Komotini, Greece, 1–4 September2011.
WECHSLER, D., 1999, Wechsler Abbreviated Scale of Intelligence(WASI) (San Antonio, TX: Psychological Corporation).
WECHSLER, D. and NAGLIERI, J. A., 2006, Wechsler Nonverbal Scaleof Ability (WNV) (San Antonio, TX: Pearson).
WECHSLER-KASHI, D., SCHWARTZ, R. G. and CLEARY, M., 2014,Picture naming and verbal fluency in children with cochlearimplants. Journal of Speech, Language, and Hearing Research,57, 1870–1882.
YOSHINAGA-ITANO, C., BACA, R. and SEDEY, A., 2010, Describingthe trajectory of language development in the presence of se-vere and profound hearing loss: a closer look at children withcochlear implants versus hearing aids. Otology and Neurotol-ogy, 31, 1268–1274.
ZIV, M., MOST, T. and COHEN, S., 2013, Understanding of emo-tions and false beliefs among hearing children versus deafchildren. Journal of Deaf Studies and Deaf Education, 18,161–174.