Embed Size (px)
Citation preview
Civil serviCe statistiCsdeCember 2016

Civil service statistics | i
table of Contents
introduction 1
Part i - Overview of the report 2
» General 2 » Civil Servants by Position Category and Position Level 2 » Civil Servants by Employment Type 3 » Civil Servants by Agency 3 » Civil Servants by Dzongkhag 3 » Civil Servants by Major Occupational Groups 4 » Civil Servants by Gender 4 » Civil Servants by Age Groups 4 » Recruitment 5 » Promotion 5 » Separation 5 » Regular Civil Servants by Qualification 5 » Long-term Training 5 » Secondment 6 » Extraordinary Leave 6 » Expatriates and Volunteers 6
Part ii – detailed statistics 7
General 7Table 1: Summary 7Table 2: Proportion of Civil Servants to Population 7Table 3: Civil Servants by Position Category & Years of Service 8Table 4: Royal Civil Service Award 2016 – Summary 8Graph 1: Civil Service Staffing Trend from 1989 to 2016 9
Civil servants by Position Category and Position level Graph 2: Civil Servants by Position Category in Percentage 10Graph 3: Civil Servants by Position Category from 2012 to 2016 10
| Royal Civil Service Commissionii
Civil servants by employment typeTable 5: Civil Servants by Position Category and Employment Type from 2012 to 2016 11Table 6: Civil Servants by Working Agency and Employment Type 13Table 7: Civil Servants by Parent Agency and Employment Type 16
Civil servants by agencyTable 8: Civil Servants by Working Agency and Position Level 18Table 9: Civil Servants by Parent Agency and Position Level 22Table 10: Contract Employees by Working Agency and Position Category 26Table 11: Civil Service Growth by Agency 28Table 12: Progressive Growth of Civil Service strength by Parent Agency 30
Civil servants by dzongkhags locationTable 13: Civil Servants under Dzongkhag/Thromde Adm. by Position Category 34Table 14: Civil Servants under Dzongkhag & Thromde Adm. by Position Level 35Table 15: Civil Servants by Location and Position Category 36Table 16: Civil Servants by Dzongkhag/Thromde Adm. and Location 37Table 17: Civil Servants by Dzongkhag/Thromde Adm. and by MOG 38Table 18: Increase in Civil Servants by Location 39
Civil servants by major Occupational GroupsGraph 4: Civil Servants by Major Occupational Groups 39Table 19: Civil Servants by Major Occupational Groups and Position Category 40Table 20: Civil Servants by MOG/Sub Groups by Position Level 42Table 21: Progressive Growth of Civil Service strength by Occupational Groups 48
Civil servants by GenderGraph 5: Percentage of Civil Servants within Position Category by Gender 49Graph 6: Female Civil Servants from 2001 to 2016 49Table 22: Civil Servants by Position Level and Gender 50Table 23: Civil Servants by Major Occupational Groups and Gender 52
Civil service statistics | iii
Civil servants by age Groups Table 24: Civil Servants by Age Groups and Position Level 54Graph 7: Civil Servants by Age 55Table 25: Civil Servants by Gender and Age Groups 56Graph 8: Distribution of Civil Servants by Age and Gender 56
recruitmentTable 26: Civil Servants Recruited by Parent Agency from Jan to Dec 2016 57Table 27: Civil Servants Recruited by MOGs from Jan to Dec 2016 58Table 28: Civil Servants Recruited by Position Level from 2012 to 2016 59Table 29: Civil Servants Recruited by Position level and Gender 60Graph 9: Civil Servants Recruited by Position Category 60
PromotionTable 30: Civil Servants Promoted from 2012 to 2016 61
separationTable 31: Civil Servants Separated by Parent Agency from Jan to Dec 2016 62Table 32: Civil Servants Separated by MOG from Jan to Dec 2016 64Table 33: Civil Servants Separated by Category of Separation 65Table 34: Civil Servants Separated by Position Level from 2012 to 2016 66Table 35: Civil Servants Separated by Position Level and Gender 67Graph 10: Trends of Civil Servants Recruited, Separated and Net Increase 68Table 36: Projection of Superannuation of Regular Civil Servants 69
Regular Civil Servants by Qualification Table 37: Qualification of Regular Civil Servants 70Graph 11: Qualification of Regular Civil Servants 71Table 38: Civil Servants by Parent Agency and Qualification 72Table 39: Civil Servants meeting the Minimum Qualification Criteria 74
| Royal Civil Service Commissioniv
long-term trainingTable 40: Long-Term Training implementation status from Jan to Dec 2016 75Table 41: Long-Term Training by Mode of Study 75Table 42: Long-Term Training implemented by Country from Jan to Dec. 2016 76Table 43: Civil Servants undergoing Long Term Training as on 31 Dec 2016 77Graph 12: Long-Term Training by Type of Funding 78Graph 13: Undergoing Long-Term Training by Parent Agency through Private Funding 78Table 44: Long Term Training Working Agency 79Table 45: Long Term Training implementation by Source of Funding 81Table 46: Year-wise Long Term Training Availed by Civil Servants 83Table 47: Undergraduate Scholarship by Country in 2017 84
secondmentTable 48: Civil Servants on Secondment by Working Agency 85
extra Ordinary leaveTable 49: Civil Servants on Extraordinary Leave by Position Level and Gender 86Graph 14: Civil Servants on Extraordinary Leave by MOGs and Gender 86Table 50: Civil Servants on Extraordinary Leave by Working Agency and Gender 87
expatriates and volunteers Table 51: Expatriates by Parent Agency and Employment Type 88Table 52: International Volunteers by Parent Agency 89
Part iii – spotlight on super structure
introduction 90Graph 15: Percentage of Civil Servants within Super Structure by Gender 91Table 53: Civil Servants by Age Groups and Super Structure 92Table 54: Civil Servants by Super Structure and Position Category 93Table 55: Civil Servants by Super Structure and Position Level 95Table 56: Civil Servants by Working Agency and Super Structure 96Table 57: Civil Servants by Parent Agency and Super Structure 99
Civil service statistics | 1
introduction
This Report presents an overview of the Civil Service statistics as on 31st December 2016. It includes information on civil servants recruited as regular and contract under Judiciary, Legislative, Constitutional (except Election Commission of Bhutan), Ministries, Autonomous Agencies, Dzongkhags, Thromdes and civil servants seconded to Non-civil Service Agencies.
The General Service Personnel (GSP) and Essential Service Personnel (ESP) are considered outside the Civil Service, and therefore only the cumulative figures are made available.
The information is organised and presented in 57 tables and 15 graphs. The number of civil servants is disaggregated by Position Category and Position Level, and Major Occupational Groups and Sub-groups which reflects the overview of the Civil Service structure.
The number by Parent Agency and Working Agency gives an overview of staffing strength and pattern at agency level. The number of civil servants by Dzongkhag Administration and Thromde provides an assessment of the extent in support of decentralization.
The Report also contains information on Human Resource actions including recruitment, promotion and separation. The trend on recruitment and separation provides an overview of the growth in Civil Service. The information on civil servants by level of qualification provides an assessment of the Human Resource capacity. The percentage of civil servants meeting the qualification requirement as per the Position Directory of the Bhutan Civil Service Rules and Regulations (BCSR) 2012 provides a reflection of the level of ‘competence’ of the Civil Service.
The long-term training implementation status provides information on progress that has been made till 31st December 2016. The information on civil servants pursuing higher education by type of training and by country were also reported.
The information on civil servants by gender provides a degree of gender balance in the Civil Service while the information by age groups provides an assessment of distribution of civil servants.
| Royal Civil Service Commission2
Part i – Overview of the report
General
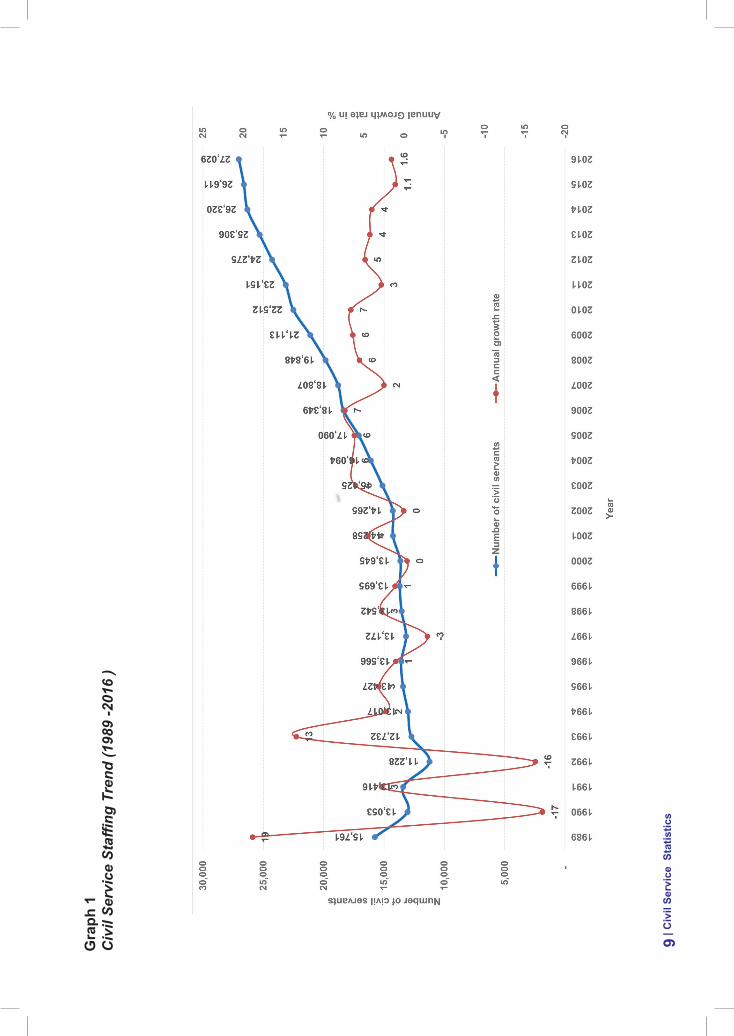
The strength of the Civil Service as on 31st December 2016 was 27,029 comprising of 25,161 regular civil servants and 1,868 on contract. Most civil servants on contract are in teaching profession.
The cumulative growth in the Civil Service strength as on 31st December 2016 compared to the strength on 31st December 2008 is 36.18%. The annual growth for the year 2016 is 1.6% as compared to 1.1% in 2015, 4.00% in 2014, 4.25% in 2013, 4.86% in 2012, 2.84% in 2011 and 6.63% in 2010.
The civil servants under the Dzongkhag and Thromde Administrations had steadily increased from 54.63% in December 2010 to 57.77% in 2011 and to 57.11% in 2012. It declined to 55.77% in 2013 and increased to 57.12% in 2014, 57.14% in 2015 and 58.14% in 2016 (Table 14).
As on 31st December 2016, the number of civil servants constituted 3.44% of the total population of the country (Table 2). The ratio of civil servants strength to the total population was 1:29. Female Civil Servants constituted 35.46% of the total Civil Service strength (Table 22), an increase of 3.87% from 2015. Expatriate personnel constituted 1.42% (Table 51).
During January to December 2016, a total of 1,118 civil servants were recruited, 4, 717 promoted, 656 separated. There is a net increase of 462 Civil Servants (Graph 10). The median age in the Civil Service is 34 years. About 75% of the civil servants are below the age of 40 years (Graph 7).
Civil servants by Position Category and Position level
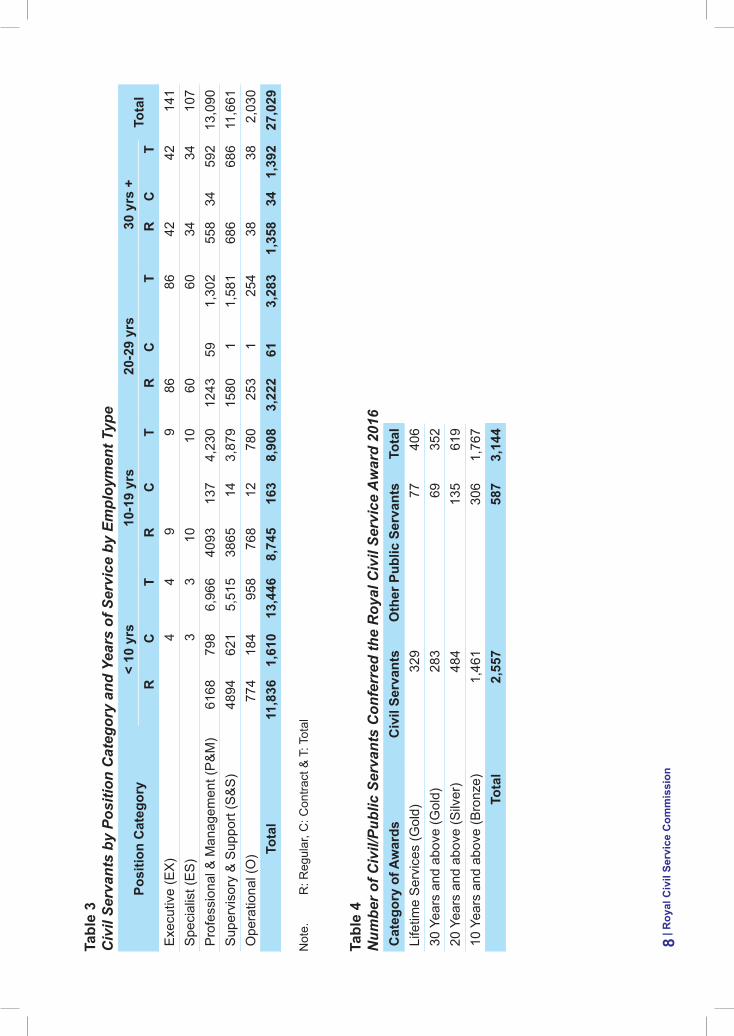
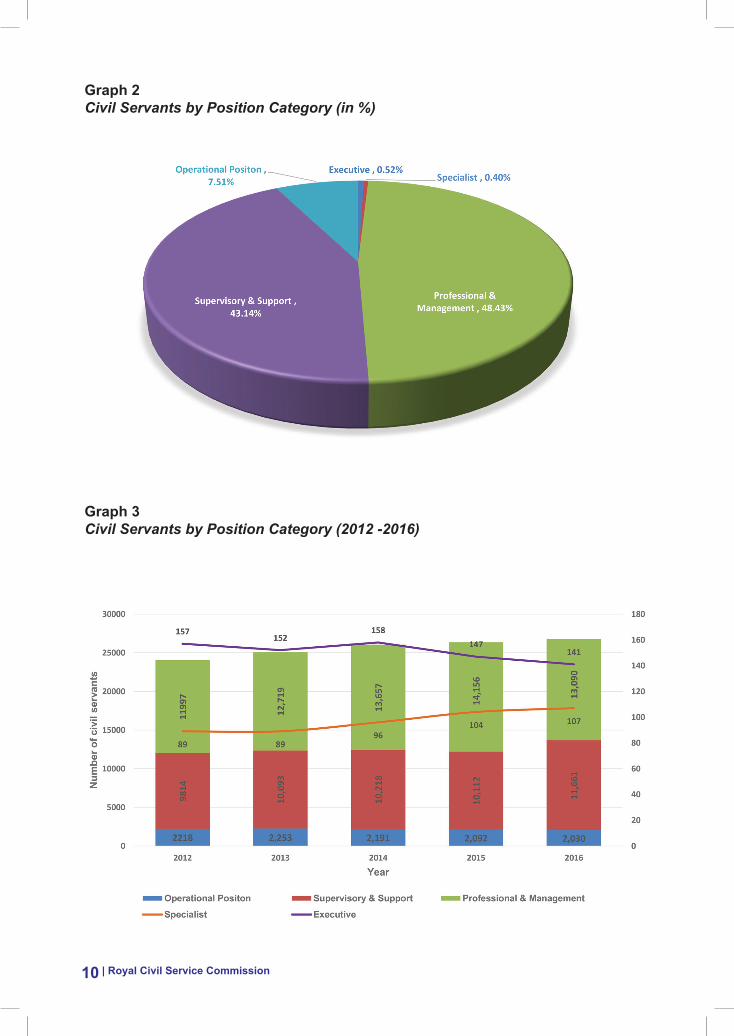
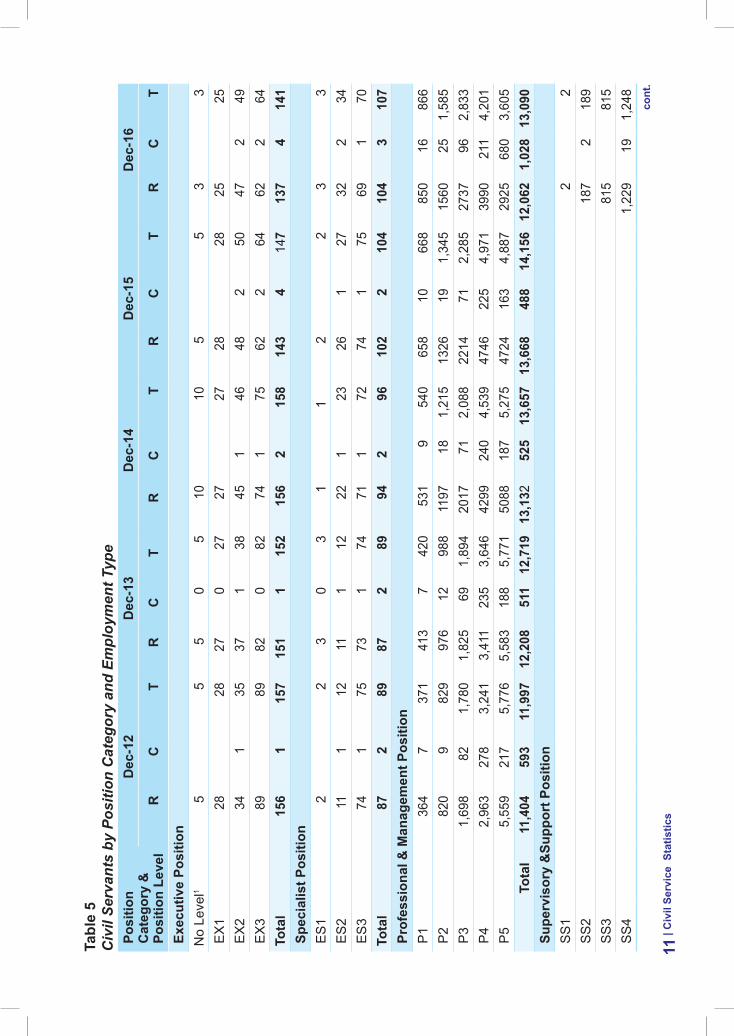
As on 31st December 2016, there are 13,090 civil servants in Professional and Management Position Category as compared to 11,661 in Supervisory and Support Position Category, and 2,030 in Operational Position Category. There are 141 civil servants in Executive Position Category and 107 in Specialist Position Category (Table 3).
The Professional and Management Position Category constituted 48.43% of the total Civil Service strength, followed by Supervisory and Support Position Category with 43.14%, and Operational Position Category with 7.51%. The Executives constituted 0.52% and Specialists 0.40% of the total Civil Service strength (Graph 2).
Civil service statistics | 3
Civil servants by employment type
There are 25,161 regular civil servants equivalent to 93.09% and 1,868 on contract equivalent to 6.91% (Table 1). Besides there are 1,973 as Elementary Service Personnel (ESP) and 2,418 as General Service Personnel (GSP), who are not considered as civil servants, and therefore kept outside the total strength of the Civil Service (Table 16).
As a parent agency, the Ministry of Education has the highest number of contract employees with 1,280 followed by Ministry of Health with 217 (Table 7). Civil servants by agency
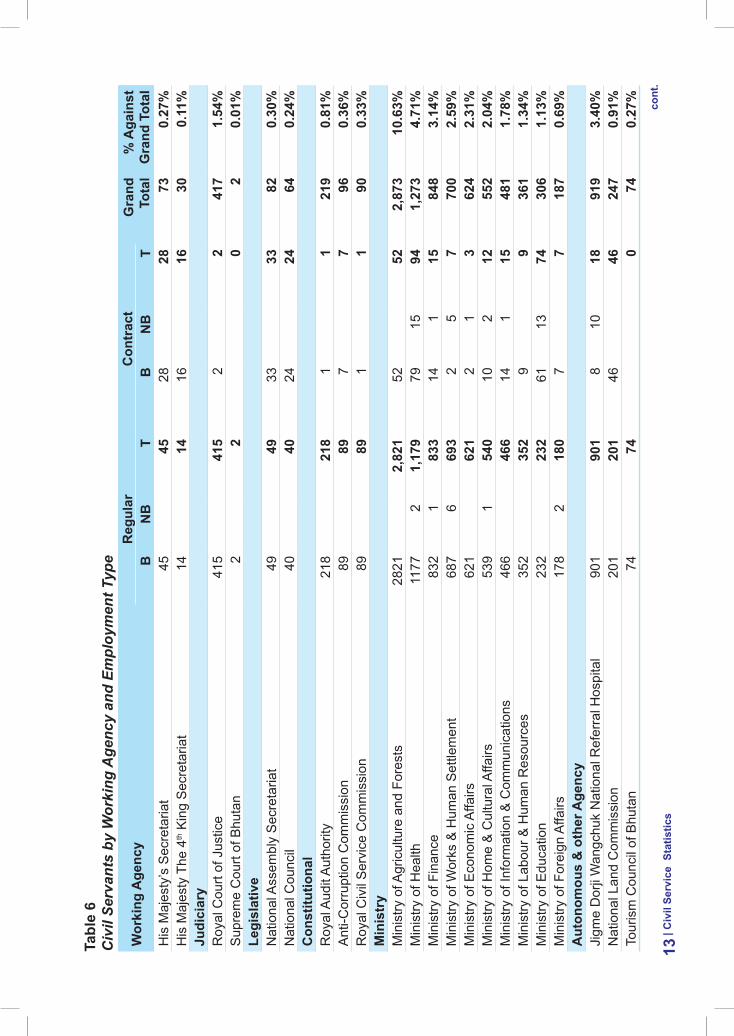
By Working Agency, the Ministry of Agriculture and Forests has the highest number of Civil Servants with 2,873 constituting 10.63% of the total strength. It is followed by Trashigang Dzongkhag with 1,304 constituting 4.82%, Ministry of Health with 1,273 constituting 4.71% and Thimphu Thromde with 1,251 constituting 4.63%.
By Parent Agency, the Ministry of Education has the highest number of civil servants with 10,625 constituting 39.31% of the total strength of the Civil Service. It is followed by the Ministry of Health with 4,155 constituting 15.37% and Ministry of Agriculture and Forest with 3,479 constituting 12.87% (Table 7).
Civil servants by dzongkhag
Civil servants by location refers to civil servants located within the perimeter of a Dzongkhag but not necessarily under Dzongkhag Administration. By location, Thimphu Dzongkhag has 8,459 civil servants which included civil servants of all central agencies located within the perimeter of Thimphu Dzongkhag. It is followed by Chhukha with 1,932, Sarpang with 1,650, Trashigang with 1,557 and Monggar with 1,394. Gasa Dzongkhag has the least number of 260 civil servants (Table 15). As on 31st December 2016, 58.14% of the civil servants are under Dzongkhag and Thromde Administrations (Table 14). Although by location, Thimphu Dzongkhag has highest number of 8,459, only 431 Civil Servants are actually under Dzongkhag Administration. The Thimphu Thromde has 1,251 civil servants and the rest remaining are under Ministries and Central Agencies (Table 16).
| Royal Civil Service Commission4
Under Dzongkhag Administration, the highest numbers of civil servants are under Trashigang with 1,304 followed by Samtse with 1,193 and Chhukha with 1,015. The other Dzongkhag Administrations has lesser number with least number of 168 Civil Servants under Gasa Dzongkhag Administration (Table 17).
Civil servants by major Occupational Groups
Amongst the 19 Major Occupational Groups, the Education and Training Services has the highest number of Civil Servants with 9,140 constituting 33.82%. It is followed by the General Administration and Support Services with 4,098 constituting 15.16% and Medical and Health Services with 2,993 constituting 11.07%. The Arts, Culture & Literacy Services has the least number of 69 constituting 0.26% of the total strength (Table 19 and Graph 4).
Civil servants by Gender
Of the total of 27,029 civil servants, 9,585 are female Civil Servants constituting 35.46% of the total strength of the Civil Service (Table 22).
Among the Major Occupational Groups, the highest numbers of female civil servants are in the Education and Training Services with 3,664 constituting 13.56% of the total strength of the Civil Service and 38.23% within the MOG. It is followed by General Administration and Support Services with 1,449 constituting 5.36% and Medical and Health Services with 1,336 constituting 4.94% (Table 23).
Civil servants by age Groups
The median age in the Civil Service is 34 years. About 75% of the civil servants are below the age of 40 years as on 31st December 2016. Around 25% of civil servants are younger than 29 years. The median age of female civil servants is 32 years. The female civil servants are three years younger than the male civil servants on an average in the civil service.
A total of 7,175 civil servants equivalent to 26.55% fall under 30-34 years age group, followed by 6,026 civil servants equivalent to 22.29% under 25-29 years age group, 5,494 equivalents to 20.33% under 35-39 years, 3,060 equivalent to 11.32% under 40-44 years, 2,160 equivalent to 7.99% under 45-49 years and 1,502 equivalent to 5.56% under 50-54 years (Table 24).
Civil service statistics | 5
recruitment
During the period from January to December 2016, a total of 1,118 civil servants were recruited, the highest being in Education and Training Services Group with 655, followed by Medical and Health Services Group with 86 and Administration and Support Services with 69 new recruits (Table 27).
Promotion
During the period from January to December 2016, a total of 4,717 civil servants were promoted. It includes 16 in Executive Positions, 22 in Specialist Positions, 2,188 in Professional and Management Position, 2,253 in Supervisory and Support Position, and 238 in Operational Position (Table 30).
separation
During the period from January to December 2016, a total of 656 civil servants were separated of which 21 are from Executive & Specialists, 279 from Professional and Management, 271 from Supervisory and Support, and 85 from Operational Category respectively (Table 31).
Regular Civil Servants by Qualification
Of the total of 25,161 regular civil servants, 7,170 equivalent to 28.50% have the Bachelor Degree, 4,165 equivalents to 16.55% have Basic Education Class X and below, 3,729 equivalents to 14.82% have Diploma, 3,701 equivalents to 14.71% have certificate, 2,121 equivalents to 8.43% have the Master Degree, and 33 equivalents to 0.13% have the PhD (Table 37). In terms of qualification, 52.62% civil servants met the minimum qualification criteria as per the Position Directory of the BCSR 2012. The percentage of civil servants meeting the qualification criteria are 94.16% in Executive Position Category, 92.31% in Specialist Position Category, 68.16% in Professional Position Category, 32.41% in Supervisory and Support Category and 66.50% in Operational Position Category (Table 39).
long-term training
During January to December 2016, a total of 490 civil servants were sent for long-term training of which five are sent for PhD, 257 for Master’s Degree, 100 for Bachelor’s Degree, and 70 for P.G. Diploma (Table 39). Out of 490 civil servants, 208 civil servants are under mixed mode category.
| Royal Civil Service Commission6
As on 31st December 2016, a total of 1, 555 Civil Servants are undergoing long-term training, mostly in Bhutan, India and Thailand (Table 42).
Table 47 shows the number of selected students who will be sent in different universities for Bachelor’s Degree in 2017. The figures are made available by the discipline of subject and by country.
secondmentAs on 31st December 2016, there are 94 civil servants on Secondment. Of the total, four are seconded to International Organisations (Table 48).
extraordinary leave
A total of 442 civil servants availed Extraordinary Leave as on December 2016. The highest number was at P4 position level which accounted to 97 civil servants and followed by 90 civil servants at P3 (Table 49).
expatriates and volunteers
As on 31st December 2016, there are 376 expatriate civil servants of which 16 are regular civil servants and 360 on contract (Table-51).
There were 49 volunteers out of whom five are Senior Volunteers (SV) and 27 Japan Overseas Co-operation Volunteers (JOCV), two are Bhutan Canada Foundation (BCF) volunteers, eight from Australian Volunteers (AF) and seven Friends from Thailand (FFT) volunteers (Table-52).
Civil service statistics | 7
Part ii - detailed statistics
General
table 1 SummaryCategory as of 31st december 2016 %Regular (Bhutanese) 25,145 93.03%Regular (Non-Bhutanese) 16 0.06%Contract (Bhutanese) 1507 5.58%Contract (Non-Bhutanese) 361 1.34%total Civil service strength 27,029 100%Total Regular 25,161 93.09%Total Contract 1,868 6.91%Total Female Civil Servants 9,585 35.46%Total Male Civil Servants 17,444 64.54%Total Civil Servants located in Thimphu 8,459 31.30%Total Civil Servants outside Thimphu 18,486 68.39%Total Civil Servants located outside the Country 84 0.31%Total Civil Servants under Dzongkhag Administration & Thromde 15,716 58.14%Total Expatriates in the Civil Service 376 1.39%International Volunteers 49 0.18%
The cummulative figures of Elementary Service Personnel and General Service Personnel as on 31st December 2016 are as follows ;
1. Elementary Service Personnel1 : 1,9732. General Service Personnel2 : 2,418
1&2 Source: Department of Public Accounts, MoF
table 2 Proportion of Civil Servants to Population
Year Number of civil servants Population1 % Civil servant to
Population ratio2008 19,848 671,083 2.96% 1:342009 21,113 683,407 3.09% 1:322010 22,512 695,822 3.24% 1:312011 23,151 708,265 3.27% 1:312012 24,275 720,679 3.37% 1:302013 25,306 733,004 3.45% 1:292014 26,320 745,153 3.53% 1:282015 26,611 757,042 3.52% 1:282016 26,457 768,577 3.44% 1:29
1Source: Population Projections of Bhutan 2005 - 2030, NSB.
tabl
e 3
C
ivil
Serv
ants
by
Posi
tion
Cat
egor
y an
d Ye
ars
of S
ervi
ce b
y Em
ploy
men
t Typ
e
Posi
tion
Cat
egor
y<
10 y
rs10
-19
yrs
20-2
9 yr
s30
yrs
+to
tal
rC
tr
Ct
rC
tr
Ct
Exe
cutiv
e (E
X)
44
99
8686
4242
141
Spe
cial
ist (
ES
)3
310
1060
6034
3410
7P
rofe
ssio
nal &
Man
agem
ent (
P&
M)
6168
798
6,96
640
9313
74,
230
1243
591,
302
558
3459
213
,090
Sup
ervi
sory
& S
uppo
rt (S
&S
)48
9462
15,
515
3865
143,
879
1580
11,
581
686
686
11,6
61O
pera
tiona
l (O
)77
418
495
876
812
780
253
125
438
382,
030
tota
l11
,836
1,61
013
,446
8,74
516
38,
908
3,22
261
3,28
31,
358
341,
392
27,0
29
Not
e.
R: R
egul
ar, C
: Con
tract
& T
: Tot
al
tabl
e 4
N
umbe
r of C
ivil/
Publ
ic S
erva
nts
Con
ferr
ed th
e R
oyal
Civ
il Se
rvic
e A
war
d 20
16C
ateg
ory
of a
war
dsC
ivil
serv
ants
Oth
er P
ublic
ser
vant
sto
tal
Life
time
Ser
vice
s (G
old)
329
7740
630
Yea
rs a
nd a
bove
(Gol
d)28
369
352
20 Y
ears
and
abo
ve (S
ilver
)48
413
561
910
Yea
rs a
nd a
bove
(Bro
nze)
1,46
130
61,
767
tota
l2,
557
587
3,14
4
| roy
al C
ivil
serv
ice
Com
mis
sion
8
Gra
ph 1
C
ivil
Serv
ice
Staffi
ng T
rend
(198
9 -2
016
)
| Civ
il se
rvic
e s
tatis
tics
9
| Royal Civil Service Commission10
Graph 2 Civil Servants by Position Category (in %)
Graph 3 Civil Servants by Position Category (2012 -2016)
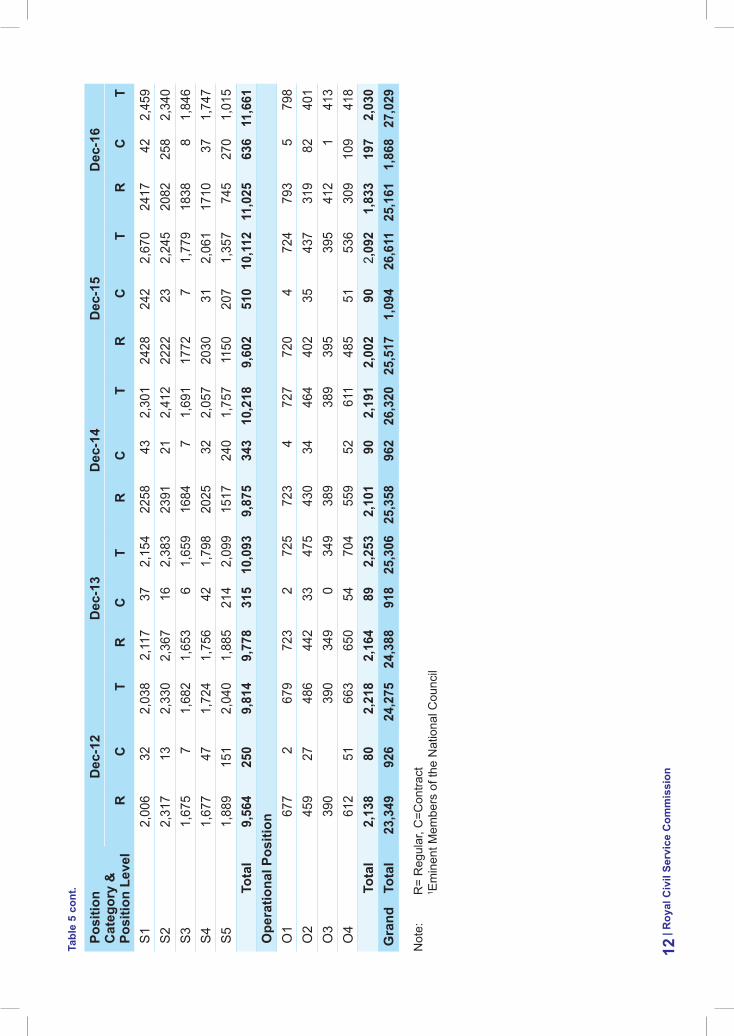
tabl
e 5
C
ivil
Serv
ants
by
Posi
tion
Cat
egor
y an
d Em
ploy
men
t Typ
ePo
sitio
n C
ateg
ory
&
Posi
tion
leve
l
dec
-12
dec
-13
dec
-14
dec
-15
dec
-16
rC
tr
Ct
rC
tr
Ct
rC
t
exec
utiv
e Po
sitio
nN
o Le
vel1
55
50
510
105
53
3E
X1
2828
270
2727
2728
2825
25E
X2
341
3537
138
451
4648
250
472
49E
X3
8989
820
8274
175
622
6462
264
tota
l15
61
157
151
115
215
62
158
143
414
713
74
141
spec
ialis
t Pos
ition
ES
12
23
03
11
22
33
ES
211
112
111
1222
123
261
2732
234
ES
374
175
731
7471
172
741
7569
170
tota
l87
289
872
8994
296
102
210
410
43
107
Prof
essi
onal
& m
anag
emen
t Pos
ition
P1
364
737
141
37
420
531
954
065
810
668
850
1686
6P
282
09
829
976
1298
811
9718
1,21
513
2619
1,34
515
6025
1,58
5P
31,
698
821,
780
1,82
569
1,89
420
1771
2,08
822
1471
2,28
527
3796
2,83
3P
42,
963
278
3,24
13,
411
235
3,64
642
9924
04,
539
4746
225
4,97
139
9021
14,
201
P5
5,55
921
75,
776
5,58
318
85,
771
5088
187
5,27
547
2416
34,
887
2925
680
3,60
5to
tal
11,4
0459
311
,997
12,2
0851
112
,719
13,1
3252
513
,657
13,6
6848
814
,156
12,0
621,
028
13,0
90su
perv
isor
y &
supp
ort P
ositi
onS
S1
22
SS
218
72
189
SS
381
581
5S
S4
1,22
919
1,24
8
| Civ
il se
rvic
e s
tatis
tics
11co
nt.
Posi
tion
Cat
egor
y &
Po
sitio
n le
vel
dec
-12
dec
-13
dec
-14
dec
-15
dec
-16
rC
tr
Ct
rC
tr
Ct
rC
t
S1
2,00
632
2,03
82,
117
372,
154
2258
432,
301
2428
242
2,67
024
1742
2,45
9S
22,
317
132,
330
2,36
716
2,38
323
9121
2,41
222
2223
2,24
520
8225
82,
340
S3
1,67
57
1,68
21,
653
61,
659
1684
71,
691
1772
71,
779
1838
81,
846
S4
1,67
747
1,72
41,
756
421,
798
2025
322,
057
2030
312,
061
1710
371,
747
S5
1,88
915
12,
040
1,88
521
42,
099
1517
240
1,75
711
5020
71,
357
745
270
1,01
5to
tal
9,56
425
09,
814
9,77
831
510
,093
9,87
534
310
,218
9,60
251
010
,112
11,0
2563
611
,661
Ope
ratio
nal P
ositi
onO
167
72
679
723
272
572
34
727
720
472
479
35
798
O2
459
2748
644
233
475
430
3446
440
235
437
319
8240
1O
339
039
034
90
349
389
389
395
395
412
141
3O
461
251
663
650
5470
455
952
611
485
5153
630
910
941
8to
tal
2,13
880
2,21
82,
164
892,
253
2,10
190
2,19
12,
002
902,
092
1,83
319
72,
030
Gra
ndto
tal
23,3
4992
624
,275
24,3
8891
825
,306
25,3
5896
226
,320
25,5
171,
094
26,6
1125
,161
1,86
827
,029
Not
e:
R=
Reg
ular
, C=C
ontra
ct
1 Em
inen
t Mem
bers
of t
he N
atio
nal C
ounc
il
| roy
al C
ivil
serv
ice
Com
mis
sion
12tabl
e 5
cont
.
tabl
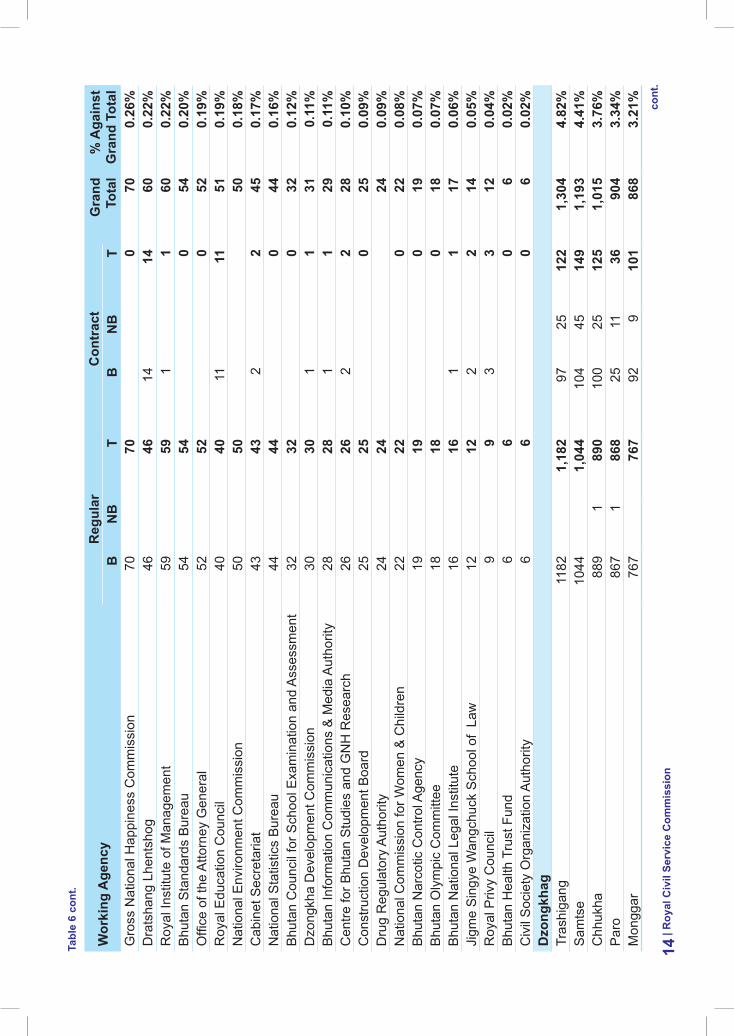
e 6
Civ
il Se
rvan
ts b
y W
orki
ng A
genc
y an
d Em
ploy
men
t Typ
e
Wor
king
age
ncy
reg
ular
Con
trac
tG
rand
to
tal
% a
gain
st
Gra
nd t
otal
bN
bt
bN
bt
His
Maj
esty
’s S
ecre
taria
t45
4528
2873
0.27
%H
is M
ajes
ty T
he 4
th K
ing
Sec
reta
riat
1414
1616
300.
11%
Judi
ciar
yR
oyal
Cou
rt of
Jus
tice
415
415
22
417
1.54
%S
upre
me
Cou
rt of
Bhu
tan
22
02
0.01
%le
gisl
ativ
eN
atio
nal A
ssem
bly
Sec
reta
riat
4949
3333
820.
30%
Nat
iona
l Cou
ncil
4040
2424
640.
24%
Con
stitu
tiona
lR
oyal
Aud
it A
utho
rity
218
218
11
219
0.81
%A
nti-C
orru
ptio
n C
omm
issi
on89
897
796
0.36
%R
oyal
Civ
il S
ervi
ce C
omm
issi
on89
891
190
0.33
%m
inis
try
Min
istry
of A
gric
ultu
re a
nd F
ores
ts28
212,
821
5252
2,87
310
.63%
Min
istry
of H
ealth
1177
21,
179
7915
941,
273
4.71
%M
inis
try o
f Fin
ance
832
183
314
115
848
3.14
%M
inis
try o
f Wor
ks &
Hum
an S
ettle
men
t68
76
693
25
770
02.
59%
Min
istry
of E
cono
mic
Affa
irs62
162
12
13
624
2.31
%M
inis
try o
f Hom
e &
Cul
tura
l Affa
irs53
91
540
102
1255
22.
04%
Min
istry
of I
nfor
mat
ion
& C
omm
unic
atio
ns46
646
614
115
481
1.78
%M
inis
try o
f Lab
our &
Hum
an R
esou
rces
352
352
99
361
1.34
%M
inis
try o
f Edu
catio
n23
223
261
1374
306
1.13
%M
inis
try o
f For
eign
Affa
irs17
82
180
77
187
0.69
%a
uton
omou
s &
oth
er a
genc
yJi
gme
Dor
ji W
angc
huk
Nat
iona
l Ref
erra
l Hos
pita
l90
190
18
1018
919
3.40
%N
atio
nal L
and
Com
mis
sion
201
201
4646
247
0.91
%To
uris
m C
ounc
il of
Bhu
tan
7474
074
0.27
%co
nt.
| Civ
il se
rvic
e s
tatis
tics
13
Wor
king
age
ncy
reg
ular
Con
trac
tG
rand
to
tal
% a
gain
st
Gra
nd t
otal
bN
bt
bN
bt
Gro
ss N
atio
nal H
appi
ness
Com
mis
sion
7070
070
0.26
%D
rats
hang
Lhe
ntsh
og46
4614
1460
0.22
%R
oyal
Inst
itute
of M
anag
emen
t59
591
160
0.22
%B
huta
n S
tand
ards
Bur
eau
5454
054
0.20
%O
ffice
of t
he A
ttorn
ey G
ener
al52
520
520.
19%
Roy
al E
duca
tion
Cou
ncil
4040
1111
510.
19%
Nat
iona
l Env
ironm
ent C
omm
issi
on50
5050
0.18
%C
abin
et S
ecre
taria
t43
432
245
0.17
%N
atio
nal S
tatis
tics
Bur
eau
4444
044
0.16
%B
huta
n C
ounc
il fo
r Sch
ool E
xam
inat
ion
and
Ass
essm
ent
3232
032
0.12
%D
zong
kha
Dev
elop
men
t Com
mis
sion
3030
11
310.
11%
Bhu
tan
Info
rmat
ion
Com
mun
icat
ions
& M
edia
Aut
horit
y28
281
129
0.11
%C
entre
for B
huta
n S
tudi
es a
nd G
NH
Res
earc
h26
262
228
0.10
%C
onst
ruct
ion
Dev
elop
men
t Boa
rd25
250
250.
09%
Dru
g R
egul
ator
y A
utho
rity
2424
240.
09%
Nat
iona
l Com
mis
sion
for W
omen
& C
hild
ren
2222
022
0.08
%B
huta
n N
arco
tic C
ontro
l Age
ncy
1919
019
0.07
%B
huta
n O
lym
pic
Com
mitt
ee18
180
180.
07%
Bhu
tan
Nat
iona
l Leg
al In
stitu
te16
161
117
0.06
%Ji
gme
Sin
gye
Wan
gchu
ck S
choo
l of
Law
12
122
214
0.05
%R
oyal
Priv
y C
ounc
il9
93
312
0.04
%B
huta
n H
ealth
Tru
st F
und
66
06
0.02
%C
ivil
Soc
iety
Org
aniz
atio
n A
utho
rity
66
06
0.02
%d
zong
khag
Tras
higa
ng
1182
1,18
297
2512
21,
304
4.82
%S
amts
e 10
441,
044
104
4514
91,
193
4.41
%C
hhuk
ha
889
189
010
025
125
1,01
53.
76%
Par
o 86
71
868
2511
3690
43.
34%
Mon
ggar
76
776
792
910
186
83.
21%
| roy
al C
ivil
serv
ice
Com
mis
sion
14co
nt.
tabl
e 6
cont
.
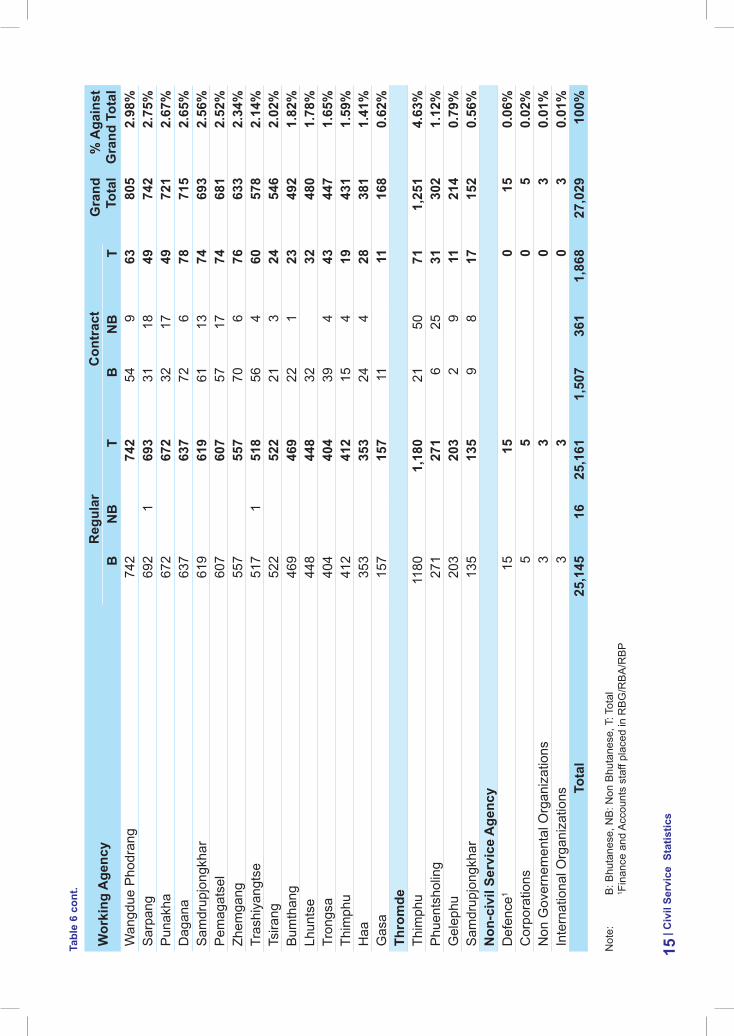
Wor
king
age
ncy
reg
ular
Con
trac
tG
rand
to
tal
% a
gain
st
Gra
nd t
otal
bN
bt
bN
bt
Wan
gdue
Pho
dran
g74
274
254
963
805
2.98
%S
arpa
ng
692
169
331
1849
742
2.75
%P
unak
ha
672
672
3217
4972
12.
67%
Dag
ana
637
637
726
7871
52.
65%
Sam
drup
jong
khar
61
961
961
1374
693
2.56
%P
emag
atse
l 60
760
757
1774
681
2.52
%Zh
emga
ng
557
557
706
7663
32.
34%
Tras
hiya
ngts
e 51
71
518
564
6057
82.
14%
Tsira
ng
522
522
213
2454
62.
02%
Bum
than
g 46
946
922
123
492
1.82
%Lh
unts
e 44
844
832
3248
01.
78%
Tron
gsa
404
404
394
4344
71.
65%
Thim
phu
412
412
154
1943
11.
59%
Haa
35
335
324
428
381
1.41
%G
asa
157
157
1111
168
0.62
%th
rom
deTh
imph
u 11
801,
180
2150
711,
251
4.63
%P
huen
tsho
ling
271
271
625
3130
21.
12%
Gel
ephu
20
320
32
911
214
0.79
%S
amdr
upjo
ngkh
ar
135
135
98
1715
20.
56%
Non
-civ
il se
rvic
e a
genc
yD
efen
ce1
1515
015
0.06
%C
orpo
ratio
ns5
50
50.
02%
Non
Gov
erne
men
tal O
rgan
izat
ions
33
03
0.01
%In
tern
atio
nal O
rgan
izat
ions
33
03
0.01
%to
tal
25,1
4516
25,1
611,
507
361
1,86
827
,029
100%
Not
e:
B: B
huta
nese
, NB
: Non
Bhu
tane
se, T
: Tot
al
1 Fin
ance
and
Acc
ount
s st
aff p
lace
d in
RB
G/R
BA
/RB
P
| Civ
il se
rvic
e s
tatis
tics
15tabl
e 6
cont
.
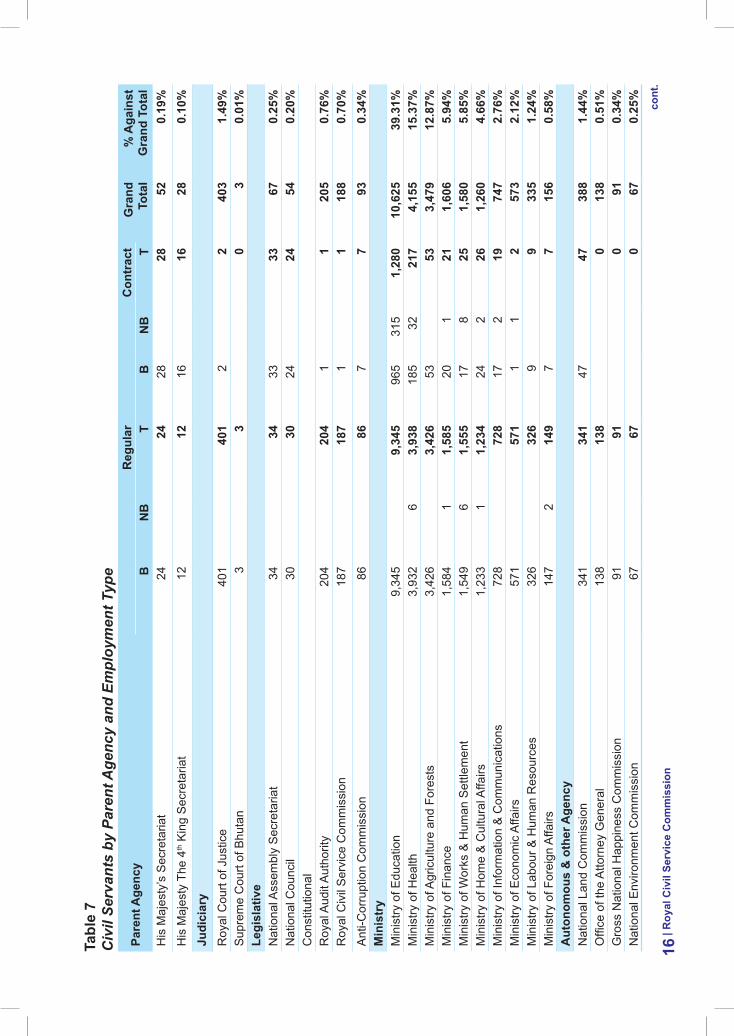
tabl
e 7
C
ivil
Serv
ants
by
Pare
nt A
genc
y an
d Em
ploy
men
t Typ
e
Pare
nt a
genc
yr
egul
arC
ontr
act
Gra
nd
tota
l%
aga
inst
G
rand
tot
alb
Nb
tb
Nb
tH
is M
ajes
ty’s
Sec
reta
riat
24
24
28
28
52
0.19
%H
is M
ajes
ty T
he 4
th K
ing
Sec
reta
riat
12
12
16
16
28
0.10
%Ju
dici
ary
Roy
al C
ourt
of J
ustic
e40
1 40
1 2
2 40
3 1.
49%
Sup
rem
e C
ourt
of B
huta
n3
3 0
3 0.
01%
legi
slat
ive
Nat
iona
l Ass
embl
y S
ecre
taria
t34
34
33
33
67
0.
25%
Nat
iona
l Cou
ncil
30
30
24
24
54
0.20
%C
onst
itutio
nal
Roy
al A
udit
Aut
horit
y20
4 20
4 1
1 20
5 0.
76%
Roy
al C
ivil
Ser
vice
Com
mis
sion
187
187
1 1
188
0.70
%A
nti-C
orru
ptio
n C
omm
issi
on86
86
7
7 93
0.
34%
min
istr
yM
inis
try o
f Edu
catio
n9,
345
9,34
5 96
5 31
5 1,
280
10,6
25
39.3
1%M
inis
try o
f Hea
lth3,
932
6 3,
938
185
32
217
4,15
5 15
.37%
Min
istry
of A
gric
ultu
re a
nd F
ores
ts3,
426
3,42
6 53
53
3,
479
12.8
7%M
inis
try o
f Fin
ance
1,58
4 1
1,58
5 20
1
21
1,60
6 5.
94%
Min
istry
of W
orks
& H
uman
Set
tlem
ent
1,54
9 6
1,55
5 17
8
25
1,58
0 5.
85%
Min
istry
of H
ome
& C
ultu
ral A
ffairs
1,23
3 1
1,23
4 24
2
26
1,26
0 4.
66%
Min
istry
of I
nfor
mat
ion
& C
omm
unic
atio
ns72
8 72
8 17
2
19
747
2.76
%M
inis
try o
f Eco
nom
ic A
ffairs
571
571
1 1
2 57
3 2.
12%
Min
istry
of L
abou
r & H
uman
Res
ourc
es32
6 32
6 9
9 33
5 1.
24%
Min
istry
of F
orei
gn A
ffairs
147
2 14
9 7
7 15
6 0.
58%
aut
onom
ous
& o
ther
age
ncy
Nat
iona
l Lan
d C
omm
issi
on34
1 34
1 47
47
38
8 1.
44%
Offi
ce o
f the
Atto
rney
Gen
eral
138
138
0 13
8 0.
51%
Gro
ss N
atio
nal H
appi
ness
Com
mis
sion
91
91
0 91
0.
34%
Nat
iona
l Env
ironm
ent C
omm
issi
on67
67
0
67
0.25
%
| roy
al C
ivil
serv
ice
Com
mis
sion
16co
nt.
Pare
nt a
genc
yr
egul
arC
ontr
act
Gra
nd
tota
l%
aga
inst
G
rand
tot
alb
Nb
tb
Nb
tTo
uris
m C
ounc
il of
Bhu
tan
63
63
0 63
0.
23%
Roy
al In
stitu
te o
f Man
agem
ent
54
54
1 1
55
0.20
%D
rats
hang
Lhe
ntsh
og40
40
14
14
54
0.
20%
Bhu
tan
Sta
ndar
ds B
urea
u52
52
0
52
0.19
%N
atio
nal S
tatis
tics
Bur
eau
49
49
0 49
0.
18%
Roy
al E
duca
tion
Cou
ncil
33
33
10
10
43
0.16
%C
abin
et S
ecre
taria
t32
32
2
2 34
0.
13%
Bhu
tan
Cou
ncil
for S
choo
l Exa
min
atio
n an
d A
sses
smen
t27
27
0
27
0.10
%D
zong
kha
Dev
elop
men
t Com
mis
sion
25
25
1 1
26
0.10
%B
huta
n In
form
atio
n C
omm
unic
atio
ns &
Med
ia A
utho
rity
24
24
1 1
25
0.09
%C
entre
for B
huta
n S
tudi
es a
nd G
NH
Res
earc
h22
22
2
2 24
0.
09%
Dru
g R
egul
ator
y A
utho
rity
22
22
0 22
0.
08%
Con
stru
ctio
n D
evel
opm
ent B
oard
19
19
0 19
0.
07%
Bhu
tan
Nar
cotic
Con
trol A
genc
y16
16
0
16
0.06
%N
atio
nal C
omm
issi
on fo
r Wom
en &
Chi
ldre
n16
16
0
16
0.06
%B
huta
n O
lym
pic
Com
mitt
ee15
15
0
15
0.06
%Ji
gme
Sin
gye
Wan
gchu
ck S
choo
l of
Law
12
12
2
2 14
0.
05%
Roy
al P
rivy
Cou
ncil
8 8
3 3
11
0.04
%B
huta
n N
atio
nal L
egal
Inst
itute
6 6
1 1
7 0.
03%
Bhu
tan
Hea
lth T
rust
Fun
d5
5 0
5 0.
02%
Civ
il S
ocie
ty O
rgan
izat
ion
Aut
horit
y4
4 0
4 0.
01%
thro
mde
Thim
phu
80
80
10
10
90
0.33
%P
huen
tsho
ling
26
26
26
0.10
%G
elep
hu20
20
0
20
0.07
%S
amdr
upjo
ngkh
ar
16
16
3 3
19
0.07
%to
tal
25,1
45
16
25,1
61
1,50
7 36
1 1,
868
27,0
29
100%
Not
e:
B: B
huta
nese
, NB
: Non
Bhu
tane
se, T
: Tot
al
Civ
il S
erva
nts
in th
e D
zong
khag
who
do
not h
ave
pare
nt a
genc
ies
are
incl
uded
and
app
lies
to a
ll th
e ag
enci
es
| Civ
il se
rvic
e s
tatis
tics
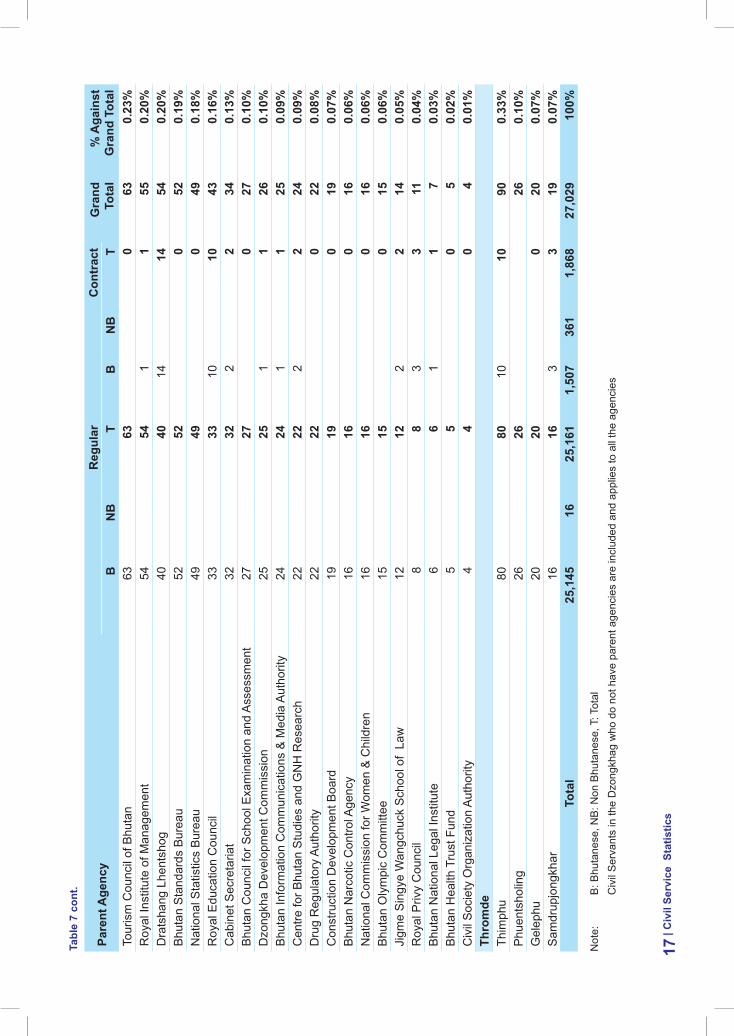
17tabl
e 7
cont
.
| Royal Civil Service Commission18
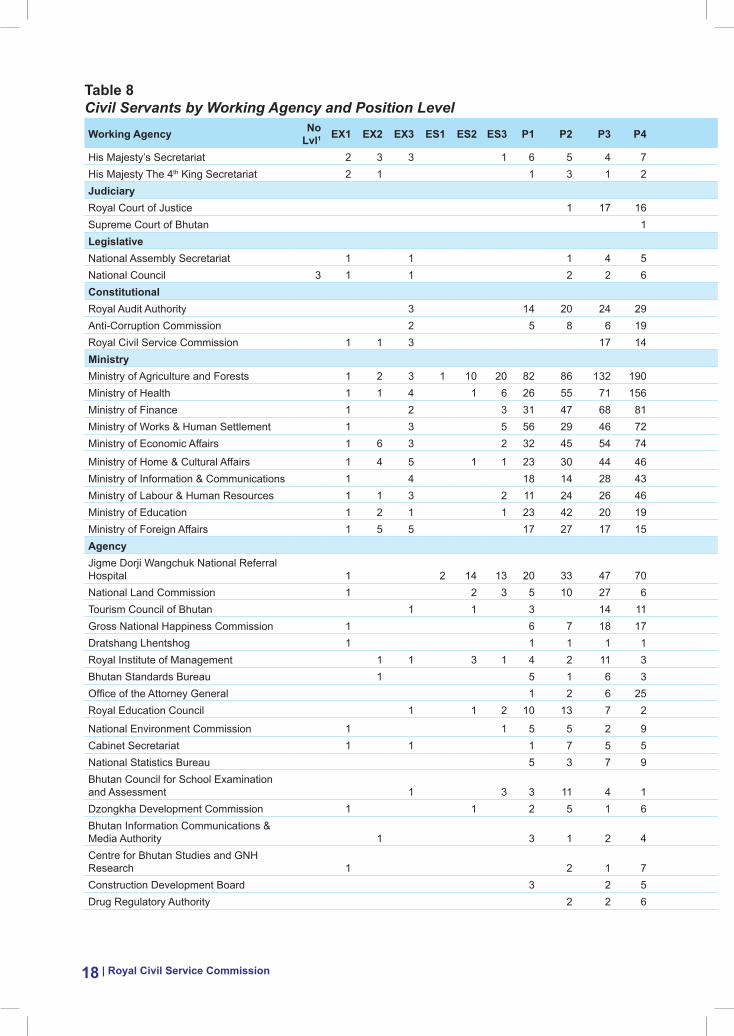
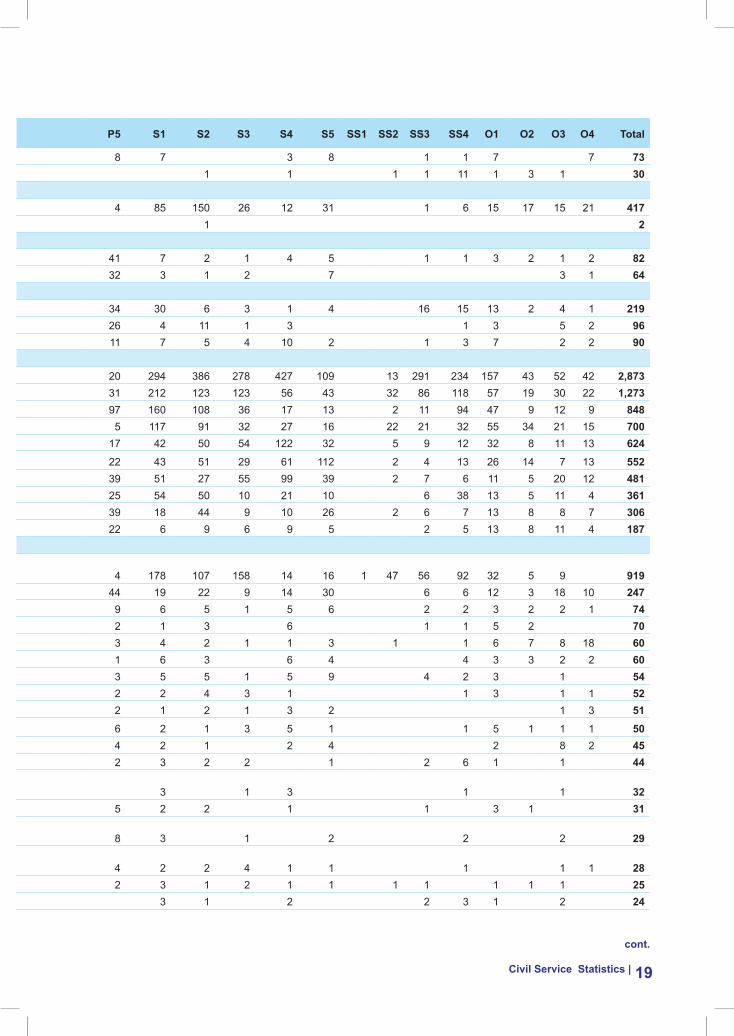
table 8 Civil Servants by Working Agency and Position LevelWorking agency No
lvl1 eX1 eX2 eX3 es1 es2 es3 P1 P2 P3 P4 P5 s1 s2 s3 s4 s5 ss1 ss2 ss3 ss4 O1 O2 O3 O4 total
His Majesty’s Secretariat 2 3 3 1 6 5 4 7 8 7 3 8 1 1 7 7 73 His Majesty The 4th King Secretariat 2 1 1 3 1 2 1 1 1 1 11 1 3 1 30 JudiciaryRoyal Court of Justice 1 17 16 4 85 150 26 12 31 1 6 15 17 15 21 417 Supreme Court of Bhutan 1 1 2 legislativeNational Assembly Secretariat 1 1 1 4 5 41 7 2 1 4 5 1 1 3 2 1 2 82 National Council 3 1 1 2 2 6 32 3 1 2 7 3 1 64 ConstitutionalRoyal Audit Authority 3 14 20 24 29 34 30 6 3 1 4 16 15 13 2 4 1 219 Anti-Corruption Commission 2 5 8 6 19 26 4 11 1 3 1 3 5 2 96 Royal Civil Service Commission 1 1 3 17 14 11 7 5 4 10 2 1 3 7 2 2 90 ministryMinistry of Agriculture and Forests 1 2 3 1 10 20 82 86 132 190 20 294 386 278 427 109 13 291 234 157 43 52 42 2,873 Ministry of Health 1 1 4 1 6 26 55 71 156 31 212 123 123 56 43 32 86 118 57 19 30 22 1,273 Ministry of Finance 1 2 3 31 47 68 81 97 160 108 36 17 13 2 11 94 47 9 12 9 848 Ministry of Works & Human Settlement 1 3 5 56 29 46 72 5 117 91 32 27 16 22 21 32 55 34 21 15 700 Ministry of Economic Affairs 1 6 3 2 32 45 54 74 17 42 50 54 122 32 5 9 12 32 8 11 13 624 Ministry of Home & Cultural Affairs 1 4 5 1 1 23 30 44 46 22 43 51 29 61 112 2 4 13 26 14 7 13 552 Ministry of Information & Communications 1 4 18 14 28 43 39 51 27 55 99 39 2 7 6 11 5 20 12 481 Ministry of Labour & Human Resources 1 1 3 2 11 24 26 46 25 54 50 10 21 10 6 38 13 5 11 4 361 Ministry of Education 1 2 1 1 23 42 20 19 39 18 44 9 10 26 2 6 7 13 8 8 7 306 Ministry of Foreign Affairs 1 5 5 17 27 17 15 22 6 9 6 9 5 2 5 13 8 11 4 187 agencyJigme Dorji Wangchuk National Referral Hospital 1 2 14 13 20 33 47 70 4 178 107 158 14 16 1 47 56 92 32 5 9 919 National Land Commission 1 2 3 5 10 27 6 44 19 22 9 14 30 6 6 12 3 18 10 247 Tourism Council of Bhutan 1 1 3 14 11 9 6 5 1 5 6 2 2 3 2 2 1 74 Gross National Happiness Commission 1 6 7 18 17 2 1 3 6 1 1 5 2 70 Dratshang Lhentshog 1 1 1 1 1 3 4 2 1 1 3 1 1 6 7 8 18 60 Royal Institute of Management 1 1 3 1 4 2 11 3 1 6 3 6 4 4 3 3 2 2 60 Bhutan Standards Bureau 1 5 1 6 3 3 5 5 1 5 9 4 2 3 1 54 Office of the Attorney General 1 2 6 25 2 2 4 3 1 1 3 1 1 52 Royal Education Council 1 1 2 10 13 7 2 2 1 2 1 3 2 1 3 51 National Environment Commission 1 1 5 5 2 9 6 2 1 3 5 1 1 5 1 1 1 50 Cabinet Secretariat 1 1 1 7 5 5 4 2 1 2 4 2 8 2 45 National Statistics Bureau 5 3 7 9 2 3 2 2 1 2 6 1 1 44 Bhutan Council for School Examination and Assessment 1 3 3 11 4 1 3 1 3 1 1 32 Dzongkha Development Commission 1 1 2 5 1 6 5 2 2 1 1 3 1 31 Bhutan Information Communications & Media Authority 1 3 1 2 4 8 3 1 2 2 2 29 Centre for Bhutan Studies and GNH Research 1 2 1 7 4 2 2 4 1 1 1 1 1 28 Construction Development Board 3 2 5 2 3 1 2 1 1 1 1 1 1 1 25 Drug Regulatory Authority 2 2 6 3 1 2 2 3 1 2 24
Civil service statistics | 19
table 8 Civil Servants by Working Agency and Position LevelWorking agency No
lvl1 eX1 eX2 eX3 es1 es2 es3 P1 P2 P3 P4 P5 s1 s2 s3 s4 s5 ss1 ss2 ss3 ss4 O1 O2 O3 O4 total
His Majesty’s Secretariat 2 3 3 1 6 5 4 7 8 7 3 8 1 1 7 7 73 His Majesty The 4th King Secretariat 2 1 1 3 1 2 1 1 1 1 11 1 3 1 30 JudiciaryRoyal Court of Justice 1 17 16 4 85 150 26 12 31 1 6 15 17 15 21 417 Supreme Court of Bhutan 1 1 2 legislativeNational Assembly Secretariat 1 1 1 4 5 41 7 2 1 4 5 1 1 3 2 1 2 82 National Council 3 1 1 2 2 6 32 3 1 2 7 3 1 64 ConstitutionalRoyal Audit Authority 3 14 20 24 29 34 30 6 3 1 4 16 15 13 2 4 1 219 Anti-Corruption Commission 2 5 8 6 19 26 4 11 1 3 1 3 5 2 96 Royal Civil Service Commission 1 1 3 17 14 11 7 5 4 10 2 1 3 7 2 2 90 ministryMinistry of Agriculture and Forests 1 2 3 1 10 20 82 86 132 190 20 294 386 278 427 109 13 291 234 157 43 52 42 2,873 Ministry of Health 1 1 4 1 6 26 55 71 156 31 212 123 123 56 43 32 86 118 57 19 30 22 1,273 Ministry of Finance 1 2 3 31 47 68 81 97 160 108 36 17 13 2 11 94 47 9 12 9 848 Ministry of Works & Human Settlement 1 3 5 56 29 46 72 5 117 91 32 27 16 22 21 32 55 34 21 15 700 Ministry of Economic Affairs 1 6 3 2 32 45 54 74 17 42 50 54 122 32 5 9 12 32 8 11 13 624 Ministry of Home & Cultural Affairs 1 4 5 1 1 23 30 44 46 22 43 51 29 61 112 2 4 13 26 14 7 13 552 Ministry of Information & Communications 1 4 18 14 28 43 39 51 27 55 99 39 2 7 6 11 5 20 12 481 Ministry of Labour & Human Resources 1 1 3 2 11 24 26 46 25 54 50 10 21 10 6 38 13 5 11 4 361 Ministry of Education 1 2 1 1 23 42 20 19 39 18 44 9 10 26 2 6 7 13 8 8 7 306 Ministry of Foreign Affairs 1 5 5 17 27 17 15 22 6 9 6 9 5 2 5 13 8 11 4 187 agencyJigme Dorji Wangchuk National Referral Hospital 1 2 14 13 20 33 47 70 4 178 107 158 14 16 1 47 56 92 32 5 9 919 National Land Commission 1 2 3 5 10 27 6 44 19 22 9 14 30 6 6 12 3 18 10 247 Tourism Council of Bhutan 1 1 3 14 11 9 6 5 1 5 6 2 2 3 2 2 1 74 Gross National Happiness Commission 1 6 7 18 17 2 1 3 6 1 1 5 2 70 Dratshang Lhentshog 1 1 1 1 1 3 4 2 1 1 3 1 1 6 7 8 18 60 Royal Institute of Management 1 1 3 1 4 2 11 3 1 6 3 6 4 4 3 3 2 2 60 Bhutan Standards Bureau 1 5 1 6 3 3 5 5 1 5 9 4 2 3 1 54 Office of the Attorney General 1 2 6 25 2 2 4 3 1 1 3 1 1 52 Royal Education Council 1 1 2 10 13 7 2 2 1 2 1 3 2 1 3 51 National Environment Commission 1 1 5 5 2 9 6 2 1 3 5 1 1 5 1 1 1 50 Cabinet Secretariat 1 1 1 7 5 5 4 2 1 2 4 2 8 2 45 National Statistics Bureau 5 3 7 9 2 3 2 2 1 2 6 1 1 44 Bhutan Council for School Examination and Assessment 1 3 3 11 4 1 3 1 3 1 1 32 Dzongkha Development Commission 1 1 2 5 1 6 5 2 2 1 1 3 1 31 Bhutan Information Communications & Media Authority 1 3 1 2 4 8 3 1 2 2 2 29 Centre for Bhutan Studies and GNH Research 1 2 1 7 4 2 2 4 1 1 1 1 1 28 Construction Development Board 3 2 5 2 3 1 2 1 1 1 1 1 1 1 25 Drug Regulatory Authority 2 2 6 3 1 2 2 3 1 2 24
cont.
| Royal Civil Service Commission20
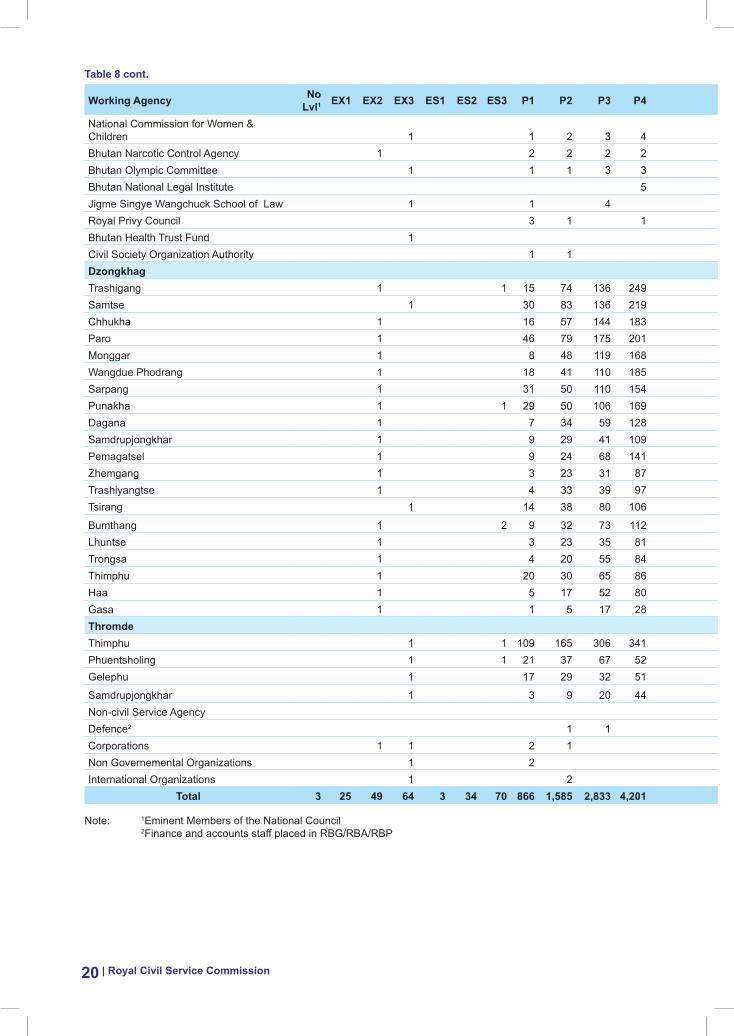
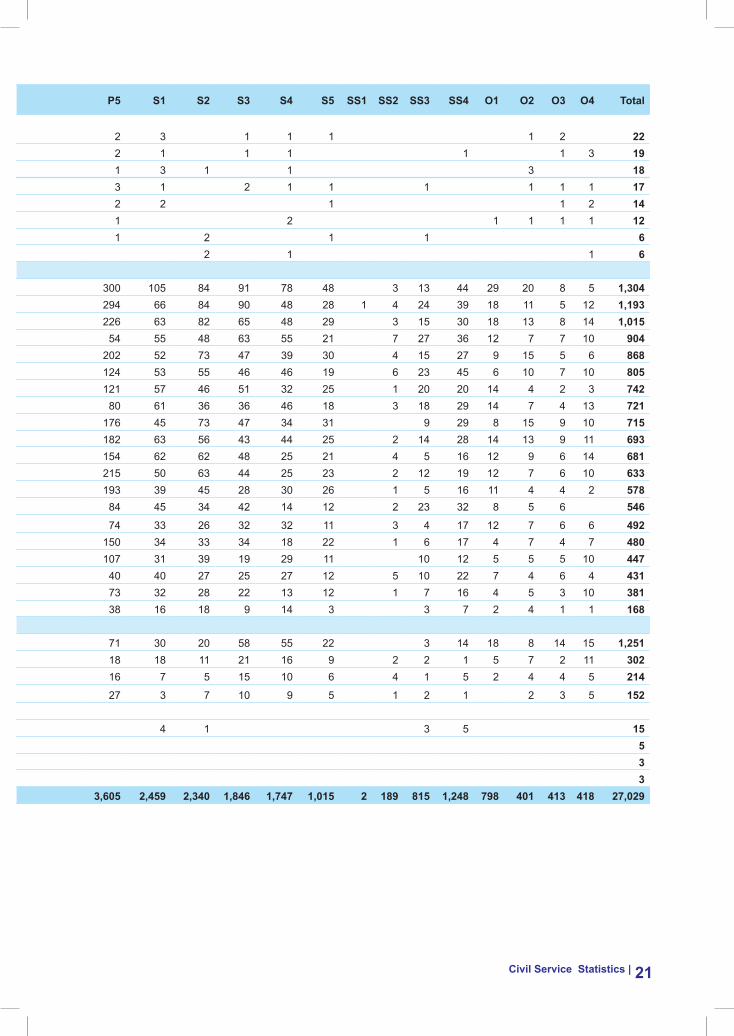
Working agency No lvl1 eX1 eX2 eX3 es1 es2 es3 P1 P2 P3 P4 P5 s1 s2 s3 s4 s5 ss1 ss2 ss3 ss4 O1 O2 O3 O4 total
National Commission for Women & Children 1 1 2 3 4 2 3 1 1 1 1 2 22 Bhutan Narcotic Control Agency 1 2 2 2 2 2 1 1 1 1 1 3 19 Bhutan Olympic Committee 1 1 1 3 3 1 3 1 1 3 18 Bhutan National Legal Institute 5 3 1 2 1 1 1 1 1 1 17 Jigme Singye Wangchuck School of Law 1 1 4 2 2 1 1 2 14 Royal Privy Council 3 1 1 1 2 1 1 1 1 12 Bhutan Health Trust Fund 1 1 2 1 1 6 Civil Society Organization Authority 1 1 2 1 1 6 dzongkhagTrashigang 1 1 15 74 136 249 300 105 84 91 78 48 3 13 44 29 20 8 5 1,304 Samtse 1 30 83 136 219 294 66 84 90 48 28 1 4 24 39 18 11 5 12 1,193 Chhukha 1 16 57 144 183 226 63 82 65 48 29 3 15 30 18 13 8 14 1,015 Paro 1 46 79 175 201 54 55 48 63 55 21 7 27 36 12 7 7 10 904 Monggar 1 8 48 119 168 202 52 73 47 39 30 4 15 27 9 15 5 6 868 Wangdue Phodrang 1 18 41 110 185 124 53 55 46 46 19 6 23 45 6 10 7 10 805 Sarpang 1 31 50 110 154 121 57 46 51 32 25 1 20 20 14 4 2 3 742 Punakha 1 1 29 50 106 169 80 61 36 36 46 18 3 18 29 14 7 4 13 721 Dagana 1 7 34 59 128 176 45 73 47 34 31 9 29 8 15 9 10 715 Samdrupjongkhar 1 9 29 41 109 182 63 56 43 44 25 2 14 28 14 13 9 11 693 Pemagatsel 1 9 24 68 141 154 62 62 48 25 21 4 5 16 12 9 6 14 681 Zhemgang 1 3 23 31 87 215 50 63 44 25 23 2 12 19 12 7 6 10 633 Trashiyangtse 1 4 33 39 97 193 39 45 28 30 26 1 5 16 11 4 4 2 578 Tsirang 1 14 38 80 106 84 45 34 42 14 12 2 23 32 8 5 6 546 Bumthang 1 2 9 32 73 112 74 33 26 32 32 11 3 4 17 12 7 6 6 492 Lhuntse 1 3 23 35 81 150 34 33 34 18 22 1 6 17 4 7 4 7 480 Trongsa 1 4 20 55 84 107 31 39 19 29 11 10 12 5 5 5 10 447 Thimphu 1 20 30 65 86 40 40 27 25 27 12 5 10 22 7 4 6 4 431 Haa 1 5 17 52 80 73 32 28 22 13 12 1 7 16 4 5 3 10 381 Gasa 1 1 5 17 28 38 16 18 9 14 3 3 7 2 4 1 1 168 thromde Thimphu 1 1 109 165 306 341 71 30 20 58 55 22 3 14 18 8 14 15 1,251 Phuentsholing 1 1 21 37 67 52 18 18 11 21 16 9 2 2 1 5 7 2 11 302 Gelephu 1 17 29 32 51 16 7 5 15 10 6 4 1 5 2 4 4 5 214 Samdrupjongkhar 1 3 9 20 44 27 3 7 10 9 5 1 2 1 2 3 5 152 Non-civil Service AgencyDefence2 1 1 4 1 3 5 15 Corporations 1 1 2 1 5 Non Governemental Organizations 1 2 3 International Organizations 1 2 3
total 3 25 49 64 3 34 70 866 1,585 2,833 4,201 3,605 2,459 2,340 1,846 1,747 1,015 2 189 815 1,248 798 401 413 418 27,029
Note: 1Eminent Members of the National Council 2Finance and accounts staff placed in RBG/RBA/RBP
table 8 cont.
Civil service statistics | 21
Working agency No lvl1 eX1 eX2 eX3 es1 es2 es3 P1 P2 P3 P4 P5 s1 s2 s3 s4 s5 ss1 ss2 ss3 ss4 O1 O2 O3 O4 total
National Commission for Women & Children 1 1 2 3 4 2 3 1 1 1 1 2 22 Bhutan Narcotic Control Agency 1 2 2 2 2 2 1 1 1 1 1 3 19 Bhutan Olympic Committee 1 1 1 3 3 1 3 1 1 3 18 Bhutan National Legal Institute 5 3 1 2 1 1 1 1 1 1 17 Jigme Singye Wangchuck School of Law 1 1 4 2 2 1 1 2 14 Royal Privy Council 3 1 1 1 2 1 1 1 1 12 Bhutan Health Trust Fund 1 1 2 1 1 6 Civil Society Organization Authority 1 1 2 1 1 6 dzongkhagTrashigang 1 1 15 74 136 249 300 105 84 91 78 48 3 13 44 29 20 8 5 1,304 Samtse 1 30 83 136 219 294 66 84 90 48 28 1 4 24 39 18 11 5 12 1,193 Chhukha 1 16 57 144 183 226 63 82 65 48 29 3 15 30 18 13 8 14 1,015 Paro 1 46 79 175 201 54 55 48 63 55 21 7 27 36 12 7 7 10 904 Monggar 1 8 48 119 168 202 52 73 47 39 30 4 15 27 9 15 5 6 868 Wangdue Phodrang 1 18 41 110 185 124 53 55 46 46 19 6 23 45 6 10 7 10 805 Sarpang 1 31 50 110 154 121 57 46 51 32 25 1 20 20 14 4 2 3 742 Punakha 1 1 29 50 106 169 80 61 36 36 46 18 3 18 29 14 7 4 13 721 Dagana 1 7 34 59 128 176 45 73 47 34 31 9 29 8 15 9 10 715 Samdrupjongkhar 1 9 29 41 109 182 63 56 43 44 25 2 14 28 14 13 9 11 693 Pemagatsel 1 9 24 68 141 154 62 62 48 25 21 4 5 16 12 9 6 14 681 Zhemgang 1 3 23 31 87 215 50 63 44 25 23 2 12 19 12 7 6 10 633 Trashiyangtse 1 4 33 39 97 193 39 45 28 30 26 1 5 16 11 4 4 2 578 Tsirang 1 14 38 80 106 84 45 34 42 14 12 2 23 32 8 5 6 546 Bumthang 1 2 9 32 73 112 74 33 26 32 32 11 3 4 17 12 7 6 6 492 Lhuntse 1 3 23 35 81 150 34 33 34 18 22 1 6 17 4 7 4 7 480 Trongsa 1 4 20 55 84 107 31 39 19 29 11 10 12 5 5 5 10 447 Thimphu 1 20 30 65 86 40 40 27 25 27 12 5 10 22 7 4 6 4 431 Haa 1 5 17 52 80 73 32 28 22 13 12 1 7 16 4 5 3 10 381 Gasa 1 1 5 17 28 38 16 18 9 14 3 3 7 2 4 1 1 168 thromde Thimphu 1 1 109 165 306 341 71 30 20 58 55 22 3 14 18 8 14 15 1,251 Phuentsholing 1 1 21 37 67 52 18 18 11 21 16 9 2 2 1 5 7 2 11 302 Gelephu 1 17 29 32 51 16 7 5 15 10 6 4 1 5 2 4 4 5 214 Samdrupjongkhar 1 3 9 20 44 27 3 7 10 9 5 1 2 1 2 3 5 152 Non-civil Service AgencyDefence2 1 1 4 1 3 5 15 Corporations 1 1 2 1 5 Non Governemental Organizations 1 2 3 International Organizations 1 2 3
total 3 25 49 64 3 34 70 866 1,585 2,833 4,201 3,605 2,459 2,340 1,846 1,747 1,015 2 189 815 1,248 798 401 413 418 27,029
Note: 1Eminent Members of the National Council 2Finance and accounts staff placed in RBG/RBA/RBP
| Royal Civil Service Commission22
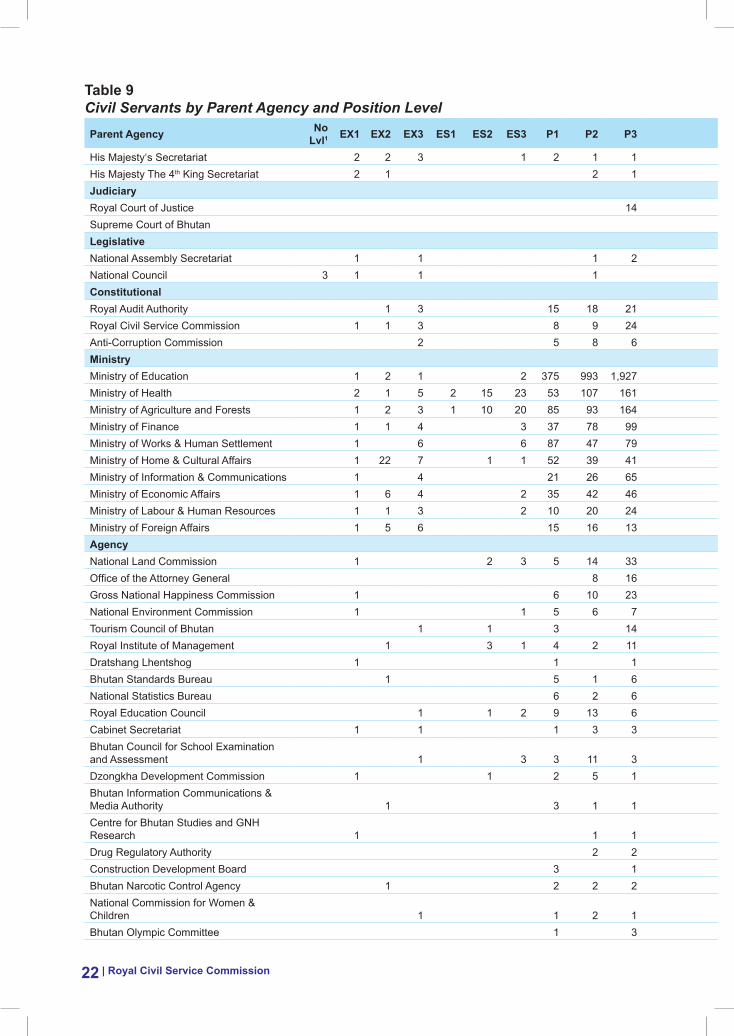
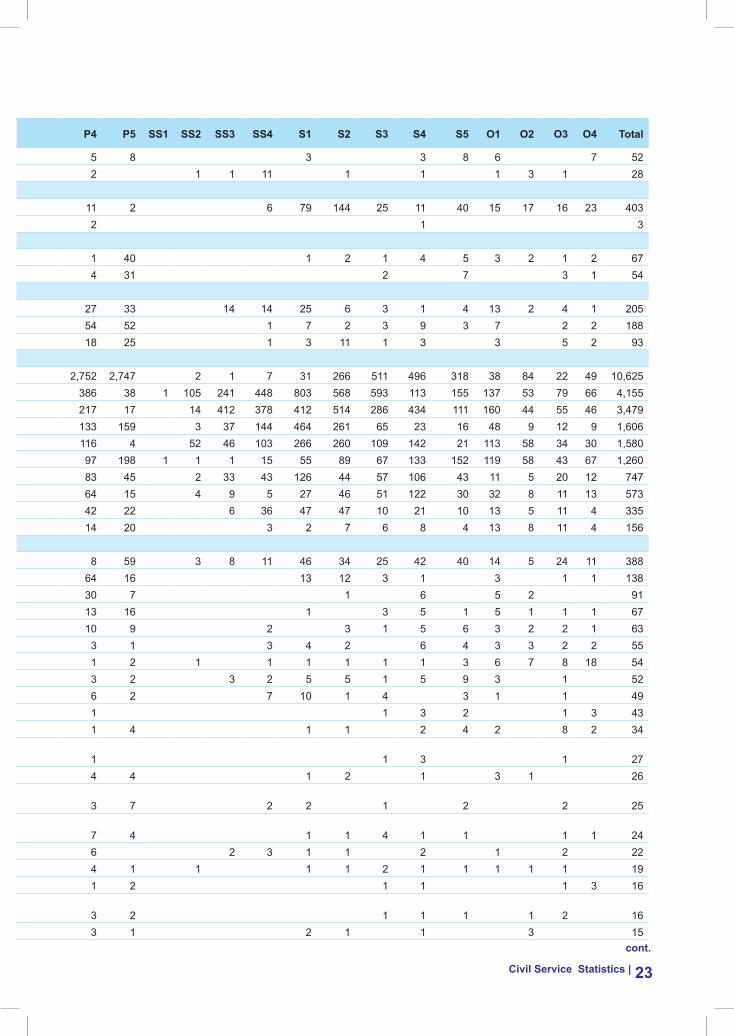
table 9 Civil Servants by Parent Agency and Position LevelParent agency No
lvl1 eX1 eX2 eX3 es1 es2 es3 P1 P2 P3 P4 P5 ss1 ss2 ss3 ss4 s1 s2 s3 s4 s5 O1 O2 O3 O4 total
His Majesty‘s Secretariat 2 2 3 1 2 1 1 5 8 3 3 8 6 7 52 His Majesty The 4th King Secretariat 2 1 2 1 2 1 1 11 1 1 1 3 1 28 Judiciary Royal Court of Justice 14 11 2 6 79 144 25 11 40 15 17 16 23 403 Supreme Court of Bhutan 2 1 3 legislativeNational Assembly Secretariat 1 1 1 2 1 40 1 2 1 4 5 3 2 1 2 67 National Council 3 1 1 1 4 31 2 7 3 1 54 ConstitutionalRoyal Audit Authority 1 3 15 18 21 27 33 14 14 25 6 3 1 4 13 2 4 1 205 Royal Civil Service Commission 1 1 3 8 9 24 54 52 1 7 2 3 9 3 7 2 2 188 Anti-Corruption Commission 2 5 8 6 18 25 1 3 11 1 3 3 5 2 93 ministryMinistry of Education 1 2 1 2 375 993 1,927 2,752 2,747 2 1 7 31 266 511 496 318 38 84 22 49 10,625 Ministry of Health 2 1 5 2 15 23 53 107 161 386 38 1 105 241 448 803 568 593 113 155 137 53 79 66 4,155 Ministry of Agriculture and Forests 1 2 3 1 10 20 85 93 164 217 17 14 412 378 412 514 286 434 111 160 44 55 46 3,479 Ministry of Finance 1 1 4 3 37 78 99 133 159 3 37 144 464 261 65 23 16 48 9 12 9 1,606 Ministry of Works & Human Settlement 1 6 6 87 47 79 116 4 52 46 103 266 260 109 142 21 113 58 34 30 1,580 Ministry of Home & Cultural Affairs 1 22 7 1 1 52 39 41 97 198 1 1 1 15 55 89 67 133 152 119 58 43 67 1,260 Ministry of Information & Communications 1 4 21 26 65 83 45 2 33 43 126 44 57 106 43 11 5 20 12 747 Ministry of Economic Affairs 1 6 4 2 35 42 46 64 15 4 9 5 27 46 51 122 30 32 8 11 13 573 Ministry of Labour & Human Resources 1 1 3 2 10 20 24 42 22 6 36 47 47 10 21 10 13 5 11 4 335 Ministry of Foreign Affairs 1 5 6 15 16 13 14 20 3 2 7 6 8 4 13 8 11 4 156 agencyNational Land Commission 1 2 3 5 14 33 8 59 3 8 11 46 34 25 42 40 14 5 24 11 388 Office of the Attorney General 8 16 64 16 13 12 3 1 3 1 1 138 Gross National Happiness Commission 1 6 10 23 30 7 1 6 5 2 91 National Environment Commission 1 1 5 6 7 13 16 1 3 5 1 5 1 1 1 67 Tourism Council of Bhutan 1 1 3 14 10 9 2 3 1 5 6 3 2 2 1 63 Royal Institute of Management 1 3 1 4 2 11 3 1 3 4 2 6 4 3 3 2 2 55 Dratshang Lhentshog 1 1 1 1 2 1 1 1 1 1 1 3 6 7 8 18 54 Bhutan Standards Bureau 1 5 1 6 3 2 3 2 5 5 1 5 9 3 1 52 National Statistics Bureau 6 2 6 6 2 7 10 1 4 3 1 1 49 Royal Education Council 1 1 2 9 13 6 1 1 3 2 1 3 43 Cabinet Secretariat 1 1 1 3 3 1 4 1 1 2 4 2 8 2 34 Bhutan Council for School Examination and Assessment 1 3 3 11 3 1 1 3 1 27 Dzongkha Development Commission 1 1 2 5 1 4 4 1 2 1 3 1 26 Bhutan Information Communications & Media Authority 1 3 1 1 3 7 2 2 1 2 2 25 Centre for Bhutan Studies and GNH Research 1 1 1 7 4 1 1 4 1 1 1 1 24 Drug Regulatory Authority 2 2 6 2 3 1 1 2 1 2 22 Construction Development Board 3 1 4 1 1 1 1 2 1 1 1 1 1 19 Bhutan Narcotic Control Agency 1 2 2 2 1 2 1 1 1 3 16 National Commission for Women & Children 1 1 2 1 3 2 1 1 1 1 2 16 Bhutan Olympic Committee 1 3 3 1 2 1 1 3 15
Civil service statistics | 23
table 9 Civil Servants by Parent Agency and Position LevelParent agency No
lvl1 eX1 eX2 eX3 es1 es2 es3 P1 P2 P3 P4 P5 ss1 ss2 ss3 ss4 s1 s2 s3 s4 s5 O1 O2 O3 O4 total
His Majesty‘s Secretariat 2 2 3 1 2 1 1 5 8 3 3 8 6 7 52 His Majesty The 4th King Secretariat 2 1 2 1 2 1 1 11 1 1 1 3 1 28 Judiciary Royal Court of Justice 14 11 2 6 79 144 25 11 40 15 17 16 23 403 Supreme Court of Bhutan 2 1 3 legislativeNational Assembly Secretariat 1 1 1 2 1 40 1 2 1 4 5 3 2 1 2 67 National Council 3 1 1 1 4 31 2 7 3 1 54 ConstitutionalRoyal Audit Authority 1 3 15 18 21 27 33 14 14 25 6 3 1 4 13 2 4 1 205 Royal Civil Service Commission 1 1 3 8 9 24 54 52 1 7 2 3 9 3 7 2 2 188 Anti-Corruption Commission 2 5 8 6 18 25 1 3 11 1 3 3 5 2 93 ministryMinistry of Education 1 2 1 2 375 993 1,927 2,752 2,747 2 1 7 31 266 511 496 318 38 84 22 49 10,625 Ministry of Health 2 1 5 2 15 23 53 107 161 386 38 1 105 241 448 803 568 593 113 155 137 53 79 66 4,155 Ministry of Agriculture and Forests 1 2 3 1 10 20 85 93 164 217 17 14 412 378 412 514 286 434 111 160 44 55 46 3,479 Ministry of Finance 1 1 4 3 37 78 99 133 159 3 37 144 464 261 65 23 16 48 9 12 9 1,606 Ministry of Works & Human Settlement 1 6 6 87 47 79 116 4 52 46 103 266 260 109 142 21 113 58 34 30 1,580 Ministry of Home & Cultural Affairs 1 22 7 1 1 52 39 41 97 198 1 1 1 15 55 89 67 133 152 119 58 43 67 1,260 Ministry of Information & Communications 1 4 21 26 65 83 45 2 33 43 126 44 57 106 43 11 5 20 12 747 Ministry of Economic Affairs 1 6 4 2 35 42 46 64 15 4 9 5 27 46 51 122 30 32 8 11 13 573 Ministry of Labour & Human Resources 1 1 3 2 10 20 24 42 22 6 36 47 47 10 21 10 13 5 11 4 335 Ministry of Foreign Affairs 1 5 6 15 16 13 14 20 3 2 7 6 8 4 13 8 11 4 156 agencyNational Land Commission 1 2 3 5 14 33 8 59 3 8 11 46 34 25 42 40 14 5 24 11 388 Office of the Attorney General 8 16 64 16 13 12 3 1 3 1 1 138 Gross National Happiness Commission 1 6 10 23 30 7 1 6 5 2 91 National Environment Commission 1 1 5 6 7 13 16 1 3 5 1 5 1 1 1 67 Tourism Council of Bhutan 1 1 3 14 10 9 2 3 1 5 6 3 2 2 1 63 Royal Institute of Management 1 3 1 4 2 11 3 1 3 4 2 6 4 3 3 2 2 55 Dratshang Lhentshog 1 1 1 1 2 1 1 1 1 1 1 3 6 7 8 18 54 Bhutan Standards Bureau 1 5 1 6 3 2 3 2 5 5 1 5 9 3 1 52 National Statistics Bureau 6 2 6 6 2 7 10 1 4 3 1 1 49 Royal Education Council 1 1 2 9 13 6 1 1 3 2 1 3 43 Cabinet Secretariat 1 1 1 3 3 1 4 1 1 2 4 2 8 2 34 Bhutan Council for School Examination and Assessment 1 3 3 11 3 1 1 3 1 27 Dzongkha Development Commission 1 1 2 5 1 4 4 1 2 1 3 1 26 Bhutan Information Communications & Media Authority 1 3 1 1 3 7 2 2 1 2 2 25 Centre for Bhutan Studies and GNH Research 1 1 1 7 4 1 1 4 1 1 1 1 24 Drug Regulatory Authority 2 2 6 2 3 1 1 2 1 2 22 Construction Development Board 3 1 4 1 1 1 1 2 1 1 1 1 1 19 Bhutan Narcotic Control Agency 1 2 2 2 1 2 1 1 1 3 16 National Commission for Women & Children 1 1 2 1 3 2 1 1 1 1 2 16 Bhutan Olympic Committee 1 3 3 1 2 1 1 3 15
cont.
| Royal Civil Service Commission24
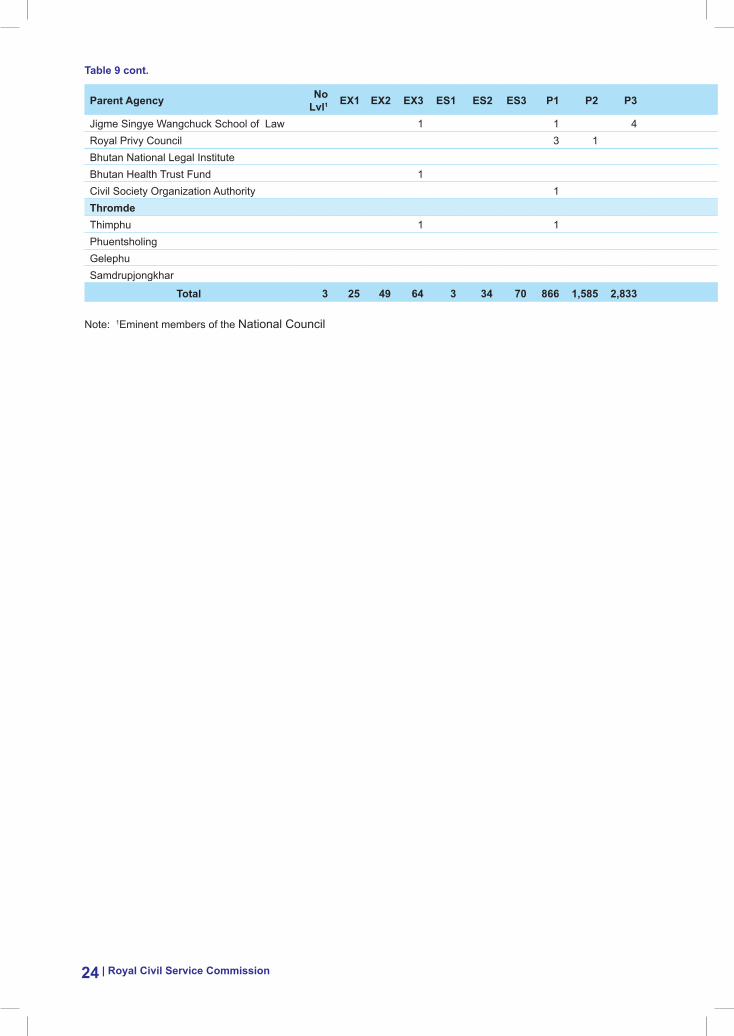
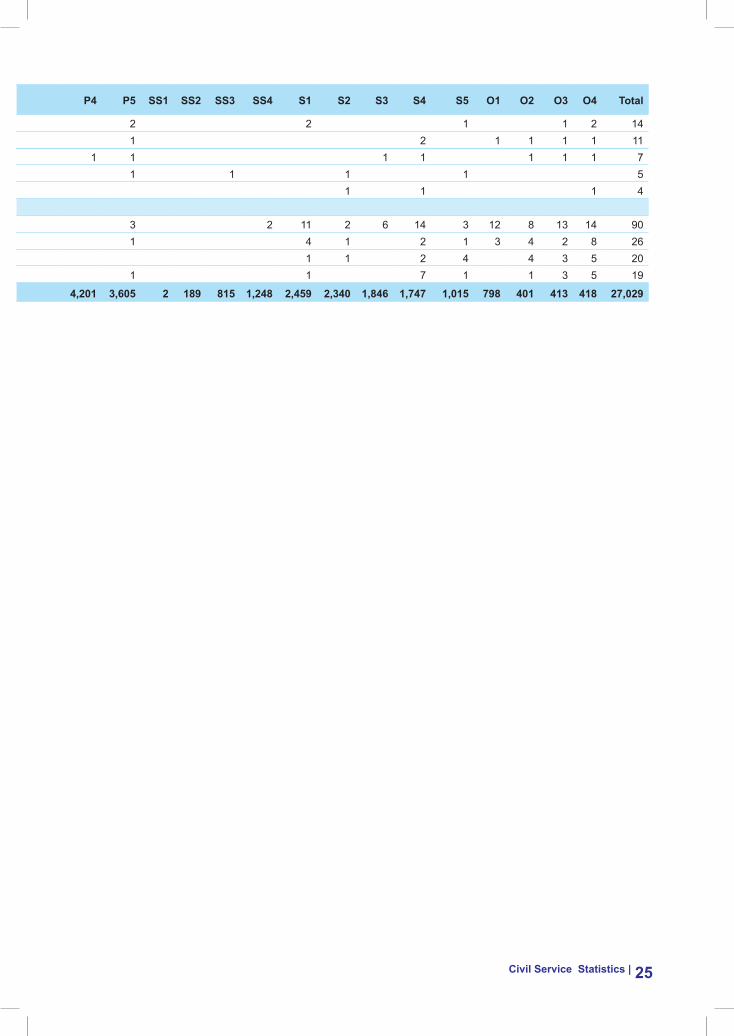
Parent agency Nolvl1 eX1 eX2 eX3 es1 es2 es3 P1 P2 P3 P4 P5 ss1 ss2 ss3 ss4 s1 s2 s3 s4 s5 O1 O2 O3 O4 total
Jigme Singye Wangchuck School of Law 1 1 4 2 2 1 1 2 14 Royal Privy Council 3 1 1 2 1 1 1 1 11 Bhutan National Legal Institute 1 1 1 1 1 1 1 7 Bhutan Health Trust Fund 1 1 1 1 1 5 Civil Society Organization Authority 1 1 1 1 4 thromde Thimphu 1 1 3 2 11 2 6 14 3 12 8 13 14 90 Phuentsholing 1 4 1 2 1 3 4 2 8 26 Gelephu 1 1 2 4 4 3 5 20 Samdrupjongkhar 1 1 7 1 1 3 5 19
total 3 25 49 64 3 34 70 866 1,585 2,833 4,201 3,605 2 189 815 1,248 2,459 2,340 1,846 1,747 1,015 798 401 413 418 27,029
Note: 1Eminent members of the National Council
table 9 cont.
Civil service statistics | 25
Parent agency Nolvl1 eX1 eX2 eX3 es1 es2 es3 P1 P2 P3 P4 P5 ss1 ss2 ss3 ss4 s1 s2 s3 s4 s5 O1 O2 O3 O4 total
Jigme Singye Wangchuck School of Law 1 1 4 2 2 1 1 2 14 Royal Privy Council 3 1 1 2 1 1 1 1 11 Bhutan National Legal Institute 1 1 1 1 1 1 1 7 Bhutan Health Trust Fund 1 1 1 1 1 5 Civil Society Organization Authority 1 1 1 1 4 thromde Thimphu 1 1 3 2 11 2 6 14 3 12 8 13 14 90 Phuentsholing 1 4 1 2 1 3 4 2 8 26 Gelephu 1 1 2 4 4 3 5 20 Samdrupjongkhar 1 1 7 1 1 3 5 19
total 3 25 49 64 3 34 70 866 1,585 2,833 4,201 3,605 2 189 815 1,248 2,459 2,340 1,846 1,747 1,015 798 401 413 418 27,029
Note: 1Eminent members of the National Council
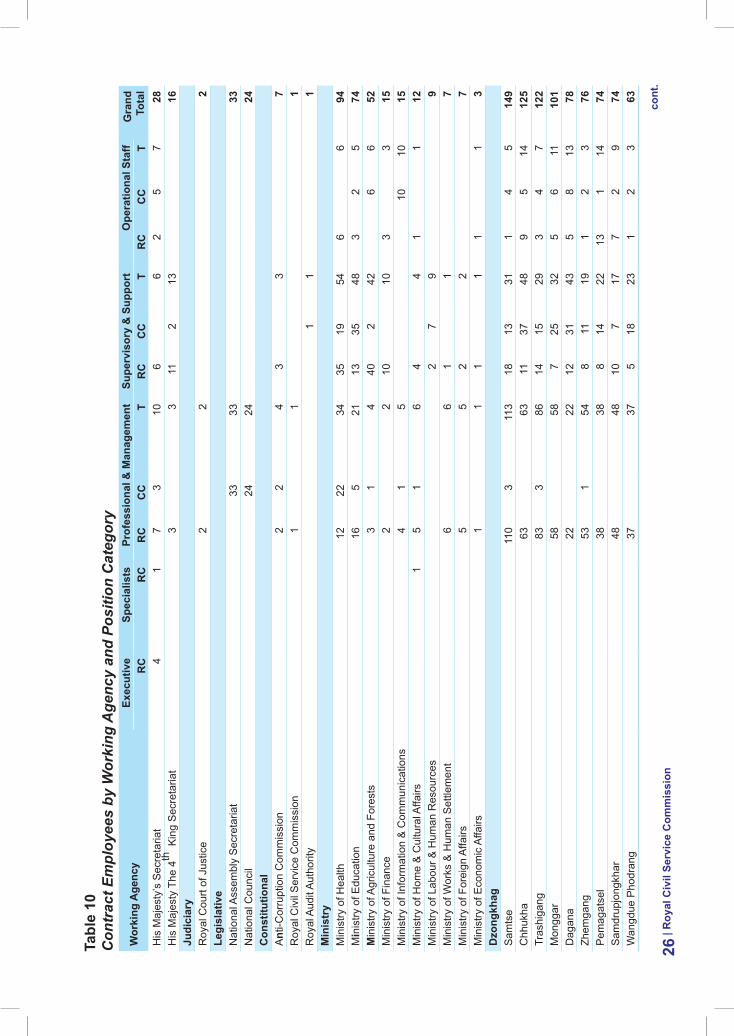
tabl
e 10
C
ontr
act E
mpl
oyee
s by
Wor
king
Age
ncy
and
Posi
tion
Cat
egor
yW
orki
ng a
genc
yex
ecut
ive
spec
ialis
tsPr
ofes
sion
al &
man
agem
ent
supe
rvis
ory
& s
uppo
rtO
pera
tiona
l sta
ffG
rand
to
tal
rC
rC
rC
CC
tr
CC
Ct
rC
CC
tH
is M
ajes
ty’s
Sec
reta
riat
41
73
106
62
57
28H
is M
ajes
ty T
he 4
th K
ing
Sec
reta
riat
33
112
1316
Judi
ciar
yR
oyal
Cou
rt of
Jus
tice
22
2le
gisl
ativ
eN
atio
nal A
ssem
bly
Sec
reta
riat
3333
33N
atio
nal C
ounc
il24
2424
Con
stitu
tiona
lA
nti-C
orru
ptio
n C
omm
issi
on2
24
33
7R
oyal
Civ
il S
ervi
ce C
omm
issi
on1
11
Roy
al A
udit
Aut
horit
y1
11
min
istr
yM
inis
try o
f Hea
lth12
2234
3519
546
694
Min
istry
of E
duca
tion
165
2113
3548
32
574
min
istry
of A
gric
ultu
re a
nd F
ores
ts3
14
402
426
652
Min
istry
of F
inan
ce2
210
103
315
Min
istry
of I
nfor
mat
ion
& C
omm
unic
atio
ns4
15
1010
15M
inis
try o
f Hom
e &
Cul
tura
l Affa
irs1
51
64
41
112
Min
istry
of L
abou
r & H
uman
Res
ourc
es2
79
9M
inis
try o
f Wor
ks &
Hum
an S
ettle
men
t6
61
17
Min
istry
of F
orei
gn A
ffairs
55
22
7M
inis
try o
f Eco
nom
ic A
ffairs
11
11
11
3d
zong
khag
Sam
tse
110
311
318
1331
14
514
9C
hhuk
ha63
6311
3748
95
1412
5Tr
ashi
gang
833
8614
1529
34
712
2M
ongg
ar58
587
2532
56
1110
1D
agan
a22
2212
3143
58
1378
Zhem
gang
531
548
1119
12
376
Pem
agat
sel
3838
814
2213
114
74S
amdr
upjo
ngkh
ar48
4810
717
72
974
Wan
gdue
Pho
dran
g37
375
1823
12
363
| roy
al C
ivil
serv
ice
Com
mis
sion
26co
nt.
Wor
king
age
ncy
exec
utiv
esp
ecia
lists
Prof
essi
onal
& m
anag
emen
tsu
perv
isor
y &
sup
port
Ope
ratio
nal s
taff
Gra
nd
tota
lr
Cr
Cr
CC
Ct
rC
CC
tr
CC
Ct
Tras
hiya
ngts
e37
138
512
175
560
Sar
pang
331
347
815
49P
unak
ha22
123
412
166
410
49Tr
ongs
a16
166
1521
15
643
Par
o17
118
116
171
136
Lhun
tse
201
214
48
12
332
Haa
1111
45
91
78
28Ts
irang
151
164
48
24B
umth
ang
88
45
96
623
Thim
phu
1010
35
81
119
Gas
a5
16
11
31
411
age
ncy
Nat
iona
l Lan
d C
omm
issi
on1
1819
163
193
58
46Ji
gme
Dor
ji W
angc
huk
Nat
iona
l Ref
erra
l H
ospi
tal (
JDW
NR
H)
101
115
27
18D
rats
hang
Lhe
ntsh
og1
11
14
812
14R
oyal
Edu
catio
n C
ounc
il11
1111
Roy
al P
rivy
Cou
ncil
21
33
Jigm
e S
ingy
e W
angc
huck
Sch
ool o
f La
w2
22
Cab
inet
Sec
reta
riat
11
22
Cen
tre fo
r Bhu
tan
Stu
dies
and
GN
H
Res
earc
h1
11
12
Roy
al In
stitu
te o
f Man
agem
ent
11
1B
huta
n N
atio
nal L
egal
Inst
itute
11
1B
huta
n In
form
atio
n C
omm
unic
atio
ns &
M
edia
Aut
horit
y1
11
Dzo
ngkh
a D
evel
opm
ent C
omm
issi
on1
1th
rom
deTh
imph
u50
151
111
128
871
Phu
ents
holin
g27
128
12
331
Sam
drup
jong
khar
1212
12
32
217
Gel
ephu
1010
11
11to
tal
43
899
129
1,02
830
033
663
690
107
197
1,86
8 N
ote:
R
C: R
egul
ar C
ontra
ct, C
C: C
onso
lidat
ed C
ontra
ct &
T: T
otal
| Civ
il se
rvic
e s
tatis
tics
27tabl
e 10
con
t.
| Royal Civil Service Commission28
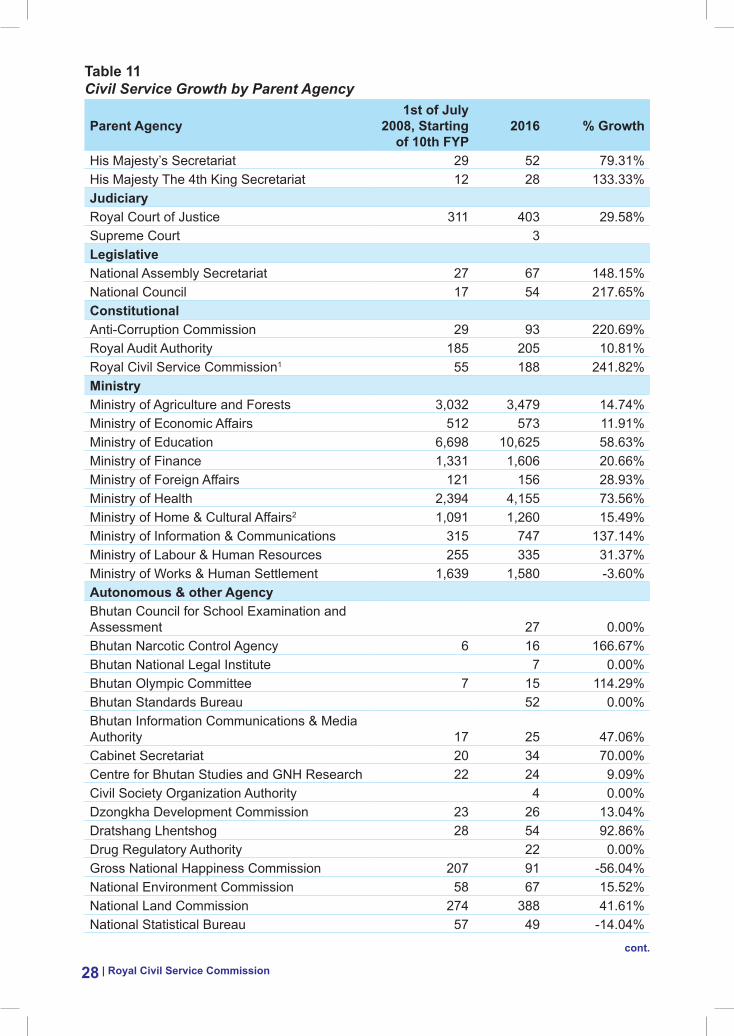
table 11 Civil Service Growth by Parent Agency
Parent agency1st of July
2008, starting of 10th FYP
2016 % Growth
His Majesty’s Secretariat 29 52 79.31%His Majesty The 4th King Secretariat 12 28 133.33%JudiciaryRoyal Court of Justice 311 403 29.58%Supreme Court 3legislativeNational Assembly Secretariat 27 67 148.15%National Council 17 54 217.65%ConstitutionalAnti-Corruption Commission 29 93 220.69%Royal Audit Authority 185 205 10.81%Royal Civil Service Commission1 55 188 241.82%ministryMinistry of Agriculture and Forests 3,032 3,479 14.74%Ministry of Economic Affairs 512 573 11.91%Ministry of Education 6,698 10,625 58.63%Ministry of Finance 1,331 1,606 20.66%Ministry of Foreign Affairs 121 156 28.93%Ministry of Health 2,394 4,155 73.56%Ministry of Home & Cultural Affairs2 1,091 1,260 15.49%Ministry of Information & Communications 315 747 137.14%Ministry of Labour & Human Resources 255 335 31.37%Ministry of Works & Human Settlement 1,639 1,580 -3.60%autonomous & other agencyBhutan Council for School Examination and Assessment 27 0.00%Bhutan Narcotic Control Agency 6 16 166.67%Bhutan National Legal Institute 7 0.00%Bhutan Olympic Committee 7 15 114.29%Bhutan Standards Bureau 52 0.00%Bhutan Information Communications & Media Authority 17 25 47.06%Cabinet Secretariat 20 34 70.00%Centre for Bhutan Studies and GNH Research 22 24 9.09%Civil Society Organization Authority 4 0.00%Dzongkha Development Commission 23 26 13.04%Dratshang Lhentshog 28 54 92.86%Drug Regulatory Authority 22 0.00%Gross National Happiness Commission 207 91 -56.04%National Environment Commission 58 67 15.52%National Land Commission 274 388 41.61%National Statistical Bureau 57 49 -14.04%
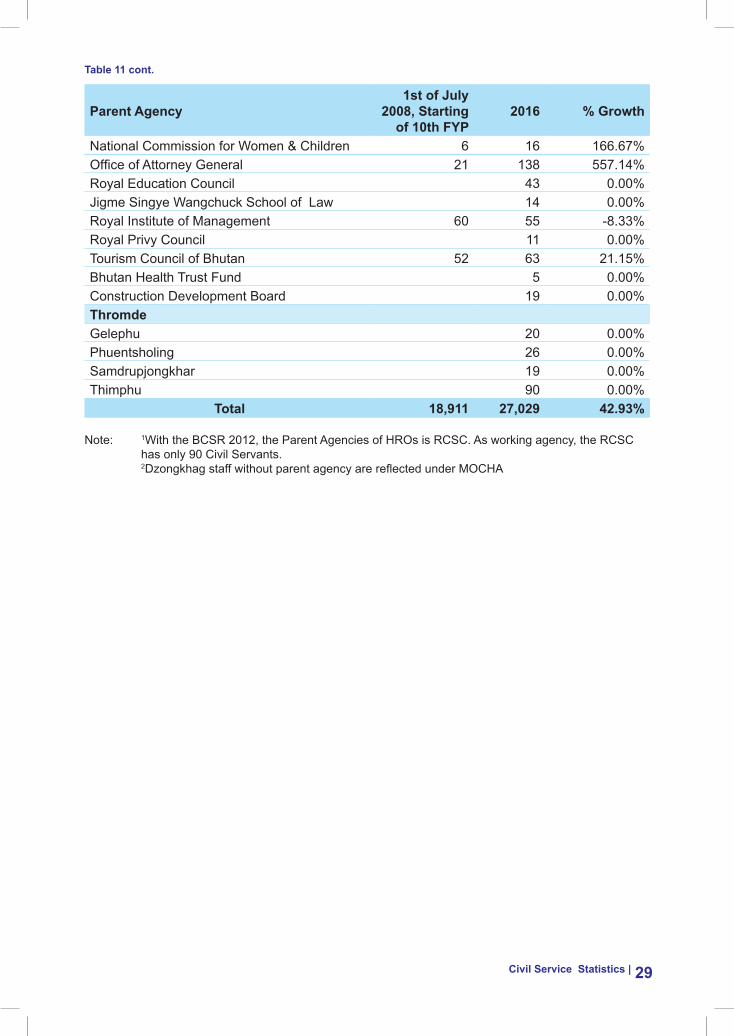
cont.
Civil service statistics | 29
Parent agency1st of July
2008, starting of 10th FYP
2016 % Growth
National Commission for Women & Children 6 16 166.67%Office of Attorney General 21 138 557.14%Royal Education Council 43 0.00%Jigme Singye Wangchuck School of Law 14 0.00%Royal Institute of Management 60 55 -8.33%Royal Privy Council 11 0.00%Tourism Council of Bhutan 52 63 21.15%Bhutan Health Trust Fund 5 0.00%Construction Development Board 19 0.00%thromdeGelephu 20 0.00%Phuentsholing 26 0.00%Samdrupjongkhar 19 0.00%Thimphu 90 0.00%
total 18,911 27,029 42.93%
Note: 1With the BCSR 2012, the Parent Agencies of HROs is RCSC. As working agency, the RCSC has only 90 Civil Servants.
2Dzongkhag staff without parent agency are reflected under MOCHA
table 11 cont.
| Royal Civil Service Commission30
table 12 Progressive Growth of Parent Agency
Parent agency2012 2013 2014 2015 2016
strength Growth strength Growth strength Growth strength Growth strength GrowthHis Majesty’s Secretariat 47 -4% 38 -19% 50 32% 51 2% 52 2%His Majesty The 4th King’s Secretariat 25 -4% 25 0% 27 8% 28 4% 28 0%JudiciaryRoyal Court of Justice 245 -17% 396 62% 485 22% 478 -1% 403 -16%Supreme Court 2 3 50%legislativeNational Assembly Secretariat 38 19% 37 -3% 37 0% 38 3% 67 76%National Council 30 36% 33 10% 32 -3% 31 -3% 54 74%ConstitutionalRoyal Audit Authority 202 3% 193 -4% 197 2% 197 0% 205 4%Royal Civil Service Commission1 52 -10% 156 200% 166 6% 183 10% 188 3%Anti-Corruption Commission 48 0% 60 25% 57 -5% 62 9% 93 50%ministryMinistry of Education 8,911 4% 9,231 4% 9,623 4% 10,040 4% 10,625 6%Ministry of Health 3,392 9% 3,551 5% 3,912 10% 4,055 4% 4,155 2%Ministry of Agriculture & Forest 3,540 4% 3,654 3% 3,695 1% 3,629 -2% 3,479 -4%Ministry of Finance 1,650 2% 1,728 5% 1,736 0% 1,693 -2% 1,606 -5%Ministry of Works & Human Settlement 1,703 5% 1,549 -9% 1,636 6% 1,620 -1% 1,580 -2%Ministry of Home & Cultural Affairs* 1,357 4% 1,318 -3% 1,346 2% 1,284 -5% 1,260 -2%Ministry of Information and Communications 756 11% 764 1% 782 2% 760 -3% 747 -2%Ministry of Economic Affairs 584 9% 584 0% 601 3% 596 -1% 573 -4%Ministry of Labour & Human Resources 356 0% 340 -4% 328 -4% 329 0% 335 2%Ministry of Foreign Affairs 165 4% 166 1% 161 -3% 158 -2% 156 -1%autonomous & other agencyNational Land Commission 363 7% 456 26% 445 -2% 382 -14% 388 2%Office of Attorney General 116 20% 132 14% 128 -3% 141 10% 138 -2%Gross National Happiness Commission 106 6% 104 -2% 98 -6% 97 -1% 91 -6%National Environment Commission 65 7% 70 8% 70 0% 67 -4% 67 0%Tourism Council of Bhutan 46 -2% 52 13% 59 13% 57 -3% 63 11%Royal Institute of Management 66 3% 63 -5% 60 -5% 55 -8% 55 0%Bhutan Standards Bureau 46 NA 44 -4% 54 23% 54 0% 54 0%National Statistical Bureau 56 4% 58 4% 57 -2% 56 -2% 52 -7%Dratshang Lhentshog 52 16% 51 -2% 51 0% 51 0% 49 -4%Royal Education Council 2 -50% 4 100% 2 -50% 1 -50% 43 4200%Cabinet Secretariat 30 15% 31 3% 34 10% 33 -3% 34 3%Bhutan Council for School Examination and Assessment 21 NA 25 19% 26 4% 24 -8% 27 13%Dzongkha Development Commission 26 0% 26 0% 23 -12% 23 0% 26 13%Centre for Bhutan Studies and GNH Research 24 -11% 23 -4% 24 4% 31 29% 25 -19%Bhutan Information Communications & Media Authority 21 -9% 27 29% 27 0% 25 -7% 24 -4%Drug Regulatory Authority 21 11% 21 0% 22 5% 22 0% 22 0%Construction Development Board 19 NA
Civil service statistics | 31
table 12 Progressive Growth of Parent Agency
Parent agency2012 2013 2014 2015 2016
strength Growth strength Growth strength Growth strength Growth strength GrowthHis Majesty’s Secretariat 47 -4% 38 -19% 50 32% 51 2% 52 2%His Majesty The 4th King’s Secretariat 25 -4% 25 0% 27 8% 28 4% 28 0%JudiciaryRoyal Court of Justice 245 -17% 396 62% 485 22% 478 -1% 403 -16%Supreme Court 2 3 50%legislativeNational Assembly Secretariat 38 19% 37 -3% 37 0% 38 3% 67 76%National Council 30 36% 33 10% 32 -3% 31 -3% 54 74%ConstitutionalRoyal Audit Authority 202 3% 193 -4% 197 2% 197 0% 205 4%Royal Civil Service Commission1 52 -10% 156 200% 166 6% 183 10% 188 3%Anti-Corruption Commission 48 0% 60 25% 57 -5% 62 9% 93 50%ministryMinistry of Education 8,911 4% 9,231 4% 9,623 4% 10,040 4% 10,625 6%Ministry of Health 3,392 9% 3,551 5% 3,912 10% 4,055 4% 4,155 2%Ministry of Agriculture & Forest 3,540 4% 3,654 3% 3,695 1% 3,629 -2% 3,479 -4%Ministry of Finance 1,650 2% 1,728 5% 1,736 0% 1,693 -2% 1,606 -5%Ministry of Works & Human Settlement 1,703 5% 1,549 -9% 1,636 6% 1,620 -1% 1,580 -2%Ministry of Home & Cultural Affairs* 1,357 4% 1,318 -3% 1,346 2% 1,284 -5% 1,260 -2%Ministry of Information and Communications 756 11% 764 1% 782 2% 760 -3% 747 -2%Ministry of Economic Affairs 584 9% 584 0% 601 3% 596 -1% 573 -4%Ministry of Labour & Human Resources 356 0% 340 -4% 328 -4% 329 0% 335 2%Ministry of Foreign Affairs 165 4% 166 1% 161 -3% 158 -2% 156 -1%autonomous & other agencyNational Land Commission 363 7% 456 26% 445 -2% 382 -14% 388 2%Office of Attorney General 116 20% 132 14% 128 -3% 141 10% 138 -2%Gross National Happiness Commission 106 6% 104 -2% 98 -6% 97 -1% 91 -6%National Environment Commission 65 7% 70 8% 70 0% 67 -4% 67 0%Tourism Council of Bhutan 46 -2% 52 13% 59 13% 57 -3% 63 11%Royal Institute of Management 66 3% 63 -5% 60 -5% 55 -8% 55 0%Bhutan Standards Bureau 46 NA 44 -4% 54 23% 54 0% 54 0%National Statistical Bureau 56 4% 58 4% 57 -2% 56 -2% 52 -7%Dratshang Lhentshog 52 16% 51 -2% 51 0% 51 0% 49 -4%Royal Education Council 2 -50% 4 100% 2 -50% 1 -50% 43 4200%Cabinet Secretariat 30 15% 31 3% 34 10% 33 -3% 34 3%Bhutan Council for School Examination and Assessment 21 NA 25 19% 26 4% 24 -8% 27 13%Dzongkha Development Commission 26 0% 26 0% 23 -12% 23 0% 26 13%Centre for Bhutan Studies and GNH Research 24 -11% 23 -4% 24 4% 31 29% 25 -19%Bhutan Information Communications & Media Authority 21 -9% 27 29% 27 0% 25 -7% 24 -4%Drug Regulatory Authority 21 11% 21 0% 22 5% 22 0% 22 0%Construction Development Board 19 NA
cont.
| Royal Civil Service Commission32
Parent agency2012 2013 2014 2015 2016
strength Growth strength Growth strength Growth strength Growth strength GrowthBhutan Narcotic Control Agency 16 14% 16 0% 16 0% 16 0% 16 0%NCWC 11 0% 13 18% 14 8% 15 7% 16 7%Bhutan Olympic Committee 6 0% 6 0% 16 167% 15 -6% 15 0%Jigme Singye Wangchuck School of Law 7 NA 7 0% 10 43% 14 40%Royal Privy Council 10 0% 9 -10% 11 22% 11 0% 11 0%Bhutan National Legal Institute 3 NA 7 133% 11 57% 7 -36% 7 0%Bhutan Health Trust Fund 5 NACivil Society Organisation Authority 3 NA 2 -33% 2 0% 4 100%thromdeThimphu 102 NA 116 14% 116 0% 90 -22%Phuentsholing 31 NA 29 -6% 27 -7% 26 -4%Gelephu 23 NA 24 4% 22 -8% 20 -9%Samdrup Jongkhar 15 NA 23 53% 17 -26% 19 12%
Cumulative Growth 24,208 4.88% 25,242 4.27% 26,320 4.27% 26,611 1.11% 27,029 1.57%
Note: 1With the BCSR 2012, the Parent agencies of HROs is RCSC. As working agency, the RCSC has only 90 Civil Servants while rest are with Ministries, Autonomous Agencies, Dzongkhags and Thromdes.
table 12 cont.
Civil service statistics | 33
Parent agency2012 2013 2014 2015 2016
strength Growth strength Growth strength Growth strength Growth strength GrowthBhutan Narcotic Control Agency 16 14% 16 0% 16 0% 16 0% 16 0%NCWC 11 0% 13 18% 14 8% 15 7% 16 7%Bhutan Olympic Committee 6 0% 6 0% 16 167% 15 -6% 15 0%Jigme Singye Wangchuck School of Law 7 NA 7 0% 10 43% 14 40%Royal Privy Council 10 0% 9 -10% 11 22% 11 0% 11 0%Bhutan National Legal Institute 3 NA 7 133% 11 57% 7 -36% 7 0%Bhutan Health Trust Fund 5 NACivil Society Organisation Authority 3 NA 2 -33% 2 0% 4 100%thromdeThimphu 102 NA 116 14% 116 0% 90 -22%Phuentsholing 31 NA 29 -6% 27 -7% 26 -4%Gelephu 23 NA 24 4% 22 -8% 20 -9%Samdrup Jongkhar 15 NA 23 53% 17 -26% 19 12%
Cumulative Growth 24,208 4.88% 25,242 4.27% 26,320 4.27% 26,611 1.11% 27,029 1.57%
Note: 1With the BCSR 2012, the Parent agencies of HROs is RCSC. As working agency, the RCSC has only 90 Civil Servants while rest are with Ministries, Autonomous Agencies, Dzongkhags and Thromdes.
tabl
e 13
C
ivil
Serv
ants
und
er D
zong
khag
/Thr
omde
Adm
inis
trat
ion
by P
ositi
on C
ateg
ory
dzo
ngkh
agex
ecut
ive
spec
ialis
tPr
ofes
sion
al &
man
agem
ent
supe
rvis
ory
& s
uppo
rtO
pera
tiona
lG
rand
to
tal
rC
tr
Ct
rC
tr
Ct
rC
tTr
ashi
gang
1
11
168
886
774
437
2946
655
762
1,30
4S
amts
e 1
10
649
113
762
353
3138
441
546
1,19
3C
hhuk
ha
11
056
363
626
287
4833
539
1453
1,01
5P
aro
11
053
718
555
295
1731
235
136
904
Mon
ggar
1
10
487
5854
525
532
287
2411
3586
8W
angd
ue P
hodr
ang
11
044
137
478
270
2329
330
333
805
Sar
pang
1
10
432
3446
623
715
252
2323
742
Pun
akha
1
11
141
123
434
231
1624
728
1038
721
Dag
ana
11
038
222
404
225
4326
829
1342
715
Sam
drup
jong
khar
1
10
322
4837
025
817
275
389
4769
3P
emag
atse
l 1
10
358
3839
622
122
243
2714
4168
1Zh
emga
ng
11
030
554
359
219
1923
832
335
633
Tras
hiya
ngts
e 1
10
328
3836
617
317
190
165
2157
8Ts
irang
1
10
306
1632
219
68
204
1919
546
Bum
than
g 1
12
229
28
300
149
915
825
631
492
Lhun
tse
11
027
121
292
157
816
519
322
480
Tron
gsa
11
025
416
270
130
2115
119
625
447
Thim
phu
11
023
110
241
160
816
820
121
431
Haa
1
10
216
1122
712
29
131
148
2238
1G
asa
11
083
689
691
704
48
168
thro
mde
Thim
phu
11
11
941
5199
219
012
202
478
551,
251
Phu
ents
holin
g1
11
116
728
195
773
8025
2530
2G
elep
hu T
hrom
de1
10
135
1014
552
153
1515
214
Sam
drup
jong
khar
11
091
1210
335
338
82
1015
2to
tal
240
246
06
8,89
082
19,
711
4,79
841
25,
210
632
133
765
15,7
16
Not
e:
R: R
egul
ar, C
: Con
tract
& T
: Tot
al
| roy
al C
ivil
serv
ice
Com
mis
sion
34
Civil service statistics | 35
table 14 Civil Servants under Dzongkhag/Thromde Administration by Position Level
Position Category and Position level
Under dzongkhag & thromde administration as
on 31st december2016
total strength as on 31st
december 2016
% of the total
executive PositionNo Level1 0 3 0.00%EX1 0 25 0.00%EX2 18 49 36.73%EX3 6 64 9.38%
total 24 141 17.02%specialist PositionES1 0 3 0.00%ES2 0 34 0.00%ES3 6 70 8.57%
total 6 107 5.61%Professional & management PositionP1 431 866 49.77%P2 1030 1,585 64.98%P3 2076 2,833 73.28%P4 3155 4,201 75.10%P5 3019 3,605 83.74%
total 9,711 13,090 74.19%supervisory & support PositionSS1 1 2 50.00%SS2 59 189 31.22%SS3 271 815 33.25%SS4 522 1248 41.83%S1 1060 2459 43.11%S2 1055 2340 45.09%S3 986 1846 53.41%S4 787 1747 45.05%S5 469 1015 46.21%
total 5,210 11,661 44.68%Operational PositionO1 244 798 30.58%O2 193 401 48.13%O3 134 413 32.45%O4 194 418 46.41%
total 765 2,030 37.68%Grand total 15,716 27,029 58.14%
Note: 1Eminent members of the National Council
tabl
e 15
C
ivil
Serv
ants
by
Loca
tion
and
Posi
tion
Cat
egor
ylo
catio
nex
ecut
ive
spec
ialis
tPr
ofes
sion
al &
mgt
.su
perv
isor
y &
Ope
ratio
nal
Gra
nd
tota
lr
Ct
rC
tr
Ct
rC
tr
Ct
Thim
phu
106
411
088
391
3,59
624
23,
838
3,34
419
23,
536
827
5788
48,
459
Chh
ukha
22
33
845
9393
879
954
853
122
1413
61,
932
Sar
pang
22
22
679
4972
876
937
806
107
511
21,
650
Tras
higa
ng1
11
171
786
803
625
2965
490
898
1,55
7M
ongg
ar1
12
256
860
628
644
3567
973
1184
1,39
4S
amts
e1
10
676
113
789
500
3553
554
559
1,38
4P
aro
33
44
631
3166
258
517
602
864
901,
361
Sam
drup
jong
khar
22
047
562
537
512
2153
371
1182
1,15
4W
angd
ue P
hodr
ang
11
11
471
3750
845
825
483
503
531,
046
Bum
than
g1
12
235
98
367
418
2344
180
1090
901
Pun
akha
11
11
423
2344
628
816
304
4310
5380
5Zh
emga
ng1
10
330
5438
434
619
365
463
4979
9D
agan
a1
10
388
2241
024
643
289
3113
4474
4P
emag
atsh
el1
10
360
3839
823
522
257
3014
4470
0Ts
irang
11
031
816
334
297
830
525
2566
5Tr
ashi
yang
tse
11
033
438
372
239
1825
722
527
657
Tron
gsa
11
026
616
282
216
2123
729
635
555
Lhun
tse
11
027
121
292
167
817
519
322
490
Haa
11
022
211
233
160
916
920
929
432
Gas
a1
10
886
9414
94
153
84
1226
0O
utsi
de B
huta
n7
70
452
4728
282
284
tota
l13
74
141
104
310
712
,062
1,02
813
,090
11,0
2563
611
,661
1,83
319
72,
030
27,0
29 N
ote:
E
min
ent m
embe
rs o
f the
Nat
iona
l Cou
ncil
are
refle
cted
und
er E
xecu
tive
Ser
vice
s
R: R
egul
ar, C
: Con
tract
& T
: Tot
al
| roy
al C
ivil
serv
ice
Com
mis
sion
36
Civil service statistics | 37
table 16 Civil Servants by Location and Dzongkhag/Thromde Administration
location
Civil servants under dzongkhag / thromde
administration
Civil servants by location1
r C t r C tThimphu 412 19 431 7,961 498 8,459Chhukha 890 125 1,015 1,771 161 1,932Sarpang 693 49 742 1,559 91 1,650Trashigang 1,182 122 1,304 1,434 123 1,557Monggar 767 101 868 1,288 106 1,394Samtse 1,044 149 1,193 1,231 153 1,384Paro 868 36 904 1,309 52 1,361Samdrupjongkhar 619 74 693 1,060 94 1,154Wangdue Phodrang 742 63 805 981 65 1,046Bumthang 469 23 492 860 41 901Punakha 672 49 721 756 49 805Zhemgang 557 76 633 723 76 799Dagana 637 78 715 666 78 744Pemagatshel 607 74 681 626 74 700Tsirang 522 24 546 641 24 665Trashiyangtse 518 60 578 596 61 657Trongsa 404 43 447 512 43 555Lhuntse 448 32 480 458 32 490Haa 353 28 381 403 29 432Gasa 157 11 168 246 14 260
total 12,561 1,236 13,797 25,081 1,864 26,945thromdeThimphu 1,180 71 1,251Phuentsholing 271 31 302Gelephu 203 11 214Samdrupjongkhar Outside Bhutan 135 17 152 80 4 84
total 1,789 130 1,919 80 4 84Grand total 14,350 1,366 15,716 25,161 1,868 27,029
Note: R: Regular, C: Contract & T: Total 1Civil Servants by location include civil servants of all Agencies based in the respective
Dzongkhags.
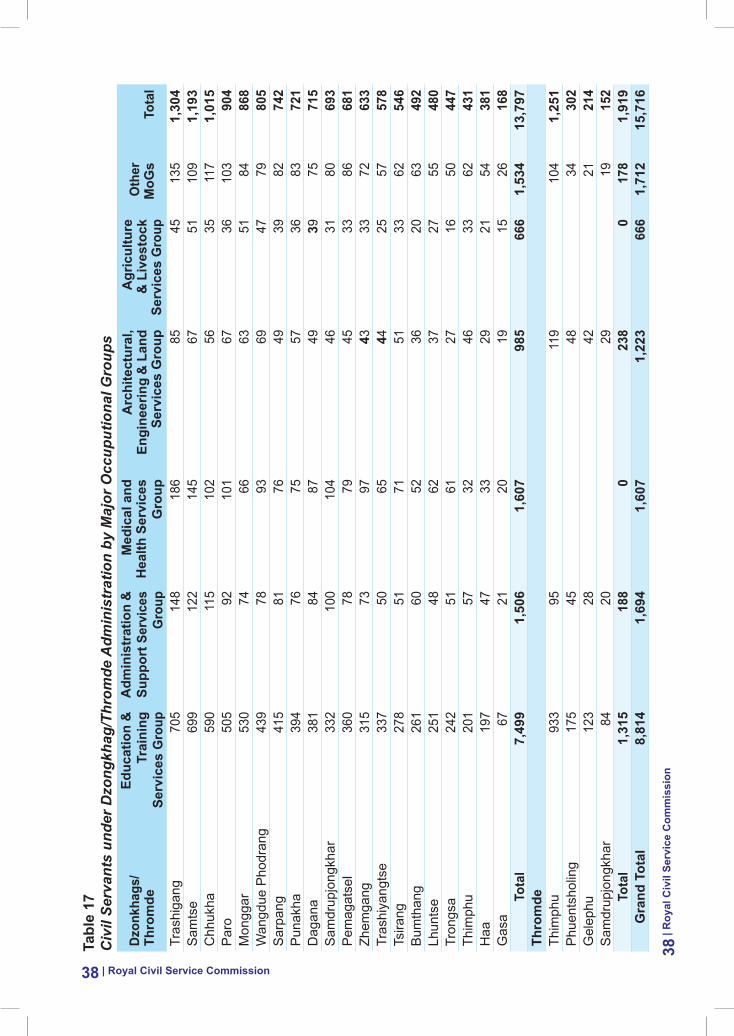
| Royal Civil Service Commission38
tabl
e 17
C
ivil
Serv
ants
und
er D
zong
khag
/Thr
omde
Adm
inis
trat
ion
by M
ajor
Occ
uput
iona
l Gro
ups
dzon
khag
s/
thro
mde
educ
atio
n &
trai
ning
se
rvic
es G
roup
adm
inis
trat
ion
&
supp
ort s
ervi
ces
Gro
up
med
ical
and
H
ealth
ser
vice
sG
roup
arc
hite
ctur
al,
engi
neer
ing
& l
and
serv
ices
Gro
up
agr
icul
ture
&
liv
esto
ck
serv
ices
Gro
upO
ther
m
oGs
tota
l
Tras
higa
ng70
514
818
685
4513
51,
304
Sam
tse
699
122
145
6751
109
1,19
3C
hhuk
ha59
011
510
256
3511
71,
015
Par
o50
592
101
6736
103
904
Mon
ggar
530
7466
6351
8486
8W
angd
ue P
hodr
ang
439
7893
6947
7980
5S
arpa
ng41
581
7649
3982
742
Pun
akha
394
7675
5736
8372
1D
agan
a38
184
8749
3975
715
Sam
drup
jong
khar
332
100
104
4631
8069
3P
emag
atse
l36
078
7945
3386
681
Zhem
gang
315
7397
4333
7263
3Tr
ashi
yang
tse
337
5065
4425
5757
8Ts
irang
278
5171
5133
6254
6B
umth
ang
261
6052
3620
6349
2Lh
unts
e25
148
6237
2755
480
Tron
gsa
242
5161
2716
5044
7Th
imph
u20
157
3246
3362
431
Haa
197
4733
2921
5438
1G
asa
6721
2019
1526
168
tota
l7,
499
1,50
61,
607
985
666
1,53
413
,797
thro
mde
Thim
phu
933
9511
910
41,
251
Phu
ents
holin
g17
545
4834
302
Gel
ephu
123
2842
2121
4S
amdr
upjo
ngkh
ar84
2029
1915
2to
tal
1,31
518
80
238
017
81,
919
Gra
nd t
otal
8,81
41,
694
1,60
71,
223
666
1,71
215
,716
| roy
al C
ivil
serv
ice
Com
mis
sion
38
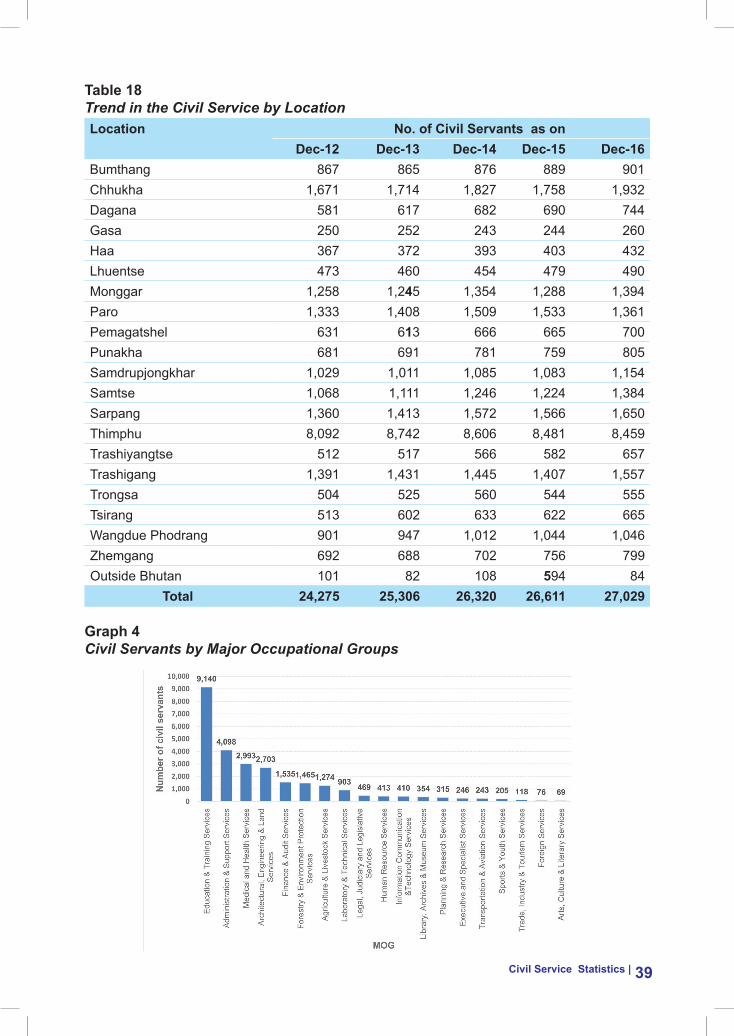
Civil service statistics | 39
table 18 Trend in the Civil Service by Location location No. of Civil servants as on
dec-12 dec-13 dec-14 dec-15 dec-16Bumthang 867 865 876 889 901Chhukha 1,671 1,714 1,827 1,758 1,932Dagana 581 617 682 690 744Gasa 250 252 243 244 260Haa 367 372 393 403 432Lhuentse 473 460 454 479 490Monggar 1,258 1,245 1,354 1,288 1,394Paro 1,333 1,408 1,509 1,533 1,361Pemagatshel 631 613 666 665 700Punakha 681 691 781 759 805Samdrupjongkhar 1,029 1,011 1,085 1,083 1,154Samtse 1,068 1,111 1,246 1,224 1,384Sarpang 1,360 1,413 1,572 1,566 1,650Thimphu 8,092 8,742 8,606 8,481 8,459Trashiyangtse 512 517 566 582 657Trashigang 1,391 1,431 1,445 1,407 1,557Trongsa 504 525 560 544 555Tsirang 513 602 633 622 665Wangdue Phodrang 901 947 1,012 1,044 1,046Zhemgang 692 688 702 756 799Outside Bhutan 101 82 108 594 84
total 24,275 25,306 26,320 26,611 27,029
Graph 4Civil Servants by Major Occupational Groups
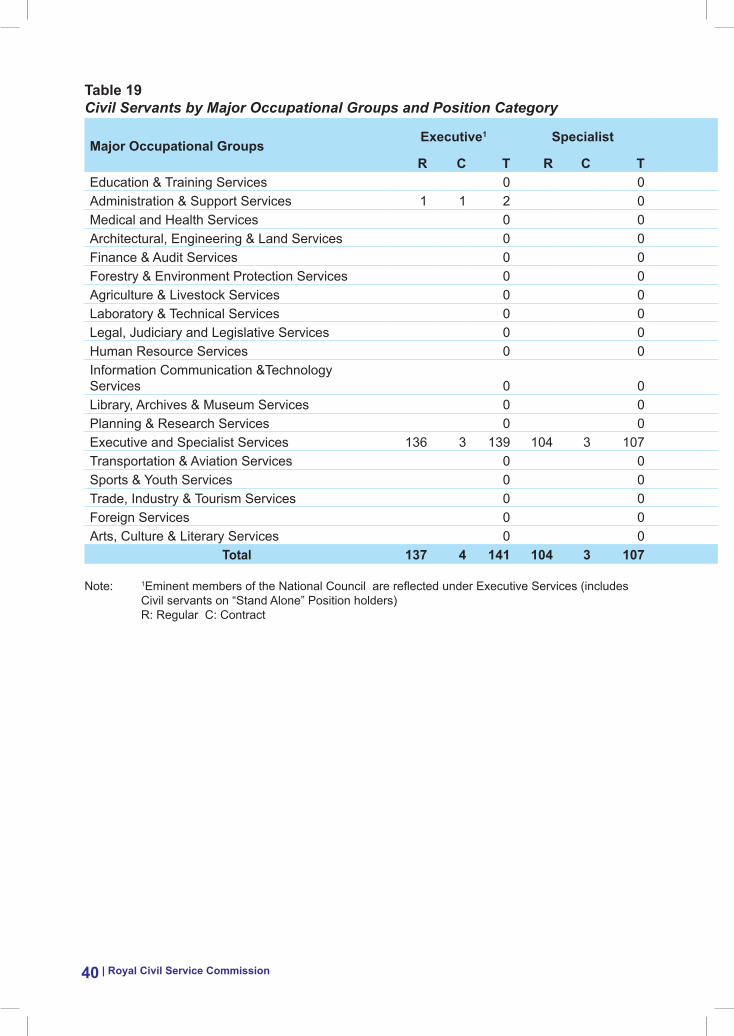
| Royal Civil Service Commission40
table 19 Civil Servants by Major Occupational Groups and Position Category
major Occupational Groupsexecutive1 specialist Professional &
management supervisory & support Operational Grand total
% of the
totalr C t r C t r C t r C t r C tEducation & Training Services 0 0 7,930 825 8,755 145 240 385 0 9,140 33.82%Administration & Support Services 1 1 2 0 710 23 733 1,494 32 1,526 1,653 184 1,837 4,098 15.16%Medical and Health Services 0 0 498 62 560 2,378 54 2,432 1 1 2,993 11.07%Architectural, Engineering & Land Services 0 0 633 33 666 1,791 54 1,845 179 13 192 2,703 10.00%Finance & Audit Services 0 0 511 1 512 1,010 13 1,023 0 1,535 5.68%Forestry & Environment Protection Services 0 0 211 2 213 1,224 28 1,252 0 1,465 5.42%Agriculture & Livestock Services 0 0 306 1 307 967 967 0 1,274 4.71%Laboratory & Technical Services 0 0 65 2 67 760 76 836 0 903 3.34%Legal, Judiciary and Legislative Services 0 0 185 1 186 280 3 283 0 469 1.74%Human Resource Services 0 0 233 1 234 178 1 179 0 413 1.53%Information Communication &Technology Services 0 0 197 9 206 203 1 204 0 410 1.52%Library, Archives & Museum Services 0 0 27 27 325 2 327 0 354 1.31%Planning & Research Services 0 0 224 63 287 28 28 0 315 1.17%Executive and Specialist Services 136 3 139 104 3 107 0 0 0 246 0.91%Transportation & Aviation Services 0 0 43 1 44 199 199 0 243 0.90%Sports & Youth Services 0 0 73 73 4 128 132 0 205 0.76%Trade, Industry & Tourism Services 0 0 100 100 18 18 0 118 0.44%Foreign Services 0 0 72 4 76 0 0 76 0.28%Arts, Culture & Literary Services 0 0 44 44 21 4 25 0 69 0.26%
total 137 4 141 104 3 107 12,062 1,028 13,090 11,025 636 11,661 1,833 197 2,030 27,029 100%
Note: 1Eminent members of the National Council are reflected under Executive Services (includes Civil servants on “Stand Alone” Position holders)
R: Regular C: Contract
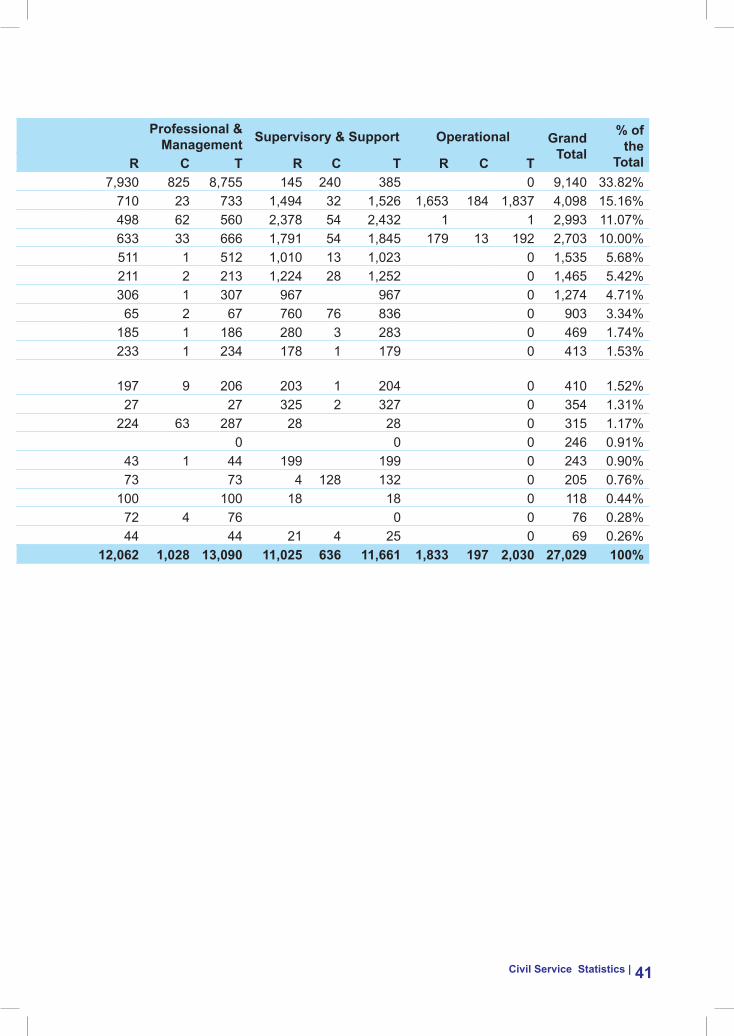
Civil service statistics | 41
table 19 Civil Servants by Major Occupational Groups and Position Category
major Occupational Groupsexecutive1 specialist Professional &
management supervisory & support Operational Grand total
% of the
totalr C t r C t r C t r C t r C tEducation & Training Services 0 0 7,930 825 8,755 145 240 385 0 9,140 33.82%Administration & Support Services 1 1 2 0 710 23 733 1,494 32 1,526 1,653 184 1,837 4,098 15.16%Medical and Health Services 0 0 498 62 560 2,378 54 2,432 1 1 2,993 11.07%Architectural, Engineering & Land Services 0 0 633 33 666 1,791 54 1,845 179 13 192 2,703 10.00%Finance & Audit Services 0 0 511 1 512 1,010 13 1,023 0 1,535 5.68%Forestry & Environment Protection Services 0 0 211 2 213 1,224 28 1,252 0 1,465 5.42%Agriculture & Livestock Services 0 0 306 1 307 967 967 0 1,274 4.71%Laboratory & Technical Services 0 0 65 2 67 760 76 836 0 903 3.34%Legal, Judiciary and Legislative Services 0 0 185 1 186 280 3 283 0 469 1.74%Human Resource Services 0 0 233 1 234 178 1 179 0 413 1.53%Information Communication &Technology Services 0 0 197 9 206 203 1 204 0 410 1.52%Library, Archives & Museum Services 0 0 27 27 325 2 327 0 354 1.31%Planning & Research Services 0 0 224 63 287 28 28 0 315 1.17%Executive and Specialist Services 136 3 139 104 3 107 0 0 0 246 0.91%Transportation & Aviation Services 0 0 43 1 44 199 199 0 243 0.90%Sports & Youth Services 0 0 73 73 4 128 132 0 205 0.76%Trade, Industry & Tourism Services 0 0 100 100 18 18 0 118 0.44%Foreign Services 0 0 72 4 76 0 0 76 0.28%Arts, Culture & Literary Services 0 0 44 44 21 4 25 0 69 0.26%
total 137 4 141 104 3 107 12,062 1,028 13,090 11,025 636 11,661 1,833 197 2,030 27,029 100%
Note: 1Eminent members of the National Council are reflected under Executive Services (includes Civil servants on “Stand Alone” Position holders)
R: Regular C: Contract
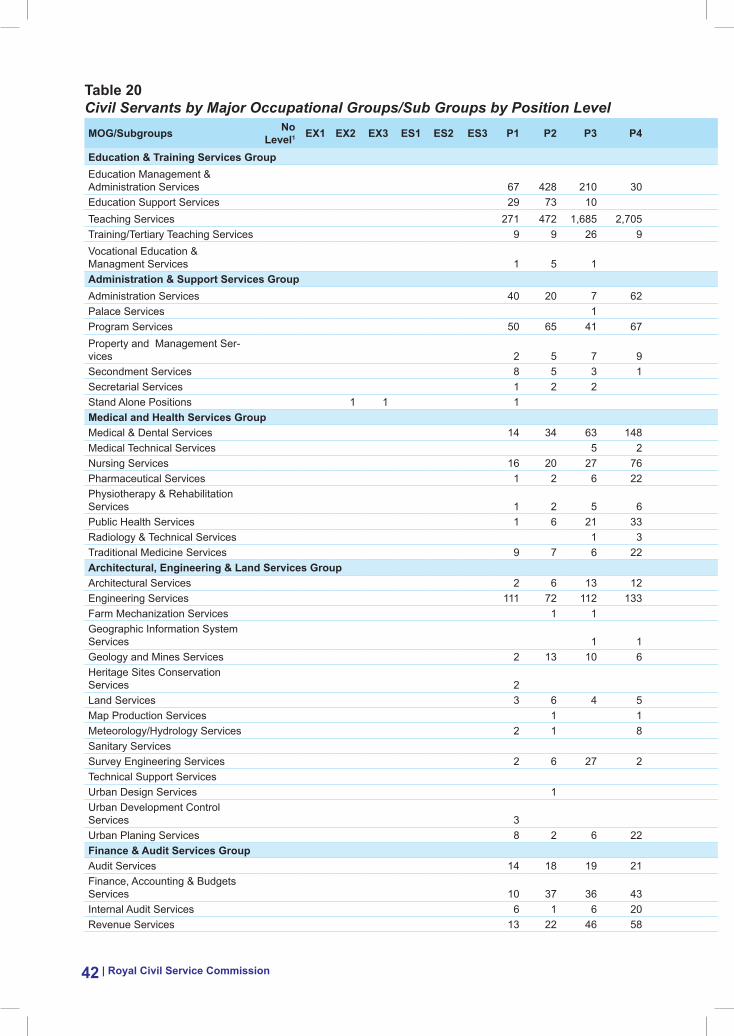
| Royal Civil Service Commission42
table 20Civil Servants by Major Occupational Groups/Sub Groups by Position LevelmOG/subgroups No
level1 eX1 eX2 eX3 es1 es2 es3 P1 P2 P3 P4 P5 ss1 ss2 ss3 ss4 s1 s2 s3 s4 s5 O1 O2 O3 O4 total
education & training services GroupEducation Management & Administration Services 67 428 210 30 735 Education Support Services 29 73 10 112 Teaching Services 271 472 1,685 2,705 2,710 9 183 8,035 Training/Tertiary Teaching Services 9 9 26 9 5 9 42 55 64 2 14 7 251 Vocational Education & Managment Services 1 5 1 7 administration & support services GroupAdministration Services 40 20 7 62 230 4 1 6 6 5 627 278 407 416 2,109 Palace Services 1 2 2 11 8 3 4 1 1 1 34 Program Services 50 65 41 67 42 265 Property and Management Ser-vices 2 5 7 9 50 1 13 19 60 93 47 3 4 1 314 Secondment Services 8 5 3 1 17 Secretarial Services 1 2 2 10 1 5 25 89 175 211 385 330 25 1,261 Stand Alone Positions 1 1 1 2 2 1 3 13 73 1 98 medical and Health services GroupMedical & Dental Services 14 34 63 148 259 Medical Technical Services 5 2 36 37 73 71 90 6 1 321 Nursing Services 16 20 27 76 1 82 65 173 410 106 123 16 17 1 1,133 Pharmaceutical Services 1 2 6 22 24 35 21 50 43 204 Physiotherapy & Rehabilitation Services 1 2 5 6 2 9 20 17 12 74 Public Health Services 1 6 21 33 1 18 70 136 162 167 136 11 762 Radiology & Technical Services 1 3 11 12 18 25 26 2 98 Traditional Medicine Services 9 7 6 22 7 14 36 41 142 architectural, engineering & land services GroupArchitectural Services 2 6 13 12 3 7 21 4 2 1 71 Engineering Services 111 72 112 133 70 58 114 215 151 14 2 1,052 Farm Mechanization Services 1 1 7 2 2 13 Geographic Information System Services 1 1 1 3 Geology and Mines Services 2 13 10 6 1 14 16 37 1 100 Heritage Sites Conservation Services 2 2 Land Services 3 6 4 5 57 1 9 12 12 14 9 132 Map Production Services 1 1 1 9 5 2 3 2 24 Meteorology/Hydrology Services 2 1 8 1 8 11 8 52 13 104 Sanitary Services 7 3 10 Survey Engineering Services 2 6 27 2 3 8 9 31 14 12 19 29 2 164 Technical Support Services 73 153 336 205 11 141 44 4 1 968 Urban Design Services 1 1 Urban Development Control Services 3 1 7 10 21 Urban Planing Services 8 2 6 22 38 Finance & audit services GroupAudit Services 14 18 19 21 31 14 14 23 2 156 Finance, Accounting & Budgets Services 10 37 36 43 22 39 65 364 170 25 2 813 Internal Audit Services 6 1 6 20 14 47 Revenue Services 13 22 46 58 75 2 79 112 96 10 4 2 519
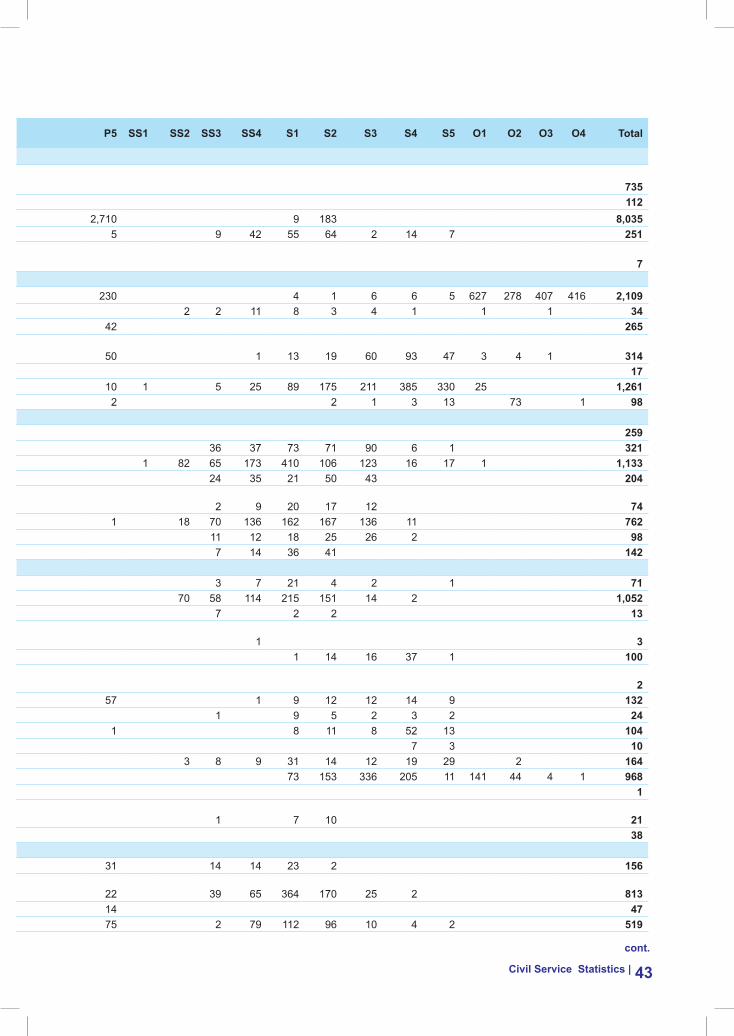
Civil service statistics | 43
table 20Civil Servants by Major Occupational Groups/Sub Groups by Position LevelmOG/subgroups No
level1 eX1 eX2 eX3 es1 es2 es3 P1 P2 P3 P4 P5 ss1 ss2 ss3 ss4 s1 s2 s3 s4 s5 O1 O2 O3 O4 total
education & training services GroupEducation Management & Administration Services 67 428 210 30 735 Education Support Services 29 73 10 112 Teaching Services 271 472 1,685 2,705 2,710 9 183 8,035 Training/Tertiary Teaching Services 9 9 26 9 5 9 42 55 64 2 14 7 251 Vocational Education & Managment Services 1 5 1 7 administration & support services GroupAdministration Services 40 20 7 62 230 4 1 6 6 5 627 278 407 416 2,109 Palace Services 1 2 2 11 8 3 4 1 1 1 34 Program Services 50 65 41 67 42 265 Property and Management Ser-vices 2 5 7 9 50 1 13 19 60 93 47 3 4 1 314 Secondment Services 8 5 3 1 17 Secretarial Services 1 2 2 10 1 5 25 89 175 211 385 330 25 1,261 Stand Alone Positions 1 1 1 2 2 1 3 13 73 1 98 medical and Health services GroupMedical & Dental Services 14 34 63 148 259 Medical Technical Services 5 2 36 37 73 71 90 6 1 321 Nursing Services 16 20 27 76 1 82 65 173 410 106 123 16 17 1 1,133 Pharmaceutical Services 1 2 6 22 24 35 21 50 43 204 Physiotherapy & Rehabilitation Services 1 2 5 6 2 9 20 17 12 74 Public Health Services 1 6 21 33 1 18 70 136 162 167 136 11 762 Radiology & Technical Services 1 3 11 12 18 25 26 2 98 Traditional Medicine Services 9 7 6 22 7 14 36 41 142 architectural, engineering & land services GroupArchitectural Services 2 6 13 12 3 7 21 4 2 1 71 Engineering Services 111 72 112 133 70 58 114 215 151 14 2 1,052 Farm Mechanization Services 1 1 7 2 2 13 Geographic Information System Services 1 1 1 3 Geology and Mines Services 2 13 10 6 1 14 16 37 1 100 Heritage Sites Conservation Services 2 2 Land Services 3 6 4 5 57 1 9 12 12 14 9 132 Map Production Services 1 1 1 9 5 2 3 2 24 Meteorology/Hydrology Services 2 1 8 1 8 11 8 52 13 104 Sanitary Services 7 3 10 Survey Engineering Services 2 6 27 2 3 8 9 31 14 12 19 29 2 164 Technical Support Services 73 153 336 205 11 141 44 4 1 968 Urban Design Services 1 1 Urban Development Control Services 3 1 7 10 21 Urban Planing Services 8 2 6 22 38 Finance & audit services GroupAudit Services 14 18 19 21 31 14 14 23 2 156 Finance, Accounting & Budgets Services 10 37 36 43 22 39 65 364 170 25 2 813 Internal Audit Services 6 1 6 20 14 47 Revenue Services 13 22 46 58 75 2 79 112 96 10 4 2 519
cont.
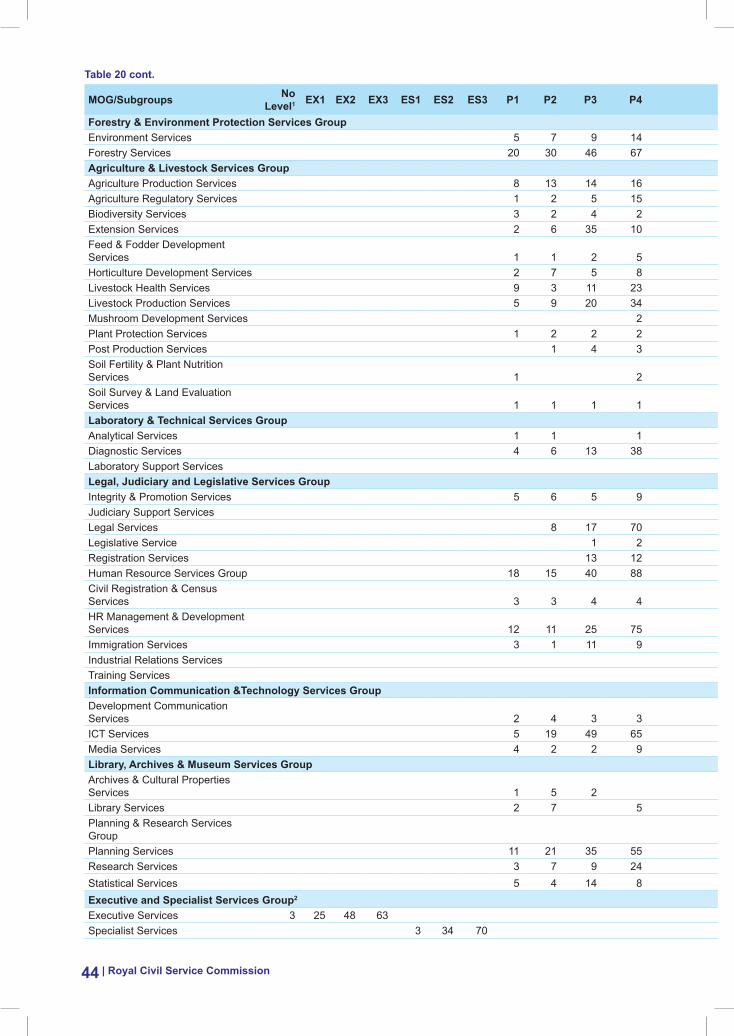
| Royal Civil Service Commission44
mOG/subgroups No level1 eX1 eX2 eX3 es1 es2 es3 P1 P2 P3 P4 P5 ss1 ss2 ss3 ss4 s1 s2 s3 s4 s5 O1 O2 O3 O4 total
Forestry & environment Protection services GroupEnvironment Services 5 7 9 14 15 1 3 6 60 Forestry Services 20 30 46 67 14 129 132 121 208 234 338 66 1,405 agriculture & livestock services GroupAgriculture Production Services 8 13 14 16 27 14 16 20 128 Agriculture Regulatory Services 1 2 5 15 33 44 36 16 1 153 Biodiversity Services 3 2 4 2 6 3 1 3 24 Extension Services 2 6 35 10 120 120 95 108 6 1 503 Feed & Fodder Development Services 1 1 2 5 2 3 14 Horticulture Development Services 2 7 5 8 3 1 1 2 1 30 Livestock Health Services 9 3 11 23 21 17 13 14 5 4 3 123 Livestock Production Services 5 9 20 34 22 25 62 48 4 6 2 237 Mushroom Development Services 2 2 3 2 1 10 Plant Protection Services 1 2 2 2 5 2 1 15 Post Production Services 1 4 3 3 1 1 6 1 20 Soil Fertility & Plant Nutrition Services 1 2 1 1 1 6 Soil Survey & Land Evaluation Services 1 1 1 1 3 1 1 2 11 laboratory & technical services GroupAnalytical Services 1 1 1 2 5 Diagnostic Services 4 6 13 38 1 62 Laboratory Support Services 40 34 67 84 228 251 132 836 legal, Judiciary and legislative services GroupIntegrity & Promotion Services 5 6 5 9 19 9 53 Judiciary Support Services 5 76 144 21 246 Legal Services 8 17 70 18 14 12 2 141 Legislative Service 1 2 3 Registration Services 13 12 1 26 Human Resource Services Group 18 15 40 88 73 1 2 7 18 20 30 101 413 Civil Registration & Census Services 3 3 4 4 6 20 HR Management & Development Services 12 11 25 75 60 183 Immigration Services 3 1 11 9 6 1 2 6 15 14 23 94 185 Industrial Relations Services 1 3 6 7 7 24 Training Services 1 1 information Communication &technology services GroupDevelopment Communication Services 2 4 3 3 4 2 3 4 25 ICT Services 5 19 49 65 14 29 40 84 20 1 15 6 347 Media Services 4 2 2 9 21 38 library, archives & museum services GroupArchives & Cultural Properties Services 1 5 2 3 2 1 5 4 7 3 33 Library Services 2 7 5 2 1 4 16 115 123 46 321 Planning & Research Services GroupPlanning Services 11 21 35 55 14 136 Research Services 3 7 9 24 77 2 2 2 126 Statistical Services 5 4 14 8 7 10 1 2 2 53 executive and specialist services Group2
Executive Services 3 25 48 63 139 Specialist Services 3 34 70 107
table 20 cont.
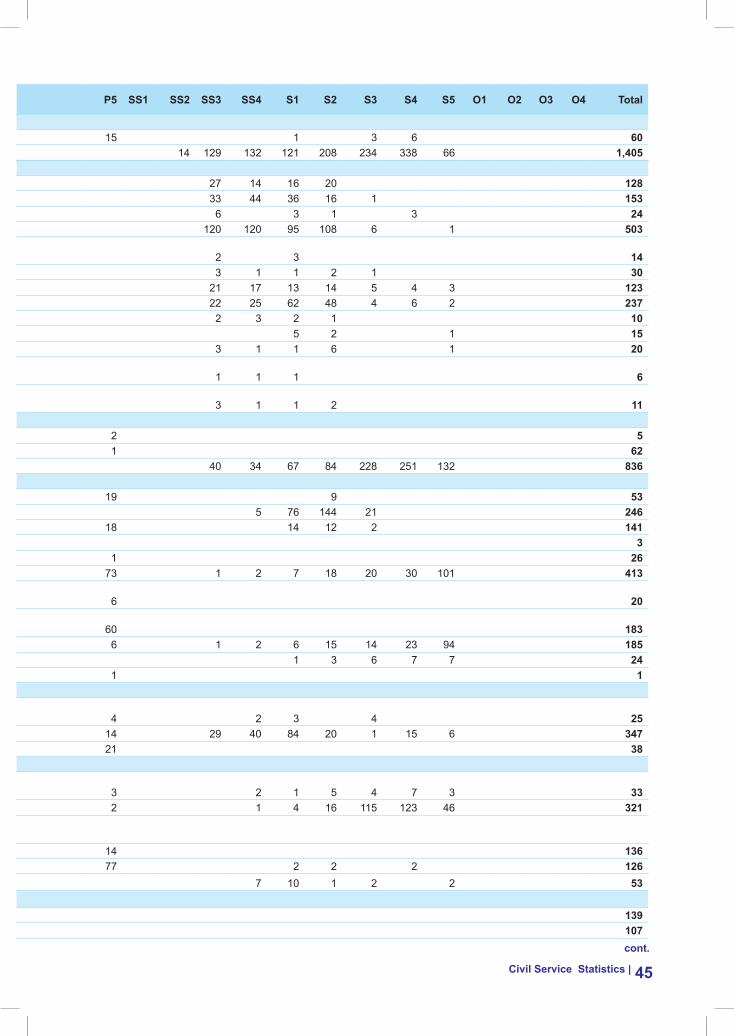
Civil service statistics | 45
mOG/subgroups No level1 eX1 eX2 eX3 es1 es2 es3 P1 P2 P3 P4 P5 ss1 ss2 ss3 ss4 s1 s2 s3 s4 s5 O1 O2 O3 O4 total
Forestry & environment Protection services GroupEnvironment Services 5 7 9 14 15 1 3 6 60 Forestry Services 20 30 46 67 14 129 132 121 208 234 338 66 1,405 agriculture & livestock services GroupAgriculture Production Services 8 13 14 16 27 14 16 20 128 Agriculture Regulatory Services 1 2 5 15 33 44 36 16 1 153 Biodiversity Services 3 2 4 2 6 3 1 3 24 Extension Services 2 6 35 10 120 120 95 108 6 1 503 Feed & Fodder Development Services 1 1 2 5 2 3 14 Horticulture Development Services 2 7 5 8 3 1 1 2 1 30 Livestock Health Services 9 3 11 23 21 17 13 14 5 4 3 123 Livestock Production Services 5 9 20 34 22 25 62 48 4 6 2 237 Mushroom Development Services 2 2 3 2 1 10 Plant Protection Services 1 2 2 2 5 2 1 15 Post Production Services 1 4 3 3 1 1 6 1 20 Soil Fertility & Plant Nutrition Services 1 2 1 1 1 6 Soil Survey & Land Evaluation Services 1 1 1 1 3 1 1 2 11 laboratory & technical services GroupAnalytical Services 1 1 1 2 5 Diagnostic Services 4 6 13 38 1 62 Laboratory Support Services 40 34 67 84 228 251 132 836 legal, Judiciary and legislative services GroupIntegrity & Promotion Services 5 6 5 9 19 9 53 Judiciary Support Services 5 76 144 21 246 Legal Services 8 17 70 18 14 12 2 141 Legislative Service 1 2 3 Registration Services 13 12 1 26 Human Resource Services Group 18 15 40 88 73 1 2 7 18 20 30 101 413 Civil Registration & Census Services 3 3 4 4 6 20 HR Management & Development Services 12 11 25 75 60 183 Immigration Services 3 1 11 9 6 1 2 6 15 14 23 94 185 Industrial Relations Services 1 3 6 7 7 24 Training Services 1 1 information Communication &technology services GroupDevelopment Communication Services 2 4 3 3 4 2 3 4 25 ICT Services 5 19 49 65 14 29 40 84 20 1 15 6 347 Media Services 4 2 2 9 21 38 library, archives & museum services GroupArchives & Cultural Properties Services 1 5 2 3 2 1 5 4 7 3 33 Library Services 2 7 5 2 1 4 16 115 123 46 321 Planning & Research Services GroupPlanning Services 11 21 35 55 14 136 Research Services 3 7 9 24 77 2 2 2 126 Statistical Services 5 4 14 8 7 10 1 2 2 53 executive and specialist services Group2
Executive Services 3 25 48 63 139 Specialist Services 3 34 70 107
cont.
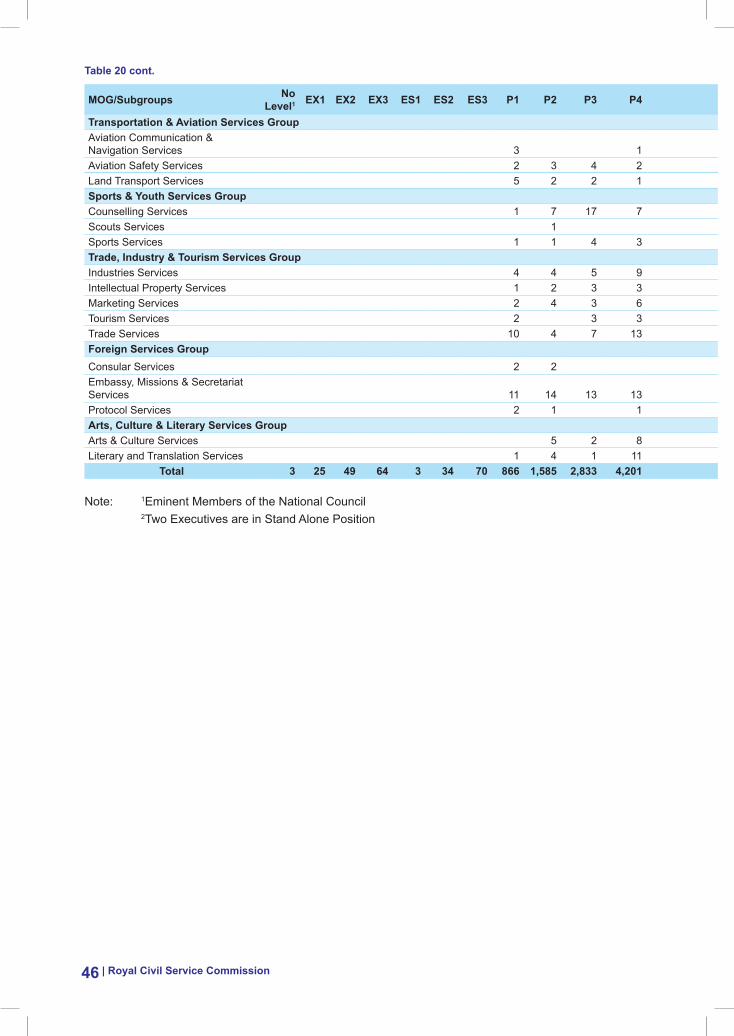
| Royal Civil Service Commission46
mOG/subgroups No level1 eX1 eX2 eX3 es1 es2 es3 P1 P2 P3 P4 P5 ss1 ss2 ss3 ss4 s1 s2 s3 s4 s5 O1 O2 O3 O4 total
transportation & aviation services GroupAviation Communication & Navigation Services 3 1 2 10 3 19 Aviation Safety Services 2 3 4 2 5 2 5 21 65 27 136 Land Transport Services 5 2 2 1 12 3 2 17 14 21 9 88 sports & Youth services GroupCounselling Services 1 7 17 7 29 61 Scouts Services 1 1 Sports Services 1 1 4 3 2 2 1 1 128 143 trade, industry & tourism services GroupIndustries Services 4 4 5 9 1 23 Intellectual Property Services 1 2 3 3 3 12 Marketing Services 2 4 3 6 1 6 4 2 28 Tourism Services 2 3 3 3 1 1 4 17 Trade Services 10 4 7 13 4 38 Foreign services GroupConsular Services 2 2 4 Embassy, Missions & Secretariat Services 11 14 13 13 7 58 Protocol Services 2 1 1 10 14 arts, Culture & literary services GroupArts & Culture Services 5 2 8 6 5 4 9 2 4 1 46 Literary and Translation Services 1 4 1 11 6 23
total 3 25 49 64 3 34 70 866 1,585 2,833 4,201 3,605 2 189 815 1,248 2,459 2,340 1,846 1,747 1,015 798 401 413 418 27,029
Note: 1Eminent Members of the National Council 2Two Executives are in Stand Alone Position
table 20 cont.
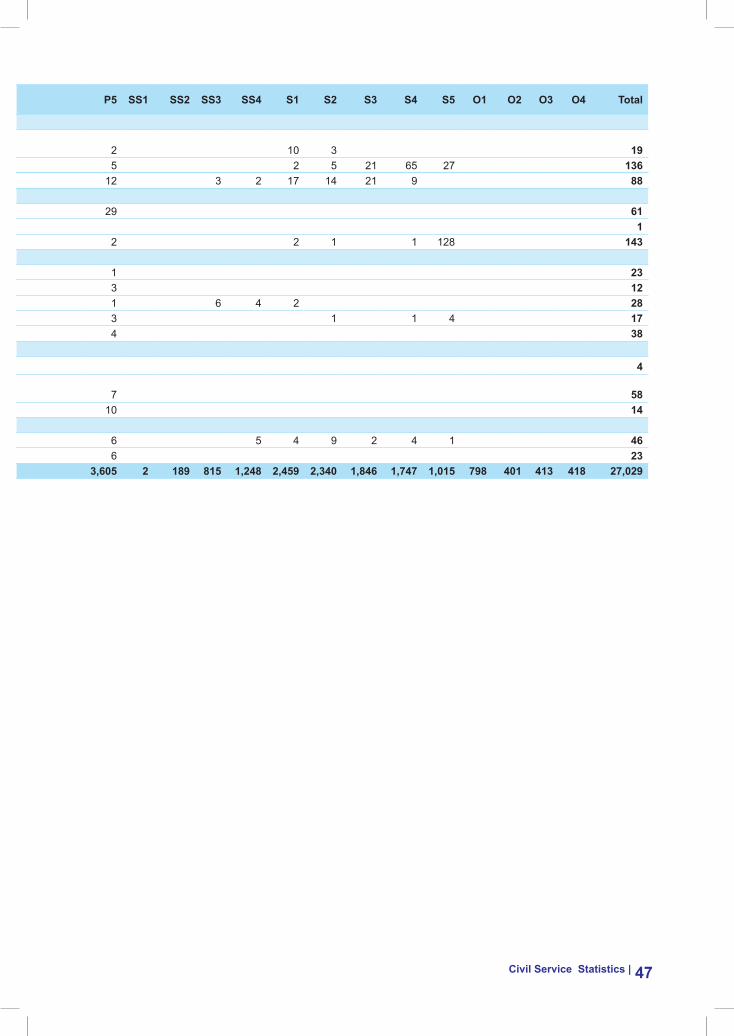
Civil service statistics | 47
mOG/subgroups No level1 eX1 eX2 eX3 es1 es2 es3 P1 P2 P3 P4 P5 ss1 ss2 ss3 ss4 s1 s2 s3 s4 s5 O1 O2 O3 O4 total
transportation & aviation services GroupAviation Communication & Navigation Services 3 1 2 10 3 19 Aviation Safety Services 2 3 4 2 5 2 5 21 65 27 136 Land Transport Services 5 2 2 1 12 3 2 17 14 21 9 88 sports & Youth services GroupCounselling Services 1 7 17 7 29 61 Scouts Services 1 1 Sports Services 1 1 4 3 2 2 1 1 128 143 trade, industry & tourism services GroupIndustries Services 4 4 5 9 1 23 Intellectual Property Services 1 2 3 3 3 12 Marketing Services 2 4 3 6 1 6 4 2 28 Tourism Services 2 3 3 3 1 1 4 17 Trade Services 10 4 7 13 4 38 Foreign services GroupConsular Services 2 2 4 Embassy, Missions & Secretariat Services 11 14 13 13 7 58 Protocol Services 2 1 1 10 14 arts, Culture & literary services GroupArts & Culture Services 5 2 8 6 5 4 9 2 4 1 46 Literary and Translation Services 1 4 1 11 6 23
total 3 25 49 64 3 34 70 866 1,585 2,833 4,201 3,605 2 189 815 1,248 2,459 2,340 1,846 1,747 1,015 798 401 413 418 27,029
Note: 1Eminent Members of the National Council 2Two Executives are in Stand Alone Position

| Royal Civil Service Commission48
table 21 Progressive Growth of Civil Service Strength by Major Occupational Groups
major Occupational Groups 1st July 2008 dec-16 % GrowthEducation & Training Services 6,257 9,140 46.08%General Administration & Support Services 3,259 4,098 25.74%Medical and Health Services 1,700 2,993 76.06%Architectural & Engg. & Land Services 2,152 2,703 25.60%Finance & Audit Services 1,230 1,535 24.80%Forestry & Environment Protection Services 1,192 1,465 22.90%Agriculture & Livestock Services 1,018 1,274 25.15%Laboratory & Technical Services 509 903 77.41%Legal, Judiciary and Legislative Services 318 469 47.48%Human Resource Services 287 413 43.90%Information Communication &Technology Services 323 410 26.93%Library, Archives & Museum Services 293 354 20.82%Planning & Research Services 393 315 -19.85%Executive & Specialist Services 186 246 32.26%Transportation & Aviation Services 154 243 57.79%Sports & Youth Services 22 205 831.82%Trade, Industry & Tourism Services 86 118 37.21%Foreign Services 55 76 38.18%Arts, Culture & Literary Services 82 69 -15.85%
total 19,516 27,029 38.50%
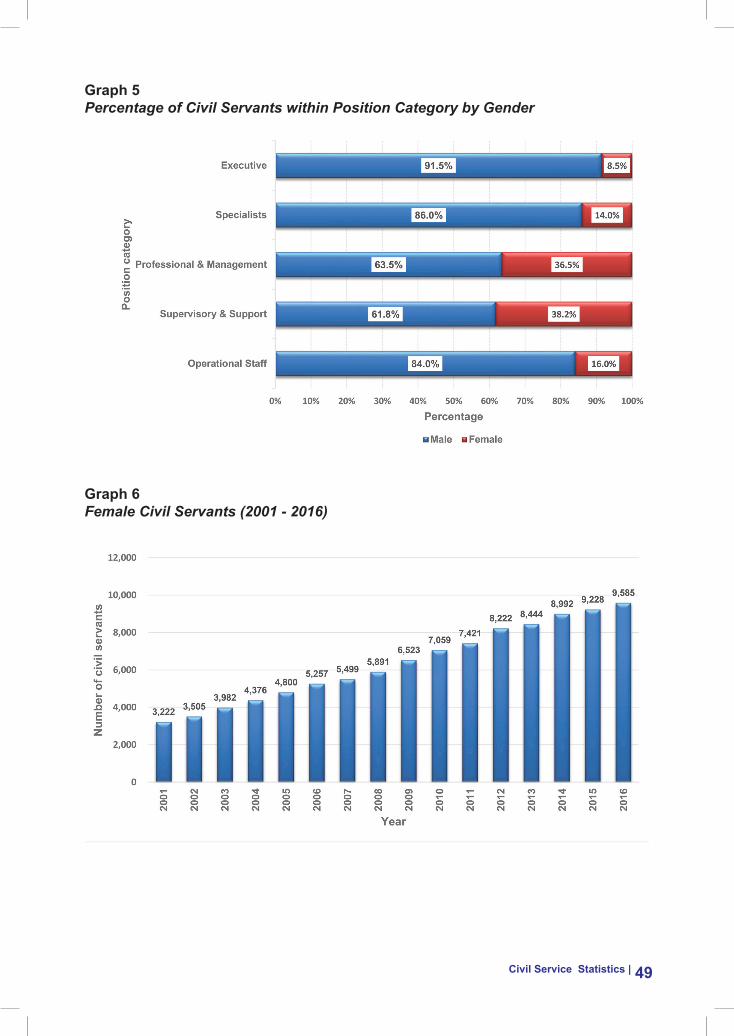
Civil service statistics | 49
Graph 5Percentage of Civil Servants within Position Category by Gender
Graph 6Female Civil Servants (2001 - 2016)
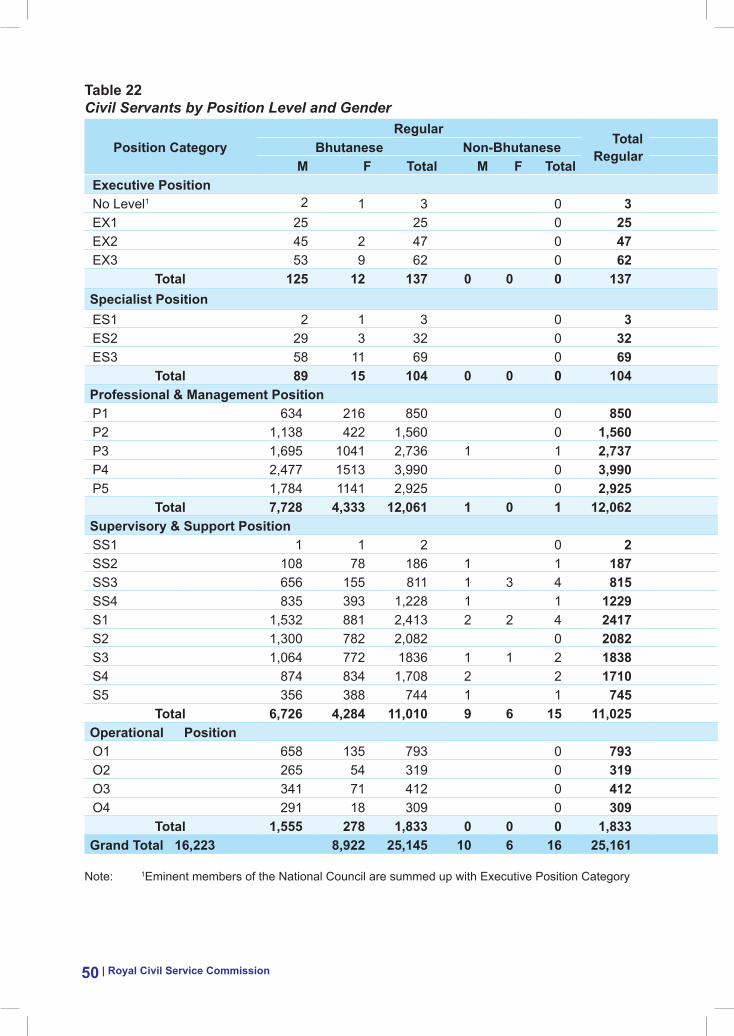
| Royal Civil Service Commission50
table 22 Civil Servants by Position Level and Gender
Position Category regular
total regular
Contracttotal
Contracttotal
maletotalFemale
Grandtotalbhutanese Non-bhutanese bhutanese Non-bhutanese
m F total m F total m F total m F totalexecutive PositionNo Level1 2 1 3 0 3 0 0 0 2 1 3EX1 25 25 0 25 0 0 0 25 0 25EX2 45 2 47 0 47 2 2 0 2 47 2 49EX3 53 9 62 0 62 2 2 0 2 55 9 64
total 125 12 137 0 0 0 137 4 0 4 0 0 0 4 129 12 141specialist PositionES1 2 1 3 0 3 0 0 0 2 1 3ES2 29 3 32 0 32 2 2 0 2 31 3 34ES3 58 11 69 0 69 1 1 0 1 59 11 70
total 89 15 104 0 0 0 104 3 0 3 0 0 0 3 92 15 107Professional & management PositionP1 634 216 850 0 850 9 2 11 4 1 5 16 647 219 866P2 1,138 422 1,560 0 1,560 6 2 8 10 7 17 25 1,154 431 1,585P3 1,695 1041 2,736 1 1 2,737 10 4 14 62 20 82 96 1,768 1,065 2,833P4 2,477 1513 3,990 0 3,990 21 38 59 109 43 152 211 2,607 1,594 4,201P5 1,784 1141 2,925 0 2,925 298 290 588 57 35 92 680 2,139 1,466 3,605
total 7,728 4,333 12,061 1 0 1 12,062 344 336 680 242 106 348 1,028 8,315 4,775 13,090supervisory & support PositionSS1 1 1 2 0 2 0 0 0 1 1 2SS2 108 78 186 1 1 187 2 2 0 2 111 78 189SS3 656 155 811 1 3 4 815 0 0 0 657 158 815SS4 835 393 1,228 1 1 1229 15 3 18 1 1 19 851 397 1,248S1 1,532 881 2,413 2 2 4 2417 24 11 35 2 5 7 42 1,560 899 2,459S2 1,300 782 2,082 0 2082 182 76 258 0 258 1,482 858 2,340S3 1,064 772 1836 1 1 2 1838 5 3 8 0 8 1,070 776 1,846S4 874 834 1,708 2 2 1710 30 5 35 2 2 37 906 841 1,747S5 356 388 744 1 1 745 207 63 270 0 270 564 451 1,015
total 6,726 4,284 11,010 9 6 15 11,025 465 161 626 2 8 10 636 7,202 4,459 11,661Operational PositionO1 658 135 793 0 793 4 4 1 1 5 663 135 798O2 265 54 319 0 319 39 43 82 0 82 304 97 401O3 341 71 412 0 412 1 1 0 1 342 71 413O4 291 18 309 0 309 104 3 107 2 2 109 397 21 418
total 1,555 278 1,833 0 0 0 1,833 148 46 194 3 0 3 197 1,706 324 2,030Grand total 16,223 8,922 25,145 10 6 16 25,161 964 543 1,507 247 114 361 1,868 17,444 9,585 27,029
Note: 1Eminent members of the National Council are summed up with Executive Position Category
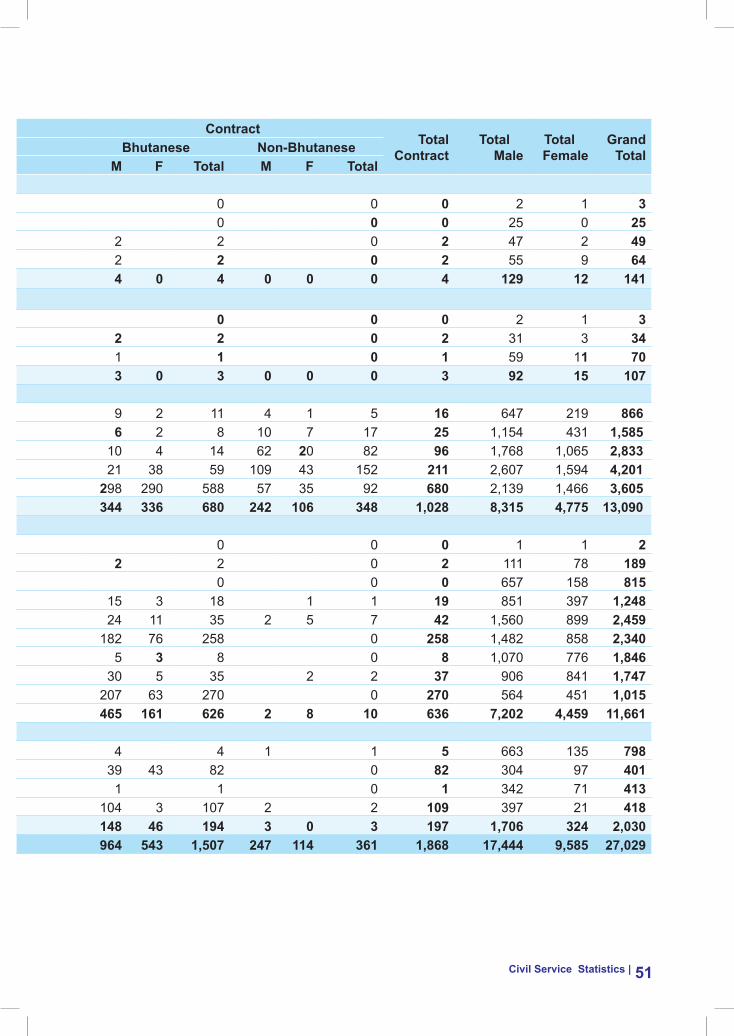
Civil service statistics | 51
table 22 Civil Servants by Position Level and Gender
Position Category regular
total regular
Contracttotal
Contracttotal
maletotalFemale
Grandtotalbhutanese Non-bhutanese bhutanese Non-bhutanese
m F total m F total m F total m F totalexecutive PositionNo Level1 2 1 3 0 3 0 0 0 2 1 3EX1 25 25 0 25 0 0 0 25 0 25EX2 45 2 47 0 47 2 2 0 2 47 2 49EX3 53 9 62 0 62 2 2 0 2 55 9 64
total 125 12 137 0 0 0 137 4 0 4 0 0 0 4 129 12 141specialist PositionES1 2 1 3 0 3 0 0 0 2 1 3ES2 29 3 32 0 32 2 2 0 2 31 3 34ES3 58 11 69 0 69 1 1 0 1 59 11 70
total 89 15 104 0 0 0 104 3 0 3 0 0 0 3 92 15 107Professional & management PositionP1 634 216 850 0 850 9 2 11 4 1 5 16 647 219 866P2 1,138 422 1,560 0 1,560 6 2 8 10 7 17 25 1,154 431 1,585P3 1,695 1041 2,736 1 1 2,737 10 4 14 62 20 82 96 1,768 1,065 2,833P4 2,477 1513 3,990 0 3,990 21 38 59 109 43 152 211 2,607 1,594 4,201P5 1,784 1141 2,925 0 2,925 298 290 588 57 35 92 680 2,139 1,466 3,605
total 7,728 4,333 12,061 1 0 1 12,062 344 336 680 242 106 348 1,028 8,315 4,775 13,090supervisory & support PositionSS1 1 1 2 0 2 0 0 0 1 1 2SS2 108 78 186 1 1 187 2 2 0 2 111 78 189SS3 656 155 811 1 3 4 815 0 0 0 657 158 815SS4 835 393 1,228 1 1 1229 15 3 18 1 1 19 851 397 1,248S1 1,532 881 2,413 2 2 4 2417 24 11 35 2 5 7 42 1,560 899 2,459S2 1,300 782 2,082 0 2082 182 76 258 0 258 1,482 858 2,340S3 1,064 772 1836 1 1 2 1838 5 3 8 0 8 1,070 776 1,846S4 874 834 1,708 2 2 1710 30 5 35 2 2 37 906 841 1,747S5 356 388 744 1 1 745 207 63 270 0 270 564 451 1,015
total 6,726 4,284 11,010 9 6 15 11,025 465 161 626 2 8 10 636 7,202 4,459 11,661Operational PositionO1 658 135 793 0 793 4 4 1 1 5 663 135 798O2 265 54 319 0 319 39 43 82 0 82 304 97 401O3 341 71 412 0 412 1 1 0 1 342 71 413O4 291 18 309 0 309 104 3 107 2 2 109 397 21 418
total 1,555 278 1,833 0 0 0 1,833 148 46 194 3 0 3 197 1,706 324 2,030Grand total 16,223 8,922 25,145 10 6 16 25,161 964 543 1,507 247 114 361 1,868 17,444 9,585 27,029
Note: 1Eminent members of the National Council are summed up with Executive Position Category
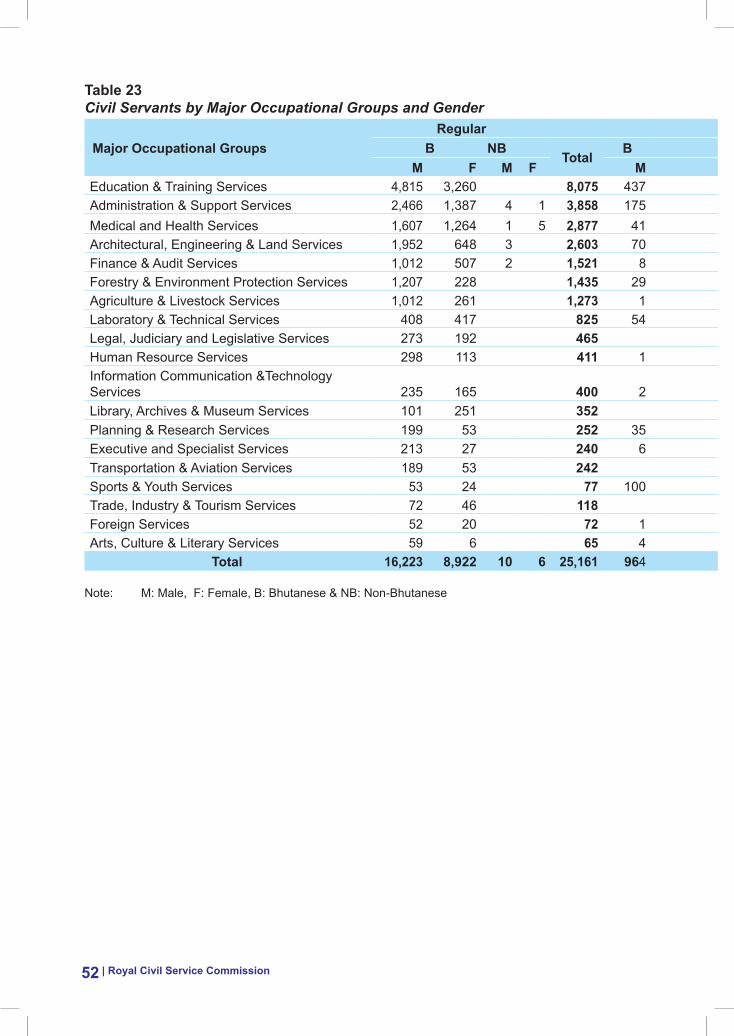
| Royal Civil Service Commission52
table 23Civil Servants by Major Occupational Groups and Gender
major Occupational Groupsregular Contract
totalGrand total % of Female
within moG% of Female
to total Cs b Nb total
b Nbtotal
m F m F m F M m FEducation & Training Services 4,815 3,260 8,075 437 314 224 90 1,065 5,476 3,664 9,140 38.23% 13.56%Administration & Support Services 2,466 1,387 4 1 3,858 175 61 4 240 2,649 1,449 4,098 15.12% 5.36%Medical and Health Services 1,607 1,264 1 5 2,877 41 48 8 19 116 1,657 1,336 2,993 13.94% 4.94%Architectural, Engineering & Land Services 1,952 648 3 2,603 70 19 8 3 100 2,033 670 2,703 6.99% 2.48%Finance & Audit Services 1,012 507 2 1,521 8 6 14 1,022 513 1,535 5.35% 1.90%Forestry & Environment Protection Services 1,207 228 1,435 29 1 30 1,237 228 1,465 2.38% 0.84%Agriculture & Livestock Services 1,012 261 1,273 1 1 1,013 261 1,274 2.72% 0.97%Laboratory & Technical Services 408 417 825 54 23 1 78 462 441 903 4.60% 1.63%Legal, Judiciary and Legislative Services 273 192 465 4 4 273 196 469 2.04% 0.73%Human Resource Services 298 113 411 1 1 2 299 114 413 1.19% 0.42%Information Communication &Technology Services 235 165 400 2 7 1 10 238 172 410 1.79% 0.64%Library, Archives & Museum Services 101 251 352 2 2 101 253 354 2.64% 0.94%Planning & Research Services 199 53 252 35 27 1 63 234 81 315 0.85% 0.30%Executive and Specialist Services 213 27 240 6 6 219 27 246 0.28% 0.10%Transportation & Aviation Services 189 53 242 1 1 190 53 243 0.55% 0.20%Sports & Youth Services 53 24 77 100 28 128 153 52 205 0.54% 0.19%Trade, Industry & Tourism Services 72 46 118 0 72 46 118 0.48% 0.17%Foreign Services 52 20 72 1 3 4 53 23 76 0.24% 0.09%Arts, Culture & Literary Services 59 6 65 4 4 63 6 69 0.06% 0.02%
total 16,223 8,922 10 6 25,161 964 543 247 114 1,868 17,444 9,585 27,029 100% 35.46%
Note: M: Male, F: Female, B: Bhutanese & NB: Non-Bhutanese
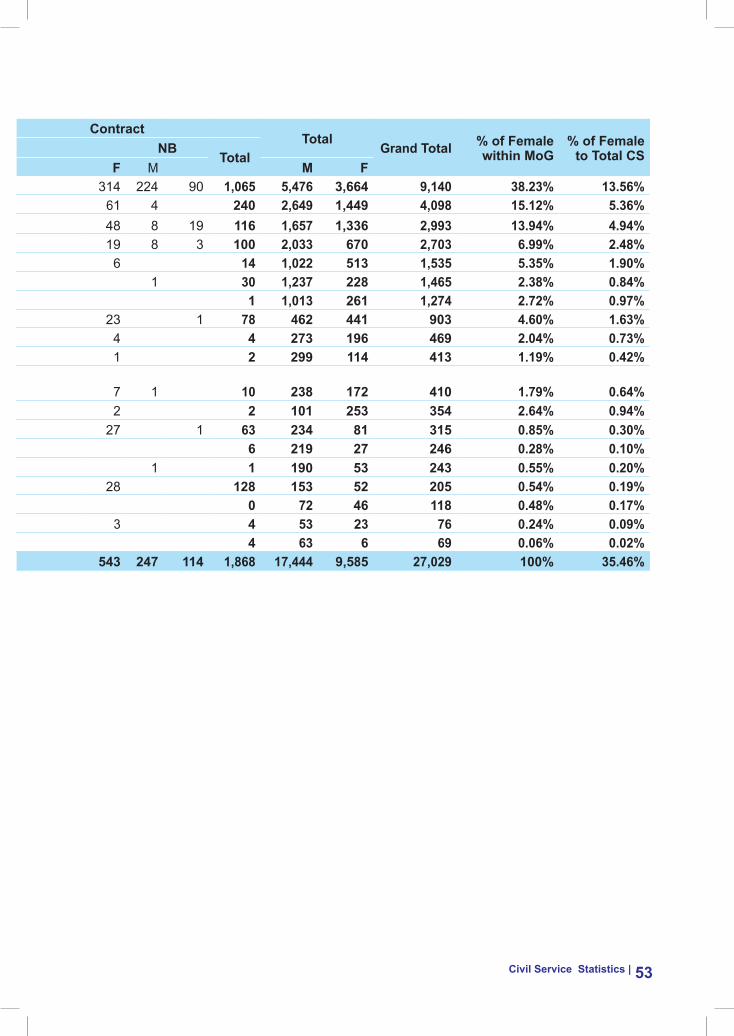
Civil service statistics | 53
table 23Civil Servants by Major Occupational Groups and Gender
major Occupational Groupsregular Contract
totalGrand total % of Female
within moG% of Female
to total Cs b Nb total
b Nbtotal
m F m F m F M m FEducation & Training Services 4,815 3,260 8,075 437 314 224 90 1,065 5,476 3,664 9,140 38.23% 13.56%Administration & Support Services 2,466 1,387 4 1 3,858 175 61 4 240 2,649 1,449 4,098 15.12% 5.36%Medical and Health Services 1,607 1,264 1 5 2,877 41 48 8 19 116 1,657 1,336 2,993 13.94% 4.94%Architectural, Engineering & Land Services 1,952 648 3 2,603 70 19 8 3 100 2,033 670 2,703 6.99% 2.48%Finance & Audit Services 1,012 507 2 1,521 8 6 14 1,022 513 1,535 5.35% 1.90%Forestry & Environment Protection Services 1,207 228 1,435 29 1 30 1,237 228 1,465 2.38% 0.84%Agriculture & Livestock Services 1,012 261 1,273 1 1 1,013 261 1,274 2.72% 0.97%Laboratory & Technical Services 408 417 825 54 23 1 78 462 441 903 4.60% 1.63%Legal, Judiciary and Legislative Services 273 192 465 4 4 273 196 469 2.04% 0.73%Human Resource Services 298 113 411 1 1 2 299 114 413 1.19% 0.42%Information Communication &Technology Services 235 165 400 2 7 1 10 238 172 410 1.79% 0.64%Library, Archives & Museum Services 101 251 352 2 2 101 253 354 2.64% 0.94%Planning & Research Services 199 53 252 35 27 1 63 234 81 315 0.85% 0.30%Executive and Specialist Services 213 27 240 6 6 219 27 246 0.28% 0.10%Transportation & Aviation Services 189 53 242 1 1 190 53 243 0.55% 0.20%Sports & Youth Services 53 24 77 100 28 128 153 52 205 0.54% 0.19%Trade, Industry & Tourism Services 72 46 118 0 72 46 118 0.48% 0.17%Foreign Services 52 20 72 1 3 4 53 23 76 0.24% 0.09%Arts, Culture & Literary Services 59 6 65 4 4 63 6 69 0.06% 0.02%
total 16,223 8,922 10 6 25,161 964 543 247 114 1,868 17,444 9,585 27,029 100% 35.46%
Note: M: Male, F: Female, B: Bhutanese & NB: Non-Bhutanese
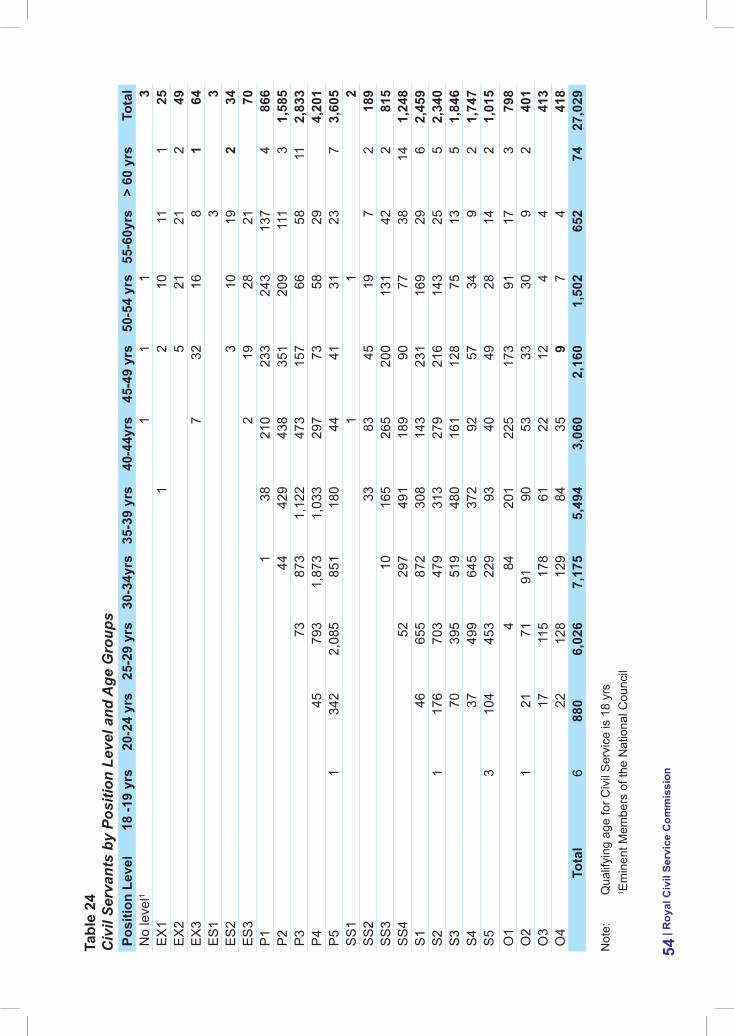
tabl
e 24
Civ
il Se
rvan
ts b
y Po
sitio
n Le
vel a
nd A
ge G
roup
sPo
sitio
n le
vel
18 -1
9 yr
s20
-24
yrs
25-2
9 yr
s30
-34y
rs35
-39
yrs
40-4
4yrs
45-4
9 yr
s50
-54
yrs
55-6
0yrs
> 60
yrs
tota
lN
o le
vel1
11
13
EX
11
210
111
25E
X2
521
212
49E
X3
732
168
164
ES
13
3E
S2
310
192
34E
S3
219
2821
70P
11
3821
023
324
313
74
866
P2
4442
943
835
120
911
13
1,58
5P
373
873
1,12
247
315
766
5811
2,83
3P
445
793
1,87
31,
033
297
7358
294,
201
P5
134
22,
085
851
180
4441
3123
73,
605
SS
11
12
SS
233
8345
197
218
9S
S3
1016
526
520
013
142
281
5S
S4
5229
749
118
990
7738
141,
248
S1
4665
587
230
814
323
116
929
62,
459
S2
117
670
347
931
327
921
614
325
52,
340
S3
7039
551
948
016
112
875
135
1,84
6S
437
499
645
372
9257
349
21,
747
S5
310
445
322
993
4049
2814
21,
015
O1
484
201
225
173
9117
379
8O
21
2171
9190
5333
309
240
1O
317
115
178
6122
124
441
3O
422
128
129
8435
97
441
8to
tal
688
06,
026
7,17
55,
494
3,06
02,
160
1,50
265
274
27,0
29 N
ote:
Q
ualif
ying
age
for C
ivil
Ser
vice
is 1
8 yr
s
1 Em
inen
t Mem
bers
of t
he N
atio
nal C
ounc
il
| roy
al C
ivil
serv
ice
Com
mis
sion
54
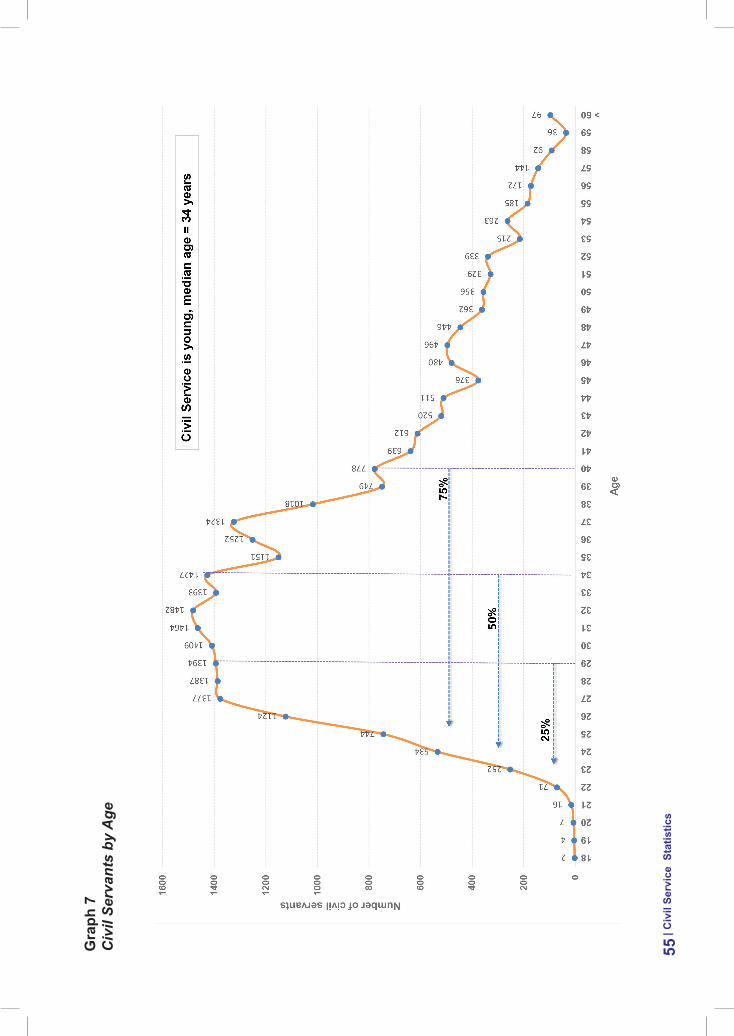
Gra
ph 7
Civ
il Se
rvan
ts b
y A
ge
| Civ
il se
rvic
e s
tatis
tics
55
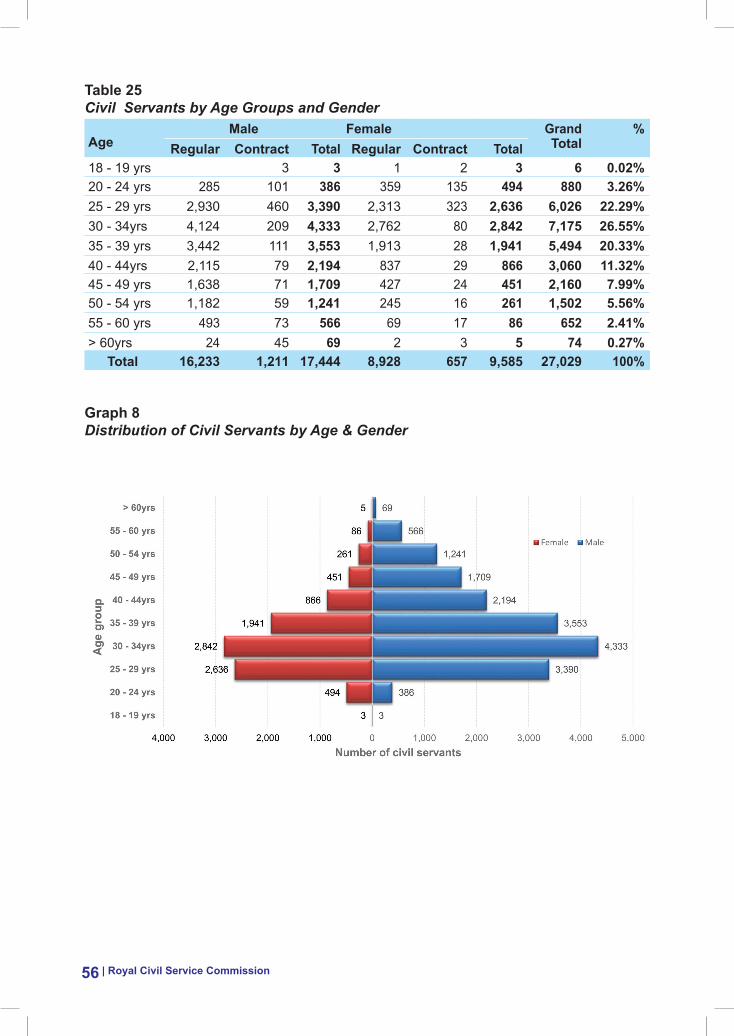
| Royal Civil Service Commission56
table 25Civil Servants by Age Groups and Gender
age
male Female Grand total
%regular Contract total regular Contract total
18 - 19 yrs 3 3 1 2 3 6 0.02%20 - 24 yrs 285 101 386 359 135 494 880 3.26%25 - 29 yrs 2,930 460 3,390 2,313 323 2,636 6,026 22.29%30 - 34yrs 4,124 209 4,333 2,762 80 2,842 7,175 26.55%35 - 39 yrs 3,442 111 3,553 1,913 28 1,941 5,494 20.33%40 - 44yrs 2,115 79 2,194 837 29 866 3,060 11.32%45 - 49 yrs 1,638 71 1,709 427 24 451 2,160 7.99%50 - 54 yrs 1,182 59 1,241 245 16 261 1,502 5.56%55 - 60 yrs 493 73 566 69 17 86 652 2.41%> 60yrs 24 45 69 2 3 5 74 0.27%
total 16,233 1,211 17,444 8,928 657 9,585 27,029 100%
Graph 8Distribution of Civil Servants by Age & Gender
tabl
e 26
Civ
il Se
rvan
ts R
ecru
ited
by P
aren
t Age
ncy
from
Jan
uary
- D
ecem
ber 2
016
Pare
nt a
genc
yP1
P2P3
P4P5
s1s2
s4s5
ss2
ss4
O2
O4
tota
lH
is M
ajes
ty S
ecre
taria
t2
2le
gisl
ativ
eN
atio
nal A
ssem
bly
Sec
reta
riat
3232
Nat
iona
l Cou
ncil
2424
Con
stitu
tiona
lR
oyal
Civ
il S
ervi
ce C
omm
issi
on11
11A
nti-C
orru
ptio
n C
omm
issi
on3
23
8R
oyal
Aud
it A
utho
rity
66
min
istr
yM
inis
try o
f Edu
catio
n60
01
5427
175
704
Min
istry
of H
ealth
192
24
15
105
Min
istry
of H
ome
& C
ultu
ral A
ffairs
11
22
449
665
Min
istry
of W
orks
& H
uman
Set
tlem
ent
123
125
Min
istry
of F
inan
ce22
11
24M
inis
try o
f Agr
icul
ture
and
For
ests
119
222
Min
istry
of I
nfor
mat
ion
& C
omm
unic
atio
ns5
83
16M
inis
try o
f Lab
our &
Hum
an R
esou
rces
42
6M
inis
try o
f Eco
nom
ic A
ffairs
44
Min
istry
of F
orei
gn A
ffairs
33
age
ncy
Nat
iona
l Lan
d C
omm
issi
on1
185
24O
ffice
of t
he A
ttorn
ey G
ener
al10
10R
oyal
Edu
catio
n C
ounc
il1
36
10To
uris
m C
ounc
il of
Bhu
tan
32
5Ji
gme
Sin
gye
Wan
gchu
ck S
choo
l of
Law
22
Dru
g R
egul
ator
y A
utho
rity
11
Nat
iona
l Sta
tistic
s B
urea
u1
1R
oyal
Priv
y C
ounc
il1
1D
zong
kha
Dev
elop
men
t Com
mis
sion
11
| Civ
il se
rvic
e s
tatis
tics
57co
nt.
Pare
nt a
genc
yP1
P2P3
P4P5
s1s2
s4s5
ss2
ss4
O2
O4
tota
lB
huta
n In
form
atio
n C
omm
unic
atio
ns &
Med
ia A
utho
rity
11
Bhu
tan
Nar
cotic
Con
trol A
genc
y1
1N
atio
nal C
omm
issi
on fo
r Wom
en &
Chi
ldre
n1
1N
atio
nal E
nviro
nmen
t Com
mis
sion
11
thro
mde
Sam
drup
jong
khar
22
tota
l6
46
163
735
168
777
12
1731
1,11
8 ta
ble
27C
ivil
Serv
ants
Rec
ruite
d by
MO
G fr
om J
anua
ry -
Dec
embe
r 201
6m
OG
sr
egul
arr
egul
arto
tal
Con
trac
tC
ontr
act
tota
lG
rand
to
tal
mal
eFe
mal
em
ale
Fem
ale
Edu
catio
n &
Tra
inin
g S
ervi
ces
160
145
305
188
172
360
665
Med
ical
and
Hea
lth S
ervi
ces
3440
743
912
86A
dmin
istra
tion
& S
uppo
rt S
ervi
ces
97
1642
1153
69H
uman
Res
ourc
e S
ervi
ces
4319
621
163
Pla
nnin
g &
Res
earc
h S
ervi
ces
31
434
2458
62A
rchi
tect
ural
, Eng
inee
ring
& L
and
Ser
vice
s25
1136
1112
2359
Spo
rts &
You
th S
ervi
ces
35
820
626
34Fi
nanc
e &
Aud
it S
ervi
ces
1213
2525
Lega
l, Ju
dici
ary
and
Legi
slat
ive
Ser
vice
s8
311
44
15Fo
rest
ry &
Env
ironm
ent P
rote
ctio
n S
ervi
ces
54
91
110
Agr
icul
ture
& L
ives
tock
Ser
vice
s7
29
9In
form
atio
n C
omm
unic
atio
n &
Tech
nolo
gy S
ervi
ces
22
41
12
6La
bora
tory
& T
echn
ical
Ser
vice
s4
15
5Tr
ansp
orta
tion
& A
viat
ion
Ser
vice
s4
44
Fore
ign
Ser
vice
s3
33
Trad
e, In
dust
ry &
Tou
rism
Ser
vice
s1
12
2A
rts, C
ultu
re &
Lite
rary
Ser
vice
s1
11
tota
l32
025
857
830
123
954
01,
118
| roy
al C
ivil
serv
ice
Com
mis
sion
58tabl
e 26
con
t.
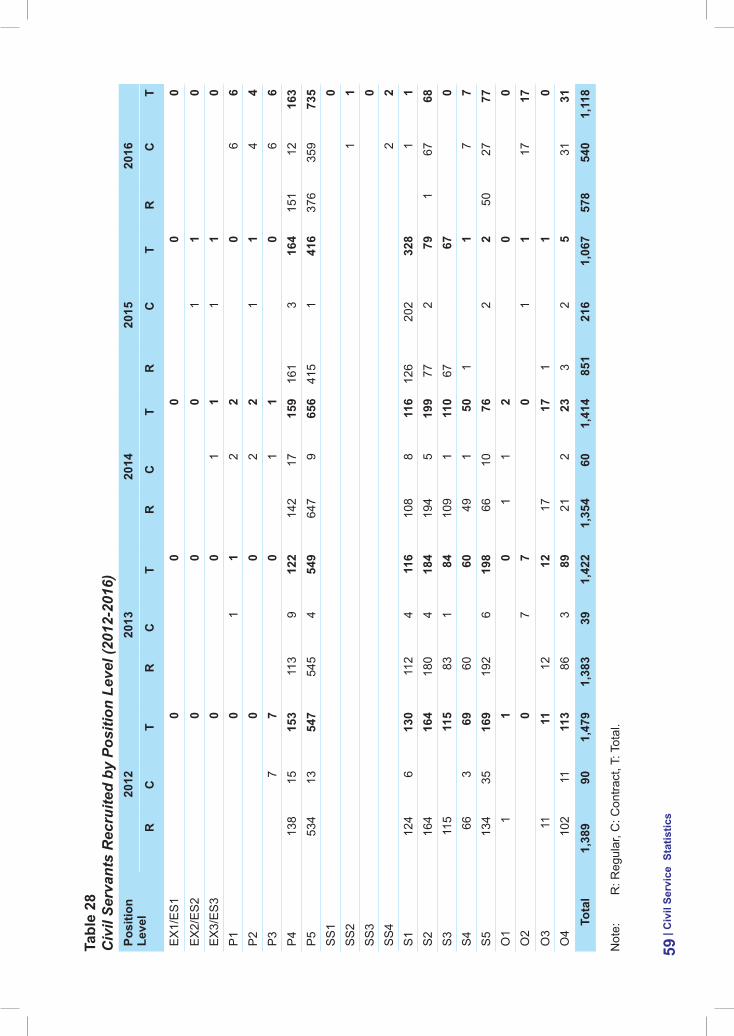
tabl
e 28
Civ
il Se
rvan
ts R
ecru
ited
by P
ositi
on L
evel
(201
2-20
16)
Posi
tion
leve
l20
1220
1320
1420
1520
16
rC
tr
Ct
rC
tr
Ct
rC
t
EX
1/E
S1
00
00
0E
X2/
ES
20
00
11
0E
X3/
ES
30
01
11
10
P1
01
12
20
66
P2
00
22
11
44
P3
77
01
10
66
P4
138
1515
311
39
122
142
1715
916
13
164
151
1216
3P
553
413
547
545
454
964
79
656
415
141
637
635
973
5S
S1
0S
S2
11
SS
30
SS
42
2S
112
46
130
112
411
610
88
116
126
202
328
11
S2
164
164
180
418
419
45
199
772
791
6768
S3
115
115
831
8410
91
110
6767
0S
466
369
6060
491
501
17
7S
513
435
169
192
619
866
1076
22
5027
77O
11
10
11
20
0O
20
77
01
117
17O
311
1112
1217
171
10
O4
102
1111
386
389
212
233
25
3131
tota
l1,
389
901,
479
1,38
339
1,42
21,
354
601,
414
851
216
1,06
757
854
01,
118
Not
e:
R: R
egul
ar, C
: Con
tract
, T: T
otal
.
| Civ
il se
rvic
e s
tatis
tics
59
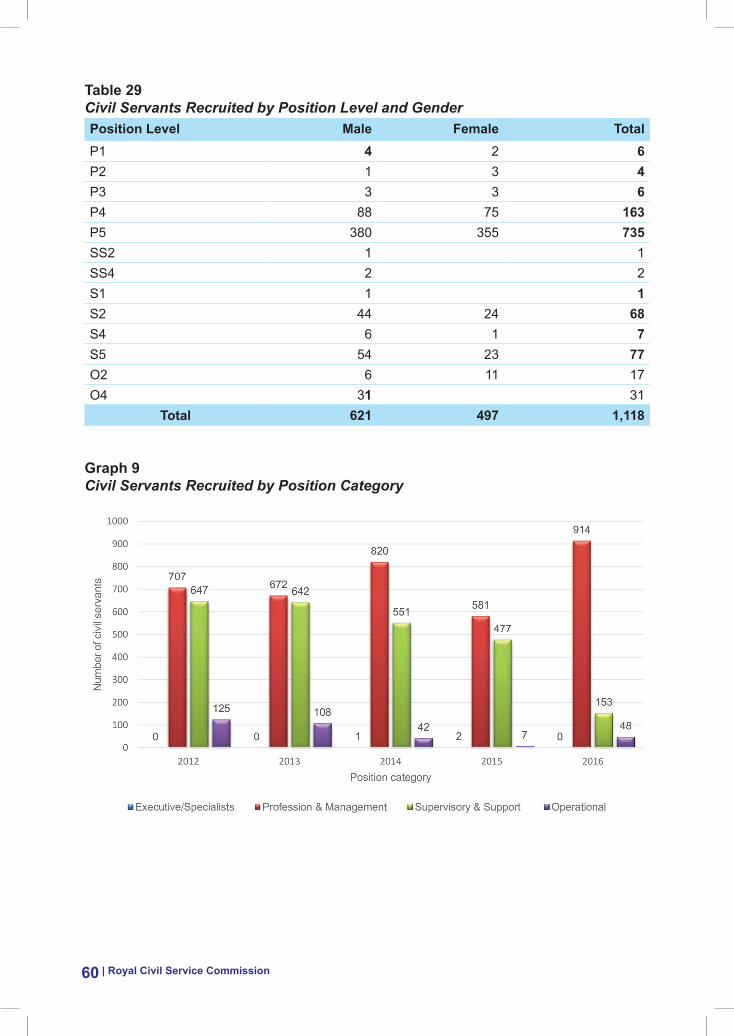
| Royal Civil Service Commission60
table 29Civil Servants Recruited by Position Level and GenderPosition level male Female totalP1 4 2 6P2 1 3 4P3 3 3 6P4 88 75 163P5 380 355 735SS2 1 1SS4 2 2S1 1 1S2 44 24 68S4 6 1 7S5 54 23 77O2 6 11 17O4 31 31
total 621 497 1,118
Graph 9Civil Servants Recruited by Position Category
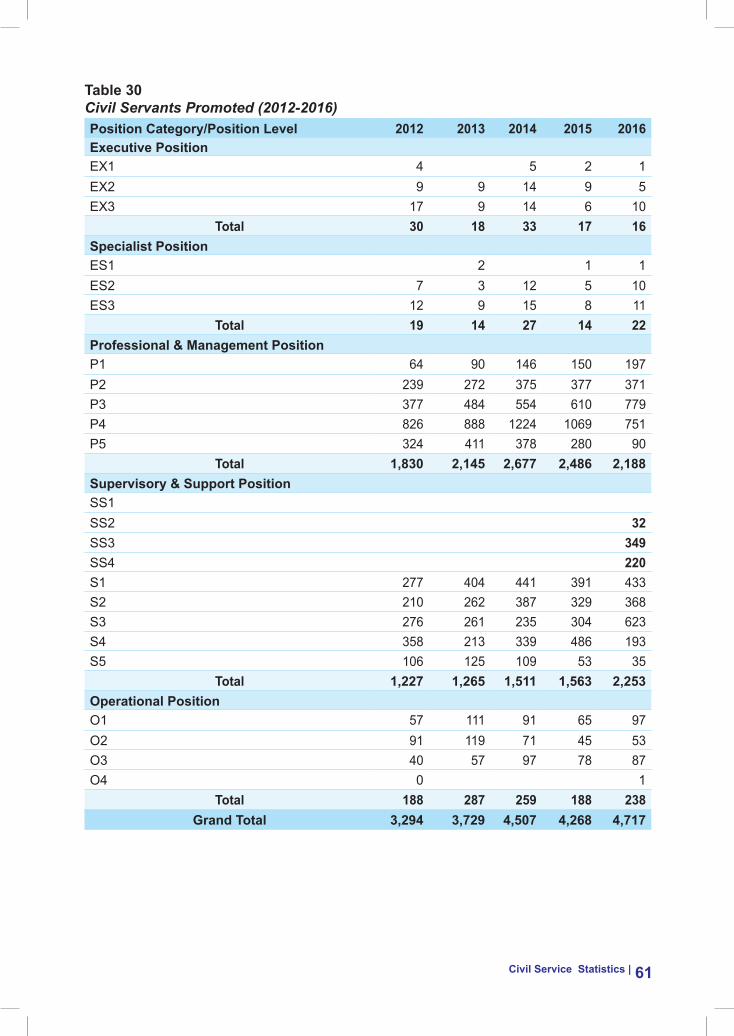
Civil service statistics | 61
table 30Civil Servants Promoted (2012-2016)Position Category/Position level 2012 2013 2014 2015 2016executive PositionEX1 4 5 2 1EX2 9 9 14 9 5EX3 17 9 14 6 10
total 30 18 33 17 16specialist PositionES1 2 1 1ES2 7 3 12 5 10ES3 12 9 15 8 11
total 19 14 27 14 22Professional & management PositionP1 64 90 146 150 197P2 239 272 375 377 371P3 377 484 554 610 779P4 826 888 1224 1069 751P5 324 411 378 280 90
total 1,830 2,145 2,677 2,486 2,188supervisory & support PositionSS1SS2 32SS3 349SS4 220S1 277 404 441 391 433S2 210 262 387 329 368S3 276 261 235 304 623S4 358 213 339 486 193S5 106 125 109 53 35
total 1,227 1,265 1,511 1,563 2,253Operational PositionO1 57 111 91 65 97O2 91 119 71 45 53O3 40 57 97 78 87O4 0 1
total 188 287 259 188 238Grand total 3,294 3,729 4,507 4,268 4,717
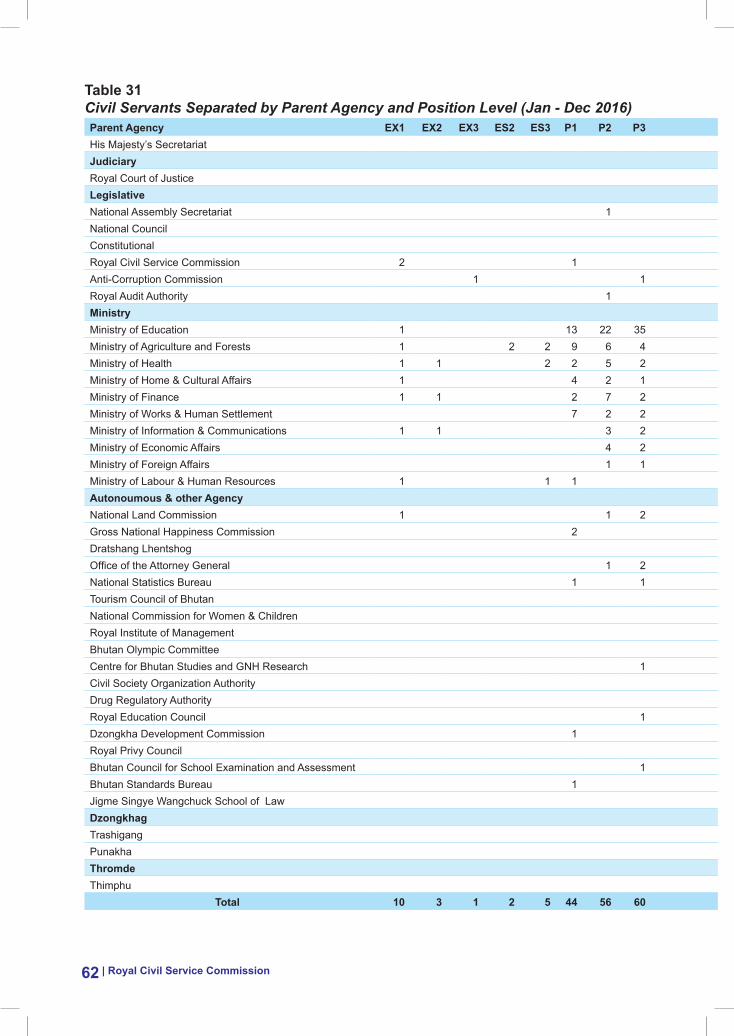
| Royal Civil Service Commission62
table 31Civil Servants Separated by Parent Agency and Position Level (Jan - Dec 2016)Parent agency eX1 eX2 eX3 es2 es3 P1 P2 P3 P4 P5 ss2 ss3 ss4 s1 s2 s3 s4 s5 O1 O2 O3 O4 totalHis Majesty’s Secretariat 1 1 1 1 4JudiciaryRoyal Court of Justice 1 2 2 2 1 1 2 2 13legislativeNational Assembly Secretariat 1 1 2National Council 1 1ConstitutionalRoyal Civil Service Commission 2 1 2 1 6Anti-Corruption Commission 1 1 1 3Royal Audit Authority 1 1 1 3ministryMinistry of Education 1 13 22 35 55 19 6 9 9 4 3 1 2 179Ministry of Agriculture and Forests 1 2 2 9 6 4 2 1 13 16 23 13 7 7 2 9 1 3 3 124Ministry of Health 1 1 2 2 5 2 3 2 4 4 8 10 8 4 3 2 2 2 3 68Ministry of Home & Cultural Affairs 1 4 2 1 2 10 3 2 15 8 8 6 1 1 64Ministry of Finance 1 1 2 7 2 1 2 1 5 6 3 5 2 1 1 1 41Ministry of Works & Human Settlement 7 2 2 1 3 1 3 3 1 1 1 8 2 4 39Ministry of Information & Communications 1 1 3 2 5 2 3 3 1 1 2 3 1 28Ministry of Economic Affairs 4 2 1 1 4 2 1 2 1 2 20Ministry of Foreign Affairs 1 1 1 1 1 1 1 1 1 9Ministry of Labour & Human Resources 1 1 1 1 1 5autonoumous & other agencyNational Land Commission 1 1 2 1 2 1 1 1 1 11Gross National Happiness Commission 2 2 1 5Dratshang Lhentshog 1 1 2 4Office of the Attorney General 1 2 1 4National Statistics Bureau 1 1 1 3Tourism Council of Bhutan 1 1 2National Commission for Women & Children 1 1Royal Institute of Management 1 1Bhutan Olympic Committee 1 1Centre for Bhutan Studies and GNH Research 1 1Civil Society Organization Authority 1 1Drug Regulatory Authority 1 1Royal Education Council 1 1Dzongkha Development Commission 1 1Royal Privy Council 1 1Bhutan Council for School Examination and Assessment 1 1Bhutan Standards Bureau 1 1Jigme Singye Wangchuck School of Law 1 1dzongkhagTrashigang 1 1 2Punakha 1 1thromdeThimphu 1 1 1 3
total 10 3 1 2 5 44 56 60 78 41 10 17 35 56 36 47 36 34 38 14 13 20 656
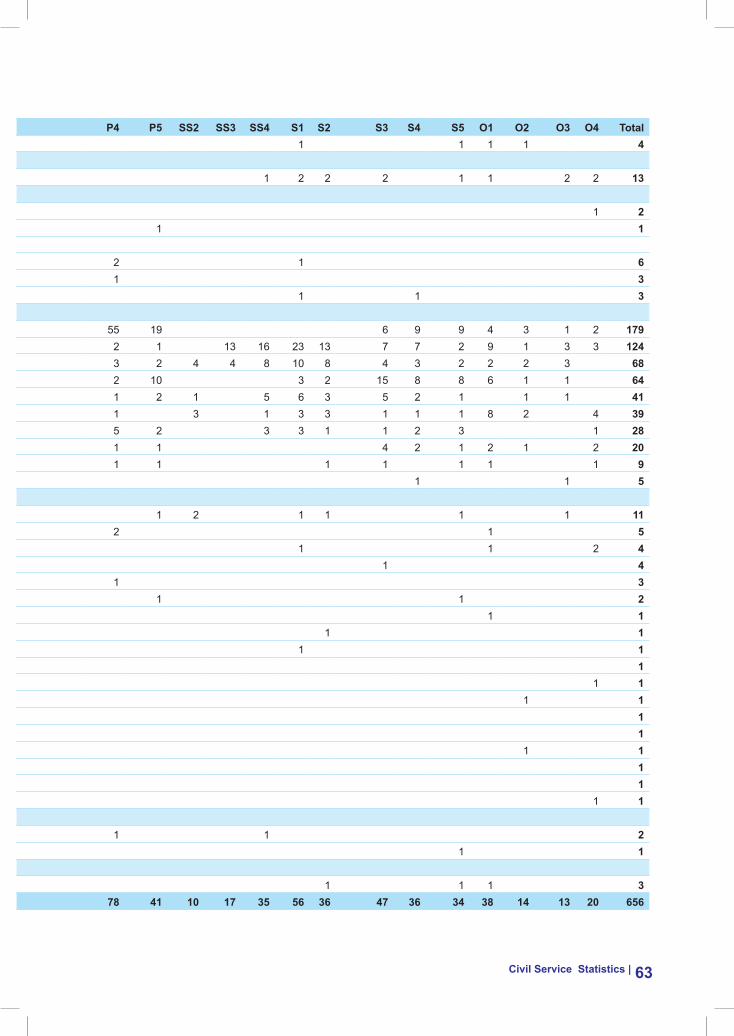
Civil service statistics | 63
table 31Civil Servants Separated by Parent Agency and Position Level (Jan - Dec 2016)Parent agency eX1 eX2 eX3 es2 es3 P1 P2 P3 P4 P5 ss2 ss3 ss4 s1 s2 s3 s4 s5 O1 O2 O3 O4 totalHis Majesty’s Secretariat 1 1 1 1 4JudiciaryRoyal Court of Justice 1 2 2 2 1 1 2 2 13legislativeNational Assembly Secretariat 1 1 2National Council 1 1ConstitutionalRoyal Civil Service Commission 2 1 2 1 6Anti-Corruption Commission 1 1 1 3Royal Audit Authority 1 1 1 3ministryMinistry of Education 1 13 22 35 55 19 6 9 9 4 3 1 2 179Ministry of Agriculture and Forests 1 2 2 9 6 4 2 1 13 16 23 13 7 7 2 9 1 3 3 124Ministry of Health 1 1 2 2 5 2 3 2 4 4 8 10 8 4 3 2 2 2 3 68Ministry of Home & Cultural Affairs 1 4 2 1 2 10 3 2 15 8 8 6 1 1 64Ministry of Finance 1 1 2 7 2 1 2 1 5 6 3 5 2 1 1 1 41Ministry of Works & Human Settlement 7 2 2 1 3 1 3 3 1 1 1 8 2 4 39Ministry of Information & Communications 1 1 3 2 5 2 3 3 1 1 2 3 1 28Ministry of Economic Affairs 4 2 1 1 4 2 1 2 1 2 20Ministry of Foreign Affairs 1 1 1 1 1 1 1 1 1 9Ministry of Labour & Human Resources 1 1 1 1 1 5autonoumous & other agencyNational Land Commission 1 1 2 1 2 1 1 1 1 11Gross National Happiness Commission 2 2 1 5Dratshang Lhentshog 1 1 2 4Office of the Attorney General 1 2 1 4National Statistics Bureau 1 1 1 3Tourism Council of Bhutan 1 1 2National Commission for Women & Children 1 1Royal Institute of Management 1 1Bhutan Olympic Committee 1 1Centre for Bhutan Studies and GNH Research 1 1Civil Society Organization Authority 1 1Drug Regulatory Authority 1 1Royal Education Council 1 1Dzongkha Development Commission 1 1Royal Privy Council 1 1Bhutan Council for School Examination and Assessment 1 1Bhutan Standards Bureau 1 1Jigme Singye Wangchuck School of Law 1 1dzongkhagTrashigang 1 1 2Punakha 1 1thromdeThimphu 1 1 1 3
total 10 3 1 2 5 44 56 60 78 41 10 17 35 56 36 47 36 34 38 14 13 20 656
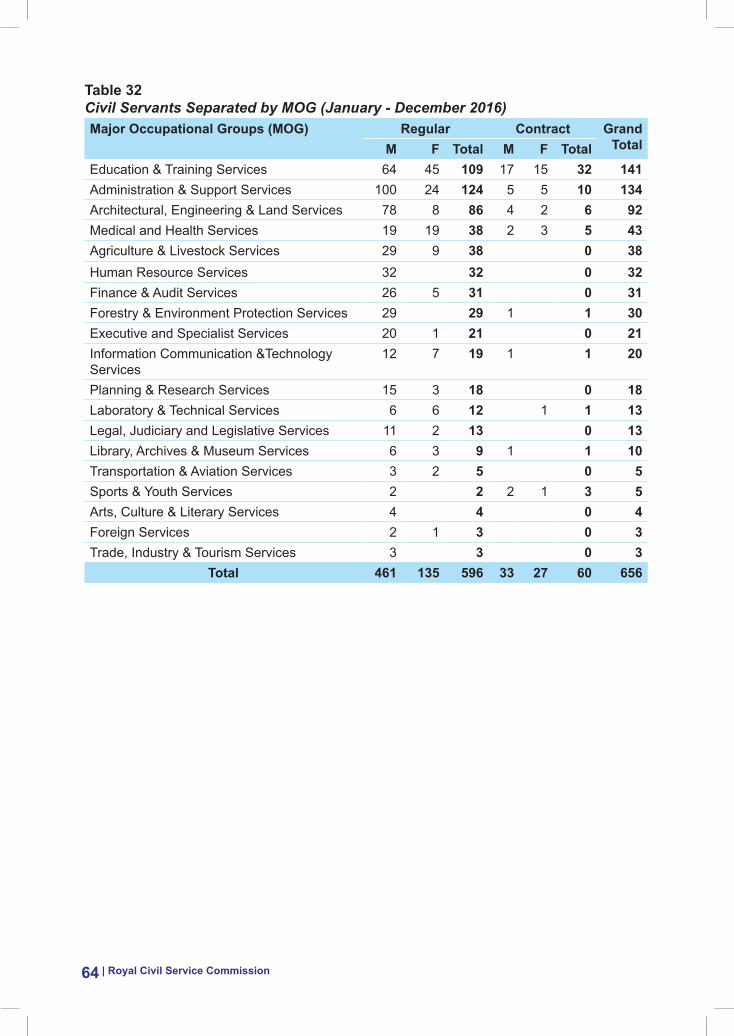
| Royal Civil Service Commission64
table 32Civil Servants Separated by MOG (January - December 2016)major Occupational Groups (mOG) regular Contract Grand
totalm F total m F totalEducation & Training Services 64 45 109 17 15 32 141Administration & Support Services 100 24 124 5 5 10 134Architectural, Engineering & Land Services 78 8 86 4 2 6 92Medical and Health Services 19 19 38 2 3 5 43Agriculture & Livestock Services 29 9 38 0 38Human Resource Services 32 32 0 32Finance & Audit Services 26 5 31 0 31Forestry & Environment Protection Services 29 29 1 1 30Executive and Specialist Services 20 1 21 0 21Information Communication &Technology Services
12 7 19 1 1 20
Planning & Research Services 15 3 18 0 18Laboratory & Technical Services 6 6 12 1 1 13Legal, Judiciary and Legislative Services 11 2 13 0 13Library, Archives & Museum Services 6 3 9 1 1 10Transportation & Aviation Services 3 2 5 0 5Sports & Youth Services 2 2 2 1 3 5Arts, Culture & Literary Services 4 4 0 4Foreign Services 2 1 3 0 3Trade, Industry & Tourism Services 3 3 0 3
total 461 135 596 33 27 60 656
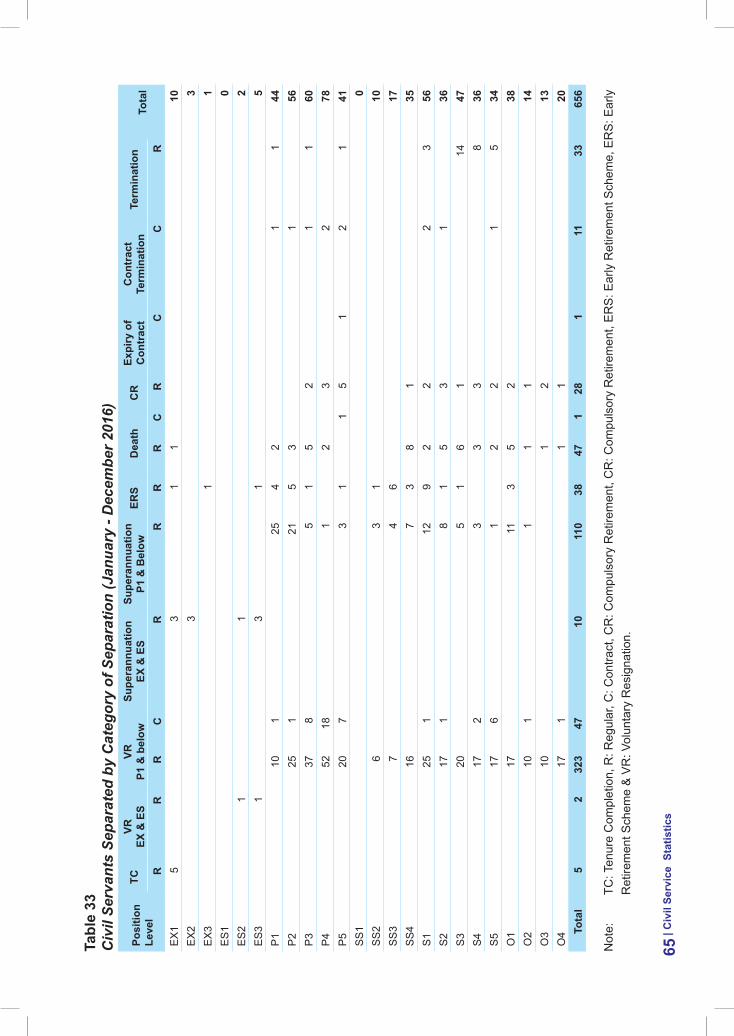
tabl
e 33
Civ
il Se
rvan
ts S
epar
ated
by
Cat
egor
y of
Sep
arat
ion
(Jan
uary
- D
ecem
ber 2
016)
Posi
tion
leve
ltC
vr
eX &
es
vr
P1
& b
elow
supe
rann
uatio
n eX
& e
ssu
pera
nnua
tion
P1 &
bel
ower
sd
eath
Cr
expi
ry o
f C
ontr
act
Con
trac
t te
rmin
atio
n te
rmin
atio
nto
tal
rr
rC
rr
rr
Cr
CC
rE
X1
53
11
10E
X2
33
EX
31
1E
S1
0E
S2
11
2E
S3
13
15
P1
101
254
21
144
P2
251
215
31
56P
337
85
15
21
160
P4
5218
12
32
78P
520
73
11
51
21
41S
S1
0S
S2
63
110
SS
37
46
17S
S4
167
38
135
S1
251
129
22
23
56S
217
18
15
31
36S
320
51
61
1447
S4
172
33
38
36S
517
61
22
15
34O
117
113
52
38O
210
11
11
14O
310
12
13O
417
11
120
tota
l5
232
347
1011
038
471
281
1133
656
Not
e:
TC: T
enur
e C
ompl
etio
n, R
: Reg
ular
, C: C
ontra
ct, C
R: C
ompu
lsor
y R
etire
men
t, C
R: C
ompu
lsor
y R
etire
men
t, E
RS
: Ear
ly R
etire
men
t Sch
eme,
ER
S: E
arly
R
etire
men
t Sch
eme
& V
R: V
olun
tary
Res
igna
tion.
| Civ
il se
rvic
e s
tatis
tics
65
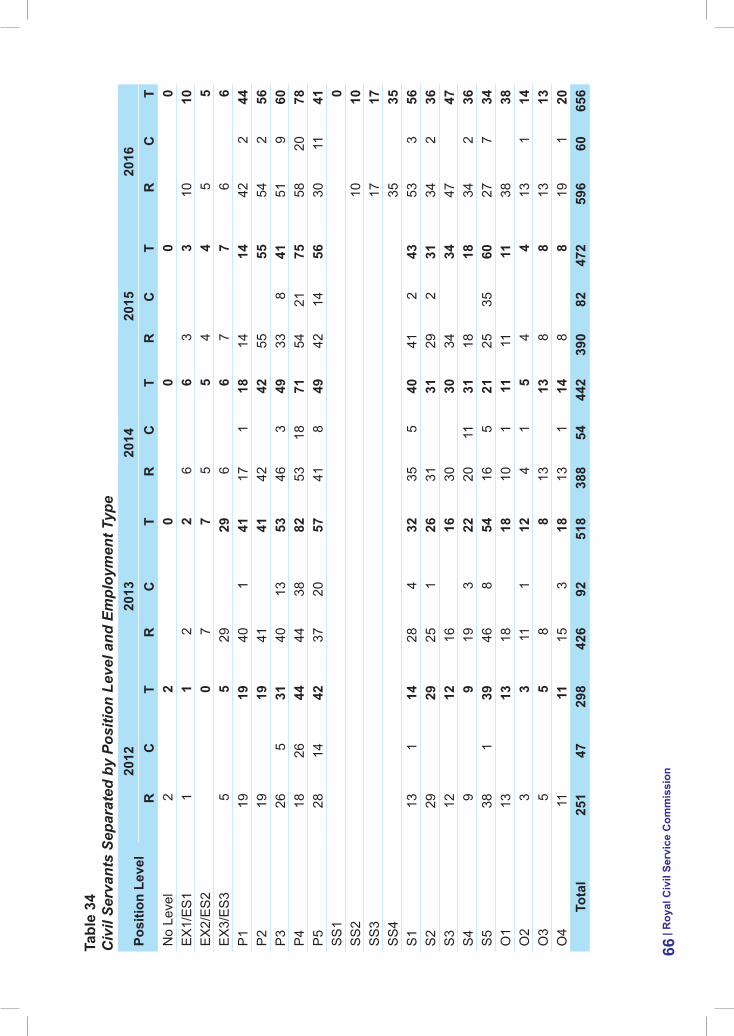
tabl
e 34
Civ
il Se
rvan
ts S
epar
ated
by
Posi
tion
Leve
l and
Em
ploy
men
t Typ
e
Posi
tion
leve
l20
1220
1320
1420
1520
16r
Ct
rC
tr
Ct
rC
tr
Ct
No
Leve
l2
20
00
0E
X1/
ES
11
12
26
63
310
10E
X2/
ES
20
77
55
44
55
EX
3/E
S3
55
2929
66
77
66
P1
1919
401
4117
118
1414
422
44P
219
1941
4142
4255
5554
256
P3
265
3140
1353
463
4933
841
519
60P
418
2644
4438
8253
1871
5421
7558
2078
P5
2814
4237
2057
418
4942
1456
3011
41S
S1
0S
S2
1010
SS
317
17S
S4
3535
S1
131
1428
432
355
4041
243
533
56S
229
2925
126
3131
292
3134
236
S3
1212
1616
3030
3434
4747
S4
99
193
2220
1131
1818
342
36S
538
139
468
5416
521
2535
6027
734
O1
1313
1818
101
1111
1138
38O
23
311
112
41
54
413
114
O3
55
88
1313
88
1313
O4
1111
153
1813
114
88
191
20to
tal
251
4729
842
692
518
388
5444
239
082
472
596
6065
6
| roy
al C
ivil
serv
ice
Com
mis
sion
66
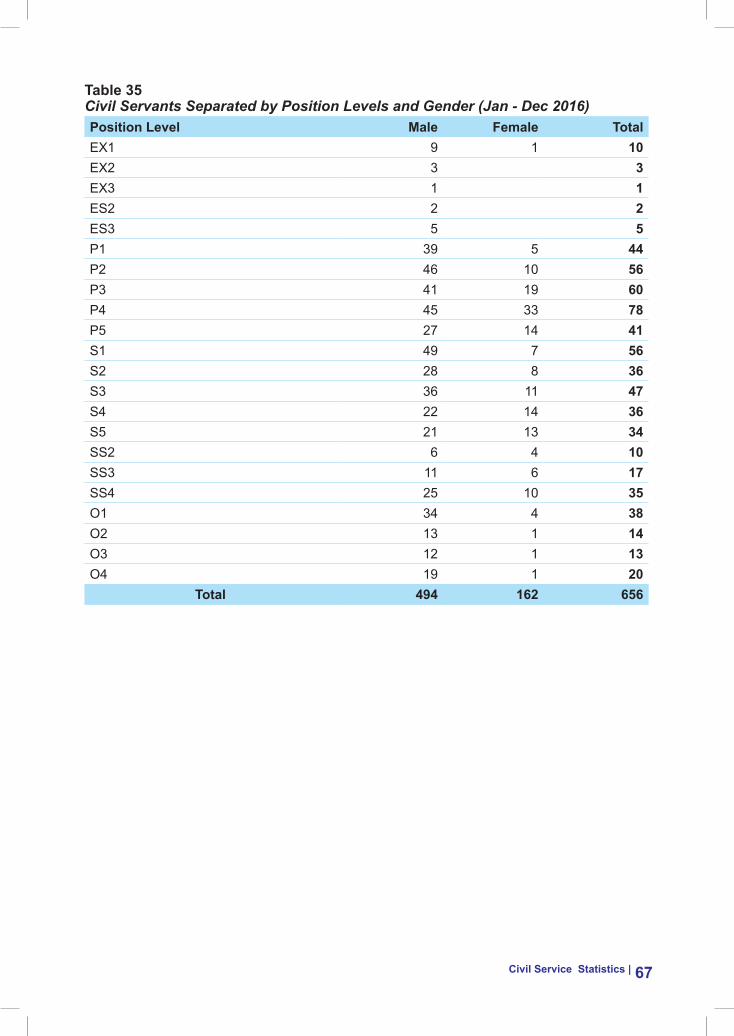
Civil service statistics | 67
table 35Civil Servants Separated by Position Levels and Gender (Jan - Dec 2016)Position level male Female totalEX1 9 1 10EX2 3 3EX3 1 1ES2 2 2ES3 5 5P1 39 5 44P2 46 10 56P3 41 19 60P4 45 33 78P5 27 14 41S1 49 7 56S2 28 8 36S3 36 11 47S4 22 14 36S5 21 13 34SS2 6 4 10SS3 11 6 17SS4 25 10 35O1 34 4 38O2 13 1 14O3 12 1 13O4 19 1 20
total 494 162 656
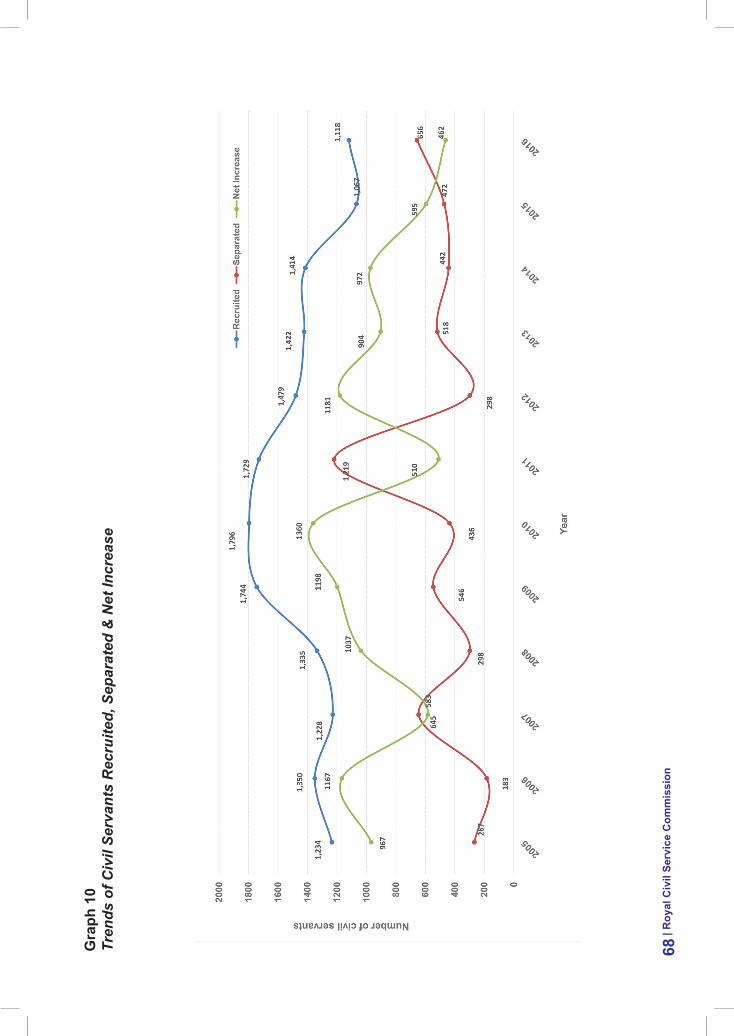
Gra
ph 1
0Tr
ends
of C
ivil
Serv
ants
Rec
ruite
d, S
epar
ated
& N
et In
crea
se
| roy
al C
ivil
serv
ice
Com
mis
sion
68
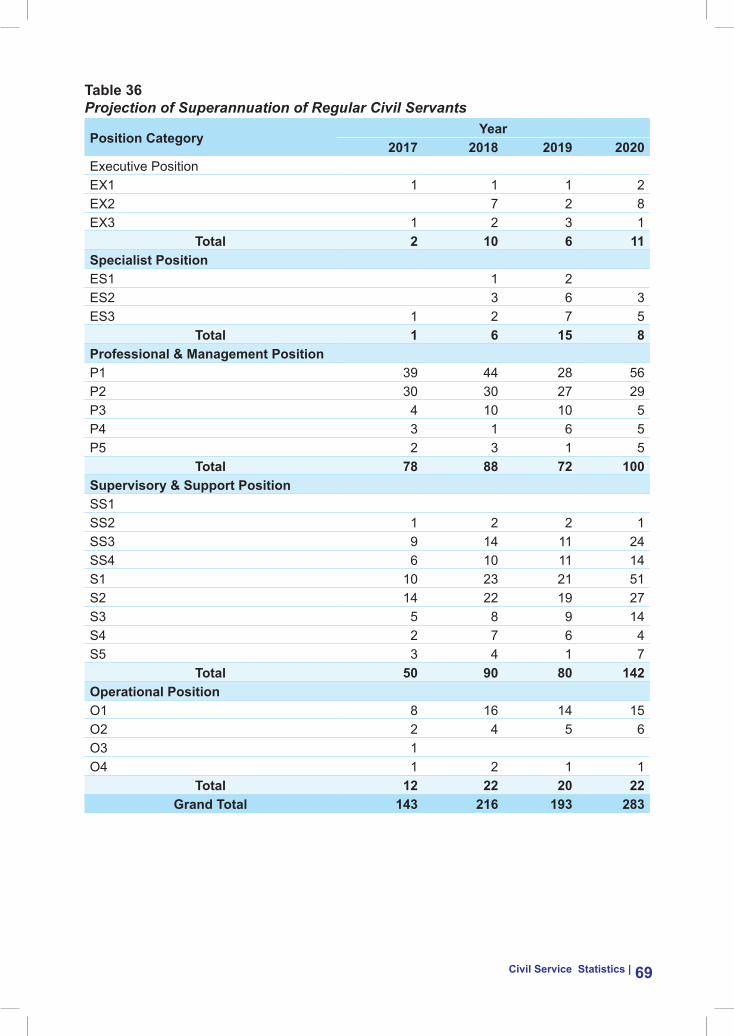
Civil service statistics | 69
table 36Projection of Superannuation of Regular Civil Servants
Position CategoryYear
2017 2018 2019 2020Executive PositionEX1 1 1 1 2EX2 7 2 8EX3 1 2 3 1
total 2 10 6 11specialist PositionES1 1 2ES2 3 6 3ES3 1 2 7 5
total 1 6 15 8Professional & management PositionP1 39 44 28 56P2 30 30 27 29P3 4 10 10 5P4 3 1 6 5P5 2 3 1 5
total 78 88 72 100supervisory & support PositionSS1SS2 1 2 2 1SS3 9 14 11 24SS4 6 10 11 14S1 10 23 21 51S2 14 22 19 27S3 5 8 9 14S4 2 7 6 4S5 3 4 1 7
total 50 90 80 142Operational PositionO1 8 16 14 15O2 2 4 5 6O3 1O4 1 2 1 1
total 12 22 20 22Grand total 143 216 193 283
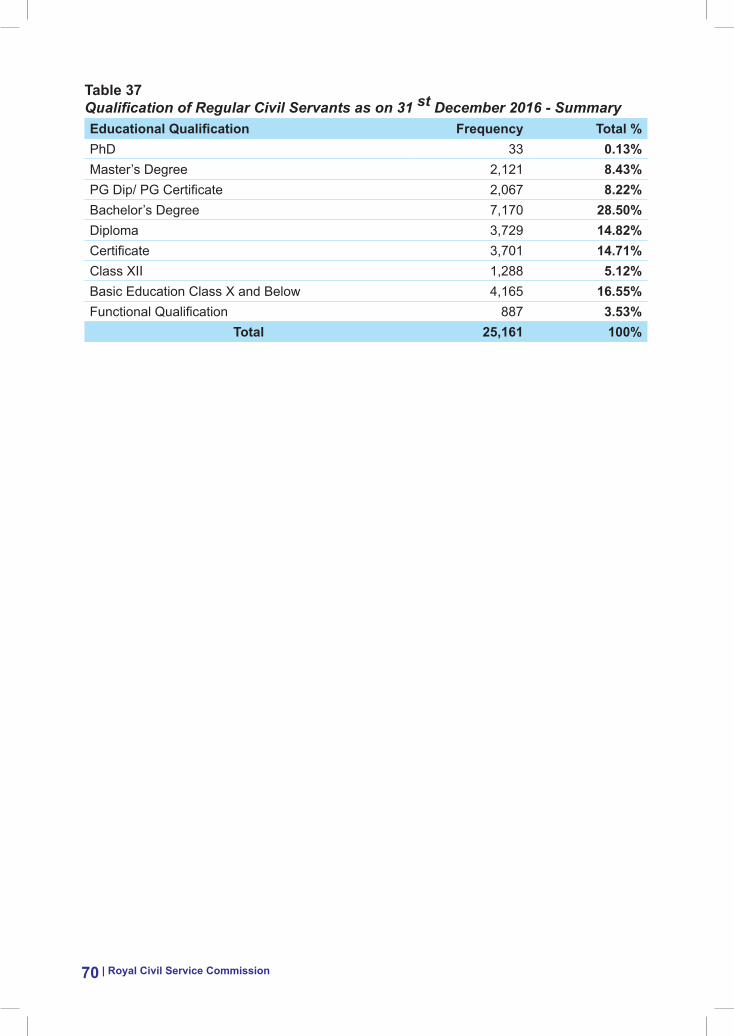
| Royal Civil Service Commission70
table 37Qualification of Regular Civil Servants as on 31 st December 2016 - SummaryEducational Qualification Frequency total %PhD 33 0.13%Master’s Degree 2,121 8.43%PG Dip/ PG Certificate 2,067 8.22%Bachelor’s Degree 7,170 28.50%Diploma 3,729 14.82%Certificate 3,701 14.71%Class XII 1,288 5.12%Basic Education Class X and Below 4,165 16.55%Functional Qualification 887 3.53%
total 25,161 100%
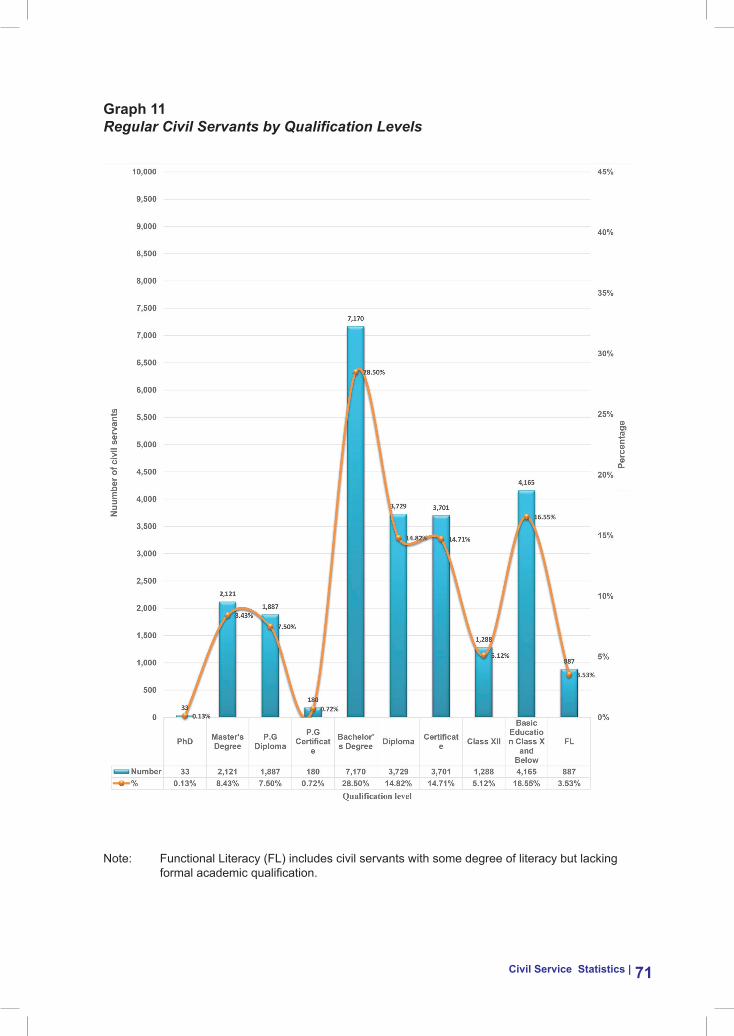
Civil service statistics | 71
Graph 11Regular Civil Servants by Qualification Levels
Note: Functional Literacy (FL) includes civil servants with some degree of literacy but lacking formal academic qualification.
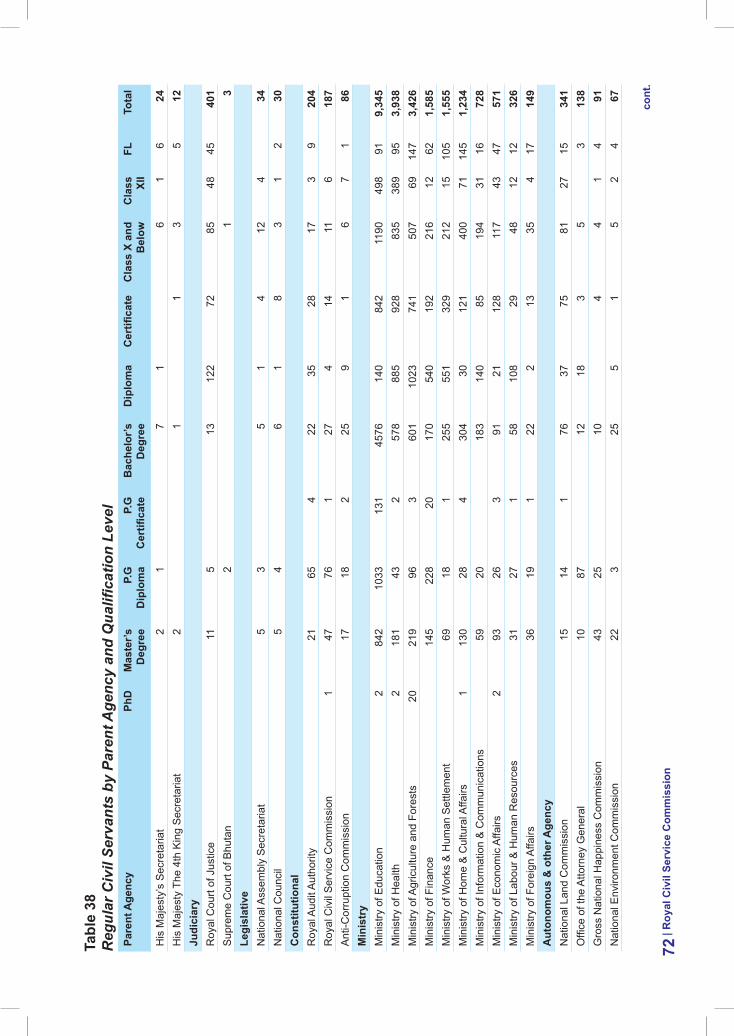
tabl
e 38
Reg
ular
Civ
il Se
rvan
ts b
y Pa
rent
Age
ncy
and
Qua
lifica
tion
Leve
lPa
rent
age
ncy
Phd
mas
ter’s
d
egre
eP.
G
dip
lom
aP.
G
Cer
tifica
teb
ache
lor’s
d
egre
ed
iplo
ma
Cer
tifica
teC
lass
X a
nd
bel
owC
lass
Xi
iFl
tota
l
His
Maj
esty
’s S
ecre
taria
t2
17
16
16
24H
is M
ajes
ty T
he 4
th K
ing
Sec
reta
riat
21
13
512
Judi
ciar
yR
oyal
Cou
rt of
Jus
tice
115
1312
272
8548
4540
1S
upre
me
Cou
rt of
Bhu
tan
21
3le
gisl
ativ
eN
atio
nal A
ssem
bly
Sec
reta
riat
53
51
412
434
Nat
iona
l Cou
ncil
54
61
83
12
30C
onst
itutio
nal
Roy
al A
udit
Aut
horit
y21
654
2235
2817
39
204
Roy
al C
ivil
Ser
vice
Com
mis
sion
147
761
274
1411
618
7A
nti-C
orru
ptio
n C
omm
issi
on17
182
259
16
71
86m
inis
try
Min
istry
of E
duca
tion
284
210
3313
145
7614
084
211
9049
891
9,34
5M
inis
try o
f Hea
lth2
181
432
578
885
928
835
389
953,
938
Min
istry
of A
gric
ultu
re a
nd F
ores
ts20
219
963
601
1023
741
507
6914
73,
426
Min
istry
of F
inan
ce14
522
820
170
540
192
216
1262
1,58
5M
inis
try o
f Wor
ks &
Hum
an S
ettle
men
t69
181
255
551
329
212
1510
51,
555
Min
istry
of H
ome
& C
ultu
ral A
ffairs
113
028
430
430
121
400
7114
51,
234
Min
istry
of I
nfor
mat
ion
& C
omm
unic
atio
ns59
2018
314
085
194
3116
728
Min
istry
of E
cono
mic
Affa
irs2
9326
391
2112
811
743
4757
1M
inis
try o
f Lab
our &
Hum
an R
esou
rces
3127
158
108
2948
1212
326
Min
istry
of F
orei
gn A
ffairs
3619
122
213
354
1714
9a
uton
omou
s &
oth
er a
genc
yN
atio
nal L
and
Com
mis
sion
1514
176
3775
8127
1534
1O
ffice
of t
he A
ttorn
ey G
ener
al10
8712
183
53
138
Gro
ss N
atio
nal H
appi
ness
Com
mis
sion
4325
104
41
491
Nat
iona
l Env
ironm
ent C
omm
issi
on22
325
51
52
467
| roy
al C
ivil
serv
ice
Com
mis
sion
72co
nt.
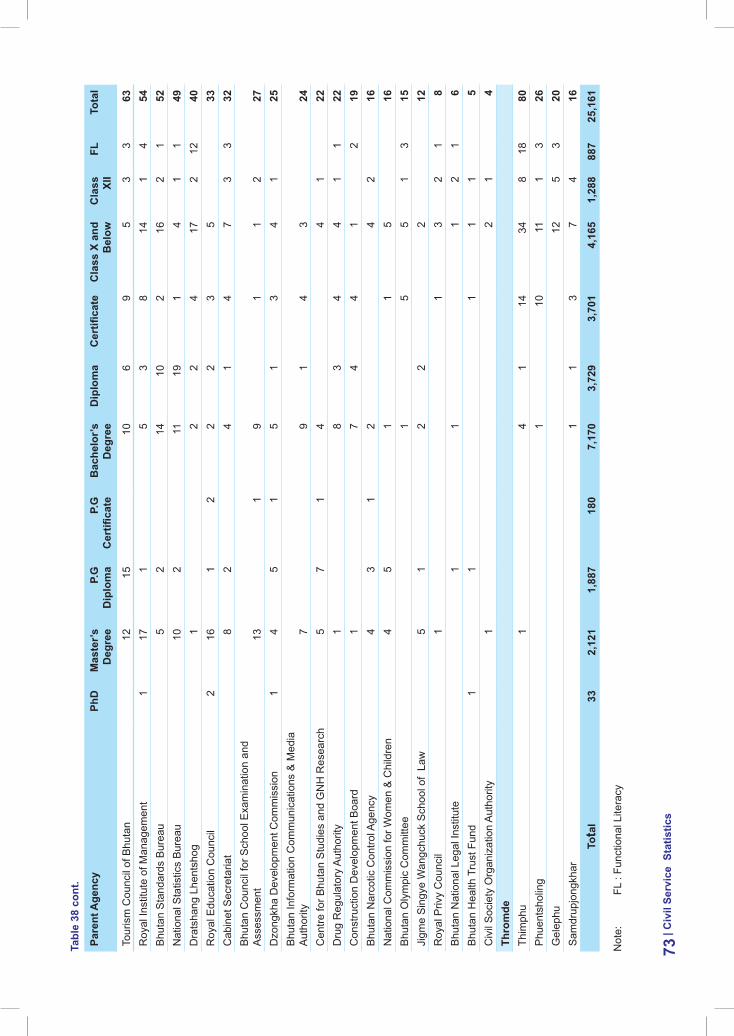
Pare
nt a
genc
yPh
dm
aste
r’s
deg
ree
P.G
d
iplo
ma
P.G
C
ertifi
cate
bac
helo
r’s
deg
ree
dip
lom
aC
ertifi
cate
Cla
ss X
and
b
elow
Cla
ss
Xii
Flto
tal
Tour
ism
Cou
ncil
of B
huta
n12
1510
69
53
363
Roy
al In
stitu
te o
f Man
agem
ent
117
15
38
141
454
Bhu
tan
Sta
ndar
ds B
urea
u5
214
102
162
152
Nat
iona
l Sta
tistic
s B
urea
u10
211
191
41
149
Dra
tsha
ng L
hent
shog
12
24
172
1240
Roy
al E
duca
tion
Cou
ncil
216
12
22
35
33C
abin
et S
ecre
taria
t8
24
14
73
332
Bhu
tan
Cou
ncil
for S
choo
l Exa
min
atio
n an
d A
sses
smen
t13
19
11
227
Dzo
ngkh
a D
evel
opm
ent C
omm
issi
on1
45
15
13
41
25B
huta
n In
form
atio
n C
omm
unic
atio
ns &
Med
ia
Aut
horit
y7
91
43
24C
entre
for B
huta
n S
tudi
es a
nd G
NH
Res
earc
h5
71
44
122
Dru
g R
egul
ator
y A
utho
rity
18
34
41
122
Con
stru
ctio
n D
evel
opm
ent B
oard
17
44
12
19B
huta
n N
arco
tic C
ontro
l Age
ncy
43
12
42
16N
atio
nal C
omm
issi
on fo
r Wom
en &
Chi
ldre
n4
51
15
16B
huta
n O
lym
pic
Com
mitt
ee1
55
13
15Ji
gme
Sin
gye
Wan
gchu
ck S
choo
l of
Law
5
12
22
12R
oyal
Priv
y C
ounc
il1
13
21
8B
huta
n N
atio
nal L
egal
Inst
itute
11
12
16
Bhu
tan
Hea
lth T
rust
Fun
d1
11
11
5C
ivil
Soc
iety
Org
aniz
atio
n A
utho
rity
12
14
thro
mde
Thim
phu
14
114
348
1880
Phu
ents
holin
g1
1011
13
26G
elep
hu12
53
20S
amdr
upjo
ngkh
ar1
13
74
16
tota
l33
2,12
11,
887
180
7,17
03,
729
3,70
14,
165
1,28
888
725
,161
Not
e:
FL :
Func
tiona
l Lite
racy
| Civ
il se
rvic
e s
tatis
tics
73tabl
e 38
con
t.
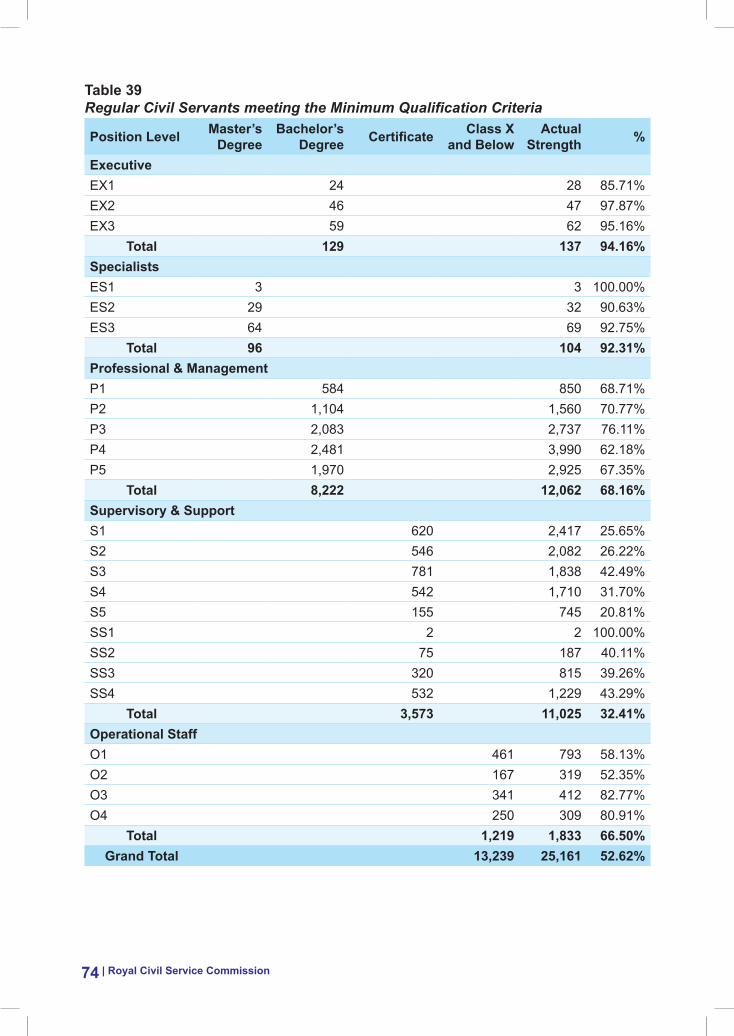
| Royal Civil Service Commission74
table 39Regular Civil Servants meeting the Minimum Qualification Criteria
Position level master’s degree
bachelor’s degree Certificate Class X
and belowactual
strength %
executiveEX1 24 28 85.71%EX2 46 47 97.87%EX3 59 62 95.16%
total 129 137 94.16%specialistsES1 3 3 100.00%ES2 29 32 90.63%ES3 64 69 92.75%
total 96 104 92.31%Professional & managementP1 584 850 68.71%P2 1,104 1,560 70.77%P3 2,083 2,737 76.11%P4 2,481 3,990 62.18%P5 1,970 2,925 67.35%
total 8,222 12,062 68.16%supervisory & supportS1 620 2,417 25.65%S2 546 2,082 26.22%S3 781 1,838 42.49%S4 542 1,710 31.70%S5 155 745 20.81%SS1 2 2 100.00%SS2 75 187 40.11%SS3 320 815 39.26%SS4 532 1,229 43.29%
total 3,573 11,025 32.41%Operational staffO1 461 793 58.13%O2 167 319 52.35%O3 341 412 82.77%O4 250 309 80.91%
total 1,219 1,833 66.50%Grand total 13,239 25,161 52.62%
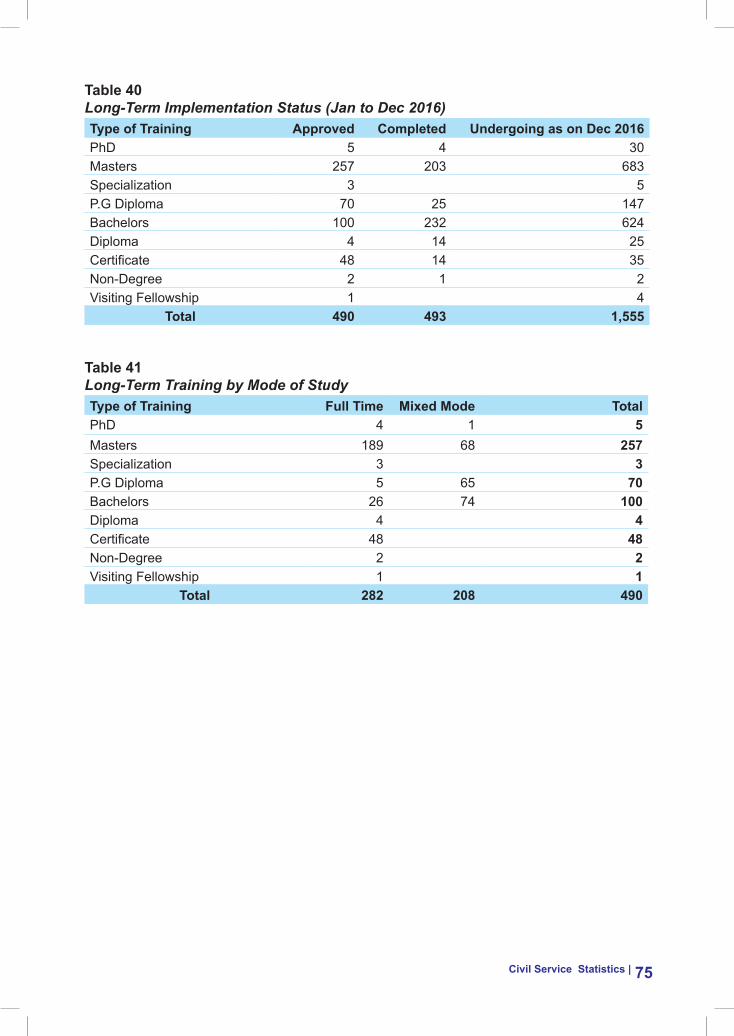
Civil service statistics | 75
table 40Long-Term Implementation Status (Jan to Dec 2016)type of training approved Completed Undergoing as on dec 2016PhD 5 4 30 Masters 257 203 683 Specialization 3 5 P.G Diploma 70 25 147 Bachelors 100 232 624 Diploma 4 14 25 Certificate 48 14 35 Non-Degree 2 1 2 Visiting Fellowship 1 4
total 490 493 1,555
table 41Long-Term Training by Mode of Studytype of training Full time mixed mode totalPhD 4 1 5Masters 189 68 257Specialization 3 3P.G Diploma 5 65 70Bachelors 26 74 100Diploma 4 4Certificate 48 48Non-Degree 2 2Visiting Fellowship 1 1
total 282 208 490
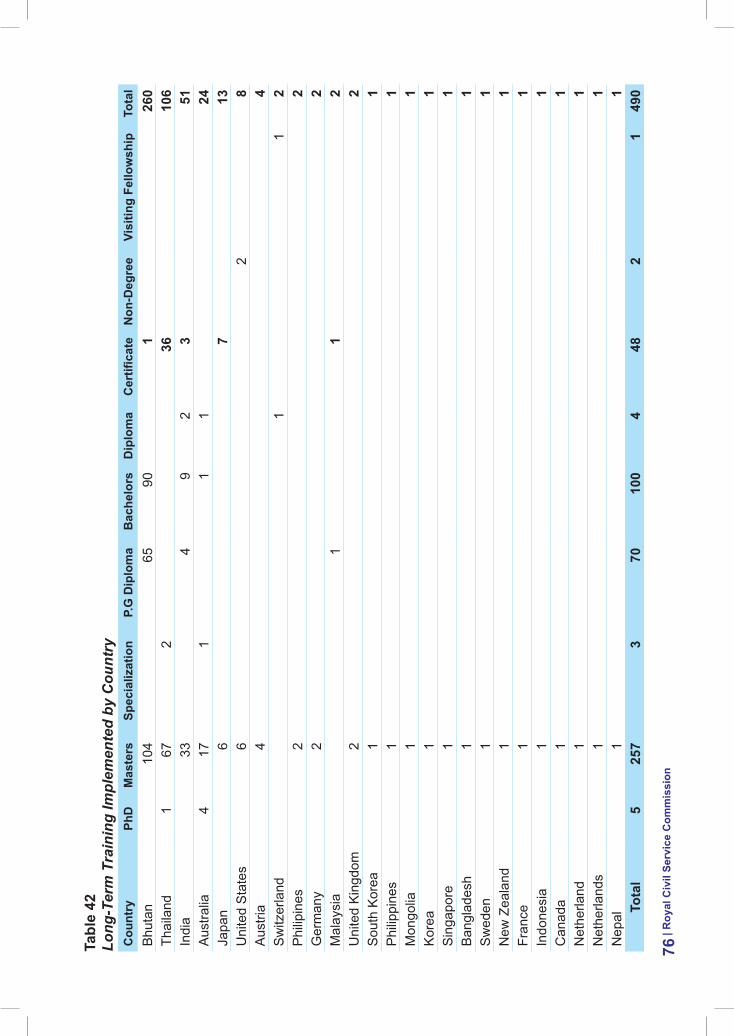
tabl
e 42
Long
-Ter
m T
rain
ing
Impl
emen
ted
by C
ount
ryC
ount
ryPh
dm
aste
rssp
ecia
lizat
ion
P.G
dip
lom
ab
ache
lors
dip
lom
aC
ertifi
cate
Non
-deg
ree
visi
ting
Fello
wsh
ipto
tal
Bhu
tan
104
6590
126
0Th
aila
nd1
672
3610
6In
dia
334
92
351
Aus
tralia
417
11
124
Japa
n6
713
Uni
ted
Sta
tes
62
8A
ustri
a4
4S
witz
erla
nd1
12
Phi
lipin
es2
2G
erm
any
22
Mal
aysi
a1
12
Uni
ted
Kin
gdom
22
Sou
th K
orea
11
Phi
lippi
nes
11
Mon
golia
11
Kor
ea1
1S
inga
pore
11
Ban
glad
esh
11
Sw
eden
11
New
Zea
land
11
Fran
ce1
1In
done
sia
11
Can
ada
11
Net
herla
nd1
1N
ethe
rland
s1
1N
epal
11
tota
l5
257
370
100
448
21
490
| roy
al C
ivil
serv
ice
Com
mis
sion
76
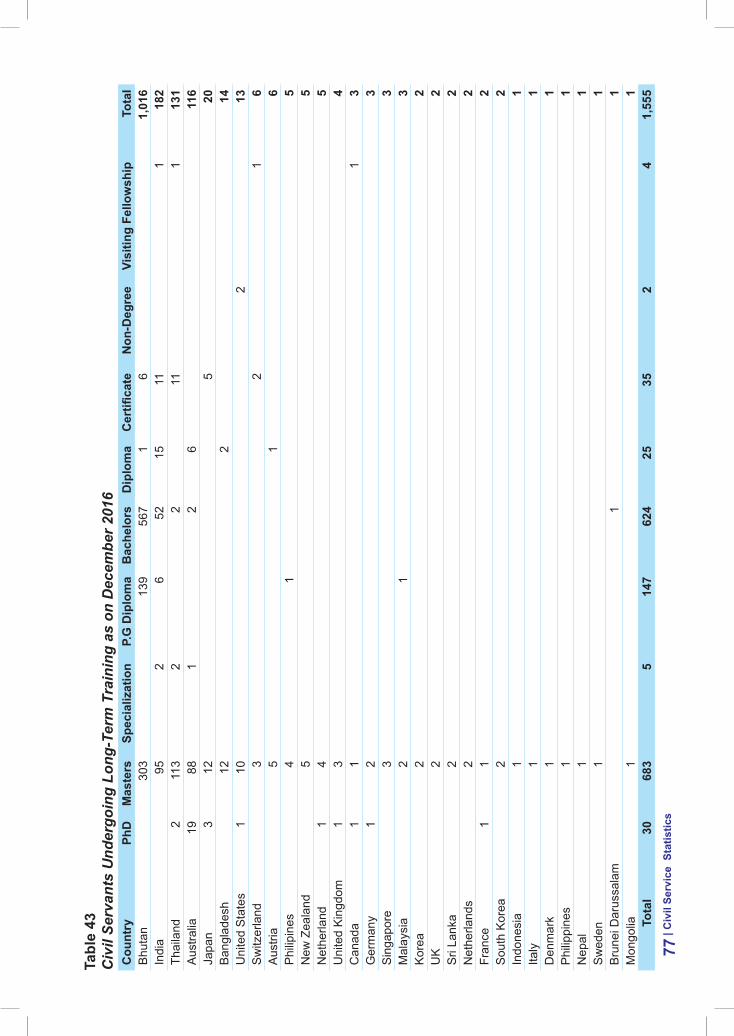
tabl
e 43
Civ
il Se
rvan
ts U
nder
goin
g Lo
ng-T
erm
Tra
inin
g as
on
Dec
embe
r 201
6C
ount
ryPh
dm
aste
rssp
ecia
lizat
ion
P.G
dip
lom
ab
ache
lors
dip
lom
aC
ertifi
cate
Non
-deg
ree
visi
ting
Fello
wsh
ipto
tal
Bhu
tan
303
139
567
1 6
1,01
6 In
dia
95
2 6
52
15
11
1 18
2 Th
aila
nd2
113
2 2
11
1 13
1 A
ustra
lia19
88
1
2 6
116
Japa
n3
12
5 20
B
angl
ades
h12
2
14
Uni
ted
Sta
tes
1 10
2
13
Sw
itzer
land
3 2
1 6
Aus
tria
5 1
6 P
hilip
ines
4 1
5 N
ew Z
eala
nd5
5 N
ethe
rland
1 4
5 U
nite
d K
ingd
om1
3 4
Can
ada
1 1
1 3
Ger
man
y1
2 3
Sin
gapo
re3
3 M
alay
sia
2 1
3 K
orea
2 2
UK
2 2
Sri
Lank
a2
2 N
ethe
rland
s2
2 Fr
ance
1 1
2 S
outh
Kor
ea2
2 In
done
sia
1 1
Italy
1 1
Den
mar
k1
1 P
hilip
pine
s1
1 N
epal
1 1
Sw
eden
1 1
Bru
nei D
arus
sala
m1
1 M
ongo
lia1
1 to
tal
30
683
5 14
7 62
4 25
35
2
4 1,
555
| Civ
il se
rvic
e s
tatis
tics
77
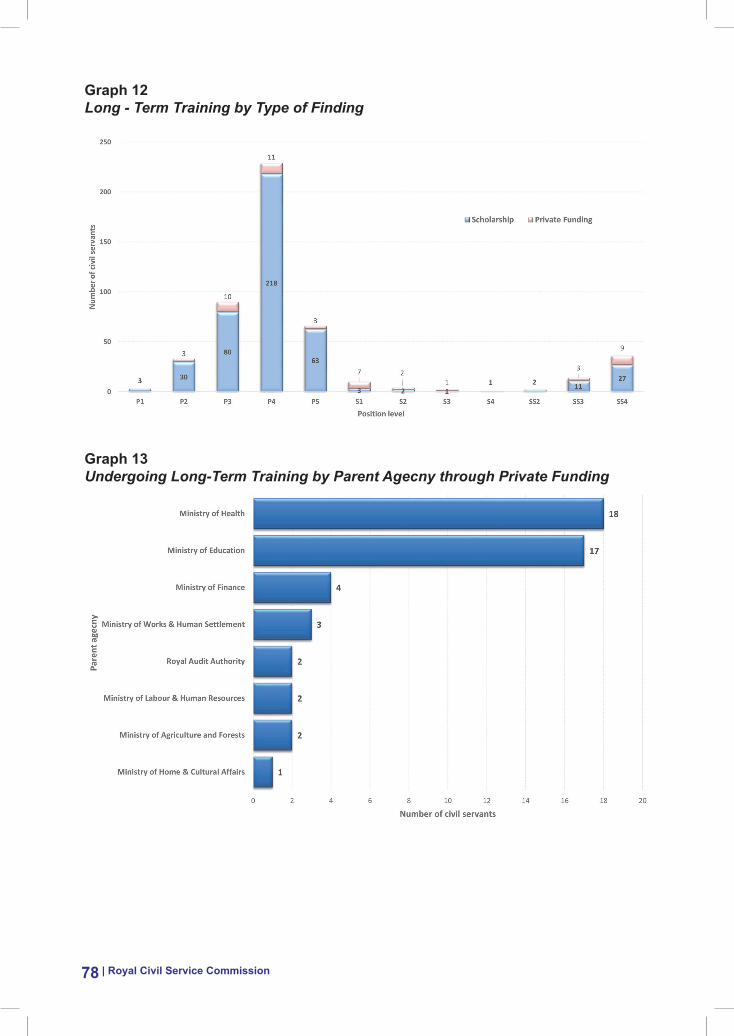
| Royal Civil Service Commission78
Graph 12Long - Term Training by Type of Finding
Graph 13Undergoing Long-Term Training by Parent Agecny through Private Funding
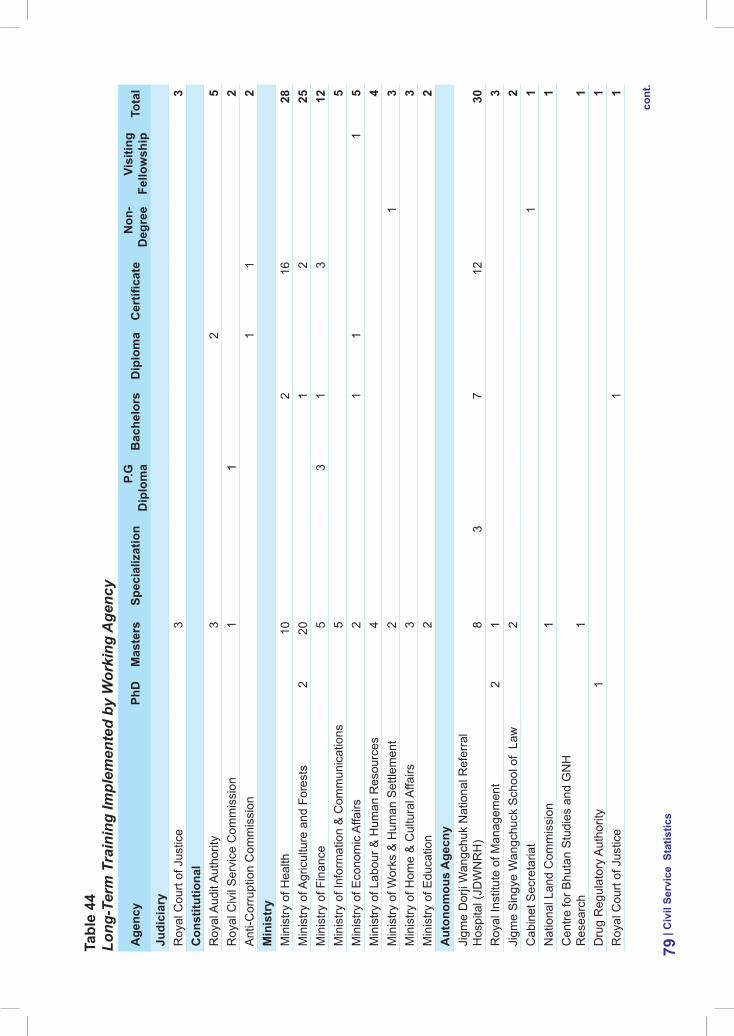
tabl
e 44
Long
-Ter
m T
rain
ing
Impl
emen
ted
by W
orki
ng A
genc
y
age
ncy
Phd
mas
ters
spec
ializ
atio
nP.
G
dip
lom
ab
ache
lors
dip
lom
aC
ertifi
cate
Non
- d
egre
evi
sitin
g Fe
llow
ship
tota
l
Judi
ciar
yR
oyal
Cou
rt of
Jus
tice
33
Con
stitu
tiona
lR
oyal
Aud
it A
utho
rity
32
5R
oyal
Civ
il S
ervi
ce C
omm
issi
on1
12
Ant
i-Cor
rupt
ion
Com
mis
sion
11
2m
inis
try
Min
istry
of H
ealth
102
1628
Min
istry
of A
gric
ultu
re a
nd F
ores
ts2
201
225
Min
istry
of F
inan
ce5
31
312
Min
istry
of I
nfor
mat
ion
& C
omm
unic
atio
ns5
5M
inis
try o
f Eco
nom
ic A
ffairs
21
11
5M
inis
try o
f Lab
our &
Hum
an R
esou
rces
44
Min
istry
of W
orks
& H
uman
Set
tlem
ent
21
3M
inis
try o
f Hom
e &
Cul
tura
l Affa
irs3
3M
inis
try o
f Edu
catio
n2
2a
uton
omou
s a
gecn
yJi
gme
Dor
ji W
angc
huk
Nat
iona
l Ref
erra
l H
ospi
tal (
JDW
NR
H)
83
712
30R
oyal
Inst
itute
of M
anag
emen
t2
13
Jigm
e S
ingy
e W
angc
huck
Sch
ool o
f La
w
22
Cab
inet
Sec
reta
riat
11
Nat
iona
l Lan
d C
omm
issi
on1
1C
entre
for B
huta
n S
tudi
es a
nd G
NH
R
esea
rch
11
Dru
g R
egul
ator
y A
utho
rity
11
Roy
al C
ourt
of J
ustic
e1
1
| Civ
il se
rvic
e s
tatis
tics
79co
nt.
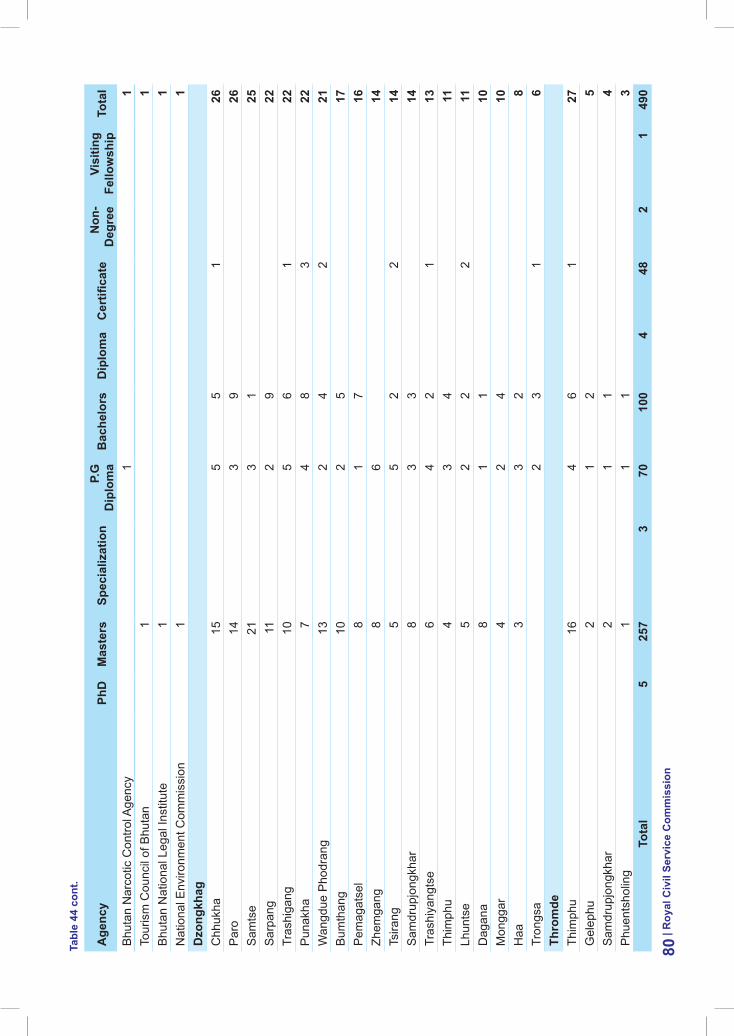
age
ncy
Phd
mas
ters
spec
ializ
atio
nP.
G
dip
lom
ab
ache
lors
dip
lom
aC
ertifi
cate
Non
- d
egre
evi
sitin
g Fe
llow
ship
tota
l
Bhu
tan
Nar
cotic
Con
trol A
genc
y1
1To
uris
m C
ounc
il of
Bhu
tan
11
Bhu
tan
Nat
iona
l Leg
al In
stitu
te1
1N
atio
nal E
nviro
nmen
t Com
mis
sion
11
dzo
ngkh
agC
hhuk
ha
155
51
26P
aro
143
926
Sam
tse
213
125
Sar
pang
11
29
22Tr
ashi
gang
10
56
122
Pun
akha
7
48
322
Wan
gdue
Pho
dran
g13
24
221
Bum
than
g 10
25
17P
emag
atse
l 8
17
16Zh
emga
ng
86
14Ts
irang
5
52
214
Sam
drup
jong
khar
8
33
14Tr
ashi
yang
tse
64
21
13Th
imph
u 4
34
11Lh
unts
e 5
22
211
Dag
ana
81
110
Mon
ggar
4
24
10H
aa
33
28
Tron
gsa
23
16
thro
mde
Thim
phu
164
61
27G
elep
hu2
12
5S
amdr
upjo
ngkh
ar
21
14
Phu
ents
holin
g1
11
3to
tal
525
73
7010
04
482
149
0
| roy
al C
ivil
serv
ice
Com
mis
sion
80tabl
e 44
con
t.
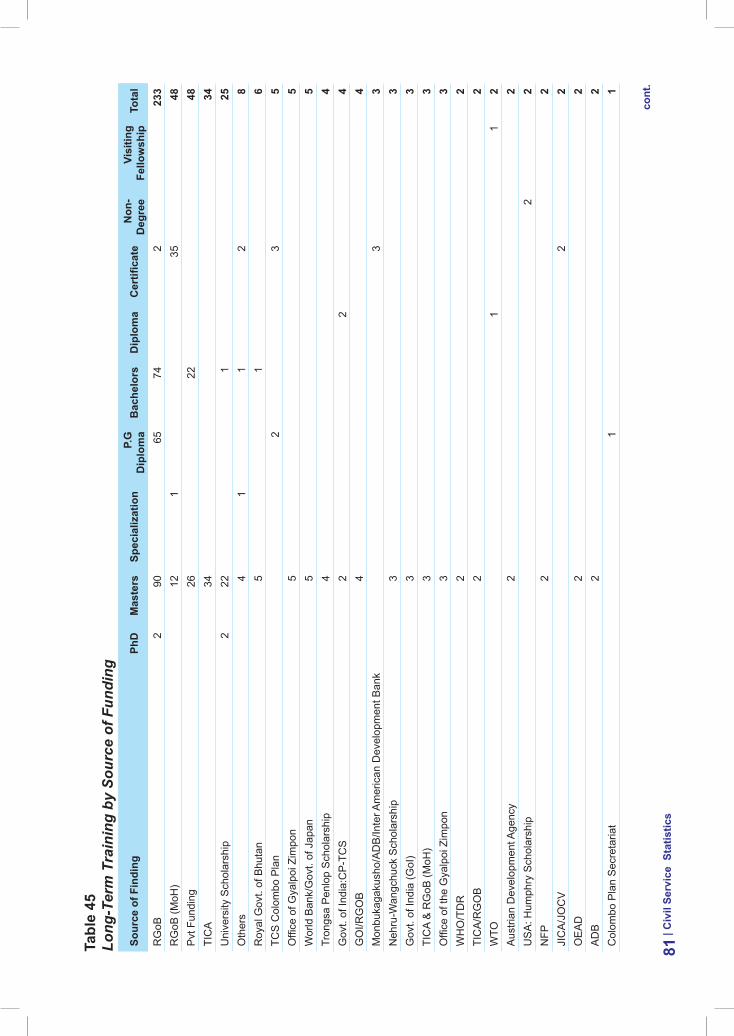
tabl
e 45
Long
-Ter
m T
rain
ing
by S
ourc
e of
Fun
ding
sour
ce o
f Fin
ding
Phd
mas
ters
spec
ializ
atio
nP.
G
dip
lom
ab
ache
lors
dip
lom
aC
ertifi
cate
Non
- d
egre
evi
sitin
g Fe
llow
ship
tota
l
RG
oB2
9065
742
233
RG
oB (M
oH)
121
3548
Pvt
Fun
ding
2622
48TI
CA
3434
Uni
vers
ity S
chol
arsh
ip2
221
25O
ther
s4
11
28
Roy
al G
ovt.
of B
huta
n5
16
TCS
Col
ombo
Pla
n2
35
Offi
ce o
f Gya
lpoi
Zim
pon
55
Wor
ld B
ank/
Gov
t. of
Jap
an5
5Tr
ongs
a P
enlo
p S
chol
arsh
ip4
4G
ovt.
of In
dia:
CP
-TC
S2
24
GO
I/RG
OB
44
Mon
buka
gaku
sho/
AD
B/In
ter A
mer
ican
Dev
elop
men
t Ban
k3
3N
ehru
-Wan
gchu
ck S
chol
arsh
ip3
3G
ovt.
of In
dia
(GoI
)3
3TI
CA
& R
GoB
(MoH
)3
3O
ffice
of t
he G
yalp
oi Z
impo
n3
3W
HO
/TD
R2
2TI
CA
/RG
OB
22
WTO
11
2A
ustri
an D
evel
opm
ent A
genc
y2
2U
SA
: Hum
phry
Sch
olar
ship
22
NFP
22
JIC
A/J
OC
V2
2O
EA
D2
2A
DB
22
Col
ombo
Pla
n S
ecre
taria
t1
1
| Civ
il se
rvic
e s
tatis
tics
81co
nt.
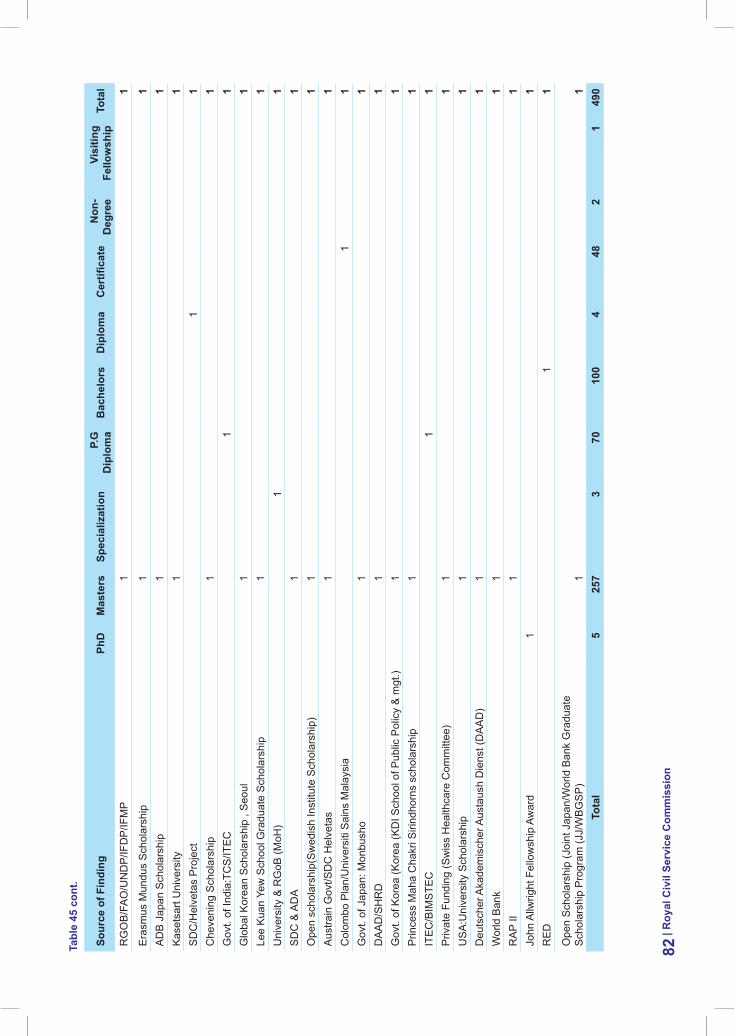
sour
ce o
f Fin
ding
Phd
mas
ters
spec
ializ
atio
nP.
G
dip
lom
ab
ache
lors
dip
lom
aC
ertifi
cate
Non
- d
egre
evi
sitin
g Fe
llow
ship
tota
l
RG
OB
/FA
O/U
ND
P/IF
DP
/IFM
P1
1
Era
smus
Mun
dus
Sch
olar
ship
11
AD
B J
apan
Sch
olar
ship
11
Kas
etsa
rt U
nive
rsity
11
SD
C/H
elve
tas
Pro
ject
11
Che
veni
ng S
chol
arsh
ip1
1G
ovt.
of In
dia:
TCS
/ITE
C1
1G
loba
l Kor
ean
Sch
olar
ship
, S
eoul
11
Lee
Kua
n Ye
w S
choo
l Gra
duat
e S
chol
arsh
ip1
1U
nive
rsity
& R
GoB
(MoH
)1
1S
DC
& A
DA
11
Ope
n sc
hola
rshi
p(S
wed
ish
Inst
itute
Sch
olar
ship
)1
1A
ustra
in G
ovt/S
DC
Hel
veta
s1
1C
olom
bo P
lan/
Uni
vers
iti S
ains
Mal
aysi
a1
1G
ovt.
of J
apan
: Mon
bush
o1
1D
AA
D/S
HR
D1
1G
ovt.
of K
orea
(Kor
ea (K
DI S
choo
l of P
ublic
Pol
icy
& m
gt.)
11
Prin
cess
Mah
a C
hakr
i Siri
ndho
rns
scho
lars
hip
11
ITE
C/B
IMS
TEC
11
Priv
ate
Fund
ing
(Sw
iss
Hea
lthca
re C
omm
ittee
)1
1U
SA
:Uni
vers
ity S
chol
arsh
ip1
1D
euts
cher
Aka
dem
isch
er A
usta
ush
Die
nst (
DA
AD
)1
1W
orld
Ban
k1
1R
AP
II1
1Jo
hn A
llwrig
ht F
ello
wsh
ip A
war
d1
1R
ED
11
Ope
n S
chol
arsh
ip (J
oint
Jap
an/W
orld
Ban
k G
radu
ate
Sch
olar
ship
Pro
gram
(JJ/
WB
GS
P)
11
tota
l5
257
370
100
448
21
490
| roy
al C
ivil
serv
ice
Com
mis
sion
82tabl
e 45
con
t.
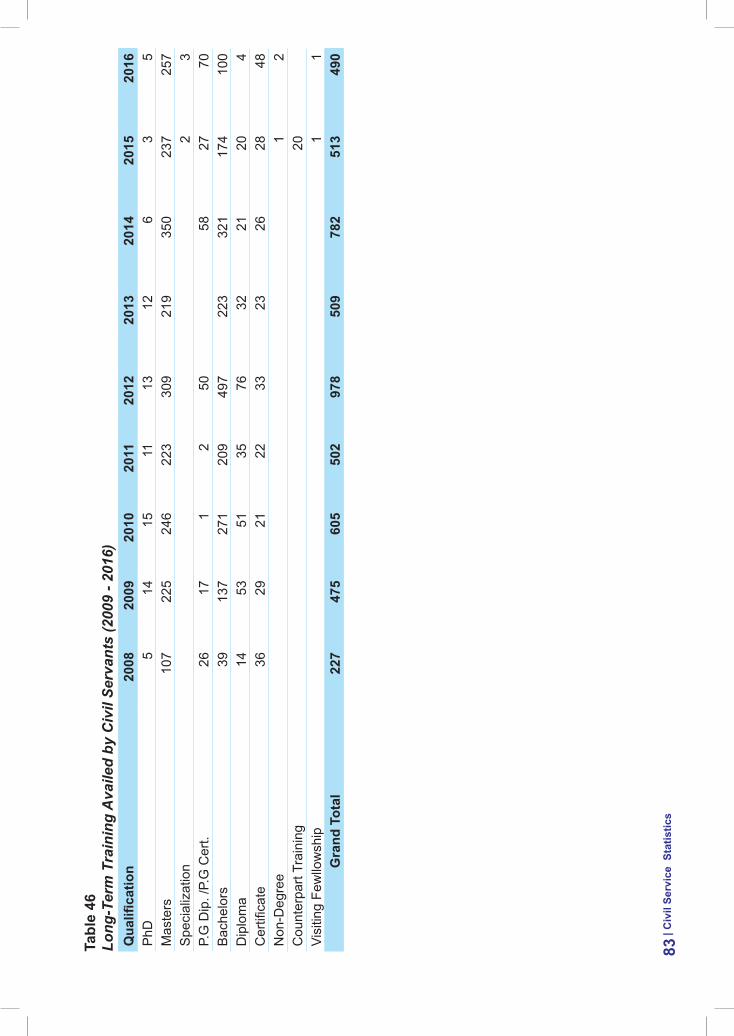
tabl
e 46
Long
-Ter
m T
rain
ing
Ava
iled
by C
ivil
Serv
ants
(200
9 - 2
016)
Qua
lifica
tion
2008
2009
2010
2011
2012
2013
2014
2015
2016
PhD
514
1511
1312
63
5M
aste
rs10
722
524
622
330
921
935
023
725
7S
peci
aliz
atio
n2
3P.
G D
ip. /
P.G
Cer
t.26
171
250
5827
70B
ache
lors
3913
727
120
949
722
332
117
410
0D
iplo
ma
1453
5135
7632
2120
4C
ertifi
cate
3629
2122
3323
2628
48N
on-D
egre
e1
2C
ount
erpa
rt Tr
aini
ng20
Visi
ting
Few
llow
ship
1
1G
rand
tot
al22
747
560
550
297
850
978
251
349
0
| Civ
il se
rvic
e s
tatis
tics
83
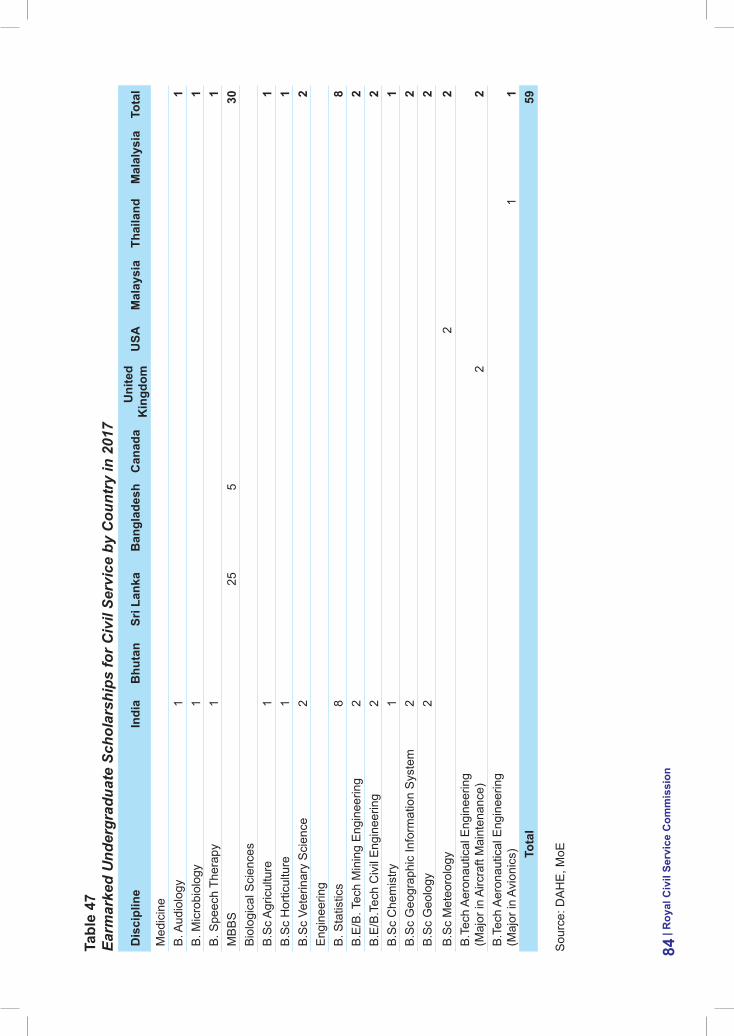
tabl
e 47
Earm
arke
d U
nder
grad
uate
Sch
olar
ship
s fo
r Civ
il Se
rvic
e by
Cou
ntry
in 2
017
dis
cipl
ine
indi
ab
huta
nsr
i lan
kab
angl
ades
hC
anad
aU
nite
d K
ingd
omU
sam
alay
sia
thai
land
mal
alys
iato
tal
Med
icin
eB
. Aud
iolo
gy1
1B
. Mic
robi
olog
y1
1B
. Spe
ech
Ther
apy
11
MB
BS
255
30B
iolo
gica
l Sci
ence
sB
.Sc
Agr
icul
ture
11
B.S
c H
ortic
ultu
re1
1B
.Sc
Vete
rinar
y S
cien
ce2
2E
ngin
eerin
gB
. Sta
tistic
s8
8B
.E/B
. Tec
h M
inin
g E
ngin
eerin
g2
2B
.E/B
.Tec
h C
ivil
Eng
inee
ring
22
B.S
c C
hem
istry
11
B.S
c G
eogr
aphi
c In
form
atio
n S
yste
m2
2B
.Sc
Geo
logy
2
2B
.Sc
Met
eoro
logy
22
B.T
ech
Aer
onau
tical
Eng
inee
ring
(Maj
or in
Airc
raft
Mai
nten
ance
)2
2B
.Tec
h A
eron
autic
al E
ngin
eerin
g (M
ajor
in A
vion
ics)
11
tota
l59
Sou
rce:
DA
HE
, MoE
| roy
al C
ivil
serv
ice
Com
mis
sion
84
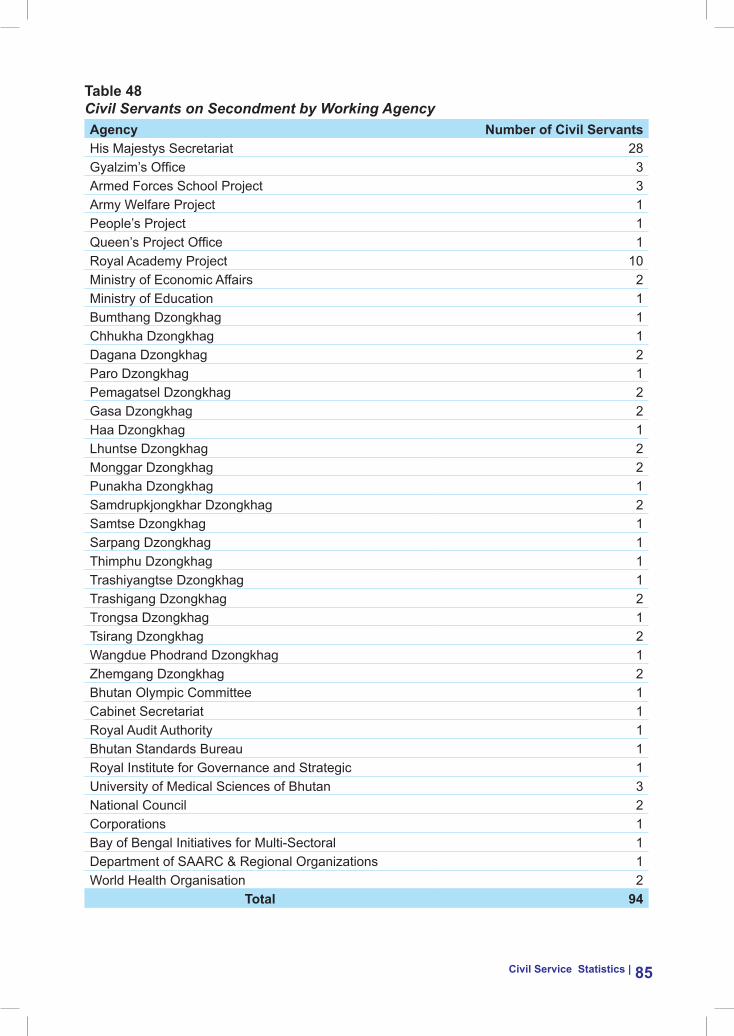
Civil service statistics | 85
table 48Civil Servants on Secondment by Working Agencyagency Number of Civil servantsHis Majestys Secretariat 28Gyalzim’s Office 3Armed Forces School Project 3Army Welfare Project 1People’s Project 1Queen’s Project Office 1Royal Academy Project 10Ministry of Economic Affairs 2Ministry of Education 1Bumthang Dzongkhag 1Chhukha Dzongkhag 1Dagana Dzongkhag 2Paro Dzongkhag 1Pemagatsel Dzongkhag 2Gasa Dzongkhag 2Haa Dzongkhag 1Lhuntse Dzongkhag 2Monggar Dzongkhag 2Punakha Dzongkhag 1Samdrupkjongkhar Dzongkhag 2Samtse Dzongkhag 1Sarpang Dzongkhag 1Thimphu Dzongkhag 1Trashiyangtse Dzongkhag 1Trashigang Dzongkhag 2Trongsa Dzongkhag 1Tsirang Dzongkhag 2Wangdue Phodrand Dzongkhag 1Zhemgang Dzongkhag 2Bhutan Olympic Committee 1Cabinet Secretariat 1Royal Audit Authority 1Bhutan Standards Bureau 1Royal Institute for Governance and Strategic 1University of Medical Sciences of Bhutan 3National Council 2Corporations 1Bay of Bengal Initiatives for Multi-Sectoral 1Department of SAARC & Regional Organizations 1World Health Organisation 2
total 94
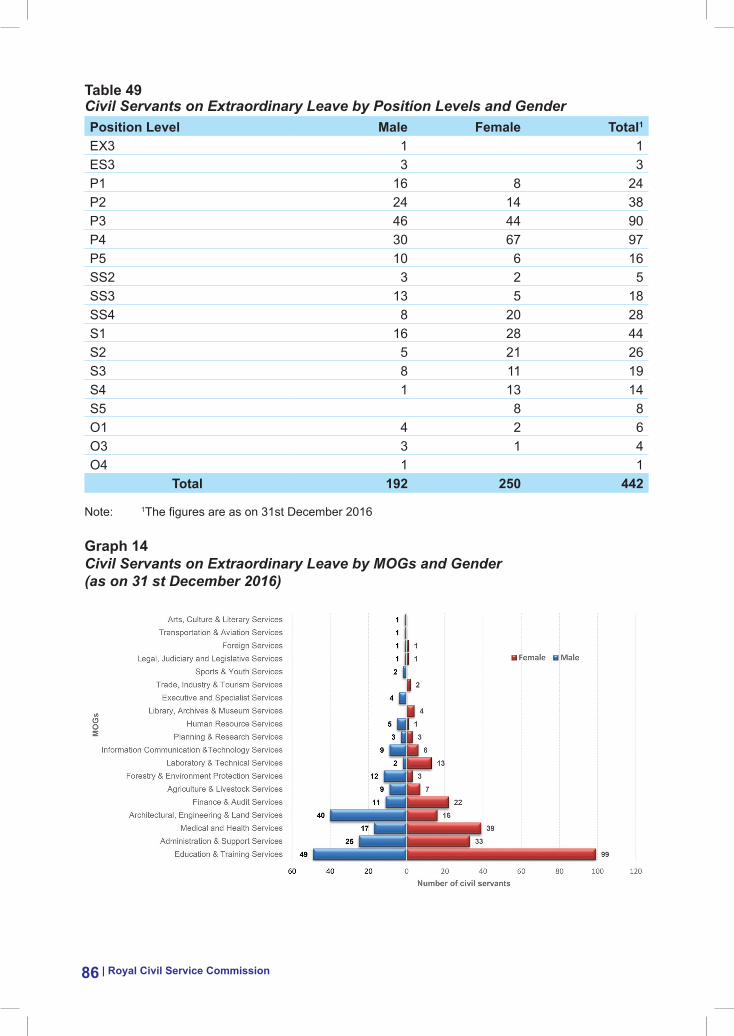
| Royal Civil Service Commission86
table 49Civil Servants on Extraordinary Leave by Position Levels and GenderPosition level male Female total1
EX3 1 1ES3 3 3P1 16 8 24P2 24 14 38P3 46 44 90P4 30 67 97P5 10 6 16SS2 3 2 5SS3 13 5 18SS4 8 20 28S1 16 28 44S2 5 21 26S3 8 11 19S4 1 13 14S5 8 8O1 4 2 6O3 3 1 4O4 1 1
total 192 250 442
Note: 1The figures are as on 31st December 2016
Graph 14Civil Servants on Extraordinary Leave by MOGs and Gender (as on 31 st December 2016)
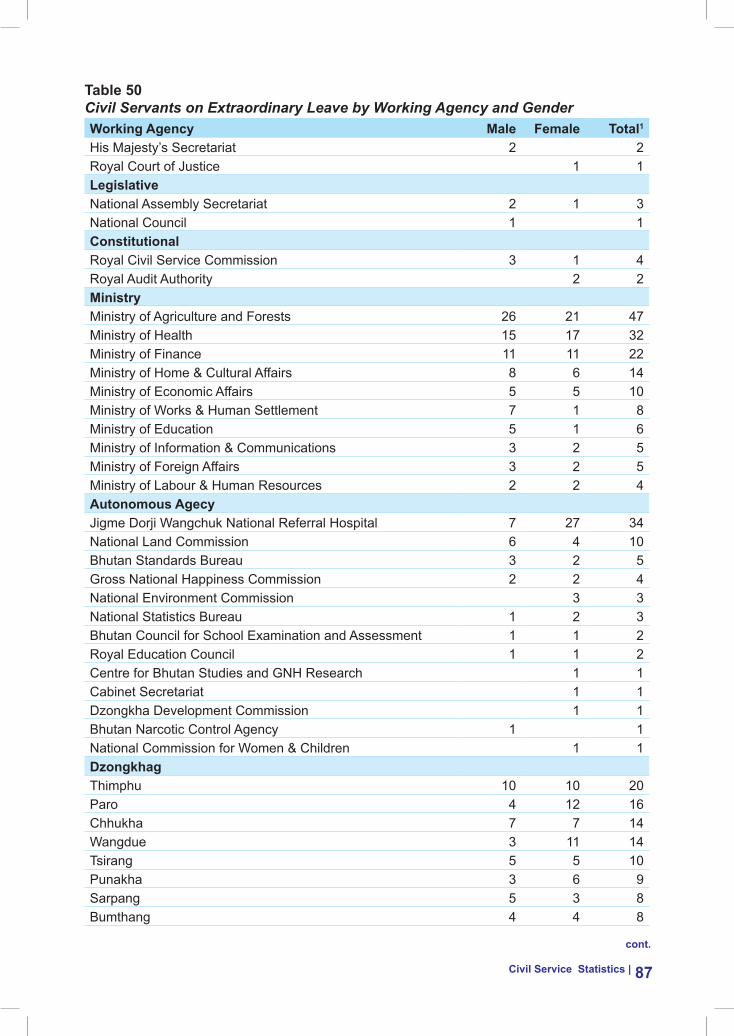
Civil service statistics | 87
table 50Civil Servants on Extraordinary Leave by Working Agency and GenderWorking agency male Female total1
His Majesty’s Secretariat 2 2Royal Court of Justice 1 1legislativeNational Assembly Secretariat 2 1 3National Council 1 1ConstitutionalRoyal Civil Service Commission 3 1 4Royal Audit Authority 2 2ministryMinistry of Agriculture and Forests 26 21 47Ministry of Health 15 17 32Ministry of Finance 11 11 22Ministry of Home & Cultural Affairs 8 6 14Ministry of Economic Affairs 5 5 10Ministry of Works & Human Settlement 7 1 8Ministry of Education 5 1 6Ministry of Information & Communications 3 2 5Ministry of Foreign Affairs 3 2 5Ministry of Labour & Human Resources 2 2 4autonomous agecyJigme Dorji Wangchuk National Referral Hospital 7 27 34National Land Commission 6 4 10Bhutan Standards Bureau 3 2 5Gross National Happiness Commission 2 2 4National Environment Commission 3 3National Statistics Bureau 1 2 3Bhutan Council for School Examination and Assessment 1 1 2Royal Education Council 1 1 2Centre for Bhutan Studies and GNH Research 1 1Cabinet Secretariat 1 1Dzongkha Development Commission 1 1Bhutan Narcotic Control Agency 1 1National Commission for Women & Children 1 1dzongkhagThimphu 10 10 20Paro 4 12 16Chhukha 7 7 14Wangdue 3 11 14Tsirang 5 5 10Punakha 3 6 9Sarpang 5 3 8Bumthang 4 4 8
cont.
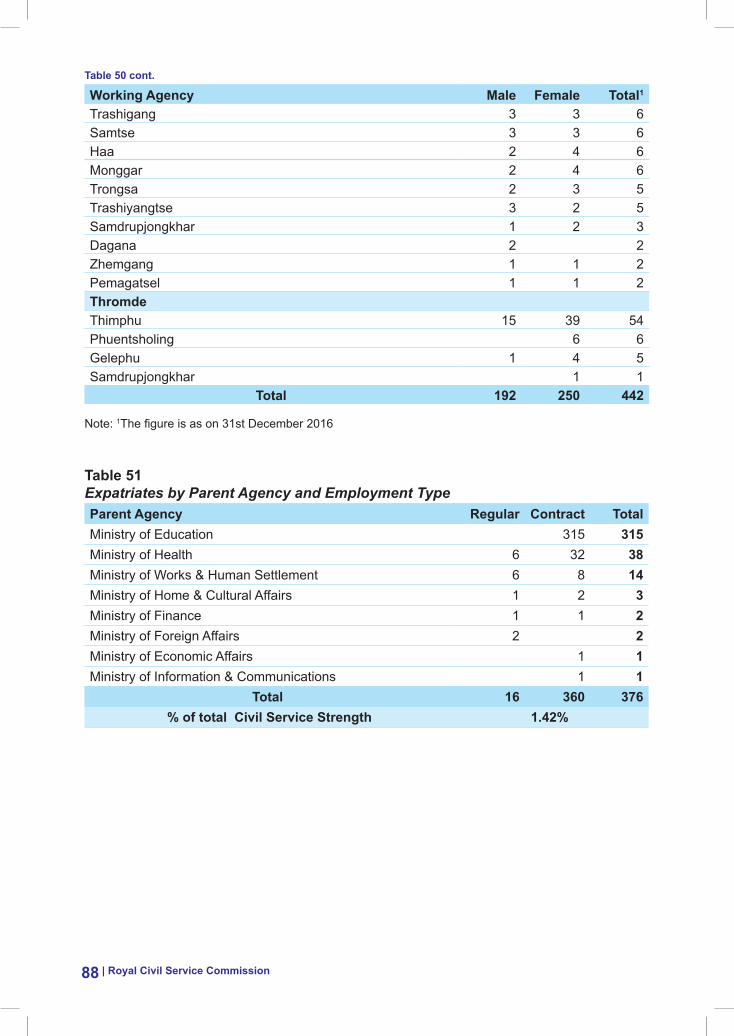
| Royal Civil Service Commission88
Working agency male Female total1
Trashigang 3 3 6Samtse 3 3 6Haa 2 4 6Monggar 2 4 6Trongsa 2 3 5Trashiyangtse 3 2 5Samdrupjongkhar 1 2 3Dagana 2 2Zhemgang 1 1 2Pemagatsel 1 1 2thromdeThimphu 15 39 54Phuentsholing 6 6Gelephu 1 4 5Samdrupjongkhar 1 1
total 192 250 442
Note: 1The figure is as on 31st December 2016
table 51Expatriates by Parent Agency and Employment TypeParent agency regular Contract totalMinistry of Education 315 315Ministry of Health 6 32 38Ministry of Works & Human Settlement 6 8 14Ministry of Home & Cultural Affairs 1 2 3Ministry of Finance 1 1 2Ministry of Foreign Affairs 2 2Ministry of Economic Affairs 1 1Ministry of Information & Communications 1 1
total 16 360 376 % of total Civil service strength 1.42%
table 50 cont.
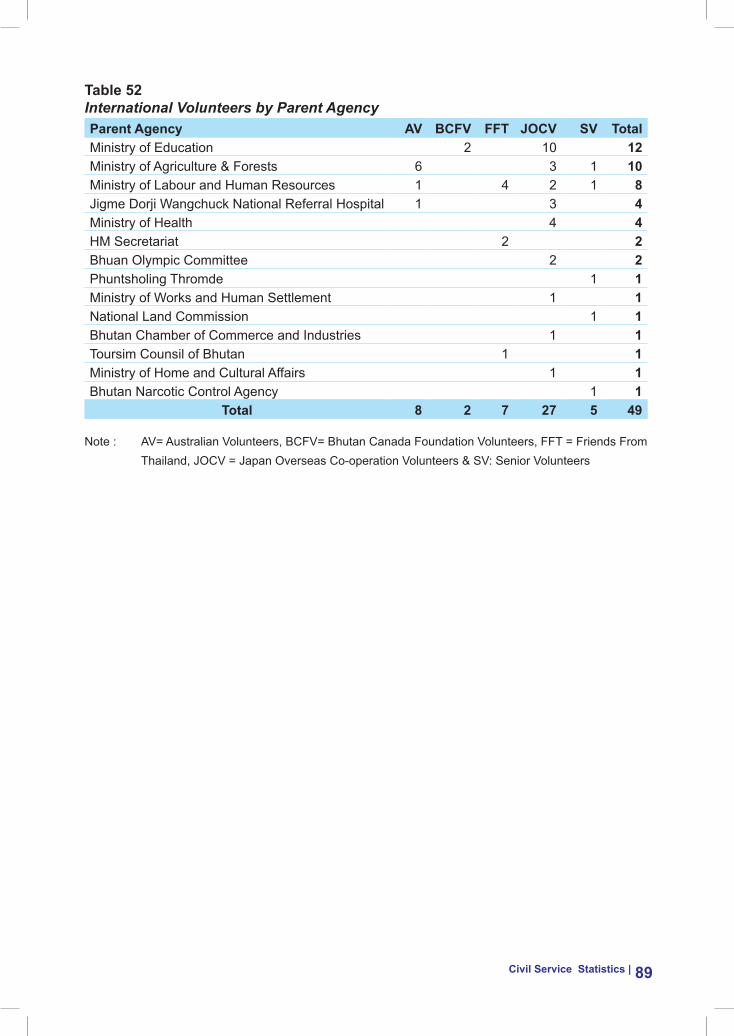
Civil service statistics | 89
table 52International Volunteers by Parent AgencyParent agency av bCFv FFt JOCv sv totalMinistry of Education 2 10 12Ministry of Agriculture & Forests 6 3 1 10Ministry of Labour and Human Resources 1 4 2 1 8Jigme Dorji Wangchuck National Referral Hospital 1 3 4Ministry of Health 4 4HM Secretariat 2 2Bhuan Olympic Committee 2 2Phuntsholing Thromde 1 1Ministry of Works and Human Settlement 1 1National Land Commission 1 1Bhutan Chamber of Commerce and Industries 1 1Toursim Counsil of Bhutan 1 1Ministry of Home and Cultural Affairs 1 1Bhutan Narcotic Control Agency 1 1
total 8 2 7 27 5 49
Note : AV= Australian Volunteers, BCFV= Bhutan Canada Foundation Volunteers, FFT = Friends From Thailand, JOCV = Japan Overseas Co-operation Volunteers & SV: Senior Volunteers
| Royal Civil Service Commission90
Part iii – spotlight on super structure
introduction
Super Structure as part of the Bhutan Civil Service System reform was initiated with the objective to uphold the principle of placing the Right Person to the Right Job and to retain professionals by allowing movement of civil servants only to the relevant positions. Super structure is made up of five overarching groups: Executive & Specialist Services; Administration Services; Finance Services; Education Services; and Technical Services. The main benefit of this change is to uphold the integrity of the various entry systems into the five groups that make up the super structure. This will address a major weakness in the past approach that allowed people to change MOG, irrespective of their original entry, after the completion 10 years of service. Therefore, super structure was approved by the 72nd Commission Meeting with effective from 2/8/2016 to uphold the above objective.
Accordingly, all civil servants are assigned to one of the five super structure groups which are reflected in individual curriculum vitae in Civil Service Information System (CSIS). The Major Occupational Groups, Subgroups & positions for the five super structure groups are identified in Schedule II of Super Structure.
The super structure framework now serves as a guide for Human Resource Officer to allow movement of civil servants within their professional areas as well as ensure specialisation in their profession. This framework is used during open competition for purpose of short listing & selection, change in position title and for transfer of civil servants.
The statistics of civil servants by super structure group, position category, position level, MOG, Agencies, Parent Agency, Age and gender are given below which provides information for the Agency to be used when positions are opened up. With the super structure, the Agency will now be able to determine the number of eligible civil servants for the announced position since movement is allowed only within the individual super structure group.
A special feature of Super Structure is the position of “Officer on Special Assignment”. This is a time bound assignment within the civil service which allows individual civil servants to move within the super structure group while maintaining the original profession. This is the flexibility rendered for all civil servants to experience diversity in their long civil service career while remaining in individual super structure group.
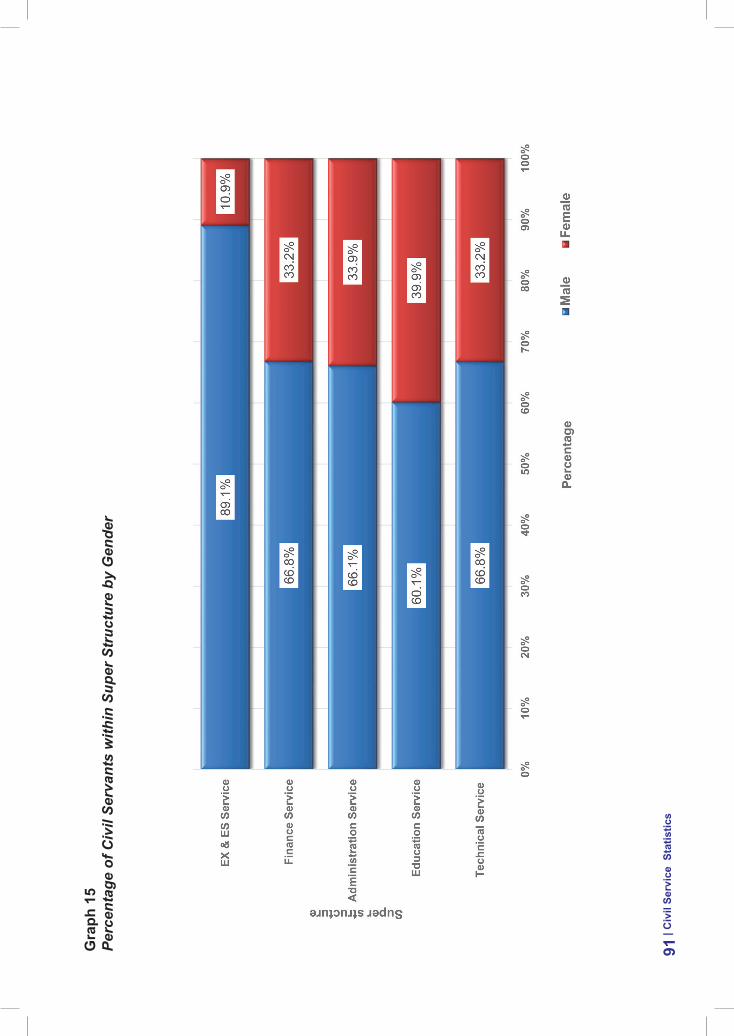
Gra
ph 1
5Pe
rcen
tage
of C
ivil
Serv
ants
with
in S
uper
Str
uctu
re b
y G
ende
r
| Civ
il se
rvic
e s
tatis
tics
91
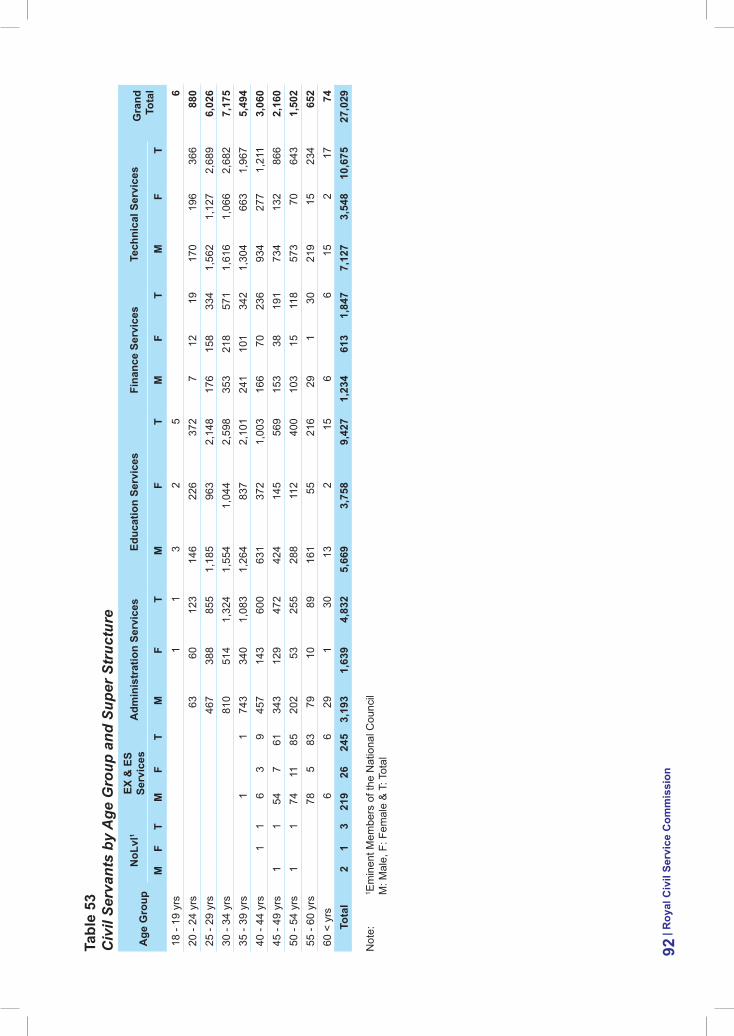
tabl
e 53
Civ
il Se
rvan
ts b
y A
ge G
roup
and
Sup
er S
truc
ture
age
Gro
upN
olvl
1eX
& e
s se
rvic
esa
dmin
istr
atio
n se
rvic
esed
ucat
ion
serv
ices
Fina
nce
serv
ices
tech
nica
l ser
vice
sG
rand
to
tal
mF
tm
Ft
mF
tm
Ft
mF
tm
Ft
18 -
19 y
rs1
1 3
2 5
6 20
- 24
yrs
63
60
123
146
226
372
7 12
19
17
0 19
6 36
6 88
0 25
- 29
yrs
467
388
855
1,18
5 96
3 2,
148
176
158
334
1,56
2 1,
127
2,68
9 6,
026
30 -
34 y
rs81
0 51
4 1,
324
1,55
4 1,
044
2,59
8 35
3 21
8 57
1 1,
616
1,06
6 2,
682
7,17
5 35
- 39
yrs
1 1
743
340
1,08
3 1,
264
837
2,10
1 24
1 10
1 34
2 1,
304
663
1,96
7 5,
494
40 -
44 y
rs1
1 6
3 9
457
143
600
631
372
1,00
3 16
6 70
23
6 93
4 27
7 1,
211
3,06
0 45
- 49
yrs
1 1
54
7 61
34
3 12
9 47
2 42
4 14
5 56
9 15
3 38
19
1 73
4 13
2 86
6 2,
160
50 -
54 y
rs1
1 74
11
85
20
2 53
25
5 28
8 11
2 40
0 10
3 15
11
8 57
3 70
64
3 1,
502
55 -
60 y
rs78
5
83
79
10
89
161
55
216
29
1 30
21
9 15
23
4 65
2 60
< y
rs6
6 29
1
30
13
2 15
6
6 15
2
17
74
tota
l2
1 3
219
26
245
3,19
3 1,
639
4,83
2 5,
669
3,75
8 9,
427
1,23
4 61
3 1,
847
7,12
7 3,
548
10,6
75
27,0
29
Not
e:
1 Em
inen
t Mem
bers
of t
he N
atio
nal C
ounc
il
M
: Mal
e, F
: Fem
ale
& T
: Tot
al
| roy
al C
ivil
serv
ice
Com
mis
sion
92
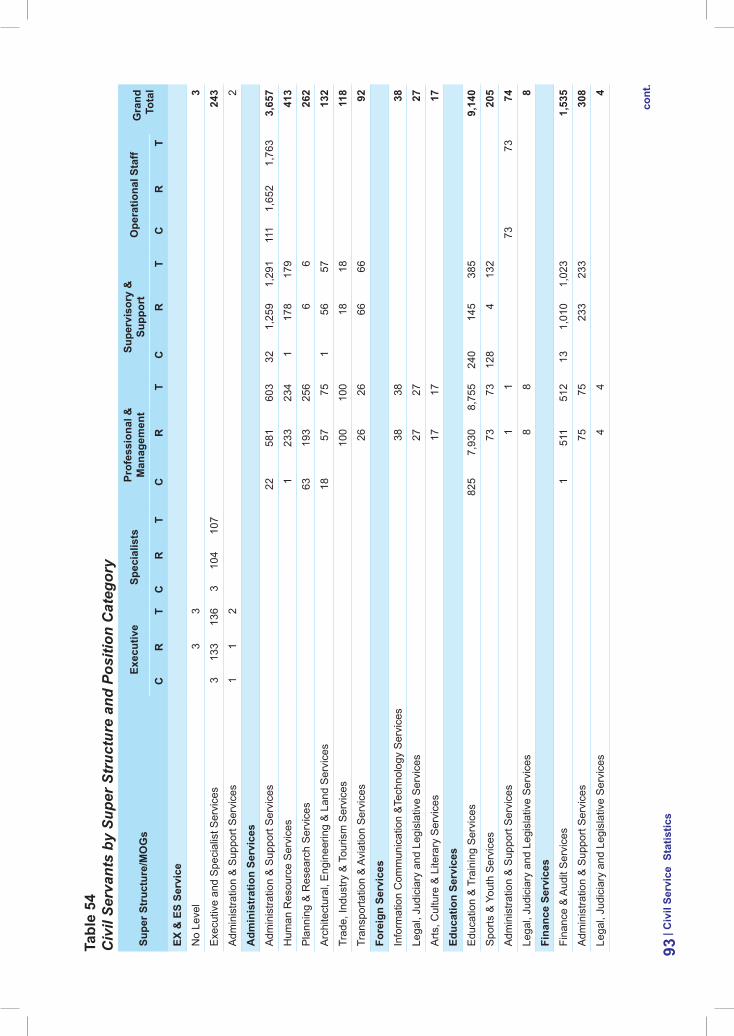
tabl
e 54
Civ
il Se
rvan
ts b
y Su
per S
truc
ture
and
Pos
ition
Cat
egor
y
supe
r str
uctu
re/m
OG
sex
ecut
ive
spec
ialis
tsPr
ofes
sion
al &
m
anag
emen
tsu
perv
isor
y &
su
ppor
tO
pera
tiona
l sta
ffG
rand
to
tal
Cr
tC
rt
Cr
tC
rt
Cr
teX
& e
s se
rvic
eN
o Le
vel
3 3
3 E
xecu
tive
and
Spe
cial
ist S
ervi
ces
3 13
3 13
6 3
104
107
243
Adm
inis
tratio
n &
Sup
port
Ser
vice
s 1
1 2
2
adm
inis
trat
ion
serv
ices
Adm
inis
tratio
n &
Sup
port
Ser
vice
s 22
58
1 60
3 32
1,
259
1,29
1 11
1 1,
652
1,76
3 3,
657
Hum
an R
esou
rce
Ser
vice
s 1
233
234
1 17
8 17
9 41
3 P
lann
ing
& R
esea
rch
Ser
vice
s 63
19
3 25
6 6
6 26
2 A
rchi
tect
ural
, Eng
inee
ring
& L
and
Ser
vice
s 18
57
75
1
56
57
132
Trad
e, In
dust
ry &
Tou
rism
Ser
vice
s 10
0 10
0 18
18
11
8 Tr
ansp
orta
tion
& A
viat
ion
Ser
vice
s 26
26
66
66
92
Fo
reig
n se
rvic
es
Info
rmat
ion
Com
mun
icat
ion
&Te
chno
logy
Ser
vice
s 38
38
38
Le
gal,
Judi
ciar
y an
d Le
gisl
ativ
e S
ervi
ces
27
27
27
Arts
, Cul
ture
& L
itera
ry S
ervi
ces
17
17
17
educ
atio
n se
rvic
es
Edu
catio
n &
Tra
inin
g S
ervi
ces
825
7,93
0 8,
755
240
145
385
9,14
0 S
ports
& Y
outh
Ser
vice
s 73
73
12
8 4
132
205
Adm
inis
tratio
n &
Sup
port
Ser
vice
s 1
1 73
73
74
Le
gal,
Judi
ciar
y an
d Le
gisl
ativ
e S
ervi
ces
8 8
8 Fi
nanc
e se
rvic
esFi
nanc
e &
Aud
it S
ervi
ces
1 51
1 51
2 13
1,
010
1,02
3 1,
535
Adm
inis
tratio
n &
Sup
port
Ser
vice
s 75
75
23
3 23
3 30
8 Le
gal,
Judi
ciar
y an
d Le
gisl
ativ
e S
ervi
ces
4 4
4
| Civ
il se
rvic
e s
tatis
tics
93co
nt.
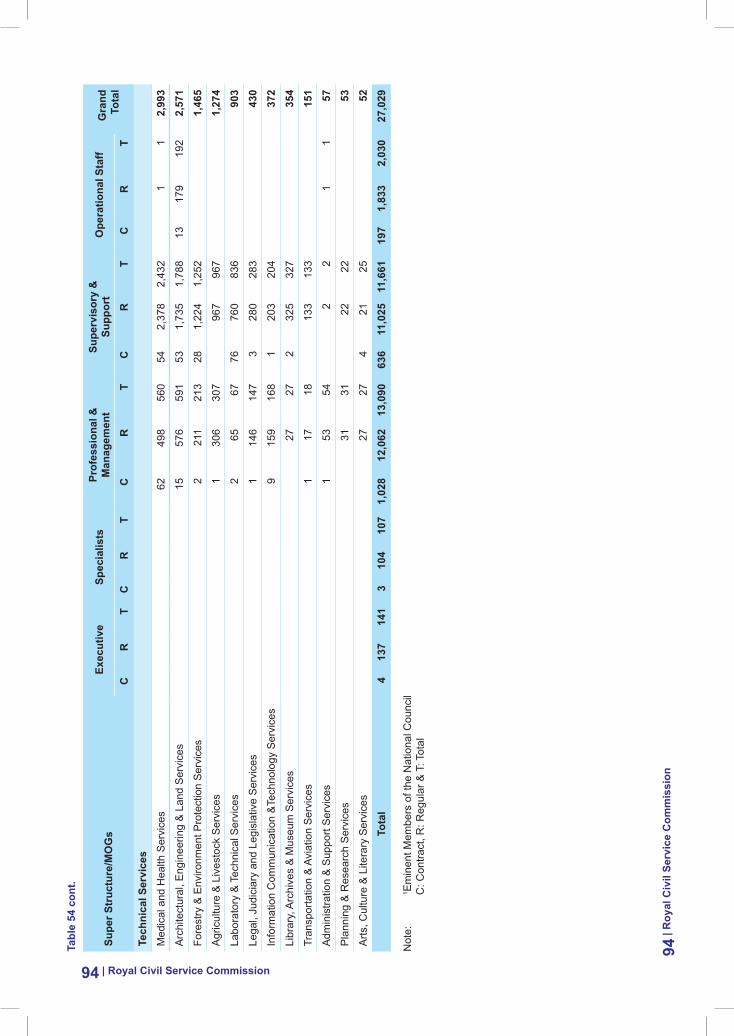
| Royal Civil Service Commission94
supe
r str
uctu
re/m
OG
sex
ecut
ive
spec
ialis
tsPr
ofes
sion
al &
m
anag
emen
tsu
perv
isor
y &
su
ppor
tO
pera
tiona
l sta
ffG
rand
to
tal
Cr
tC
rt
Cr
tC
rt
Cr
tte
chni
cal s
ervi
ces
Med
ical
and
Hea
lth S
ervi
ces
62
498
560
54
2,37
8 2,
432
1 1
2,99
3 A
rchi
tect
ural
, Eng
inee
ring
& L
and
Ser
vice
s 15
57
6 59
1 53
1,
735
1,78
8 13
17
9 19
2 2,
571
Fore
stry
& E
nviro
nmen
t Pro
tect
ion
Ser
vice
s 2
211
213
28
1,22
4 1,
252
1,46
5 A
gric
ultu
re &
Liv
esto
ck S
ervi
ces
1 30
6 30
7 96
7 96
7 1,
274
Labo
rato
ry &
Tec
hnic
al S
ervi
ces
2 65
67
76
76
0 83
6 90
3 Le
gal,
Judi
ciar
y an
d Le
gisl
ativ
e S
ervi
ces
1 14
6 14
7 3
280
283
430
Info
rmat
ion
Com
mun
icat
ion
&Te
chno
logy
Ser
vice
s 9
159
168
1 20
3 20
4 37
2 Li
brar
y, A
rchi
ves
& M
useu
m S
ervi
ces
27
27
2 32
5 32
7 35
4 Tr
ansp
orta
tion
& A
viat
ion
Ser
vice
s 1
17
18
133
133
151
Adm
inis
tratio
n &
Sup
port
Ser
vice
s 1
53
54
2 2
1 1
57
Pla
nnin
g &
Res
earc
h S
ervi
ces
31
31
22
22
53
Arts
, Cul
ture
& L
itera
ry S
ervi
ces
27
27
4 21
25
52
to
tal
4 13
7 14
1 3
104
107
1,02
8 12
,062
13
,090
63
6 11
,025
11
,661
19
7 1,
833
2,03
0 27
,029
N
ote:
1 E
min
ent M
embe
rs o
f the
Nat
iona
l Cou
ncil
C
: Con
tract
, R: R
egul
ar &
T: T
otal
| roy
al C
ivil
serv
ice
Com
mis
sion
94tabl
e 54
con
t.
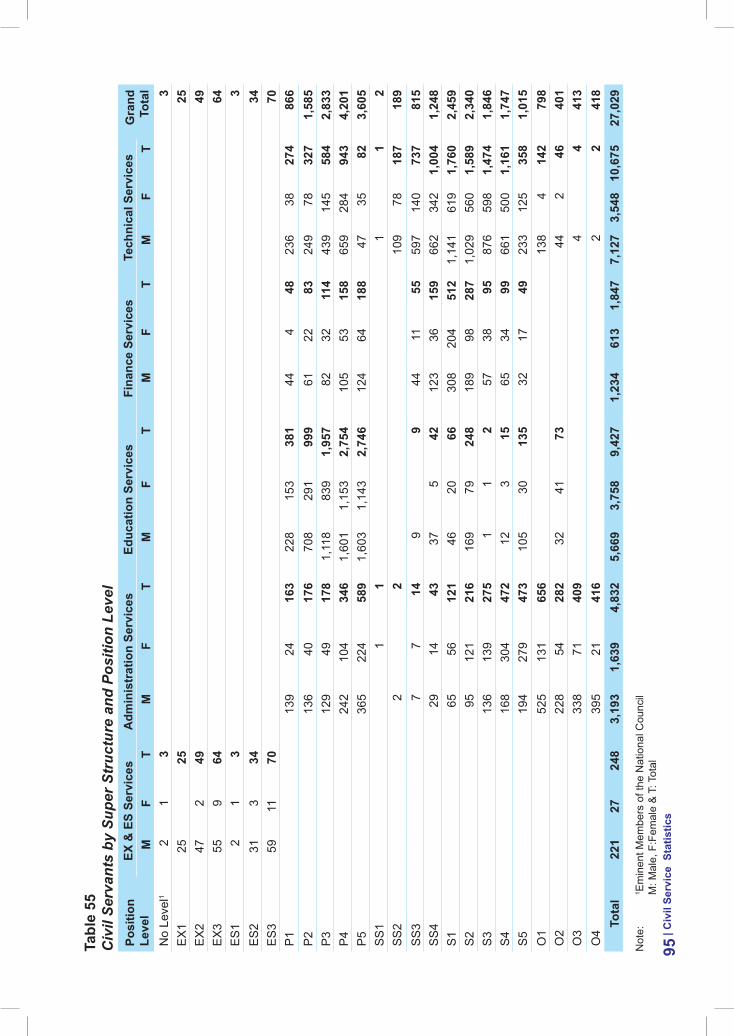
tabl
e 55
Civ
il Se
rvan
ts b
y Su
per S
truc
ture
and
Pos
ition
Lev
elPo
sitio
n le
vel
eX &
es
serv
ices
adm
inis
trat
ion
serv
ices
educ
atio
n se
rvic
esFi
nanc
e se
rvic
este
chni
cal s
ervi
ces
Gra
nd
tota
lm
Ft
mF
tm
Ft
mF
tm
Ft
No
Leve
l12
1 3
3 E
X1
25
25
25
EX
247
2
49
49
EX
355
9
64
64
ES
12
1 3
3 E
S2
31
3 34
34
E
S3
59
11
70
70
P1
139
24
163
228
153
381
44
4 48
23
6 38
27
4 86
6 P
213
6 40
17
6 70
8 29
1 99
9 61
22
83
24
9 78
32
7 1,
585
P3
129
49
178
1,11
8 83
9 1,
957
82
32
114
439
145
584
2,83
3 P
424
2 10
4 34
6 1,
601
1,15
3 2,
754
105
53
158
659
284
943
4,20
1 P
536
5 22
4 58
9 1,
603
1,14
3 2,
746
124
64
188
47
35
82
3,60
5 S
S1
1 1
1 1
2 S
S2
2 2
109
78
187
189
SS
37
7 14
9
9 44
11
55
59
7 14
0 73
7 81
5 S
S4
29
14
43
37
5 42
12
3 36
15
9 66
2 34
2 1,
004
1,24
8 S
165
56
12
1 46
20
66
30
8 20
4 51
2 1,
141
619
1,76
0 2,
459
S2
95
121
216
169
79
248
189
98
287
1,02
9 56
0 1,
589
2,34
0 S
313
6 13
9 27
5 1
1 2
57
38
95
876
598
1,47
4 1,
846
S4
168
304
472
12
3 15
65
34
99
66
1 50
0 1,
161
1,74
7 S
519
4 27
9 47
3 10
5 30
13
5 32
17
49
23
3 12
5 35
8 1,
015
O1
525
131
656
138
4 14
2 79
8 O
222
8 54
28
2 32
41
73
44
2
46
401
O3
338
71
409
4 4
413
O4
395
21
416
2 2
418
tota
l22
1 27
24
8 3,
193
1,63
9 4,
832
5,66
9 3,
758
9,42
7 1,
234
613
1,84
7 7,
127
3,54
8 10
,675
27
,029
N
ote:
1 E
min
ent M
embe
rs o
f the
Nat
iona
l Cou
ncil
M: M
ale,
F:F
emal
e &
T: T
otal
| Civ
il se
rvic
e s
tatis
tics
95
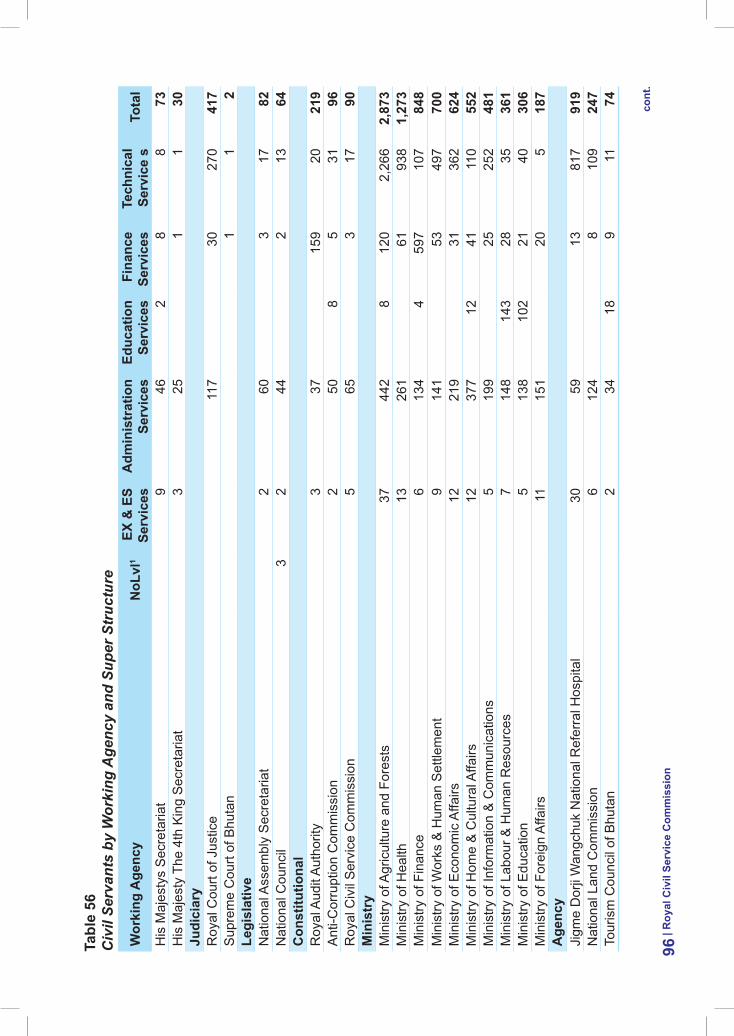
tabl
e 56
Civ
il Se
rvan
ts b
y W
orki
ng A
genc
y an
d Su
per S
truc
ture
Wor
king
age
ncy
Nol
vl1
eX &
es
serv
ices
adm
inis
trat
ion
serv
ices
educ
atio
n se
rvic
esFi
nanc
e se
rvic
este
chni
cal
serv
ice
sto
tal
His
Maj
esty
s S
ecre
taria
t9
46
2 8
8 73
H
is M
ajes
ty T
he 4
th K
ing
Sec
reta
riat
3 25
1
1 30
Ju
dici
ary
Roy
al C
ourt
of J
ustic
e11
7 30
27
0 41
7 S
upre
me
Cou
rt of
Bhu
tan
1 1
2 le
gisl
ativ
eN
atio
nal A
ssem
bly
Sec
reta
riat
2 60
3
17
82
Nat
iona
l Cou
ncil
3 2
44
2 13
64
C
onst
itutio
nal
Roy
al A
udit
Aut
horit
y3
37
159
20
219
Ant
i-Cor
rupt
ion
Com
mis
sion
2 50
8
5 31
96
R
oyal
Civ
il S
ervi
ce C
omm
issi
on5
65
3 17
90
m
inis
try
Min
istry
of A
gric
ultu
re a
nd F
ores
ts37
44
2 8
120
2,26
6 2,
873
Min
istry
of H
ealth
13
261
61
938
1,27
3 M
inis
try o
f Fin
ance
6 13
4 4
597
107
848
Min
istry
of W
orks
& H
uman
Set
tlem
ent
9 14
1 53
49
7 70
0 M
inis
try o
f Eco
nom
ic A
ffairs
12
219
31
362
624
Min
istry
of H
ome
& C
ultu
ral A
ffairs
12
377
12
41
110
552
Min
istry
of I
nfor
mat
ion
& C
omm
unic
atio
ns5
199
25
252
481
Min
istry
of L
abou
r & H
uman
Res
ourc
es7
148
143
28
35
361
Min
istry
of E
duca
tion
5 13
8 10
2 21
40
30
6 M
inis
try o
f For
eign
Affa
irs11
15
1 20
5
187
age
ncy
Jigm
e D
orji
Wan
gchu
k N
atio
nal R
efer
ral H
ospi
tal
30
59
13
817
919
Nat
iona
l Lan
d C
omm
issi
on6
124
8 10
9 24
7 To
uris
m C
ounc
il of
Bhu
tan
2 34
18
9
11
74
| roy
al C
ivil
serv
ice
Com
mis
sion
96co
nt.
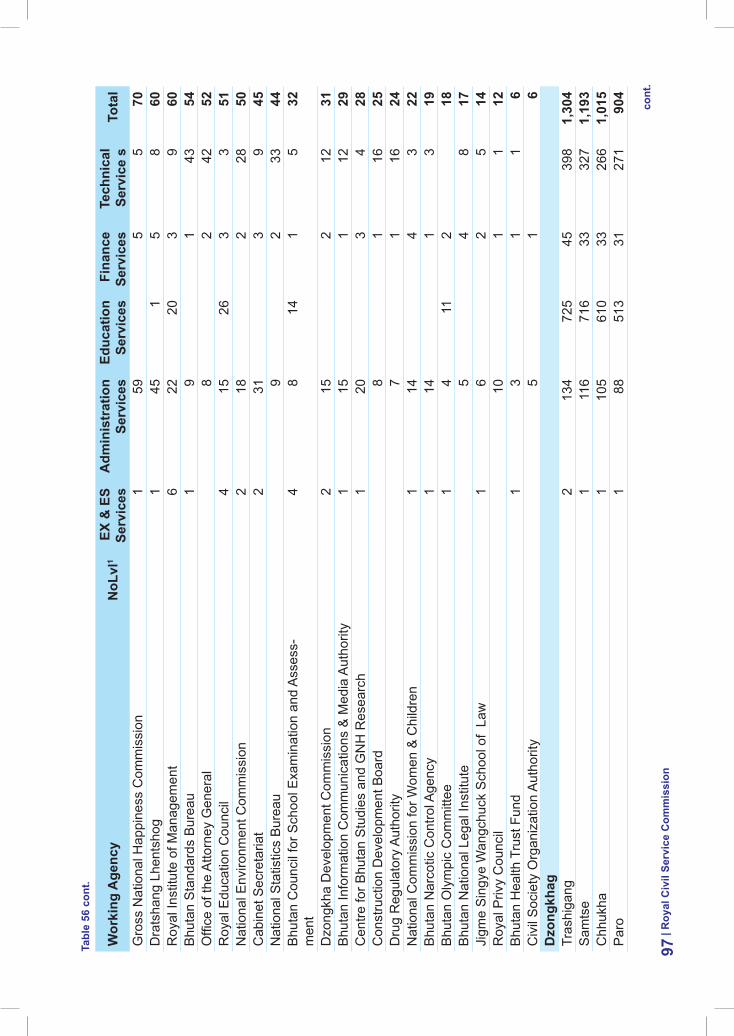
Wor
king
age
ncy
Nol
vl1
eX &
es
serv
ices
adm
inis
trat
ion
serv
ices
educ
atio
n se
rvic
esFi
nanc
e se
rvic
este
chni
cal
serv
ice
sto
tal
Gro
ss N
atio
nal H
appi
ness
Com
mis
sion
1 59
5
5 70
D
rats
hang
Lhe
ntsh
og1
45
1 5
8 60
R
oyal
Inst
itute
of M
anag
emen
t6
22
20
3 9
60
Bhu
tan
Sta
ndar
ds B
urea
u1
9 1
43
54
Offi
ce o
f the
Atto
rney
Gen
eral
8 2
42
52
Roy
al E
duca
tion
Cou
ncil
4 15
26
3
3 51
N
atio
nal E
nviro
nmen
t Com
mis
sion
2 18
2
28
50
Cab
inet
Sec
reta
riat
2 31
3
9 45
N
atio
nal S
tatis
tics
Bur
eau
9 2
33
44
Bhu
tan
Cou
ncil
for S
choo
l Exa
min
atio
n an
d A
sses
s-m
ent
4 8
14
1 5
32
Dzo
ngkh
a D
evel
opm
ent C
omm
issi
on2
15
2 12
31
B
huta
n In
form
atio
n C
omm
unic
atio
ns &
Med
ia A
utho
rity
1 15
1
12
29
Cen
tre fo
r Bhu
tan
Stu
dies
and
GN
H R
esea
rch
1 20
3
4 28
C
onst
ruct
ion
Dev
elop
men
t Boa
rd8
1 16
25
D
rug
Reg
ulat
ory
Aut
horit
y7
1 16
24
N
atio
nal C
omm
issi
on fo
r Wom
en &
Chi
ldre
n1
14
4 3
22
Bhu
tan
Nar
cotic
Con
trol A
genc
y1
14
1 3
19
Bhu
tan
Oly
mpi
c C
omm
ittee
1 4
11
2 18
B
huta
n N
atio
nal L
egal
Inst
itute
5 4
8 17
Ji
gme
Sin
gye
Wan
gchu
ck S
choo
l of
Law
1
6 2
5 14
R
oyal
Priv
y C
ounc
il10
1
1 12
B
huta
n H
ealth
Tru
st F
und
1 3
1 1
6 C
ivil
Soc
iety
Org
aniz
atio
n A
utho
rity
5 1
6 d
zong
khag
Tras
higa
ng
2 13
4 72
5 45
39
8 1,
304
Sam
tse
1 11
6 71
6 33
32
7 1,
193
Chh
ukha
1
105
610
33
266
1,01
5 P
aro
1 88
51
3 31
27
1 90
4
| roy
al C
ivil
serv
ice
Com
mis
sion
97co
nt.
tabl
e 56
con
t.
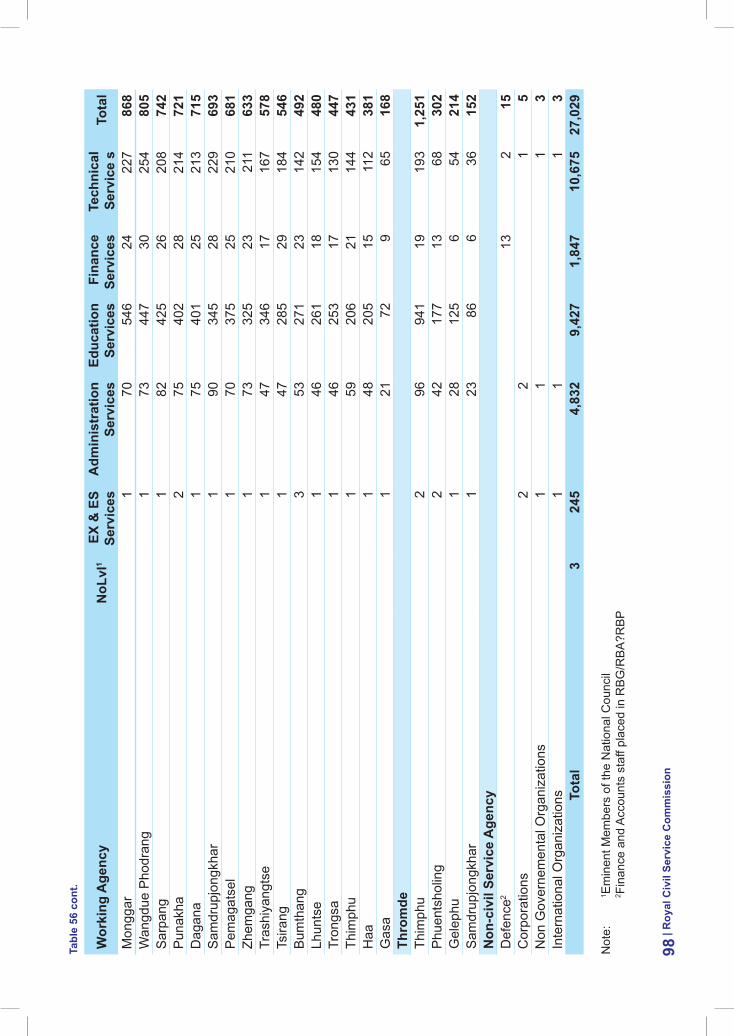
Wor
king
age
ncy
Nol
vl1
eX &
es
serv
ices
adm
inis
trat
ion
serv
ices
educ
atio
n se
rvic
esFi
nanc
e se
rvic
este
chni
cal
serv
ice
sto
tal
Mon
ggar
1
70
546
24
227
868
Wan
gdue
Pho
dran
g1
73
447
30
254
805
Sar
pang
1
82
425
26
208
742
Pun
akha
2
75
402
28
214
721
Dag
ana
1 75
40
1 25
21
3 71
5 S
amdr
upjo
ngkh
ar
1 90
34
5 28
22
9 69
3 P
emag
atse
l 1
70
375
25
210
681
Zhem
gang
1
73
325
23
211
633
Tras
hiya
ngts
e 1
47
346
17
167
578
Tsira
ng
1 47
28
5 29
18
4 54
6 B
umth
ang
3 53
27
1 23
14
2 49
2 Lh
unts
e 1
46
261
18
154
480
Tron
gsa
1 46
25
3 17
13
0 44
7 Th
imph
u 1
59
206
21
144
431
Haa
1
48
205
15
112
381
Gas
a 1
21
72
9 65
16
8 th
rom
de
Thim
phu
2 96
94
1 19
19
3 1,
251
Phu
ents
holin
g 2
42
177
13
68
302
Gel
ephu
1
28
125
6 54
21
4 S
amdr
upjo
ngkh
ar
1 23
86
6
36
152
Non
-civ
il se
rvic
e a
genc
yD
efen
ce2
13
2 15
C
orpo
ratio
ns2
2 1
5 N
on G
over
nem
enta
l Org
aniz
atio
ns1
1 1
3 In
tern
atio
nal O
rgan
izat
ions
1 1
1 3
tota
l3
245
4,83
2 9,
427
1,84
7 10
,675
27
,029
Not
e:
1 Em
inen
t Mem
bers
of t
he N
atio
nal C
ounc
il
2 Fin
ance
and
Acc
ount
s st
aff p
lace
d in
RB
G/R
BA
?RB
P
| roy
al C
ivil
serv
ice
Com
mis
sion
98tabl
e 56
con
t.
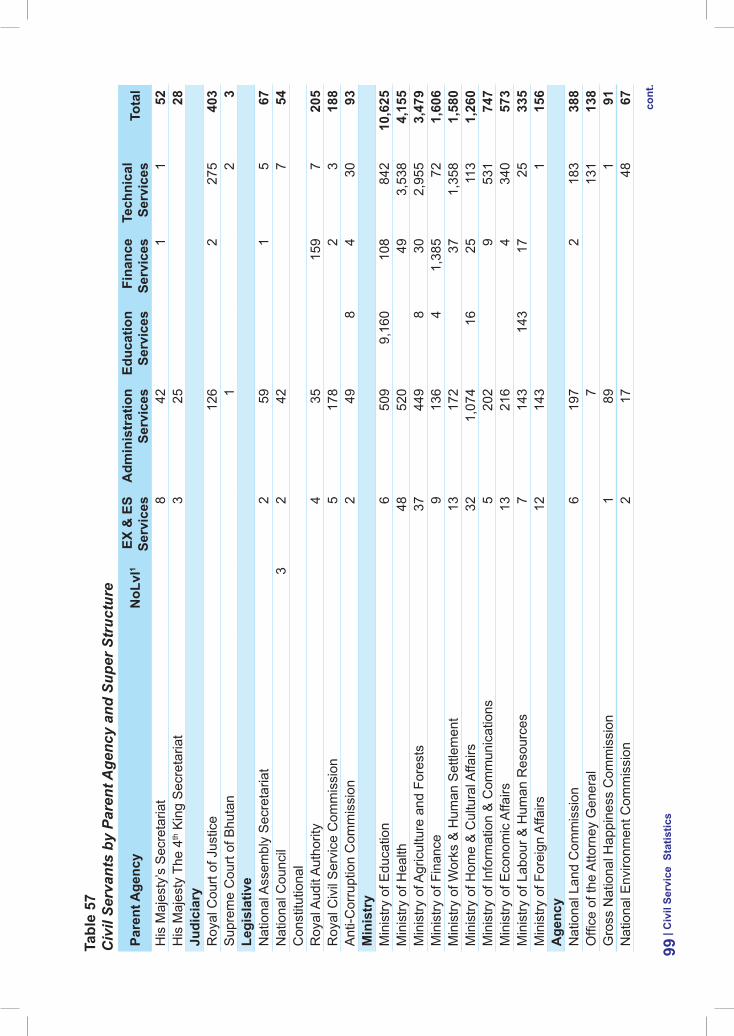
tabl
e 57
Civ
il Se
rvan
ts b
y Pa
rent
Age
ncy
and
Supe
r Str
uctu
re
Pare
nt a
genc
yN
olvl
1eX
& e
s se
rvic
esa
dmin
istr
atio
n se
rvic
esed
ucat
ion
serv
ices
Fina
nce
serv
ices
tech
nica
l se
rvic
esto
tal
His
Maj
esty
’s S
ecre
taria
t8
42
1 1
52
His
Maj
esty
The
4th K
ing
Sec
reta
riat
3 25
28
Ju
dici
ary
Roy
al C
ourt
of J
ustic
e12
6 2
275
403
Sup
rem
e C
ourt
of B
huta
n1
2 3
legi
slat
ive
Nat
iona
l Ass
embl
y S
ecre
taria
t2
59
1 5
67
Nat
iona
l Cou
ncil
3 2
42
7 54
C
onst
itutio
nal
Roy
al A
udit
Aut
horit
y4
35
159
7 20
5 R
oyal
Civ
il S
ervi
ce C
omm
issi
on5
178
2 3
188
Ant
i-Cor
rupt
ion
Com
mis
sion
2 49
8
4 30
93
m
inis
try
Min
istry
of E
duca
tion
6 50
9 9,
160
108
842
10,6
25
Min
istry
of H
ealth
48
520
49
3,53
8 4,
155
Min
istry
of A
gric
ultu
re a
nd F
ores
ts37
44
9 8
30
2,95
5 3,
479
Min
istry
of F
inan
ce9
136
4 1,
385
72
1,60
6 M
inis
try o
f Wor
ks &
Hum
an S
ettle
men
t13
17
2 37
1,
358
1,58
0 M
inis
try o
f Hom
e &
Cul
tura
l Affa
irs32
1,
074
16
25
113
1,26
0 M
inis
try o
f Inf
orm
atio
n &
Com
mun
icat
ions
5 20
2 9
531
747
Min
istry
of E
cono
mic
Affa
irs13
21
6 4
340
573
Min
istry
of L
abou
r & H
uman
Res
ourc
es7
143
143
17
25
335
Min
istry
of F
orei
gn A
ffairs
12
143
1 15
6 a
genc
yN
atio
nal L
and
Com
mis
sion
6 19
7 2
183
388
Offi
ce o
f the
Atto
rney
Gen
eral
7 13
1 13
8 G
ross
Nat
iona
l Hap
pine
ss C
omm
issi
on1
89
1 91
N
atio
nal E
nviro
nmen
t Com
mis
sion
2 17
48
67
| Civ
il se
rvic
e s
tatis
tics
99co
nt.
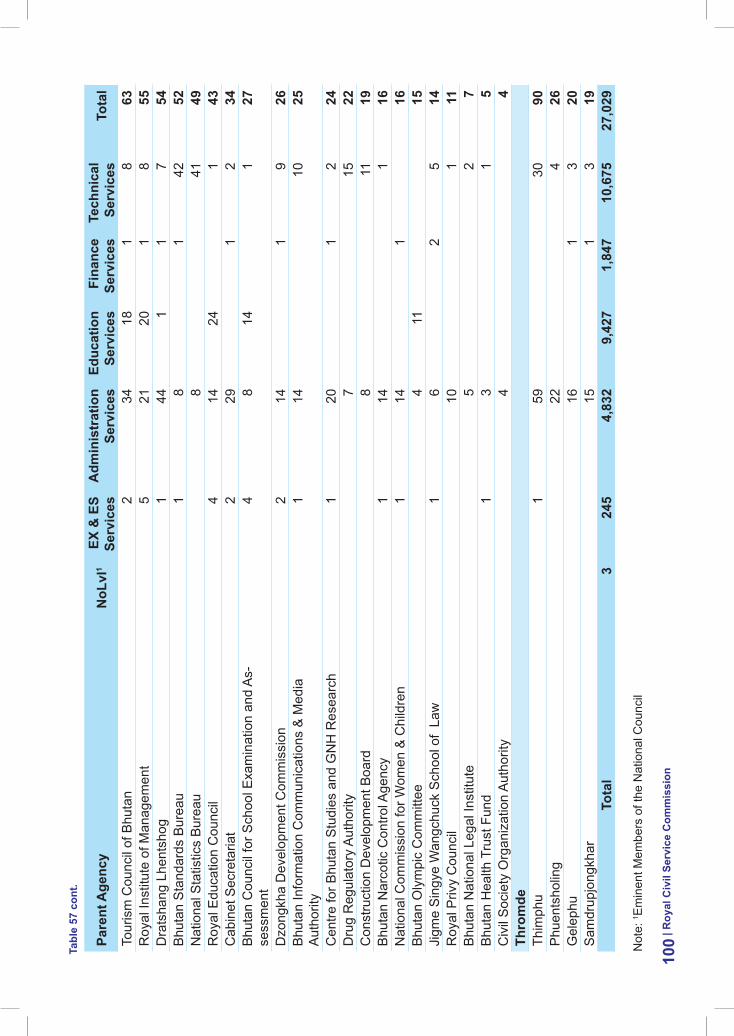
Pare
nt a
genc
yN
olvl
1eX
& e
s se
rvic
esa
dmin
istr
atio
n se
rvic
esed
ucat
ion
serv
ices
Fina
nce
serv
ices
tech
nica
l se
rvic
esto
tal
Tour
ism
Cou
ncil
of B
huta
n2
34
18
1 8
63
Roy
al In
stitu
te o
f Man
agem
ent
5 21
20
1
8 55
D
rats
hang
Lhe
ntsh
og1
44
1 1
7 54
B
huta
n S
tand
ards
Bur
eau
1 8
1 42
52
N
atio
nal S
tatis
tics
Bur
eau
8 41
49
R
oyal
Edu
catio
n C
ounc
il4
14
24
1 43
C
abin
et S
ecre
taria
t2
29
1 2
34
Bhu
tan
Cou
ncil
for S
choo
l Exa
min
atio
n an
d A
s-se
ssm
ent
4 8
14
1 27
Dzo
ngkh
a D
evel
opm
ent C
omm
issi
on2
14
1 9
26
Bhu
tan
Info
rmat
ion
Com
mun
icat
ions
& M
edia
A
utho
rity
1 14
10
25
Cen
tre fo
r Bhu
tan
Stu
dies
and
GN
H R
esea
rch
1 20
1
2 24
D
rug
Reg
ulat
ory
Aut
horit
y7
15
22
Con
stru
ctio
n D
evel
opm
ent B
oard
8 11
19
B
huta
n N
arco
tic C
ontro
l Age
ncy
1 14
1
16
Nat
iona
l Com
mis
sion
for W
omen
& C
hild
ren
1 14
1
16
Bhu
tan
Oly
mpi
c C
omm
ittee
4 11
15
Ji
gme
Sin
gye
Wan
gchu
ck S
choo
l of
Law
1
6 2
5 14
R
oyal
Priv
y C
ounc
il10
1
11
Bhu
tan
Nat
iona
l Leg
al In
stitu
te5
2 7
Bhu
tan
Hea
lth T
rust
Fun
d1
3 1
5 C
ivil
Soc
iety
Org
aniz
atio
n A
utho
rity
4 4
thro
mde
Th
imph
u1
59
30
90
Phu
ents
holin
g22
4
26
Gel
ephu
16
1 3
20
Sam
drup
jong
khar
15
1 3
19
tota
l3
245
4,83
2 9,
427
1,84
7 10
,675
27
,029
Not
e: 1 E
min
ent M
embe
rs o
f the
Nat
iona
l Cou
ncil
| roy
al C
ivil
serv
ice
Com
mis
sion
100tabl
e 57
con
t.