Embed Size (px)
Citation preview
Hall B Software Team
August 2015 Jefferson Lab, Newport News, VA
CLAS12 Occupancy Monitor DC Component Monitor
Overview: This project intends to take over all duties of the current online occupancy histograms and to monitor the status of all detector components of the accelerator. For the first time, the component status database will be working with the reference occupancy plot. The end goal is to create an automated system of comparing occupancy histograms and pinpointing component failures with close to realtime analysis. The current project focuses solely on the drift chamber components, but eventually the CLAS12 Occupancy Monitor will encompass all detectors.
Problem: Due to faulty electronic components, the occupancy histogram will change overtime, creating holes in the wiremap. These holes could be caused by multiple components. The past solution has been to replace all components that could possibly have caused the hole. This method is both inefficient and costly. When holes do occur during a run period, the occupancy histogram will be affected for the subsequent runs. While examining an occupancy histogram, it is often unclear which component failure is causing outliers in the histogram. It is also unclear if holes in the drift chamber are actual experimental results, or just an electronic error. Thus a reference occupancy histogram for subsequent runs, based off of electronic component statuses, must be reset after each component failure.
Goals:
● Record component failures, mappings and reference occupancy in database ● Isolate component malfunctions to a single point of failure quickly ● Create a runspecific occupancy references ● Automatically verify the occupancy of subsequent runs with references ● Ultimately monitor each component’s status throughout running time.
DC Component Monitor Specifications
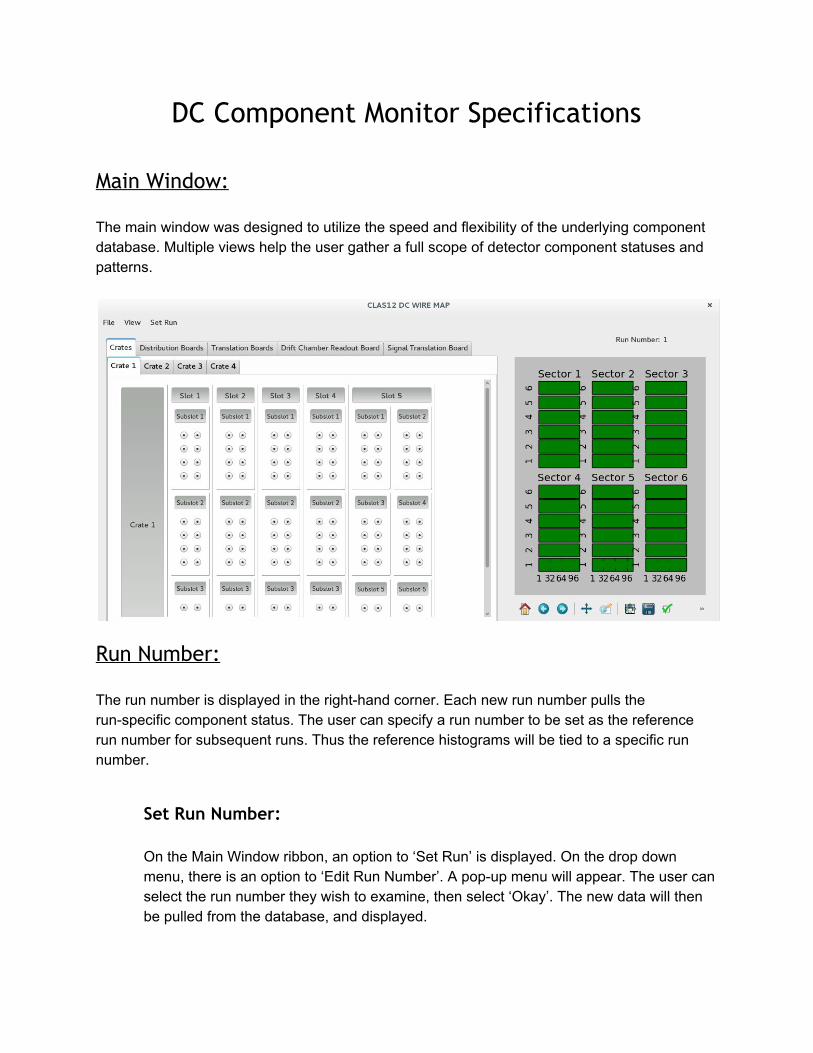
Main Window: The main window was designed to utilize the speed and flexibility of the underlying component database. Multiple views help the user gather a full scope of detector component statuses and patterns.
Run Number: The run number is displayed in the righthand corner. Each new run number pulls the runspecific component status. The user can specify a run number to be set as the reference run number for subsequent runs. Thus the reference histograms will be tied to a specific run number.
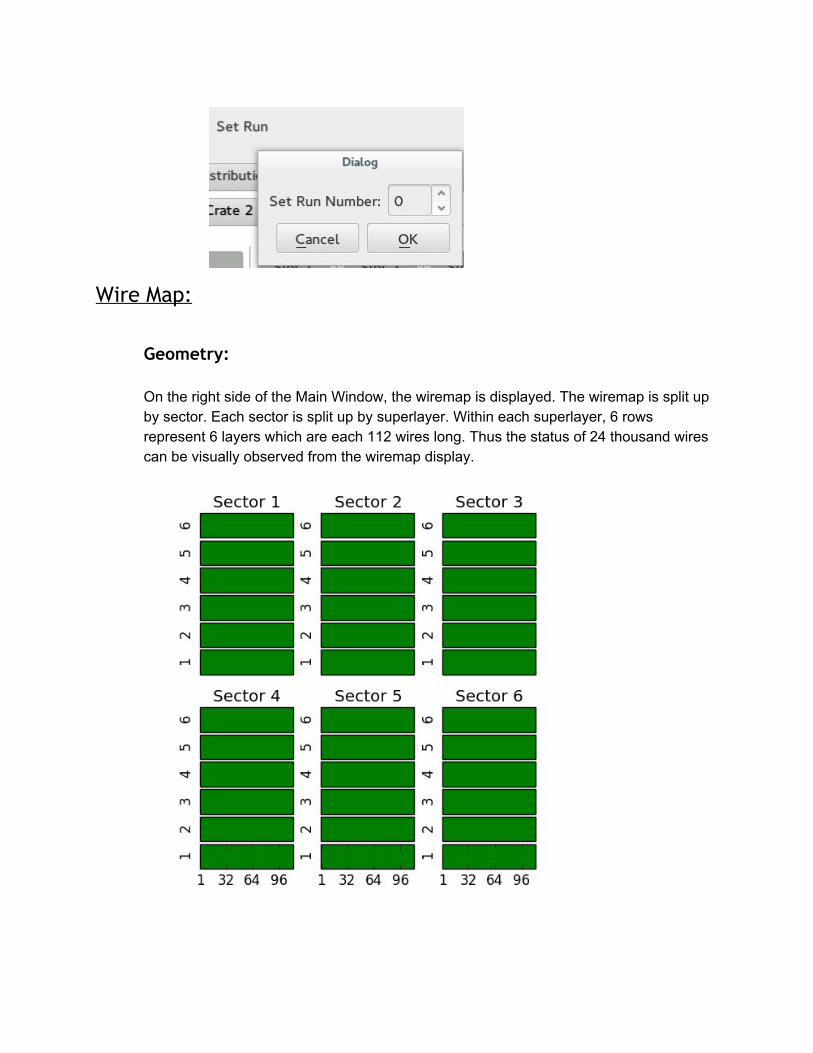
Set Run Number: On the Main Window ribbon, an option to ‘Set Run’ is displayed. On the drop down menu, there is an option to ‘Edit Run Number’. A popup menu will appear. The user can select the run number they wish to examine, then select ‘Okay’. The new data will then be pulled from the database, and displayed.
Wire Map:
Geometry: On the right side of the Main Window, the wiremap is displayed. The wiremap is split up by sector. Each sector is split up by superlayer. Within each superlayer, 6 rows represent 6 layers which are each 112 wires long. Thus the status of 24 thousand wires can be visually observed from the wiremap display.
Wire Identification: The user can scroll over and zoom in on specific wires, and the component’s associated with the specific wire will be displayed in the ‘Wire Identification’ box. This diagnostic tool is very useful when identifying all possible sources of failures for a hole in the drift chamber. <Insert photo>
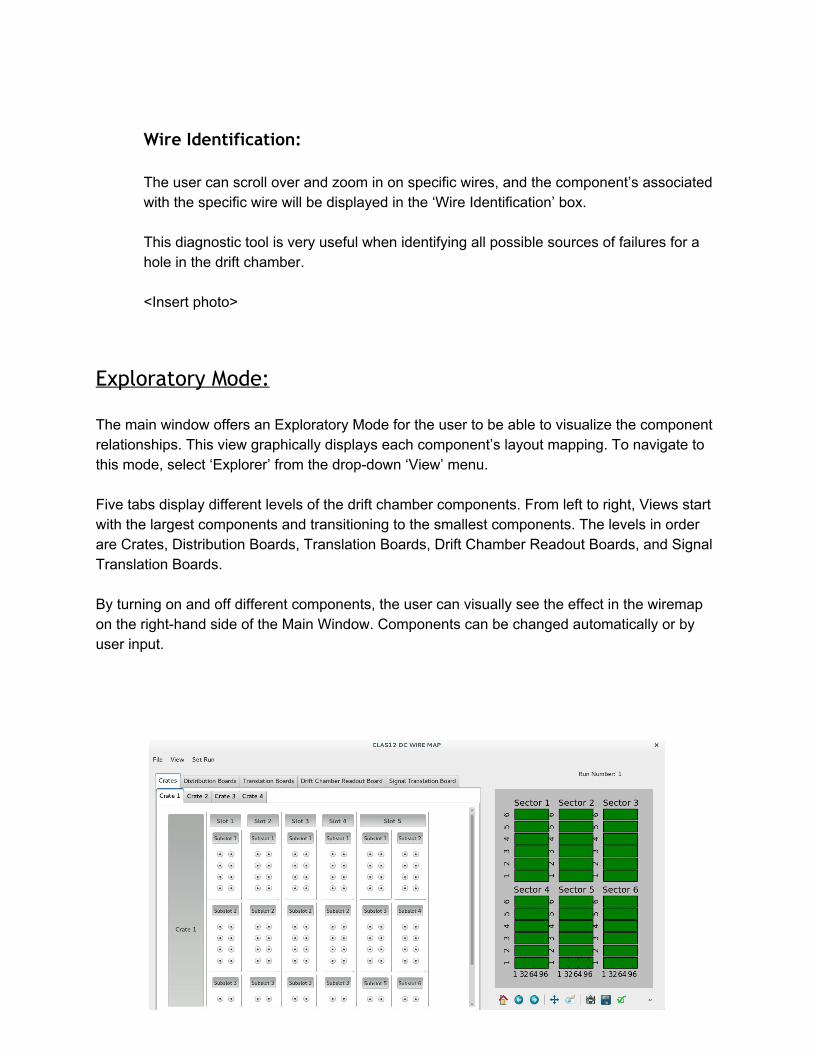
Exploratory Mode: The main window offers an Exploratory Mode for the user to be able to visualize the component relationships. This view graphically displays each component’s layout mapping. To navigate to this mode, select ‘Explorer’ from the dropdown ‘View’ menu. Five tabs display different levels of the drift chamber components. From left to right, Views start with the largest components and transitioning to the smallest components. The levels in order are Crates, Distribution Boards, Translation Boards, Drift Chamber Readout Boards, and Signal Translation Boards. By turning on and off different components, the user can visually see the effect in the wiremap on the righthand side of the Main Window. Components can be changed automatically or by user input.
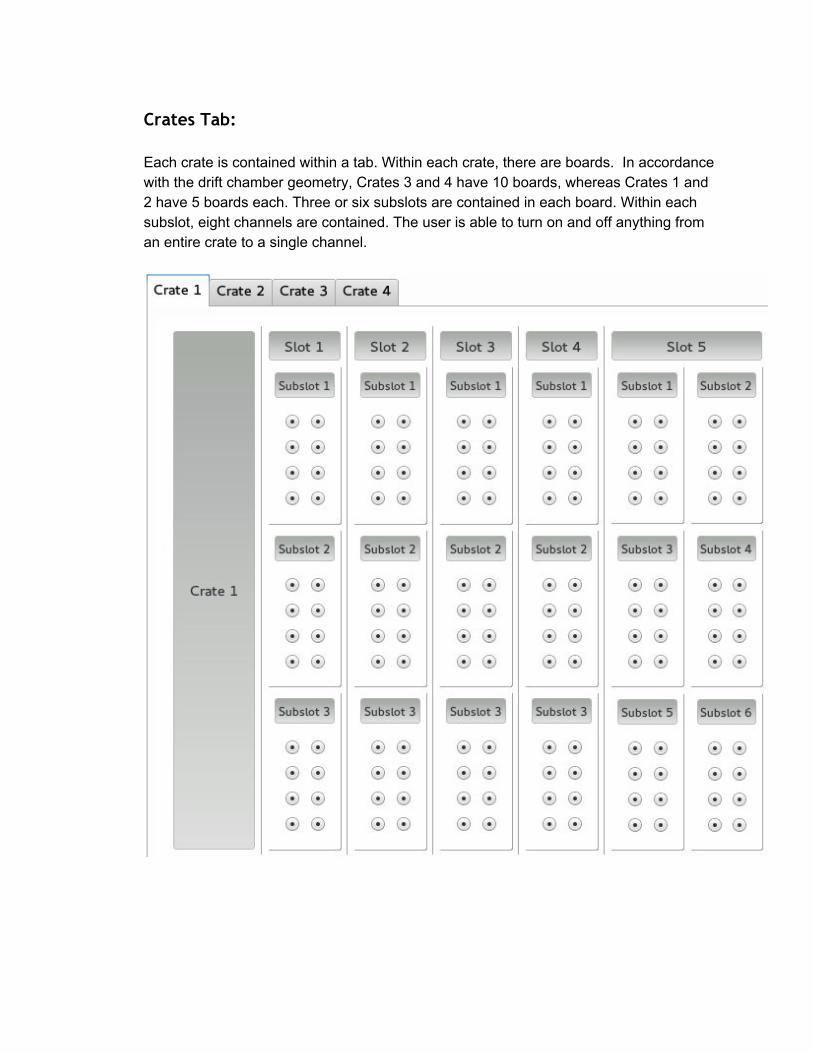
Crates Tab:
Each crate is contained within a tab. Within each crate, there are boards. In accordance with the drift chamber geometry, Crates 3 and 4 have 10 boards, whereas Crates 1 and 2 have 5 boards each. Three or six subslots are contained in each board. Within each subslot, eight channels are contained. The user is able to turn on and off anything from an entire crate to a single channel.
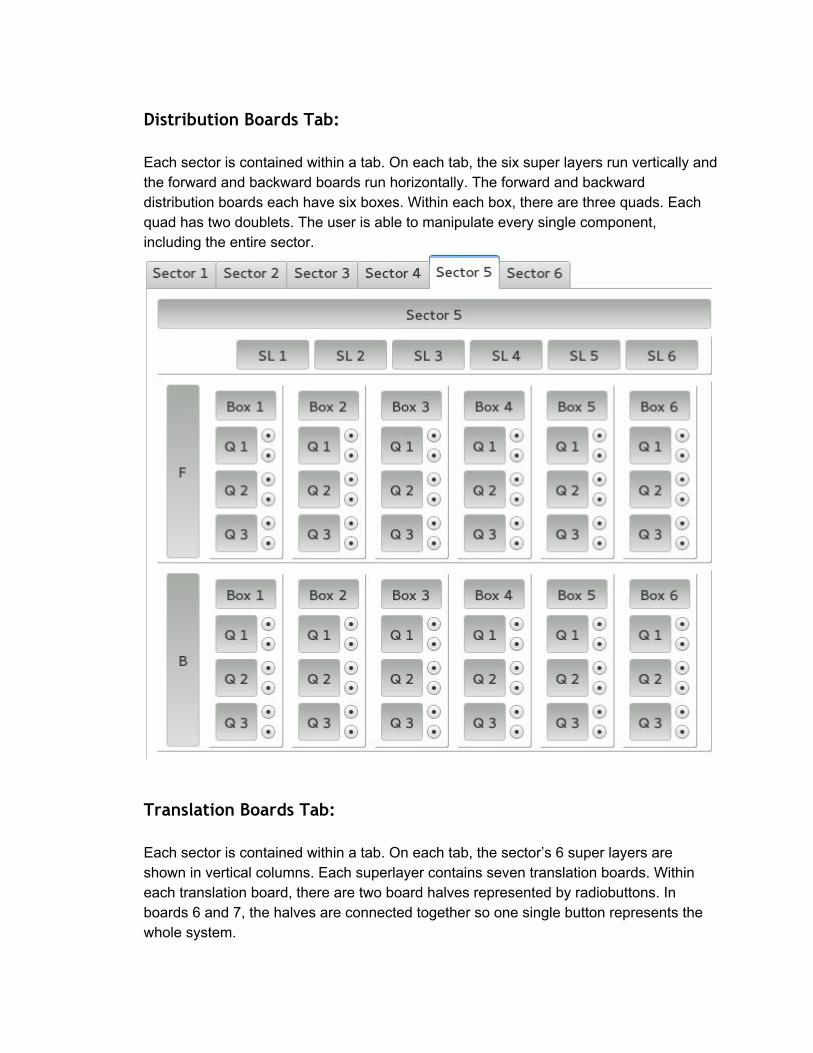
Distribution Boards Tab:
Each sector is contained within a tab. On each tab, the six super layers run vertically and the forward and backward boards run horizontally. The forward and backward distribution boards each have six boxes. Within each box, there are three quads. Each quad has two doublets. The user is able to manipulate every single component, including the entire sector.
Translation Boards Tab:
Each sector is contained within a tab. On each tab, the sector’s 6 super layers are shown in vertical columns. Each superlayer contains seven translation boards. Within each translation board, there are two board halves represented by radiobuttons. In boards 6 and 7, the halves are connected together so one single button represents the whole system.
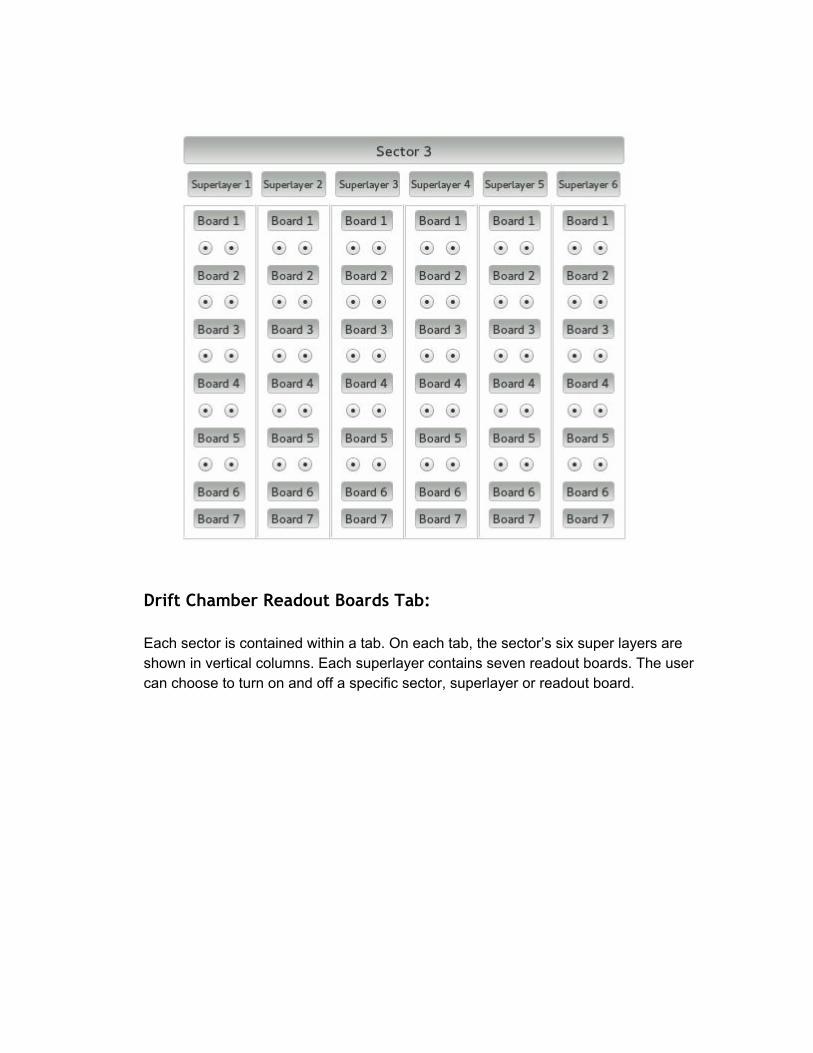
Drift Chamber Readout Boards Tab:
Each sector is contained within a tab. On each tab, the sector’s six super layers are shown in vertical columns. Each superlayer contains seven readout boards. The user can choose to turn on and off a specific sector, superlayer or readout board.
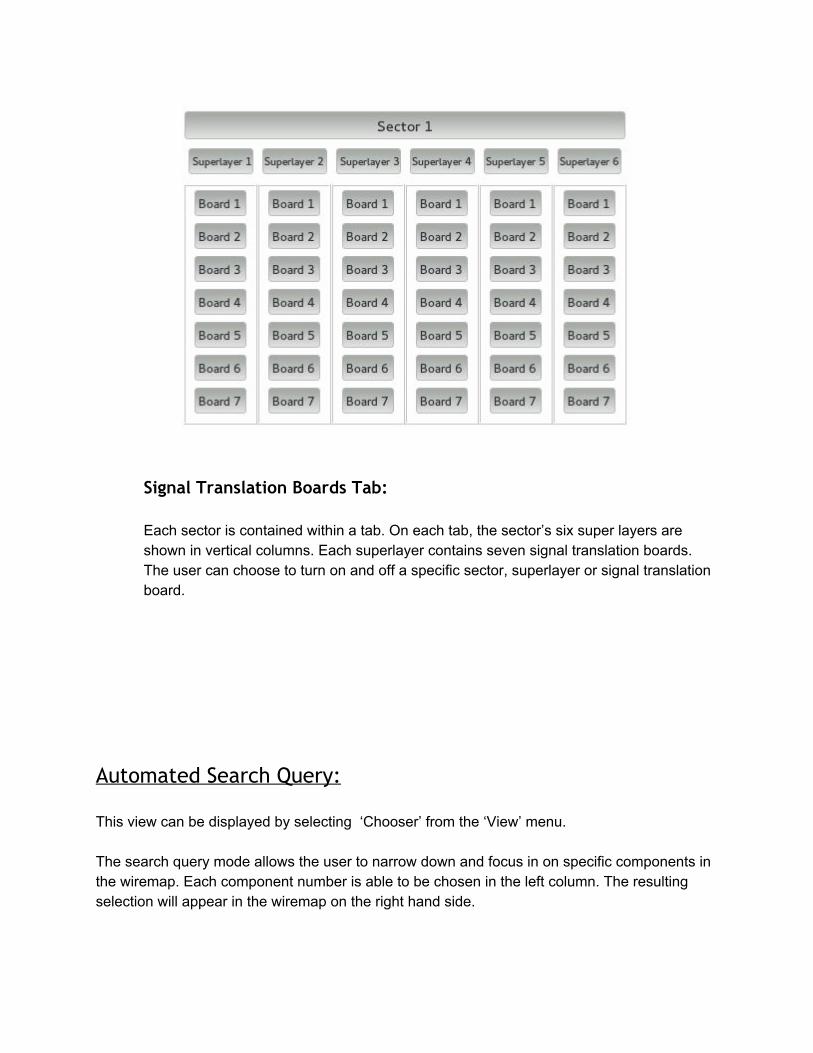
Signal Translation Boards Tab:
Each sector is contained within a tab. On each tab, the sector’s six super layers are shown in vertical columns. Each superlayer contains seven signal translation boards. The user can choose to turn on and off a specific sector, superlayer or signal translation board.
Automated Search Query: This view can be displayed by selecting ‘Chooser’ from the ‘View’ menu. The search query mode allows the user to narrow down and focus in on specific components in the wiremap. Each component number is able to be chosen in the left column. The resulting selection will appear in the wiremap on the right hand side.
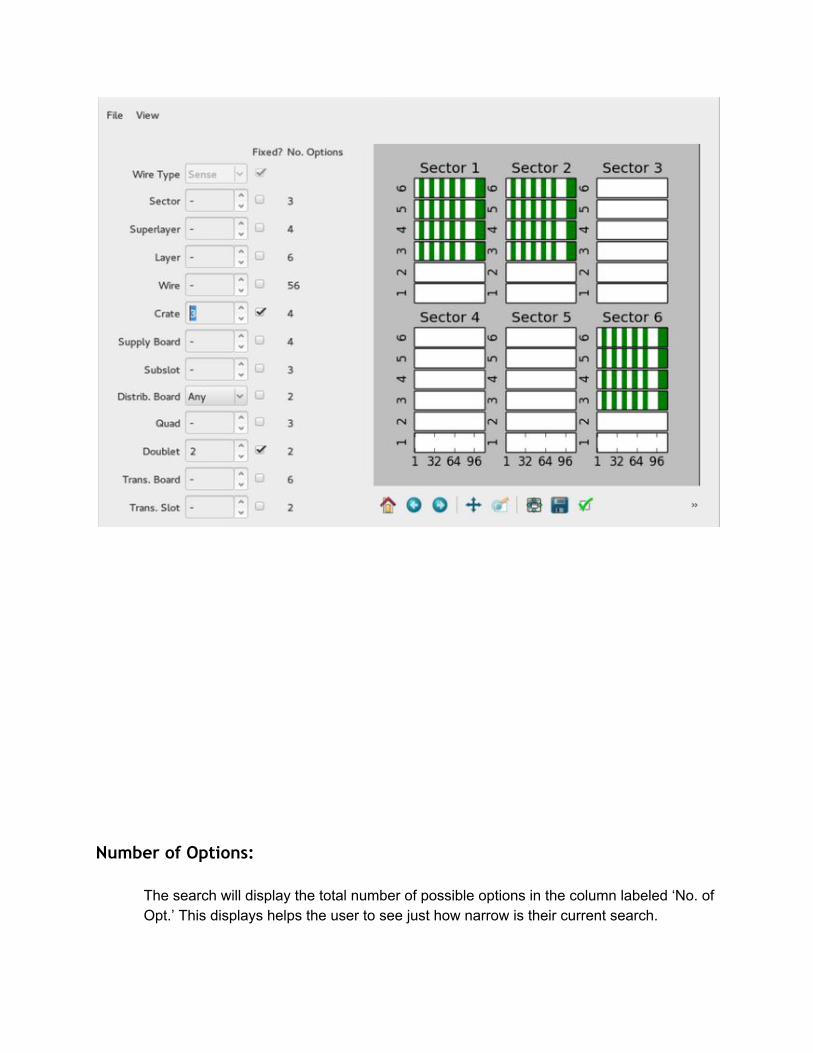
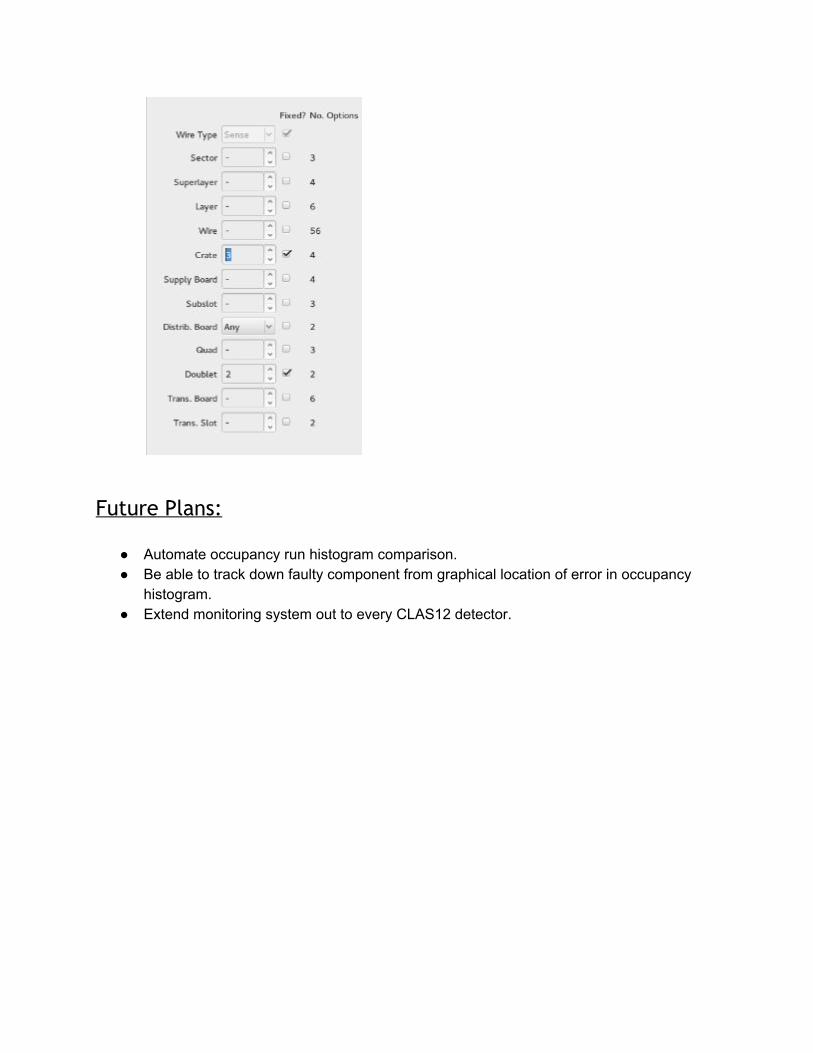
Number of Options:
The search will display the total number of possible options in the column labeled ‘No. of Opt.’ This displays helps the user to see just how narrow is their current search.
Future Plans:
● Automate occupancy run histogram comparison. ● Be able to track down faulty component from graphical location of error in occupancy
histogram. ● Extend monitoring system out to every CLAS12 detector.


