Embed Size (px)
Citation preview
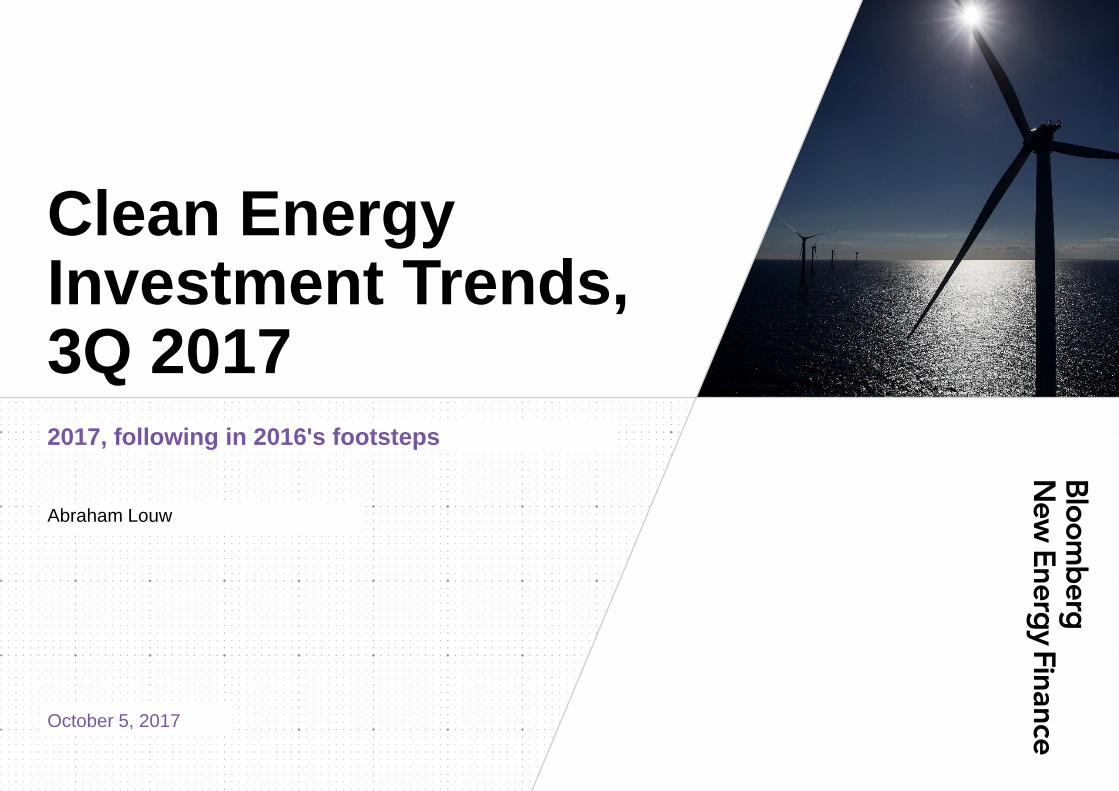
Clean Energy Investment Trends, 3Q 2017 2017, following in 2016's footsteps
Abraham Louw
October 5, 2017
1 October 5, 2017
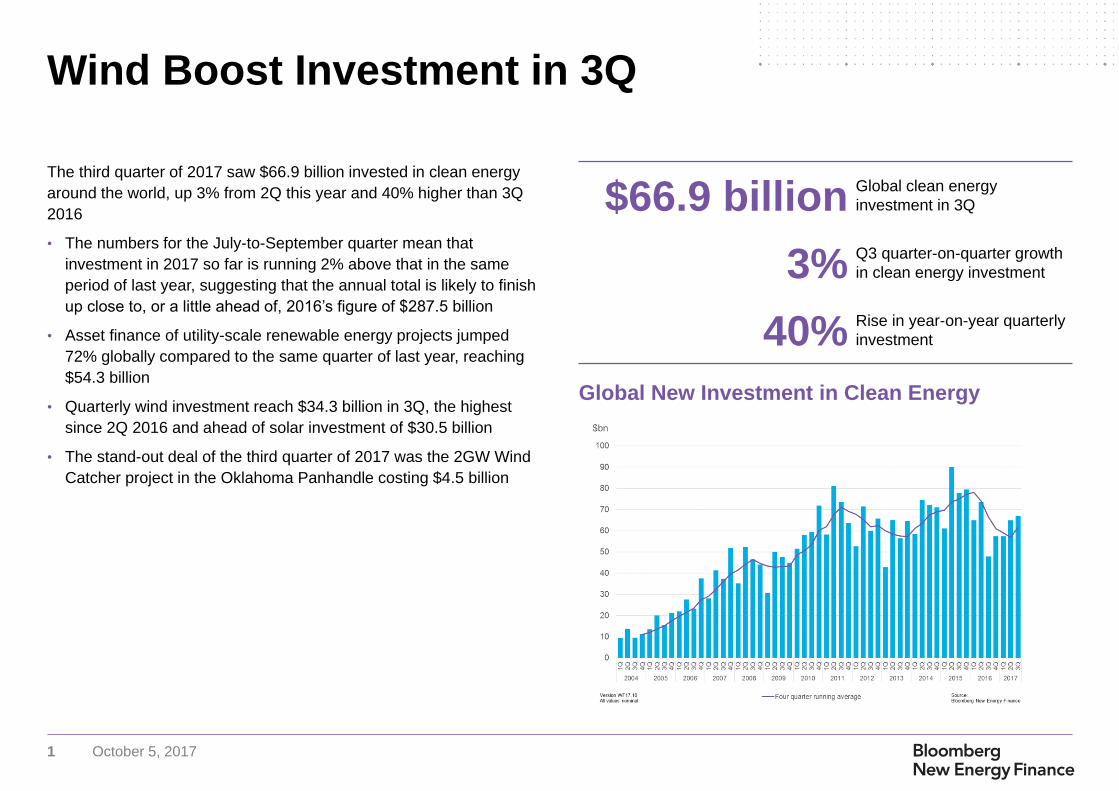
The third quarter of 2017 saw $66.9 billion invested in clean energy
around the world, up 3% from 2Q this year and 40% higher than 3Q
2016
• The numbers for the July-to-September quarter mean that
investment in 2017 so far is running 2% above that in the same
period of last year, suggesting that the annual total is likely to finish
up close to, or a little ahead of, 2016’s figure of $287.5 billion
• Asset finance of utility-scale renewable energy projects jumped
72% globally compared to the same quarter of last year, reaching
$54.3 billion
• Quarterly wind investment reach $34.3 billion in 3Q, the highest
since 2Q 2016 and ahead of solar investment of $30.5 billion
• The stand-out deal of the third quarter of 2017 was the 2GW Wind
Catcher project in the Oklahoma Panhandle costing $4.5 billion
Wind Boost Investment in 3Q
Global New Investment in Clean Energy
$66.9 billion Global clean energy
investment in 3Q
3% Q3 quarter-on-quarter growth
in clean energy investment
40% Rise in year-on-year quarterly
investment
2 October 5, 2017
Contents
Quarterly Trends, New Investment 3
Quarterly Trends, Funds in Circulation 30
Top Deals 34
Annual Trends, New Investment 36
Clean Energy Stock Performance 56
Definitions and FAQs 60
3 October 5, 2017
Quarterly Trends,
New Investment
Quarterly trends since 1Q 2004
4 October 5, 2017
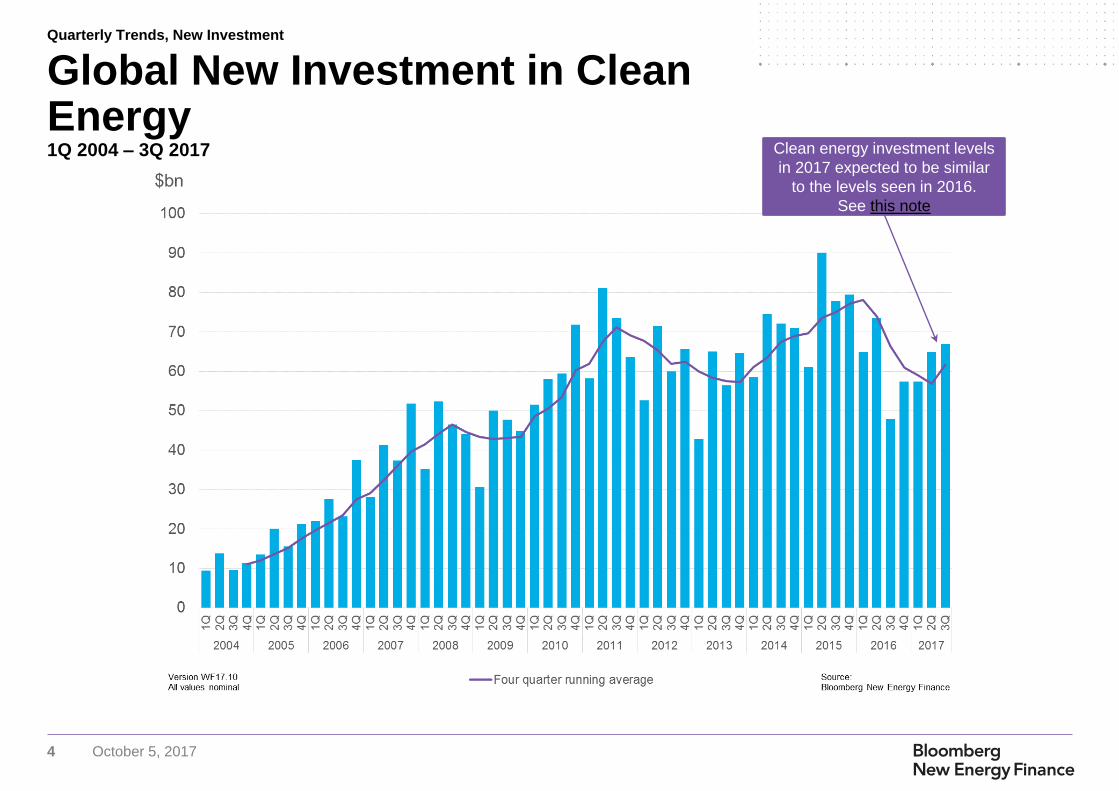
Global New Investment in Clean Energy 1Q 2004 – 3Q 2017 Clean energy investment levels
in 2017 expected to be similar
to the levels seen in 2016.
See this note
Quarterly Trends, New Investment
5 October 5, 2017
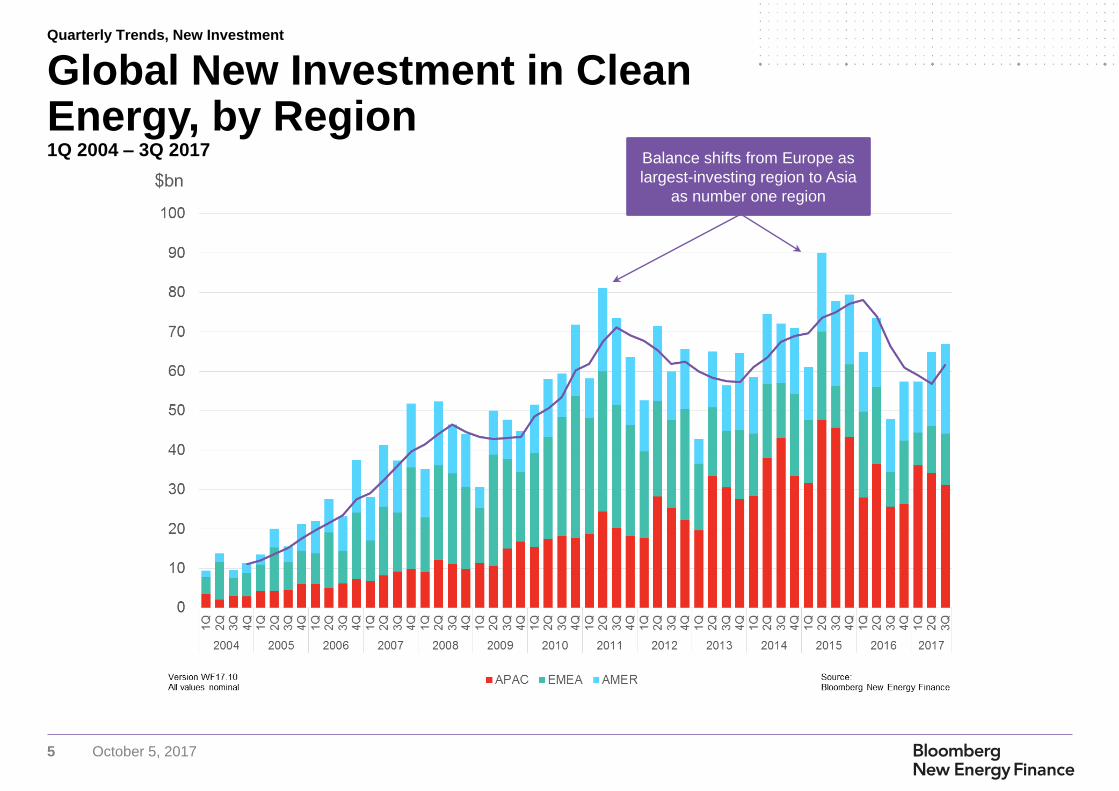
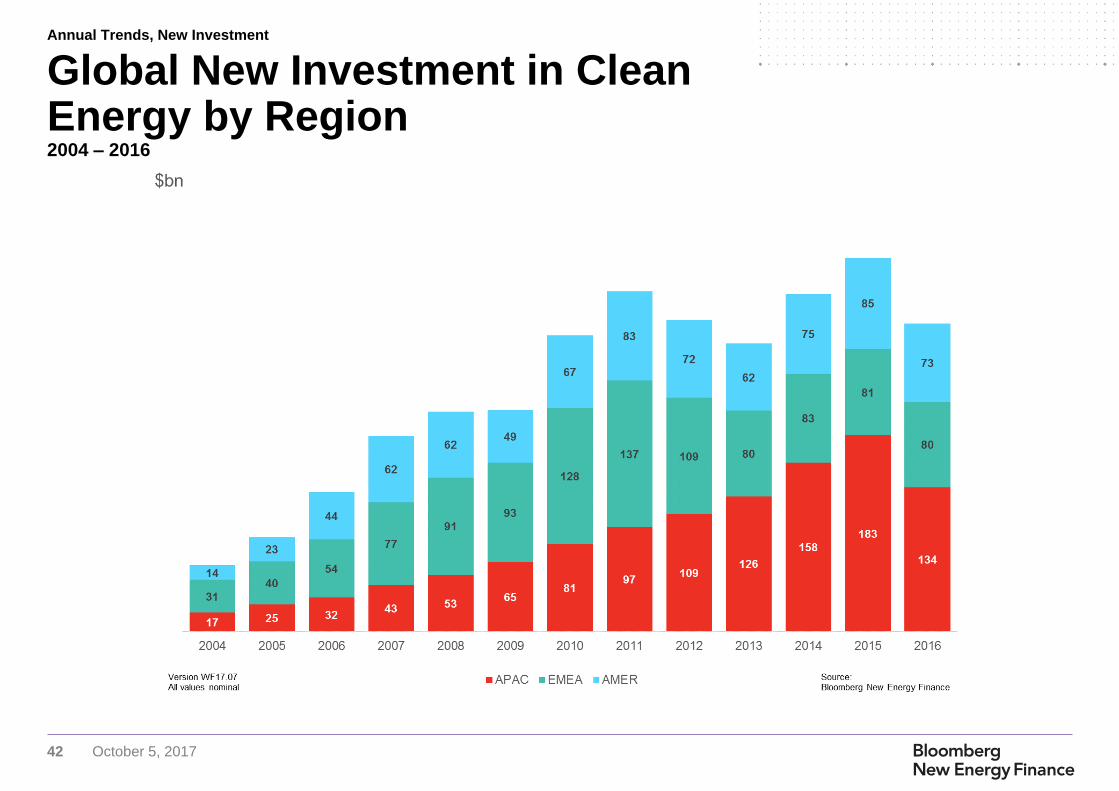
Global New Investment in Clean Energy, by Region1Q 2004 – 3Q 2017 Balance shifts from Europe as
largest-investing region to Asia
as number one region
Quarterly Trends, New Investment
6 October 5, 2017
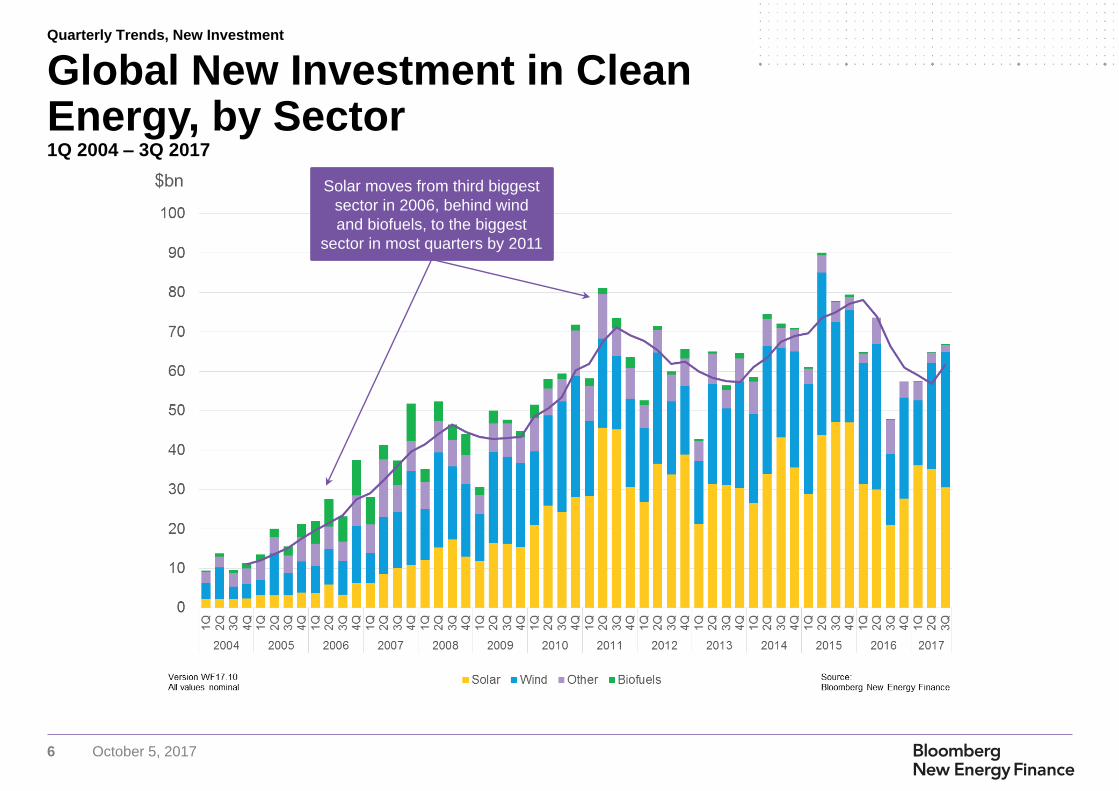
Global New Investment in Clean Energy, by Sector1Q 2004 – 3Q 2017
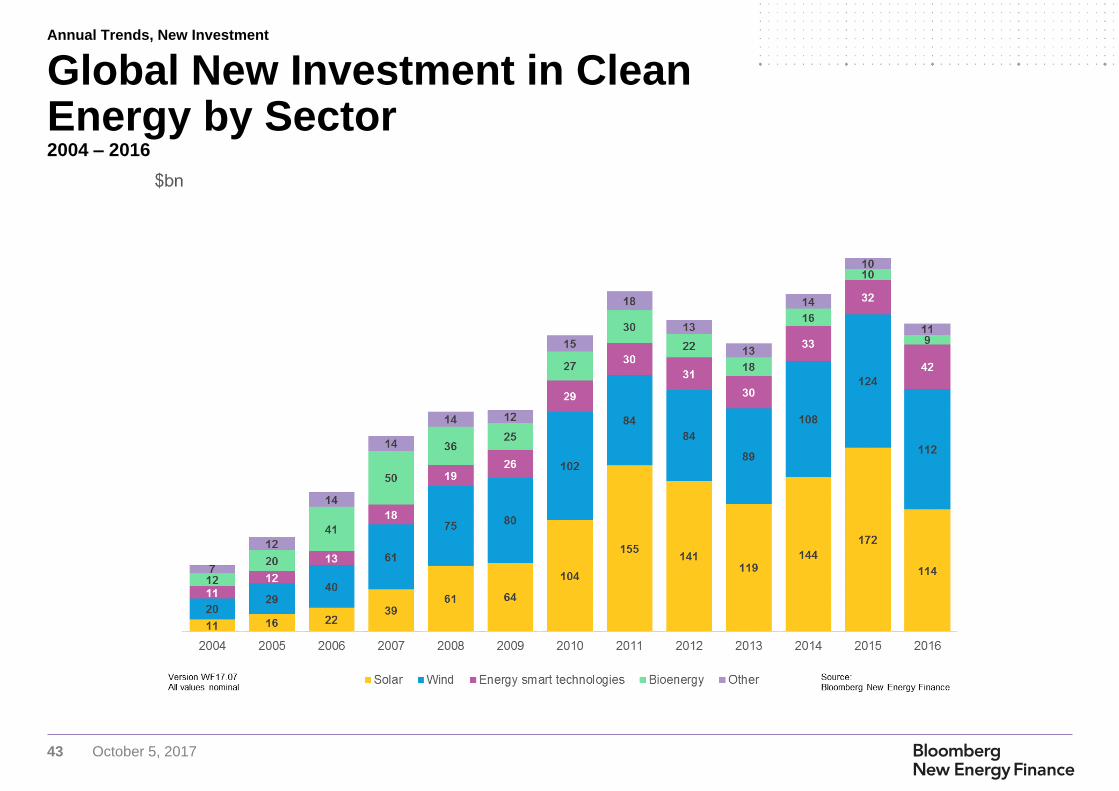
Solar moves from third biggest
sector in 2006, behind wind
and biofuels, to the biggest
sector in most quarters by 2011
Quarterly Trends, New Investment
7 October 5, 2017
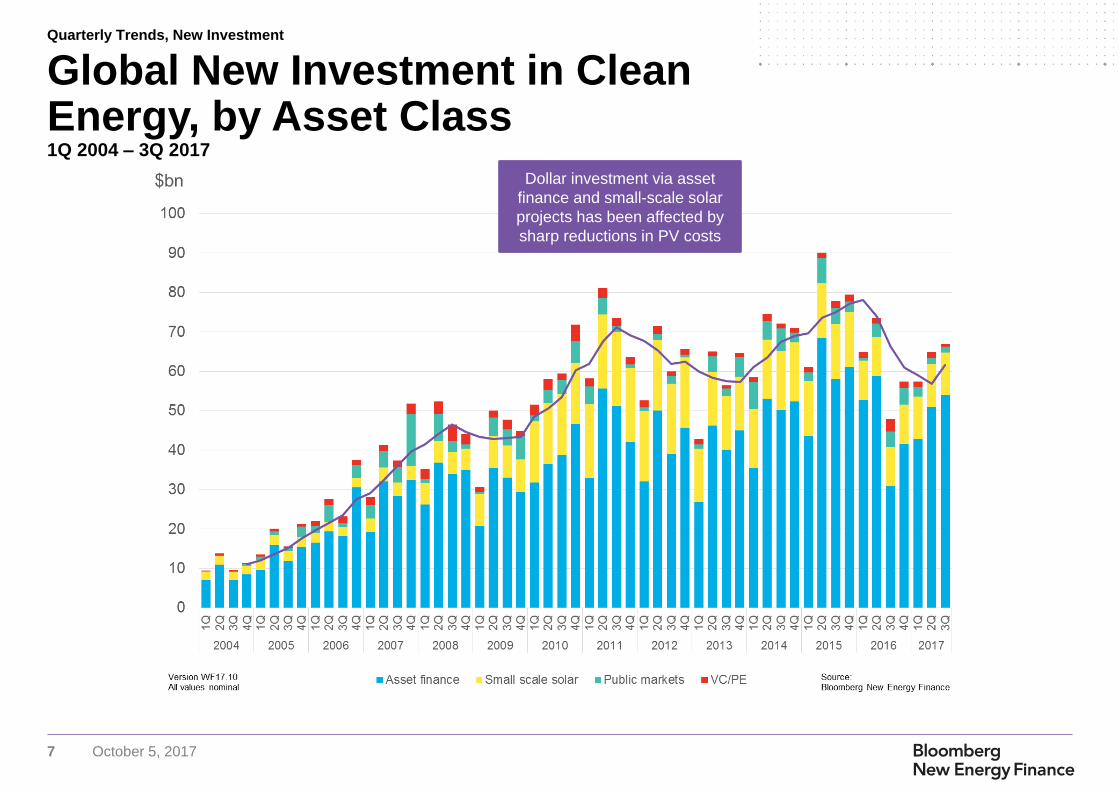
Global New Investment in Clean Energy, by Asset Class1Q 2004 – 3Q 2017
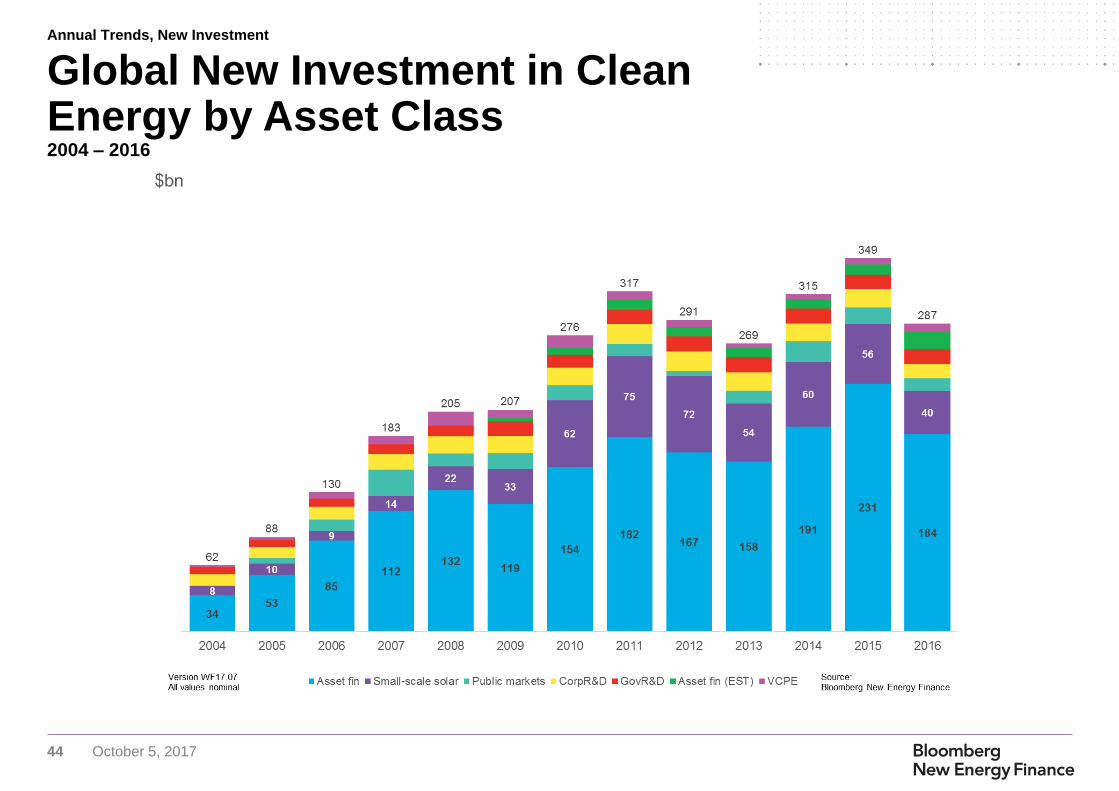
Dollar investment via asset
finance and small-scale solar
projects has been affected by
sharp reductions in PV costs
Quarterly Trends, New Investment
8 October 5, 2017
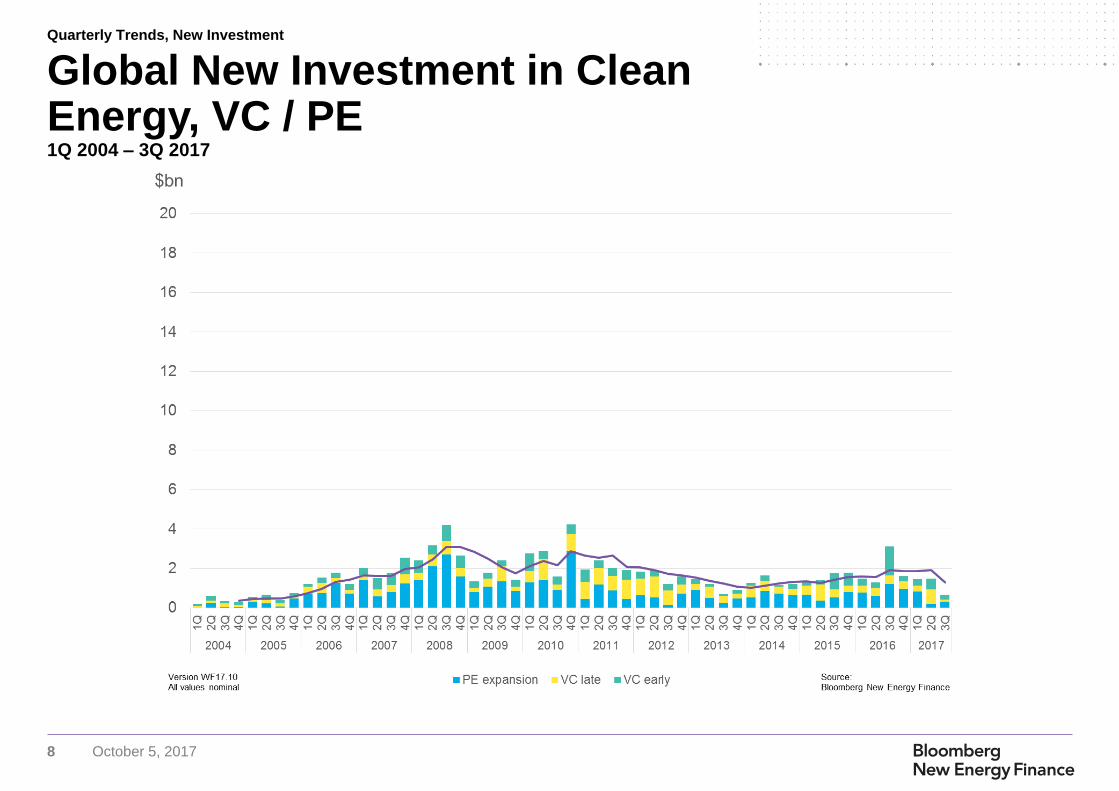
Global New Investment in Clean Energy, VC / PE1Q 2004 – 3Q 2017
Quarterly Trends, New Investment
9 October 5, 2017
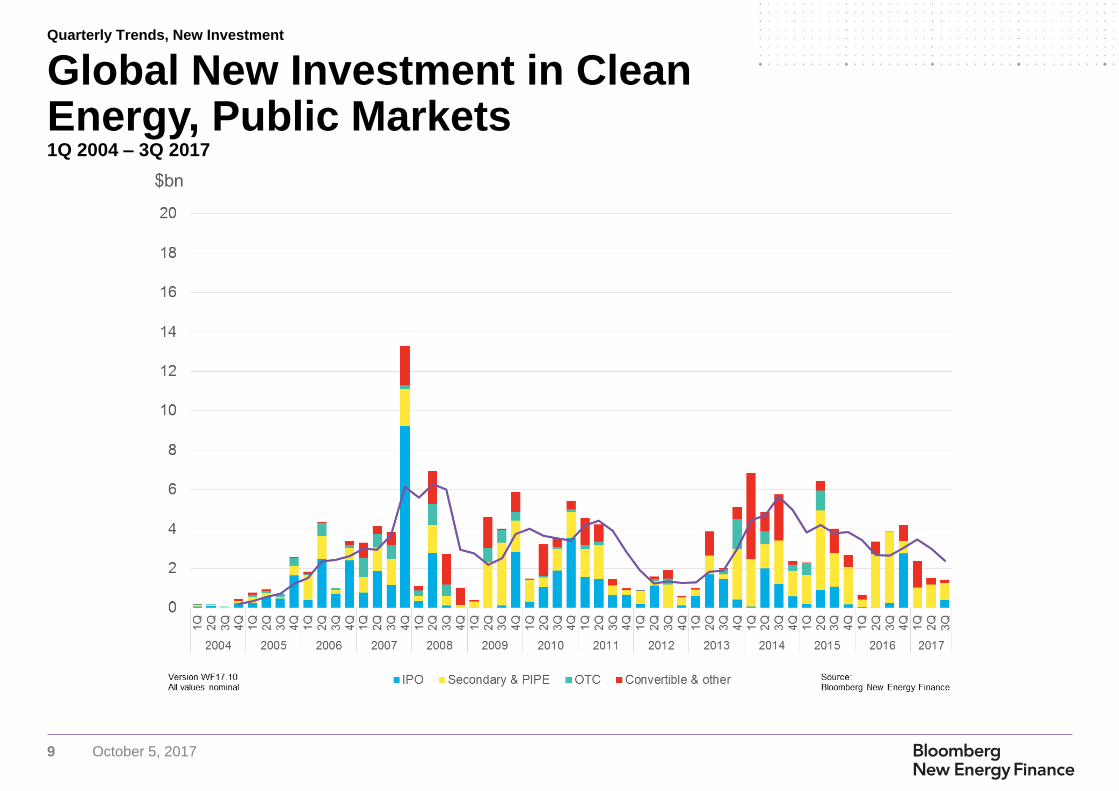
Global New Investment in Clean Energy, Public Markets1Q 2004 – 3Q 2017
Quarterly Trends, New Investment
10 October 5, 2017
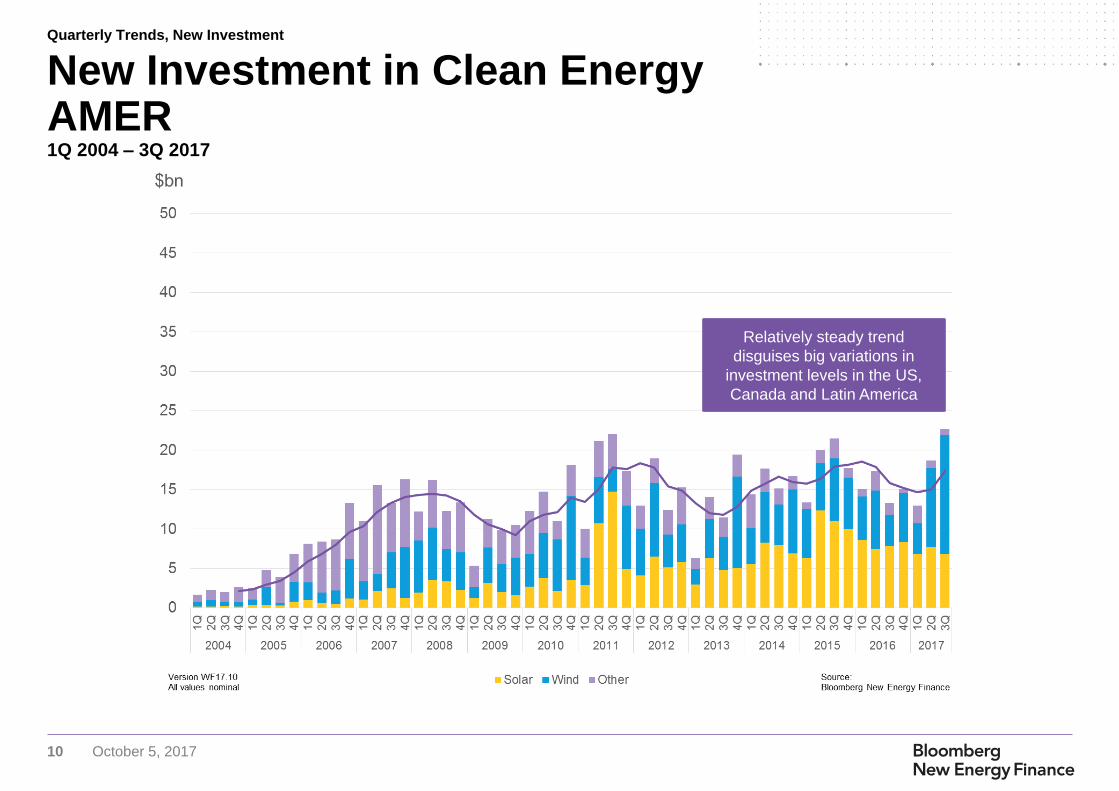
New Investment in Clean Energy AMER1Q 2004 – 3Q 2017
Relatively steady trend
disguises big variations in
investment levels in the US,
Canada and Latin America
Quarterly Trends, New Investment
11 October 5, 2017
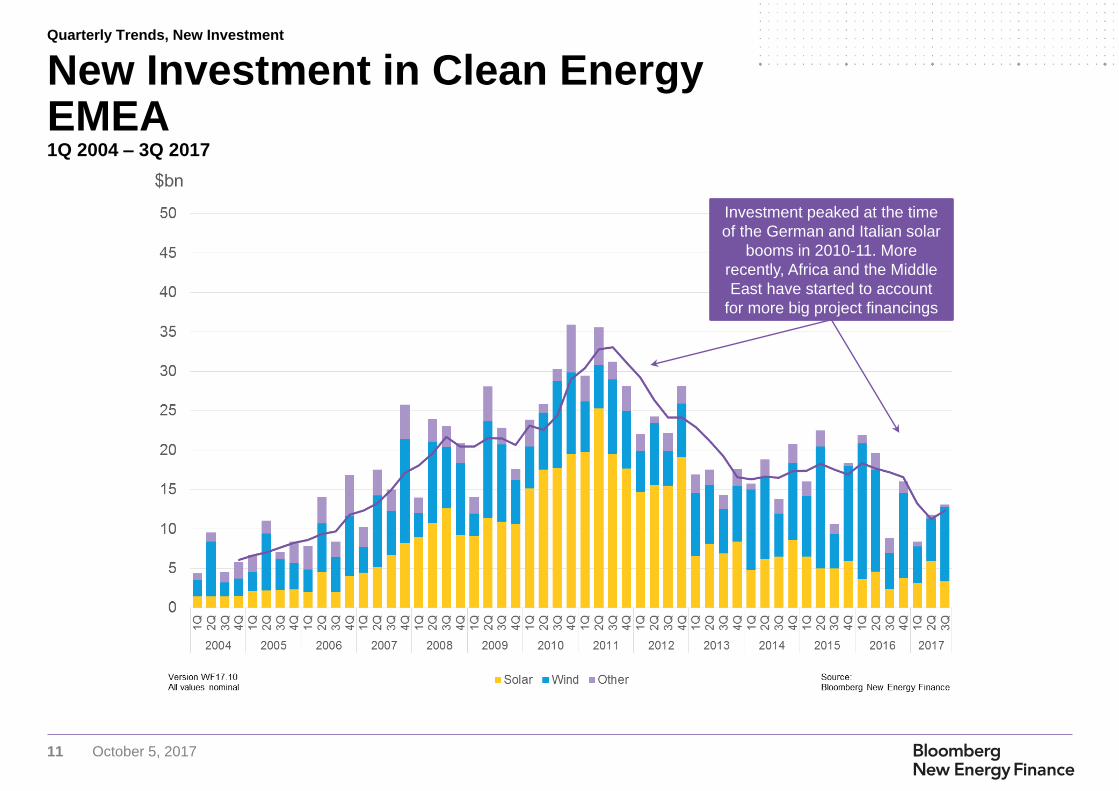
New Investment in Clean Energy EMEA1Q 2004 – 3Q 2017
Investment peaked at the time
of the German and Italian solar
booms in 2010-11. More
recently, Africa and the Middle
East have started to account
for more big project financings
Quarterly Trends, New Investment
12 October 5, 2017
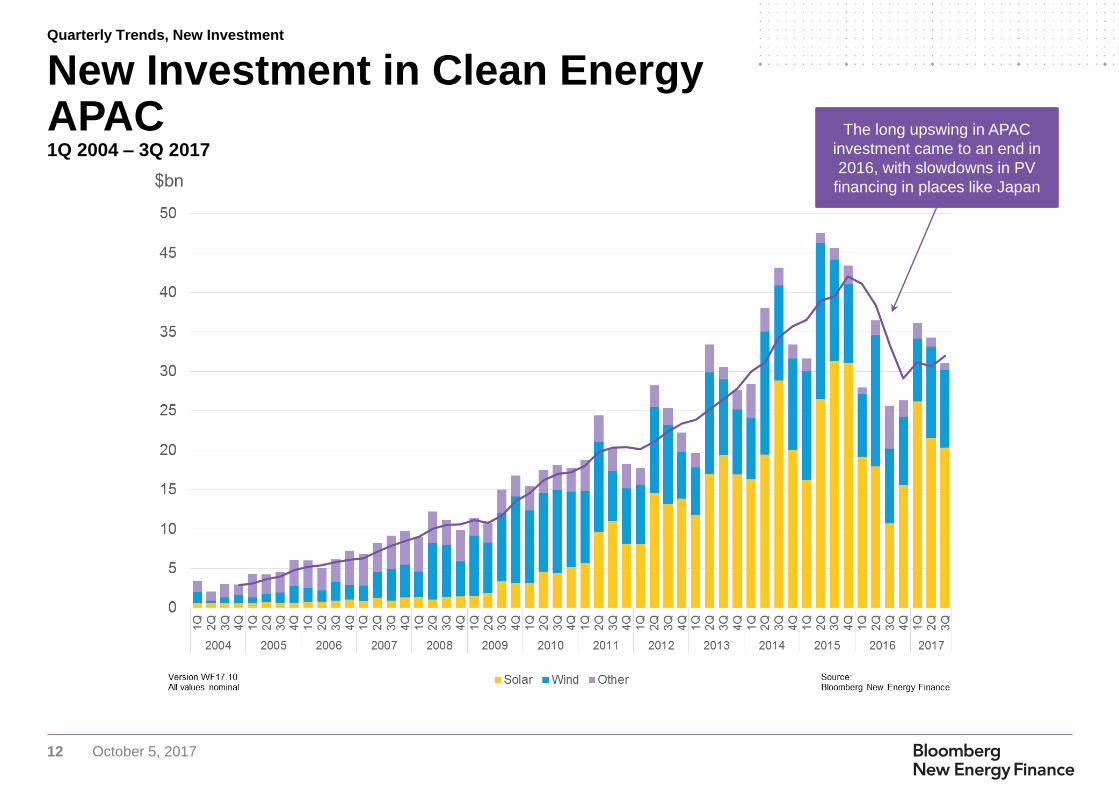
New Investment in Clean Energy APAC1Q 2004 – 3Q 2017
The long upswing in APAC
investment came to an end in
2016, with slowdowns in PV
financing in places like Japan
Quarterly Trends, New Investment
13 October 5, 2017
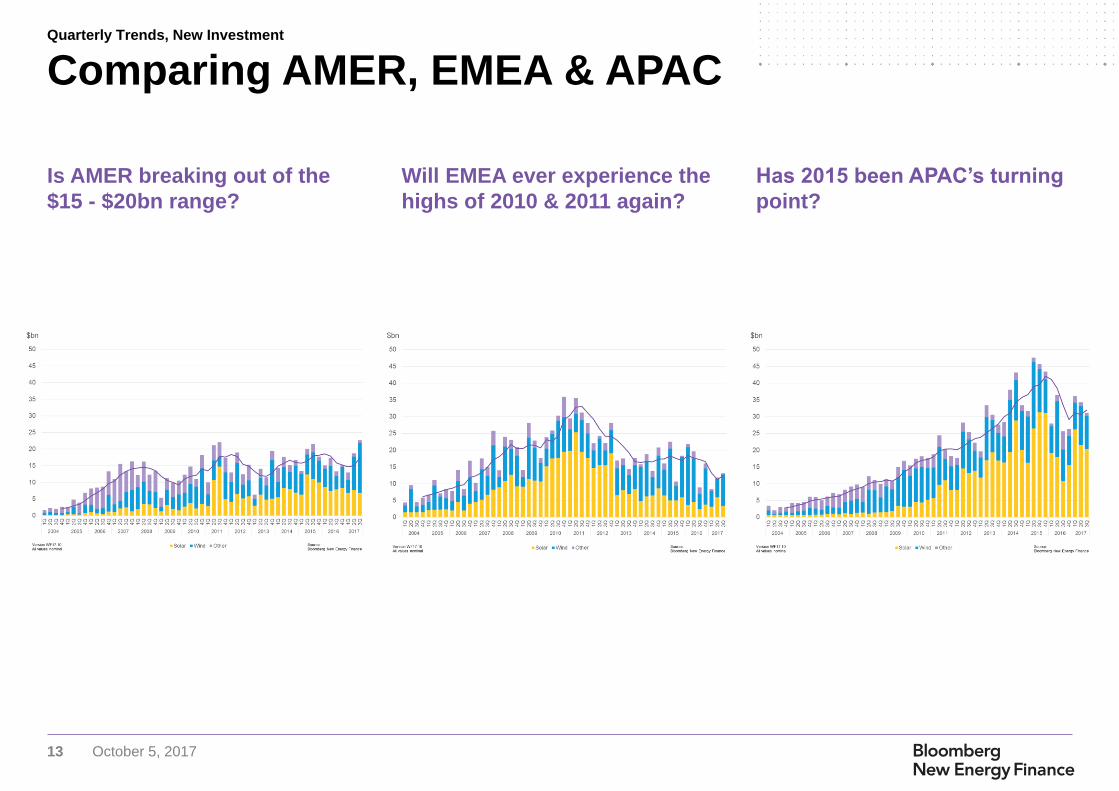
Is AMER breaking out of the
$15 - $20bn range?
Will EMEA ever experience the
highs of 2010 & 2011 again?
Has 2015 been APAC’s turning
point?
Comparing AMER, EMEA & APACQuarterly Trends, New Investment
14 October 5, 2017
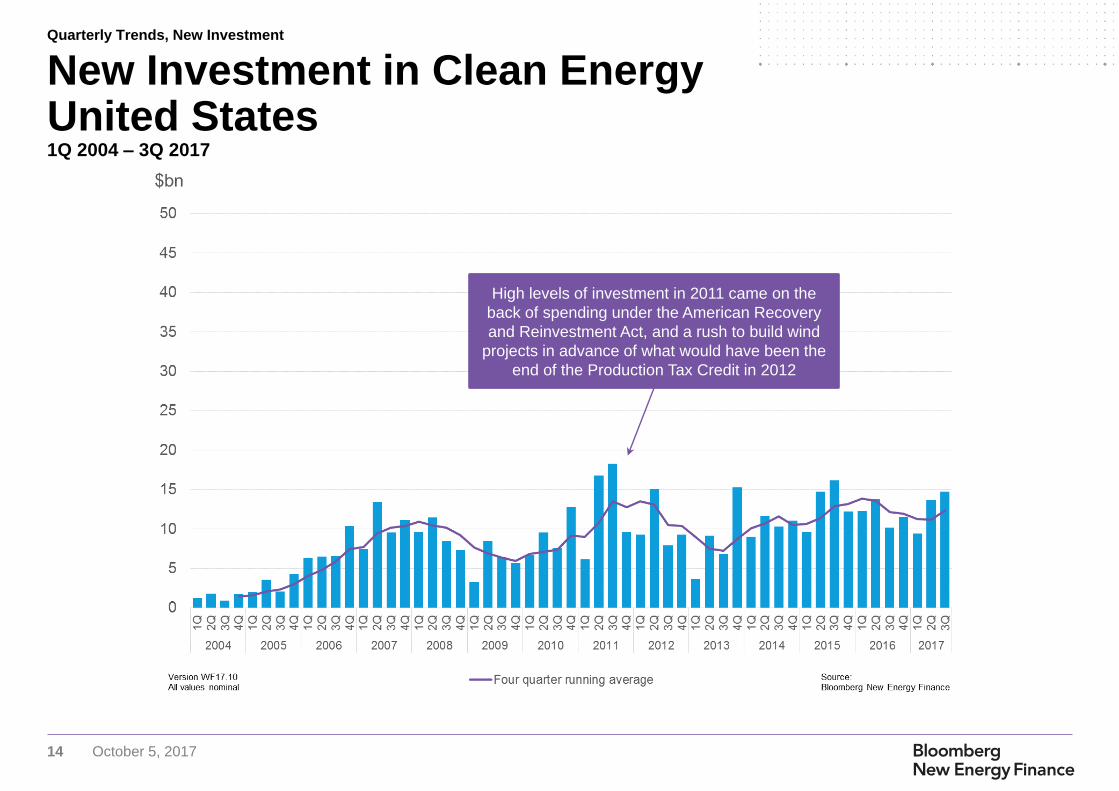
New Investment in Clean Energy United States1Q 2004 – 3Q 2017
High levels of investment in 2011 came on the
back of spending under the American Recovery
and Reinvestment Act, and a rush to build wind
projects in advance of what would have been the
end of the Production Tax Credit in 2012
Quarterly Trends, New Investment
15 October 5, 2017
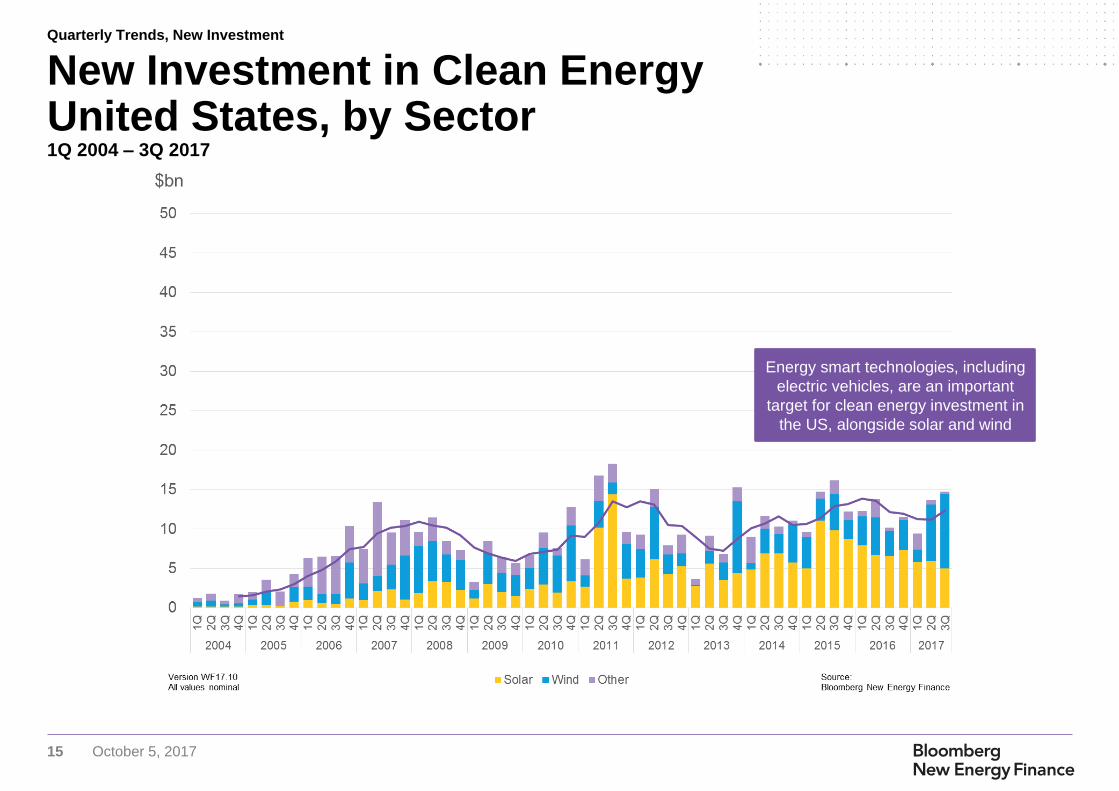
New Investment in Clean Energy United States, by Sector1Q 2004 – 3Q 2017
Energy smart technologies, including
electric vehicles, are an important
target for clean energy investment in
the US, alongside solar and wind
Quarterly Trends, New Investment
16 October 5, 2017
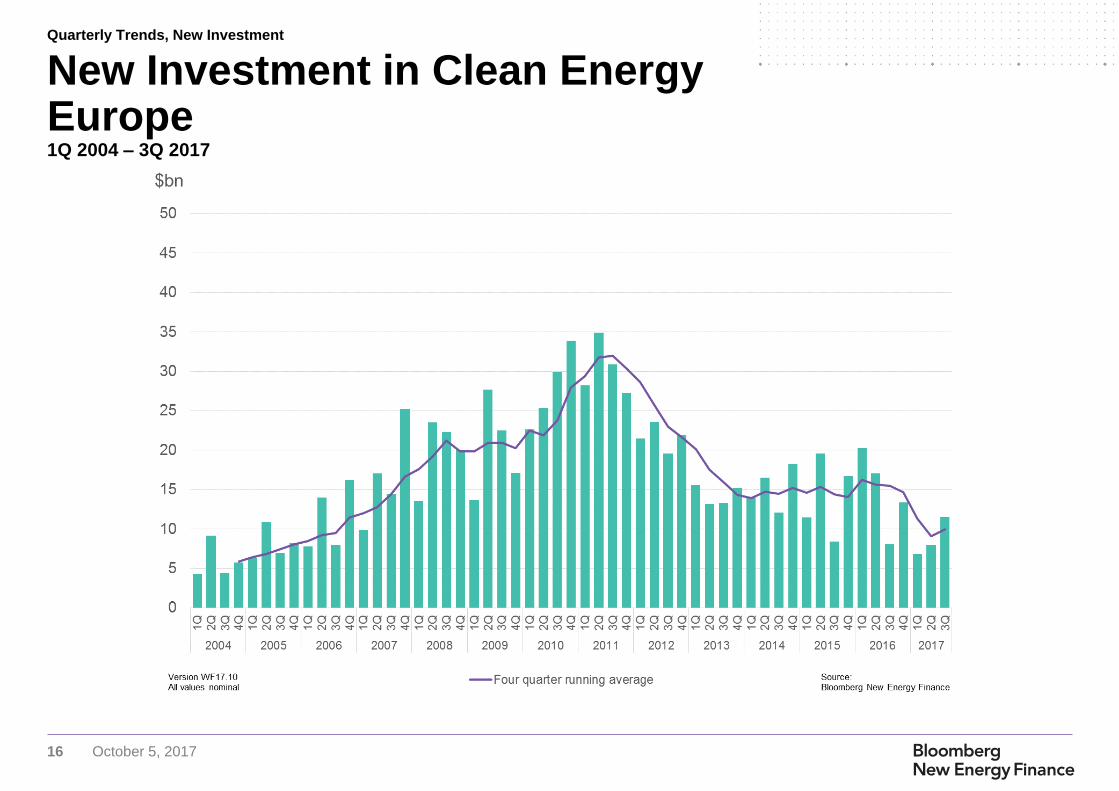
New Investment in Clean Energy Europe1Q 2004 – 3Q 2017
Quarterly Trends, New Investment
17 October 5, 2017
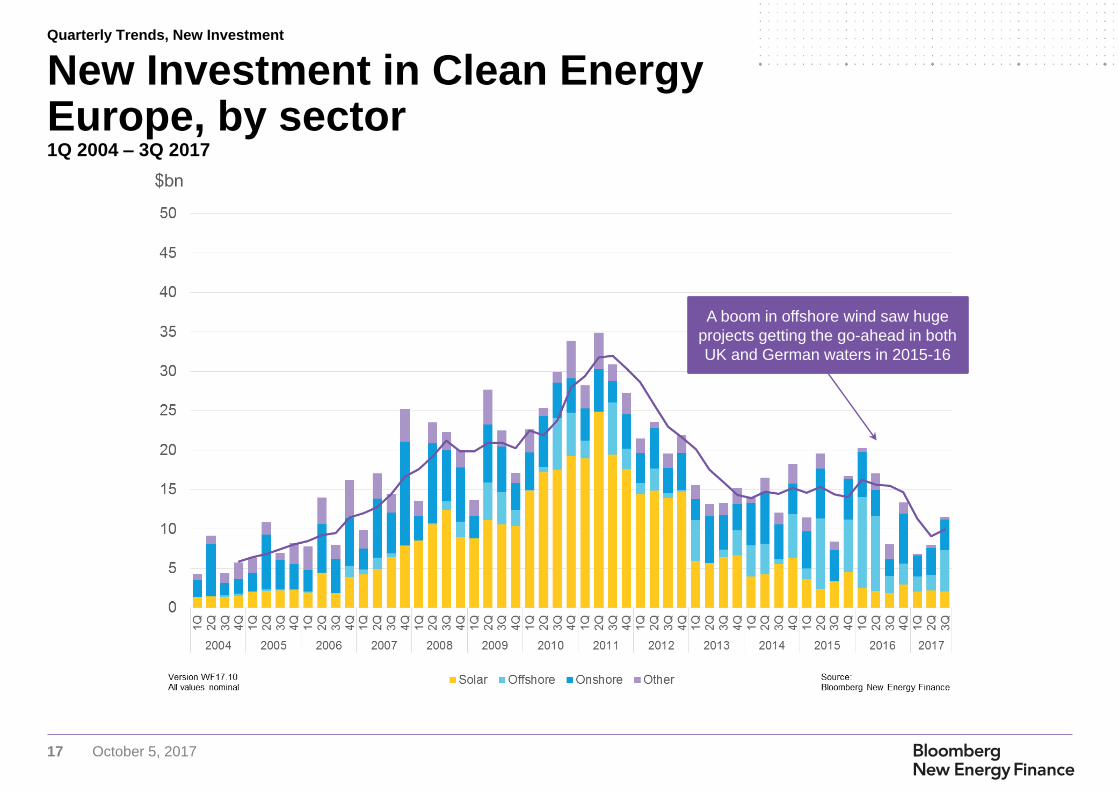
New Investment in Clean Energy Europe, by sector1Q 2004 – 3Q 2017
A boom in offshore wind saw huge
projects getting the go-ahead in both
UK and German waters in 2015-16
Quarterly Trends, New Investment
18 October 5, 2017
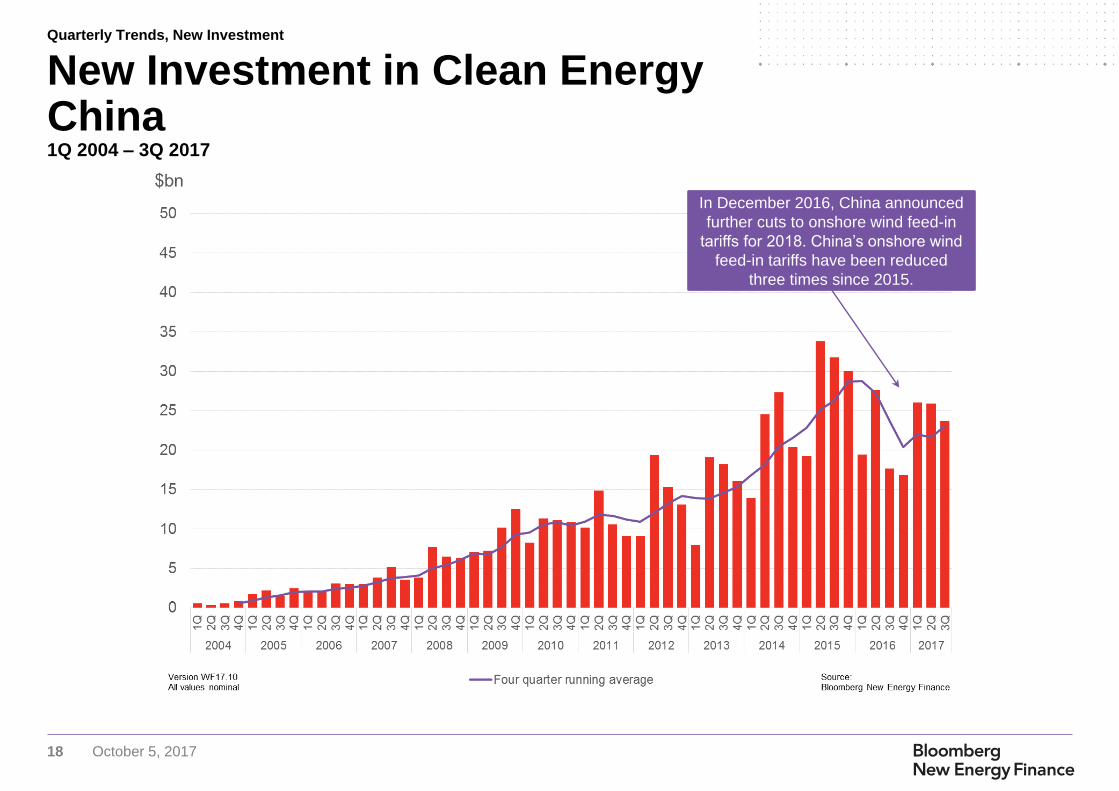
New Investment in Clean Energy China1Q 2004 – 3Q 2017
In December 2016, China announced
further cuts to onshore wind feed-in
tariffs for 2018. China’s onshore wind
feed-in tariffs have been reduced
three times since 2015.
Quarterly Trends, New Investment
19 October 5, 2017
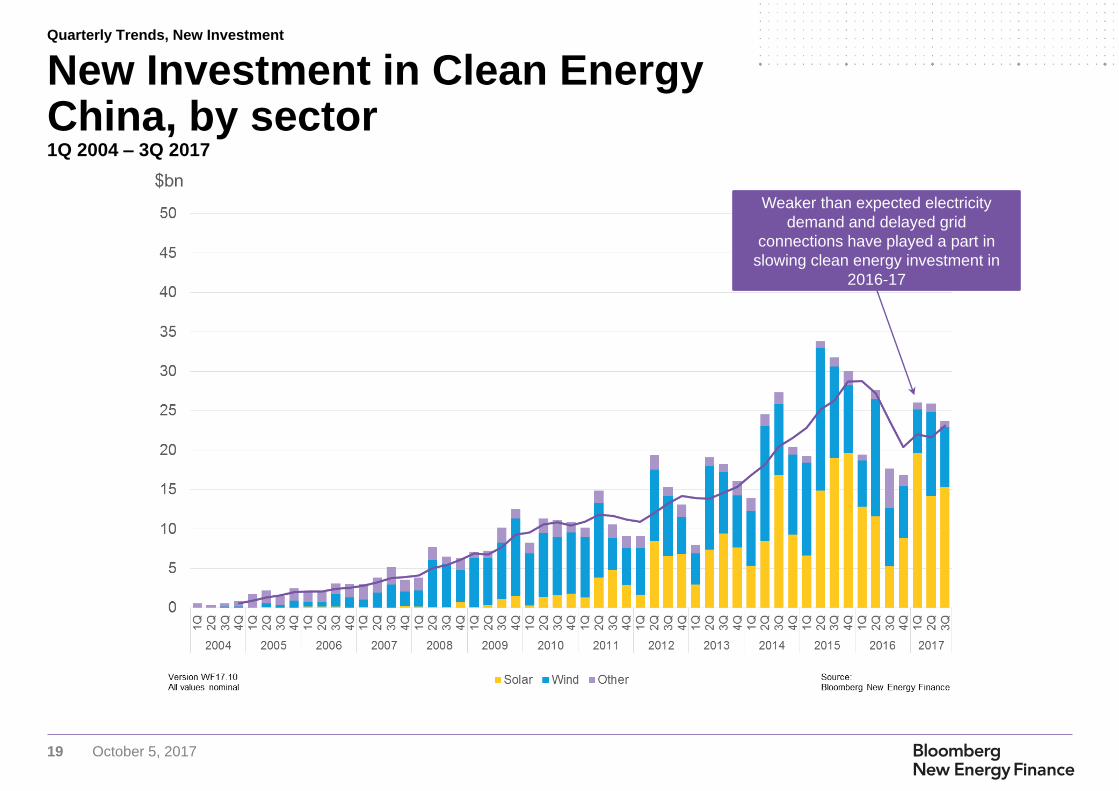
New Investment in Clean Energy China, by sector1Q 2004 – 3Q 2017
Weaker than expected electricity
demand and delayed grid
connections have played a part in
slowing clean energy investment in
2016-17
Quarterly Trends, New Investment
20 October 5, 2017
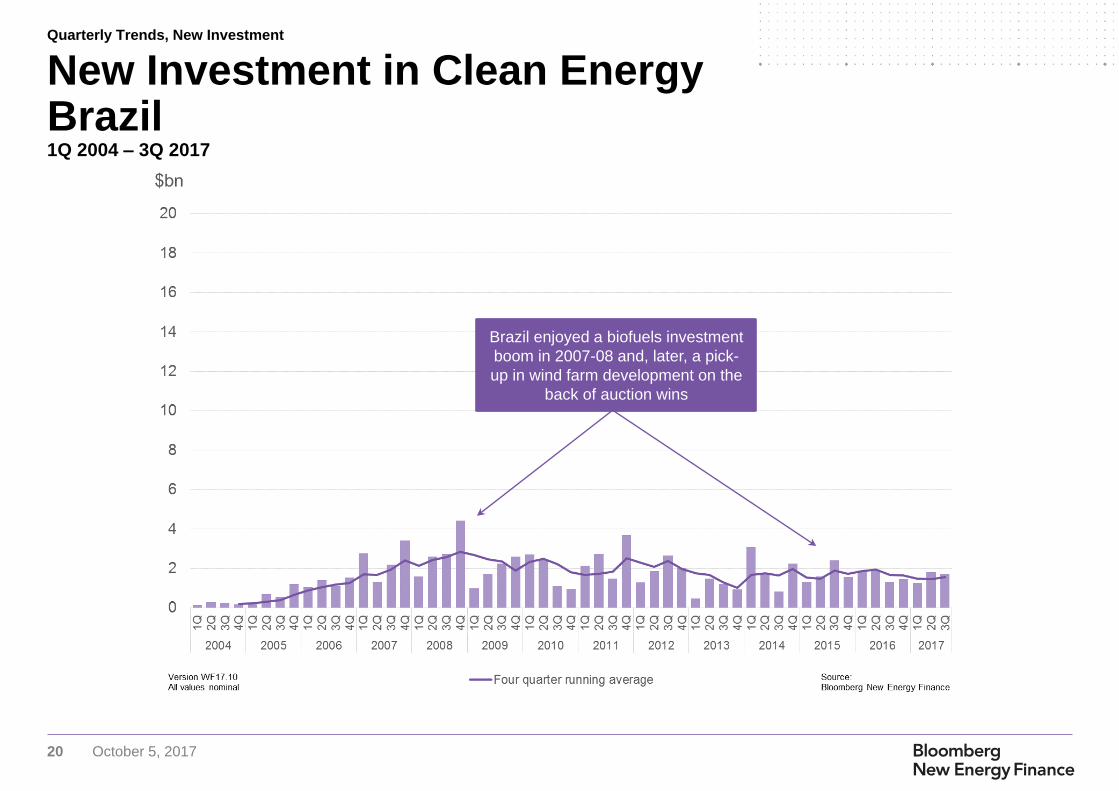
New Investment in Clean Energy Brazil1Q 2004 – 3Q 2017
Brazil enjoyed a biofuels investment
boom in 2007-08 and, later, a pick-
up in wind farm development on the
back of auction wins
Quarterly Trends, New Investment
21 October 5, 2017
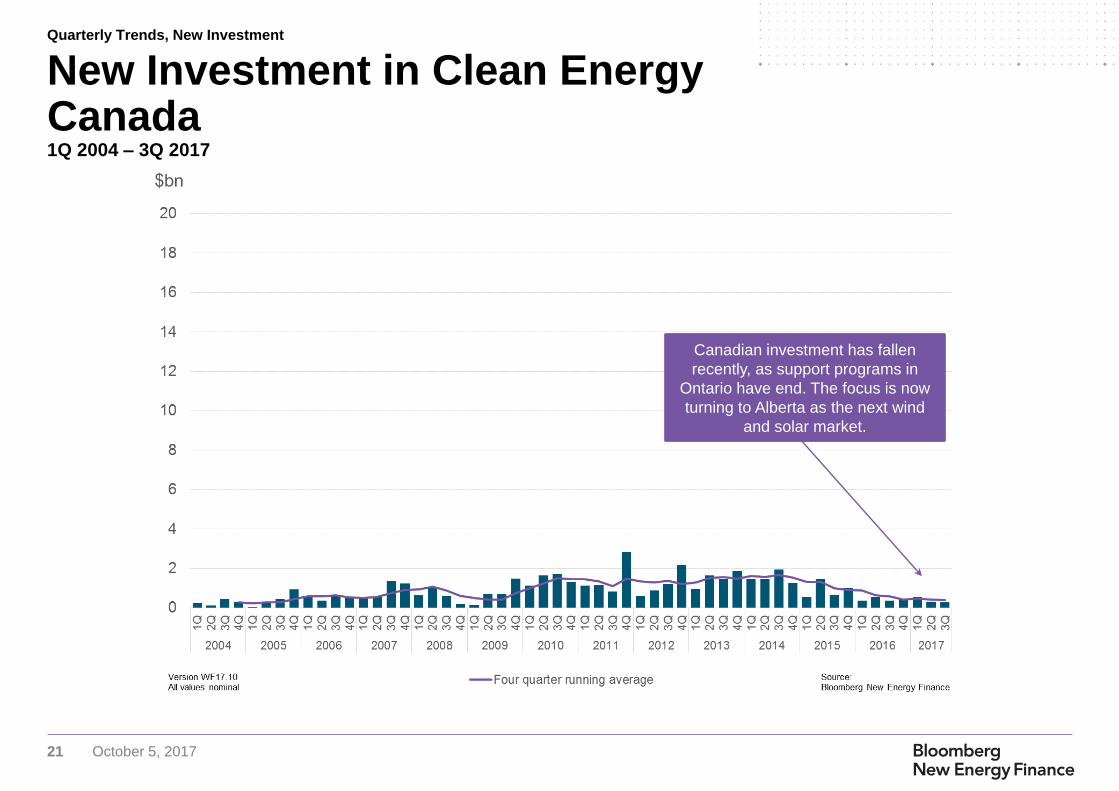
New Investment in Clean Energy Canada1Q 2004 – 3Q 2017
Canadian investment has fallen
recently, as support programs in
Ontario have end. The focus is now
turning to Alberta as the next wind
and solar market.
Quarterly Trends, New Investment
22 October 5, 2017
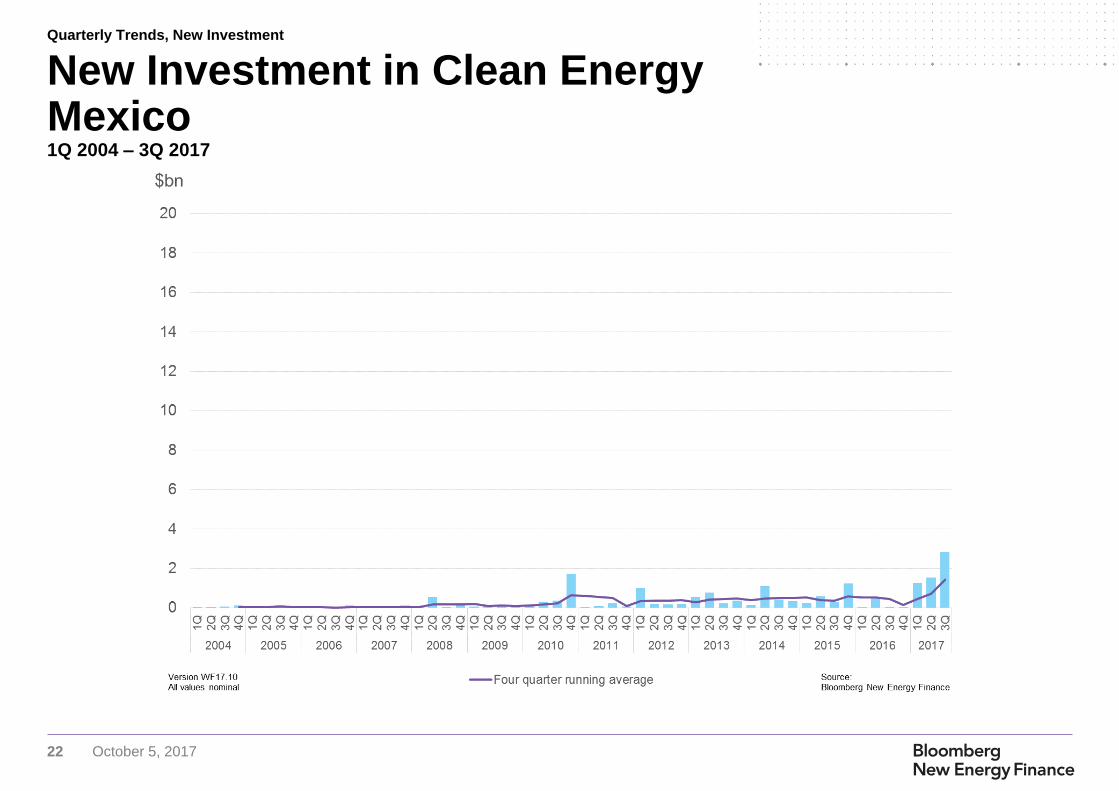
New Investment in Clean Energy Mexico1Q 2004 – 3Q 2017
Quarterly Trends, New Investment
23 October 5, 2017
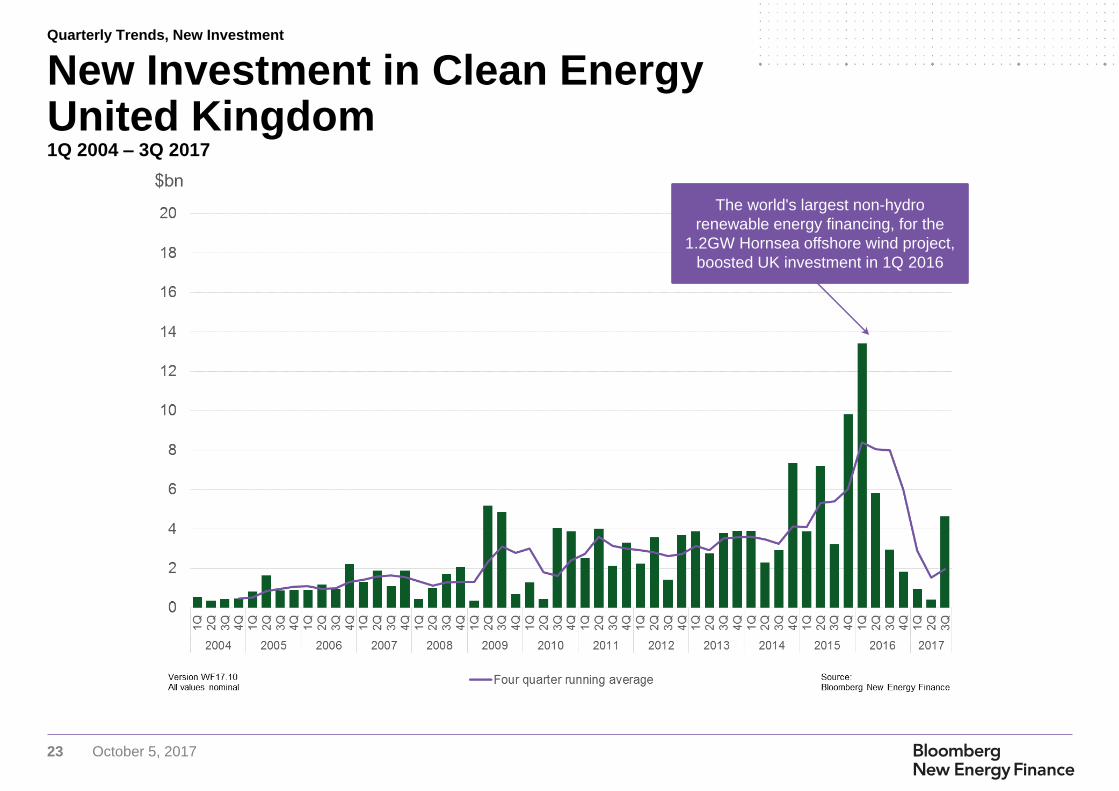
New Investment in Clean Energy United Kingdom1Q 2004 – 3Q 2017
The world's largest non-hydro
renewable energy financing, for the
1.2GW Hornsea offshore wind project,
boosted UK investment in 1Q 2016
Quarterly Trends, New Investment
24 October 5, 2017
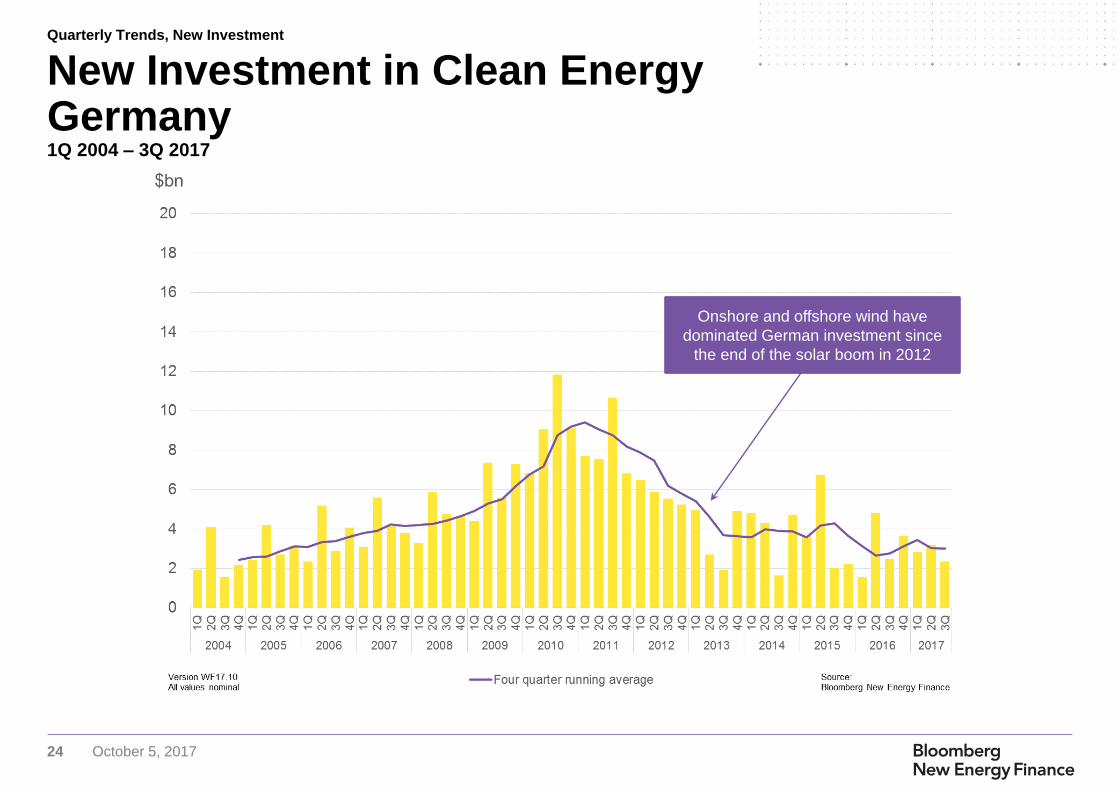
New Investment in Clean Energy Germany1Q 2004 – 3Q 2017
Onshore and offshore wind have
dominated German investment since
the end of the solar boom in 2012
Quarterly Trends, New Investment
25 October 5, 2017
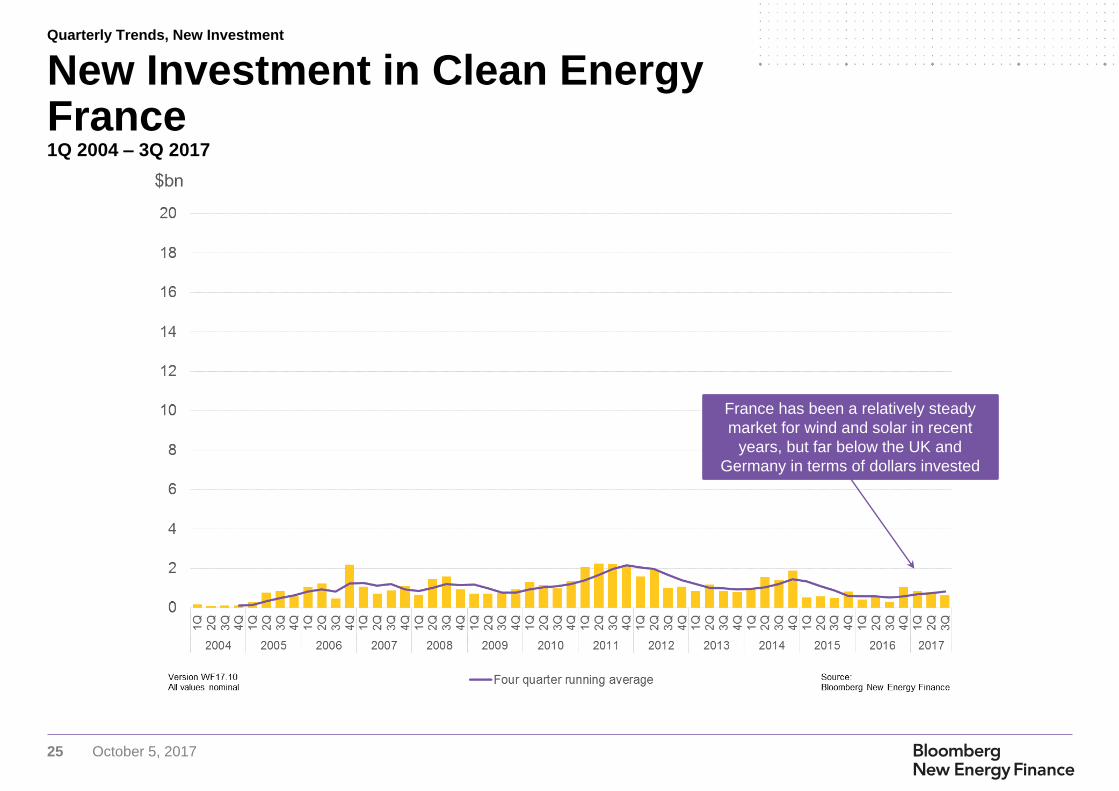
New Investment in Clean Energy France1Q 2004 – 3Q 2017
France has been a relatively steady
market for wind and solar in recent
years, but far below the UK and
Germany in terms of dollars invested
Quarterly Trends, New Investment
26 October 5, 2017
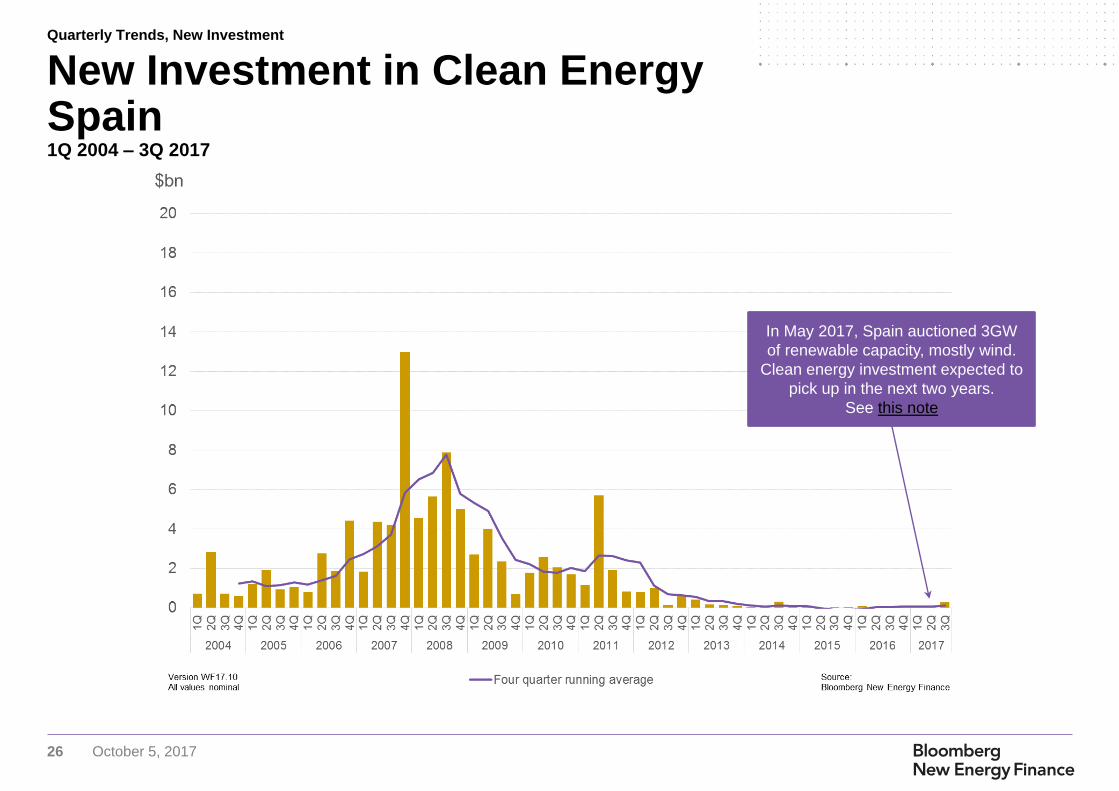
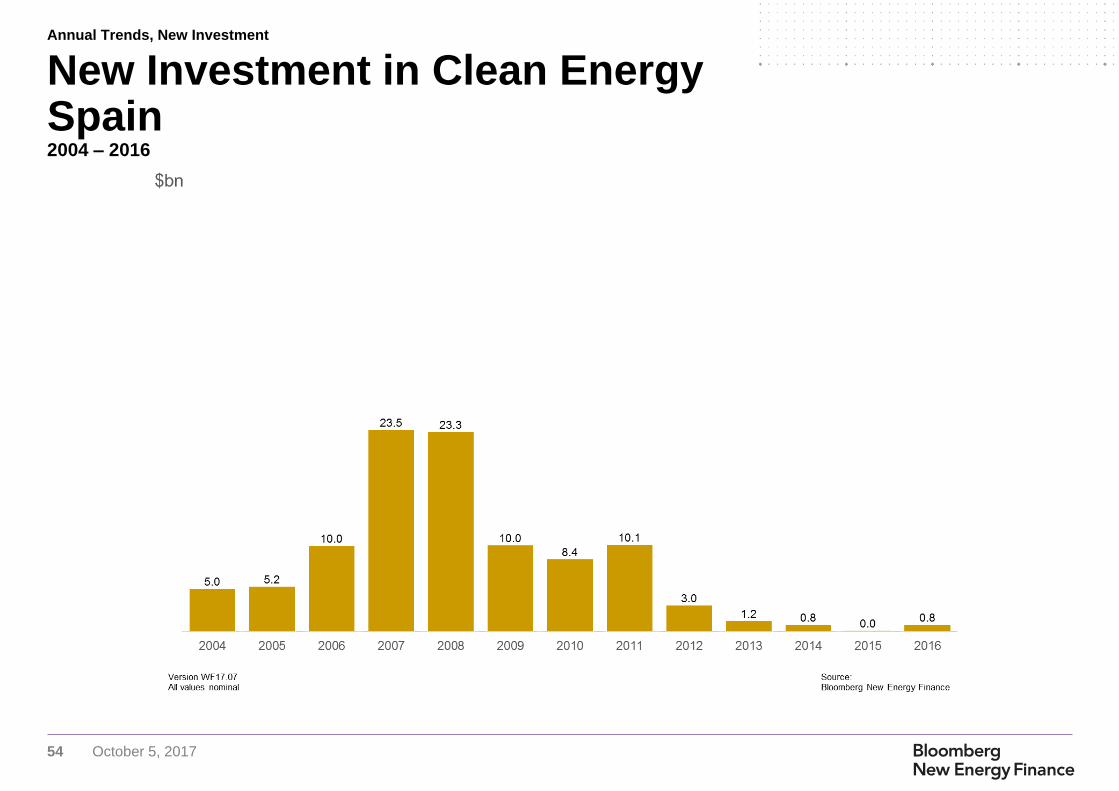
New Investment in Clean Energy Spain1Q 2004 – 3Q 2017
In May 2017, Spain auctioned 3GW
of renewable capacity, mostly wind.
Clean energy investment expected to
pick up in the next two years.
See this note
Quarterly Trends, New Investment
27 October 5, 2017
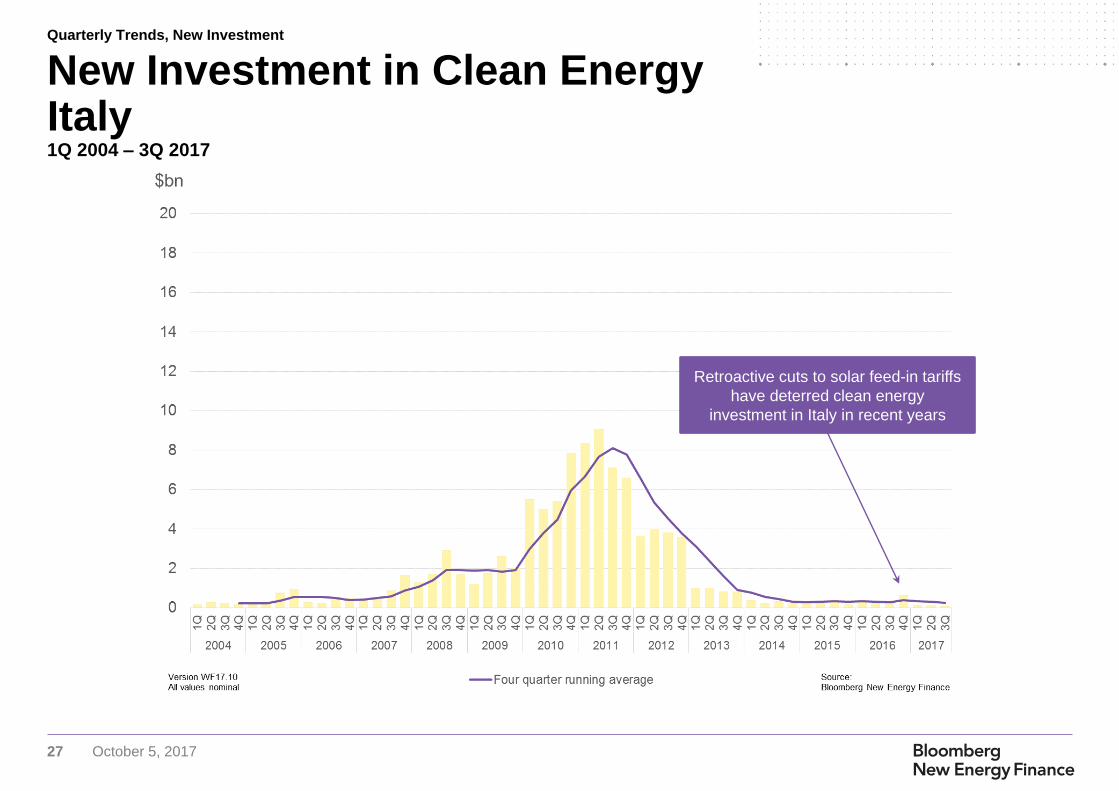
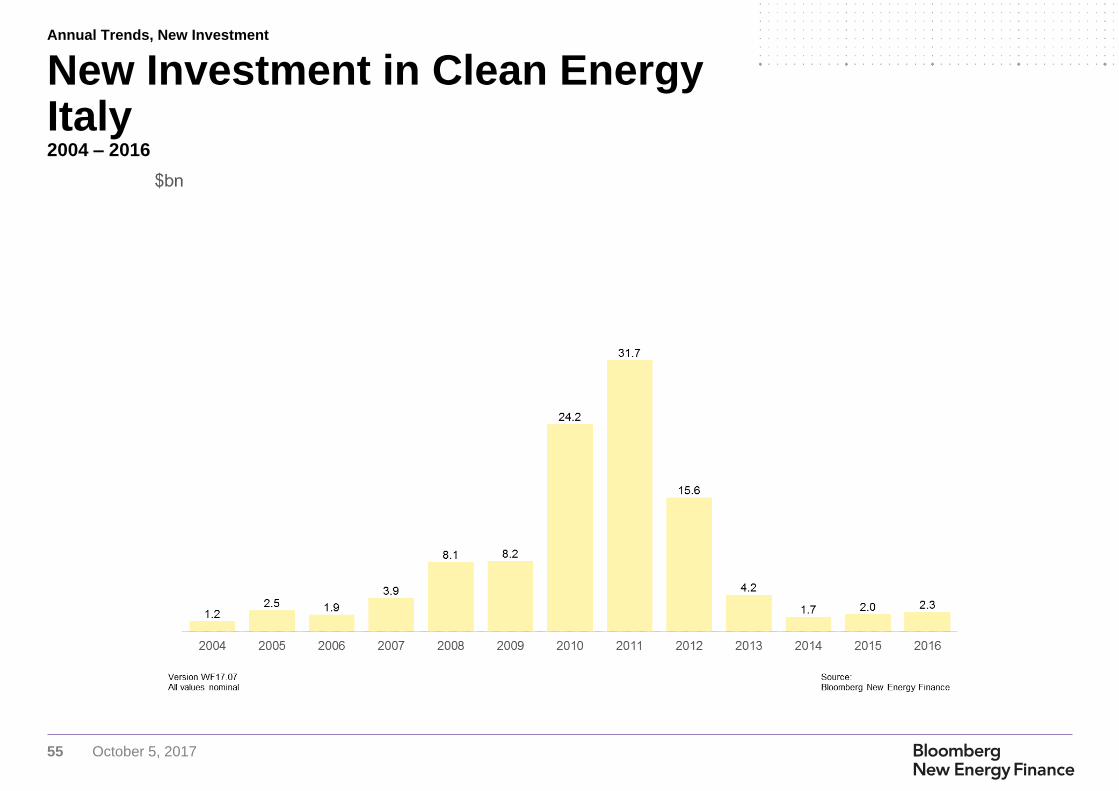
New Investment in Clean Energy Italy1Q 2004 – 3Q 2017
Retroactive cuts to solar feed-in tariffs
have deterred clean energy
investment in Italy in recent years
Quarterly Trends, New Investment
28 October 5, 2017
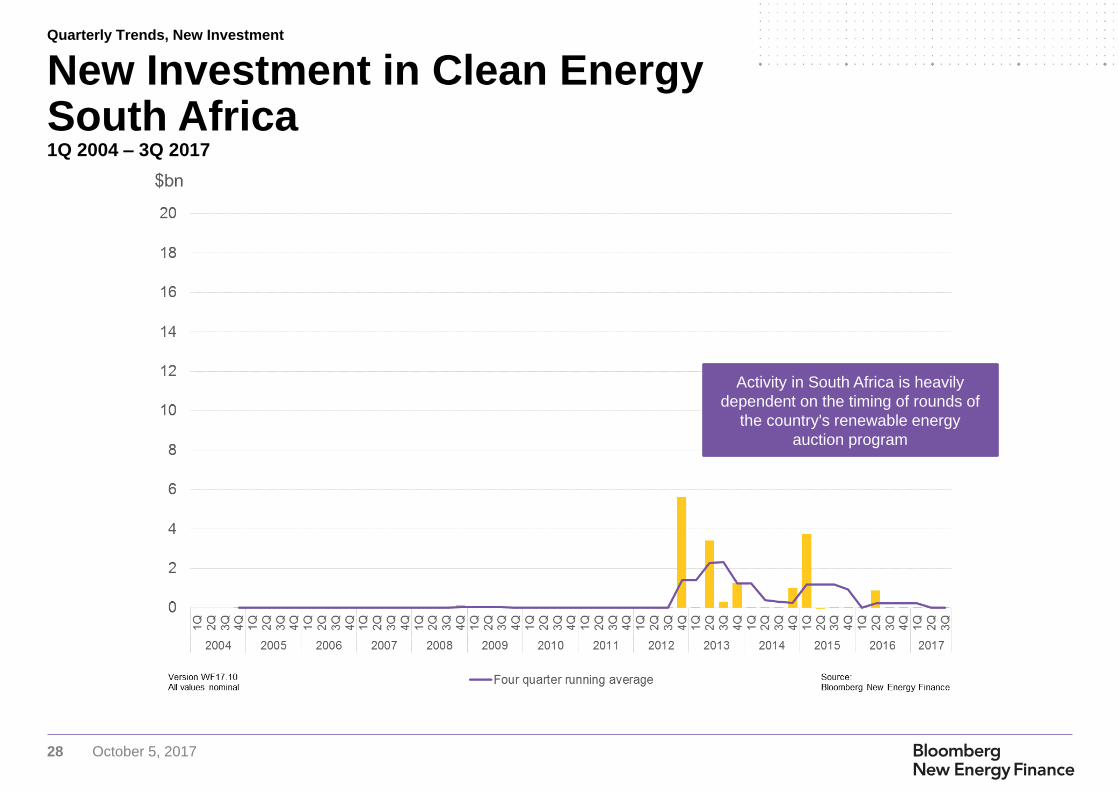
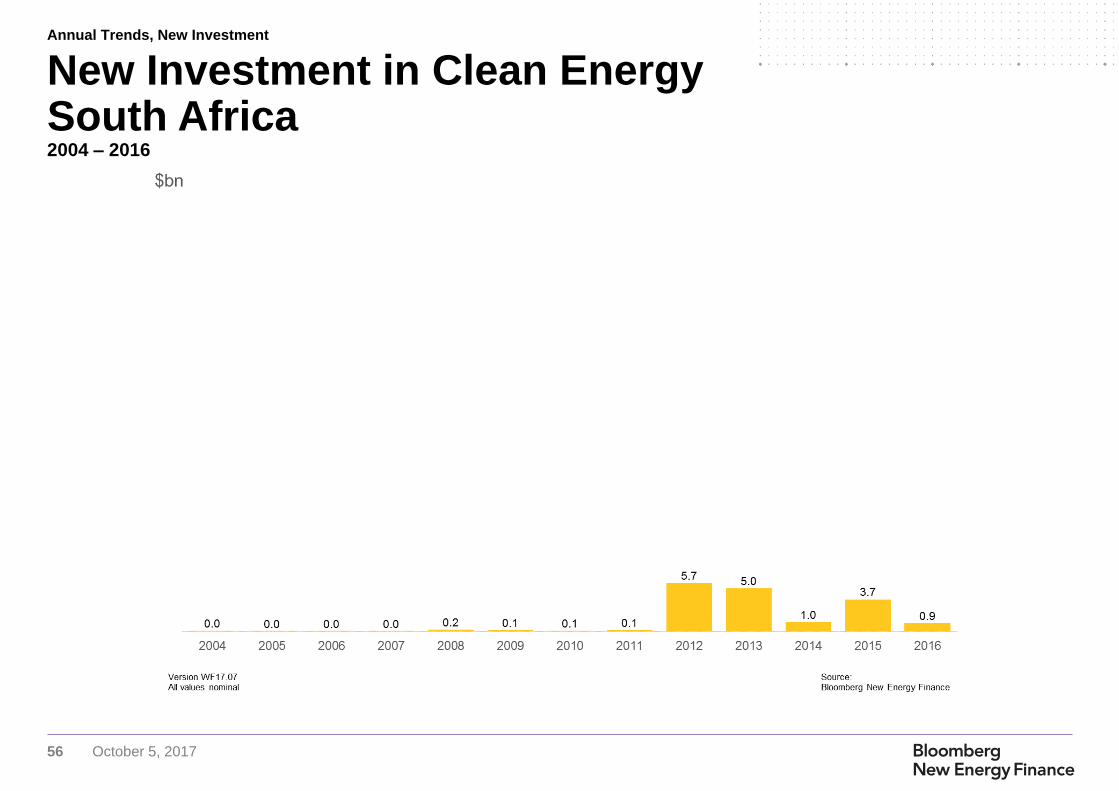
New Investment in Clean Energy South Africa1Q 2004 – 3Q 2017
Activity in South Africa is heavily
dependent on the timing of rounds of
the country's renewable energy
auction program
Quarterly Trends, New Investment
29 October 5, 2017
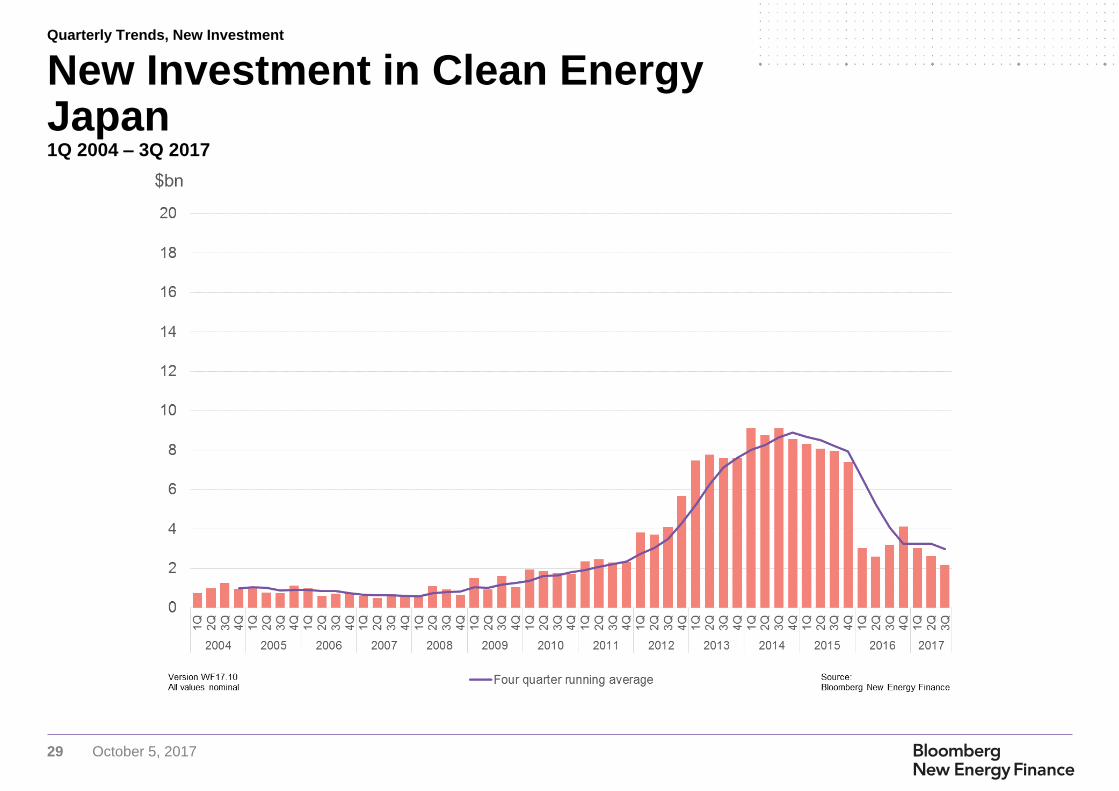
New Investment in Clean Energy Japan1Q 2004 – 3Q 2017
Quarterly Trends, New Investment
30 October 5, 2017
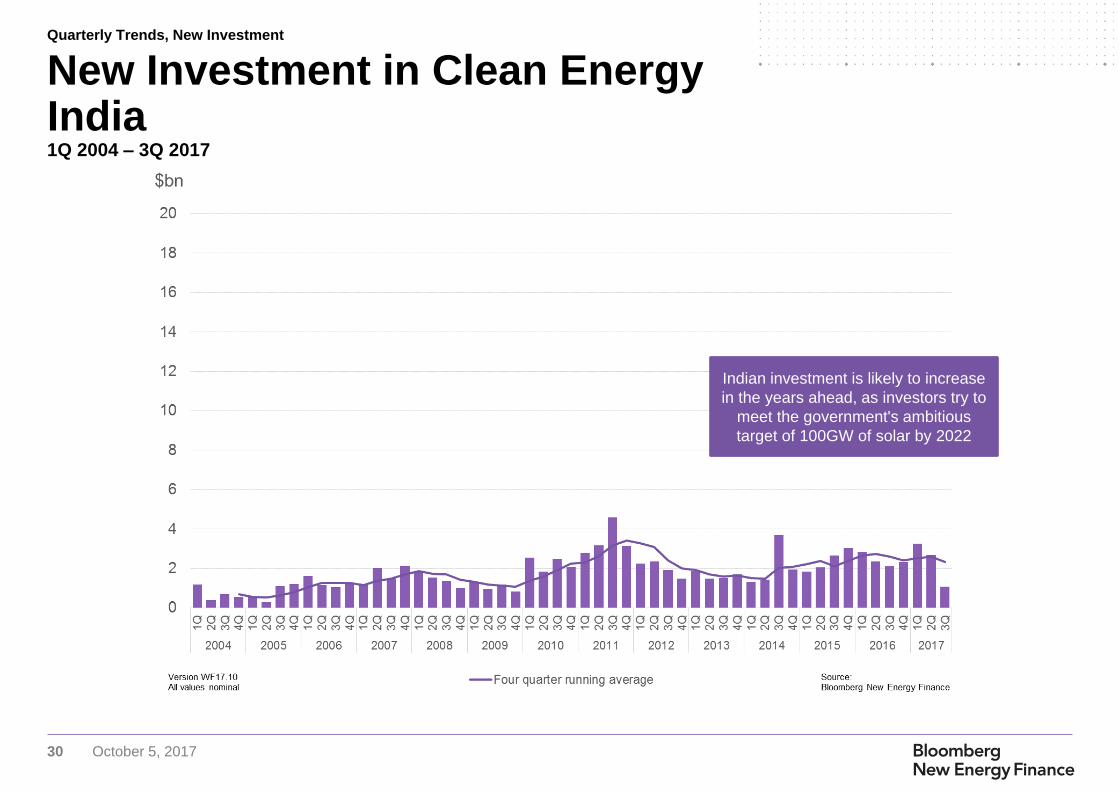
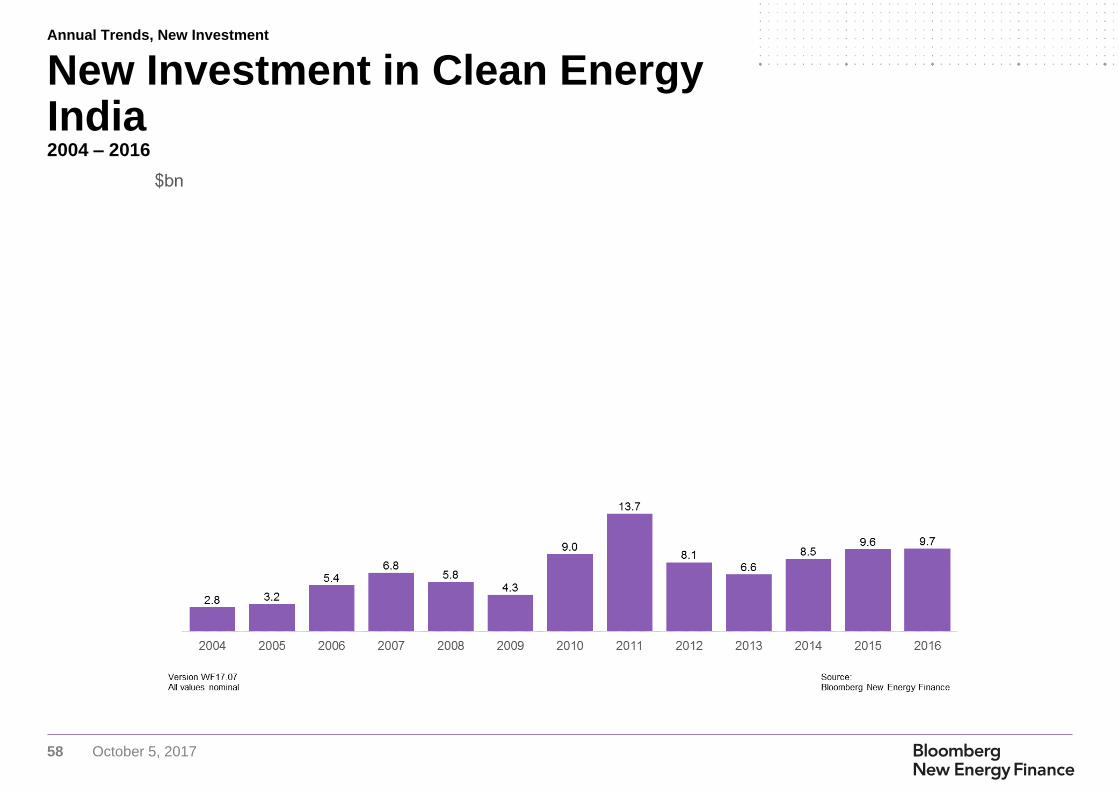
New Investment in Clean Energy India1Q 2004 – 3Q 2017
Indian investment is likely to increase
in the years ahead, as investors try to
meet the government's ambitious
target of 100GW of solar by 2022
Quarterly Trends, New Investment
31 October 5, 2017
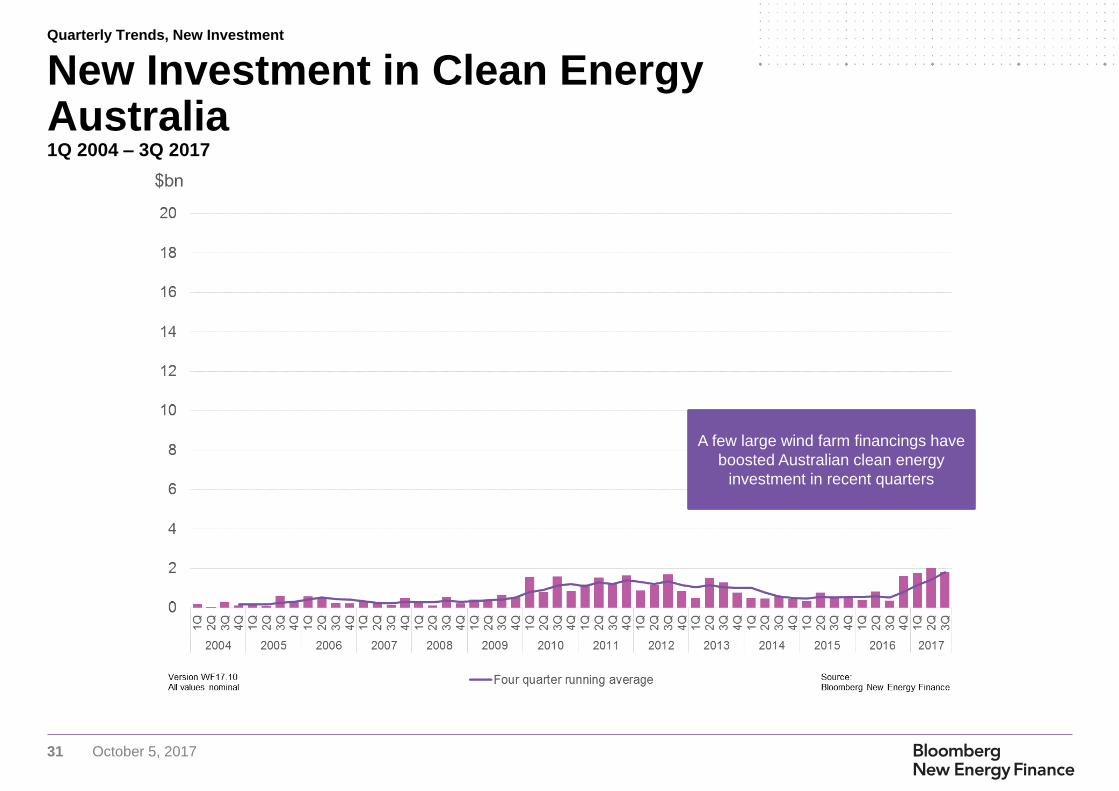
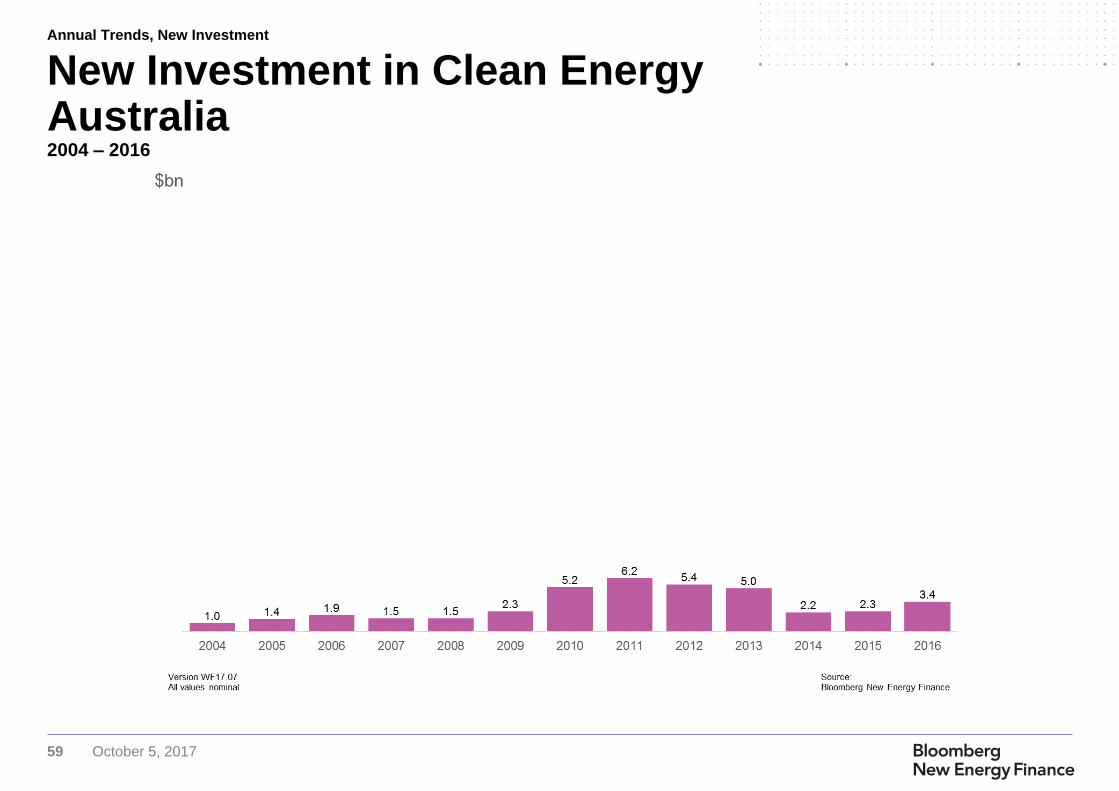
New Investment in Clean Energy Australia1Q 2004 – 3Q 2017
A few large wind farm financings have
boosted Australian clean energy
investment in recent quarters
Quarterly Trends, New Investment
32 October 5, 2017
Quarterly Trends,
Funds in Circulation
Quarterly trends since 1Q 2004
33 October 5, 2017
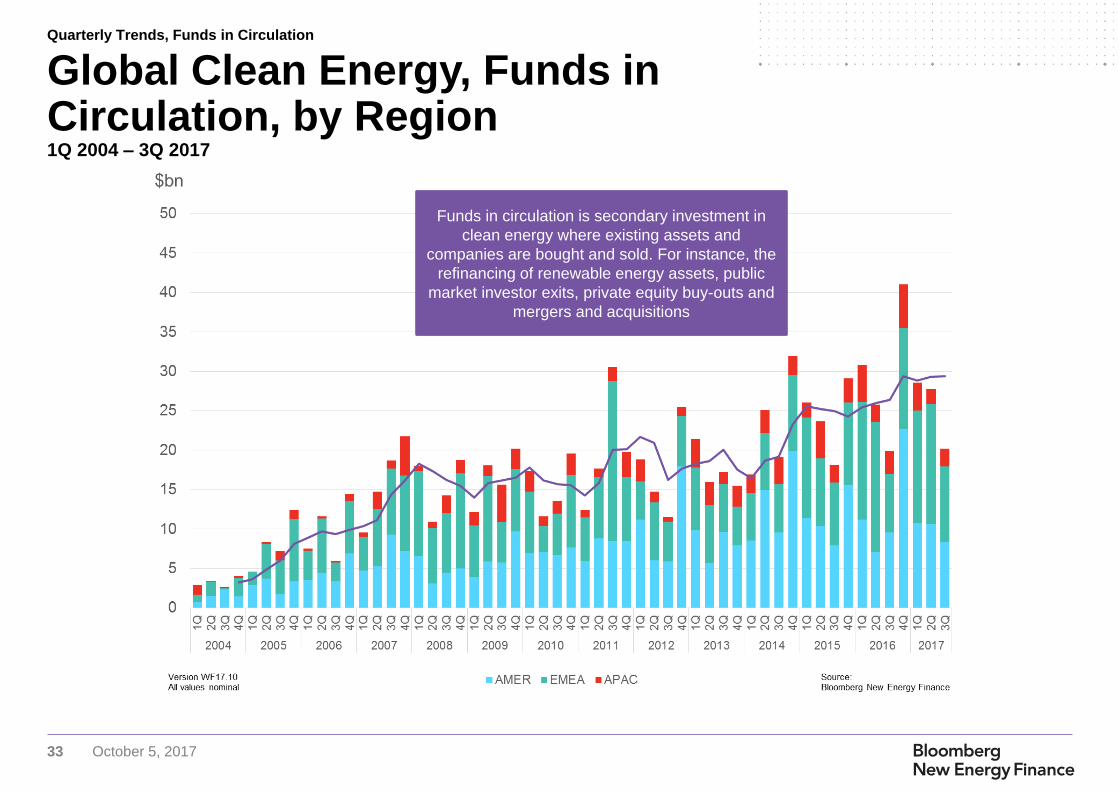
Global Clean Energy, Funds in Circulation, by Region1Q 2004 – 3Q 2017
Funds in circulation is secondary investment in
clean energy where existing assets and
companies are bought and sold. For instance, the
refinancing of renewable energy assets, public
market investor exits, private equity buy-outs and
mergers and acquisitions
Quarterly Trends, Funds in Circulation
34 October 5, 2017
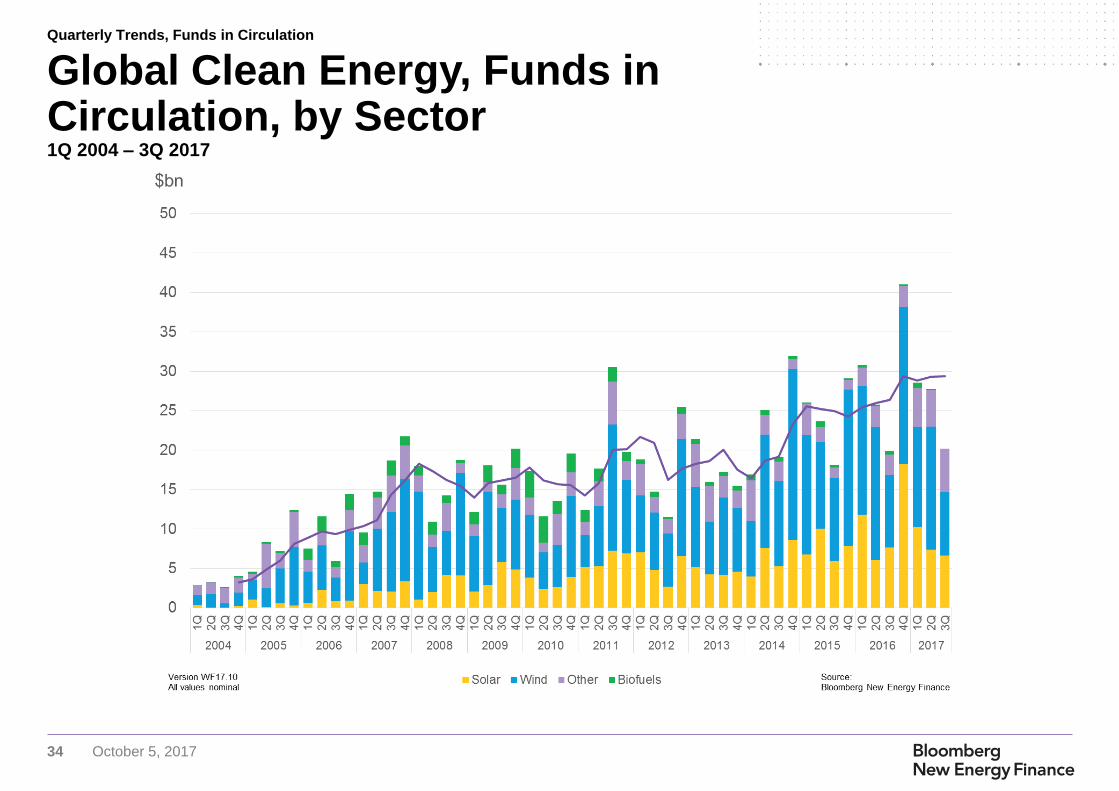
Global Clean Energy, Funds in Circulation, by Sector1Q 2004 – 3Q 2017
Quarterly Trends, Funds in Circulation
35 October 5, 2017
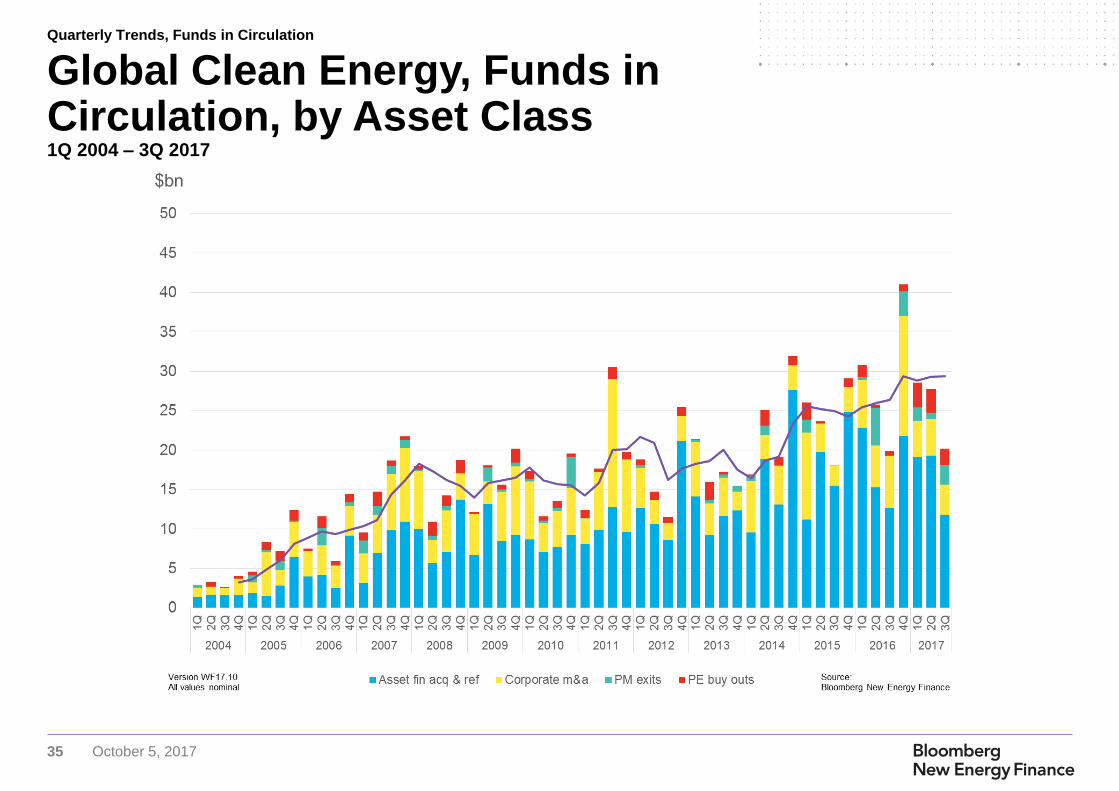
Global Clean Energy, Funds in Circulation, by Asset Class1Q 2004 – 3Q 2017
Quarterly Trends, Funds in Circulation
36 October 5, 2017
Top Deals
Top Quarterly Deals for 3Q 2017
37 October 5, 2017
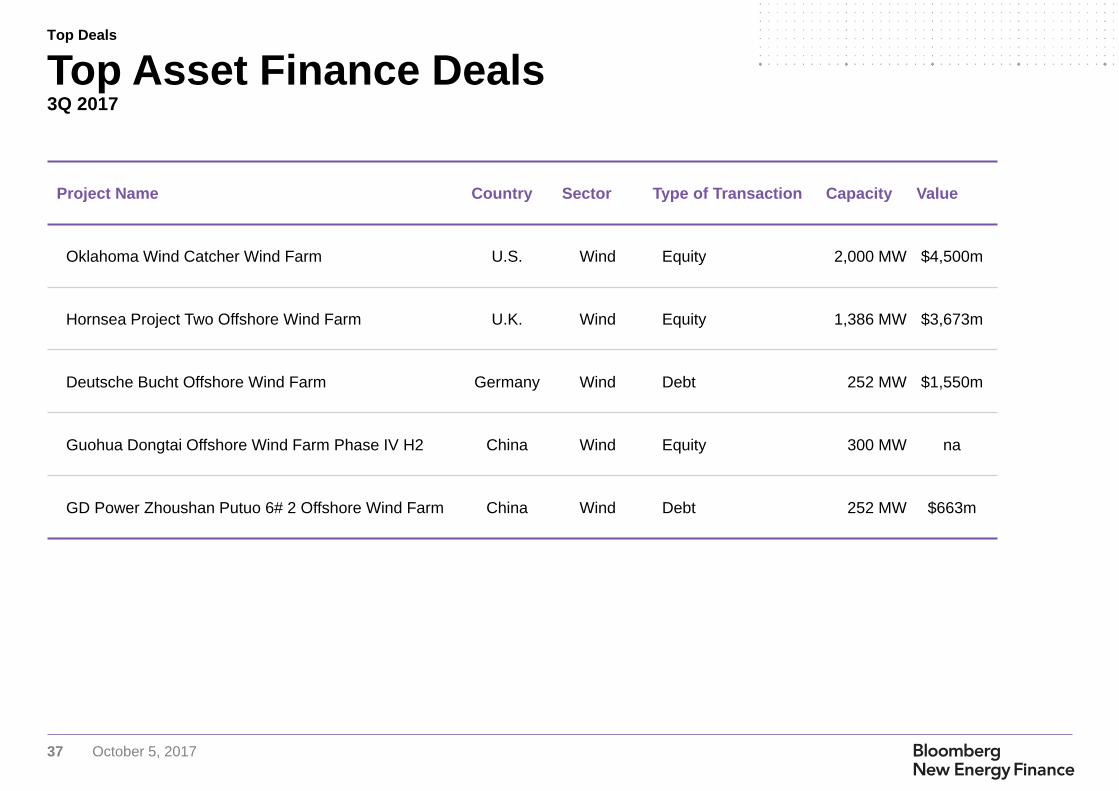
Project Name Country Sector Type of Transaction Capacity Value
Oklahoma Wind Catcher Wind Farm U.S. Wind Equity 2,000 MW $4,500m
Hornsea Project Two Offshore Wind Farm U.K. Wind Equity 1,386 MW $3,673m
Deutsche Bucht Offshore Wind Farm Germany Wind Debt 252 MW $1,550m
Guohua Dongtai Offshore Wind Farm Phase IV H2 China Wind Equity 300 MW na
GD Power Zhoushan Putuo 6# 2 Offshore Wind Farm China Wind Debt 252 MW $663m
Top Asset Finance Deals3Q 2017
Top Deals
38 October 5, 2017
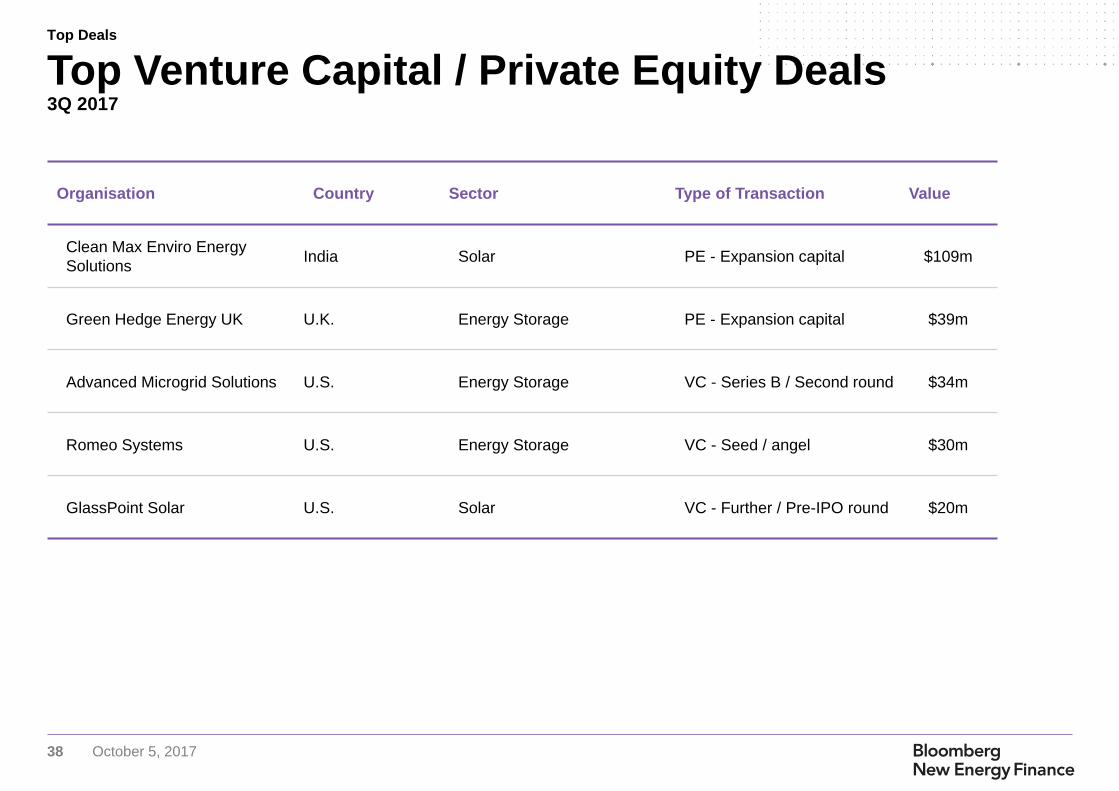
Organisation Country Sector Type of Transaction Value
Clean Max Enviro Energy
SolutionsIndia Solar PE - Expansion capital $109m
Green Hedge Energy UK U.K. Energy Storage PE - Expansion capital $39m
Advanced Microgrid Solutions U.S. Energy Storage VC - Series B / Second round $34m
Romeo Systems U.S. Energy Storage VC - Seed / angel $30m
GlassPoint Solar U.S. Solar VC - Further / Pre-IPO round $20m
Top Venture Capital / Private Equity Deals3Q 2017
Top Deals
39 October 5, 2017
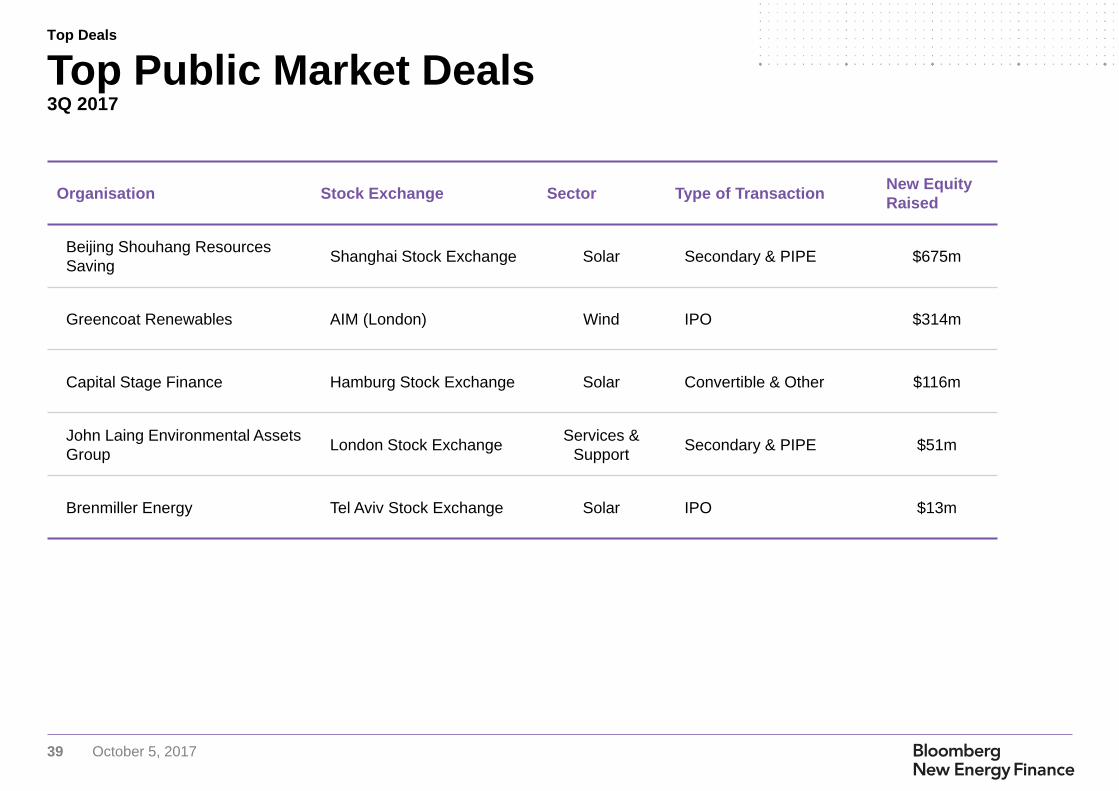
Organisation Stock Exchange Sector Type of TransactionNew Equity
Raised
Beijing Shouhang Resources
SavingShanghai Stock Exchange Solar Secondary & PIPE $675m
Greencoat Renewables AIM (London) Wind IPO $314m
Capital Stage Finance Hamburg Stock Exchange Solar Convertible & Other $116m
John Laing Environmental Assets
GroupLondon Stock Exchange
Services &
SupportSecondary & PIPE $51m
Brenmiller Energy Tel Aviv Stock Exchange Solar IPO $13m
Top Public Market Deals3Q 2017
Top Deals
40 October 5, 2017
Annual Trends, New
Investment
Annual trends since 2004
41 October 5, 2017
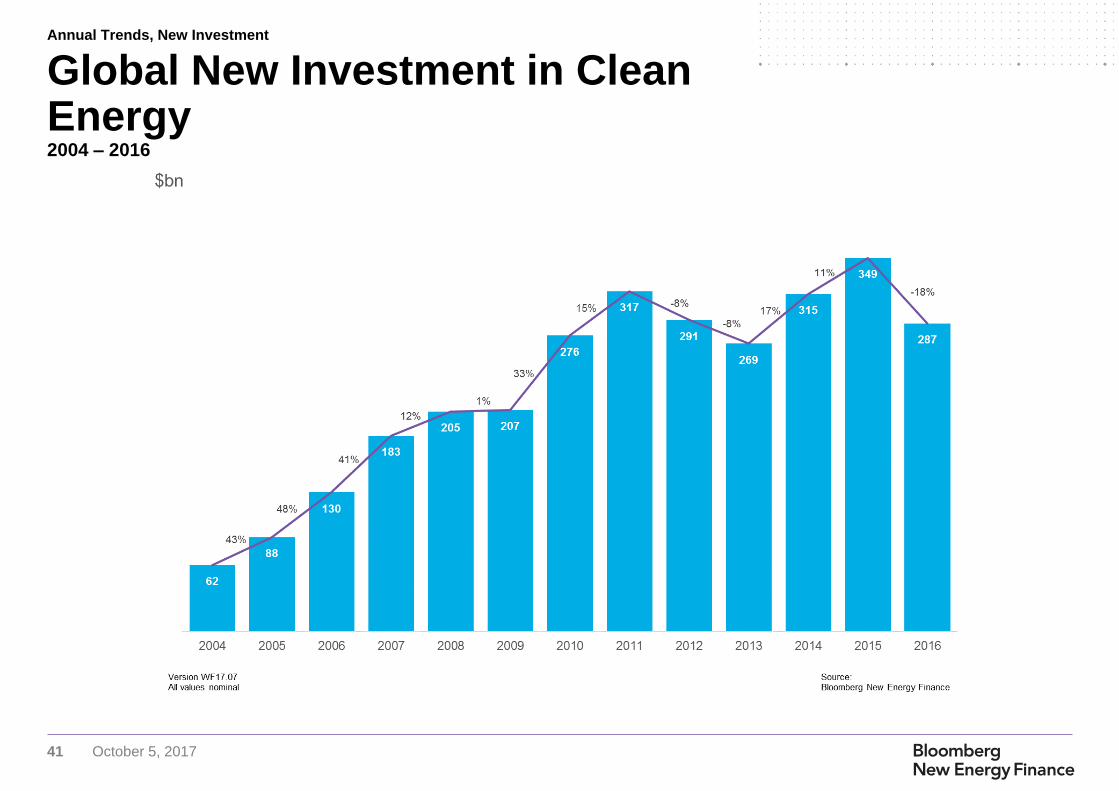
Global New Investment in Clean Energy2004 – 2016
Annual Trends, New Investment
42 October 5, 2017
Global New Investment in Clean Energy by Region2004 – 2016
Annual Trends, New Investment
43 October 5, 2017
Global New Investment in Clean Energy by Sector2004 – 2016
Annual Trends, New Investment
44 October 5, 2017
Global New Investment in Clean Energy by Asset Class2004 – 2016
Annual Trends, New Investment
45 October 5, 2017
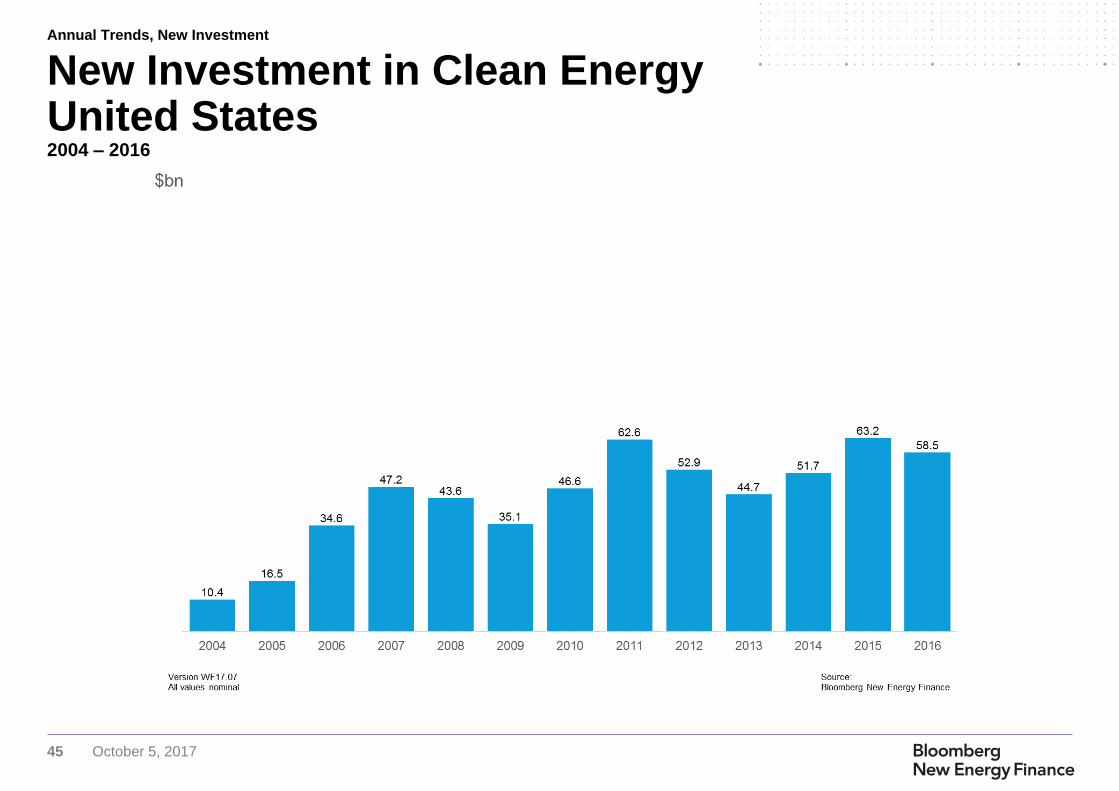
New Investment in Clean Energy United States2004 – 2016
High levels of investment in 2011 came on the
back of spending under the American Recovery
and Reinvestment Act, and a rush to build wind
projects in advance of what would have been the
end of the Production Tax Credit in 2012.
Annual Trends, New Investment
46 October 5, 2017
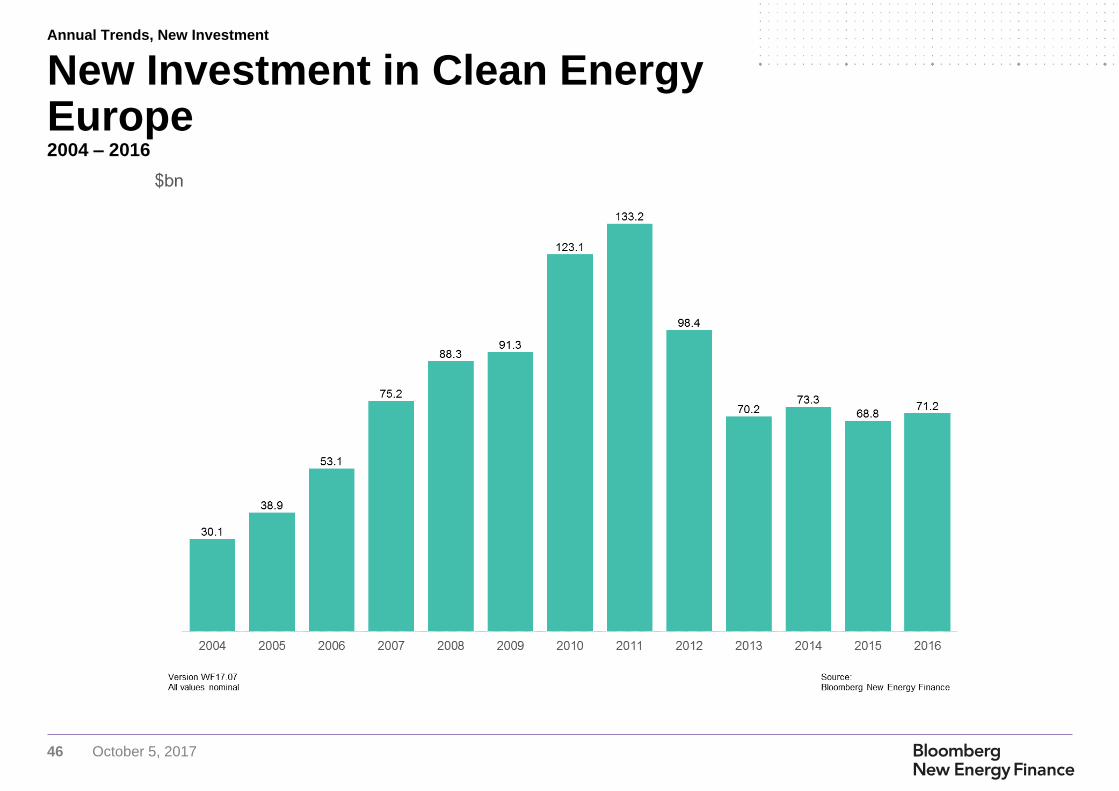
New Investment in Clean Energy Europe2004 – 2016
Annual Trends, New Investment
47 October 5, 2017
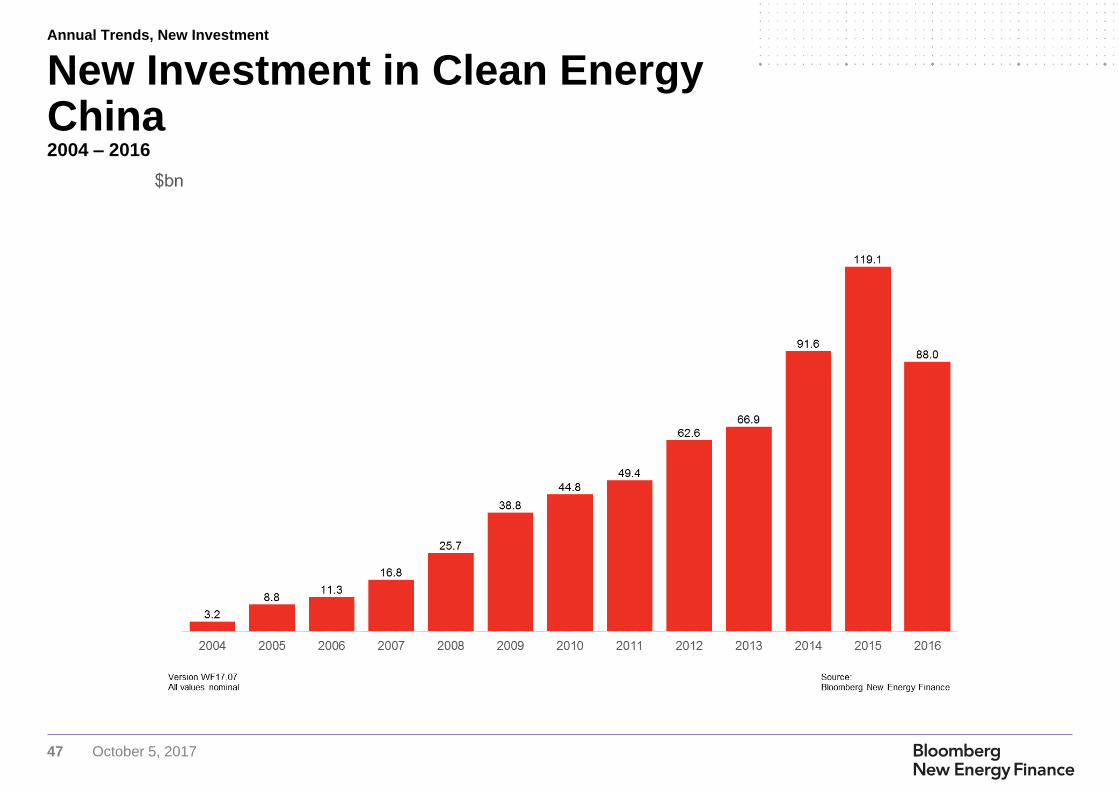
New Investment in Clean Energy China2004 – 2016
Annual Trends, New Investment
48 October 5, 2017
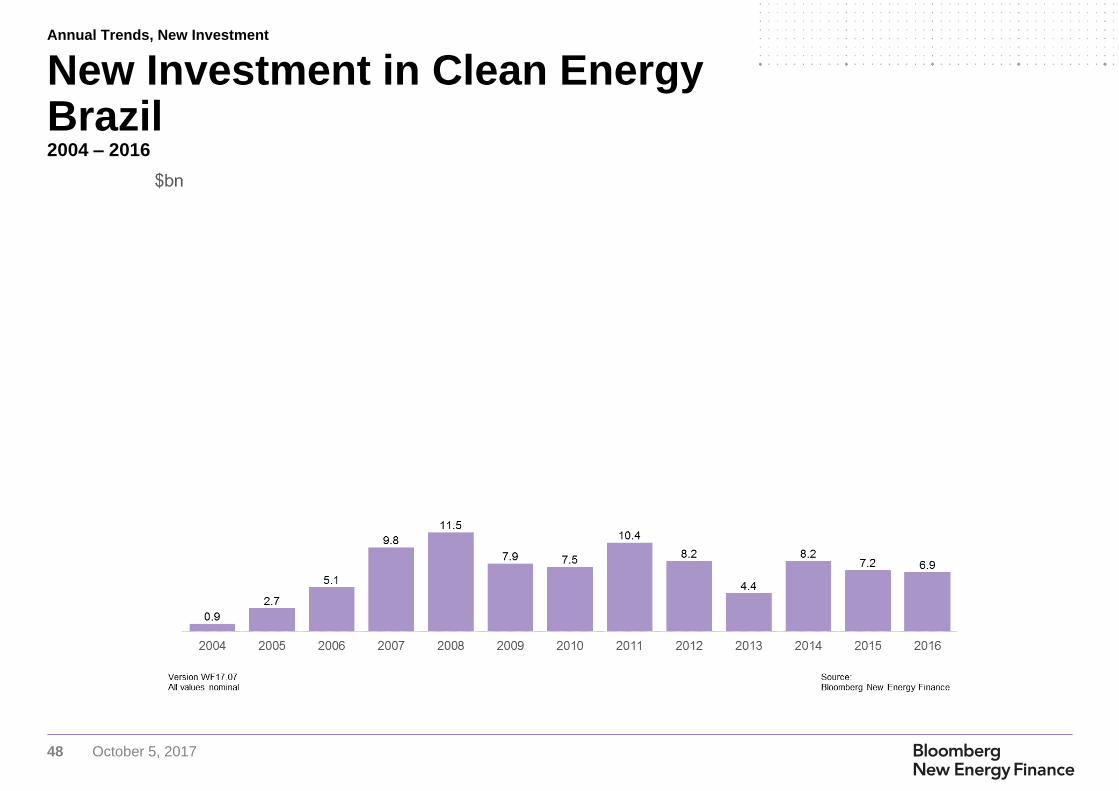
New Investment in Clean Energy Brazil2004 – 2016
Annual Trends, New Investment
49 October 5, 2017
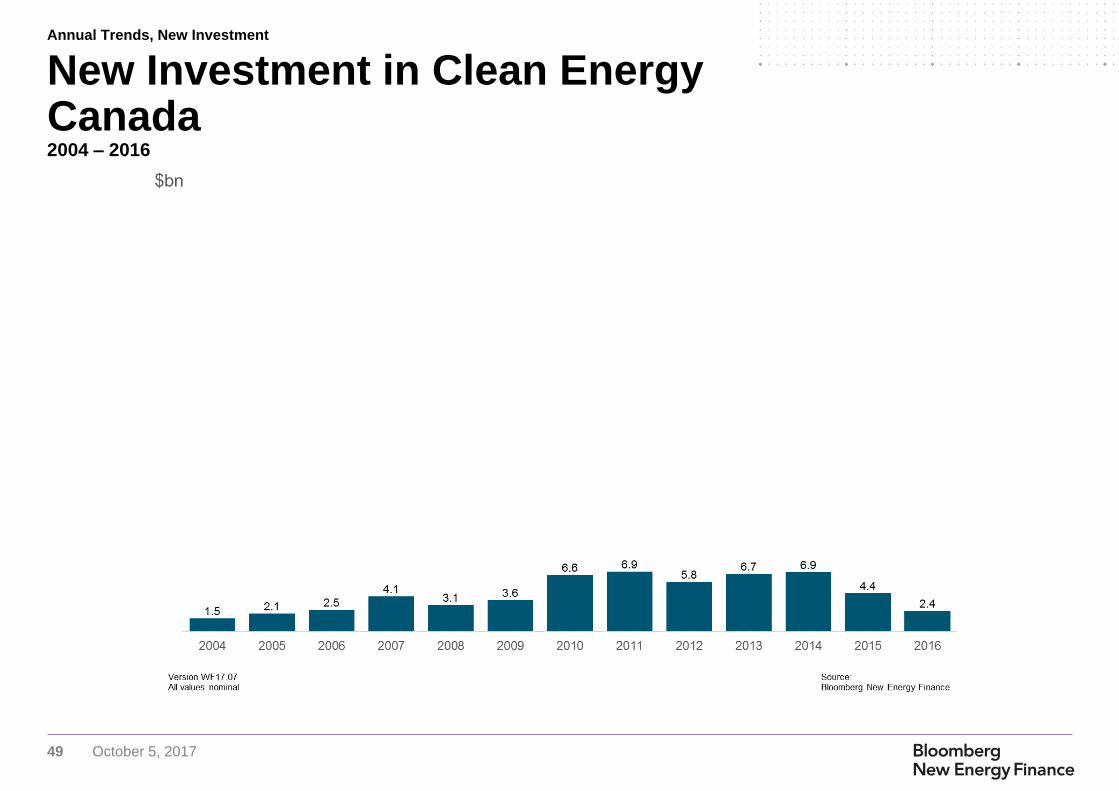
New Investment in Clean Energy Canada2004 – 2016
Annual Trends, New Investment
50 October 5, 2017
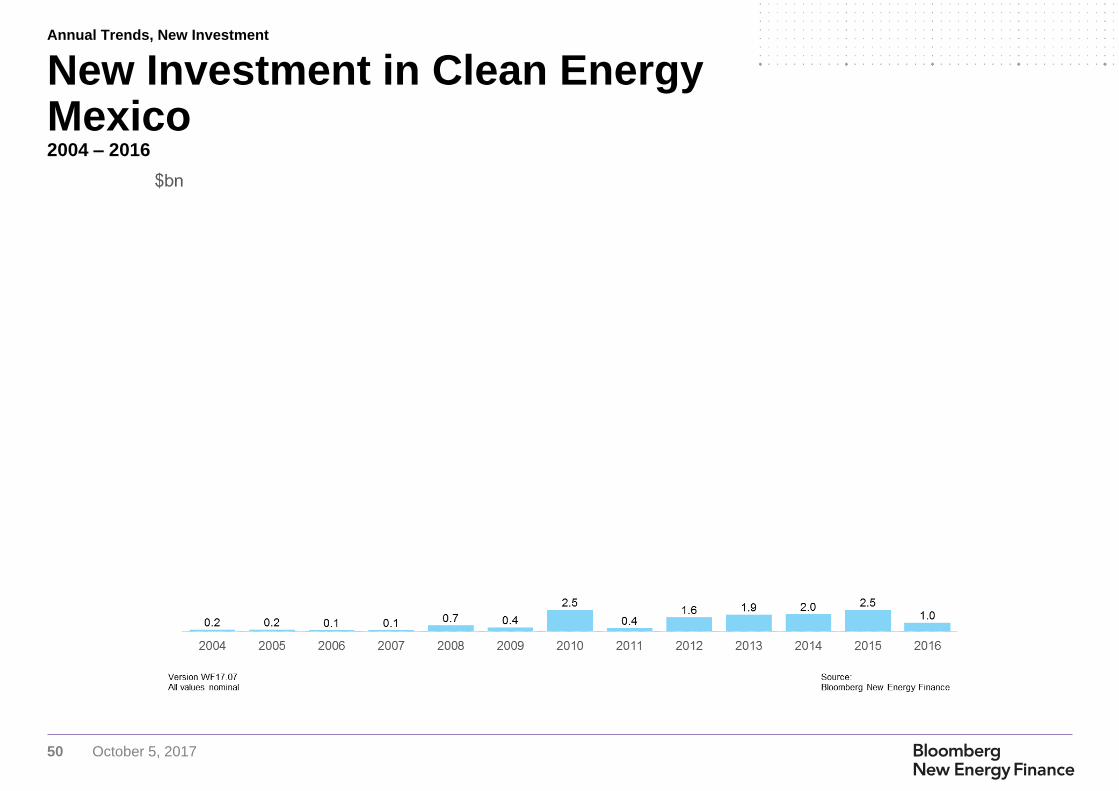
New Investment in Clean Energy Mexico2004 – 2016
Annual Trends, New Investment
51 October 5, 2017
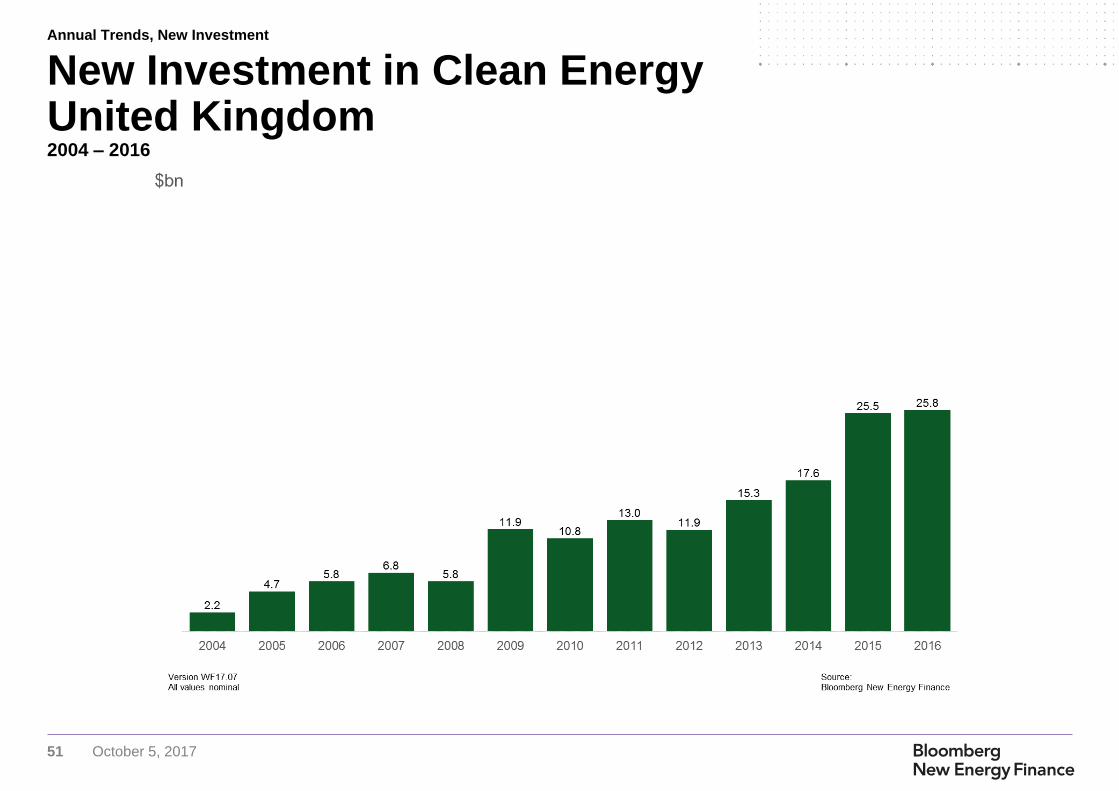
New Investment in Clean Energy United Kingdom2004 – 2016
Annual Trends, New Investment
52 October 5, 2017
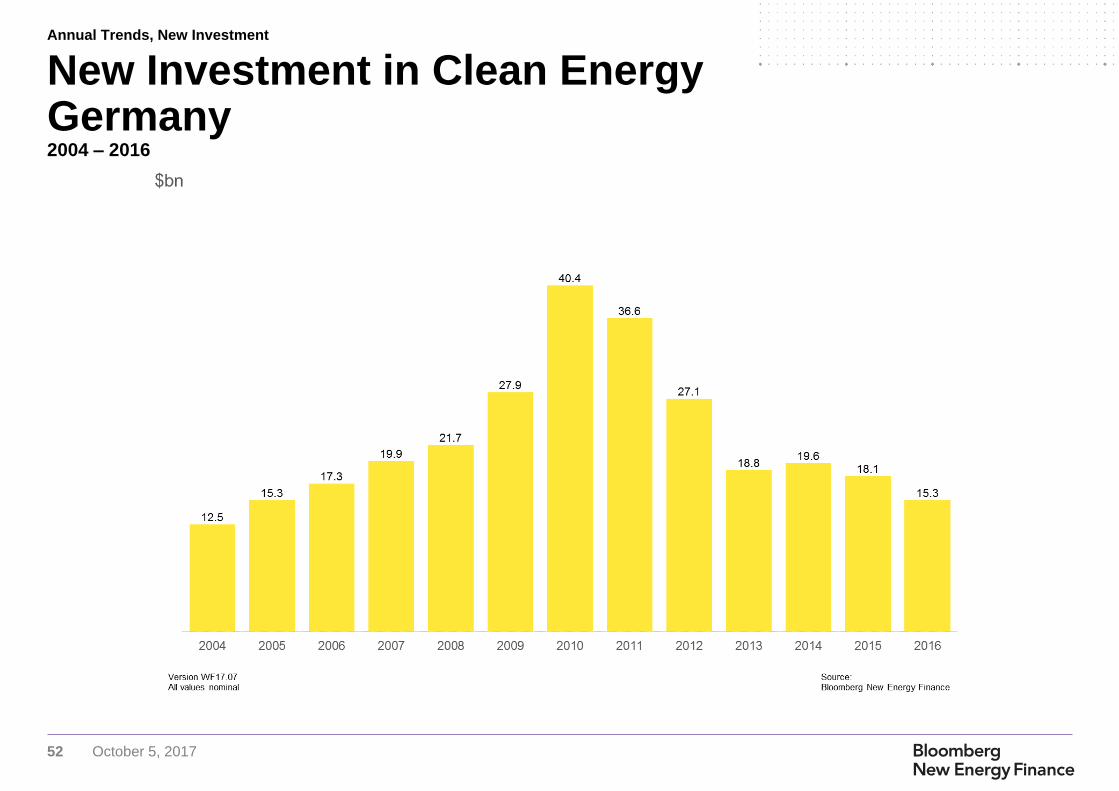
New Investment in Clean Energy Germany2004 – 2016
Annual Trends, New Investment
53 October 5, 2017
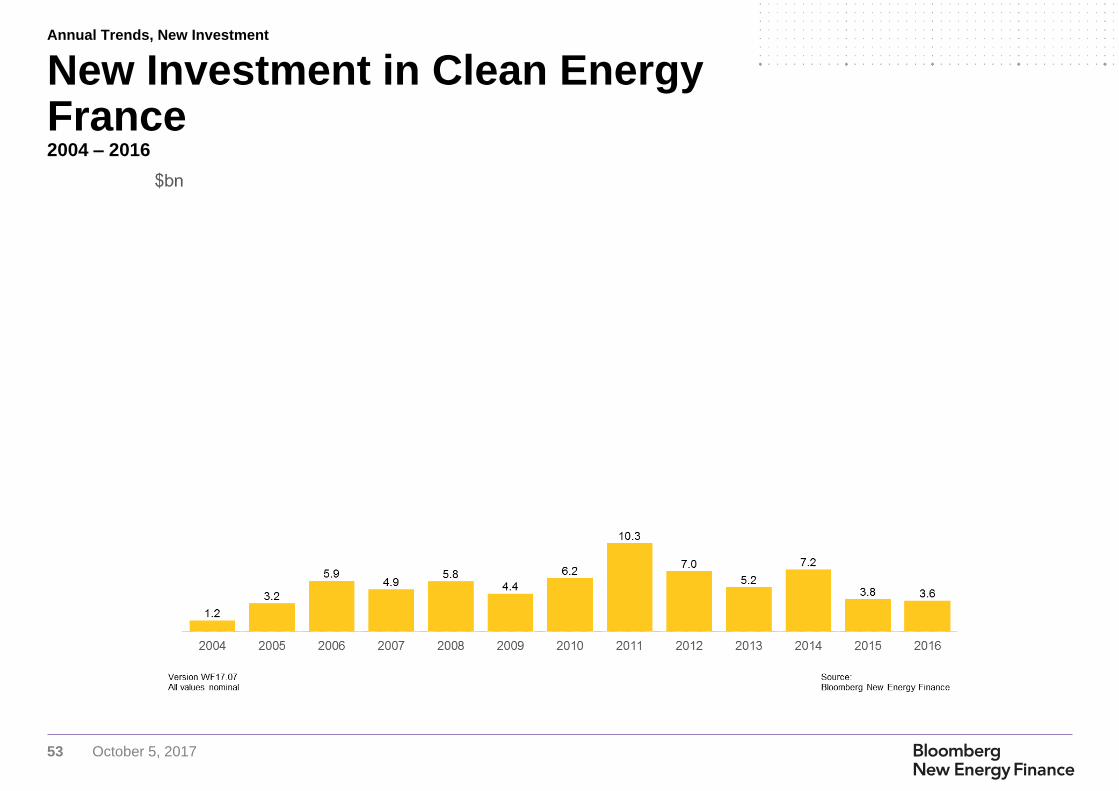
New Investment in Clean Energy France2004 – 2016
Annual Trends, New Investment
54 October 5, 2017
New Investment in Clean Energy Spain2004 – 2016
Annual Trends, New Investment
55 October 5, 2017
New Investment in Clean Energy Italy2004 – 2016
Annual Trends, New Investment
56 October 5, 2017
New Investment in Clean Energy South Africa2004 – 2016
Annual Trends, New Investment
57 October 5, 2017
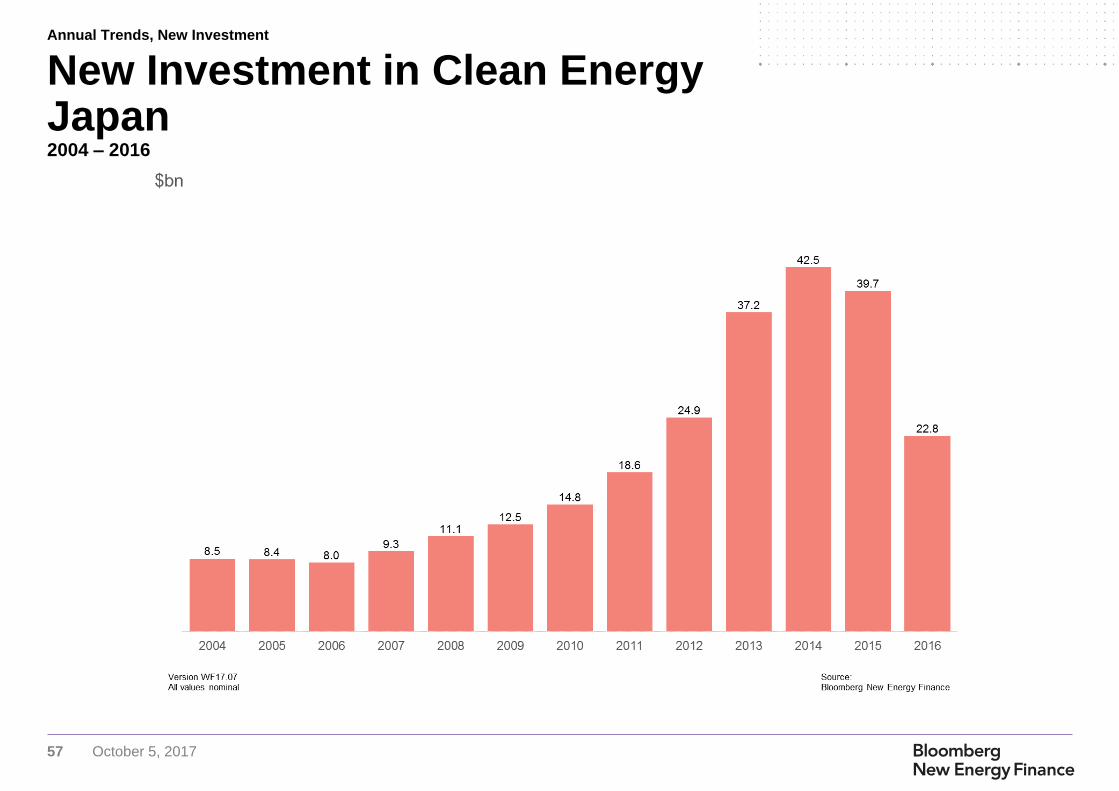
New Investment in Clean Energy Japan2004 – 2016
Annual Trends, New Investment
58 October 5, 2017
New Investment in Clean Energy India2004 – 2016
Annual Trends, New Investment
59 October 5, 2017
New Investment in Clean Energy Australia2004 – 2016
Annual Trends, New Investment
60 October 5, 2017
Clean Energy Stock
Performance
Clean energy and the stock market
61 October 5, 2017
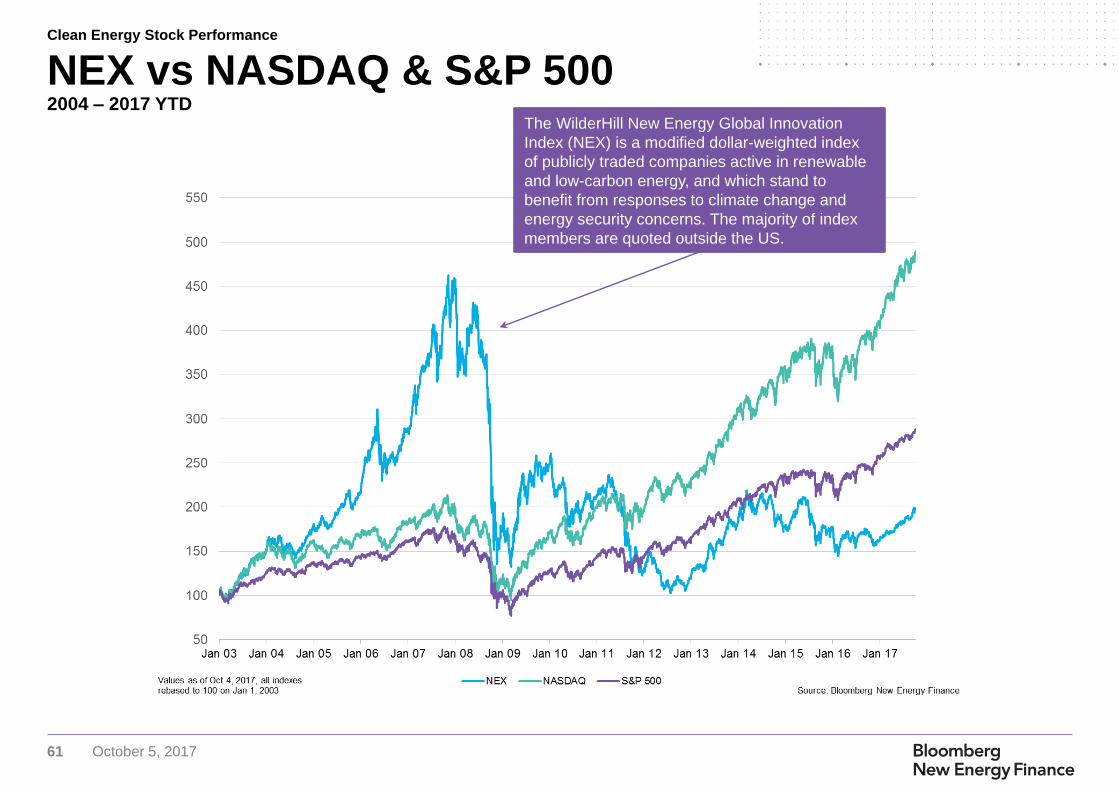
NEX vs NASDAQ & S&P 5002004 – 2017 YTD
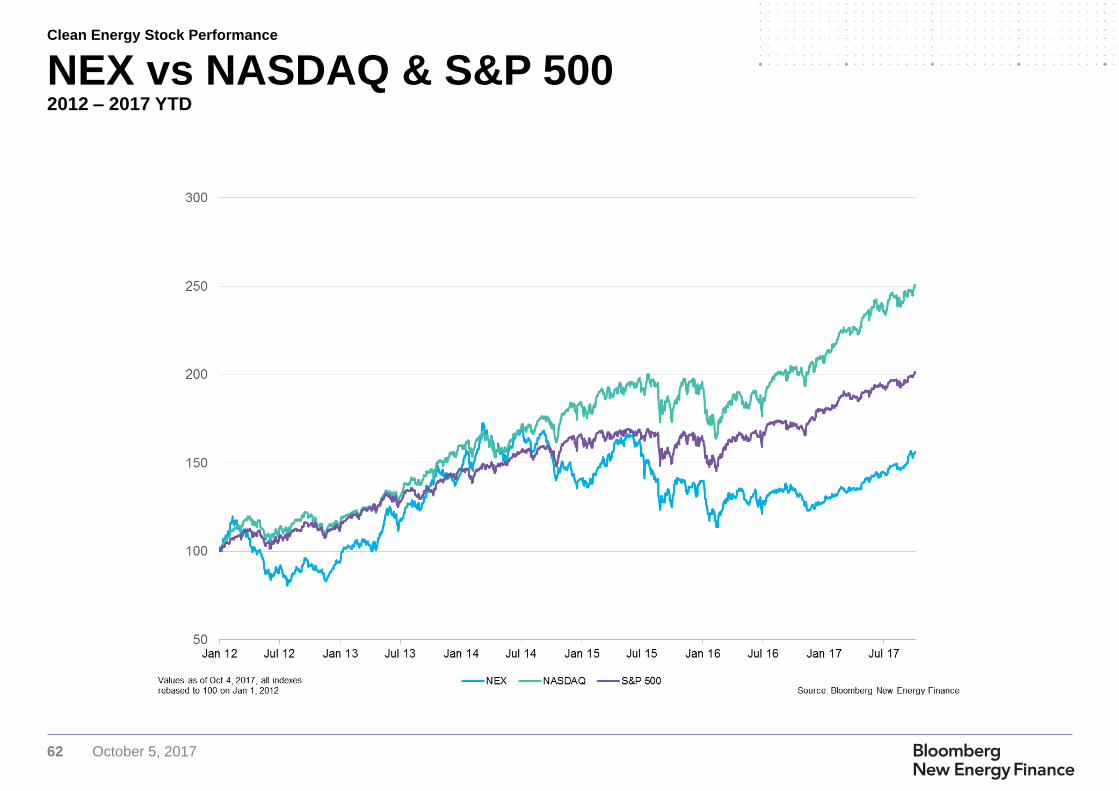
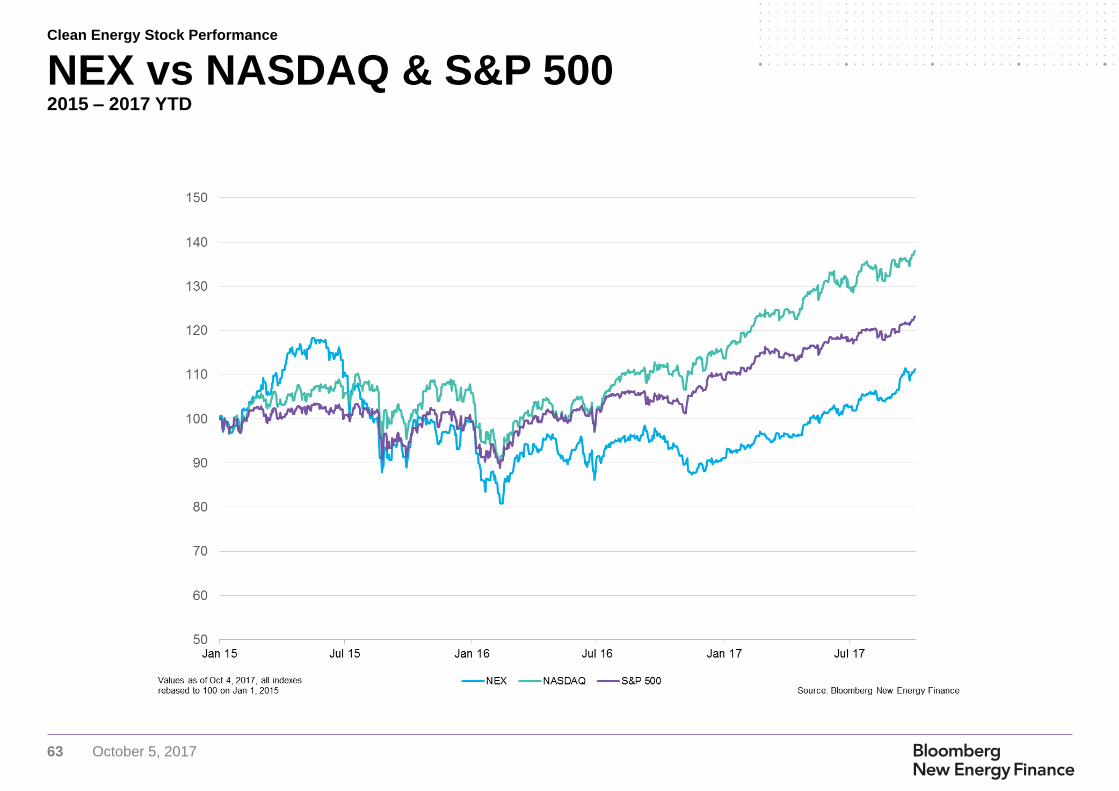
The WilderHill New Energy Global Innovation
Index (NEX) is a modified dollar-weighted index
of publicly traded companies active in renewable
and low-carbon energy, and which stand to
benefit from responses to climate change and
energy security concerns. The majority of index
members are quoted outside the US.
Clean Energy Stock Performance
62 October 5, 2017
NEX vs NASDAQ & S&P 5002012 – 2017 YTD
Clean Energy Stock Performance
63 October 5, 2017
NEX vs NASDAQ & S&P 5002015 – 2017 YTD
Clean Energy Stock Performance
64 October 5, 2017
Definitions and FAQs
How Bloomberg New Energy Finance
defines clean energy
65 October 5, 2017
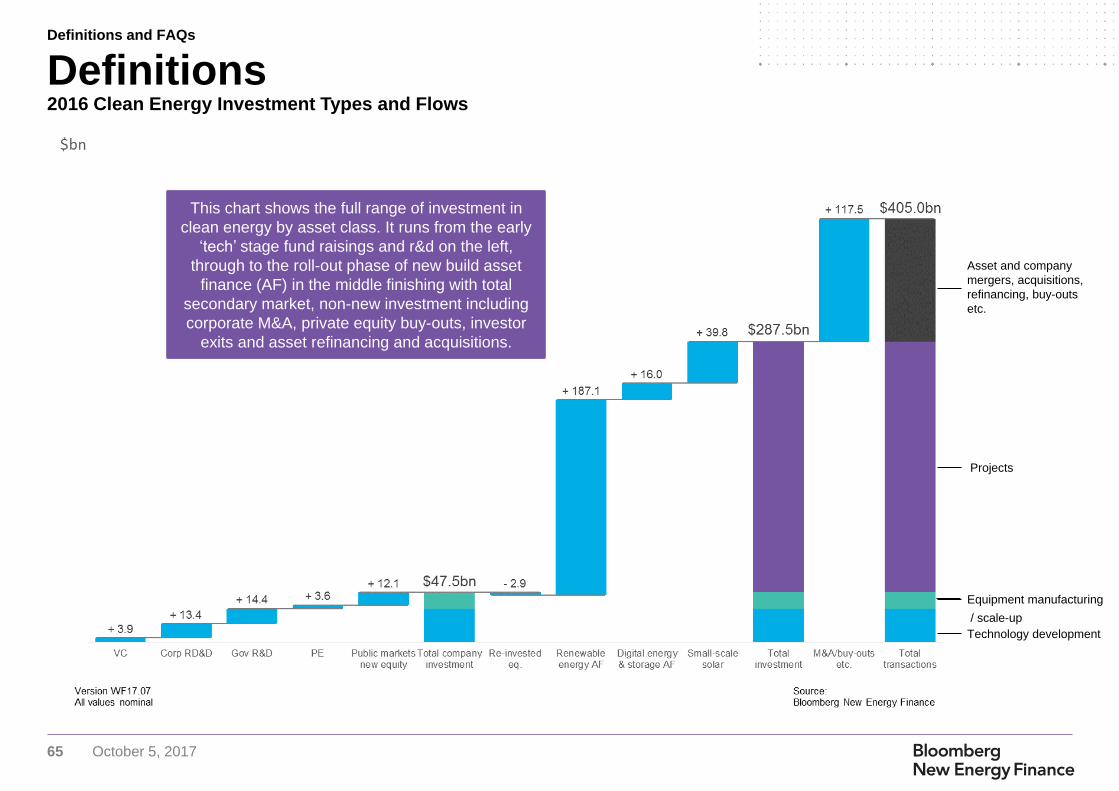
Definitions2016 Clean Energy Investment Types and Flows
This chart shows the full range of investment in
clean energy by asset class. It runs from the early
‘tech’ stage fund raisings and r&d on the left,
through to the roll-out phase of new build asset
finance (AF) in the middle finishing with total
secondary market, non-new investment including
corporate M&A, private equity buy-outs, investor
exits and asset refinancing and acquisitions.
Asset and company
mergers, acquisitions,
refinancing, buy-outs
etc.
Projects
Technology development
Equipment manufacturing
/ scale-up
Definitions and FAQs
66 October 5, 2017
Venture capital and private equity (VCPE)
Early and late stage venture capital funding rounds of pure play clean energy companies as well as funds raised privately for the purposes of
expansion.
Public markets (PM)
Funds raised by publicly quoted or OTC quoted pure play clean energy companies on the capital markets. This may be through IPOs or follow-on
offerings like secondary offerings, private investment in public equity or PIPEs, convertibles etc.
Asset finance
The new build financing of renewable energy generating projects as well as smart metering and energy storage projects - smart metering and
energy storage investment are only reported annually. Renewable energy generating projects includes both electricity generating and biofuels
producing assets. Projects may be financed off the owner's balance sheet, or through financing mechanisms such as project finance, syndicated
equity from institutional investors, or project bonds underwritten by banks.
Re-invested equity
Isolates values for balance sheet-financed project investments by companies who have raised money privately or publicly over the past 12
months. The purpose of this category is to prevent double counting of money raised publicly or privately that has been invested in clean energy
assets.
Small scale solar
Given the technical limitations in tracking small-scale solar projects, BNEF's asset finance database excludes projects below roughly 1MW. Unlike
utility scale asset investment, small-scale solar investment is based on top-down analyst estimates.
Government r&d
Government r&d figures are sourced from the IEA, IMF, OECD, and various government agencies.
Corporate r&d
The Bloomberg Terminal is used to source corporate r&d figures for key quoted companies in all clean energy sectors.
DefinitionsAsset classes
Definitions and FAQs
67 October 5, 2017
Wind
Electricity generation using wind turbines. Included in this sector, are players across the entire value chain of both onshore and offshore
developments. From manufacturers of turbines, components and subassemblies to developers, generators, utilities and engineering firm.
Solar
All technologies which capture energy directly from the sun. These include production of electricity using semiconductor-based photovoltaic (pv)
materials, use of concentrated sunlight to heat fluids that drive power generation equipment (solar thermal), and passive methods which use
sunlight to heat water. Whilst company level investment of passive methods is recorded, investment in passive projects is not.
Biofuels
Liquid transportation fuels including biodiesel and bioethanol. These can be derived from a range of biomass sources, including sugar cane, rape
seed, soybean oil or non-food cellulosic feedstock. Our database excludes producers of base biomass, but includes suppliers of everything from
the processing technologies and equipment, through the logistics of distribution, to manufacturers of energy systems which are specially adapted
for the use of biofuels and products, and the services on which they depend.
Biomass & waste
Electricity and/or heat produced with bio-based feedstocks, typically through incineration but also through more advanced processes like
gasification or anaerobic digestion. This sector also includes waste-to-energy which includes energy produced through landfill gas projects and
incineration of municipal and industrial waste.
Energy smart technologies
This sector covers technologies like digital energy, smart grids, power storage, hydrogen and fuel cells, advanced transportation and energy
efficiency on both the demand and supply side.
Other renewables
Includes small hydro - hydro projects with capacities smaller or equal to 50MW; geothermal - extraction of useful power from heat stored in the
earth; marine - the extraction of tidal, wave and thermal energy from the ocean.
DefinitionsSectors
Definitions and FAQs
68 October 5, 2017
Other low carbon tech / services
This sector covers clean energy service companies such as consultants, government agencies and policy makers, NGOs, financial service
providers, investors, and clean energy information providers (such as ourselves). It also covers the corporate activity of organizations across the
carbon market value chains.
DefinitionsSectors
Definitions and FAQs
69 October 5, 2017
Q1: Why is there a difference between the sum of the quarterly figures and the annual figures?
Quarterly figures do not include certain asset classes which we only produce annually. These asset classes are corporate and government r&d
and asset finance for energy smart technologies, in other words, smart meters and energy storage investment
Q2: Which countries are included in Europe?
Europe includes all 28 EU countries, and non-EU countries like Switzerland, Norway, Turkey and Russia. The majority of clean energy investment
stems from the EU though
FAQsDefinitions and FAQs
70 October 5, 2017
This publication is the copyright of Bloomberg New Energy Finance. No portion of this document may be photocopied,
reproduced, scanned into an electronic system or transmitted, forwarded or distributed in any way without prior consent of
Bloomberg New Energy Finance.
The information contained in this publication is derived from carefully selected sources we believe are reasonable. We do not
guarantee its accuracy or completeness and nothing in this document shall be construed to be a representation of such a
guarantee. Any opinions expressed reflect the current judgment of the author of the relevant article or features, and does not
necessarily reflect the opinion of Bloomberg New Energy Finance, Bloomberg Finance L.P., Bloomberg L.P. or any of their
affiliates ("Bloomberg"). The opinions presented are subject to change without notice. Bloomberg accepts no responsibility
for any liability arising from use of this document or its contents. Nothing herein shall constitute or be construed as an
offering of financial instruments, or as investment advice or recommendations by Bloomberg of an investment strategy or
whether or not to "buy," "sell" or "hold" an investment.
Copyright and disclaimer
Coverage.
Renewable Energy
Power & Utilities
Gas
Carbon Markets & Climate Negotiations
Energy Smart Technologies
Storage
Electric Vehicles
Mobility and Autonomous Driving
Frontier Power
Emerging Technologies
Bloomberg New Energy Finance is a
research firm that helps energy
professionals generate opportunities. With a
team of experts spread across six
continents, BNEF provides independent
analysis and insight, enabling decision-
makers to navigate change in an evolving
energy economy.
BNEF research and analysis is accessible
via web and mobile platforms, as well as on
the Bloomberg Terminal.
about.bnef.com
@BloombergNEF