Embed Size (px)
Citation preview
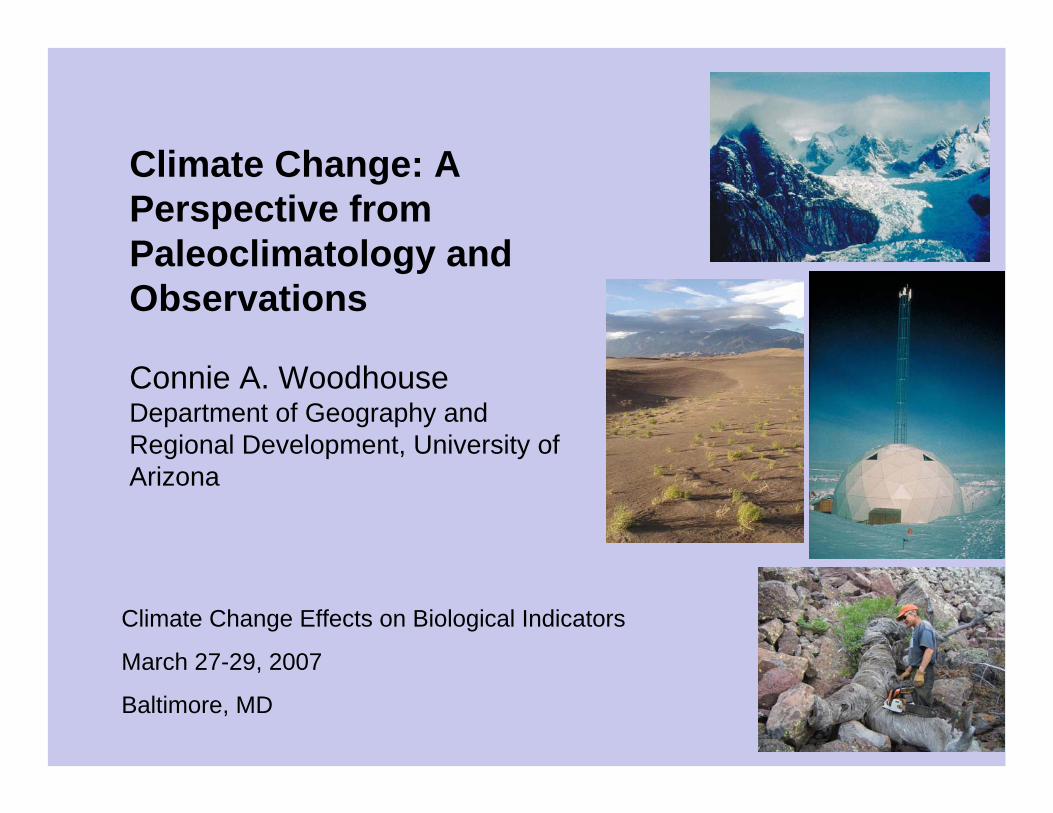
Climate Change: A Perspective from Paleoclimatology and Observations
Connie A. Woodhouse Department of Geography and Regional Development, University of Arizona
Climate Change Effects on Biological Indicators
March 27-29, 2007
Baltimore, MD
How do we know that human-induced climate change is occurring?
• In order to assess whether current climate conditions are different from that expected under natural conditions, we first need to know the range of natural climate variability.
• The 20th and 21st century records of climate (observations) provide some context for assessing this, but do they provide the full range of natural variability that has occurred in the past?
• Information about climate prior to instrumental measurements, paleoclimatology, from environmental recorders of climate can provide a broader context from which to access the current climate.
Overview • What climate trends have been observed?
• Environmental recorders of past climate
• Northern Hemisphere temperatures from paleoclimatic data
• Drought from paleoclimatic data, continental and regional scales
• Paleoclimatology and resource management
• How relevant is the past with regard to future?
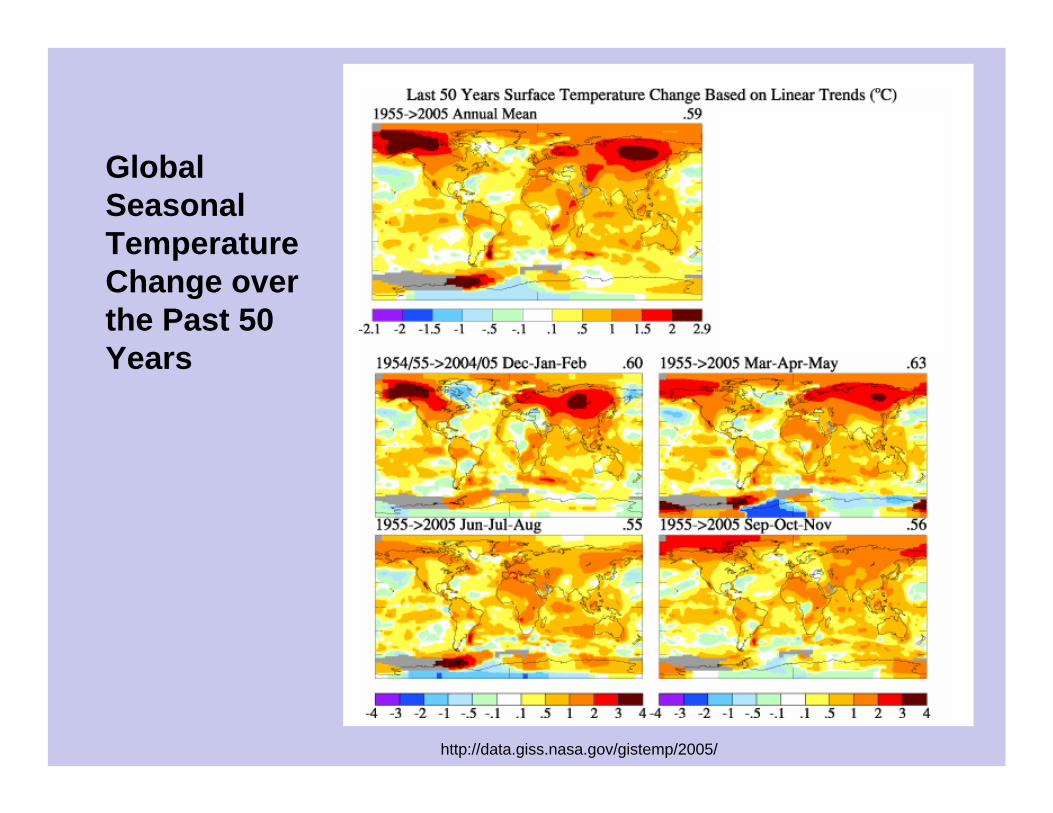
Global Seasonal Temperature Change over the Past 50 Years
http://data.giss.nasa.gov/gistemp/2005/
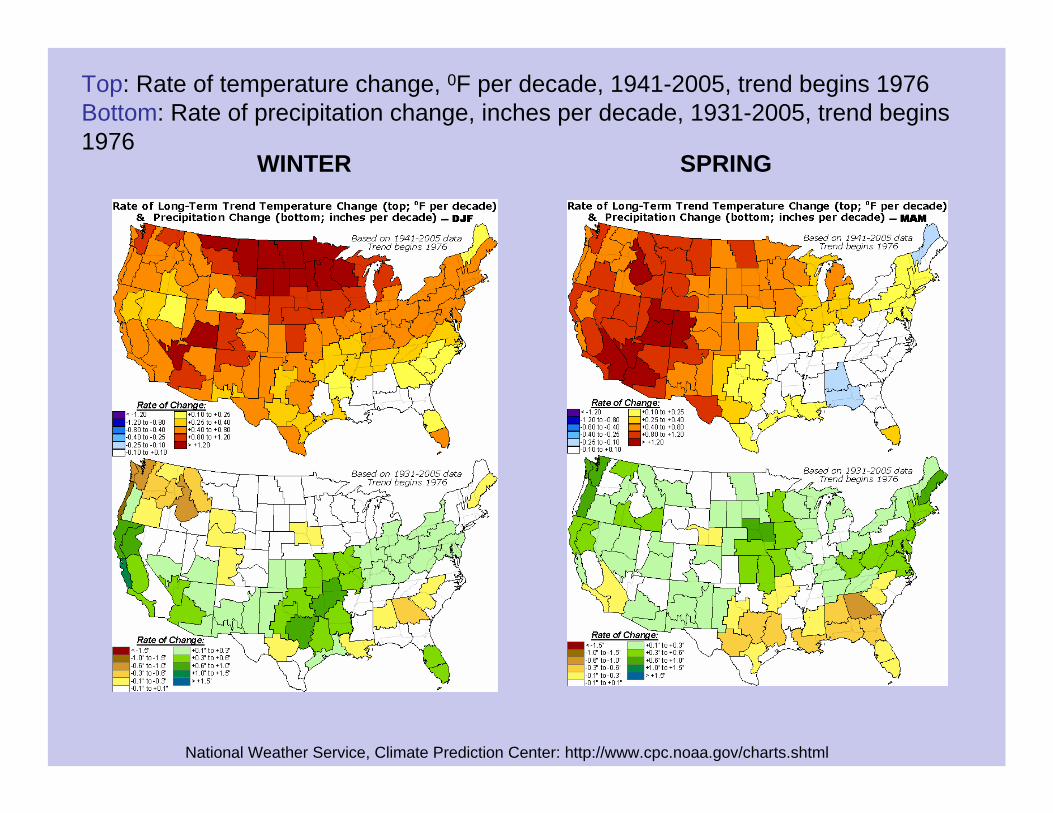
Top: Rate of temperature change, 0F per decade, 1941-2005, trend begins 1976 Bottom: Rate of precipitation change, inches per decade, 1931-2005, trend begins 1976
WINTER SPRING
National Weather Service, Climate Prediction Center: http://www.cpc.noaa.gov/charts.shtml
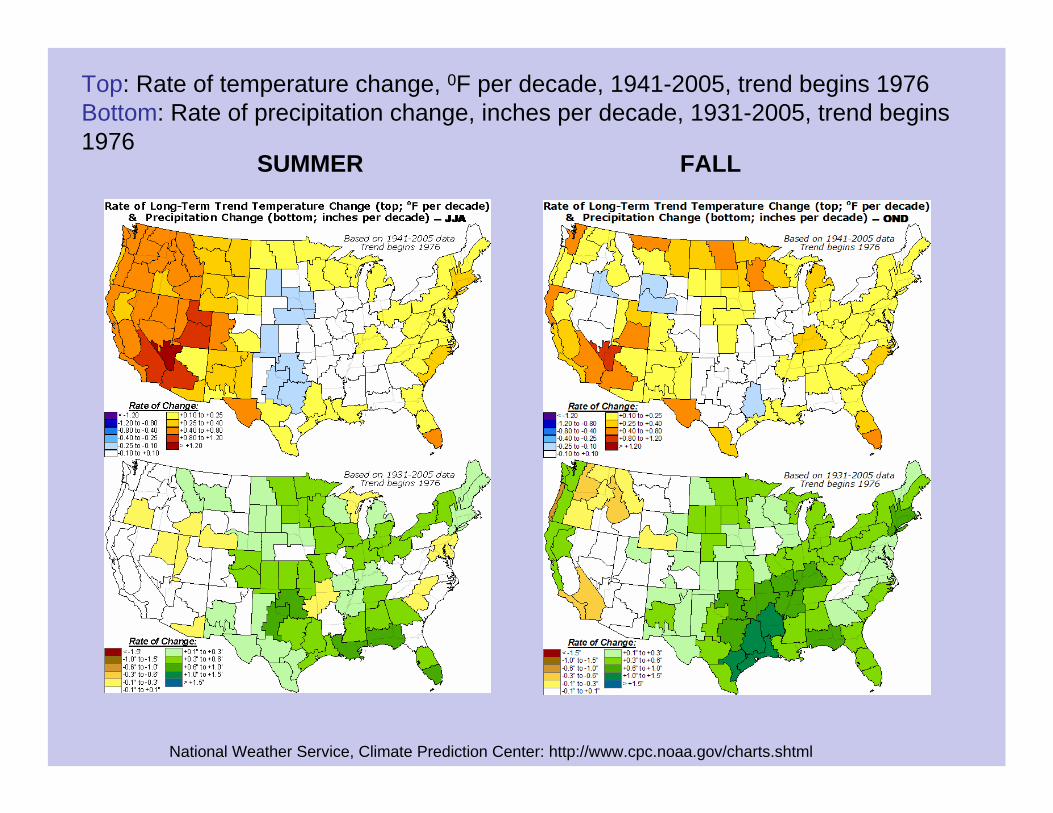
Top: Rate of temperature change, 0F per decade, 1941-2005, trend begins 1976 Bottom: Rate of precipitation change, inches per decade, 1931-2005, trend begins 1976
SUMMER FALL
National Weather Service, Climate Prediction Center: http://www.cpc.noaa.gov/charts.shtml
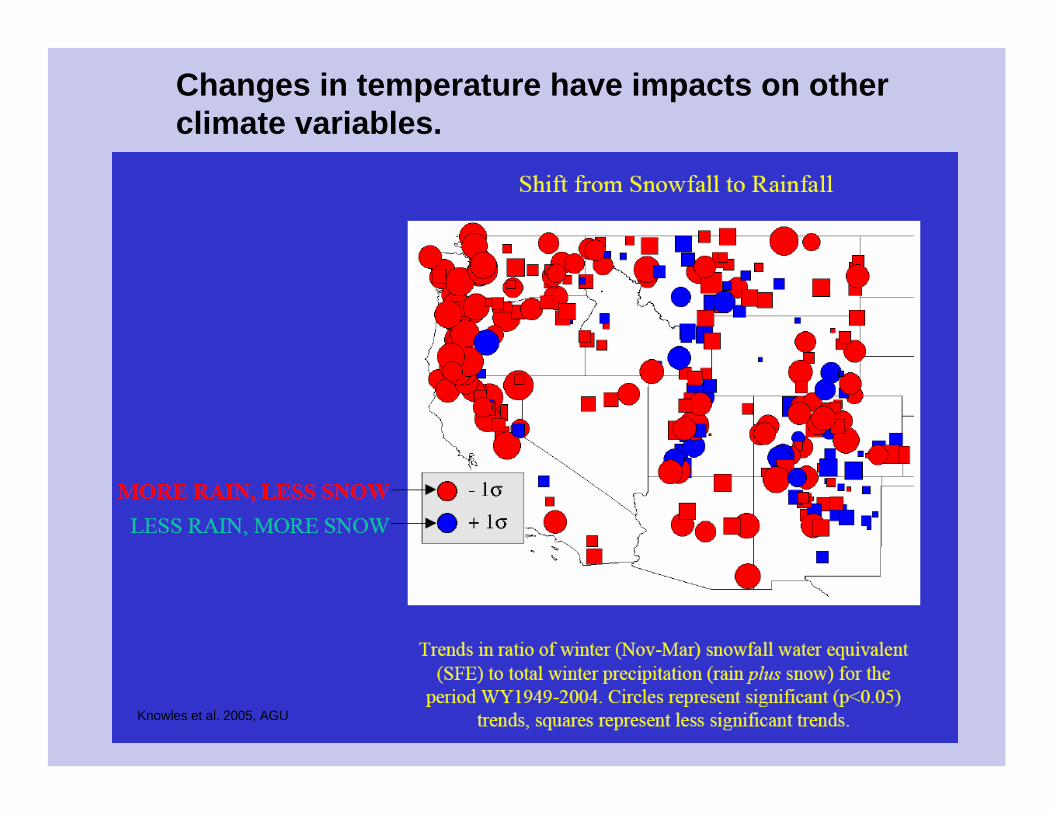
Changes in temperature have impacts on other climate variables.
Knowles et al. 2005, AGU
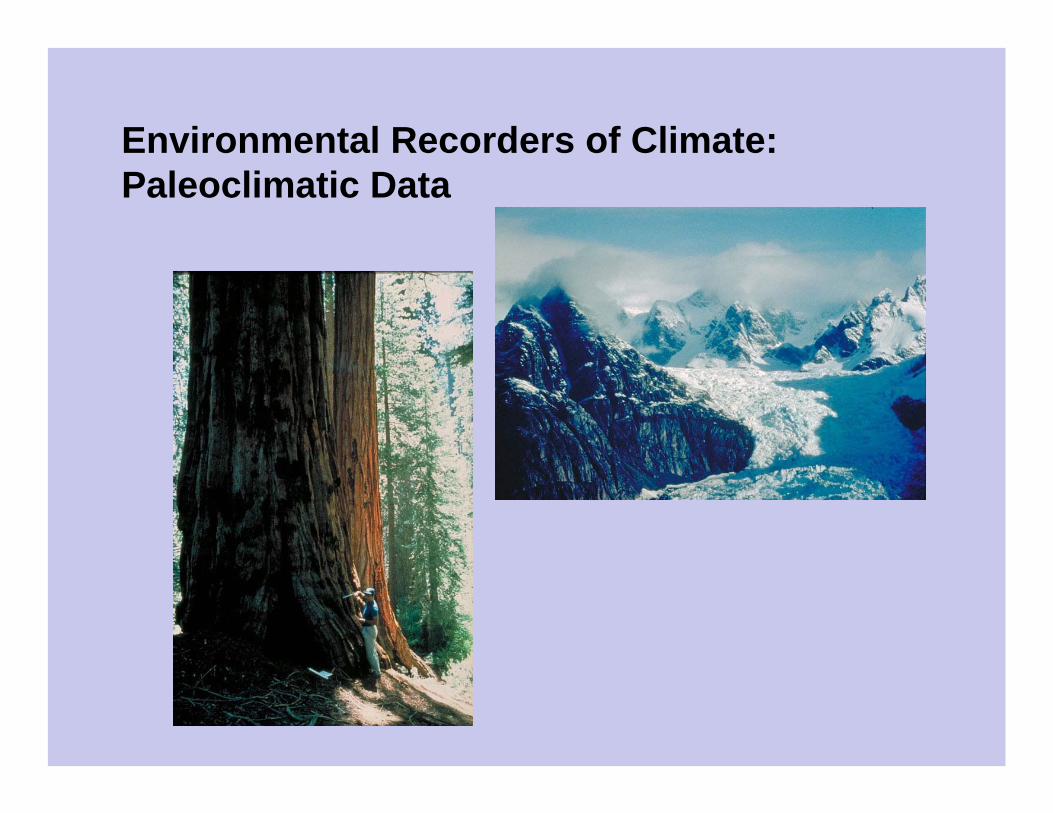
Environmental Recorders of Climate: Paleoclimatic Data
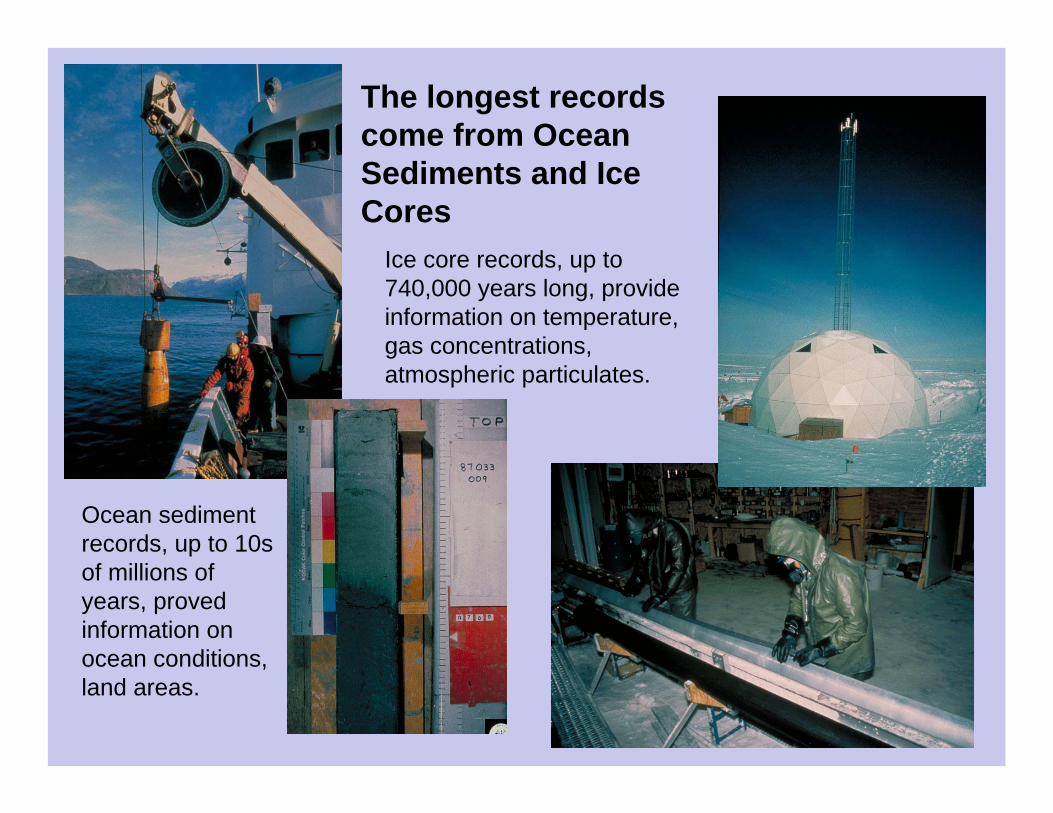
The longest records come from Ocean Sediments and Ice Cores
Ice core records, up to 740,000 years long, provide information on temperature, gas concentrations, atmospheric particulates.
Ocean sediment records, up to 10s of millions of years, proved information on ocean conditions, land areas.
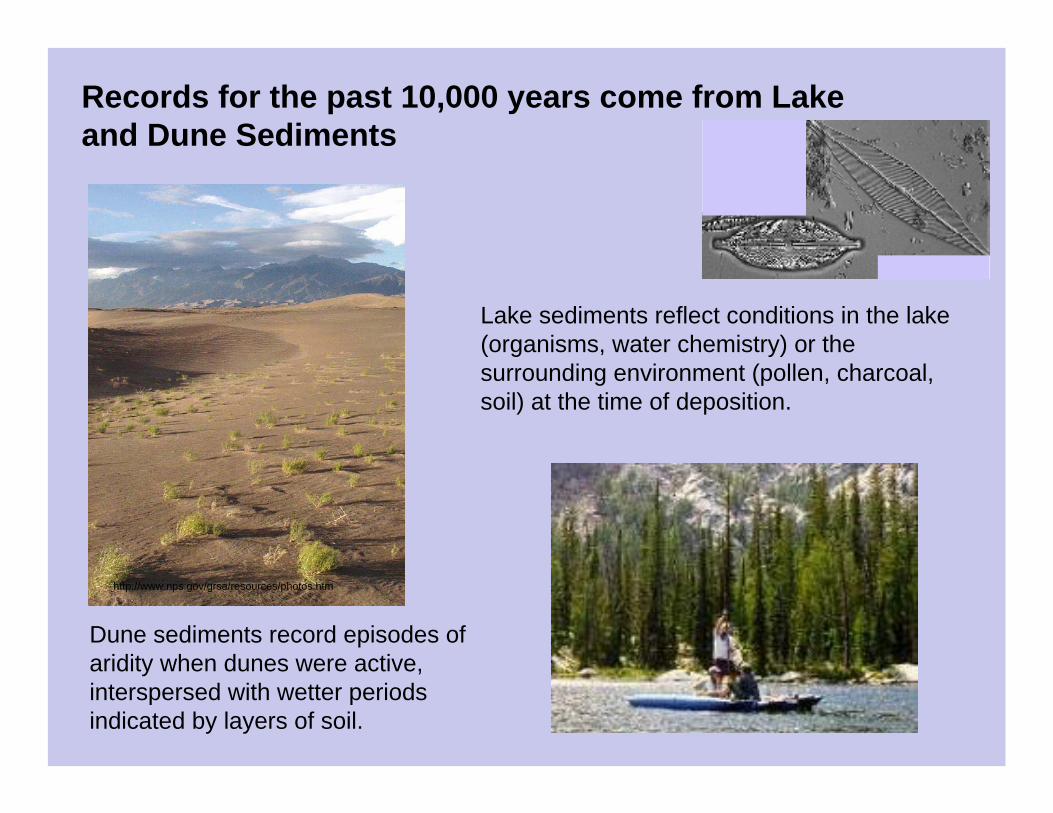
Records for the past 10,000 years come from Lake and Dune Sediments
Lake sediments reflect conditions in the lake (organisms, water chemistry) or the surrounding environment (pollen, charcoal, soil) at the time of deposition.
Dune sediments record episodes of aridity when dunes were active, interspersed with wetter periods indicated by layers of soil.
http://www.nps.gov/grsa/resources/photos.htm
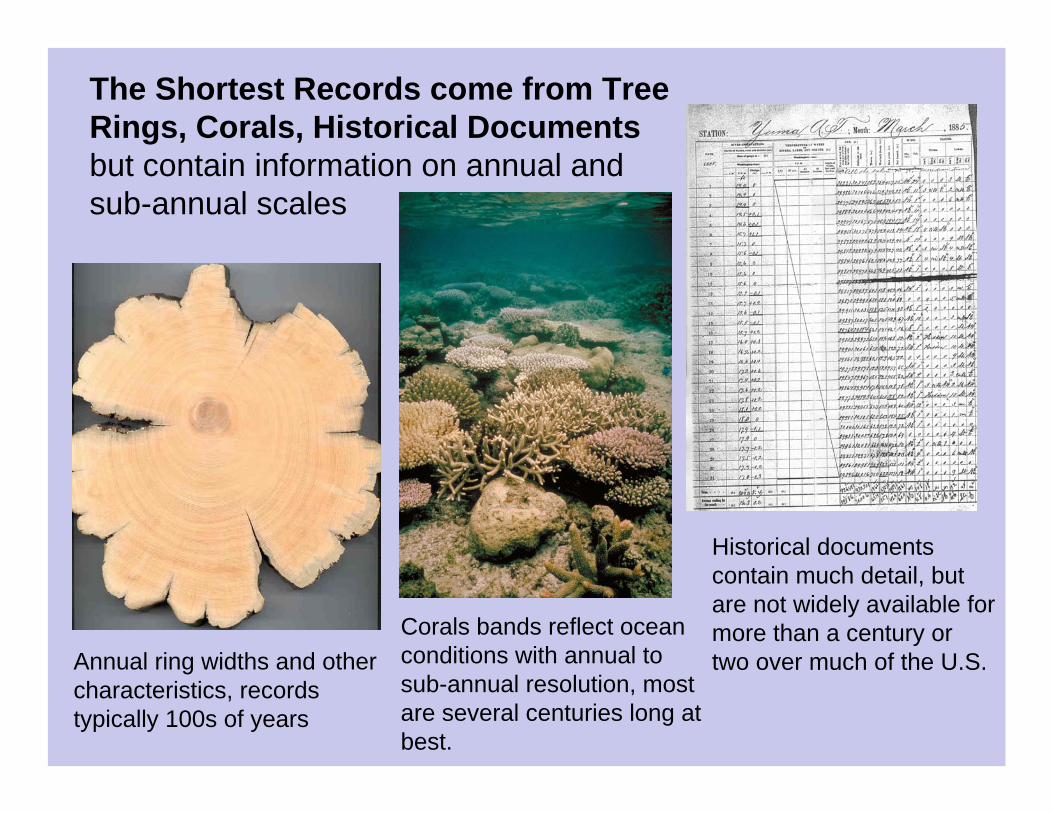
The Shortest Records come from Tree Rings, Corals, Historical Documents but contain information on annual and sub-annual scales
Annual ring widths and other characteristics, records typically 100s of years
Corals bands reflect ocean conditions with annual to sub-annual resolution, most are several centuries long at best.
Historical documents contain much detail, but are not widely available for more than a century or two over much of the U.S.
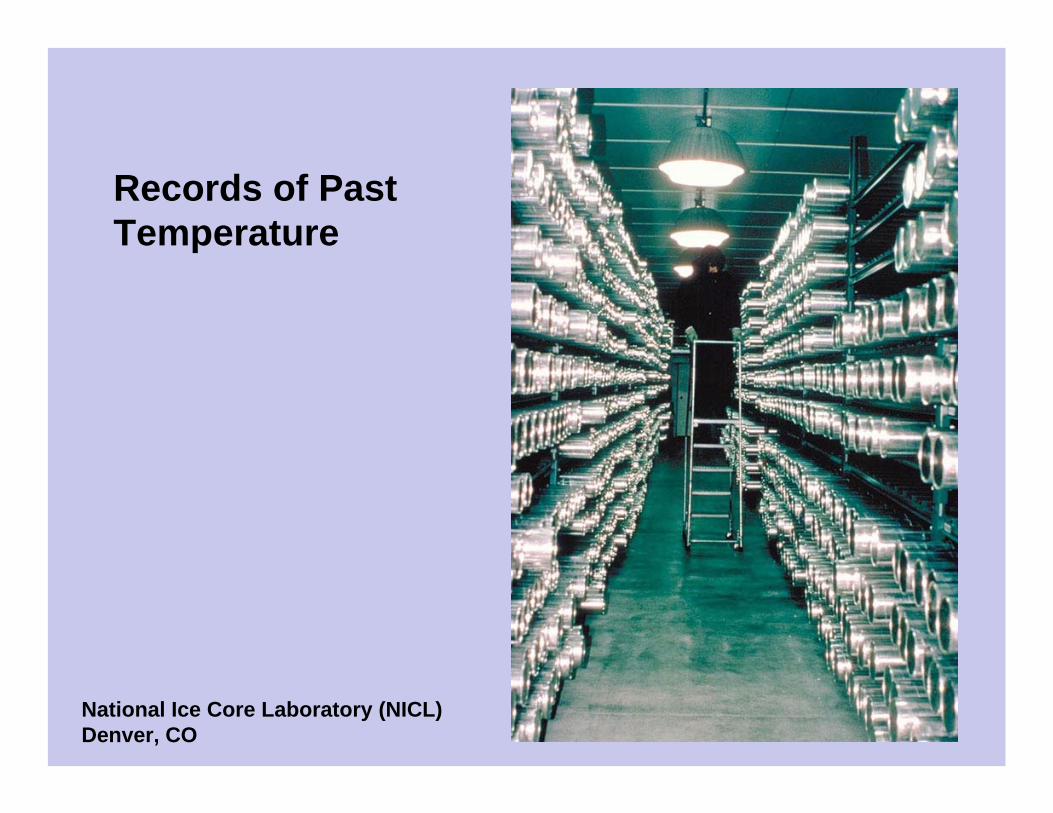
Records of Past Temperature
National Ice Core Laboratory (NICL) Denver, CO
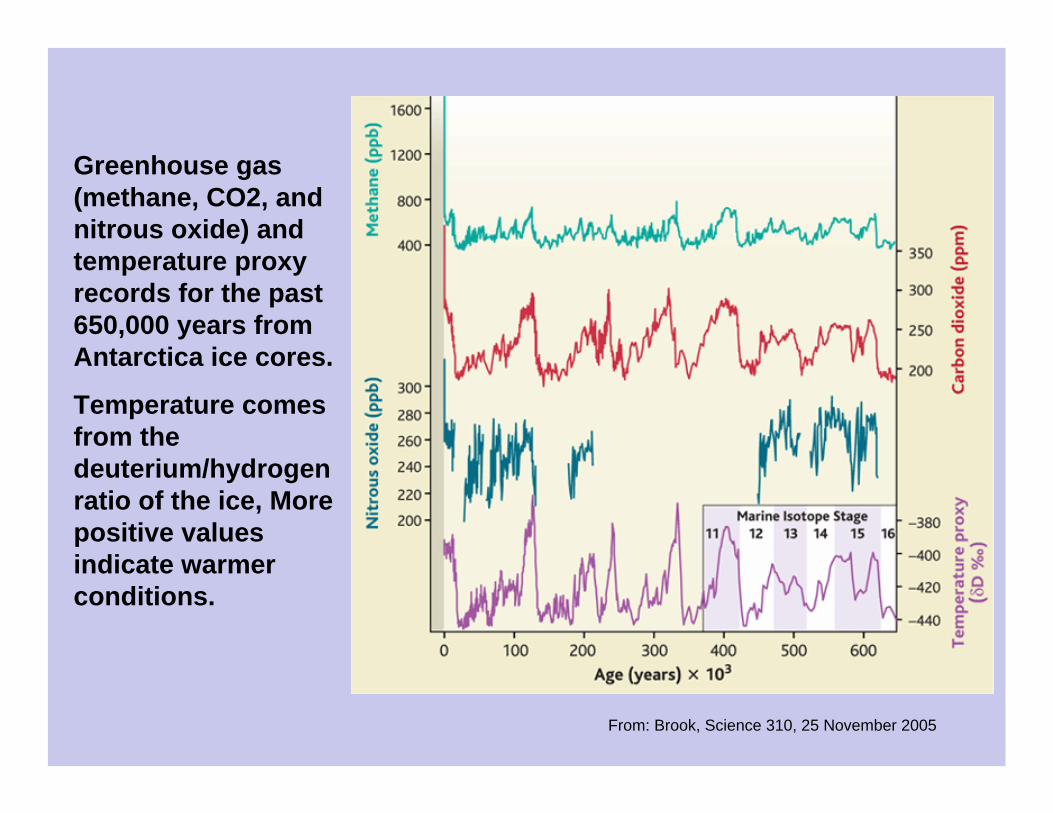
Greenhouse gas (methane, CO2, and nitrous oxide) and temperature proxy records for the past 650,000 years from Antarctica ice cores.
Temperature comes from the deuterium/hydrogen ratio of the ice, More positive values indicate warmer conditions.
From: Brook, Science 310, 25 November 2005
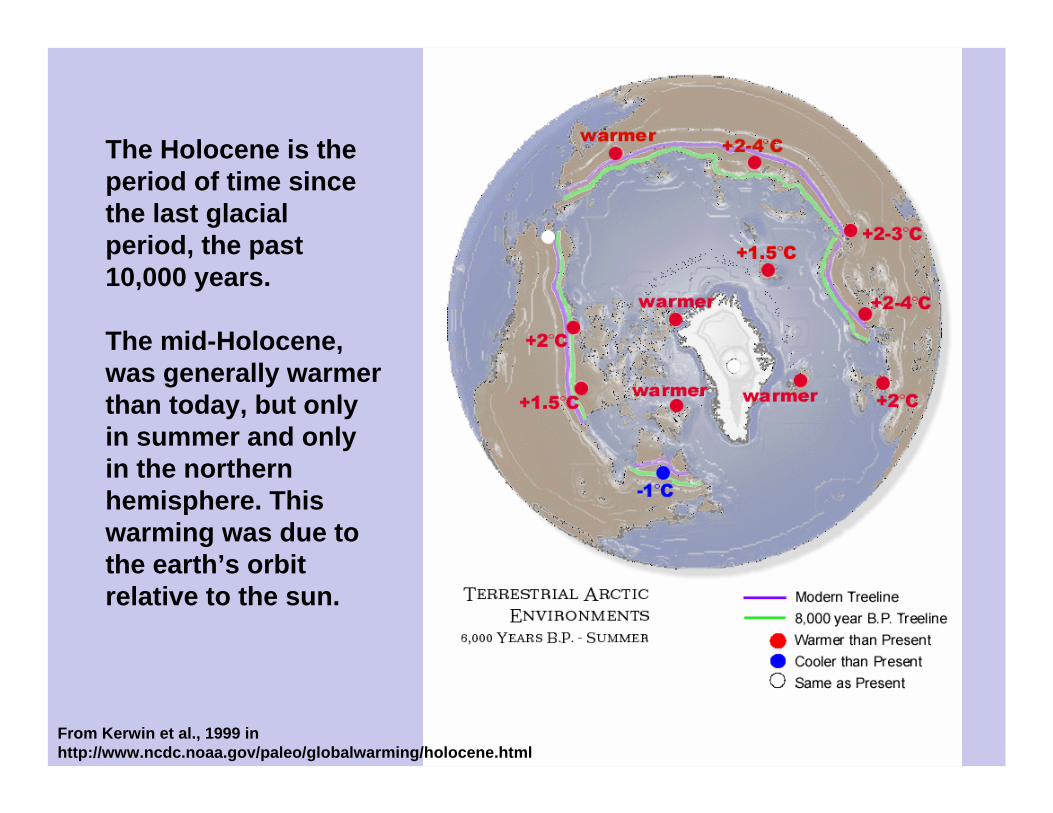
The Holocene is the period of time since the last glacial period, the past 10,000 years.
The mid-Holocene, was generally warmer than today, but only in summer and only in the northern hemisphere. This warming was due to the earth’s orbit relative to the sun.
From Kerwin et al., 1999 in http://www.ncdc.noaa.gov/paleo/globalwarming/holocene.html
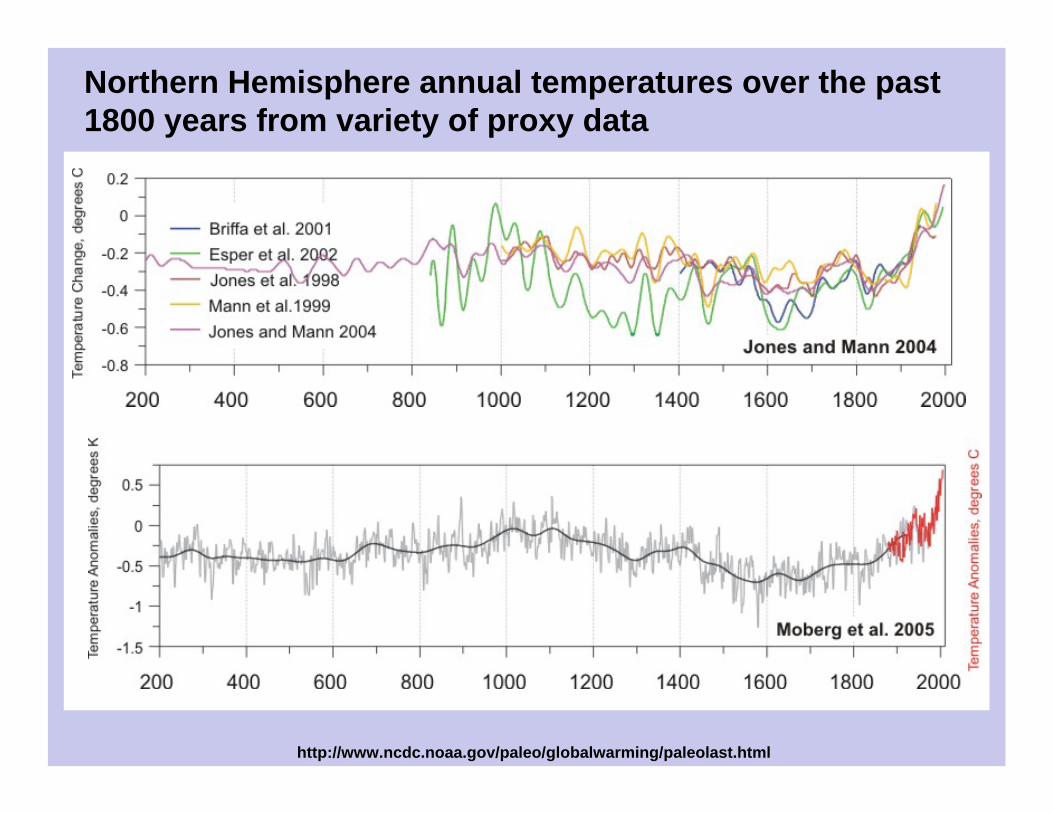
Northern Hemisphere annual temperatures over the past 1800 years from variety of proxy data
http://www.ncdc.noaa.gov/paleo/globalwarming/paleolast.html
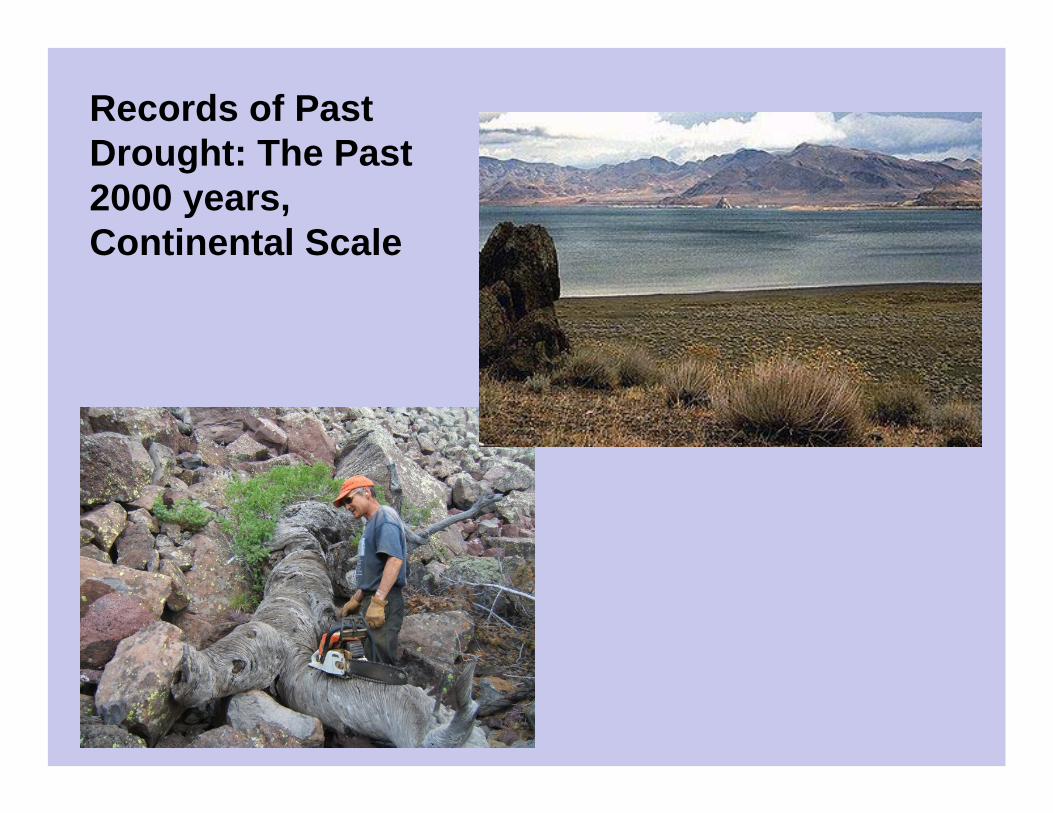
Records of Past Drought: The Past 2000 years, Continental Scale
20
30
40
50
60
-140 -120 -100 -80 -60
297-POINT 2.5°x2.5° "DAI" GRID USED FOR RECONSTRUCTING SUMMER PDSI
DAI GRID POINTS
LONGITUDE
LATI
TUD
E
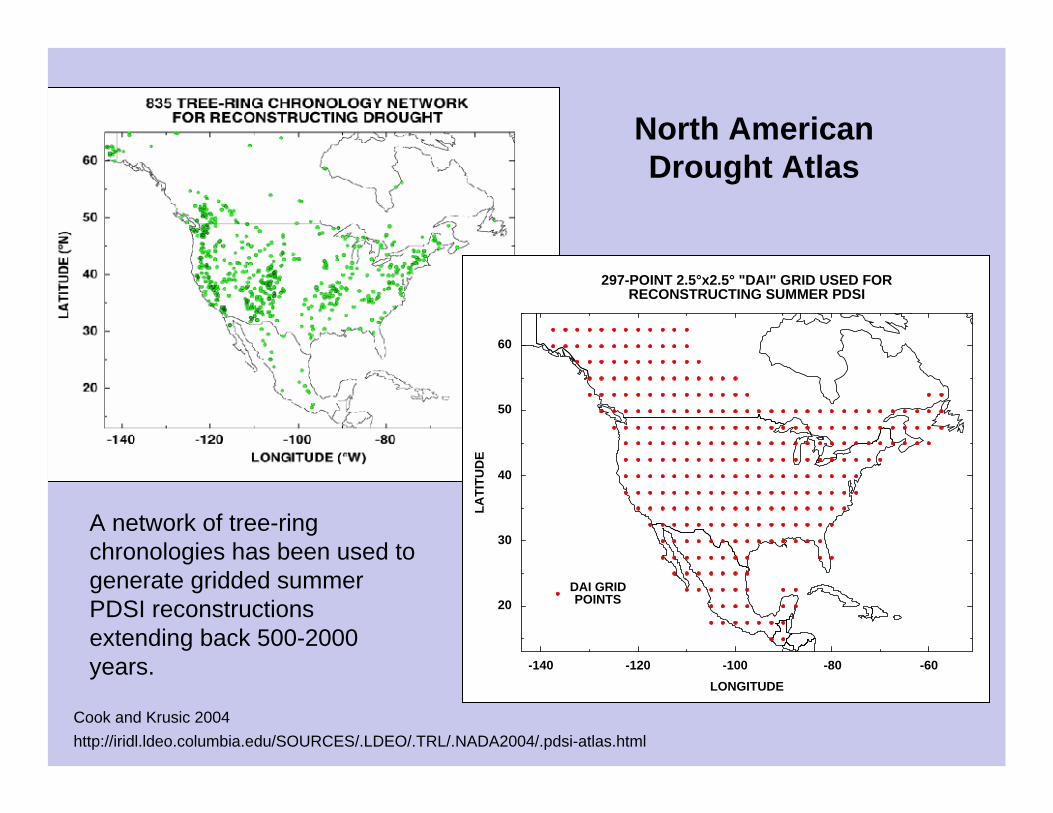
North American Drought Atlas
A network of tree-ring chronologies has been used to generate gridded summer PDSI reconstructions extending back 500-2000 years.
Cook and Krusic 2004 http://iridl.ldeo.columbia.edu/SOURCES/.LDEO/.TRL/.NADA2004/.pdsi-atlas.html
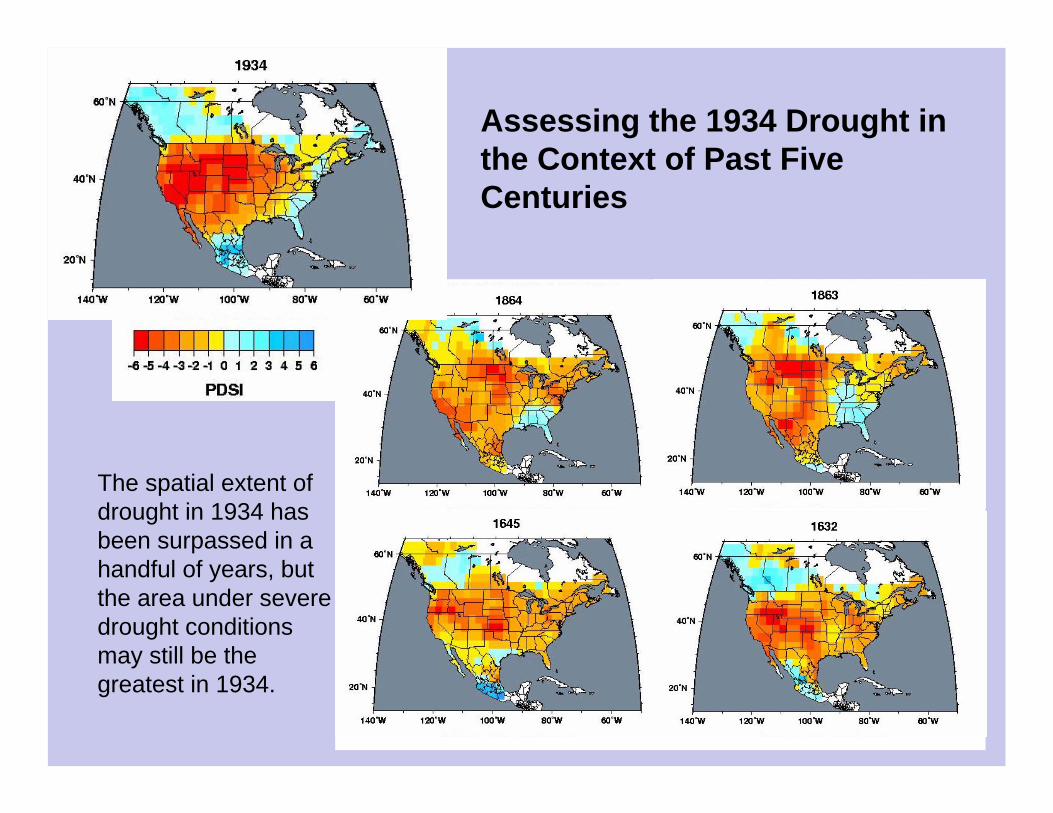
Assessing the 1934 Drought in the Context of Past Five Centuries
The spatial extent of drought in 1934 has been surpassed in a handful of years, but the area under severe drought conditions may still be the greatest in 1934.
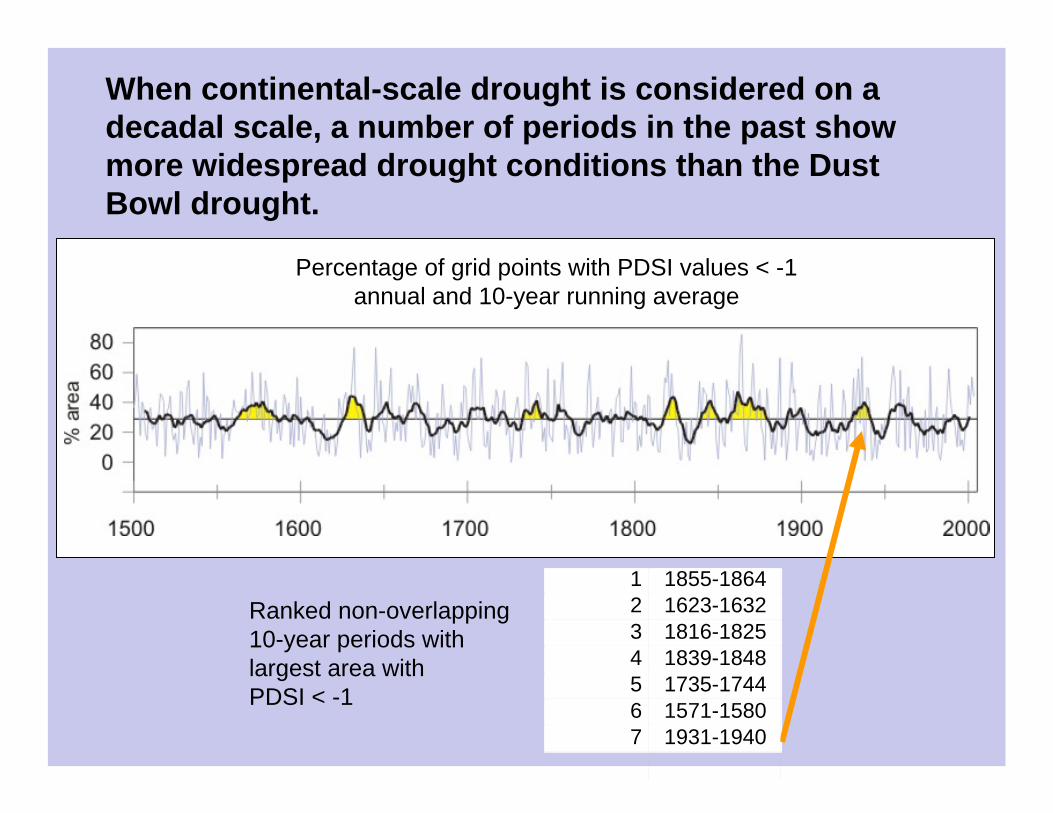
When continental-scale drought is considered on a decadal scale, a number of periods in the past show more widespread drought conditions than the Dust Bowl drought.
Percentage of grid points with PDSI values < -1 annual and 10-year running average
Ranked non-overlapping 10-year periods with largest area with PDSI < -1
1 1855-18642 1623-16323 1816-18254 1839-18485 1735-17446 1571-15807 1931-1940
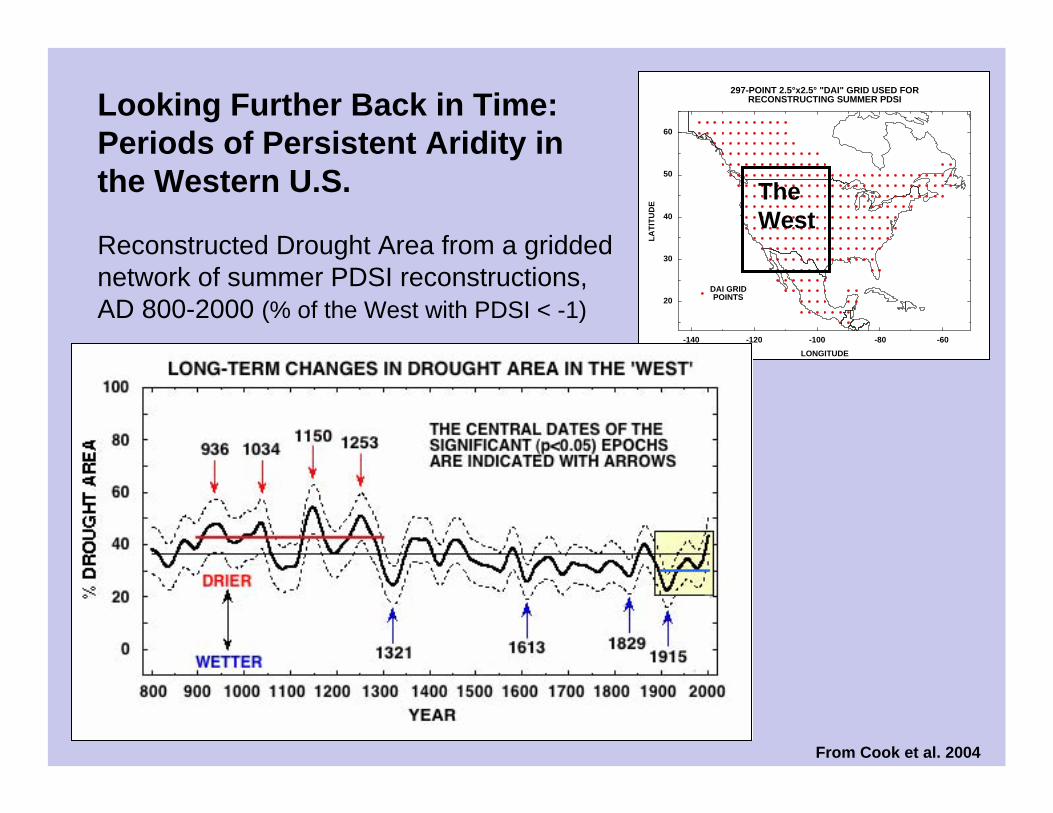
Looking Further Back in Time: Periods of Persistent Aridity in the Western U.S.
Reconstructed Drought Area from a gridded network of summer PDSI reconstructions, AD 800-2000 (% of the West with PDSI < -1) 20
30
40
50
60
-140 -120 -100 -80 -60
297-POINT 2.5°x2.5° "DAI" GRID USED FOR RECONSTRUCTING SUMMER PDSI
DAI GRID POINTS
LONGITUDE
LATI
TUD
E
The West
From Cook et al. 2004
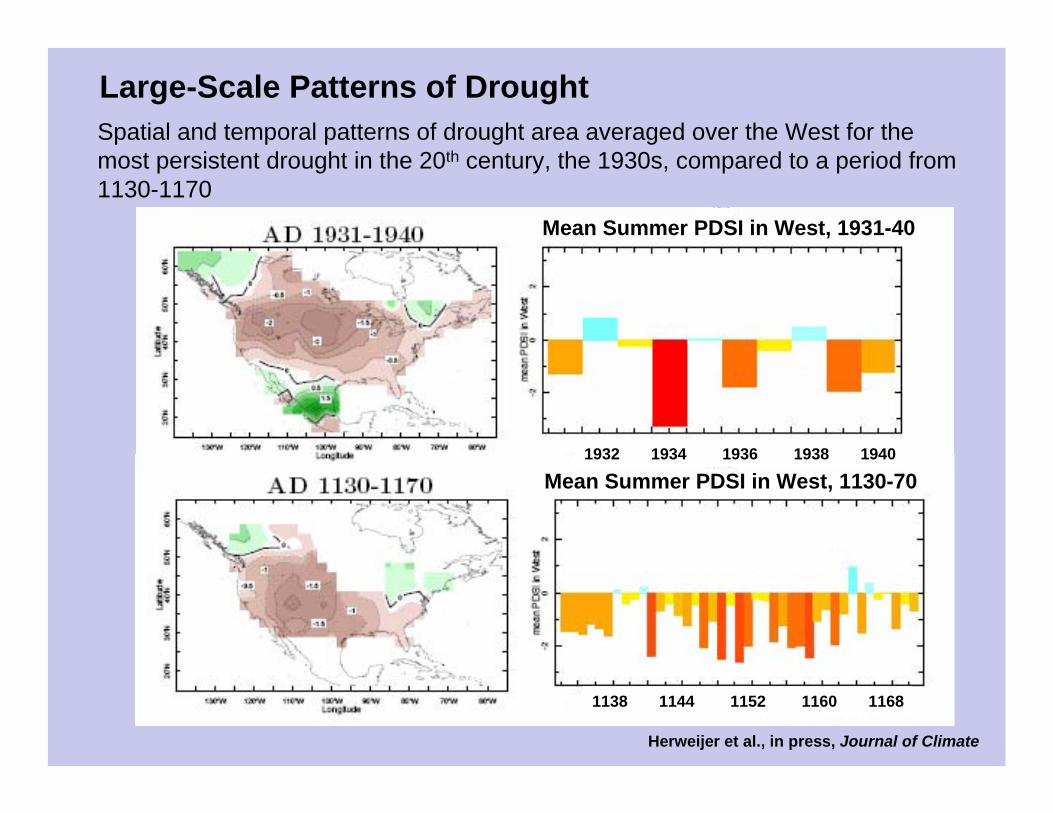
Large-Scale Patterns of Drought Spatial and temporal patterns of drought area averaged over the West for the most persistent drought in the 20th century, the 1930s, compared to a period from 1130-1170
1932 1934 1936 1938 1940
1138 1144 1152 1160 1168
Mean Summer PDSI in West, 1931-40
Mean Summer PDSI in West, 1130-70
Herweijer et al., in press, Journal of Climate
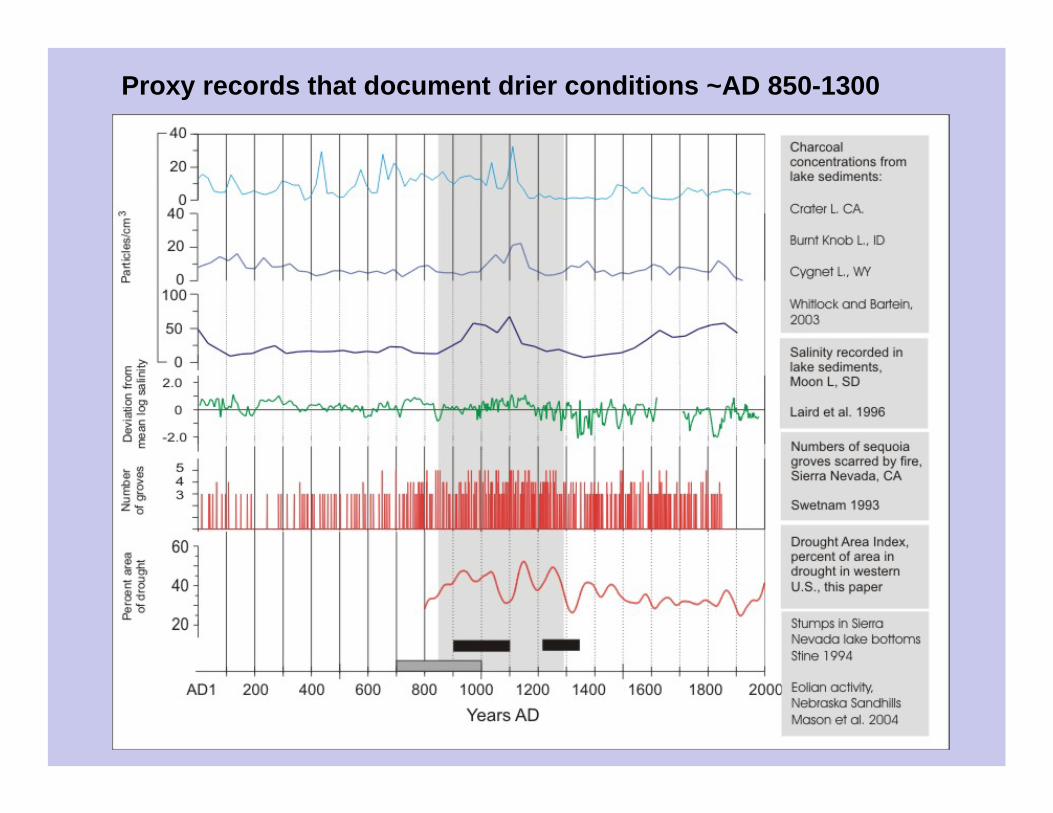
Proxy records that document drier conditions ~AD 850-1300
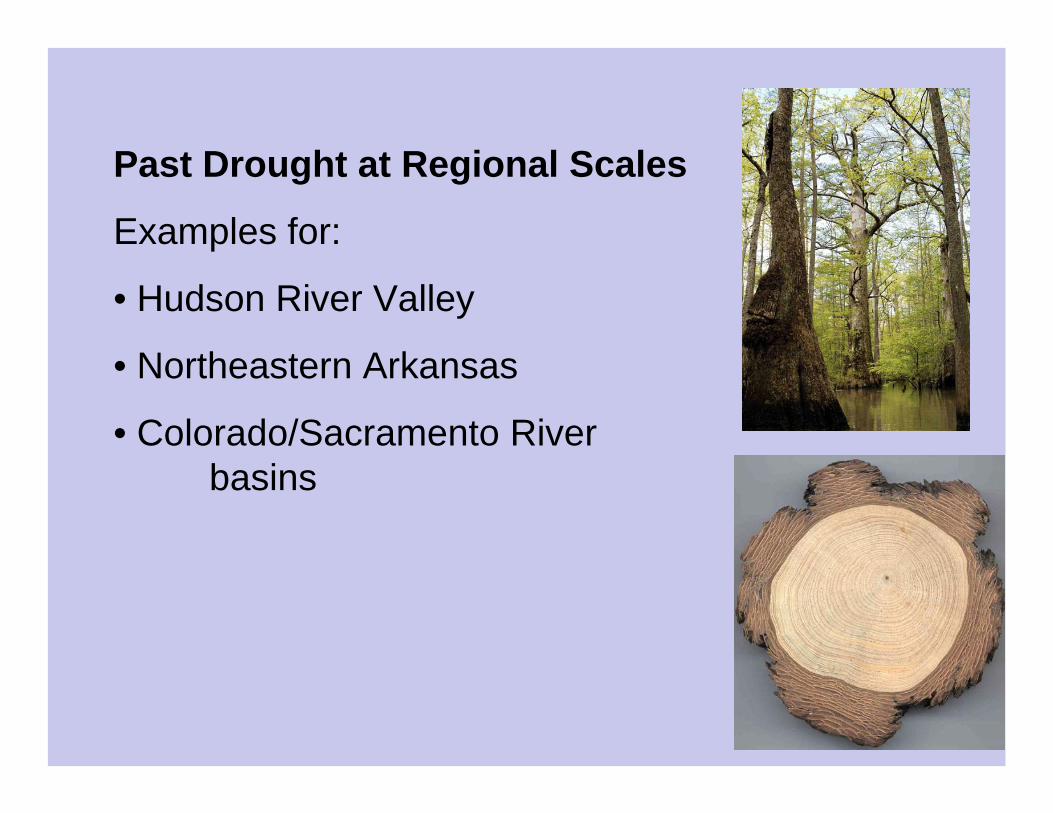
Past Drought at Regional Scales
Examples for:
• Hudson River Valley
• Northeastern Arkansas
• Colorado/Sacramento River basins
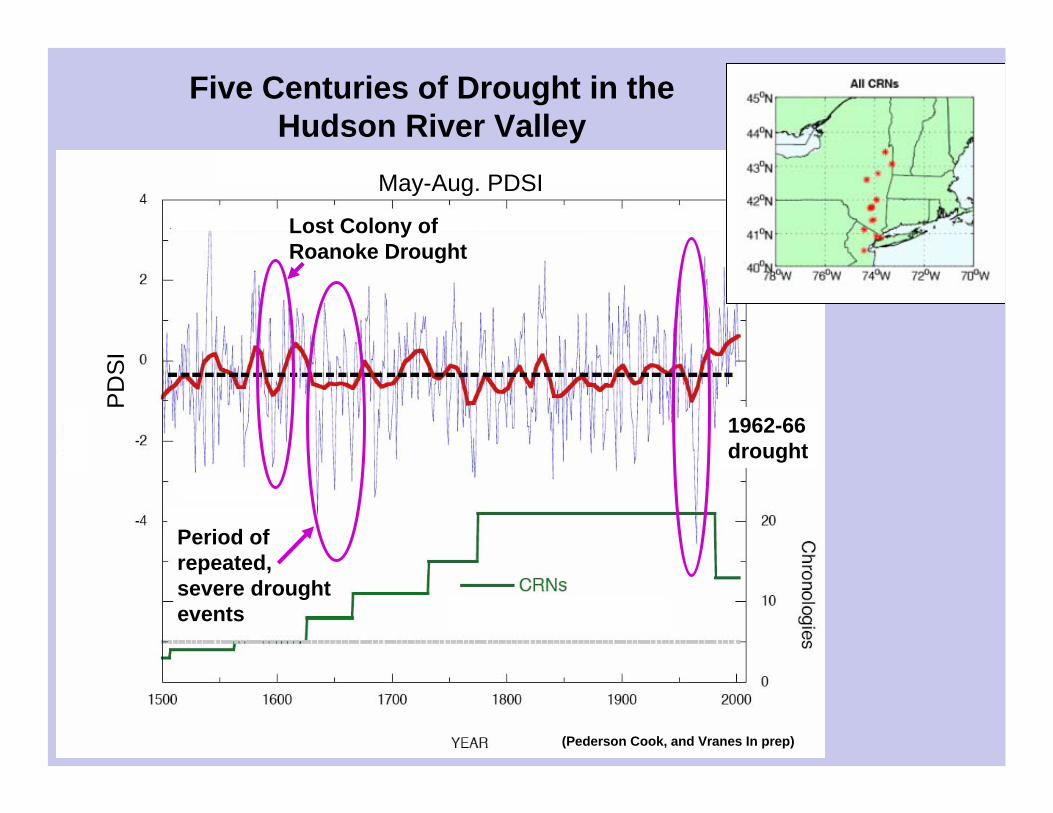
Five Centuries of Drought in the Hudson River Valley
(Pederson Cook, and Vranes In prep)
1962-66 drought
Lost Colony of Roanoke Drought
May-Aug. PDSI
PD
SI
Period of repeated, severe drought events
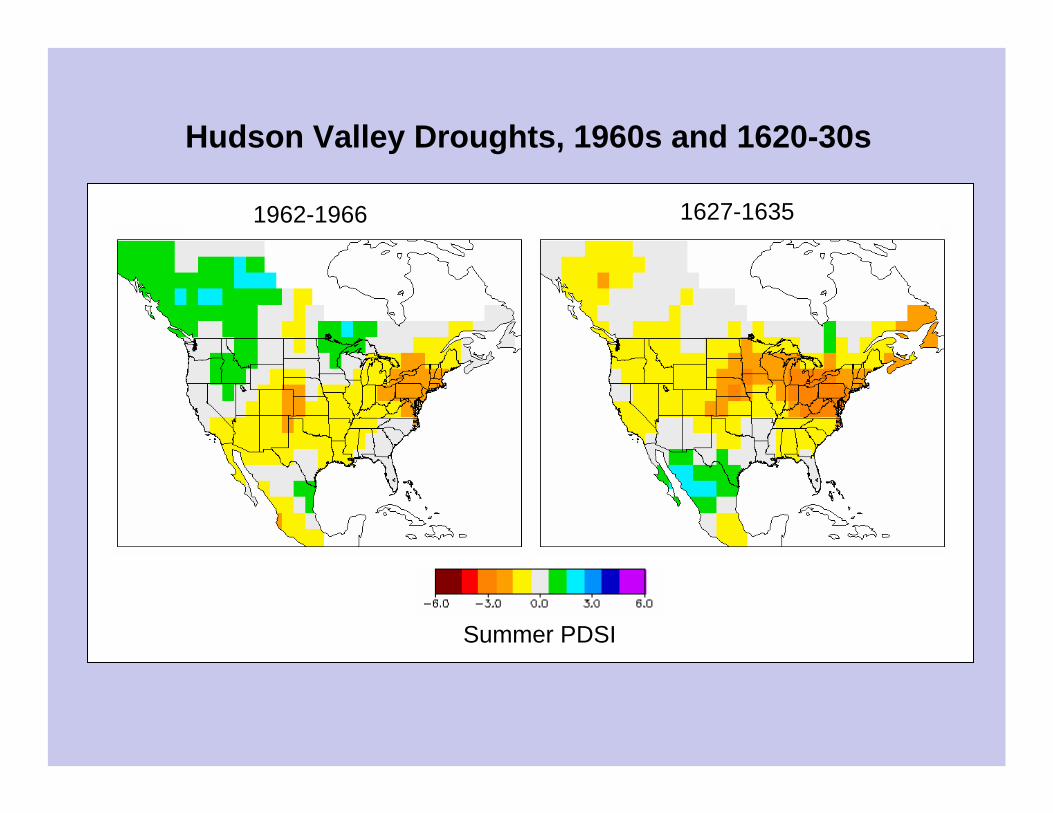
Hudson Valley Droughts, 1960s and 1620-30s
1962-1966 1627-1635
Summer PDSI
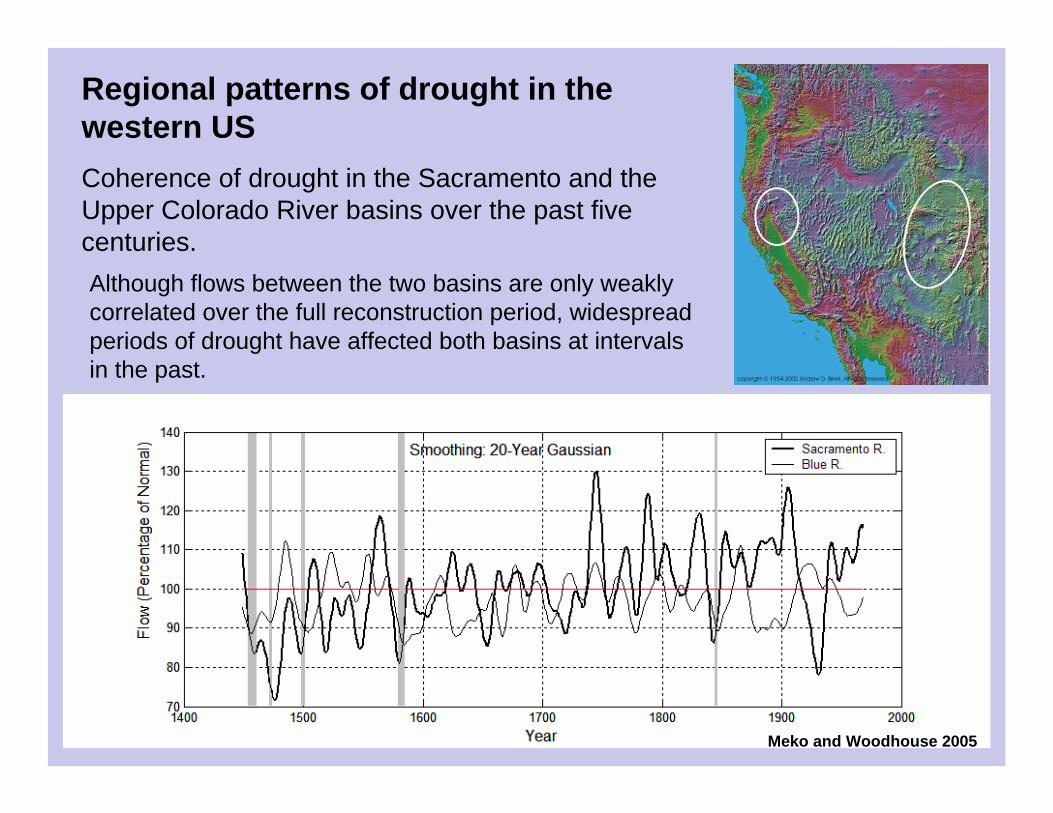
Regional patterns of drought in the western US Coherence of drought in the Sacramento and the Upper Colorado River basins over the past five centuries.
Meko and Woodhouse 2005
Although flows between the two basins are only weakly correlated over the full reconstruction period, widespread periods of drought have affected both basins at intervals in the past.
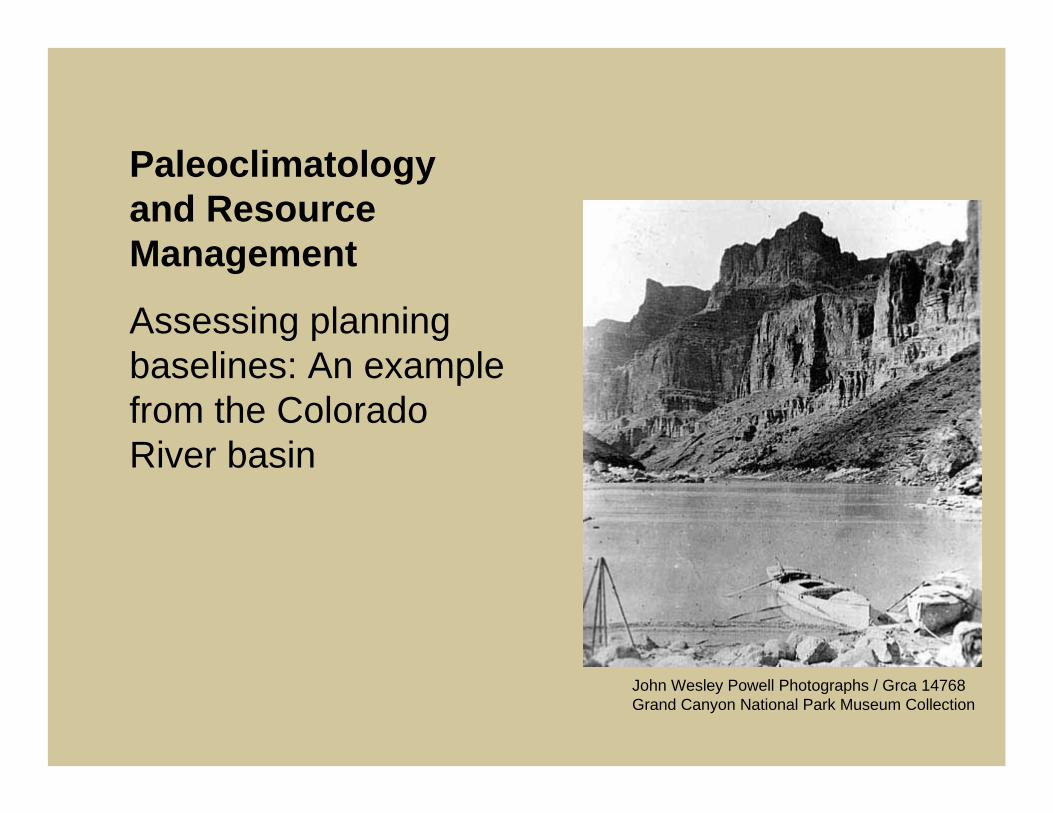
Paleoclimatology and Resource Management
Assessing planning baselines: An example from the Colorado River basin
John Wesley Powell Photographs / Grca 14768Grand Canyon National Park Museum Collection
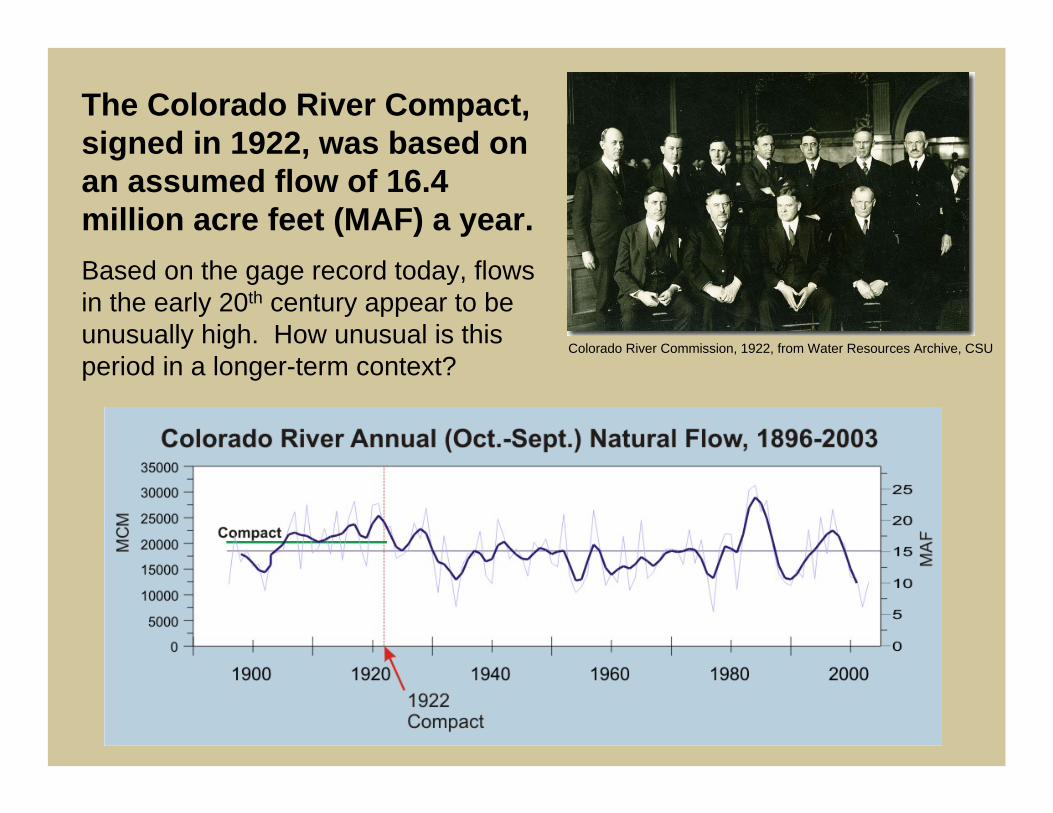
The Colorado River Compact, signed in 1922, was based on an assumed flow of 16.4 million acre feet (MAF) a year. Based on the gage record today, flows in the early 20th century appear to be unusually high. How unusual is this period in a longer-term context?
Colorado River Commission, 1922, from Water Resources Archive, CSU
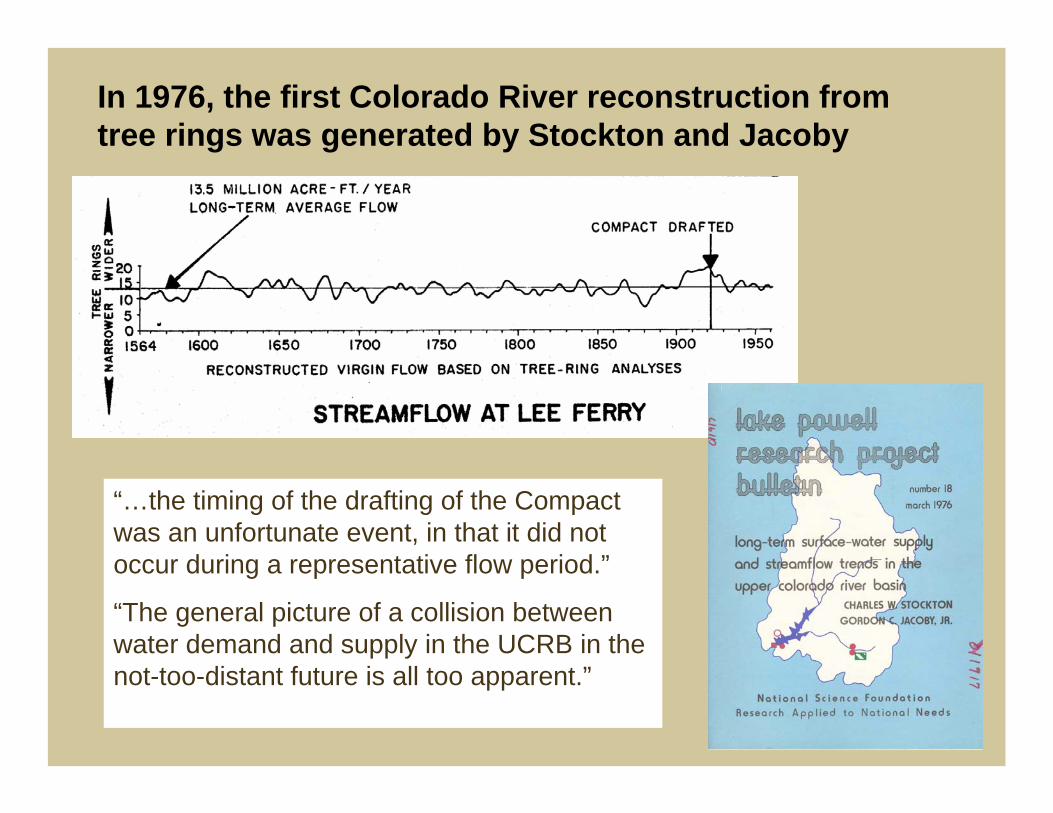
In 1976, the first Colorado River reconstruction from tree rings was generated by Stockton and Jacoby
“…the timing of the drafting of the Compact was an unfortunate event, in that it did not occur during a representative flow period.”
“The general picture of a collision between water demand and supply in the UCRB in the not-too-distant future is all too apparent.”
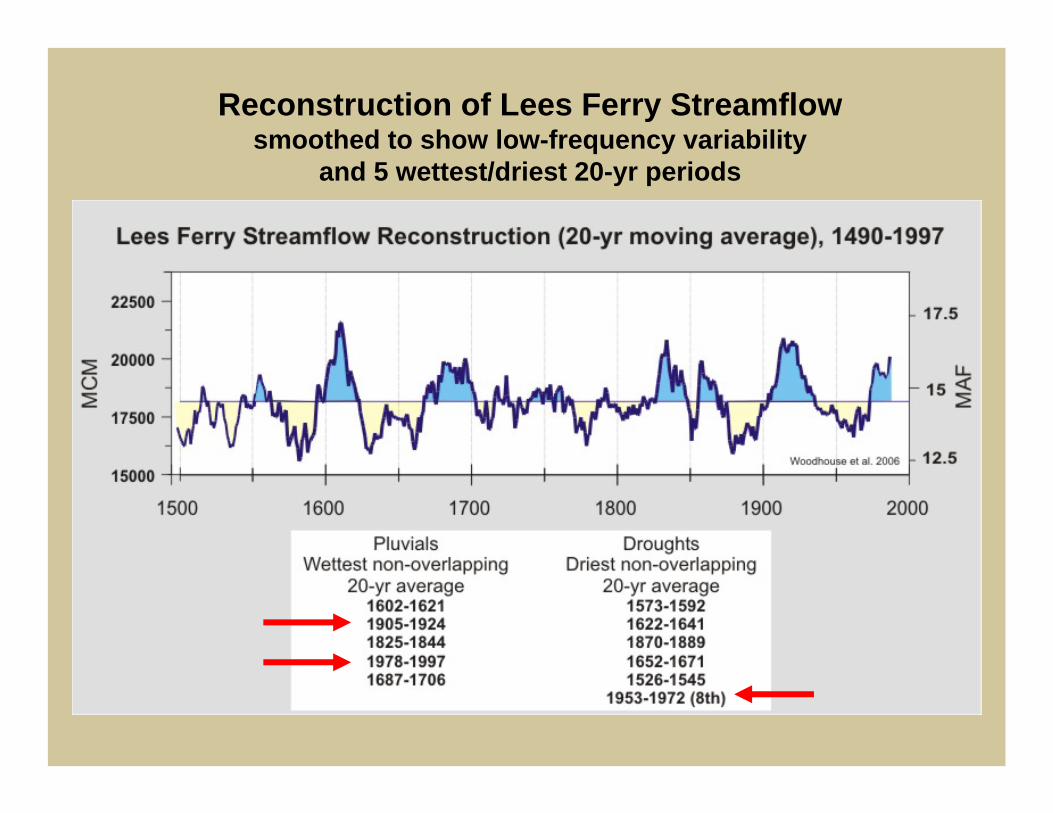
Reconstruction of Lees Ferry Streamflow smoothed to show low-frequency variability
and 5 wettest/driest 20-yr periods
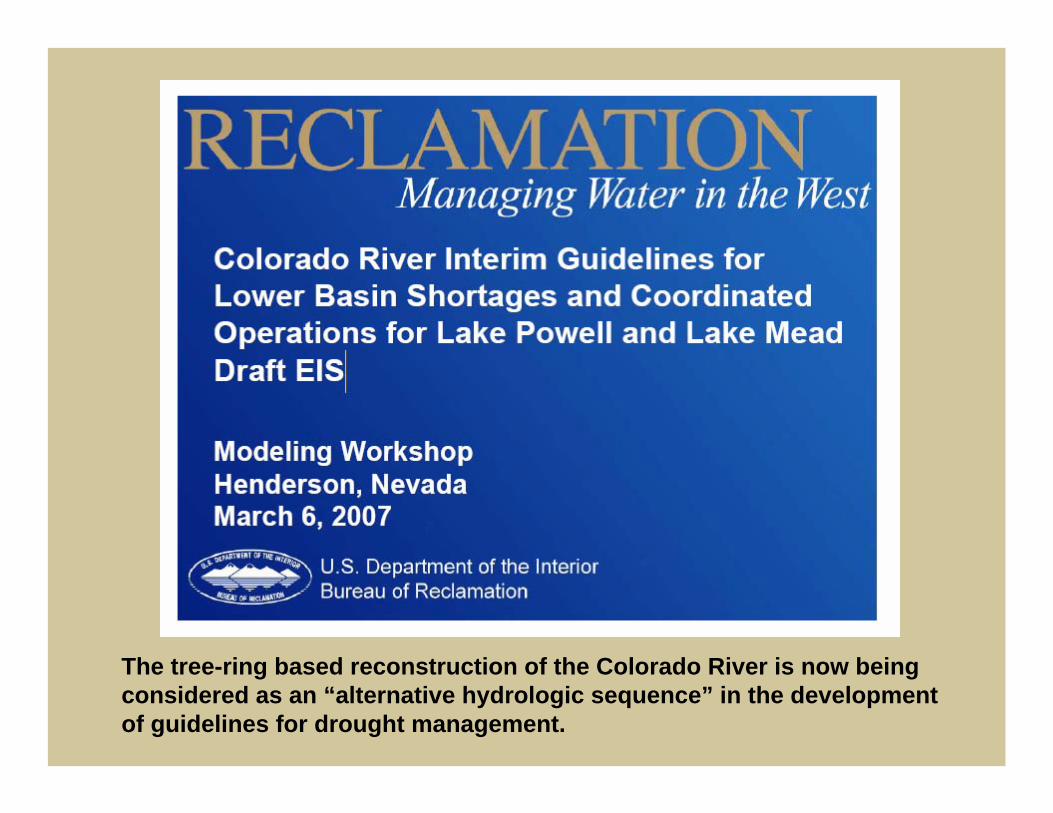
The tree-ring based reconstruction of the Colorado River is now being considered as an “alternative hydrologic sequence” in the development of guidelines for drought management.
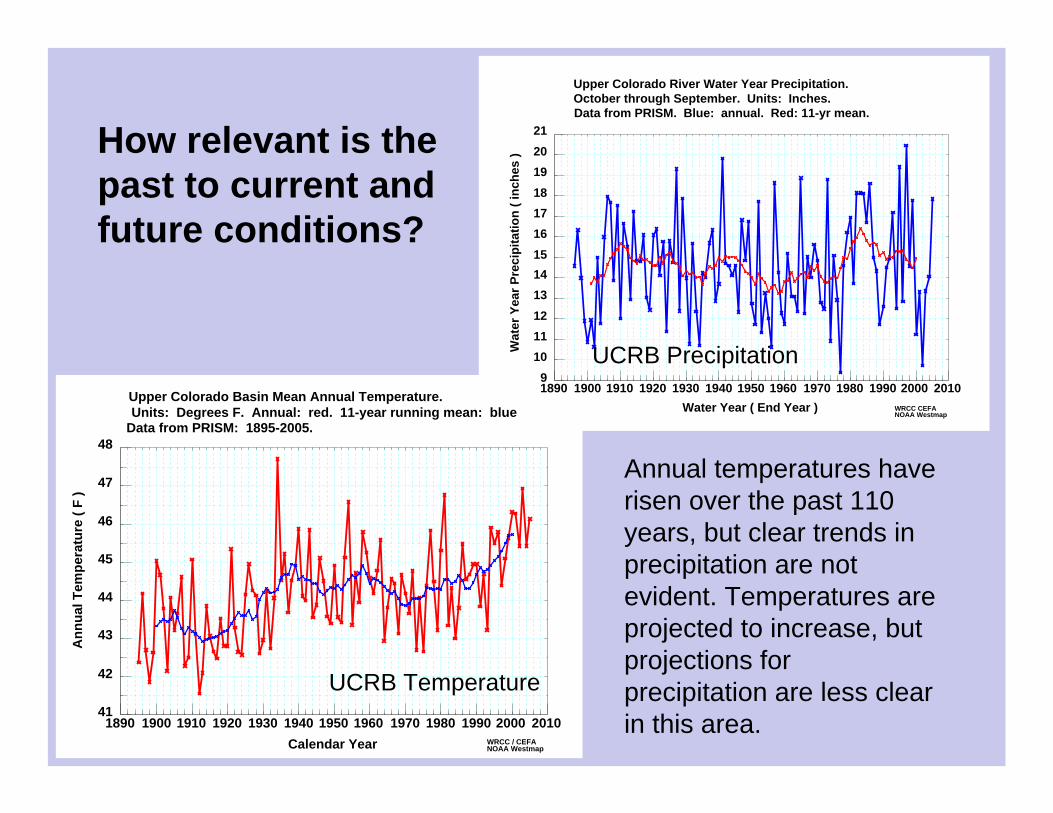
How relevant is the past to current and future conditions?
Upper Colorado Basin Mean Annual Temperature. Units: Degrees F. Annual: red. 11-year running mean: blue
Data from PRISM: 1895-2005. 48
47
46
45
44
43
42 UCRB Temperature 41
1890 1900 1910 1920 1930 1940 1950 1960 1970 1980 1990 2000 2010 WRCC / CEFACalendar Year NOAA Westmap
Ann
ual T
empe
ratu
re (
F )
Upper Colorado River Water Year Precipitation.October through September. Units: Inches.Data from PRISM. Blue: annual. Red: 11-yr mean.
21
20
19
18
17
16
15
14
13
12
11
10 UCRB Precipitation91890 1900 1910 1920 1930 1940 1950 1960 1970 1980 1990 2000 2010
Wat
er Y
ear P
reci
pita
tion
( inc
hes
)
Water Year ( End Year ) WRCC CEFANOAA Westmap
Annual temperatures haverisen over the past 110years, but clear trends in precipitation are not evident. Temperatures are projected to increase, but projections for precipitation are less clearin this area.
Role of Paleoclimatology in Climate Change
• Paleoclimatic records have been critical to the evaluation and attribution of the warming over the past century. Records indicate that global temperatures of the recent decades were the warmest in at least the past four centuries, and possibly over the past 1000 years or more.
• In contrast, paleoclimatic data indicate that droughts of the past century do not appear to be beyond the range of natural variability over past millennia.
• The climate of the past is unlikely to be replicated in the future, but natural climate variability –particularly moisture variability -- is likely to continue, underlying human-induced changes to climate. This variability may be a useful analogue for the future.
Many of the graphics presented here came from the NCDC Paleoclimatology Branch web site: http://www.ncdc.noaa.gov/paleo/paleo.html, through donations from many scientists.