Embed Size (px)
Citation preview

Munich Personal RePEc Archive
Cognitive capital, governance, and the
wealth of nations
Kodila-Tedika, Oasis and Rindermann, Heiner and
Christainsen, Gregory
Department of Economics, University of Kinshasa, DRC,
Department of Psychology, Chemnitz University of Technology,
Germany, Department of Economics, California State University,
East Bay USA
25 July 2014
Online at https://mpra.ub.uni-muenchen.de/57563/
MPRA Paper No. 57563, posted 25 Jul 2014 18:00 UTC

Prelmanary version
Cognitive capital, governance,
and the wealth of nations
Heiner Rindermann
Department of Psychology, Chemnitz University of Technology, Germany
Professor for Educational Psychology, Department of Psychology, Chemnitz University of Technology Wilhelm-Raabe-Str. 43, D-09107 Chemnitz, Germany
E-mail: [email protected] Tel. +49 371 531 38715, Fax +49 371 531 838715
Oasis Kodila-Tedika
Department of Economics, University of Kinshasa, Congo
Assistant Lecturer, Department of Economics, University of Kinshasa B.P. 832 KIN XI
Kinshasa, Democratic Republic of Congo. [email protected]
Gregory Christainsen
Department of Economics, California State University, East Bay USA
Professor of Economics, Department of Economics, California State University, East Bay, 25800 Carlos Bee Blvd., Hayward, CA 94542 USA

Competence and Governance
2
Abstract
Good governance or “government effectiveness” (per the World Bank) is seen as a critical
factor for the wealth of nations insofar as it shapes political and economic institutions and
affects overall economic performance. The quality of governance, in turn, depends on the
attributes of the people involved. In an analysis based on international data, government
effectiveness was related to the cognitive human capital of the society as a whole, of the
intellectual class, and of leading politicians. The importance of cognitive capital was reflected in
the rate of innovation, the degree of economic freedom, and country competitiveness, all of
which were found to have an impact on the level of productivity (GDP per capita) and wealth
(per adult). Correlation, regression, and path analyses involving N=98 to 201 countries showed
that government effectiveness had a very strong impact on productivity and wealth (total
standardized effects of =.56-.68). The intellectual class’s cognitive competence, seen as
background factor and indicated by scores for the top 5 percent of the population on PISA,
TIMSS and PIRLS, also had a strong impact (=.50-.54). Cross-lagged panel designs were used
to establish causal directions, including backward effects from economic freedom and wealth on
governance. The use of further controls showed no independent impacts on per capita wealth
coming from geographical variables or natural resource rents. Finally, we discuss background
factors and ways in which governance might be improved.
Keywords: government effectiveness, human capital, cognitive ability, intelligence,
economic freedom, innovation, competitiveness
JEL code : D73, I20, O55, O41

Competence and Governance
3
Good governance, the benign and efficient management of society via decisions and
institutions, can make a major contribution to the well-being of nations. Notorious
examples of bad governance include China’s “Great Leap Forward” under Mao Zedong
(from 1958 to 1961) resulting in a famine with 18 to 45 million deaths, and the
dictatorships of Adolf Hitler, Pol Pot, Idi Amin, and Saddam Hussein. By contrast good
governance promotes not only economic prosperity, but also freedom, the rule of law,
human rights, security, and peace.
How may good or bad governance affect society? Governance has an impact through
the development and interpretation of law, the negotiation of agreements with other
countries and international organizations, the shaping of political and economic
institutions, influence on human capital development and demographic policies, the
development and control of executive organs and the workforce in administration,
bureaucracy, police, judiciary, military, customs, tax bodies, and technical inspection
organs. Corruption and low quality in administration and economy are controlled;
competence, efficiency and meritoric principles are encouraged.
Since governance under modern conditions operates through many kinds of decisions
and institutions, the development of cognitive capital is critical for its success.
Educational policies are important for both the spread of basic skills and the emergence
of specialists working in political, economic, and scientific institutions managing
processes and developing new technologies. This view of governance is actively
promoted by the World Bank and its researchers (Kaufmann, 2003).
1 Human capital and cognitive ability theory
Aristotle wrote in his Nicomachean Ethics (VI, 8, 1141b; 2009) that “Prudence is
indeed the same quality of mind as statesmanship”, and that this prudence (or wisdom
and intelligence) is mirrored in legislation. Modern human capital theory relates
individual human capabilities to life outcomes such as job performance, marriage, and
health (Becker, 1993/1964). Studies of diverse forms of human capital – diligence,
conscientiousness, discipline and self-discipline, vitality, social competence, law-
abidingness, agreeableness, and cognitive ability – have typically found the last of
these to be the most important one. In statistical analyses of job performance, cognitive
ability has the highest predictive validity of any form of human capital. Depending on

Competence and Governance
4
the criteria used and corrections for low reliability and variance restriction, the
correlations and values for cognitive ability are typically between .25 and .80
(Salgado et al., 2003; Schmidt, 2012). Such results have been obtained in developing as
well as developed countries (Meisenberg et al., 2006). In more complex jobs, the
predictive validity of cognitive competence is even greater (e.g., r=.40-.58, Kuncel &
Hezlett, 2010). The relationships hold regardless of whether the analysis is of a cross-
sectional or longitudinal nature (Irwing & Lynn, 2006; Kramer, 2009).
One reason for these results is that cognitive ability tests are more reliable and valid
than measures of other types of human capital. It is also the case that people differ in
cognitive ability more so than they do with respect to fundamental traits. But
differences are a prerequisite for correlational predictivity. Thus, a fundamental
condition for successful job performance such as visual ability is not very predictive
because blind people are rare and frequently excluded from consideration (e.g., from
becoming a pilot).
More importantly, job requirements call for cognitive abilities because many tasks
are better addressed through the use of knowledge and deliberation. Especially in
modern and more complex jobs, learning is a prerequisite to becoming an effective
worker (Schmidt & Hunter, 1998). ). Job requirements themselves are cognitively
demanding, e.g. understanding instructions, orders, and security risks, prioritizing tasks,
coming to a decision, processing, and integrating and evaluating information for solving
problems. The performance of diverse professionals such as accountants,
businesspeople, physicians, engineers, managers, and scientists depends on cognitive
ability to one degree or another (Gottfredson, 2003). Cognitive ability is not only
helpful in navigating the educational selection and competence building process in
schools, but also in coping with conditions in jobs and in every day life, e.g. driving a
car, managing income and property, selecting a mate, educating children, and engaging
life in a healthy and sensible way. People with greater cognitive ability learn from their
mistakes and can therefore mimic what works elsewhere (Kodila-Tedika, 2012, 2013).
Intelligence is also positively related to patience, which enables players in institutions to
develop a better understanding of the principles and rules that govern them (Kodila-
Tedika & Kanyama-Kalonda, 2012; Shamosh & Gray, 2008).

Competence and Governance
5
An example of worst practice is revealing. According to Schmidt (2009, pp. 11ff.),
until the mid-1980s the Washington, DC police force was one of the best in the USA.
Applicants were selected for police academy training based on a general intelligence
test and a background investigation. The mayor, Marion Barry, eliminated this
procedure with several consequences: the drop-out rate among the police increased
(80% of the new hires were incapable of completing the required training); the content
of academy training was eased; the police officers being produced were frequently
incompetent (murder indictments were dismissed because the reports written by the
officers on the scene were unintelligible, solution rates for murder cases declined,
firearms accidents soared because officers did not know how to use weapons properly,
and crime on the police force became more common).
This example highlights not only the consequences of test abandonment for hiring
decisions and its cognitive outcomes, but also the effects of bad government on the
quality of institutions. Such a view is backed by systematic studies of the impact of
human capital on institutions and growth: (Glaeser, La Porta, Lopez-de-Silanes &
Shleifer, 2004, p. 297f.): “Much evidence points to the primacy of human capital for
both growth and democratization. ... The first order effect comes from human and social
capital, which shape both institutional and productive capacities of a society.” See also
Jones and Potrafke (2014).
The traditional human capital and cognitive ability approaches assume that their
constructs show an impact on the achievement of individuals. However, in addition they
have effects at higher order levels. First, there is a simple aggregation effect. Ability
and achievement averaged across different individuals will lead to corresponding results
at an aggregated level (e.g., intelligence and income: individual level across individuals:
r=.35, Kramer, 2009; national level across nations, GNP/GNI per capita: r=.57 to .77,
Lynn & Vanhanen, 2012a, p. 76f.). Second, there are interaction effects as the ability
level of others in groups influences the behavior and cognitive development of
individuals. Additionally, intelligence furthers cooperation within institutions (Jones,
2008). Third, there are also interaction effects insofar as the ability level of individuals
and groups influences the quality of institutions and the institutions again have an
impact on individual and group development (e.g., through the instructional quality of
teachers; Chetty et al., 2011; Rindermann & Heller, 2005). This could be extended from

Competence and Governance
6
classes and schools to administrative bodies, companies, politics, countries and cultures.
E.g., economies and societies at a higher ability level are likely to develop new and
complex technology and will absorb innovations from other countries more quickly
(Jones, 2012). Intelligence also reduces corruption (Potrafke, 2012), and more
intelligent people tend to prefer pro-market policies (Caplan & Miller, 2010), both of
which have a positive impact on economic growth.
Studies at the macro-social level usually show high correlations between average
cognitive ability and productivity (GDP) or income (GNI), where average cognitive
ability is assessed on the basis of intelligence tests or student achievement tests. The test
results are also typically related to the average number of years in primary, secondary
and tertiary schools or the percentage of the population with secondary school
qualifications. Correlations (r) between cognitive ability and production or income are
usually between r=.50 and .80 (Lynn & Vanhanen, 2012b).
However, in modernity the achievements of intellectual classes, high ability groups,
called by Pritchett and Viarengo (2009) “global performers” or the “team in the tail”,
who can “compete internationally” and “perform at a globally competitive level”, seem
to be especially crucial for enhancing the production of wealth. Hanushek and
Woessmann (2008) referred to them as “rocket scientists”. Their impact works via
technological innovation and management of complexity in companies and
administration – the last as a part of government effectiveness. Contrary to other forms
of “capital” there seems to be no diminishing returns from cognitive ability: the higher
the ability and the more intelligent persons there are, even at highest ability levels, the
better (Robertson, Smeets, Lubinski, & Benbow, 2010; Wai, 2013). The existence and
extent of such intellectual classes can be estimated in two different ways: the size of
higher ability groups (e.g., the share above SAS≥600, equivalent to IQ≥115; Hanushek
& Woessmann, 2009) or the ability level of the top group (e.g., brightest 5%;
Rindermann, Sailer & Thompson, 2009)1. Both operationalizations cover not only a
small elite, but a broader spectrum of cognitive workers including teachers, engineers,
entrepreneurs, physicians, lawyers, normal scientists, managers, accountants and
politicians, managing and working in the areas of education, innovation, economy,
administration and politics.
Competence and Governance
7
2 A model of governance effects
Good governance is a highly complex cognitive task. Leaders and administrators need
to acquire and interpret information, frequently from multiple and even contradictory
sources, process it in light of differing aims and values, and arrive at decisions. These
decisions are only provisional because the evaluation of outcomes and changing
conditions may call for fine-tuning or even revisions. To govern is to engage in complex
problem solving as studied in simulations, e.g., being a company manager or the mayor
of a community (Süß, 1999). We therefore assume that cognitive ability positively
contributes to the quality of governance. Especially at the level of intellectual classes,
which form the social basis for the government and political leaders, cognitive ability is
likely to be highly important. This is backed by a study of Simonton (2006) for US
presidents showing a positive relationship between intelligence and political success
(r=.33).
Good governance is studied under the term “government effectiveness.” As used by
World Bank researchers, it is defined as the quality of public services, the quality of the
civil service and the degree of its independence from political pressures, the quality of
policy formulation and implementation, and the credibility of the government’s
commitment to such policies (Kaufmann, Kraay & Mastruzzi, 2010, p. 4). This
government effectiveness is accompanied by further political criteria such as voice and
accountability (democracy and political liberty), political stability and absence of
violence (stability, low crime and peace), regulatory quality (the ability of the
government to formulate and implement sound policies and regulations that permit and
promote private sector development, related to economic freedom), rule of law (quality
of contract enforcement, the police, and the courts), and control of corruption (low
corruption).
The governance model clashes with a pure concept of liberalism, which generally
views government interventions as a threat to the economy and the well-being of
nations (Mises, 1996/1927; Hoppe, 2001). In contrast, we assume that good governance
can produce conditions favorable to economic performance. First, governments can
follow a more liberal or less liberal economic policy. If expressed in this way, we
1 More precisely, the intellectual classes’ level is the ability level at the 95th percentile rank, meaning the lower cognitive ability threshold of the top 5% group.
Competence and Governance
8
generally support a libertarian approach. Economic freedom is one of the most powerful
means to stimulate economic growth (de Haan, Lundstrom & Sturm, 2006), leading to
increased wealth and welfare, and is even reflected in human height (Western vs.
Eastern Germany, South vs. North Korea; Komlos & Kriwy, 2003; Schwekendiek &
Pak, 2009) and psychological well-being (Belasen & Hafer, 2012).
However, good governance can do more than simply abstain from doing harm.
Governments can stimulate the competitiveness of an economy, by setting rules (rule of
law, low corruption), by supporting research and innovation, and by encouraging the
development of human capital. As defined by the World Economic Forum, a country is
said to be competitive to the extent that it has institutions, policies, and other factors that
contribute to productivity (Schwab, 2013). Innovation is a central factor for the
competitiveness. All these factors contribute through productivity to wealth – the
possession of valuable assets. Governance, depending on cognitive ability of the general
society, intellectual classes and political leaders, working through economic freedom,
innovation and competitiveness, leading to productivity and wealth.
Of course, this model, like others, is a simplification of reality and its complexity.
What is missing is that, first, produced wealth needs to be maintained; a war, political
chaos, or destructive government can reduce it. However, a model with a path from
governance to wealth indirectly reflect these realities. More difficult to handle are
backward effects (i.e., instances of reverse causality). Longitudinal designs with cross-
lagged effects can be used to detect them. Going further, there can be previously-
ignored additional variables such as geography or natural resources. Next, background
variables such as culture, history, or genetic factors deserve consideration. While the
first ones can be easily added, the letter ones are difficult to measure. Finally, there are
always outliers and single country peculiarities such as an unexpected and sudden
detection of mineral resources (e.g., Equatorial Guinea: the largest oil producer in sub-
Saharan Africa on a per-capita basis) or wars in neighboring countries, impairing one’s
own society and economy (e.g., Jordan). In the case of special local and historical
conditions a general model needs to be adapted.

Competence and Governance
9
3 Method
[Remark for reviewers and editor: If wished, this part can be put into an appendix or online supplement
and in this case we provide only some summary information.]
3.1 Data
Cognitive ability: Data from various student assessment studies were combined: 1.
PISA (Programme for International Student Assessment – reading, mathematics and
science literacy of 15 year old students), 2000, 2003, 2006, 2009; TIMSS, 1995, 1999,
2003, 2007, 2011 (mathematics and science of 4th and 8th graders); PIRLS, 2001, 2006,
2011 (Reading literacy of 4th graders). 2. If for certain countries no data could be
obtained from PISA, PIRLS and TIMSS, older, regional or less representative studies
were considered: IEA-Reading Literacy Study 1991 (9-year-old and 14-year-old
students) and IAEP-II 1991 (International Assessment of Educational Progress,
mathematics and science, 9- and 13-year-old students), LLECE 1997 and 2005-2006
(Laboratorio Latinoamericano de Evaluación de la Calidad de la Educación, in third to
sixth grade reading, mathematics and science), SACMEQ 1995-1998, 1999-2004, 2007
(Southern and Eastern Africa Consortium for Monitoring Educational Quality; reading
and mathematics in sixth grade), MLA 1999 (Monitoring Learning Achievement;
literacy, numeracy and life skills in fourth grade), PASEC (Programme d’Analyse des
Systèmes Éducatifs; French and mathematics in second and fifth grade, due to low
comparability we took only mathematics), and results in the International Mathematical
Olympiad (IMO). The scores from student assessments were combined with
psychometric intelligence test data from Lynn and Vanhanen (2012a).
Before averaging, the data were, if necessary and possible, corrected for age
(depending on the country, students may be older or younger than the international
average) and school attendance rates (depending on the country, more or less youth
than an international average attends school). Student data from countries with only
regional data were corrected to be more accurate as country estimates; IQ estimates (not
directly measured) were also corrected. Obviously wrong results were excluded. Student
assessment scores and psychometric IQ test results are highly correlated and form a
strong international G-factor (r’s around .80 to .92; Coyle & Rindermann, 2013; Lynn
& Vanhanen, 2012b). At the level of individuals, knowledge (which should be
measured by SAS) and thinking (which should be better measured h by IQ tests)

Competence and Governance
10
influence each other (Maas et al., 2006; Rindermann, Flores-Mendoza & Mansur-Alves,
2010).
Many student assessment studies also provide data for the 95%-ability level
(intellectual classes, high achievement groups). All data were standardized in an IQ-
metric. A detailed description of the procedure can be found in Rindermann (2014). The
procedure is similar to the one used by Rindermann, Sailer and Thompson (2009). The
assumption is that student-based data are good proxies for the general (adult) ability
level in a society. Data are given for N=200 (cognitive ability mean) or N=98 countries
(95%-ability level) and correlate at r=.97 (N=98; see Table 1). Correlations with the
ability compilations of other researchers are high: r=.99 (average with average, N=200;
IQ-student assessment average, Lynn & Vanhanen, 2012a), r=.88 (average with
average, N=77; student assessment average, Hanushek & Woessmann, 2009) or r=.76
(95%-ability level with percentage of students with SAS=600 or higher, equivalent to
IQ≥115, N=74, same source), r=.94 (average with average, N=131; student assessment
average, Altinok, Diebolt & De Meulemeester, 2013) or r=.88 (95%-ability level with
percentage of students with SAS=600 or higher, equivalent to IQ≥115, N=96, same
source).
Competence of leading politicians: Data derived from educational levels (graduate
education, at least a postgraduate qualification, 1, or not, 0) of Besley and Reynal-
Querol (2011). In contrast to the original data set we coded every year (not only the
inaugural year of a leader). To get a more reliable and valid measure we took a longer
period, between 1960 and 2004. The correlation with a similar variable from
Rindermann et al. (2009, “cognitive ability of leading politicians” based on educational
degrees) is r=.44 (N=87, r=.62 not only using the graduate vs. not split). The Besley and
Reynal-Querol sample covers a much larger country sample (N=182 vs. 94), thus we
used their data. Data are given for N=182 countries.
Government effectiveness: Data come from the World Bank (Kaufmann, Kraay &
Mastruzzi, 2010, update 2012) and stand for the quality of public services, its
independence from political pressures, the quality of policy formulation and
implementation and the credibility of the government’s commitment to such policies.
Data for the period 1996-2011 are given for N=200 countries.
Competence and Governance
11
Innovation: Data come from the World Intellectual Property Organization (WIPO;
Dutta & Lanvin, 2013). WIPO ranks countries according to their innovations in science,
technology, economics and society based on seven pillars: Institutions including
politics, human capital (education and research), infrastructure, market sophistication
(credit and trade), business sophistication (knowledge workforce), knowledge and
technology outputs, and creative outputs (including arts).The Global Innovation Index
(GII) is used for the year 2013 (N=142 countries).
Competitiveness: The Global Competitiveness Index (GCI) from the World
Economic Forum (WEF; Schwab, 2013) reflects the set of institutions, policies, and
factors that determine the level of productivity of a country. This competitiveness is
built upon twelve pillars: The quality of institutions including a proper management of
public finances, the quality of infrastructure, the stability of the macroeconomic
environment, a healthy workforce, a well educated workforce, efficient goods markets,
efficiency and flexibility of the labor market, sound and well-functioning financial
sector, technological readiness and innovation by the development of new technological
and non-technological knowledge. There is some conceptual overlap with government
effectiveness (quality of institutions), but a majority of the pillars are the result of good
governance. Of course, innovation contributes to competitiveness, and these measures
are highly correlated (r=.90, N=133). Data from the period 2006-2013 are given for
N=148 countries.
Economic freedom: Our economic freedom measure is based on the Fraser index
(Gwartney, Lawson & Hall, 2013) and the Heritage index (Miller, Holmes & Feulner,
2013). From Fraser we used the longitudinal chain-linked index; if for single countries
data were not given but in the single year data set, we added them standardized on the
group of countries having data in both variables (chain-linked, single year). The index
takes on higher values in the presence of smaller government, an impartial legal system
with secure property rights, access to sound money, freedom to trade internationally,
and modest regulation of credit markets, labor markets, and business. The Heritage
index covers ten aspects in four categories: rule of law (property rights, freedom from
corruption), limited government (fiscal freedom, government spending), regulatory
efficiency (business freedom, labor freedom, monetary freedom), and open markets
(trade freedom, investment freedom, financial freedom). Fraser data are given for 1995

Competence and Governance
12
to 2011 (N=153), Heritage for 1995 to 2013 (N=181); the indices correlate with r=.86
(N=152). The sum exists for N=182 countries (Cronbach-=.93).
Economic productivity: We used as an intermediate criterion per capita gross
domestic product (GDP) 2010 from the Penn World Tables (Heston, Summers & Aten,
2012) in 2005 constant prices, with purchasing power parity (ppp) adapted to an
international dollar (Laspeyres). ‘GDP’ indicates the produced per capita standard of
living for one year. Because an increase at a lower level arguably has much more impact
on the quality of life, we also used the natural logarithm of GDP. It transforms
nonlinear, exponential increases in “currency units” to linear increases in more realistic
“quality of life units”. However, GDP-logs do not offer understandable units. For
communication purposes unlogged numbers are more useful. Data are given for N=189
countries.
Wealth: As a final criterion we used wealth holdings of households calculated per
adult according to the Credit Suisse Research Institute (2013, Tables 2-1 and 2-4,
current US dollar). Wealth is the marketable value of financial assets plus non-financial
assets (principally housing and land) less debts. For comparisons official exchange rates
were used. We also used the natural logarithm of wealth. Data for the year 2013 come
from N=174 countries.
Sub-Saharan Africa: As a control we applied a geographical variable that
distinguishes sub-Saharan African countries from the rest of the world. As in most
international data sets until recently, Sudan was not split into a northern and southern
part.
Absolute latitude: As a further geographical control we used absolute latitude or
antipodal latitude (distance from equator) derived from
https://opendata.socrata.com/dataset/Country-List-ISO-3166-Codes-Latitude-
Longitude/mnkm-8ram. Compared with the data used by Sala-i-Martin (1997, based on
the Barro-Lee collection) the correlation is r=.99 (N=133). The used variable represents
the absolute latitude average of a country, not a population-weighted absolute latitude
average (e.g., for Canada and Australia these distinctions are important). The same
geographical method for latitude average is used in the CIA World Factbook. Data are
given for N=202 countries.

Competence and Governance
13
Natural resources rents: A final control used was total natural resources rents,
calculated as the sum of oil rents, natural gas rents, coal rents (hard and soft), mineral
rents, and forest rents as a percent of GDP from the World Bank (2011). Data come
from the years 1995-2011 (average) for N=195 countries.
3.2 Statistical analyses
We performed correlation, regression and path analyses.
Regression and path analyses are used to calculate direct, indirect, net and sum
effects of variables. In these analyses the standardized path coefficients () between
different variables must be interpreted. Correlations are always added in parentheses.
Correlations help to quickly estimate the influence of other variables in a model (the
larger the difference between a correlation and a path coefficient, the larger is the
influence of other variables), and they make it possible to check the model (r=R²=1-
error) and to calculate the proportion of the explained variance in each factor (R²=r).
“Good” values for fit indices (if models are not saturated) are SRMR.08 or SRMR.05
and CFI.95 or CFI.97, and “acceptable” fit is reached with SRMR.10 and CFI.95.
For the analyses, SPSS 22 and Mplus 5.21 were used. Significance tests were not used
for interpretation (for an in-depth justification, see, e.g., Armstrong, 2007; Cohen, 1994;
Gigerenzer, 2004). Especially at the macro-social level they are questionable for
scientific reasoning. More instructive for inductive generalization – which is not
possible with significance tests – is the demonstration of the stability of relationships if
control variables are included (or across different country samples, different variable
operationalizations, different measurement points and various studies of different
authors). We use full-information maximum likelihood (FIML). This means no listwise
deletion in the case of missing data. All given information is used; behind single paths
and correlations stand differing sample sizes and country compositions (see Table 1 for
bivariate correlations).
We present standardized coefficients. First, they are comparable across differently
scaled predictors and criteria. Second, a majority of the variables do not have natural,
understandable and widely-used scales. Thus, unstandardized results would be less
meaningful.

Competence and Governance
14
4 Results
Table 1 around here please
Figure 1 around here please
Table 1 shows the correlations among the variables. All macrosocial variables are
positively correlated except for the sub-Saharan Africa dummy (Africa as 1, rest of
world 0) and natural resources rents (NNR) as a percent of GDP. At a country level a
relatively high level of natural resources rents seems to be an indicator of lesser
economic development. Of course, high NNRs are numerically possible only if other
incomes based on technology or services are low. However, longitudinally, natural
resources could harm economic productivity in non-resource based sectors (“Dutch
disease”; Corden & Neary, 1982).
There is only a minor correlation between the society’s cognitive ability mean and
the educational level of its political leaders (taken as an indicator of their competence):
r=.15 (with ability mean, N=181) or r=.14 (with top ability level, N=92). It is typically
the case that political leaders hail from the better-educated and higher-competence strata
of society. Additionally, educational degrees are difficult to compare across different
countries. However, there is considerable variation across regions with the West (North-
West-Middle Europe, North America and Australia-New Zealand) having on average
the best-educated politicians (on a scale between 0, not graduated, and 1, graduated,
M=0.50, SD=0.27, N=18 countries) and the Arab-Muslim world the least-educated
(M=0.15, SD=0.27, N=20), with sub-Saharan Africa also low (M=0.18, SD=0.29,
N=47).2 As expected, a reasonably high correlation is found between the political
leaders’ level and government effectiveness (r=.36, N=181).
Table 2 around here please
The cognitive ability mean and the top ability level have differing country sample sizes
(N=200 vs. N=98). Comparing them in the same country sample across all our given
variables (N=88) shows that the top ability level is more predictive for all positive
2 East-Asian politicians tend to be not very highly educated -- in contrast to the high test scores of East Asian students and adults (M=0.16, SD=0.28, N=7).

Competence and Governance
15
economic variables, e.g., for government effectiveness (r=.65 vs. r=.69), but not for the
non-economic variables: the sub-Saharan Africa dummy, natural resources rents and
absolute latitude (see Table 2). We see this as evidence for the intellectual classes
theory. I.e., the ability level of cognitive elites is crucial in modernity. Across different
regions and cultures there is a close relationship (see Figure 1, scatterplot). The
relationship appears to be slightly curvilinear, consistent with a view that government
effectiveness has a low threshold. Lower levels may be avoided by the positive
influence of advisors from international organizations, support by local but abroad
educated experts (e.g., at universities in North America and Europe) and by copying the
institutional features of developed countries.
Government effectiveness, innovation and competitiveness are highly correlated
(r=.90 to .92). There is some conceptual overlap. However, competent government
supports innovation and competitiveness by the fostering of research and economic
freedom. Similarly, economic freedom is highly (but somewhat less) correlated with
these three variables (r=.76 to .81).
The sub-Saharan Africa dummy correlates negatively with cognitive, technological
and economic modernity indicators. In the total sample, the cognitive ability mean and
GDP-log show the highest negative correlations (r=-.67 and -.64). In a same country
sample of N=88 the highest correlations could be found with the cognitive ability mean
and top ability level (r=-.44 and -.37). However, there are only data for four African
countries in all variables (Botswana, Ghana, Mauritius and South Africa), and one of
these countries (Mauritius) is, for the most part, not populated by sub-Saharan African
people.
Absolute latitude, the distance from the equator, is positively correlated with all
developmental indicators. The highest correlation is found for the cognitive ability
mean (r=.69). In the same country sample the highest correlations are with cognitive
ability (r=.62), top ability level (r=.60) and innovation (r=.51).
As mentioned before, natural resources rents are negatively correlated with
developmental and modernity indicators. The highest negative correlations are found for
economic freedom and government effectiveness (r=-.39 and -.34).
Generally, the logarithmic productivity and wealth measures are more highly
correlated with developmental indicators than the same measures in usual money units

Competence and Governance
16
(differences in correlation of about .10 or .20). The logarithm converts nonlinear,
exponential increases to linear ones appropriate for conventional statistical analyses
such as correlation, regression and path analyses. Also the correlation between one
year’s productivity, GDP, and the result of long term productivity, wealth, increases by
using the logarithmic transformation, from r=.73 to r=.92 (N=172). Both indicators
correlate most highly with competitiveness (r=.72 to r=.87), innovation (r=.68 to r=.86)
and government effectiveness (r=.70 to r=.84). Assuming no backward effects (which is
rather simplistic), these three factors are the most important variables for a country’s
wealth. However, even without backward effects from wealth these factors are not
exogenous variables. They depend, e.g., on the competence of political leaders and the
country’s cognitive ability level. These relationships were examined by using path
analyses.
Table 3 around here please
Figure 2 around here please
Before showing results from path analyses we want to mention the limits of
conventional regression studies (see Table 3). Regression analysis cannot typically
capture both direct and indirect effects. Thus, the relevance of background factors such
as cognitive ability will be underestimated insofar as it operates (indirectly) through an
impact on governance and institutions. Additionally, the traditional use of
unstandardized coefficients in regression analysis may lead to confusion with respect to
predictors using differing scales. Organizations have developed their own scales (from 1
to 10 or 1 to 100 or –3 to +3) and use different segments within scales. Unstandardized
effects are not strictly comparable in such a context. The only message we can take
from our regression analysis is that government effectiveness is more important than
other factors for wealth.
These problems are resolved by using path analyses and presenting the results in
terms of standardized effects. Figure 2 shows a path analysis using productivity and
wealth criteria in usual money units. The fit is very good CFI=.98 and SRMR=.03, and
the chosen model is consistent with the empirical covariations between the variables.
The cognitive ability mean and the top cognitive ability level are highly correlated

Competence and Governance
17
(r=.98). The correlation slightly deviates from the one calculated by SPSS (r=.97). First,
Mplus estimates correlations in a slightly different way (Muthen, 2009), and second,
there could be some minor rounding errors. In the first model we do not consider any
effects of the average cognitive ability of a society. However, intellectual classes come
from the general society. In any case, the top cognitive ability level has a positive
impact on the competence of leading politicians (95%CClP=.17), on government
effectiveness (95%GovE=.62), innovation (95%Inno=.36) and competitiveness
(95%Com=.16). These are all theoretically highly convincing paths insofar as people
working in these fields must have high cognitive ability to satisfy work requirements.
The competence of leading politicians also has a positive impact on government
effectiveness (CClPGovE=.26). Leading politicians manage government and affect
government effectiveness. They set the general conditions, and they select the staff for
administration. As a prime example, consider in Singapore longtime Prime Minister Lee
Kuan Yew (university degree with double First Class Honours from Cambridge): “I
realized that the more talented people I had as ministers, administrators, and
professionals, the more effective my policies were, and the better the results” (Yew,
2000, p. 135). According to the World Bank, Singapore’s government effectiveness has
been the second highest of the 200 countries evaluated.
Government effectiveness is crucial for economic freedom (GovEEF=.81). The two
concepts are theoretically distinguishable. A competent government pays attention to
economic liberty because it is a means to achieve higher competitiveness, economic
growth and wealth. However, some backward effects (economic freedom fosters not
only economic productivity, but also has a positive impact on government
effectiveness) cannot be excluded. Testing this, a longitudinal analysis using cross-
lagged effects for 135 countries between the middle of the 1990s and 2010 (see Figure
3) shows that government effectiveness has had in the past a stronger effect on
economic freedom (GovE96EF10=.29) than economic freedom on government
effectiveness (EF95GovE10=.06). Thus the direction of our chosen path is empirically
backed.
Figure 3 around here please
Competence and Governance
18
Similarly, government effectiveness has a positive impact on competitiveness (Figure 2,
directly and indirectly via economic freedom, direct: GovECom=.38; indirect:
GovE(ind)Com=.81.08=.06; total: GovE(tot)Com=.38+.06=.44), on innovation
(GovEInno=.67) and on productivity (direct: GovEGDP=.26; indirect via economic
freedom, competitiveness and innovation, indirect sum: GovE(ind)GDP=.34; total:
GovE(tot)GDP=.60).3
Productivity (GDP per capita) directly depends on competitiveness (ComGDP=.49)
and government effectiveness (GovEGDP=.26; total effect: GovE(tot)GDP=.60).
Figure 4 around here please
Wealth (per adult) directly depends on yearly productivity (GDPWealth=.37) and
government effectiveness (GovEWealth=.51; indirect: GovE(ind)Wealth=.22; total effect:
GovE(tot)Wealth=.73). The analysis of longitudinal data (for only a ten year interval) for
reciprocal effects between government effectiveness and wealth did not yield a clear
result (see Figure 4). Depending on how the wealth data were used (in monetary units or
logarithmic form) government effectiveness or wealth had a stronger effect (monetary
units: GovE00Wealth10=.20 vs. Wealth00GovE10=-.02; logarithm: GovE00Wealth10=.09 vs.
Wealth00GovE10=.12). There seem to be reciprocal effects. A cross-sectional model is in
this respect not sufficiently complex.
Figure 5 around here please
In a final path analysis (Figure 5) we have used logarithmic versions of GDP and
wealth. This model has as a feature that wealth increases in the lower tail receive more
emphasis. Lower tail increases are arguably more important for the improvement of
quality of life than wealth increases in the upper tail. Additionally, using the logarithm
converts nonlinear, exponential increases to linear ones. We also added three controls
for wealth, a sub-Saharan African dummy, absolute latitude and natural resources rents.
Finally, we added a direct path from the cognitive ability mean to productivity
3 Indirect effects of government effectiveness on GDP: (.67.37.49)+(.38.49)+(.81.08.49)=.34.
Competence and Governance
19
(CAMGDPl=.24). If we set such a path for a linear measure of GDP – i.e., GDP in a
nonlogarithmic form – the result is zero (CAMGDP=.00). Why is there such a
remarkable difference? Taking the logarithm means stressing differences at the lower to
average levels of the GDP distribution across countries. Compared to the influence of
intellectual classes (measured by the cognitive level of the 95th percentile), the influence
of the average ability range (as indicated by the cognitive ability of the general society)
is larger at the average levels of the GDP distribution. The impact of competitiveness
and government effectiveness is only slightly changed (ComGDPl=.45, minus .04;
GovEGDPl=.24, minus .02). The impact of GDP on wealth is increased dramatically,
from GDPWealth=.37 to GDPlWealthl=.70, and the direct effect of government
effectiveness decreases, from GovEWealth=.51 to GovEWealthl=.29.
The total impact of government effectiveness on wealth is now GovE(tot)Wealthl=.68,
and somewhat smaller than for wealth in monetary units (the total impact of government
effectiveness for not-log was: .73).4
The additional control variables in a model with cognitive ability mean, top cognitive
ability, competence of politicians, government effectiveness, innovation,
competitiveness, economic freedom and depending on them: GDP, cannot explain
further variance in wealth (expressed in logarithmic form): The sub-Saharan African
dummy has nearly no effect (sSAWealthl=-.04), and absolute latitude (ALatWealthl=.04)
and natural resources rents (NRRWealthl=.03) likewise have only trivial impacts.
Together they explain only 4% of the variance in national wealth, whereas government
effectiveness by itself directly explains 24%.5 However, the substantial correlations
between the sub-Saharan African dummy and wealth (in parentheses: r=-.58) and
between absolute latitude (distance to the equator) and wealth (r=.52) show a closer
relationship. But in our model the other human capital, political and economic attributes
of societies can explain the given wealth differences that are associated with geography.
Geography is not relevant – unless it is assumed that it influences the predictor variables
in our model, e.g., via culture.
4 Calculation of total effect of government effectiveness on log-wealth: .29+((.24+(.68.37.45)+(.40.45)+(.81.08.45)).70)=.68 (.683666). 5 Calculation of the variance explained in log-wealth by the three controls: (-.04-.58)+(.04.52)+(.03-.09)=.04. Calculation of the variance explained in log-wealth by government effectiveness: .29.83=.24.
Competence and Governance
20
The total effect of government effectiveness on wealth is GovE(tot)Wealthl=.68. The
total effect of competence of leading politicians on wealth is CClP(tot)Wealthl=.18.6 The
total effect of cognitive ability mean on wealth is CAM(tot)Wealthl=.17.7 Here we have
not considered that the intellectual classes come from the general society. Finally, the
total effect of the top cognitive ability level on wealth is 95% (tot)Wealthl=.54.8
Looking at productivity gives us the same pattern of results: GovE(tot)GDPl=.569,
CClP(tot)GDPl=.1510, CAM(tot)GDPl=.2411, and 95% (tot)GDPl=.5012.
Thus, government effectiveness is seen to be the crucial political-institutional variable
in understanding productivity and wealth differences between countries. Since
government effectiveness depends on the cognitive competence of politicians and the
intellectual class, it is not easy to change administrative and bureaucratic structures in a
sustainable way.
5 Discussion
Our aim has been to empirically analyze the impact of good governance on economic
productivity and wealth. We took as our measure of good governance the government
effectiveness concept of the World Bank (quality of policy formulation and its
implementation through public services). Government effectiveness depends positively
on the intellectual class’s ability level (the level of the top ability group at the 95th
percentile, total effect: 95%(tot)GovE=.66) and on the cognitive competence of leading
6 Calculation of competence of leading politicians on log-wealth: Taking the above .68 and multiplying with .26 = .18 (.17775316). 7 Calculation of cognitive ability mean on log-wealth: .24.70=.17 (.168). 8 Calculation of total effect of top cognitive ability level on log-wealth: We took the government effectiveness effect (.68 written for .683666): (.17.26.68)+(.62.68)+(.36.37.45.70)+(.14.45.70)=.54 (.540148957). 9 Calculation of total effect of government effectiveness on log-GDP: .24+(.68.37.45)+(.40.45)+(.81.08.45)=.56 (.56238). 10 Calculation of competence of leading politicians on log-GDP: Taking the above .56 and multiplying with .26 = .15 (.1462188). 11 Calculation of cognitive ability mean on log-GDP: Simply taking the direct effect of .24. 12 Calculation of total effect of top cognitive ability level on log-GDP: We took the government effectiveness effect (.56 written for .56238): (.17.26.56)+(.62.56)+(.36.37.45)+(.14.45)=.50 (.496472796).

Competence and Governance
21
politicians (CClP(tot)GovE=.2613). Using these two variables, we can explain 51-52
percent of the cross-national variation in government effectiveness.14
Of course, government policy and its implementation are also subject to ideological
currents, and even intelligent people can be influenced by bad ideas. We can shake our
heads about Mao Zedong and Adolf Hitler, but they and the people they governed in
their times were not lacking in general intelligence. From 1995 to 2010, however – the
period for which we have assembled quantitative evidence – there developed a fair
degree of consensus among intellectual people in support of free and open markets and
more generally of political freedom and rule of law.
Government effectiveness has a positive impact by supporting economic freedom,
innovation and competitiveness, which in turn affect economic productivity (GDP per
capita, total impact: GovE(tot)GDPl=.56) and wealth (per adult, total:
GovE(tot)Wealthl=.68). Our final model (Figure 5) using GDP and wealth in logarithmic
form explains a whopping 73 percent (GDP) and 88 percent (wealth) of the cross-
national variation in these variables. Compared to economic freedom (total on GDP:
EF(tot)GDPl=.04, total wealth: EF(tot)Wealthl=.0315) the impact of government
effectiveness is much larger. This result can also be inferred from the higher
correlations between government effectiveness and GDP/wealth than between economic
freedom and GDP/wealth (Table 1, mean across the four indicators: rGovE=.78 vs.
rEF=.64). Additional geographic and natural resources controls have only a minor
impact (<|.05|).
In the context of technological and social modernity, featuring increases in the
complexity of economies, politics and daily life (e.g., the coordination of supplies and
production, the management of financial assets, the competent operation of technology
as in telephones, TVs and cars), good governance is the crucial factor for producing and
maintaining national wealth.
13 For the effect of competence of leading politicians on government effectiveness direct and total effects are identical (only one effect). 14 Taken from the Mplus output. It can be also calculated by this, using Figure 2 or Figure 5: (.62.67)+(.26.36)=.51; (.62.69)+(.26.37)=.52. There are minor differences in correlations between SPSS and Mplus and in the correlations between the two models calculated by Mplus. 15 For the effect of economic freedom on GDP and wealth indirect and total effects are identical; taken from the final model in Figure 5.

Competence and Governance
22
As in previous studies (Rindermann et al., 2009) the level of the top ability group
(“intellectual classes”, “smart fractions”, “rocket scientists”, “the team in the tail”) had
the strongest impact on economic performance. Cognitive capitalism is built upon
intellectual classes.
However, we should not forget the limitations of our model: First, there are
backward, reciprocal effects: wealth may also have an impact on government
effectiveness (here Figure 4), GDP has also an effect on economic freedom
(Rindermann, 2012, Figures 1 and 2 therein) and economic freedom a small one on
government effectiveness (here Figure 3). But there is no hint that wealth/GDP
longitudinally has a stronger impact on government effectiveness than on economic
freedom. Rather, the opposite is true: there is longitudinally a stronger effect of
wealth/GDP on economic freedom. Thus, the stronger cross-sectional statistical impact
of government effectiveness on GDP/wealth than of economic freedom on GDP/wealth
is not due to a stronger reciprocal effect of GDP/wealth on government effectiveness.
What we have not analyzed here are backward effects of wealth on cognitive ability.
Previous longitudinal analyses at the international level (Rindermann, 2012) have
shown that the cognitive human capital effect on GDP/wealth is larger than the
backward effect of GDP/wealth on cognitive human capital (see also Christainsen,
2013). Research has shown that there are poor regions with low cognitive ability levels
(Africa or Bali; Rindermann, 2013; Rindermann & te Nijenhuis, 2012), but also poor
regions with average to high ability levels (Vietnam; Rindermann, Hoang &
Baumeister, 2013) and rich regions with rather low ability levels (Emirates;
Rindermann, Baumeister & Gröper, 2013). However, developing countries often
experience a “brain drain” from their intellectual classes (Kapur & McHale, 2005)
because developed countries provide better political, economic and institutional
working and living conditions for them (political stability, security, contract safety,
prospects for promotion, interaction with highly competent others). Africa in particular
suffers from this talent loss.
Second, further effects of government effectiveness on the control of corruption, rule
of law and human capital policies (leading to productivity and wealth) are not covered
by our model. Further studies can try to integrate them.

Competence and Governance
23
Third, we have not considered general background variables such as culture and
history including evolutionary history. Genes and evolutionary history appear to have
effects at the cross-country level (Ashraf & Galor, 2013; Meisenberg & Woodley, 2013;
Putterman & Weil, 2010; Rindermann, Woodley & Stratford, 2012; Spolaore &
Wacziarg, 2013), but no concrete gene-ability-relationships applicable to cross-country
analyses have yet been found.16 Thus, their explanatory value (as compared to their
statistical one) is small. Culture is a somewhat fuzzy concept. However, developing a
theory going out from world views and values influencing behavior in education,
learning, thinking, work and dealing with others (Weber, 2008/1904; Harrison, 2006)
may explain, after properly operationalizing such a theory, differences in our factors
from cognitive ability to governance.
Fourth, our model is a general one. Historical analyses of single countries and
regions may shed light on special regional and historical paths to wealth.
Fifth, there are concerns about the rating approach. Experts evaluating indicators for
different political and economic criteria (government effectiveness, economic freedom,
innovation and competitiveness) may be influenced by halo effects. For example, they
may perceive a competitive economy and therefore infer that there is a high level of
innovation. However, all global indicators are based on more specific ones. For some of
the specific ones there are objective measures. For others, guidelines exist as to how to
score them. Nevertheless, it would be better if the research organizations would
alternatively provide only measured indicators for their concepts.
Finally, productivity and wealth may be important for the well-being of nations, but
well-being itself is a broader concept encompassing psychological health and political
values – liberty, democracy, autonomy, civil society (“bürgerliche Gesellschaft”), rule
of law, peace, and a low crime rate (e.g., Ura, Alkire, Zangmo & Wangdi, 2012).
However, previous research (Rindermann et al., 2009; Vanhanen, 2011) as well as the
present paper offers evidence that cognitive ability contributes to all of the above. Good
governance would be aimed at improving these outcomes via health, demographic,
education and cultural change policies (Heckman, 2000; Hunt, 2012).
16 Possibly the first exception is the study of Piffer (2013). However, further research will be needed to establish the causal path from genes via proteins and neurological processes to intelligence and cross-country differences in gene frequencies.
Competence and Governance
24
References
Altinok, N., Diebolt, C. & De Meulemeester, J.-L. (2013). A new international database
on education quality: 1965-2010. Metz: Working Papers, Association Francaise de
Cliometrie (AFC), No. 3, www.cliometrie.org/images/wp/AFC_WP_03-2013.pdf.
Armstrong, J. S. (2007). Significance tests harm progress in forecasting. International
Journal of Forecasting, 23, 321-327.
Aristotle (2009/-330). Nicomachean ethics. New York: Oxford University Press.
Ashraf, Q. & Galor, O. (2013). The out of Africa hypothesis, human genetic diversity,
and comparative economic development American Economic Review, 103, 1-46.
Becker, G. S. (1993/1964). Human capital: A theoretical and empirical analysis with
special reference to education. Chicago: University of Chicago Press.
Belasen, A. R. & Hafer, R. W. (2012). Well-being and economic freedom: Evidence
from the States. Intelligence, 40, 306-316.
Besley, T. & Reynal-Querol, M. (2011). Do democracies select more educated leaders?
American Political Science Review, 105, 552-566.
Caplan, B. & Miller, S. C. (2010). Intelligence makes people think like economists:
Evidence from the General Social Survey. Intelligence, 38, 636-647.
Chetty, R., Friedman, J. N., Hilger, N., Saez, E., Schanzenbach, D. & Yagan, D. (2011).
How does your kindergarten classroom affect your earnings? Evidence from project
STAR. Quarterly Journal of Economics, 126, 1593-1660.
Christainsen, G. B. (2013). IQ and the wealth of nations: How much reverse causality?
Intelligence, 41, 688-698.
Cohen, J. (1994). The earth is round (p<.05). American Psychologist, 49, 997-1003.
Corden, W. M. & Neary, J. P. (1982). Booming sector and de-industrialisation in a
small open economy. The Economic Journal, 92, 825-848.
Coyle, Th. R. & Rindermann, H. (2013). Spearman’s Law of Diminishing Returns and
national ability. Personality and Individual Differences, 55, 406-410.
Credit Suisse Research Institute (2013). Global wealth databook 2013. Zurich: Credit
Suisse.
de Haan, J., Lundstrom, S. & Sturm, J-E. (2006). Market-oriented institutions and
policies and economic growth: A critical survey. Journal of Economic Surveys, 20,
157-191.

Competence and Governance
25
Dutta, S. & Lanvin, B. (2013). The global innovation index 2013. The local dynamics of
innovation. Ithaca: Cornell University, World Intellectual Property Organization
(WIPO). Retrieved from www.globalinnovationindex.org/content.aspx?page=gii-
full-report-2013.
Gigerenzer, G. (2004). Mindless statistics. Journal of Socio-Economics, 33, 587-606.
Glaeser, E. L., La Porta, R., Lopez-de-Silanes, F. & Shleifer, A. (2004). Do institutions
cause growth? Journal of Economic Growth, 9, 271-303.
Gottfredson, L. S. (2003). g, jobs and life. In H. Nyborg (Ed.), The scientific study of
general intelligence. Tribute to Arthur R. Jensen (pp. 293-342). Oxford: Pergamon.
Gwartney, J., Lawson, R. & Hall, J. (2013). Economic freedom of the world. 2013
annual report. Vancouver: Fraser Institute. Retrieved from
www.freetheworld.com/2013/EFW2013-complete.pdf.
Hanushek, E. A. & Woessmann, L. (2008). The role of cognitive skills in economic
development. Journal of Economic Literature, 46, 607-668.
Hanushek, E. A. & Woessmann, L. (2009). Do better schools lead to more growth?
Bonn: IZA DP No. 4575.
Harrison, L. E. (2006). The central liberal truth: How politics can change a culture and
save it from itself. New York: Oxford University Press.
Heckman, J. J. (2000). Policies to foster human capital. Research in Economics, 54, 3-
56.
Heston, A., Summers, R. & Aten, B. (2012). Penn World Table Version 7.1.
Philadelphia: University of Pennsylvania, Center for International Comparisons of
Production, Income and Prices. Retrieved from
https://pwt.sas.upenn.edu/php_site/pwt_index.php.
Hoppe, H.-H. (2001). Democracy: The god that failed. Rutgers: Transaction.
Hunt, E. (2012). What makes nations intelligent? Perspectives on Psychological
Science, 7, 284-306.
Irwing, P. & Lynn, R. (2006). The relation between childhood IQ and income in middle
age. Journal of Social Political and Economic Studies, 31, 191-196.
Jones, G. (2008). Are smarter groups more cooperative? Evidence from prisoner's
dilemma experiments, 1959-2003 Journal of Economic Behavior & Organization,
68, 489-497.
Competence and Governance
26
Jones, G. (2012). Cognitive skill and technology diffusion: An empirical test. Economic
Systems, 36, 444-460.
Jones, G. & Potrafke, N. (2014). Human capital and national institutional quality: Are
TIMMS, PISA, and national average IQ robust predictors? Intelligence, 46, 148-155.
Kapur, D. & McHale, J. (2005). Give us your best and brightest: The global hunt for
talent and its impact on the developing world. Washington: Center for Global
Development.
Kaufmann, D. (2003). Rethinking governance: Empirical lessons challenge orthodoxy.
Washington: World Bank. Retrieved from
http://siteresources.worldbank.org/INTWBIGOVANTCOR/Resources/rethink_gov_s
tanford.pdf.
Kaufmann, D., Kraay, A. & Mastruzzi, M. (2010). The worldwide governance
indicators. Methodology and analytical issues. Washington: The World Bank, Policy
Research Working Paper 5430. Updated: The Worldwide Governance Indicators,
2012 Update. Retrieved from
http://info.worldbank.org/governance/wgi/wgidataset.xlsx.
Kodila-Tedika, O. (2012). Governance and intelligence: Empirical analysis from
African data. University Library of Munich, Germany: MPRA Paper 39937.
Kodila-Tedika, O. (2013, forthcoming). Governance and intelligence: Empirical
analysis from African data. Journal of African Development.
Kodila-Tedika, O. & Kalonda-Kanyama, I. (2012). Quality of institutions: Does
intelligence matter? Economic Research Southern Africa: Working Papers 308.
Kodila-Tedika, O. & Bolito-Losembe, R. 2014. "Poverty and Intelligence: Evidence
using Quantile Regression," Economic Research Guardian, vol. 4(1), pages 25-32,
June.
Komlos, J. & Kriwy, P. (2003). The biological standard of living in the two Germanies.
German Economic Review, 4, 493-507.
Kramer, J. (2009). General mental ability and occupational success in Germany.
Psychologische Rundschau, 60, 82-98.
Kuncel, N. R. & Hezlett, S. A. (2010). Fact and fiction in cognitive ability testing for
admissions and hiring decisions. Current Directions in Psychological Science, 19,
339-345.

Competence and Governance
27
Lynn, R. & Vanhanen, T. (2012a). Intelligence. A unifying construct for the social
sciences. London: Ulster Institute for Social Research.
Lynn, R. & Vanhanen, T. (2012b). National IQs: A review of their educational,
cognitive, economic, political, demographic, sociological, epidemiological,
geographic and climatic correlates. Intelligence, 40, 226-234.
Maas, H. L. J. v. d., Dolan, C. V., Grasman, R. P. P. P., Wicherts, J. M., Huizenga, H.
M. & Raijmakers, M. E. J. (2006). A dynamical model of general intelligence: The
positive manifold of intelligence by mutualism. Psychological Review, 113, 842-861.
Meisenberg, G. & Woodley, M. A. (2013). Global behavioral variation: A test of
differential-K. Personality and Individual Differences, 55, 273-278.
Meisenberg, G., Lawless, E., Lambert, E. & Newton, A. (2006). The social ecology of
intelligence on a Caribbean island. Mankind Quarterly, 46, 395-433.
Miller, T., Holmes, K. R. & Feulner, E. J. (2013). 2013 index of economic freedom.
Washington: The Heritage Foundation. Retrieved from
www.heritage.org/index/pdf/2013/book/index_2013.pdf.
Mises, L. v. (1996/1927). Liberalism: The classical tradition. New York: Cobden Press.
Muthen, L. K. (2009). Blog entry on Mplus, January 28, 2009. Retrieved from
www.statmodel.com/discussion/messages/8/3908.html?1366413074.
Piffer, D. (2013). Correlation of the COMT Val158Met polymorphism with latitude and
a hunter-gather lifestyle suggests culture-gene coevolution and selective pressure on
cognition genes due to climate. Anthropological Science, 121, 161-171.
Potrafke, N. (2012). Intelligence and corruption. Economics Letters, 114, 109-112.
Pritchett, L. & Viarengo, M. (2009). Producing superstars for the economic mundial:
The Mexican predicament with quality of education. In R. Hausmann, E. L. Austin &
I. Mia (Eds.), The Mexico competitiveness report 2009 (pp. 71-89). Genf/Harvard:
World Economic Forum.
Putterman, L. & Weil, D. (2010). Post-1500 population flows and the long run
determinants of economic growth and inequality. Quarterly Journal of Economics,
125, 1627-1682.
Rindermann, H. (2012). Intellectual classes, technological progress and economic
development: The rise of cognitive capitalism. Personality and Individual
Differences, 53, 108-113.

Competence and Governance
28
Rindermann, H. (2013). African cognitive ability: Research, results, divergences and
recommendations. Personality and Individual Differences, 55, 229-233.
Rindermann, H. (2014/in preperation). Cognitive capitalism: Human capital and the
wealth of nations. Cambridge: Cambridge University Press.
Rindermann, H., Baumeister, A. E. E. & Gröper, A. (2013). Cognitive abilities of
Emirati and German engineering university students. Journal of Biosocial Science.
DOI: 10.1017/S0021932013000266
Rindermann, H. & Heller, K. A. (2005). The benefit of gifted classes and talent schools
for developing students’ competences and enhancing academic self-concept.
Zeitschrift für Pädagogische Psychologie, 19, 133-136.
Rindermann, H., Hoang, Q. S. N. & Baumeister, A. E. E. (2013). Cognitive ability,
parenting and instruction in Vietnam and Germany. Intelligence, 41, 366-377.
Rindermann, H. & te Nijenhuis, J. (2012). Intelligence in Bali – A case study on
estimating mean IQ for a population using various corrections based on theory and
empirical findings. Intelligence, 40, 395-400.
Rindermann, H., Flores-Mendoza, C. & Mansur-Alves, M. (2010). Reciprocal effects
between fluid and crystallized intelligence and their dependence on parents’
socioeconomic status and education. Learning and Individual Differences, 20, 544-
548.
Rindermann, H., Sailer, M., & Thompson, J. (2009). The impact of smart fractions,
cognitive ability of politicians and average competence of peoples on social
development. Talent Development and Excellence, 1, 3-25.
Rindermann, H., Woodley, M. A. & Stratford, J. (2012). Haplogroups as evolutionary
markers of cognitive ability. Intelligence, 40, 362-375.
Robertson, K. F., Smeets, S., Lubinski, D., & Benbow, C. P. (2010). Beyond the
threshold hypothesis. Current Directions in Psychological Science, 19, 346-351.
Sala-i-Martin, X. (1997). I just ran two million regressions. American Economic
Review, 87, 178-183.
Salgado, J. F., Anderson, N., Moscoso, S., Bertua, C., De Fruyt, F. & Rolland, J. P.
(2003). A meta-analytic study of general mental ability validity for different
occupations in the European Community. Journal of Applied Psychology, 88, 1068-
1081.

Competence and Governance
29
Schmidt, F. L. (2009). Select on intelligence. In E. A. Locke (Ed.), Handbook of
principles of organizational behavior (pp. 3-17). Oxford: Blackwell.
Schmidt, F. L. (2012). Cognitive tests used in selection can have content validity as well
as criterion validity: A broader research review and implications for practice.
International Journal of Selection and Assessment, 20, 1-13.
Schmidt, F. L. & Hunter, J. E. (1998). The validity and utility of selection methods in
personnel psychology: Practical and theoretical implications of 85 years of research
findings. Psychological Bulletin, 124, 262-274.
Schwab, K. (2013). The global competitiveness report 2013-2014. Geneva: World
Economic Forum. Retrieved from
www3.weforum.org/docs/WEF_GlobalCompetitivenessReport_2013-14.pdf.
Schwekendiek, D. & Pak, S. (2009). Recent growth of children in the two Koreas: A
meta-analysis. Economics and Human Biology, 7, 109-112.
Shamosh, N. A. & Gray, J. R. (2008). Delay discounting and intelligence: A meta-
analysis. Intelligence, 36, 289-305.
Simonton, D. K. (2006). Presidential IQ, openness, intellectual brilliance, and
leadership: Estimates and correlations for 42 US chief executives. Political
Psychology, 27, 511-526.
Spolaore, E. & Wacziarg, R. (2013). How deep are the roots of economic development?
Journal of Economic Literature, 51, 325-369.
Süß [Suess], H.-M. (1999). Intelligence and complex problem solving. Psychologische
Rundschau, 50, 220-228.
Ura, K., Alkire, S., Zangmo, T. & Wangdi, K. (2012). An extensive analysis of GNH
index. Thimphu: The Centre for Bhutan Studies.
Vanhanen, T. (2011). IQ and international wellbeing indexes. Journal of Social,
Political and Economic Studies, 36, 80-89.
Wai, J. (2013). Investigating America’s elite: Cognitive ability, education, and sex
differences. Intelligence, 41, 203-211.
Weber, M. (2008/1904). The Protestant ethic and the spirit of capitalism. New York:
Oxford University Press.
World Bank (2011). The changing wealth of nations: Measuring sustainable
development in the new millennium. Washington. Data retrieved November 5, 2013

Competence and Governance
30
from
http://api.worldbank.org/v2/en/indicator/ny.gdp.totl.rt.zs?downloadformat=excel.
Yew, L. K. (2000). From Third World to First. The Singapore story 1965-2000.
Singapore and the Asian economic boom. New York: Harper Collins.
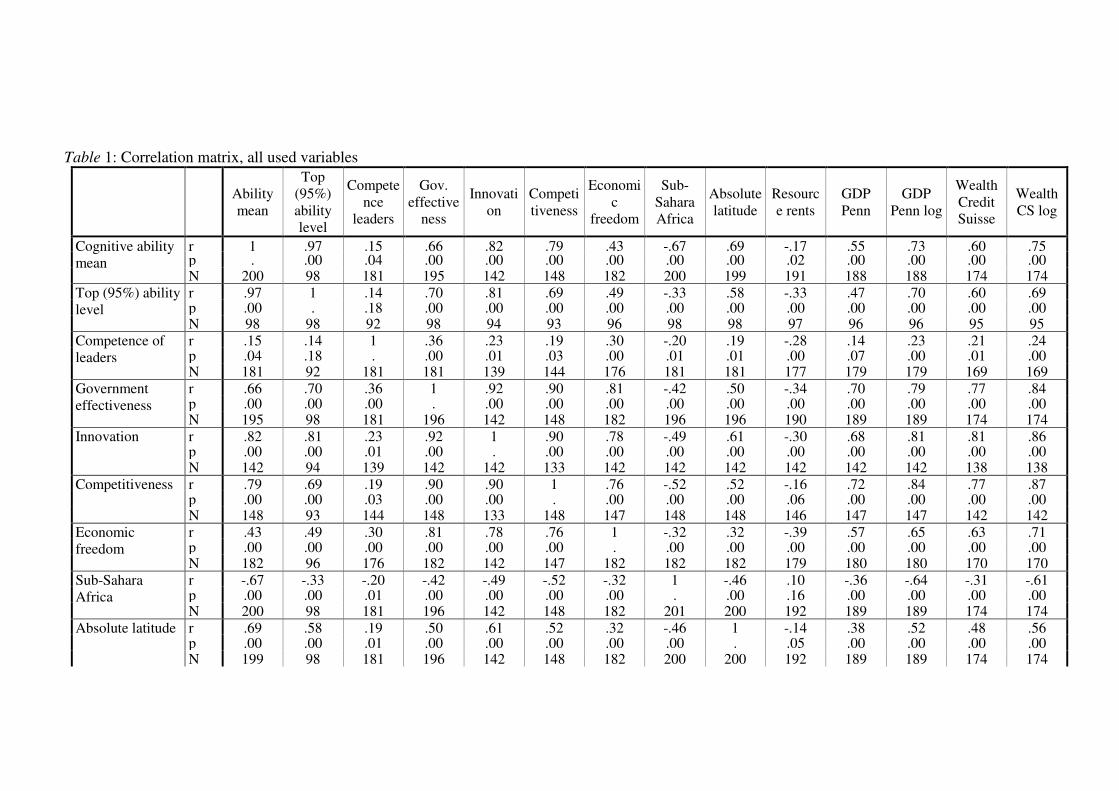
Table 1: Correlation matrix, all used variables
Ability mean
Top (95%) ability level
Competence
leaders
Gov. effective
ness
Innovation
Competitiveness
Economic
freedom
Sub-Sahara Africa
Absolute latitude
Resource rents
GDP Penn
GDP Penn log
Wealth Credit Suisse
Wealth CS log
Cognitive ability mean
r 1 .97 .15 .66 .82 .79 .43 -.67 .69 -.17 .55 .73 .60 .75 p . .00 .04 .00 .00 .00 .00 .00 .00 .02 .00 .00 .00 .00 N 200 98 181 195 142 148 182 200 199 191 188 188 174 174
Top (95%) ability level
r .97 1 .14 .70 .81 .69 .49 -.33 .58 -.33 .47 .70 .60 .69 p .00 . .18 .00 .00 .00 .00 .00 .00 .00 .00 .00 .00 .00 N 98 98 92 98 94 93 96 98 98 97 96 96 95 95
Competence of leaders
r .15 .14 1 .36 .23 .19 .30 -.20 .19 -.28 .14 .23 .21 .24 p .04 .18 . .00 .01 .03 .00 .01 .01 .00 .07 .00 .01 .00 N 181 92 181 181 139 144 176 181 181 177 179 179 169 169
Government effectiveness
r .66 .70 .36 1 .92 .90 .81 -.42 .50 -.34 .70 .79 .77 .84 p .00 .00 .00 . .00 .00 .00 .00 .00 .00 .00 .00 .00 .00 N 195 98 181 196 142 148 182 196 196 190 189 189 174 174
Innovation
r .82 .81 .23 .92 1 .90 .78 -.49 .61 -.30 .68 .81 .81 .86 p .00 .00 .01 .00 . .00 .00 .00 .00 .00 .00 .00 .00 .00 N 142 94 139 142 142 133 142 142 142 142 142 142 138 138
Competitiveness
r .79 .69 .19 .90 .90 1 .76 -.52 .52 -.16 .72 .84 .77 .87 p .00 .00 .03 .00 .00 . .00 .00 .00 .06 .00 .00 .00 .00 N 148 93 144 148 133 148 147 148 148 146 147 147 142 142
Economic freedom
r .43 .49 .30 .81 .78 .76 1 -.32 .32 -.39 .57 .65 .63 .71 p .00 .00 .00 .00 .00 .00 . .00 .00 .00 .00 .00 .00 .00 N 182 96 176 182 142 147 182 182 182 179 180 180 170 170
Sub-Sahara Africa
r -.67 -.33 -.20 -.42 -.49 -.52 -.32 1 -.46 .10 -.36 -.64 -.31 -.61 p .00 .00 .01 .00 .00 .00 .00 . .00 .16 .00 .00 .00 .00 N 200 98 181 196 142 148 182 201 200 192 189 189 174 174
Absolute latitude
r .69 .58 .19 .50 .61 .52 .32 -.46 1 -.14 .38 .52 .48 .56 p .00 .00 .01 .00 .00 .00 .00 .00 . .05 .00 .00 .00 .00 N 199 98 181 196 142 148 182 200 200 192 189 189 174 174

Competence and Governance
32
Natural resources rents
r -.17 -.33 -.28 -.34 -.30 -.16 -.39 .10 -.14 1 .03 .00 -.14 -.05 p .02 .00 .00 .00 .00 .06 .00 .16 .05 . .70 .99 .07 .49 N 191 97 177 190 142 146 179 192 192 192 187 187 172 172
GDP/capita Penn
r .55 .47 .14 .70 .68 .72 .57 -.36 .38 .03 1 .79 .73 .75 p .00 .00 .07 .00 .00 .00 .00 .00 .00 .70 . .00 .00 .00 N 188 96 179 189 142 147 180 189 189 187 189 189 172 172
GDP/cap Penn log
r .73 .70 .23 .79 .81 .84 .65 -.64 .52 .00 .79 1 .64 .92 p .00 .00 .00 .00 .00 .00 .00 .00 .00 .99 .00 . .00 .00 N 188 96 179 189 142 147 180 189 189 187 189 189 172 172
Wealth/adult Credit Suisse
r .60 .60 .21 .77 .81 .77 .63 -.31 .48 -.14 .73 .64 1 .77 p .00 .00 .01 .00 .00 .00 .00 .00 .00 .07 .00 .00 . .00 N 174 95 169 174 138 142 170 174 174 172 172 172 174 174
Wealth/adult CS log
r .75 .69 .24 .84 .86 .87 .71 -.61 .56 -.05 .75 .92 .77 1 p .00 .00 .00 .00 .00 .00 .00 .00 .00 .49 .00 .00 .00 . N 174 95 169 174 138 142 170 174 174 172 172 172 174 174
Table 2: Correlations between cognitive ability measures and the other variables in a same country sample
Competence
leaders
Gov. effective
ness
Innovation
Competitiveness
Economic
freedom
Sub-Sahara Africa
Absolute latitude
Resource rents
GDP Penn
GDP Penn log
Wealth Credit Suisse
Wealth CS log
Cognitive ability mean r .13 .65 .79 .65 .41 -.44 .62 -.37 .38 .63 .58 .66 p .23 .00 .00 .00 .00 .00 .00 .00 .00 .00 .00 .00
Top (95%) ability level r .15 .69 .81 .67 .47 -.37 .60 -.36 .44 .69 .60 .68 p .17 .00 .00 .00 .00 .00 .00 .00 .00 .00 .00 .00
Notes: N=88.

Competence and Governance
33
Table 3: Prediction of wealth (logarithm, regression analysis) Predictor Standardized regression
coefficient ()
Predictor scale Unstandardized effect for wealth in monetary units (only direct effects, not indirect; in current US dollar)
Top (95%) ability level .07 IQ, from (empirically) around 77 to 126, M=108.42, SD=10.31
+ 1 IQ point + $ 777
Government effectiveness .48 World Bank scale, from (empirically) around –2.50 to +2.50, M=0.54, SD=0.88
+ 1 WB scale point + $ 60.836
Innovation .10 WIPO scale, from (empirically) around 19 to 67, M=42.60, SD=10.38
+ 1 WIPO scale point + $ 1.012
Competitiveness .24 WEF scale, from (empirically) around 2.60 to 5.80, M=4.47, SD=0.57
+ 1 WEF scale point + $ 45.734
Economic freedom .08 Fraser scale, from (empirically) around 1.50 to 9.20, M=7.06, SD=0.77
+ 1 Fraser scale point + $ 11.507
Notes: The five most relevant predictors used, N=91 (listwise deletion); means (M) and standard deviations (SD) of our 91 country sample, minima and maxima from data samples of the variables covering more countries; economic freedom is based on Fraser and Heritage, the Heritage data were adapted to the Fraser scale.


Top cognitive ability level (95th percentile), in IQ (UKav=100, S
130120110100908070
3,0
2,0
1,0
0,0
-1,0
-2,0
ZAF
YEM VEN
USA
URY
UKR
TWN
TUR
TUNTTOTHA
SYR
SWE
SVN
SVK
SRBSLV
SGP
SAU
RUSROU
QAT
PSE
PRT
POL
PHL
PER
PAN
OMN
NZLNORNLD
MYS
MUS
MNG
MNE
MLT
MKD
MEX
MDA
MAR
MAC
LVA
LUX
LTU
LIE
LBN
KWT
KOR
KGZ KAZ
JPN
JOR
ITA
ISR
ISL
IRN
IRL
IND
IDN
HUN
HRV
HND
HKG
GRC
GHAGEO
GBRFRA
FIN
EST
ESP
EGY
DZA
DNK
DEU
CZE
CYP
CRI
COLCHN
CHL
CHECAN
BWA
BRA
BLZ
BIH
BHR
BGR
BEL
AZE
AUTAUS
ARM
ARG
ARE
ALB
Figure 1: Scatterplot between top cognitive ability level (intellectual classes) and
government effectiveness, United Kingdom average (UKav/mean, not 95th
percentile) is set at IQ 100, countries indicated by country code (ISO 3166-1 alpha-3
code), N=98 nations

Competence and Governance
36
Wealth(Credit Suisse)
.33
Productivity (GDP Penn)
Cognitive Ability(Mean)
.26 (.36)
.36 (.81)
(.98)
Top Cognitive Ability Level(95th Percentile)
Competence of leading Politicians (Educational Level)
Government Effectiveness
Innovation(GII-WIPO)
Competitiveness(GCI-WEF)
.62 (.67)
.17 (.17)
.26 (.70)
.16 (.76).38 (.89) .37 (.91)
.49 (.72)
.67 (.91)
.51 (.77)
.37 (.73)
Economic Freedom
.81 (.81) .08 (.74)
Figure 2: Path analysis for cognitive ability, institutional and economic variables and
wealth in monetary units, standardized path coefficients (and correlations in
parentheses, FIML, error term as unexplained variance, CFI=.98, SRMR=.03),
N=201 nations
Economicfreedom
1995
Economicfreedom
2010
Government Effectiveness
1996
Government Effectiveness
2010
Figure 3: Analysis of cross-lagged effects between government effectiveness and
economic freedom in a 15 year interval (standardized path coefficients, correlations
in parentheses, CFI=1.00, SRMR=.00), N=135 nations

Competence and Governance
37
Wealth (CS, per adult)
2000
Government Effectiveness
2000
Government Effectiveness
2010
Wealth (CS, per adult)
2010
Figure 4: Analysis of cross-lagged effects between government effectiveness and
wealth in a 10 year interval (standardized path coefficients, correlations in
parentheses, CFI=1.00, SRMR=.00, in brackets [ ] results for wealth logarithm),
N=173 nations
Wealth(CredSui Log)
.12
Productivity (GDP log)
Cognitive Ability(Mean)
.26 (.37)
.36 (.81)
(.98)
Top Cognitive Ability Level(95th Percentile)
Competence of leading Politicians (Educational Level)
Government Effectiveness
.62 (.69)
.17 (.17).24 (.72)
.14 (.76).40 (.90) .37 (.91)
.45 (.83)
.68 (.91)
.29 (.83)
.70 (.92)
Sub-Saharan Africa (1 or 0)
-.04 (-.58)
.24 (.79)
Absolute Latitude.04 (.52)
Natural Resources
Rents
.03 (-.09)
Innovation(GII-WIPO)
Competitiveness(GCI-WEF)
Economic Freedom
.08 (.74).81 (.81)
Figure 5: Path analysis for cognitive ability, institutional and economic variables and
wealth (logarithm), with direct path of average cognitive ability on log GDP
(standardized path coefficients, correlations in parentheses, FIML, error term as
unexplained variance, CFI=.98, SRMR=.03), N=201 nations