Embed Size (px)
Citation preview

Tu 22P1 04Combination of Geophysical Technques toCharacterize Sediments (Ebro Delta, Spain)B. Benjumea* (Institut Cartografic i Geologic de Catalunya (ICGC)), A.Gabàs (ICGC), A. Macau (ICGC), F. Bellmunt (ICGC), S. Figueras (ICGC), M.Vilà (ICGC) & R. Pi (ICGC)
SUMMARYThe Ebro Delta (Spain) faces anthropogenic and climate changes that can cause a significant decrease onits subaerial surface. One of the causes of this reduction is subsidence that take place due to thecompacting of the sediments. In order to identify zones vulnerable to subsidence, we have defined severaltargets such as: characterization of Holocene sediments (sands versus clays/silts and location of organics)and delineation of the bottom of deltaic sediments. Regarding these objectives, we have acquiredgeophysical data sets at different environments of the Ebro Delta (from delta plain to marshes amongothers). The methodology includes combination of seismic methods (surface waves, refraction andreflection methods) and electrical resistivity tomography for sediment characterization as well as the useof the H/V spectral ratio of microtremor measurements to delineate the base of the Holocene sediments.We show the results for one line located on the delta plain and close to alluvial fans. Geophysical modelsare characterized by a high-resistivity and high-velocity layer at around 25 m depth interpreted as the baseof the deltaic sediments. H/V results provide evidence of maximum thickness of deltaic sediments locatedat the right side of the river mouth.
Near Surface Geoscience 4-8 September 2016, Barcelona, Spain
Introduction
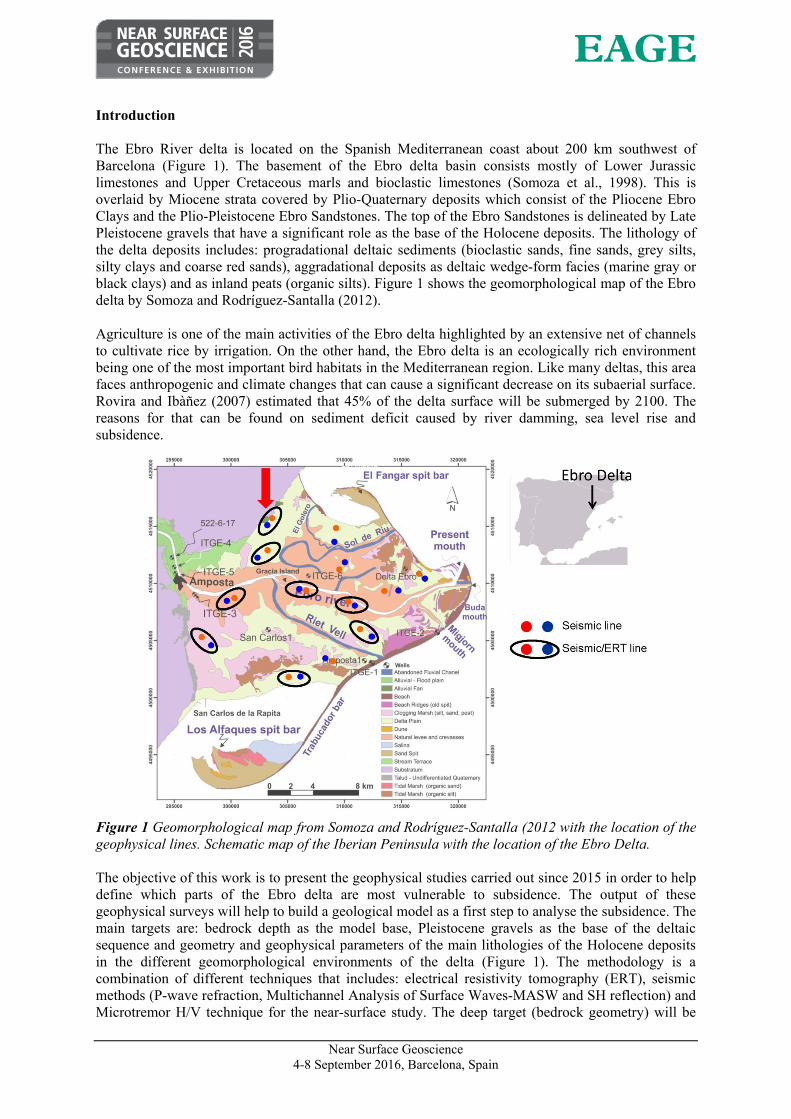
The Ebro River delta is located on the Spanish Mediterranean coast about 200 km southwest of Barcelona (Figure 1). The basement of the Ebro delta basin consists mostly of Lower Jurassic limestones and Upper Cretaceous marls and bioclastic limestones (Somoza et al., 1998). This is overlaid by Miocene strata covered by Plio-Quaternary deposits which consist of the Pliocene Ebro Clays and the Plio-Pleistocene Ebro Sandstones. The top of the Ebro Sandstones is delineated by Late Pleistocene gravels that have a significant role as the base of the Holocene deposits. The lithology of the delta deposits includes: progradational deltaic sediments (bioclastic sands, fine sands, grey silts, silty clays and coarse red sands), aggradational deposits as deltaic wedge-form facies (marine gray or black clays) and as inland peats (organic silts). Figure 1 shows the geomorphological map of the Ebro delta by Somoza and Rodríguez-Santalla (2012).
Agriculture is one of the main activities of the Ebro delta highlighted by an extensive net of channels to cultivate rice by irrigation. On the other hand, the Ebro delta is an ecologically rich environment being one of the most important bird habitats in the Mediterranean region. Like many deltas, this area faces anthropogenic and climate changes that can cause a significant decrease on its subaerial surface. Rovira and Ibàñez (2007) estimated that 45% of the delta surface will be submerged by 2100. The reasons for that can be found on sediment deficit caused by river damming, sea level rise and subsidence.
Figure 1 Geomorphological map from Somoza and Rodríguez-Santalla (2012 with the location of the geophysical lines. Schematic map of the Iberian Peninsula with the location of the Ebro Delta.
The objective of this work is to present the geophysical studies carried out since 2015 in order to help define which parts of the Ebro delta are most vulnerable to subsidence. The output of these geophysical surveys will help to build a geological model as a first step to analyse the subsidence. The main targets are: bedrock depth as the model base, Pleistocene gravels as the base of the deltaic sequence and geometry and geophysical parameters of the main lithologies of the Holocene deposits in the different geomorphological environments of the delta (Figure 1). The methodology is a combination of different techniques that includes: electrical resistivity tomography (ERT), seismic methods (P-wave refraction, Multichannel Analysis of Surface Waves-MASW and SH reflection) and Microtremor H/V technique for the near-surface study. The deep target (bedrock geometry) will be
Near Surface Geoscience
4-8 September 2016, Barcelona, Spain
investigated using the H/V technique combined with vintage seismic reflection and well logging data. In this work, we will focus on shallow targets using one line acquired with ERT and seismic techniques. This line has been chosen as example in this abstract to show the potential of both electrical and seismic methods in the delta plain. In addition, we will present the results along the Ebro delta obtained with the H/V technique for near-surface investigation. Data acquisition and processing We have performed 8 ERT lines combining three consecutive electrode setups, with some overlap between them, consisting on 72 electrodes at 5 m spacing. This leads to lines of around 1 km long distributed around the delta (Figure 1). We have used the SYSCAL- IRIS resistivity-meter with dipole-dipole configuration. Data processing has been carried out using Res2DInv TM software to image electrical resistivity changes up to 60 m approximately (Loke, 2002).
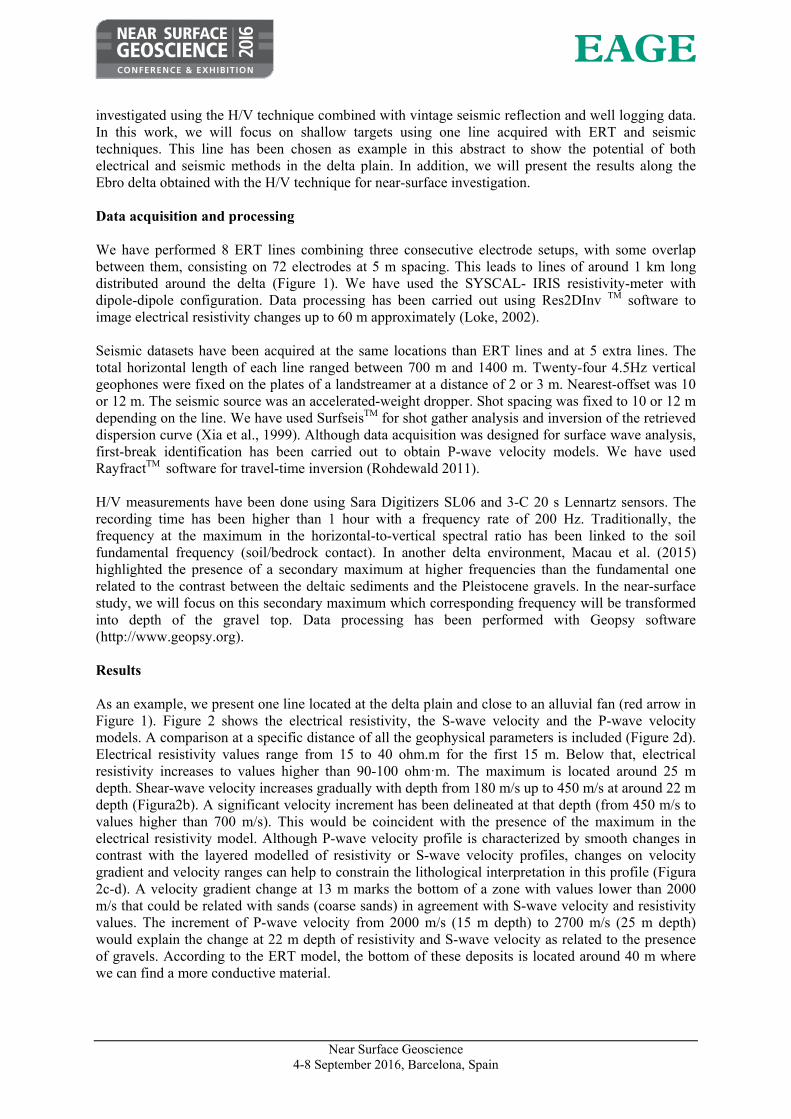
Seismic datasets have been acquired at the same locations than ERT lines and at 5 extra lines. The total horizontal length of each line ranged between 700 m and 1400 m. Twenty-four 4.5Hz vertical geophones were fixed on the plates of a landstreamer at a distance of 2 or 3 m. Nearest-offset was 10 or 12 m. The seismic source was an accelerated-weight dropper. Shot spacing was fixed to 10 or 12 m depending on the line. We have used SurfseisTM for shot gather analysis and inversion of the retrieved dispersion curve (Xia et al., 1999). Although data acquisition was designed for surface wave analysis, first-break identification has been carried out to obtain P-wave velocity models. We have used RayfractTM software for travel-time inversion (Rohdewald 2011). H/V measurements have been done using Sara Digitizers SL06 and 3-C 20 s Lennartz sensors. The recording time has been higher than 1 hour with a frequency rate of 200 Hz. Traditionally, the frequency at the maximum in the horizontal-to-vertical spectral ratio has been linked to the soil fundamental frequency (soil/bedrock contact). In another delta environment, Macau et al. (2015) highlighted the presence of a secondary maximum at higher frequencies than the fundamental one related to the contrast between the deltaic sediments and the Pleistocene gravels. In the near-surface study, we will focus on this secondary maximum which corresponding frequency will be transformed into depth of the gravel top. Data processing has been performed with Geopsy software (http://www.geopsy.org). Results As an example, we present one line located at the delta plain and close to an alluvial fan (red arrow in Figure 1). Figure 2 shows the electrical resistivity, the S-wave velocity and the P-wave velocity models. A comparison at a specific distance of all the geophysical parameters is included (Figure 2d). Electrical resistivity values range from 15 to 40 ohm.m for the first 15 m. Below that, electrical resistivity increases to values higher than 90-100 ohm·m. The maximum is located around 25 m depth. Shear-wave velocity increases gradually with depth from 180 m/s up to 450 m/s at around 22 m depth (Figura2b). A significant velocity increment has been delineated at that depth (from 450 m/s to values higher than 700 m/s). This would be coincident with the presence of the maximum in the electrical resistivity model. Although P-wave velocity profile is characterized by smooth changes in contrast with the layered modelled of resistivity or S-wave velocity profiles, changes on velocity gradient and velocity ranges can help to constrain the lithological interpretation in this profile (Figura 2c-d). A velocity gradient change at 13 m marks the bottom of a zone with values lower than 2000 m/s that could be related with sands (coarse sands) in agreement with S-wave velocity and resistivity values. The increment of P-wave velocity from 2000 m/s (15 m depth) to 2700 m/s (25 m depth) would explain the change at 22 m depth of resistivity and S-wave velocity as related to the presence of gravels. According to the ERT model, the bottom of these deposits is located around 40 m where we can find a more conductive material.
Near Surface Geoscience 4-8 September 2016, Barcelona, Spain
Figure 2 a) Electrical resistivity model (rms error 7%) b) S-wave velocity model (rms error along the profile between 1.8-27 m/s) c) P-wave velocity model (normalized rms error 1.4 %) d) 1D profiles obtained at the same location (420 m distance) from a), b) and c) .
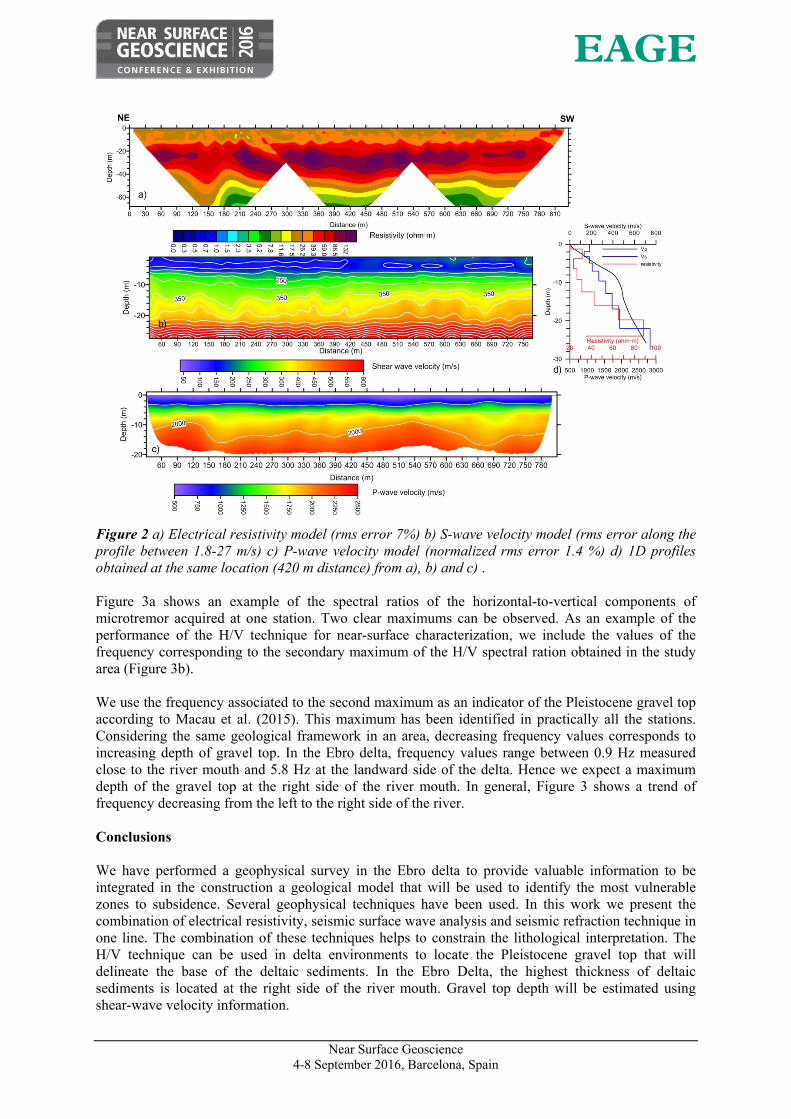
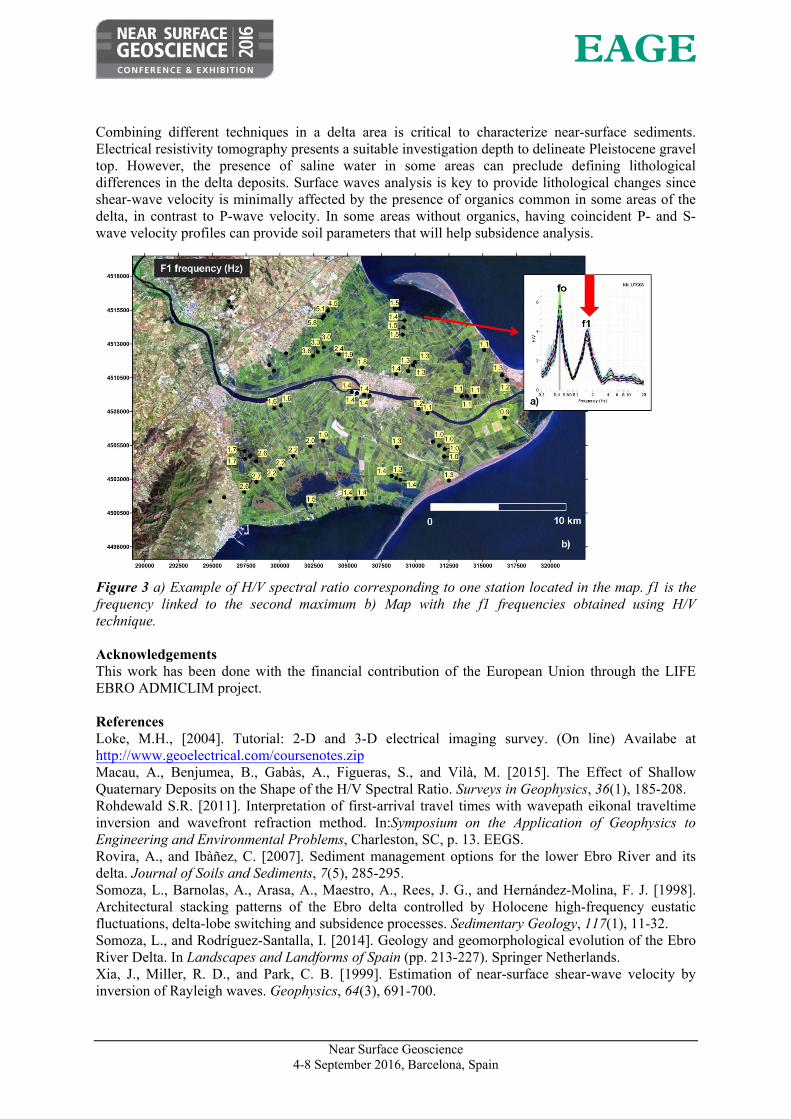
Figure 3a shows an example of the spectral ratios of the horizontal-to-vertical components of microtremor acquired at one station. Two clear maximums can be observed. As an example of the performance of the H/V technique for near-surface characterization, we include the values of the frequency corresponding to the secondary maximum of the H/V spectral ration obtained in the study area (Figure 3b).
We use the frequency associated to the second maximum as an indicator of the Pleistocene gravel top according to Macau et al. (2015). This maximum has been identified in practically all the stations. Considering the same geological framework in an area, decreasing frequency values corresponds to increasing depth of gravel top. In the Ebro delta, frequency values range between 0.9 Hz measured close to the river mouth and 5.8 Hz at the landward side of the delta. Hence we expect a maximum depth of the gravel top at the right side of the river mouth. In general, Figure 3 shows a trend of frequency decreasing from the left to the right side of the river.
Conclusions
We have performed a geophysical survey in the Ebro delta to provide valuable information to be integrated in the construction a geological model that will be used to identify the most vulnerable zones to subsidence. Several geophysical techniques have been used. In this work we present the combination of electrical resistivity, seismic surface wave analysis and seismic refraction technique in one line. The combination of these techniques helps to constrain the lithological interpretation. The H/V technique can be used in delta environments to locate the Pleistocene gravel top that will delineate the base of the deltaic sediments. In the Ebro Delta, the highest thickness of deltaic sediments is located at the right side of the river mouth. Gravel top depth will be estimated using shear-wave velocity information.
Near Surface Geoscience 4-8 September 2016, Barcelona, Spain
Combining different techniques in a delta area is critical to characterize near-surface sediments. Electrical resistivity tomography presents a suitable investigation depth to delineate Pleistocene gravel top. However, the presence of saline water in some areas can preclude defining lithological differences in the delta deposits. Surface waves analysis is key to provide lithological changes since shear-wave velocity is minimally affected by the presence of organics common in some areas of the delta, in contrast to P-wave velocity. In some areas without organics, having coincident P- and S-wave velocity profiles can provide soil parameters that will help subsidence analysis.
Figure 3 a) Example of H/V spectral ratio corresponding to one station located in the map. f1 is the frequency linked to the second maximum b) Map with the f1 frequencies obtained using H/V technique.
Acknowledgements This work has been done with the financial contribution of the European Union through the LIFE EBRO ADMICLIM project.
References Loke, M.H., [2004]. Tutorial: 2-D and 3-D electrical imaging survey. (On line) Availabe at http://www.geoelectrical.com/coursenotes.zip Macau, A., Benjumea, B., Gabàs, A., Figueras, S., and Vilà, M. [2015]. The Effect of Shallow Quaternary Deposits on the Shape of the H/V Spectral Ratio. Surveys in Geophysics, 36(1), 185-208. Rohdewald S.R. [2011]. Interpretation of first-arrival travel times with wavepath eikonal traveltime inversion and wavefront refraction method. In:Symposium on the Application of Geophysics to Engineering and Environmental Problems, Charleston, SC, p. 13. EEGS. Rovira, A., and Ibàñez, C. [2007]. Sediment management options for the lower Ebro River and its delta. Journal of Soils and Sediments, 7(5), 285-295. Somoza, L., Barnolas, A., Arasa, A., Maestro, A., Rees, J. G., and Hernández-Molina, F. J. [1998]. Architectural stacking patterns of the Ebro delta controlled by Holocene high-frequency eustatic fluctuations, delta-lobe switching and subsidence processes. Sedimentary Geology, 117(1), 11-32. Somoza, L., and Rodríguez-Santalla, I. [2014]. Geology and geomorphological evolution of the Ebro River Delta. In Landscapes and Landforms of Spain (pp. 213-227). Springer Netherlands. Xia, J., Miller, R. D., and Park, C. B. [1999]. Estimation of near-surface shear-wave velocity by inversion of Rayleigh waves. Geophysics, 64(3), 691-700.