Embed Size (px)
Citation preview

© Pearson Education Ltd 2018. Copying permitted for purchasing institution only. This material is not copyright free.
1
AQA GCSE
Combined science Mapping Trilogy to Synergy
The practicals featured in this Lab Book follow the Combined Science Trilogy course numbering. If you are
following the Synergy course, you can find the practical numbers in the table below.
AQA Practical name Combined science: Trilogy required practical number
Combined science: Synergy required practical number
Microscopy 1 3
Osmosis 2 4
Food tests 3 7
Enzymes 4 20
Photosynthesis 5 10
Reaction time 6 8
Field investigations 7 12
Making salts 8 17
Electrolysis 9 21
Temperature changes 10 18
Rates of reaction 11 19
Chromatography 12 9
Water purification 13 11
Specific heat capacity 14 2
Resistance 15 16
Current–voltage characteristics 16 15
Density 17 1
Force and extension 18 13
Acceleration 19 14
Waves 20 5
Radiation and absorption 21 6

© Pearson Education Ltd 2018. Copying permitted for purchasing institution only. This material is not copyright free.
2
AQA GCSE
Combined science Technician Notes
Practical 1: Microscopy
AT links
1 Use appropriate apparatus to record length and area.
7 Use a microscope to make observations of biological specimens and produce labelled scientific
drawings.
Safety
Do not allow students to angle microscope mirrors towards the Sun, as this can seriously damage eyesight.
Students should wear eye protection while preparing their own slides, and disposable, non-latex gloves
while using stains. Students should not eat the onion. Students should take care not to cut themselves when
using glass slides. The use of a wooden toothpick or cocktail stick is preferred for lowering coverslips rather
than a mounted needle. Anything that has been in the mouths of students needs to be placed in disinfectant
after use.
Apparatus
per student or pair of students:
microscope with lamp, transparent ruler, sterile (autoclaved) wooden spatulas/tongue depressors, access to
beaker of 1% Virkon (in which to dispose of used spatulas/tongue depressors), selection of pre-prepared
slides of plant and animal cells (e.g. cheek cells, epithelial cells, palisade cells), piece of onion bulb, stain
(e.g. methylene blue [Method 2], iodine solution [Method 3]), non-latex disposable gloves, paper towel,
forceps, 2 plain glass microscope slides, 2 coverslips, wooden toothpick or cocktail stick, pipette, water,
transparent ruler
Method
Students look at simple animal and/or plant cells, make labelled drawings that identify cell structures and
calculate magnifications.
The worksheet provides three possible methods to do this: students can use pre-prepared cells (Method 1),
prepare a slide of their own cheek cells (Method 2) or prepare a slide of onion cells (Method 3). Students
should draw at least one plant cell and one animal cell. Note that the AQA required practical only expects
students to work from prepared slides. However, preparing and staining their own slides can make this activity
more interesting for students.
Students may need a description of how to work carefully with a light microscope, using the procedure of
starting with the lowest magnification objective described in Method 1. Once the cell is in focus at the lowest
magnification, they should then move to a higher power objective and focus the slide only using the fine
focusing control. If they cannot focus it this way, they should return to the lower power objective and start
again. Students should also be reminded not to angle their microscope mirror towards the Sun.
Students may also need reminding of how to draw and label cells clearly. The procedure for this is described at
the end of Methods 2 and 3.
Method 1 also describes how to calculate magnification and field of view diameter, which should also be used
in the other methods. Some students may need additional help with these calculations.
For demonstration, it is worth showing some pre-prepared cells in which mitochondria show up. These can be
bought commercially or you can make your own using methylene blue − basic fuchsin stain, although the
staining procedure (freely available on the Internet) is quite involved.
Expected results
Students should identify, draw and label cells and their parts. It is likely that they will not be able to see
mitochondria, even on the highest magnification, although they may see small granules within the cytoplasm
that may be a range of things depending on the cell type.

© Pearson Education Ltd 2018. Copying permitted for purchasing institution only. This material is not copyright free.
3
AQA GCSE
Combined science Technician Notes
Practical 2: Osmosis
AT links
1 Use appropriate apparatus to record mass and time.
3 Use appropriate apparatus and techniques to observe and measure the process of osmosis.
5 Measure the rate of osmosis by water uptake.
Safety
Students should be warned not to taste or drink any of the solutions or taste the potato.
Apparatus
per group:
4 potato strips of identical size, accurate balance, 4 boiling tubes and rack (or beakers), waterproof pen,
4 labelled solutions containing different concentrations of initial (approx. 550 g/dm3) sucrose solution (0%,
40%, 80%, 100%), forceps, paper towels
Method
Students investigate the effect of concentration of solution on osmosis in potato strips. Students could be given
prepared potato strips, or could cut their own using a cork borer to standardise the diameter of the strips. They
should then cut a length of potato strip to fit in a tube and allow it to be fully covered with solution. Advise
students that they must remove any potato skin before cutting the strips, as this can affect the movement of
water molecules. If the strips are prepared for students, cut them as near to lesson time as possible and wrap
the strips in a damp cloth or plastic film until needed. This will mean that the strips placed in distilled water (0%
sucrose solution) should gain mass during the experiment, as the cells will not be fully turgid at the start.
For some students, using a coloured sugar syrup, such as blackcurrant squash (not sugar-free), makes it
easier to see that the solutions are of different concentrations. However, a concentrated sucrose solution with
added food colouring, which is then used to produce different dilutions, is also suitable.
The solutions can be prepared using sucrose or salt, either as percentage solutions or as molarities. The
following table starts with a sucrose or blackcurrant squash concentration of about 550 g dm−3
of sucrose.
Concentration of initial solution (%)
Volume of sucrose/ squash needed to make 30 cm
3 of solution (cm
3)
Volume of water needed to make 30 cm
3
of solution (cm3)
Final volume of solution made (cm
3)
0 (pure water) 0 30 30
40 12 18 30
80 24 6 30
100 30 0 30
If making a range of molarities, prepare a 1.0 M solution of sucrose (342.3 g dm−3
) or sodium chloride
(58.44 g dm−3
), then dilute as needed with distilled water to produce a 0.75 M, 0.5 M and 0.25 M solution.
Note that students will need a fifth tube and potato strip if they include a measurement in 0 M solution
(distilled water) in their investigation.
Note that some students may be confused by the idea that a more concentrated solution contains
proportionately fewer water molecules than a weaker or more dilute solution. So, it may be worth checking
understanding of this when students are carrying out this practical. If needed, talk in terms of a higher
concentration of solute containing fewer water molecules.
Students will need to measure mass accurately, using a balance accurate to at least 0.01 g. Students could also
measure the effect of osmosis on the length of strips, although this will give less accurate data. It may help to try
this practical out beforehand, to identify a suitable length of time to produce measurable differences. The Practical
sheet suggests 15 minutes, but it may need a little more time than this. Use of a water bath set at 30 °C may help.

© Pearson Education Ltd 2018. Copying permitted for purchasing institution only. This material is not copyright free.
4
AQA GCSE
Combined science Technician Notes
Analysis of the results includes calculations that some students may have problems with. If so, work through
the calculations for the first concentration, before expecting them to do the rest.
For question 5, collate results from different groups on the board. Compare the results to check for outliers,
then calculate a mean value for each solution. The identification of outliers provides useful information for the
evaluation of the investigation.
When plotting the results as a line graph in question 7, students may need help with positioning the x-axis
partly down the y-axis so that they can include both positive and negative values for change in mass or length.
Expected results
Students should find that the potato strip in pure water gains mass, while the rest lose mass in relation to how
much water was in the solution (i.e. the potato in the solution with least water (100% solution) loses most
mass). If students measure length, then similarly, the strip in distilled water should show an increase in length,
with other strips showing a decrease in length proportional to the increase in concentration of solution.
Practical 3: Food tests
AT links
2 Safe use of a Bunsen burner and a boiling water bath.
8 Use of qualitative reagents to identify biological molecules.
Safety
Remind students that they should not taste any of the foods. Care should be taken with very hot water, to
avoid scalding. Students should wear eye protection throughout the tests.
Ethanol (IDA) is hazardous, harmful and highly flammable. Keep it away from flames.
Copper sulfate is poisonous and potassium hydroxide is corrosive (both substances are also present in Biuret
solution). Handle solutions with care and wipe up any spills. Wash splashes on skin with water immediately.
Apparatus
per student or group:
eye protection, food samples (e.g. powdered potato, full and/or low-fat powdered milk, whey (protein)
powder, powdered egg white/commercially available albumen, powdered glucose, icing sugar [or see below
for alternative solid and liquid foods]) water, measuring cylinder, spatula, paper towels, test tubes, racks and
bungs, stirrer, iodine solution (1 g iodine in 100 cm3 0.5 mol dm
–3 potassium iodide solution) in dropper
bottle, Benedict’s solution (prepared according to CLEAPSS Recipe Sheet 11 (qualitative)), 5% potassium
hydroxide and 1% copper sulfate solution or Biuret solution (prepared according to CLEAPSS Recipe Sheet
15) in dropper bottle, water bath at c. 95 °C, ethanol (IDA), cold water
Method
This series of tests can be set up as a circus activity, to allow students to complete each test. Depending on the
previous experience of students, they could either carry out a test on a specific food that will show a positive
reaction (e.g. iodine test on flour, Benedict’s test on glucose powder, Biuret test on powdered egg white,
emulsion test on vegetable oil), or use a variety of food samples with all tests.
The practical work is most simply carried out on powdered foods, such as powdered potato, full and/or low fat
powdered milk, whey (protein) powder, powdered egg white (use commercially available albumen) and
powdered glucose. You could also include icing sugar if you want to show that sucrose is non-reducing. Label
each powder either with its name, or as ‘food A’, ‘food B’ etc. and ask students to identify which is which from a
list of names, using their results. Liquid or solid foods could be used instead, though coloured foods will affect
results and most of the tests are best carried out on liquid samples. Grind solid foods up with a little water using
a mortar and pestle before testing.
An alternative to a water bath for the Benedict’s test is a large beaker of water heated to boiling, before turning off
the heat source. Tubes should be placed in the water while it is still very hot. Biuret solution can be used as an
alternative to the two-stage test using potassium hydroxide and copper sulfate solutions. However, Biuret solution
does not keep, so only prepare as much as is needed. Details of its preparation can be found from CLEAPSS.

© Pearson Education Ltd 2018. Copying permitted for purchasing institution only. This material is not copyright free.
5
AQA GCSE
Combined science Technician Notes
Expected results
The results of the tests will depend on the foods used. The table below shows results from the suggested foods.
Food Iodine test Benedict’s test Biuret test Emulsion test
full-fat milk yellow–orange yellow purple cloudy
whey yellow–orange bright blue purple clear
egg white yellow–orange bright blue purple clear
potato black–blue bright blue light blue clear
glucose yellow–orange red precipitate light blue clear
icing sugar yellow–orange bright blue light blue clear
Errors are most likely to occur if equipment is not cleaned properly between tests and it becomes contaminated
with another sample.
Practical 4: Enzymes
AT links
1 Use appropriate apparatus to record the volume of liquids, time and pH.
2 Safe use of a water bath or electric heater.
5 Measure the rate of reaction by the colour change of iodine indicator.
8 Use of qualitative iodine reagent to identify starch by continuous sampling.
Safety
Students should wear eye protection and should avoid splashing the solution. Treat iodine solution splashes
on skin or clothing with 0.1 mol dm–3
sodium thiosulfate solution until the brown stain is removed, then wash
with water.
Apparatus
per pair or group:
for each pH tested: test tube containing 5 cm3 1% starch suspension, test tube containing 1 cm
3 1% amylase
solution (or 0.5% pancreatin solution), buffer solutions of specific pH (labelled with pH), water bath at 30 °C
(or refer to instructions on packaging if using bacterial amylase), 5 cm3 syringe or pipette, beaker of water for
washing pipette, eye protection, 0.01 mol dm–3
iodine solution in dropper bottle, well tray (spotting tile), stop
clock or watch
Method
Students investigate the effect of pH on the action on starch of amylase. The enzyme is provided in a prepared
amylase solution and the point where all starch is digested is indicated using the iodine test. If students are
unfamiliar with the test, briefly demonstrate its reaction with starch suspension so that they are aware of the
colour change to expect, and that they link that to the end point of the reaction. During the investigation, they
will be identifying the time at which digestion of the starch ends in solutions of different pH.
The water bath should be set at 30 °C for human amylase. Alternatively, use human pancreatin solution, which
contains several enzymes though only the amylase is effective in this practical. Purchased amylase may be
fungal or bacterial in origin and therefore need a different temperature (check supplier’s instructions).
Details on how to prepare pH buffered solutions are available from CLEAPSS. Solutions of pH 5, 6, 7 and 8 are
recommended, but lower pH solutions can also be used. Decide how many pHs can be tested by each group
within the session based on time available, and distribute the buffer solutions around the groups so that all are
tested. Then collate the results from every group on the board before students answer the questions on the
worksheet. This is another opportunity for discussing variation in results between groups for the same pH,
identifying outliers and calculating mean values for use in the analysis of results.

© Pearson Education Ltd 2018. Copying permitted for purchasing institution only. This material is not copyright free.
6
AQA GCSE
Combined science Technician Notes
It is worth checking ahead of the lesson that the amylase breaks down the starch in a reasonable time in the
water bath (i.e. within a few minutes). Starch and amylase solutions should be made up fresh just before the
lesson.
Expected results
The optimum pH varies with the type of amylase, but is usually around pH 7 for human amylase.
Practical 5: Photosynthesis
AT links
1 Use appropriate apparatus to record the rate of change in carbon dioxide levels; and to measure and
control the temperature of the water in the ‘heat shield’ beaker.
2 Safe use of a thermometer to measure and control temperature of water bath.
3 Use appropriate apparatus and techniques to observe and measure the process of change of carbon
dioxide.
4 Safe and ethical use and disposal of living pondweed to measure physiological functions and
responses to light.
5 Measuring rate of reaction by colour change of indicator according to pH.
Safety
Wear eye protection. Wash hands after setting up the experiment. Avoid touching the hot lamp.
Apparatus
To make algal balls: 3–4-week-old culture of algae (e.g. Scenedesmus quadricauda) (refer to the Science &
Plants for Schools website or supplier’s instructions for culture method), 2–3% w/v sodium alginate solution
(this needs to be left on a magnetic stirrer overnight, for the sodium alginate to fully dissolve in the water – do
not be tempted to warm it), 2% w/v calcium chloride solution (0.18 mol dm–3
), 12.5 cm3 fine nosed syringe,
2 50 cm3 beakers, retort stand and clamp, tea strainer, stirring rod/plastic spoon. Make enough algal balls to
allow 10–15 to be placed in each of the bottles made up by students.
per student or group:
bijou bottles and caps (one for each distance to be investigated and one for a control), small beaker
containing algal balls in distilled water (enough for 10–15 balls to be added to each bottle), hydrogen
carbonate indicator (equilibrated with carbon dioxide from the air), plastic forceps or plastic spoon (to transfer
balls), light source (flood lamp with filament bulbs in excess of 60 W or compact fluorescent bulb equivalents,
15–22 W – these can be shared between groups; note that 40–60 W power rated bulbs can also be used but
are unlikely to provide results in under an hour), heat filter for filament lamp (a water-filled medical flat
bottle/square/rectangular glass vase/beaker), measuring cylinder, metre rule, kitchen foil (to cover one bijou
bottle), stop clock, graph paper.
Method
The practical activity provided differs from the one given in the AQA Handbook. This is because the previously
recommended pondweeds (Cabomba and Elodea canadensis) are both invasive species in the UK. More
importantly, pondweeds produce variable and limited results within a suitable time. The alternative investigation
using algal balls should produce repeatable results in about an hour.
The practical using immobilised algae is based on a method developed by Science & Plants for Schools, and is
described on its website. The method can also be found on the National Centre for Biotechnology Education
(NCBE) website. The NCBE also sells kits with all the materials needed for this practical (note that the algal
balls themselves cannot be purchased and need to be made). Other suppliers are available.
The algal balls must be prepared ahead of the lesson, using a 3–4-week-old culture of algae (Science & Plants
for Schools recommends unicellular Scenedesmus quadricauda). Take about 50 cm3 of dark green algal
culture and allow it to settle, then pour off the liquid at the top leaving about 10 cm3 of concentrated culture. An
alternative is to centrifuge 50 cm3 of the suspension. Use a syringe to add 2.5 cm
3 of 2–3% sodium alginate
solution to a 50 cm3 beaker, add the concentrated algal solution and stir well. Add 20 cm
3 of 2% calcium

© Pearson Education Ltd 2018. Copying permitted for purchasing institution only. This material is not copyright free.
7
AQA GCSE
Combined science Technician Notes
chloride solution to another 50 cm3 beaker. Pour the algal solution into a 12.5 cm
3 fine-nosed syringe (with the
plunger removed) and allow drops to fall into the calcium chloride solution. Leave for about 15 minutes for the
balls to stabilise, then remove the balls from the solution using a tea strainer and wash with distilled water.
Keep moist and in daylight until ready to use.
The hydrogen carbonate indicator solution should be a cherry red colour and equilibrated with carbon dioxide in
the air by bubbling air through the solution using a fish tank bubbler in a well-ventilated prep room. You can buy
the solution ready-made or you can make it up. Instructions for making the solution and a chart showing the
colours of the indicator at different pHs can be found on the Science & Plants for Schools or NCBE websites. A
better alternative is to prepare a range of bottles showing the indicator at different pHs. Full instructions for how
to do this are also given on the Science & Plants for Schools and NCBE websites.
A heat sink will be needed between the light source and bottles if using a bulb that is hot when lit (e.g.
filament). Otherwise this can be ignored. If used, check that students understand why it is needed (because the
rate of photosynthesis is affected by temperature, and bottles nearer the lamp will be heated more than those
further away).
Make sure students fully appreciate the link between pH, carbon dioxide and photosynthesis, to help them
interpret the colour changes that they see in the different bottles. Some students may need support with the
calculations and plotting of the graph.
Question 5 is suitable only for students attempting the Higher tier. To answer the question properly, students
will need to understand how to calculate inverse squares of the distances used.
The bottle covered in foil may show a change in colour that could confuse students. If needed, remind them
that respiration continues while photosynthesis is happening. However, the effect of respiration on pH
(removing carbon dioxide from the solution and so increasing pH) is masked by the impact of photosynthesis
(releasing carbon dioxide and so decreasing pH).
Expected results
Students should find a clear pattern in their results: the further away the light source (the lower the intensity of
the light), the less quickly the pH falls.
Practical 6: Reaction time
AT links
1 Use appropriate apparatus to record time.
3 Selecting appropriate apparatus and techniques to measure the process of reaction time.
4 Safe and ethical use of humans to measure physiological function of reaction time and responses to
a chosen factor.
Safety
Students should take care that falling rulers do not hit anyone. Additional care may be needed if students
exercise between tests. Students should not test the effect of caffeine or the consumption of other
substances that affect metabolic rate.
Apparatus
per pair:
metre ruler, bench or table, chair or stool, (optional) music on portable device with ear phones
Method
Students work in pairs to carry out this investigation, with one student releasing the ruler to test the other’s
reaction time, then vice versa. Although the results from this investigation may not produce a clear-cut
conclusion, it uses a simple method that students should be able to plan easily.
Before starting the investigation, discuss with students possible factors that could affect reaction rate and how
they could be tested. The method in the Lab Book compares students who do or do not have a particular
proficiency, such as being good at reactive computer games. Good sports ability is another suitable proficiency.
© Pearson Education Ltd 2018. Copying permitted for purchasing institution only. This material is not copyright free.
8
AQA GCSE
Combined science Technician Notes
Alternatively, students could investigate the effect of a factor that they can change during the investigation.
Factors that speed up reaction rate might include a short period of meditation, listening to one’s favourite music
(best done with ear phones to avoid distracting other students), deep breathing or a short period of brisk
exercise (be aware of students’ limitations and the space available for this). Factors that slow down reaction
rate might include listening to music that you do not like or listening to a conversation (best done with ear
phones). Students should not study the effect of caffeine or other substances that can change metabolic rate.
Allow time for students to discuss in their pairs which factor to test. They should then plan out their
investigation, considering problems that might occur and what they can do to get useful results.
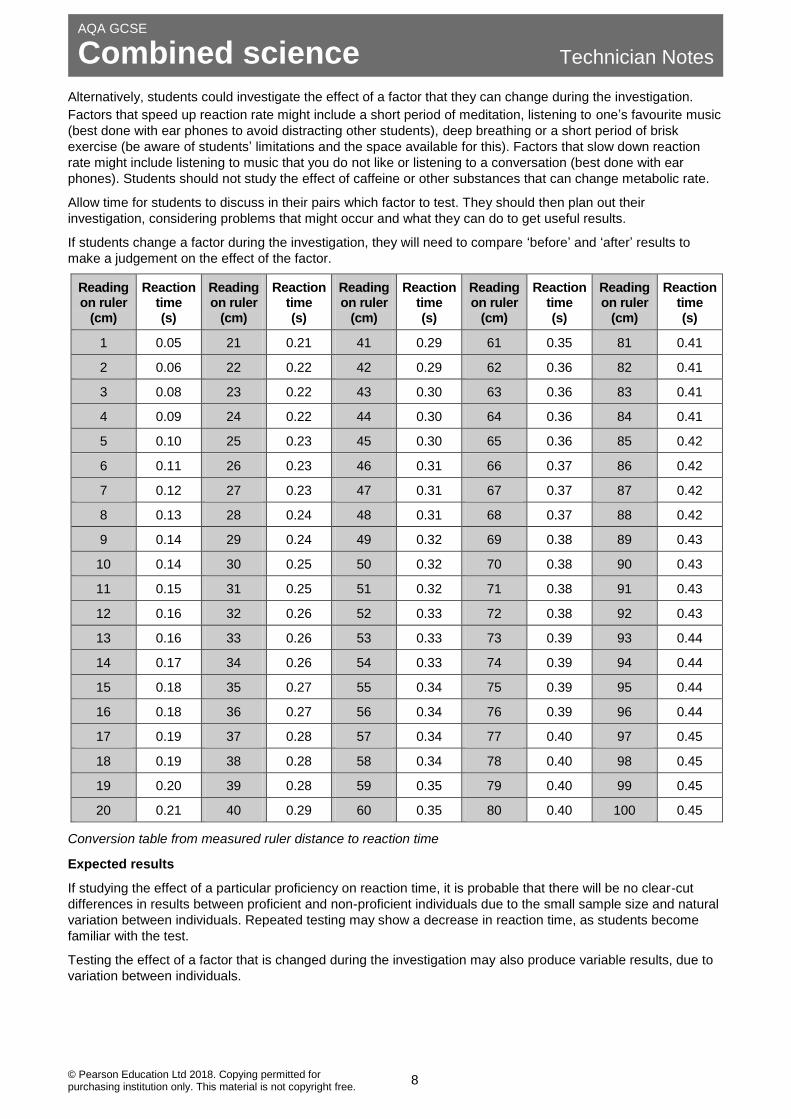
If students change a factor during the investigation, they will need to compare ‘before’ and ‘after’ results to
make a judgement on the effect of the factor.
Reading on ruler
(cm)
Reaction time (s)
Reading on ruler
(cm)
Reaction time (s)
Reading on ruler
(cm)
Reaction time (s)
Reading on ruler
(cm)
Reaction time (s)
Reading on ruler
(cm)
Reaction time (s)
1 0.05 21 0.21 41 0.29 61 0.35 81 0.41
2 0.06 22 0.22 42 0.29 62 0.36 82 0.41
3 0.08 23 0.22 43 0.30 63 0.36 83 0.41
4 0.09 24 0.22 44 0.30 64 0.36 84 0.41
5 0.10 25 0.23 45 0.30 65 0.36 85 0.42
6 0.11 26 0.23 46 0.31 66 0.37 86 0.42
7 0.12 27 0.23 47 0.31 67 0.37 87 0.42
8 0.13 28 0.24 48 0.31 68 0.37 88 0.42
9 0.14 29 0.24 49 0.32 69 0.38 89 0.43
10 0.14 30 0.25 50 0.32 70 0.38 90 0.43
11 0.15 31 0.25 51 0.32 71 0.38 91 0.43
12 0.16 32 0.26 52 0.33 72 0.38 92 0.43
13 0.16 33 0.26 53 0.33 73 0.39 93 0.44
14 0.17 34 0.26 54 0.33 74 0.39 94 0.44
15 0.18 35 0.27 55 0.34 75 0.39 95 0.44
16 0.18 36 0.27 56 0.34 76 0.39 96 0.44
17 0.19 37 0.28 57 0.34 77 0.40 97 0.45
18 0.19 38 0.28 58 0.34 78 0.40 98 0.45
19 0.20 39 0.28 59 0.35 79 0.40 99 0.45
20 0.21 40 0.29 60 0.35 80 0.40 100 0.45
Conversion table from measured ruler distance to reaction time
Expected results
If studying the effect of a particular proficiency on reaction time, it is probable that there will be no clear-cut
differences in results between proficient and non-proficient individuals due to the small sample size and natural
variation between individuals. Repeated testing may show a decrease in reaction time, as students become
familiar with the test.
Testing the effect of a factor that is changed during the investigation may also produce variable results, due to
variation between individuals.

© Pearson Education Ltd 2018. Copying permitted for purchasing institution only. This material is not copyright free.
9
AQA GCSE
Combined science Technician Notes
Practical 7: Field investigations
AT links
1 Use appropriate apparatus to record length and time.
3 Use transect lines and quadrats to measure distribution of a species.
4 Safe and ethical use of organisms and response to a factor in the environment.
6 Application of appropriate sampling techniques to investigate the distribution and abundance of
organisms in an ecosystem via direct use in the field.
8 Use of appropriate techniques in more complex context including continuous sampling in an
investigation.
There are two required practicals for this topic, one that investigates population size (abundance) of a common
species in a habitat, and one that investigates distribution. A student method for the second of these is given in
the Lab Book.
Safety
Carry out a full risk assessment of the area where sampling will take place prior to the investigation. Be
aware of risks such as animal faeces, poisonous plants and open water. Make sure students are fully aware
of any safety issues and how to tackle them.
1: Investigating population size of a plant species
Apparatus
per pair:
quadrat (e.g. 50 50 cm), plant identification guide, random number generator (e.g. phone app or numbers
drawn from a bag)
(optional for class) 2 long tape measures (e.g. 30 m) or strings marked at metre intervals
Method
This investigation should be carried out in a large open area such as a school playing field.
Prior to the fieldwork, discuss with students why sampling is done (because it is unlikely you could count every
individual in such a large area), and how to carry out sampling to get a reasonably accurate estimate. Students
should consider the number of samples taken (more samples increase accuracy but also increase time taken to
sample – the actual number of samples taken is often limited by time available).
Students should also consider the placement of the quadrats. Discuss the impact of choosing ‘interesting’
areas for sampling, or areas that might be easier to get to. Lead the discussion towards the use of random
sampling and how this could help reduce bias in sampling sites. Then discuss how random sampling could be
carried out. This can be prompted by laying a graph paper grid over an image of the area to be sampled. Some
method of creating random numbers (to produce coordinates that decide where a quadrat is placed) will be
needed (e.g. random number app on a phone, or taking numbers from a bag) in the field.
When in the field, set out two long tape measures at right angles, as the axes of a graph, to guide students on
where to place their quadrat. Spend a short while familiarising students with the plant species that are visible,
and help them to choose a species that is relatively common and has clearly separate individual plants (i.e. not
grass, and not daisy plants, as these can clump and make it difficult to count individual plants). A plant
identification guide may be helpful.
Students should record the number of individuals of a particular plant species in each quadrat sample they take.
Students will need to calculate the total area of the field (using the tape measures) and the area sampled.
area sampled = area of one quadrat number of quadrat samples taken
e.g. 10 quadrat samples using a quadrat size of 0.5 m 0.5 m
area sampled = 0.5 0.5 10 = 2.5 m2

© Pearson Education Ltd 2018. Copying permitted for purchasing institution only. This material is not copyright free.
10
AQA GCSE
Combined science Technician Notes
To estimate population size, students should use the following formula:
total population size = total area
area sampled number of individual plants in samples
e.g. if total area of the field was 500 m2 and the number of individuals plants in the 10 quadrats was 20
total population size = 500
2.5 20 = 4000
Compare estimates of total population size from different student pairs to discuss how accurate the estimates
might be.
2: Investigating distribution
Apparatus
per pair:
long tape measure (at least 20 m) with pegs at each end to hold it firmly in place on the ground, quadrat (e.g.
50 50 cm, or 1 1 m if recording larger plants/seaweed), apparatus for measuring suitable abiotic factors
(e.g. light sensor and recorder, soil humidity sensor, small bags for collecting soil samples for nutrient testing
in the lab, trowel, soil nutrient testing kit, wind speed measurer), identification charts, labels for bags, pencil
Method
This investigation can be adapted to any available example of changing distribution related to environmental
change, such as the distribution of plants between shade and bright light, or from a well-trampled area to an
area of little trampling across a path. (Note: this method can also be used to investigate factors that affect the
distribution of seaweed or shellfish on a rocky seashore from low to high tide.) Consider a preparatory session
in the field to help students decide where best to take samples (between areas that show obvious differences in
abundance of a particular species) and which environmental factor(s) to measure (e.g. light intensity, soil
moisture, wind speed, temperature, soil nutrient content). Discuss the best way to measure and record the
chosen environmental factor(s). It may also help if students become familiar with the organisms they will
record, from identification charts, before they begin the investigation.
Suggest that students focus on recording details of only one or two species. Note that abundance can be
measured by counting individuals within the quadrat. Alternatively, students could use the ACFOR (abundant,
common, frequent, occasional, rare) method of scoring. (Information on this can be found on the Internet.) If soil
samples are taken, students will need time in the lab to carry out analysis, for example using nutrient test kits.
Discuss with students the placement of quadrats along the transect. To investigate distribution, the quadrats
should be placed at regular intervals between the ends of the transects, in order to identify any trends in the
abundance and values of environmental factors.
Question 2 in the Lab Book requires students to consider the best way to display the results. This will depend
on how the data was recorded, as some (discontinuous data) will need presenting as a bar chart and some
(continuous data) as a line graph. Some students may be able to combine results on one set of axes, using
different scales and a key for each factor measured. Other students may need to draw separate charts or
graphs for each factor. In the latter case, encourage them to align the x-axis of each chart, to make comparison
easier.
Expected results
If a clear change in distribution of an organism along the transect was measured, students should be able to
associate that with a change in value of an appropriate environmental factor (e.g. abundance of plantains is
greater where light intensity is greater or trampling less). Note, this may not always occur, because an
environmental factor that was not measured may be controlling distribution more than the factors measured. In
this case, discuss with students what else might be causing the distribution, and ask them to suggest how they
would test their ideas.

© Pearson Education Ltd 2018. Copying permitted for purchasing institution only. This material is not copyright free.
11
AQA GCSE
Combined science Technician Notes
Practical 8: Making salts
AT links
2 Safe use of appropriate heating devices and techniques including the use of a Bunsen burner and
water bath or electric heater.
3 Use of appropriate apparatus and techniques for conducting chemical reactions including appropriate
reagents.
4 Safe use of a range of equipment to purify and/or separate a chemical mixture including evaporation,
filtration and crystallisation.
6 Safe use and careful handling of gases, liquids and solids, including careful mixing of reagents under
controlled conditions, using appropriate apparatus to explore chemical changes and/or products.
Safety
Eye protection should be worn throughout this experiment.
Sulfuric acid at the concentration suggested is an irritant. Lower concentrations could also be used to reduce
risk. Copper oxide is harmful if swallowed; dust irritates the lungs and eyes.
Apparatus
per student or pair of students:
eye protection, 100 cm3 beaker, 250 cm
3 beaker (or 100 cm
3 conical flask), Bunsen burner, gauze, tripod
stand, heat mat, Petri dish or watch glass, 100 cm3 measuring cylinder, evaporating basin, spatula, stirring
rod, filter funnel, filter paper, tongs, water bath (set at 50 °C), 1 mol dm–3
sulfuric acid, copper(II) oxide
Method
Students work in groups to investigate the preparation of a pure, dry salt. In this case the salt is hydrated
copper sulfate. Briefly discuss the steps involved in the preparation of the salt before the students start the
investigation. Students should understand why:
an excess of copper oxide has to be added
the excess has to be removed
only the salt and water are present in the solution after filtration.
There are different ways of carrying out this practical. For example, the experiment could be carried out in a
boiling tube and step B could be done by placing the boiling tube in a beaker of water over a Bunsen burner.
To produce the largest and best-formed crystals of copper sulfate, the final solution should be kept dust-free
and allowed to evaporate as slowly and evenly as possible. Step E could be completed using a conical flask
instead of a beaker.
Ask students to find out why certain salts could not be prepared by this method. For example, sodium sulfate
cannot be made this way as sodium oxide is soluble and the excess could not be separated. Calcium sulfate
could not be formed this way as it is insoluble in water and could not be separated from the metal oxide.
Expected results
Copper oxide and sulfuric acid form a soluble salt, copper sulfate. Students should be able to prepare a dry,
pure sample of copper sulfate crystals, which are blue in colour and diamond shaped.

© Pearson Education Ltd 2018. Copying permitted for purchasing institution only. This material is not copyright free.
12
AQA GCSE
Combined science Technician Notes
Practical 9: Electrolysis
AT links
3 Use of appropriate apparatus and techniques for conducting and monitoring chemical reactions
including appropriate reagents and/or techniques for the measurement of pH in different situations.
7 Use of appropriate apparatus and techniques to draw, set up and use electrochemical cells for
separation and production of elements and compounds.
8 Use of appropriate qualitative reagents and techniques to analyse and identify unknown samples of
products including gas tests for hydrogen, oxygen and chlorine.
Safety
Eye protection must be worn.
Solutions of copper sulfate, sodium chloride solution, copper(II) chloride and sodium sulfate are low hazards
at the concentrations stated.
Carry out this practical in a well-ventilated laboratory.
Wear disposable gloves. Acidified water is an irritant. Do not inhale any of the gases from the electrodes.
Students with asthma must take particular care with copper chloride solution and sodium chloride solution as
chlorine will be produced.
Ensure students realise that although the starting chemicals are of a low hazard, the substances being
produced are not all low hazards. Hydrogen gas is extremely flammable. Chlorine gas is toxic. Sodium
hydroxide is corrosive. Oxygen gas is oxidising. Tell students to turn off the power supply as soon as they
have carried out their tests.
Apparatus
per student or pair of students:
eye protection, copper(II) sulfate solution (about 50 cm3, 0.50 mol dm
−3), sodium chloride solution (about
50 cm3, 0.50 mol dm
−3), copper(II) chloride solution (about 50 cm
3, 0.50 mol dm
−3), sodium sulfate solution
(about 50 cm3, 0.50 mol dm
−3), carbon electrodes, 100 cm
3 beaker, Petri dish lid, tweezers, connecting
leads, damp litmus paper, electrode holder
Method
Students investigate substances that are produced at carbon electrodes when different salt solutions are
electrolysed. The suggested method uses beakers with Petri dish lids. The lids should be pre-drilled with two
holes for the electrodes to fit through. This will prevent short circuiting. There are commercially produced
electrolysis cells which can be used, though students often find it difficult to set up these cells. If there is time
before the lesson, it is helpful to have a few cells set up with each solution. Students then just test one or two
solutions and share results with another group that has tested different solutions. Students should use
tweezers to hold the damp litmus paper close to the electrodes.
This practical also allows students to revise the gas tests for chlorine, hydrogen and oxygen. Students begin
with copper(II) solutions and follow with sodium solutions. When they use the sodium solutions, they are
looking to confirm their predictions. This will mean students should select the correct identification test for the
gas they suspect is being released. The method suggested makes it difficult to identify gases when they are
produced at the anode and cathode simultaneously, which is easier to achieve when electrolysis cells are used.
However, when electrolysis cells are not available, students should note any visual indicators e.g. colour
change, fizzing etc. that occur during the experiment. The teacher could then run a demonstration of the results
using an electrolysis cell with the correct identification tests.
The product at the anode during the electrolysis of copper chloride and sodium chloride solutions is usually a
mixture of chlorine and oxygen. However, students usually notice the characteristic smell of the chlorine.
Students with asthma should take particular care, and it is important that the laboratory is well ventilated and
that students switch off the power as soon as they have detected the products.

© Pearson Education Ltd 2018. Copying permitted for purchasing institution only. This material is not copyright free.
13
AQA GCSE
Combined science Technician Notes
Expected results
Salt solution Appearance of solution at start
Observation at the cathode (−)
Observation at the anode (+)
copper(II) chloride blue brown solid effervescence
gas turns litmus red then white
copper(II) sulfate blue brown solid effervescence
gas relights glowing splint
sodium chloride colourless effervescence
gas pops lighted splint
effervescence
gas turns litmus red then white
sodium sulfate colourless effervescence
gas pops lighted splint
effervescence
gas relights glowing splint
Practical 10: Temperature changes
AT links
1 Use of appropriate apparatus to make and record a range of measurements accurately, including mass,
temperature and volume of liquids.
3 Use of appropriate apparatus and techniques for conducting and monitoring chemical reactions.
5 Making and recording appropriate observations during chemical reactions including changes in
temperature.
6 Safe and careful handling of gases, liquids and solids, including careful mixing of reagents under
controlled conditions, using appropriate apparatus to explore chemical changes and/or products.
Safety
Eye protection must be worn.
Sodium hydroxide and hydrochloric acid at this concentration are corrosive and very damaging to eyes.
Apparatus
per student or pair of students:
2 polystyrene cups, 250 cm3 beaker (to sit the cup in), lid for 1 cup, measuring cylinders, sodium hydroxide,
hydrochloric acid, tripod and thermometer (sensitivity of at least 0.5 °C, but preferably 0.1 or 0.2 °C)
Method
Students react hydrochloric acid with sodium hydroxide solution in a neutralisation reaction and measure the
temperature change.
The set up may seem elaborate for adding two chemicals together, but the tripod holds the thermometer in
position and the glass beaker insulates the reaction mixture and improves stability. The tripod may not be
needed if the thermometer is small. Students should understand the need to take care to keep the thermometer
in a small beaker, as well as the need for insulation to reduce heat losses to the environment. Explain to
students that the main sources of error in the experiment is heat loss.
If the equipment is available, students could use a temperature probe and datalogger to help them to produce a
continuous graph. Students might need help drawing the two lines of best fit so that they intersect. The
solutions used are fairly concentrated in order to produce reasonable temperature changes; 2 mol dm−3
sodium
hydroxide is particularly hazardous to the eyes.
Expected results
Students should observe a temperature rise in the region of 10 °C and should state their experiment is
exothermic.

© Pearson Education Ltd 2018. Copying permitted for purchasing institution only. This material is not copyright free.
14
AQA GCSE
Combined science Technician Notes
Practical 11: Rates of reaction
AT links
1 Use of appropriate apparatus to make and record a range of measurements accurately, including mass,
time, temperature and volumes of liquids and gases.
3 Use of appropriate apparatus and techniques for conducting and monitoring chemical reactions.
5 Making and recording appropriate observations during chemical reactions including the measurement
of rates of reaction by a variety of methods such as production of gas and colour change.
6 Safe and careful handling of liquids and solids, including careful mixing of reagents under controlled
conditions, using appropriate apparatus to explore chemical changes.
Safety
Wear eye protection at all times. Wash all spills immediately.
Hydrochloric acid at a concentration of 2.0 mol dm–3
is an irritant. At 1.0 mol dm–3
it is a low hazard but may
still cause harm in eyes and in cuts. Calcium carbonate and sodium thiosulfate are low hazards.
Sulfur dioxide gas is released during Part 2, which can exacerbate breathing difficulties in people with
conditions such as asthma. It is toxic and corrosive. The laboratory should be well ventilated. It may also be
appropriate to cover the neck of the conical flask with, for example, cling film.
Apparatus
per group:
Part 1 – eye protection, balance, 100 cm3 measuring cylinder, stop clock, water trough, 250 cm
3 conical
flask, bung with delivery tube, stand and clamp, dilute hydrochloric acid (1.0 mol dm–3
and 2.0 mol dm
–3),
marble chips
Part 2 – eye protection, 250 cm3 conical flask, 10 cm
3 measuring cylinder, 50 cm
3 measuring cylinder,
stop clock, test tube, test-tube rack, water bath, white paper with cross pre-printed, sodium thiosulfate
solution (40 g dm–3
), dilute hydrochloric acid (2 mol dm–3
).
Optional: cling film
Method
The progress of a chemical reaction can be measured by how the amounts of reactant or product change with
time. This practical is divided into two parts:
Part 1 – Investigating the measurement of the rate of reaction using volume of gas produced
Part 2 – Investigating the measurement of the rate of reaction using colour change or turbidity
In Part 1, students should work in groups and follow the instructions in the Lab Book to investigate the effect of
changing the concentration of hydrochloric acid in the reaction between marble chips and hydrochloric acid.
Note that the concentrations of hydrochloric acid to be used in Part 1 are given in mol dm−3
. However, these
units and the concept of moles will only be covered by students studying Higher tier. For teachers who would
prefer to use concentrations in g dm−3
, the equivalent concentrations are 72 (2.0 mol dm−3
) and 36.5 g dm−3
(1.0 mol dm−3
).
Some students may need help to set up the experiments and take measurements, as well as guidance to
ensure that they measure the changes as soon as the reactions start.
In Part 2, students should work in groups, following the instructions in the Lab Book to investigate the effect of
temperature on the rate of the reaction between sodium thiosulfate and hydrochloric acid. To save time, groups
could share their results. The reaction releases sulfur dioxide gas. The amount released into the laboratory can
be minimised by covering the neck of the conical flask with cling film. Putting cotton wool in the neck could
obscure the cross and so is not advised.
© Pearson Education Ltd 2018. Copying permitted for purchasing institution only. This material is not copyright free.
15
AQA GCSE
Combined science Technician Notes
Expected results
In Part 1, the volume of gas produced in each 30 second interval will be greatest at the start of the experiment
and decrease until the reaction is finished and no more gas is formed. The volume of gas produced should be
directly proportional to the concentration of acid used. For example, the 2.0 mol dm–3
hydrochloric acid should
produce twice the volume of gas in one minute as produced by the 1.0 mol dm–3
hydrochloric acid.
In Part 2, the results should show that for every 10°C rise in temperature, the time for the cross to disappear
halves and so the rate of the reaction doubles.
Practical 12: Chromatography
AT links
1 Use of appropriate apparatus to make and record a range of measurements accurately.
4 Safe use of a range of equipment to purify and/or separate chemical mixtures including
chromatography.
Safety
There are no risks if water is used as the solvent.
Apparatus
per student or pair of students:
250 cm3 beaker, chromatography paper cut to fit the beaker used and stapled to a splint or attached to a
pencil or glass rod using paper clips, 2 different (black) felt pens or water-soluble marker pens, ruler, pencil
Method
The Lab Book provides instructions to help students to compare the mixtures of dyes in the inks used in black
marker pens or felt-tip pens. Have a selection of pens available, labelled with letters for ease of identification.
These should be tested before the lesson to ensure that they do contain different mixtures of dyes. One set of
pens will suffice for the whole class. Instead of pens, bottles of black inks from different manufacturers could
also be used.
This is a relatively simple procedure, similar to chromatography investigations that students will have done at
KS3. As the chromatography will be wet it will make taking measurements tricky. Ensure students have marked
where the solvent has reached in case the papers are left to dry. Students need this information to calculate Rf
values.
Expected results
Black inks usually include black dyes and blue dyes, and sometimes other colours as well. The Rf values will
depend on the pens available.
Practical 13: Water purification
AT links
2 Safe use of appropriate heating devices and techniques including use of a Bunsen burner and a water
bath or electric heater.
4 Safe use of a range of equipment to purify and/or separate chemical mixtures including evaporation,
distillation.
Safety
Eye protection should be worn. Avoid skin contact with the substances used. Dilute nitric acid is an irritant.
Allow apparatus to cool down before attempting to move anything. Follow general procedures for using a
Bunsen burner: tie long hair back or tuck ties in when heating, stand when heating and light Bunsen burner
with air-hole closed. Do not allow students to drink the distilled water.

© Pearson Education Ltd 2018. Copying permitted for purchasing institution only. This material is not copyright free.
16
AQA GCSE
Combined science Technician Notes
Apparatus
Before and after distillation:
eye protection, salt water sample, 0.05 mol dm–3
silver nitrate, 0.4 mol dm–3
nitric acid, nichrome wire,
Bunsen burner, heat-resistant mat, test tubes
During distillation:
eye protection, salt water sample, ice, 250 cm3 beaker, 250 cm
3 conical flask, clamp stand, anti-bumping
granules, Bunsen burner, tripod, heat-resistant mat, gauze, delivery tube with bung.
Optional: damp cold paper towels, rubber bands
Method
Students produce potable water from a provided salty water sample and complete tests on the water sample
before and after distillation to prove it is now pure water.
Prior to distillation, students should carry out two simple tests to prove that the sample of water is salty. The
first test is a simple flame test (see Practical 7 – Part 1) to confirm the presence of sodium. The second test is a
halide ion test (see Practical 7 – Part 3) to confirm the presence of chloride ions.
The distillation stage uses typical lab apparatus rather than a condenser as few schools will have access to
distillation sets. However, conventional distillation with a Liebig condenser should be demonstrated by the
teacher, with a discussion explaining how this links to the equipment students will be using.
Some deviation from the set-up diagram would be expected for schools using alternative apparatus and the
delivery tubes in particular may differ from the diagram. It would be sensible to trial the experiment before the
lesson with the equipment students will be using if it differs from the diagram. To help condense the distillation,
damp cold paper towels can be wrapped around the delivery tube. They can be fixed in place with rubber
bands. Ensure students know how to heat gently as sometimes they may not know how to control the flow of
gas to the Bunsen burner.
Expected results
Prior to distillation, the water sample should produce positive results for sodium (flame test: yellow) and
chloride (halide ions: white). After distillation, the water sample should not turn yellow in the flame test and
there should be no precipitate with the halide ion test.
Practical 14: Specific heat capacity
AT links
1 Use appropriate apparatus to measure mass, time and temperature accurately.
5 Use, in a safe manner, appropriate apparatus to measure energy changes/transfers and associated
values such as work done.
Safety
Take care as the heaters and blocks may get hot enough to burn skin.
Do not put oil into the heater hole, as there is a danger of cracking any oil left on the heater after removal.
Apparatus
1 kg copper, iron and aluminium metal block calorimeters (with holes for heater and thermometer),
thermometer, pipette, paraffin oil, 30 W heater, 12 V power supply, insulation to wrap around the blocks
(fleece is suitable), sticky tape or thread to secure insulation, ammeter and voltmeter, 4 mm leads, stop clock,
balance (capable of measuring more than 1 kg) heat-resistant mat.
Method
Metal block calorimeters are available from equipment suppliers. Use a pipette to add a few drops of oil into the
thermometer holes in the calorimeters to ensure good thermal contact.

© Pearson Education Ltd 2018. Copying permitted for purchasing institution only. This material is not copyright free.
17
AQA GCSE
Combined science Technician Notes
Students may use a joulemeter instead of the ammeter, voltmeter and stop clock, or can be told the power of
the heater and calculate the energy transferred from the power and time.
Students heat metal blocks, and record the current, voltage and time to allow them to calculate the energy
transferred (work done) by the heater. They record the temperature of the block every minute for 10 minutes,
and plot a graph of temperature against work done. After an initial warming period, the graph should be a
straight line. Students should ignore this initial warming period when drawing the line of best fit and working out
the gradient. If it is felt that the students may struggle with the calculation or setting up the equipment, students
can be told the power of the heater instead of measuring it.
Students calculate the heat capacity of each block from the gradient of the graph, then use the mass of the
block to find specific heat capacity.
If the metal blocks are being shared between groups, allow the block to cool down between uses.
Expected results
Students calculate the specific heat capacities of the materials tested. Their values are likely to be higher than
published values, due to energy transferred from the blocks to the surroundings during the investigation.
Practical 15: Resistance
AT links
1 Use appropriate apparatus to measure and record length accurately.
6 Use of appropriate apparatus to measure current, potential difference and resistance.
7 Use circuit diagrams to construct and check series and parallel.
Safety
Warn students that the wires may get hot. Check students’ circuits before they switch them on. Remind
students to switch off the power between readings.
Apparatus
battery or suitable low voltage power supply, ammeter, voltmeter, crocodile clips, resistance wire attached to
metre rule (0.3 mm diameter nichrome is suitable), connecting leads, 2 identical wire-wound resistors (e.g.
10 Ω)
Method
Use a low potential difference, particularly for short lengths of wire, to avoid the wire getting too hot. Students
follow the instructions and circuit diagrams in the Lab Book to carry out two tasks.
Task 1: Students measure the current and voltage for different lengths of resistance wire, and use their
readings to calculate the resistance. They plot resistance against length to determine the relationship.
Task 2: Students use current and voltage readings to find the resistance of a single resistor, of two resistors in
series and two resistors in parallel.
Expected results
Task 1: Students should find that resistance is proportional to length. The graph that students plot should be a
straight line through the origin.
Task 2: Students should find that adding an identical resistor in series doubles the resistance of the circuit,
adding one in parallel halves the overall resistance of the circuit.

© Pearson Education Ltd 2018. Copying permitted for purchasing institution only. This material is not copyright free.
18
AQA GCSE
Combined science Technician Notes
Practical 16: Current–voltage characteristics
AT links
6 Use appropriate apparatus to measure current and potential difference and to explore the
characteristics of a variety of circuit elements.
7 Use circuit diagrams to construct and check series and parallel circuits including a variety of common
circuit elements.
Safety
Check students’ circuits before they switch them on.
Apparatus
ammeter, milliammeter (for working with the diode), voltmeter, 12 V/24 W filament lamp (e.g. a ray box
lamp), resistor (e.g. 100 Ω, 1 W), diode and protective resistor (e.g. 10 Ω), variable resistor (e.g. 10 Ω, 5 A),
low voltage power supply, connecting leads
Method
Students set up a circuit to measure the current through a component and the voltage across it, including a
variable resistor to allow the current to be varied. They use ammeter and voltmeter readings to find the
resistance of the component at different voltages (including reversing the polarity of the connections), and plot
graphs of current against voltage.
They follow this procedure to obtain graphs for a resistor, a filament lamp and a diode. When testing the diode,
students will need to use a milliammeter in place of the ammeter. To prevent the current through the diode
becoming too large, the diode should be protected with a resistor. The resistance of this resistor will depend on
the diode used.
The instructions may need to be adapted to suit the electrical equipment available.
Expected results
Resistor: Students should obtain a linear graph passing through the origin.
Filament lamp: Graph should curve, showing a smaller increase in current for each voltage increment as the
voltage increases.
Diode: Students should find that the current is zero with the voltage in the reverse direction.
Practical 17: Density
AT links
1 Use appropriate apparatus to make and record a range of measurements of length, area, mass and
volume accurately. Use such measurements to determine the densities of solid objects and liquids.
Safety
Ensure any spills are mopped up straight away.
Apparatus
various regular shaped objects (blocks from a materials kit are suitable; see note below), various irregular
shaped objects, a range of liquids (e.g. tap water, sugar or salt solution, cooking oil, ethanol (or white spirit,
methylated spirit, etc.)), ruler, digital balance, displacement can, bowl, a variety of measuring cylinders,
thread or very thin string
Note on materials: The Lab Book asks students to identify the material of the regular objects by comparing
their calculated densities with given reference densities. The densities given are for aluminium, brass,
copper, iron, lead, zinc and wood (ash).

© Pearson Education Ltd 2018. Copying permitted for purchasing institution only. This material is not copyright free.
19
AQA GCSE
Combined science Technician Notes
Method
This practical is in three parts.
Task 1: Students find the volume of a regular-shaped object by measuring its dimensions, then measure mass
and calculate density. They are asked to identify the substances by comparing their calculated density with
given reference values (see note in the equipment section). If materials other than those listed are used,
provide students with reference densities for the materials used.
Task 2: Students use a displacement can to find the volume of irregular shaped objects, then measure mass
and calculate density. If displacement cans are not available, students could find the volume by noting the
change of reading when the object is submerged in a large measuring cylinder part-filled with water.
Task 3: Students find the mass of a known volume of liquid then calculate its density.
Results will be provided in g and cm3.
Expected results
Students calculate the densities of a range of liquids and solids from measurements of mass and volume.
Practical 18: Force and extension
AT links
1 Use appropriate apparatus to make and record length accurately.
2 Use appropriate apparatus to measure and observe the effect of force on the extension of springs and
collect the data required to plot a force–extension graph.
Safety
Wear eye protection.
Apparatus
stand and 2 clamps, 2 springs with loops at each end, of different spring constants (capable of extending
more than 1 cm under a load of 1 N – the ‘expendable steel springs’ available from equipment suppliers are
suitable), metre ruler, stacking masses appropriate for the springs (e.g. ten 100 g masses), eye protection
Optional: G-clamp or weight to prevent the apparatus tipping over.
Method
Students measure the extension of a spring with different weights hanging from it. Work out the maximum
weight that can be added to each spring without going beyond the point at which the force–extension
relationship becomes non-linear (the limit of proportionality), and limit students to testing their springs with
weights below this.
If the extension of the spring is too great to allow the spring to remain above the base plate of the stand (i.e. the
spring needs to be suspended over the edge of a bench), ensure the stand is clamped to the bench or has a
large weight placed on it to prevent it from tipping over.
Expected results
Students obtain force–extension graphs for two or more springs and use the gradients to calculate the spring
constants.
© Pearson Education Ltd 2018. Copying permitted for purchasing institution only. This material is not copyright free.
20
AQA GCSE
Combined science Technician Notes
Practical 19: Acceleration
AT links
1 Use appropriate apparatus to make and record measurements of length, mass and time.
2 Use appropriate apparatus to measure and observe the effect of force.
3 Use appropriate apparatus and techniques to measure motion, including determination of speed and
rate of change of speed (acceleration/deceleration).
Safety
Ensure masses cannot fall on feet by placing a box full of crumpled newspaper beneath the weights.
Take care when moving ramps as these can be heavy. If the large 2 m ramps are being used, set these out
before the lesson.
Apparatus
trolley, ramp, blocks, pulley, string, stacking masses (ten 100 g masses), mass hanger, sticky tape, card,
sticky tack, 2 light gates, 2 clamps and stands, access to balance, datalogger (set up to measure velocities
from the light gate readings and the time between the two readings – students will need to enter the length of
the card mounted on their trolley), box of crumpled newspaper
Method
This investigation is in two parts. The Lab Book provides instructions, including how to set up friction-
compensated ramps. Note that the mass being accelerated comprises the trolley and anything standing on it,
plus the hanging masses used to provide the force.
Part 1: Students investigate the effect of mass on acceleration with a constant force. The force is provided by
hanging masses, and students vary the mass by adding masses to the trolley.
Part 2: Students investigate the effect of changing the force for a system with constant mass. The total mass of
the system must be kept the same, so any of the masses not on the mass hanger must be placed on the trolley.
If sufficient light gates are not available, students should mark a measured length on the ramp. Starting the
trolley from the top mark, they use a stop clock to measure the time to reach the second mark. They can then
simply compare the times to derive a qualitative relationship between mass or force and acceleration, or you
can show them how to calculate the acceleration by substituting into s = ut + ½at2, where u = 0.
Expected results
Students investigate the effect of mass on acceleration for a constant force, and the effect of changing force
with a constant mass. They should find that the acceleration is inversely proportional to mass, and is
proportional to force.
Practical 20: Waves
AT links
4 Make observations of waves in fluids and solids to identify the suitability of apparatus to measure
speed, frequency and wavelength.
Safety
Ensure any spilled water is mopped up right away.
Apparatus
Part 1: ripple tank (ideally with beaches to prevent reflections), stop clock, ruler, digital camera
Part 2: 2 clamps and stands, 2 rubber bands, long metal rod (up to 1 m long), metre rule, hammer,
smartphone with frequency app

© Pearson Education Ltd 2018. Copying permitted for purchasing institution only. This material is not copyright free.
21
AQA GCSE
Combined science Technician Notes
Method
Part 1: Measuring the speed of waves on water. Ripple tanks can vary widely, so it may need to be explained
to students that the focus of the practical is viewing the waves and not on how they are produced. Since it may
take time to produce clear waves with the ripple tank, it is suggested to trial the experiment ahead of the lesson
to resolve any problems. Some teachers may also wish to use a strobe view of the waves, but it is essential to
ensure prior to the lesson that there are no students who would be affected by this. Students are asked to
estimate the speed of a wave by measuring how far it travels in a certain time, and also to calculate it from
measurements of frequency and wavelength. Note that the speed of a wave in water depends on the
wavelength and the depth, so the results students obtain will depend on both the depth of water in their tank
and the frequency they set. They should use digital cameras, if available, to help them with the measurements.
A darkened room will also help with viewing the waves.
Part 2: Measuring the waves in a solid. The method uses the fact that a standing wave in a cylindrical object
has a wavelength twice the length of the object, but students are not expected to recall this fact. The rod is
suspended using rubber bands and hit on one end with a hammer. Use a smartphone frequency app to detect
the highest frequency.
Expected results
Students compare the appropriateness of the apparatus used for measuring waves in different materials.
Practical 21: Radiation and absorption
AT links
1 Use appropriate apparatus to make and record accurate temperature measurements.
4 Make observations of the effects of the interaction of electromagnetic waves with matter.
Safety
Warn students to take care with hot water.
Apparatus
4 boiling tubes, test-tube rack, measuring cylinder, 4 thermometers, stop clock, insulating materials
(e.g. paper of different colours, aluminium foil), sticky tape, hot water
Method
Students cover four boiling tubes in material of different colours. Ideally, all materials should be the same
substance (e.g. paper) and the same thickness. They then measure the cooling rate of hot water poured into
the boiling tubes every two minutes for 20 minutes.
Expected results
Tubes covered in dark, dull material should cool down faster than tubes covered in light and/or shiny materials.

© Pearson Education Ltd 2018. Copying permitted for purchasing institution only. This material is not copyright free.
22
AQA GCSE
Combined science Technician Notes
Published by Pearson Education Limited, 80 Strand, London, WC2R 0RL.
www.pearsonschoolsandfecolleges.co.uk
Text © Pearson Education Limited 2018.
Typeset by iEnergizer Aptara Limited.
First published 2018
Copyright notice
All rights reserved. The material in this publication is copyright. Activity sheets may be freely photocopied for
classroom use in the purchasing institution. However, this material is copyright and under no circumstances
may copies be offered for sale. If you wish to use the material in any way other than that specified you must
apply in writing to the publishers.
Acknowledgements
The publishers would like to thank Penny Johnson, John Kavanagh, Sue Kearsey and Nigel Saunders for their
contributions to the text.
Note from the publisher
Pearson has robust editorial processes, including answer and fact checks, to ensure the accuracy of the
content in this publication, and every effort is made to ensure this publication is free of errors. We are, however,
only human, and occasionally errors do occur. Pearson is not liable for any misunderstandings that arise as a
result of errors in this publication, but it is our priority to ensure that the content is accurate. If you spot an error,
please do contact us at [email protected] so we can make sure it is corrected.