Embed Size (px)
Citation preview

Commercial and Small Business Taxation: Summary and Recommendations
Committee of the WholeJune 25th, 2019
Re: Item No. 4

2
Outline• Origin
• Three Key Issues for the Business Community
• Key Considerations and Options• Perceptions of High Municipal Tax• Perceptions of Fairness• Predictability
• Summary and Conclusions
• Recommendation
3
Origin• In April 2015, Council passed a motion requesting a
“staff report and recommendations for changes to the commercial tax structure and for implementation approaches that shall: • Address concerns regarding small and
independent businesses in the central business district and main street and commercial corridors.
• Outline options to address these issues.• Contain pros and cons of various courses of
action”.

4
Work Undertaken• 2015 (November): staff report to Regional Council on
“Commercial Tax Options for Small Business” • included analysis of tax trends, business concerns
and economic environment;• Council requests assessment phasing and additional
tax powers.• 2017: The Province provides
• Assessment phase-in of up to ten years;• Some new tax powers in HRM Charter.
• 2018 (January, June and October): workshops with business community• Economic study on commercial taxation;• Fourteen tax options examined.

5
Economic Impact Study on Commercial Tax- Canmac Economics
• Impact of commercial property taxes on investment minimal.
• Commercial tax is a small portion of total business costs, can be more significant on fringe of business districts
• Changes in property taxes not a key factor for building investment.
• Property tax should not be used to achieve equity objectives.
• Commercial tax incentives generally not effective.• Should be limited to new immigrant start-ups, technology
incubators.

6
Select Examples: What other Cities/Regions do
• City of Winnipeg: Small Business Tax Credit Program (SBTC), using an annual rent value (ARV) metric, firms with an ARV under $30,000 receive a tax credit that reduces their business occupancy taxes. Subject to annual review and approval by Council.
• City of Toronto: Tiered Rates of assessment based on class of building, preferred tax rates for smaller structures. Excludes shopping centres and other large complexes. Rate is approximately 10% lower.
• City of Vancouver: Land assessment averaging to improve predictability. Assessment average threshold is determined by Council annually.
• Province of Ontario: Assessment valuation occurs every four years, with the assessment increase phased in 25% each year.
• City of Regina: Three (3) year phase in of 2017 assessment, 1/3rd increase of new assessment value. Similar to Ontario but with reassessment occurring every three, not four years.

7
Three Key Issues for the Business Community

8
Three Key Issues We Heard from the Business Community
Since 2015, many issues have been cited by business. Staff have distilled these down into three categories:
1. Perceived high municipal tax bill, relative to business revenues or municipal services.
2. Perception of fairness of tax paid versus similar properties or businesses in HRM.
3. Unpredictability of tax bills stemming from changes in land prices and development activity.

9
Perceived High Tax
Perceived Issue High tax relative to sales, revenue, fixed costs.
High tax relative to residential taxes, and the cost to provide municipal services to commercial sector.
Considerations HRM commercial taxes are comparable to other Canadian cities - Altus, 2014 and Calgary (Canadian Property Tax and Utilities Charges Survey)
Possible Solutions Reduce Commercial General Tax Rate for all properties.
In-depth analysis of the cost of municipal services.

10
40.3% 39.8% 39.4% 39.0% 38.2% 38.1% 38.7% 38.6% 38.3% 37.8% 38.0%
59.7% 60.2% 60.6% 61.0% 61.8% 61.9% 61.3% 61.4% 61.7% 62.2% 62.0%
2009-10 2010-11 2011-12 2012-13 2013-14 2014-15 2015-16 2016-17 2017-18 2018-19 2019-20
Source: HRM Finance, Internal Estimates
Commercial/Business OccupancyResidentialLinear (Commercial/Business Occupancy)
Residential and Commercial Property Tax Revenues, Relative Share (%) 2009-2019
11
$0.50
$1.00
$1.50
$2.00
$2.50
$3.00
$3.50
$4.00
2013-14 2014-15 2015-16 2016-17 2017-18 2018-19 2019-20
Pro
perty
Tax
Rat
e pe
r $10
0 of
Ass
esse
d V
alue
Residential Commercial
Source: HRM Finance, Internal Estimates
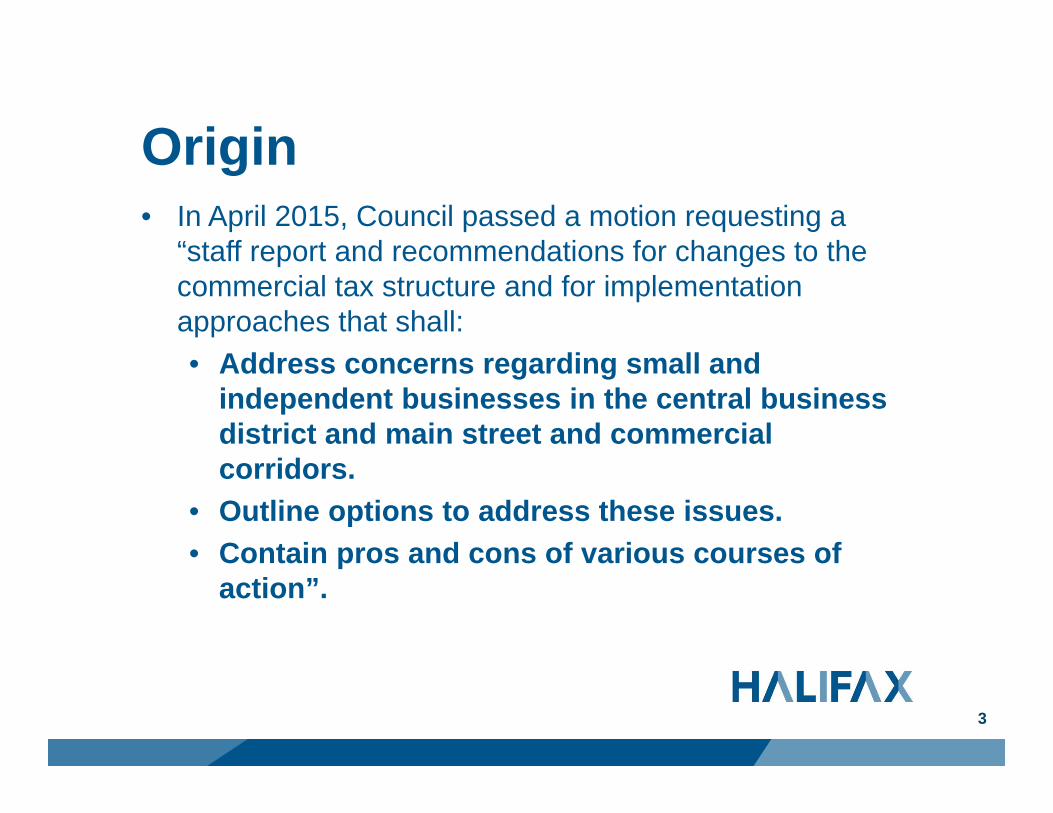
Commercial/Residential Tax Rate Trend,2013-2019
12
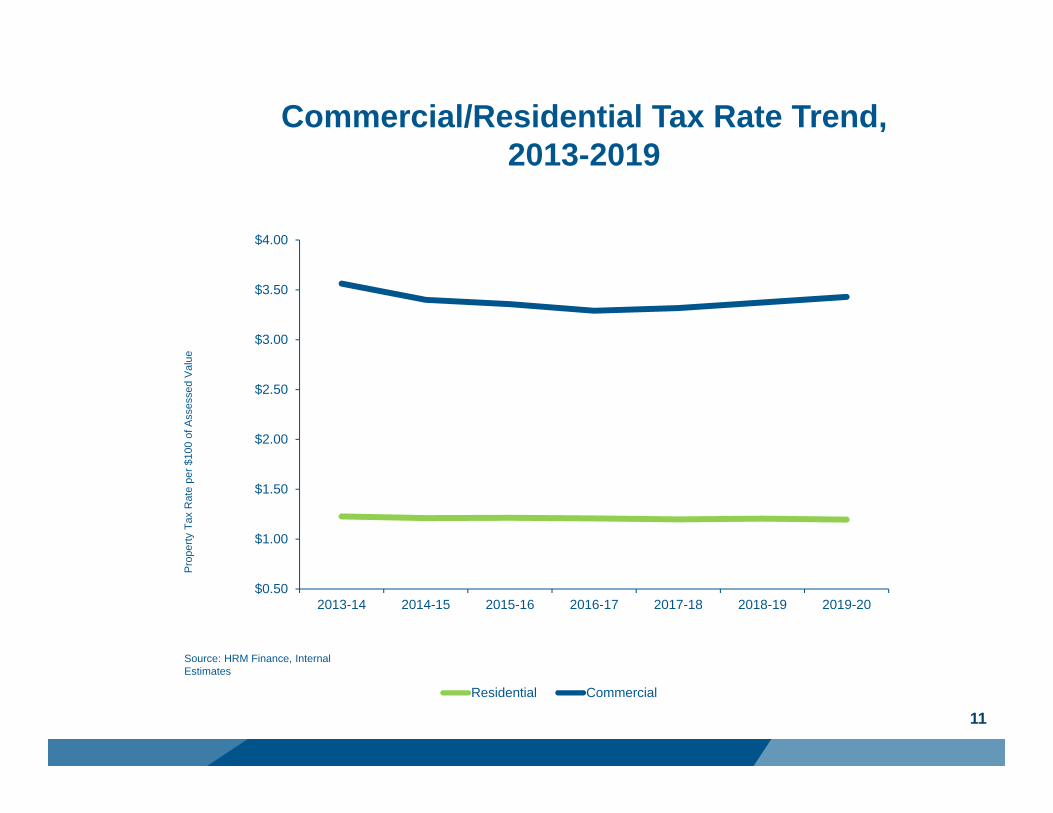
Average Annual Property Taxes of Class 'A' Office Buildings, Per Square Foot (Altus Group, September, 2015)

13C ccc
Perceived Fairness
Perceived Issue Inconsistency amongst property tax paid by small firms compared to larger firms, including large retailers. Retail taxes higher downtown.
Rising land prices disproportionately affecting small properties on higher value land.
Current Situation Taxes vary considerably across region for numerous reasons. Differ within neighbourhoods of the Region.
Location and demand drive land values.
Retail and commercial areas tend to change over time.
Firms make their own decisions on property to lease/buy.
Options to address perception
Variety of special tax options.
14
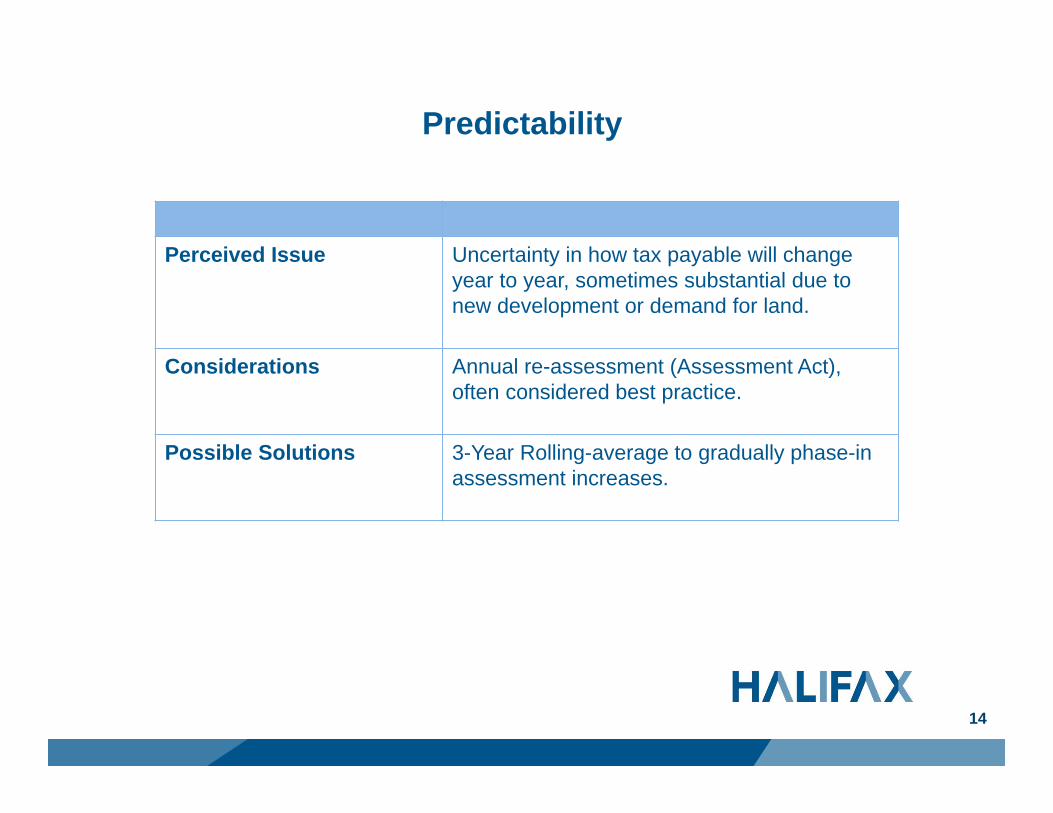
Predictability
Perceived Issue Uncertainty in how tax payable will change year to year, sometimes substantial due to new development or demand for land.
Considerations Annual re-assessment (Assessment Act), often considered best practice.
Possible Solutions 3-Year Rolling-average to gradually phase-in assessment increases.
15
Three Key Issues: Analysis
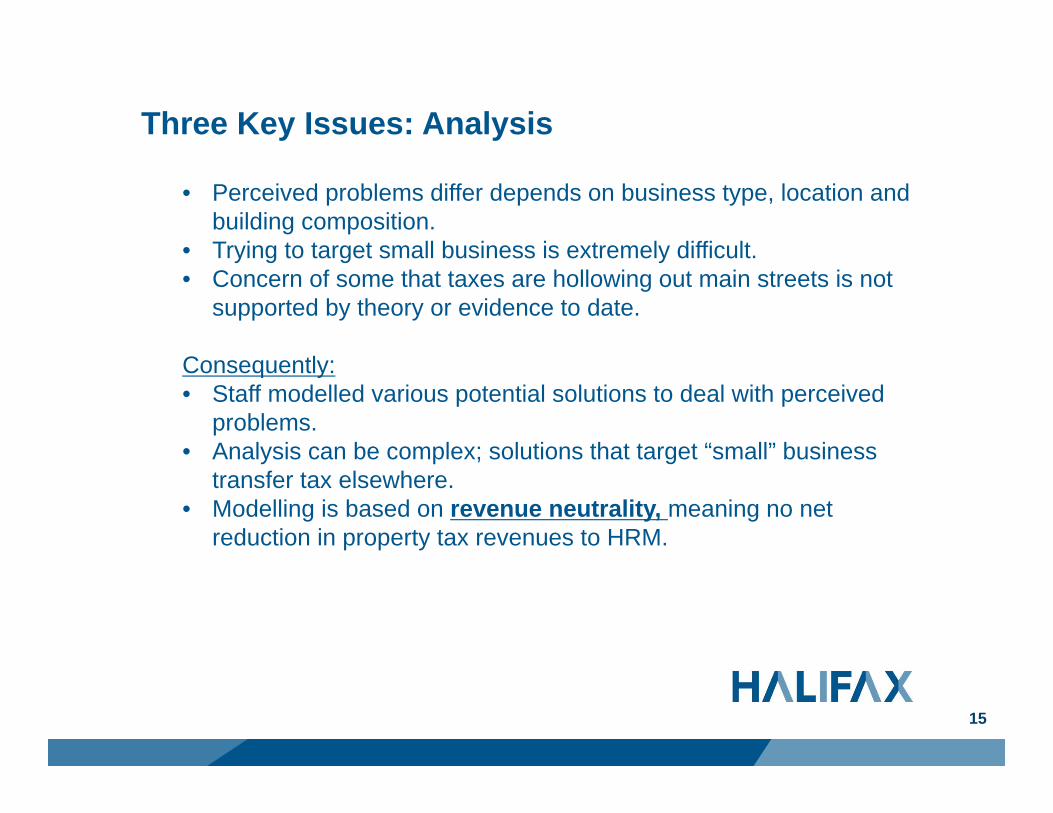
• Perceived problems differ depends on business type, location and building composition.
• Trying to target small business is extremely difficult.• Concern of some that taxes are hollowing out main streets is not
supported by theory or evidence to date.
Consequently: • Staff modelled various potential solutions to deal with perceived
problems.• Analysis can be complex; solutions that target “small” business
transfer tax elsewhere. • Modelling is based on revenue neutrality, meaning no net
reduction in property tax revenues to HRM.

16
Key Considerations and Options

17
Possible Solutions to 3 Key Issues
1. Perception of High Property Tax Relative to Fixed Costs• General Tax Rate reductions
2. Fairness (Equity)• BID Tax Rate (Attachment A)• Tax Rates for Centres & Corridors (Attachment B)• Tax Relief to High Taxed BIDs (Attachment C)• 5 Tax Zones (Attachment D)• Multi-Tiered Tax Rate (Attachment E)
3. Unpredictability• 3-Year Assessment Average
18
Key Considerations
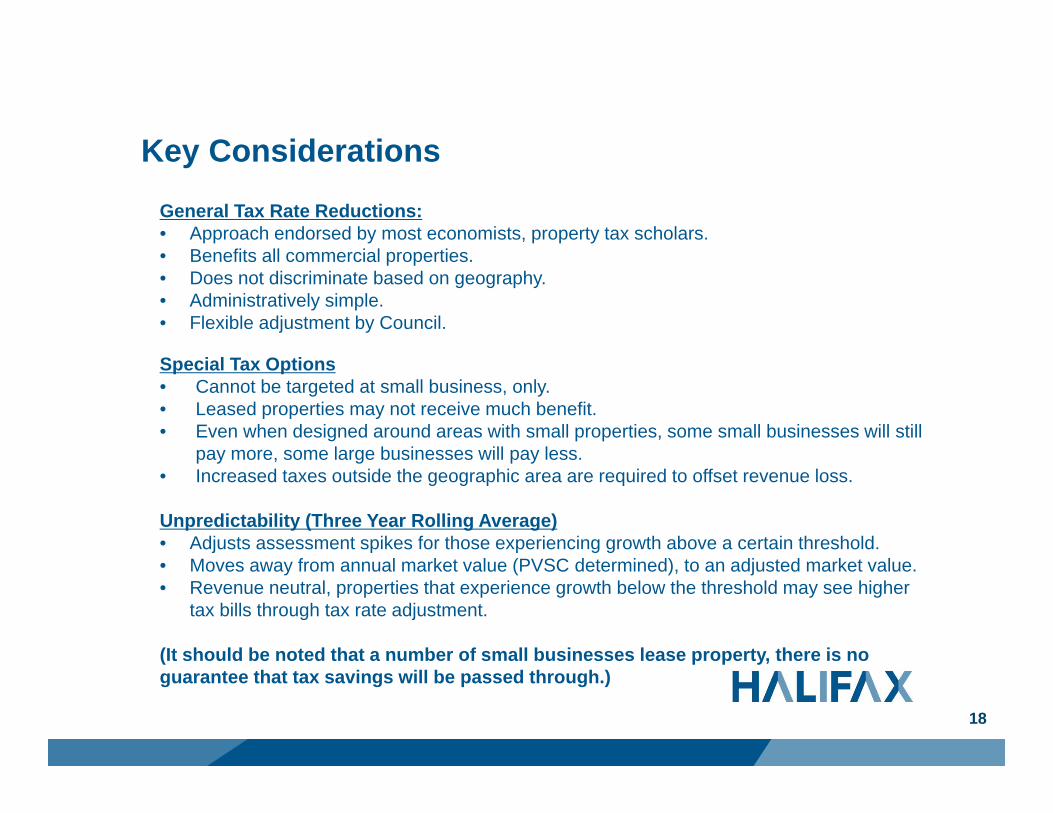
General Tax Rate Reductions: • Approach endorsed by most economists, property tax scholars. • Benefits all commercial properties. • Does not discriminate based on geography. • Administratively simple. • Flexible adjustment by Council.
Special Tax Options• Cannot be targeted at small business, only.• Leased properties may not receive much benefit.• Even when designed around areas with small properties, some small businesses will still
pay more, some large businesses will pay less.• Increased taxes outside the geographic area are required to offset revenue loss.
Unpredictability (Three Year Rolling Average)• Adjusts assessment spikes for those experiencing growth above a certain threshold.• Moves away from annual market value (PVSC determined), to an adjusted market value.• Revenue neutral, properties that experience growth below the threshold may see higher
tax bills through tax rate adjustment.
(It should be noted that a number of small businesses lease property, there is no guarantee that tax savings will be passed through.)
19
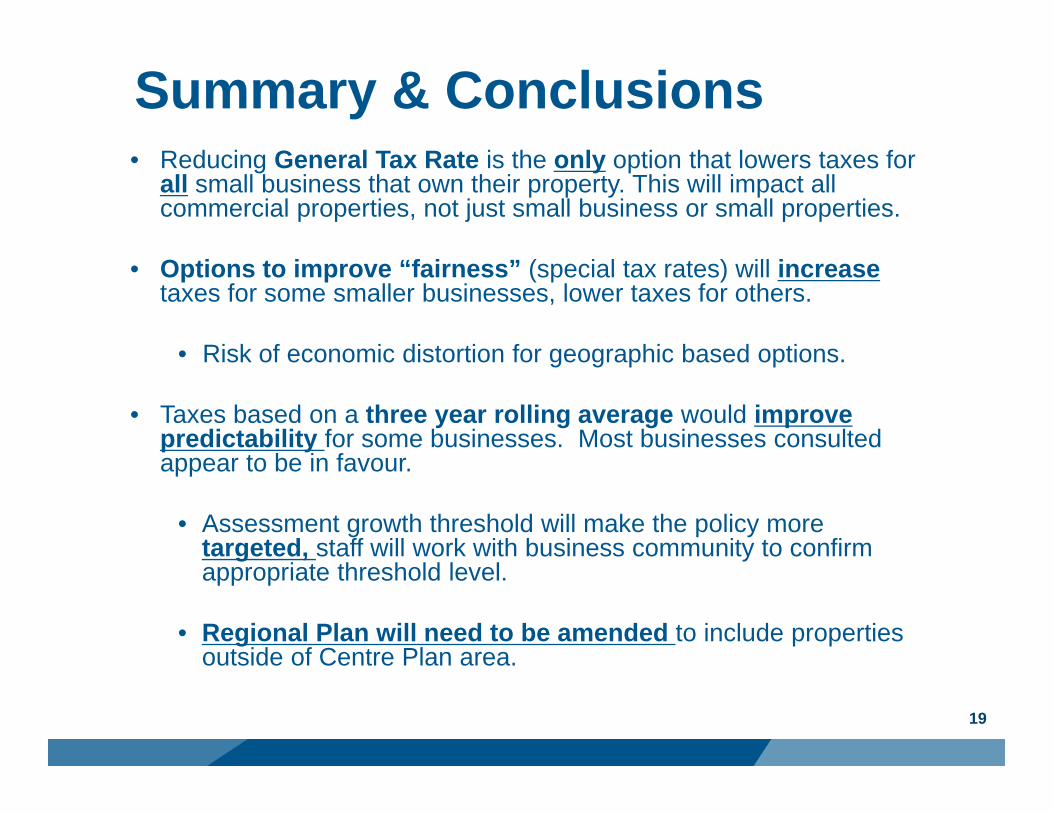
Summary & Conclusions• Reducing General Tax Rate is the only option that lowers taxes for
all small business that own their property. This will impact all commercial properties, not just small business or small properties.
• Options to improve “fairness” (special tax rates) will increasetaxes for some smaller businesses, lower taxes for others.
• Risk of economic distortion for geographic based options.
• Taxes based on a three year rolling average would improve predictability for some businesses. Most businesses consulted appear to be in favour.
• Assessment growth threshold will make the policy more targeted, staff will work with business community to confirm appropriate threshold level.
• Regional Plan will need to be amended to include properties outside of Centre Plan area.

20
Example of Three Year Rolling AverageSuppose a business is assessed at 100,000.The value increases from 100,000 to $135,000. The average business went up 0%.The increase for your business that is above 5% is averaged over three years:
Total Value 135,000Amount not averaged: 105,000 ($100,000 + 5% = $105,000)Amount spread over three years 30,000
Year 1 Year 2 Year 3 Year 4 Year 5Current Approach 100,000 100,000 135,000 135,000 135,000
Amount Plus 5% 100,000 100,000 105,000 105,000 105,000Eligible $ to Average 10,000 20,000 30,000
Rolling Average (Tax Bill) 115,000 125,000 135,000

21
Towards Implementation• Considerations:
– MPS must designate a “Commercial Development Districts” (CDD) for water and sewer areas.
• CDD in the proposed Centre Plan.• Must include CDD in Regional Plan review.
– Cannot be combined with special tax rates.– Assessment declines can’t be averaged.
• PVSC to provide adjusted assessment roll with 3-year average for eligible properties.
• Communications, transition and system changes.• Possibility of additional administrative cost (to be determined)• Implementation Timetable: 2021-22

22
RecommendationIt is recommended that Halifax Regional Council direct the CAO to:
1. Develop and return to Regional Council for its consideration a by-law to phase-in commercial tax bills that:
a. uses a three-year rolling assessment average,b. is targeted towards properties with assessment growth more than 5 percent above the HRM average,c. is implemented starting in fiscal year 2021-22, and d. has a renewal requirement for it to extend beyond 2023-24; and,
2. work with the business community on implementation of a three-year rolling average, and;
3. direct staff to return to Regional Council with a program review before the end of 2023-24.