Embed Size (px)
Citation preview
FORM 6-K
U.S. SECURITIES AND EXCHANGE COMMISSION Washington, D.C. 20549
Report of Foreign Private Issuer Pursuant to Rule 13a-16 or 15d-16 of the Securities Exchange Act of 1934
Commission File Number: 1-15270
For the month of December 2015
NOMURA HOLDINGS, INC. (Translation of registrant’s name into English)
9-1, Nihonbashi 1-chome Chuo-ku, Tokyo 103-8645
Japan (Address of principal executive offices)
Indicate by check mark whether the registrant files or will file annual reports under cover Form 20-F or Form 40-F.
Form 20-F X Form 40-F
Indicate by check mark if the registrant is submitting the Form 6-K in paper as permitted by Regulation S-T Rule 101(b)(1):
Indicate by check mark if the registrant is submitting the Form 6-K in paper as permitted by Regulation S-T Rule 101(b)(7):
Incorporation by Reference
The registrant hereby incorporates Exhibit 1 to this report on Form 6-K by reference (i) in the prospectus that is part of the Registration Statement on Form F-3 (Registration No. 333-191250) of the registrant and Nomura America Finance, LLC, filed with the Securities and Exchange Commission (“SEC”) on September 19, 2013 and (ii) in the prospectus that is part of the Registration Statement on Form F-3 (Registration No. 333-186755) of the registrant, filed with the SEC on February 20, 2013.
Information furnished on this form:
EXHIBITS
Exhibit Number
1. Nomura Holdings, Inc. Interim Operating and Financial Review
15. Acknowledgment Letter of Ernst & Young ShinNihon LLC
101.INS XBRL Instance Document
101.SCH XBRL Taxonomy Extension Schema
101.CAL XBRL Taxonomy Extension Calculation Linkbase
101.DEF XBRL Taxonomy Extension Definition Linkbase
101.LAB XBRL Taxonomy Extension Label Linkbase
101.PRE XBRL Taxonomy Extension Presentation Linkbase

SIGNATURES
Pursuant to the requirements of the Securities Exchange Act of 1934, the registrant has duly caused this report to be signed on its behalf by the undersigned, thereunto duly authorized.
NOMURA HOLDINGS, INC.
Date: December 18, 2015 By: /s/ Hajime Ikeda
Hajime Ikeda
Senior Managing Director
1
Exhibit 1
NOMURA HOLDINGS, INC. INTERIM OPERATING AND FINANCIAL REVIEW
TABLE OF CONTENTS
Presentation of Financial and Other Information 1
Recent Developments 2
Risk Factors 7
Operating and Financial Review and Prospects 9
Interim Consolidated Financial Statements (UNAUDITED)
Consolidated Balance Sheets as of March 31, 2015 and September 30, 2015 F-2
Consolidated Statements of Income for the Six Months Ended September 30, 2014 and 2015 and Three Months Ended September 30, 2014 and 2015 F-5
Consolidated Statements of Comprehensive Income for the Six Months Ended September 30, 2014 and 2015 and Three Months Ended September 30, 2014 and 2015 F-7
Consolidated Statements of Changes in Equity for the Six Months Ended September 30, 2014 and 2015 F-8
Consolidated Statements of Cash Flows for the Six Months Ended September 30, 2014 and 2015 F-9
Notes to the Interim Consolidated Financial Statements F-10
Report of Independent Registered Public Accounting Firm F-95
Presentation of Financial and Other Information
As used in this Form 6-K, references to the “Company”, “Nomura”, “Nomura Group”, “we”, “us” and “our” are to Nomura Holdings, Inc. and, except as the context otherwise requires, its consolidated subsidiaries. As part of certain line items in Nomura’s financial statements and information included in this Form 6-K, references to “NHI” are to Nomura Holdings, Inc.
Unless otherwise stated, references in this Form 6-K to “yen” and “¥” are to the lawful currency of Japan and references to “U.S. dollars” and “$” are to the lawful currency of the United States of America (“U.S.”).
All ownership data with respect to us presented in this Form 6-K is presented based on the voting interest directly or indirectly held by us. Our voting interest is presented in accordance with Japanese reporting requirements, pursuant to which the amount presented with respect to each subsidiary is the percentage of voting rights of such subsidiary held directly by us or our subsidiaries. For example, wholly-owned subsidiaries of our subsidiaries are listed as 100%, regardless of the level of our direct interest in the intermediate subsidiaries.
Amounts shown within this Form 6-K have been rounded to the nearest indicated digit unless otherwise specified. In tables and graphs with rounded figures, sums may not add up due to rounding.
Except as otherwise indicated, all financial information with respect to us presented in this Form 6-K is presented on a consolidated basis. Our fiscal year ends on March 31 of each year. We prepare interim consolidated financial statements in accordance with U.S. generally accepted accounting principles (“U.S. GAAP”). Our interim consolidated financial statements, including the notes thereto, for the six months ended September 30, 2014 and 2015 are included elsewhere in this Form 6-K. The interim consolidated financial statements included in this Form 6-K have been reviewed in accordance with the standards of the Public Company Accounting Oversight Board (United States) by our independent auditors.
2
Recent Developments
Recent Developments in Capital Adequacy Regulations. In December 2010, the Basel Committee on Banking Supervision (“Basel Committee”) issued the overall reform package on capital adequacy ratio, liquidity and leverage ratio from Basel II (“Basel III”) in order to promote a more resilient banking sector. The Basel Committee has been reviewing the Basel III package and has published various proposals. After the implementation of the Capital Adequacy Notice on Final Designated Parent Company, which was revised to be in line with Basel III, the Financial Services Agency of Japan (“FSA”) has been considering further revisions, taking into consideration the series of proposals published by the Basel Committee. In addition to Basel III, implementation of new regulations or strengthening of existing regulations have been determined or are under consideration by internal organizations such as the G-20, Financial Stability Board (“FSB”), International Organization of Securities Commissions (“IOSCO”) and Basel Committee, or governmental and self-regulatory organizations in Japan and in virtually all other jurisdictions in which we operate. The FSB and the Basel Committee at the Group of Twenty (“G-20”) summit in November 2011 identified global systemically important banks (“G-SIBs”) on which additional capital requirements will be imposed and updates the list of G-SIBs in November of each year. We have not been designated as a G-SIB in the past, since November 2013, and we were not designated as a G-SIB in November 2015. The Basel Committee published updated assessment methodology and the higher loss absorbency requirement on G-SIBs, as well as disclosure requirements on G-SIBs evaluation indices, and such disclosure requirements were made effect by the FSA on March 2014. Also, the Basel Committee developed and published a set of principles on the assessment methodology and the higher loss absorbency requirement for domestic systemically important banks (“D-SIBs”), extending the framework for G-SIBs to D-SIBs. We were designated as a D-SIB in December 2015 by the FSA. In addition, the FSB and the IOSCO have published assessment methodologies for identifying Non-bank Non-insurer Global Systemically Important Financial Institutions (“NBNI G-SIFIs”), for public consultation.
Regulatory Developments in the U.S. and the U.K. Our overseas offices and subsidiaries are also subject to various laws, rules and regulations applicable in the countries where they conduct their operations, including, but not limited to those promulgated and enforced by the U.S. Securities and Exchange Commission (“SEC”), the Commodity Futures Trading Commission (“CFTC”), the U.S. Treasury, the Financial Stability Oversight Council, the New York Stock Exchange, the Financial Industry Regulatory Authority (a private organization with quasi-governmental authority and a regulator for all securities companies doing business in the U.S.), the National Futures Association (a self-regulatory organization for the U.S. derivatives industry) in the U.S.; and by the Prudential Regulation Authority (“U.K. PRA”), the Financial Conduct Authority (“U.K. FCA”), and the London Stock Exchange in the U.K. We are also subject to international money laundering and related regulations in various countries. For example, the USA PATRIOT Act of 2001 contains measures to prevent, detect and prosecute terrorism and international money laundering by imposing significant compliance and due diligence obligations and creating crimes and penalties. The Foreign Account Tax Compliance Act (“FATCA”) which was enacted in 2010 requires foreign financial institutions (“FFIs”) to report to the U.S. Internal Revenue Service information about financial accounts held by U.S. taxpayers, or by foreign entities in which U.S. taxpayers hold a substantial ownership interest. As a result, Nomura will be subject to certain reporting requirements consistent with a mutual agreement between Japanese governmental authorities and the U.S. Treasury Department. Failure to comply with such laws, rules or regulations could result in fines, suspension or expulsion, which could materially and adversely affect us.
In response to the financial markets crisis, governments and regulatory authorities in various jurisdictions have made and continue to make numerous proposals to reform the regulatory framework for, or impose a tax or levy upon, the financial services industry to enhance its resilience against future crises, contribute to the relevant economy generally or for other purposes. In July 2010, the U.S. enacted the Dodd-Frank Act, which is now the subject of a multi-agency rulemaking process. The rulemakings include the following: (i) create a tighter regulatory framework for OTC derivatives to promote transparency and impose conduct rules in that marketplace; (ii) establish a process for designating nonbank financial firms as Systemically Important Financial Institutions (“SIFIs”), subject to increased (and sometimes new) prudential oversight including early remediation, capital standards, resolution authority and new regulatory fees; (iii) prohibit material conflicts of interest between firms that package and sell asset-backed securities (“ABS”) and firms that invest in ABS; (iv) establish risk retention requirements for ABS; and (v) rules related to the orderly liquidation of certain broker dealers; (vi) annual stress tests; (vii) a number of executive compensation mandates, including rules to curtail incentive compensation that promotes excessive risk taking and listing standards for recovery of erroneously awarded compensation. The new regulatory framework for OTC derivatives includes mandates for clearing transactions with designated clearing organizations, exchange trading, new capital requirements, bilateral and variation margin for non-cleared derivatives, reporting and recordkeeping, and internal and external business conduct rules. Some U.S. derivatives and executive compensation rules may be applied extraterritorially and therefore impact some non-U.S. Nomura entities.
3
Other aspects of the Dodd-Frank Act and related rulemakings include provisions that (i) prohibit deposit-taking banks and their affiliates from engaging in proprietary trading and limit their ability to make investments in hedge funds and private equity funds (the so-called “Volcker Rule”); (ii) empower regulators to liquidate failing nonbank financial companies that are systemically important; (iii) provide for new systemic risk oversight and increased capital requirements for both bank and non-bank SIFIs; (iv) provide for a broader regulatory oversight of hedge funds; and (v) new regulations regarding the role of credit rating agencies, investment advisors and others. To facilitate the transition to the requirements of the Dodd-Frank Act, the Commodity Futures Trading Commission issued an exemptive order in July 2013 (“Exemptive Order”) that granted market participants temporary conditional relief from certain provisions of the Commodity Exchange Act, as amended by the Dodd-Frank Act. As the Exemptive Order expired on December 21, 2013 some U.S. derivatives rules are now being applied extraterritorially and are now therefore impacting some non-U.S. Nomura entities. In addition, Title VII of the Dodd-Frank Act gives the SEC regulatory authority over “security-based swaps” which are defined under the act as swaps based on a single security or loan or a narrow-based group or index of securities. Security-based swaps are included within the definition of “security” under the U.S. Securities and Exchange Act of 1934 and the U.S. Securities Act of 1933. On May 1, 2013, the SEC proposed rules and interpretive guidance addressing cross-border security-based swap activities. On June 25, 2014, the SEC finalized some (but not all) of the cross-border rules, namely key foundational definitions and registration calculations that will become operative once the SEC sets a timeframe for the security-based swap dealer registration process to begin. Additionally, on April 29, 2015, the SEC proposed rules that would apply certain Dodd-Frank Act requirements to security-based swaps of a non-U.S. person connected with its security-based swap dealing activity that it arranges, negotiates or executes using its personnel or personnel of its agent located in the United States. Once final, these rules will also be applied extraterritorially and impact some non-U.S. Nomura entities. The exact details of the Dodd-Frank Act implementation and ultimate impact on Nomura’s operations will depend on the form and substance of the final regulations adopted by various governmental agencies and oversight boards. In addition to the rulemakings required by the Dodd-Frank Act, the SEC is considering other rulemakings that will impact Nomura’s U.S. entities. While these rules have not been formally proposed, they have been publicly reported in the U.S. Office of Management and Budget’s (“OMB”) “Current Regulatory Plan and Unified Agenda of Regulatory and Deregulatory Actions.” The SEC’s Division of Trading and Markets is considering recommending that the SEC propose an amendment to its net capital rule that would prohibit a broker-dealer that carries customer accounts from having a ratio of total assets to regulatory capital in excess of a certain level. The SEC and the CFTC are also considering a number of changes to market structure rules.
On July 19, 2011, the Financial Stability Board published a consultative document to establish a global framework to improve authorities’ capacity to resolve failing SIFIs without systemic disruption and exposing taxpayers to the risk of loss. The proposed measures require Global SIFIs (“G-SIFIs”) to prepare and maintain recovery and resolution plans (“RRPs”) by December 2012. In light of such a global framework, the U.K. Financial Services Authority (“U.K. FSA”) (which has now been replaced by the U.K. PRA and FCA) published a consultation paper on August 9, 2011 containing its proposals for RRPs. The consultation paper covered a requirement for banks and large investment firms in the U.K. (including G-SIFIs) to prepare and maintain RRPs. In a separate discussion paper, the U.K. FSA explored matters relevant to resolving financial services firms, including the resolution of trading books, enhancing the resolution toolkit and bail-ins. In May 2012, the U.K. FSA published a feedback statement setting out its approach to ensure firms develop appropriate recovery plans and resolution packs and a further update was issued by the U.K. FSA in February 2013. In December 2013, the U.K. PRA published a policy statement setting out final rules which require banks, building societies and U.K. PRA-regulated investment firms to produce recovery plans (identification of options to recover financial strength in stress situations) and resolution packs (information to support resolution planning by the authorities).
These rules were amended in January 2015 as part of the U.K. implementation of the EU Bank Recovery and Resolution Directive (“BRRD”), which entered into force on June 12, 2014. The BRRD also aims to implement Financial Stability Board recommendations on recovery and resolution regimes for financial institutions and for U.K. purposes it will partially supersede the existing U.K. regime. The BRRD applies to banks and investment firms operating in EU member states, including EU branches and subsidiaries of third country firms. It includes requirements for the preparation of RRPs by institutions and regulators. It also creates various powers for EU regulators to intervene to resolve institutions at risk of failure, including the ability to sell or transfer all or part of an institution (similar to existing U.K. regulatory powers) and the introduction of a debt write down or bail-in tool. Amongst other things, relevant firms are required to include a contractual recognition of bail-in clause in a wide range of non-EU law governed contracts governing liabilities created or materially amended after January 1, 2016 under which the creditor contractually recognizes and agrees that the liability may be subject to use of the bail-in tool. Specific provision is also made to facilitate cross-border crisis management and the recognition of third country recovery and resolution action in relation to third country banking and investment groups. As part of the bail-in rules, firms will be required to maintain capital resources sufficient to meet the stipulated minimum requirement for eligible liabilities (“MREL”). The MREL requirement overlaps with the global capital standards on total loss absorbing capacity (“TLAC”) for G-SIBs issued by the Financial Stability Board on November 9, 2015. The TLAC standard defines a minimum requirement for the instruments and liabilities that should be readily available for bail-in within resolution at G-SIBs, but does not limit authorities’ powers under the applicable resolution law to expose other liabilities to loss through bail-in or the application of other resolution tools. G-SIBs will be required to meet the TLAC requirement alongside the minimum regulatory requirements set out in the Basel III framework.
There are a number of regulatory developments that impact capital requirements for U.K. regulated entities. Most significant of these is the Basel III framework, as adopted into EU law through the fourth Capital Requirements Directive and Capital Requirements Regulation (together, “CRD IV”), which came into force on January 1, 2014. The aim of CRD IV is to strengthen the resilience of the EU banking sector so it is better placed to absorb economic shocks while ensuring that banks continue to finance economic activity and growth. CRD IV sets out requirements for minimum capital requirements for banks and investment firms and also introduced new capital and liquidity buffers.
4
The new framework also modifies treatment of bank exposures to central counterparties, resulting in increased capital charges (though still preferential relative to bilateral exposures), as well as qualifying conditions that must be met by central counterparties before institutions may benefit from the preferential treatment. CRD IV introduces the concept of the leverage ratio and the net stable funding ratio (“NSFR”) expected to apply from 2018, although further legislation is required to implement a binding requirement. The directive introduces corporate governance requirements with a more rigorous supervision of risks by directors as well as management or supervisory boards. The rules concern the composition of boards, their functioning and their role in risk oversight and strategy in order to improve the effectiveness of risk oversight by boards. The regulation requires firms to make increased Pillar 3 disclosures about their corporate governance arrangements. CRD IV also sets out requirements in relation to remuneration policies imposing a 1:1 ratio on the basic salary relative to bonus (can be raised to a maximum of 1:2 with the approval of shareholders) for certain staff.
On October 20, 2011, the European Commission published draft legislation for the Directive on markets in financial instruments repealing Directive 2004/39/EC of the European Parliament and of the Council. The legislation has been split into two parts: the Markets in Financial Instruments Directive (“MiFID”) and the Markets in Financial Instruments Regulation (“MiFIR”). On May 13, 2014, the Council of the European Union announced that it had adopted MiFID II and MiFIR. MiFID II was published in the EU Official Journal on June 12, 2014 and entered into force on July 3, 2014. However, Member States have until July 3, 2016 to transpose the MiFID II Directive into national law (MiFIR will become fully effective at the same time).
The majority of the new rules will come into force in January 2017. However, on November 10, 2015, the Commission recommended to the ECON Committee that the implementation of MiFID II be delayed by approximately one year, and on November 27, 2015, the European Parliament’s negotiation team informed the Commission that they would accept a one-year delay of the entry into force of MiFID II. On this basis, the majority of the new rules under MiFID II and MiFIR would only take effect from January 2018.
The legislation seeks to introduce wide-reaching changes to markets, including the extension of market transparency rules into non-equities and potentially reducing the size of the OTC derivative market by mandating the clearing of standardised OTC transactions through central clearing counterparties and their trading through regulated trading venues. The new framework introduces a market structure which seeks to close certain loopholes and ensures that trading, wherever appropriate, takes place on regulated platforms. It introduces rules on high frequency trading and aims to improve the transparency and oversight of financial markets. The revised MiFID also aims to strengthen the protection of investors by introducing more robust organisational and conduct requirements and by strengthening the role of management bodies. The new framework also increases the role and supervisory powers of regulators and establishes powers to prohibit or restrict the marketing and distribution of certain products in well-defined circumstances. A harmonised regime for granting access to EU professional markets for firms from third countries, based on an equivalence assessment of third country jurisdictions by the Commission, is introduced.
In December 2014, the European Securities and Markets Authority (“ESMA”) published its final technical advice that it is required to provide to the European Commission on the possible content of the delegated acts required by various provisions of MiFID II and MiFIR. ESMA has also launched consultations on and published draft regulatory and implementing technical standards (“ITS”) and guidelines required under MiFID II and MiFIR. ESMA published various final regulatory and ITS in September 2015. The final report deals with technical standards from the areas of transparency, market microstructure, data publication and access, requirements applying on and to trading venues, commodity derivatives, market data reporting, post-trading and investor protection. On November 4, 2015, ESMA published the responses received to a consultation regarding three draft ITS required under MiFID II on which ESMA had not yet consulted. On November 5, 2015, ESMA launched a public consultation on draft requirements regarding indirect clearing arrangements under both MiFIR and EMIR.
At the U.K. level, the U.K. FCA has also published various commentary on MiFID II, including a Discussion Paper published in March 2015, which discusses the FCA’s approach to those areas of MiFID II for which the U.K. has discretion in relation to implementation. The U.K. FCA plans to publish its first consultation paper on MiFID II implementation in December 2015. The paper will focus on markets issues. The U.K. FCA was proposing to publish a second consultation in March 2016; however, this timing is now subject to some uncertainty due to the possible change to the MiFID II implementation date.
The European Market Infrastructure Regulation (“EMIR”) introduces new requirements to improve transparency and reduce the risks associated with the derivatives market. EMIR was adopted on July 4, 2012 and entered into force on August 16, 2012. EMIR applies to any entity established in the European Union that is a legal counterparty to a derivative contract, even when trading with non-EU firms. It may also have extraterritorial impact in certain circumstances. Many of the EMIR requirements have entered into force throughout 2013 and 2014, although some elements have yet to be implemented. When fully implemented, EMIR will require entities that enter into any form of derivative contract to: report every derivative contract that they enter to a trade repository; implement new risk management standards, including operational processes and margining, for all bilateral over-the-counter derivatives trades that are not cleared by a central counterparty; and clear, through a central counterparty, over-the-counter derivatives that are subject to a mandatory clearing obligation. Nomura is in the process of implementing the various EMIR requirements across work streams in accordance with their respective compliance dates.
In May 2015, the Commission published a consultation paper to enable it to judge market participants’ experience in implementing EMIR. ESMA’s input to the Commission’s consultation on the EMIR review made recommendations to amend EMIR in a number of areas, including the clearing obligation, recognition of third-country CCPs and trade repositories.
5
In November 2015, the Council of the EU formally adopted the Securities Financing Transactions Regulation (“SFTR”), which forms part of the EU’s package of legislation targeted at reforming shadow banking and aims to improve transparency in the securities financing transactions (“SFT”) market. The SFTR, once implemented, will require counterparties to an SFT to report the SFT to a trade repository; impose various potentially onerous requirements on entities reusing financial instruments received under a collateral arrangement and apply various related disclosure requirements.
On October 20, 2011, the European Commission published draft legislation for the review of the Market Abuse Directive (“MAD II”). The dossier has been split into two parts: the Directive on criminal sanctions for market abuse (“CSMAD”) and the Market Abuse Regulation (“MAR”). The new rules on market abuse update and strengthen the existing framework to ensure greater market integrity and investor protection, replacing the existing Market Abuse Directive.
In June 2014, MAR and CSMAD were published in the EU Official Journal. MAR repeals and replaces the Market Abuse Directive and its implementing legislation with effect from July 3, 2016. A number of delegated acts, technical standards and guidelines in key areas are required to be produced under MAR. On September 28, 2015, ESMA published a final report containing draft regulatory technical standards (“RTS”) and ITS on MAR. On November 5, 2015, the U.K. FCA published a consultation paper setting out its proposals for the necessary changes to its rules required to implement MAR.
Member States must also transpose CSMAD into their national law by July 3, 2016. The U.K. has not opted in to CSMAD and is therefore not obliged to transpose its provisions into national law. CSMAD requires all Member States to provide for harmonised criminal offences of insider dealing and market manipulation, and to impose maximum criminal penalties of not less than 4 and 2 years imprisonment, respectively, for the most serious market abuse offences.
In February 2013, the European Commission published draft legislation for the review of the current EU anti-money laundering rules, in the form of proposals for the Fourth Money Laundering Directive (“MLD4”). MLD4 came into effect on June 25, 2015. It has to be transposed by Member States by June 26, 2017, on which date it will repeal the Third Money Laundering Directive (“MLD3”) and the MLD3 Implementing Directive. MLD4 aims to update and strengthen the current EU anti-money laundering regime, including by implementing the standards published by the Financial Action Task Force in 2012. MLD4 also shifts the focus of regulatory requirements further towards a risk-based approach, which will require increasingly robust policies and procedures within regulated firms in order to assess and monitor risk effectively. The scope of the anti-money laundering regime is also extended in certain respects and the approach to classifying third country firms will in the future be focused on “blacklisting” of non-equivalent jurisdictions (in contrast with the current focus on positive equivalence).
The Alternative Investment Fund Managers Directive (“AIFMD”) entered into force on July 21, 2011. The AIFMD was required to be implemented by Member States by July 22, 2013 (subject to a one year transitional period). The AIFMD and its related implementing legislation establishes a detailed framework for the management and marketing of alternative investment funds (or “AIFs”) within the EEA. As the concept of an “AIF” is broadly defined, the AIFMD captures the majority of non-UCITs funds, including hedge funds, private equity, debt and real estate funds.
Under the AIFMD regime, fund managers operating within the EEA are subject to extensive organizational requirements, including mandatory authorization by an EEA regulator, substantial ongoing compliance, conduct of business and disclosure requirements and the obligation to appoint an independent depositary with responsibility for an AIF’s assets. A separate regulatory regime applies to depositaries, which must also be authorized for this purpose. Additional restrictions and disclosure obligations apply to managers of private equity firms which acquire material holdings in EEA companies. Non-EEA fund managers seeking to target EEA investors are also subject, at a minimum, to a sub-set of the compliance requirements for EEA managers, focusing mainly on disclosure. It is open to each Member State to introduce additional restrictions for third-country managers and some jurisdictions remain very restrictive in this respect. The possibility of a passporting regime for third-country managers is, however, provided for in the AIFMD and is currently under consideration at the EU level, although further legislation would be required to introduce this. The AIFMD has material impact for Nomura insofar as it manages and markets investment funds within the EEA (which now attracts an enhanced compliance burden). Nomura also acts as depositary of an AIF and is accordingly subject to separate compliance requirements and liability provisions in this capacity.
On April 1, 2013, the U.K. Financial Services Act 2012 was formally enacted (after having received Royal Assent on December 19, 2012). The implementation of the U.K. Financial Services Act 2012 has resulted in the U.K. FSA being replaced by a “twin peaks” approach through the U.K. PRA and U.K. FCA. The U.K. PRA was formed as a subsidiary of the Bank of England and is responsible for the prudential supervision of a number of banks and deposit takers, plus certain large investment firms and insurers. It has a single objective to “promote the safety and soundness of regulated firms.” The U.K. FCA was formed as a separate entity and is responsible for the prudential supervision of firms not supervised by the U.K. PRA and for market conduct matters for all authorized firms. The U.K. FCA has a single strategic objective of “making markets work well.” Nomura’s main operating subsidiaries in the U.K. (Nomura International plc and Nomura Bank International plc) are regulated by both the U.K. PRA and U.K. FCA.
6
The U.K. FCA and U.K. PRA currently maintain a regulatory regime for the individual approval and accountability of certain senior management and other significant personnel carrying out “controlled functions” within banks and investment firms. In July 2014, the U.K. FCA and U.K. PRA consulted on proposals for a new senior managers regime (“SMR”) for senior managers and a related certification regime (“CR”) for a wider population of employees whose performance has the potential to pose harm to a firm or its customers. In March 2015, the U.K. FCA and U.K. PRA consulted on applying the SMR and CR to U.K. branches of foreign banks. On August 13, 2015, the U.K. FCA and the U.K. PRA published their respective rules confirming how they will apply the SMR and CR to U.K. branches of non-EEA banks (incoming branches). The new individual accountability standards in this area have been developed by the FCA in response to recommendations made by the Parliamentary Committee on Banking Standards in this area and are expected to enter into force from March 2016 onwards. When implemented these new standards will significantly increase regulatory accountability for senior managers. Senior managers (but not those of U.K. branches of overseas banks) may be prosecuted by the U.K. PRA or U.K. FCA in certain prescribed circumstances for taking a decision that causes a financial institution to fail. The rules will also require firms to demarcate responsibilities more precisely, implement new systems and controls for certification and share with the U.K. PRA/U.K.FCA detailed information on their governance structures.
Over the past two to three years the U.K. FCA (and its predecessor the U.K. FSA) has worked towards introducing a number of changes to the U.K. regulatory regime for the protection of client assets (“CASS”). These requirements are relevant for Nomura’s U.K. entities where they hold client money and other assets on behalf of their clients (other than in the course of deposit-taking activity). The reforms made to the CASS regime have been driven in large part by concerns of the U.K. FSA/FCA regarding the shortcomings of the previous rules that were highlighted in the U.K. case law surrounding the collapse of Lehman Brothers International (Europe). The U.K. FCA commenced its review of the CASS regime in 2012 and published final rules in 2014, the last of which came into force on June 1, 2015. The reforms aim to improve the speed and efficiency with which client assets may be distributed following the insolvency of the holding firm and to minimize negative market impact. This has resulted in extensive changes to the rules, designed to strengthen the legal and operational requirements of holding firms for effective segregation of client money and to enhance controls over institutions with which client money is deposited and third parties to whom client money is transferred. The conditions attached to exclusions from the client money rules have also been clarified and enhanced. In addition, various changes have also been made to the rules to give effect to EMIR requirements regarding client money held in the course of derivatives clearing activity. The net effect of these various changes is generally to increase the operational and compliance burden on firms that hold client money and assets. Nomura has made arrangements to implement the changes and to review existing client arrangements where appropriate.
A number of reforms are also either pending or anticipated at the EU and/or U.K. level, which may have a material impact on Nomura and on EU markets generally. At the EU level, these include the Bank Structure Regulation and the Capital Markets Union initiative (together with the related review of the Prospectus Directive and the EU securitization framework). At the U.K. level, the Fair and Effective Markets Review recently completed by the U.K. authorities may also have a material impact on Nomura and on U.K. markets.
Disposal of Subsidiary. In December 2015, Chi-X Global Holdings LLC, our consolidated subsidiary, entered into an agreement to sell Chi-X Canada ATS Ltd. (“Chi-X Canada”), its wholly owned subsidiary, to Nasdaq Inc. Chi-X Canada is based in Canada and operates an Alternative Trading System marketplace for equity securities listed on the Toronto Stock Exchange and the TSX Venture Exchange. Subject to customary regulatory approvals, the sale of Chi-X Canada is expected to be completed by the end of March 2016.

7
Risk Factors
There is no significant change from the risks as previously disclosed in Part I, Item 3.D “Risk Factors” of our annual report on Form 20-F for the year ended March 31, 2015.
8
Special Note Regarding Forward-Looking Statements This report contains forward-looking statements that are based on our current expectations, assumptions, estimates and
projections about our business, our industry and capital markets around the world. These forward-looking statements are subject to various risks and uncertainties. Generally, these forward-looking statements can be identified by the use of forward-looking terminology such as “may”, “will”, “expect”, “anticipate”, “estimate”, “plan” or similar words. These statements discuss future expectations, identify strategies, contain projections of our results of operations or financial condition, or state other forward-looking information.
Known and unknown risks, uncertainties and other factors may cause our actual results, performance, achievements or financial position to differ materially from any future results, performance, achievements or financial position expressed or implied by any forward-looking statements contained in this report. Such risks, uncertainties and other factors are set forth in “Risk Factors” above and in Item 3.D of our annual report on Form 20-F for the fiscal year ended March 31, 2015, as well as elsewhere in this Form 6-K.
9
Operating and Financial Review and Prospects
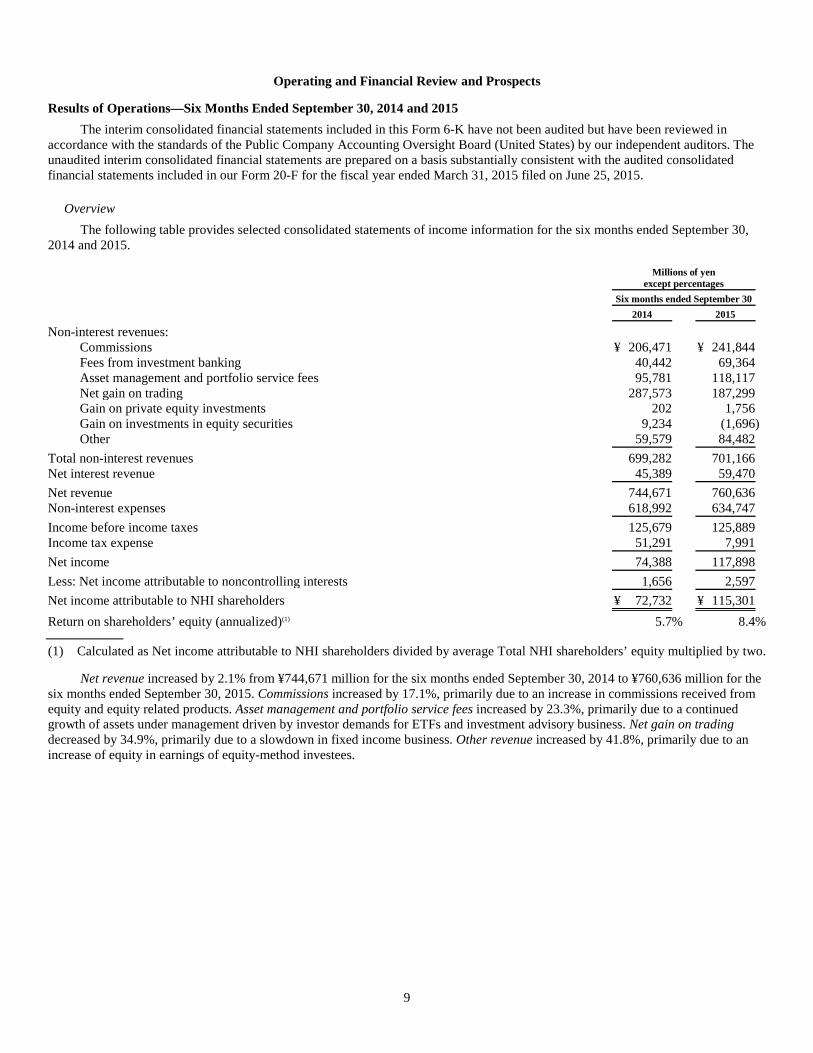
Results of Operations—Six Months Ended September 30, 2014 and 2015 The interim consolidated financial statements included in this Form 6-K have not been audited but have been reviewed in
accordance with the standards of the Public Company Accounting Oversight Board (United States) by our independent auditors. The unaudited interim consolidated financial statements are prepared on a basis substantially consistent with the audited consolidated financial statements included in our Form 20-F for the fiscal year ended March 31, 2015 filed on June 25, 2015.
Overview The following table provides selected consolidated statements of income information for the six months ended September 30,
2014 and 2015.
Millions of yen except percentages
Six months ended September 30
2014
2015
Non-interest revenues:
Commissions ¥ 206,471 ¥ 241,844 Fees from investment banking 40,442 69,364 Asset management and portfolio service fees 95,781 118,117 Net gain on trading 287,573 187,299 Gain on private equity investments 202 1,756 Gain on investments in equity securities 9,234 (1,696) Other 59,579 84,482
Total non-interest revenues 699,282 701,166 Net interest revenue 45,389 59,470
Net revenue 744,671 760,636 Non-interest expenses 618,992 634,747
Income before income taxes 125,679 125,889 Income tax expense 51,291 7,991
Net income 74,388 117,898
Less: Net income attributable to noncontrolling interests 1,656 2,597
Net income attributable to NHI shareholders ¥ 72,732 ¥ 115,301
Return on shareholders’ equity (annualized)(1) 5.7% 8.4% (1) Calculated as Net income attributable to NHI shareholders divided by average Total NHI shareholders’ equity multiplied by two.
Net revenue increased by 2.1% from ¥744,671 million for the six months ended September 30, 2014 to ¥760,636 million for the six months ended September 30, 2015. Commissions increased by 17.1%, primarily due to an increase in commissions received from equity and equity related products. Asset management and portfolio service fees increased by 23.3%, primarily due to a continued growth of assets under management driven by investor demands for ETFs and investment advisory business. Net gain on trading decreased by 34.9%, primarily due to a slowdown in fixed income business. Other revenue increased by 41.8%, primarily due to an increase of equity in earnings of equity-method investees.
10
Net interest revenue was ¥45,389 million for the six months ended September 30, 2014 and ¥59,470 million for the six months ended September 30, 2015. Net interest revenue is a function of the level and the mix of total assets and liabilities, which includes trading assets and financing and lending transactions, and the level, term structure and volatility of interest rates. Net interest revenue is an integral component of our trading business. In assessing the profitability of our overall business and of our Wholesale operation in particular, we view Net interest revenue and Non-interest revenues in aggregate.
Non-interest expenses increased by 2.5% from ¥618,992 million for the six months ended September 30, 2014 to ¥634,747 million for the six months ended September 30, 2015.
We are subject to a number of different taxes in Japan and have adopted the consolidated tax filing system permitted under Japanese tax law. The consolidated tax filing system only imposes a national tax. As a result of revisions to domestic tax laws during the third quarter ended December 31, 2011 and the fourth quarter ended March 31, 2014, Nomura’s domestic effective statutory tax rate was approximately 38% for the fiscal years ended March 31, 2013 and March 31, 2014, and decreased to approximately 36% for the fiscal year ended March 31, 2015. Furthermore, as a result of revision to domestic tax laws on March 31, 2015, Nomura’s effective statutory tax rate will decrease from approximately 36% to 33% for fiscal years beginning on or after April 1, 2015 and will decrease to approximately 32% for fiscal years beginning on or after April 1, 2016. Our foreign subsidiaries are subject to the income taxes of the countries in which they operate, which are generally lower than those in Japan. The Company’s effective statutory tax rate in any one year is therefore dependent on our geographic mix of profits and losses and also on the specific tax treatment applicable in each location.
For the six months ended September 30, 2014, the difference between the effective statutory tax rate of 36% and the effective tax rate of 40.8% was mainly due to non-deductible expenses, an increase in valuation allowance of foreign subsidiaries, whereas non-taxable revenue reduced the effective tax rate.
For the six months ended September 30, 2015, the difference between the effective statutory tax rate of 33% and the effective tax rate of 6.3% was mainly due to tax benefit recognized on the devaluation of investment in subsidiaries and affiliates, whereas an increase in valuation allowance of foreign subsidiaries.
Net income attributable to NHI shareholders was ¥72,732 million for the six months ended September 30, 2014 and ¥115,301 million for the six months ended September 30, 2015, individually. Our annualized return on shareholder’s equity was 5.7% for the six months ended September 30, 2014 and 8.4% for the six months ended September 30, 2015.
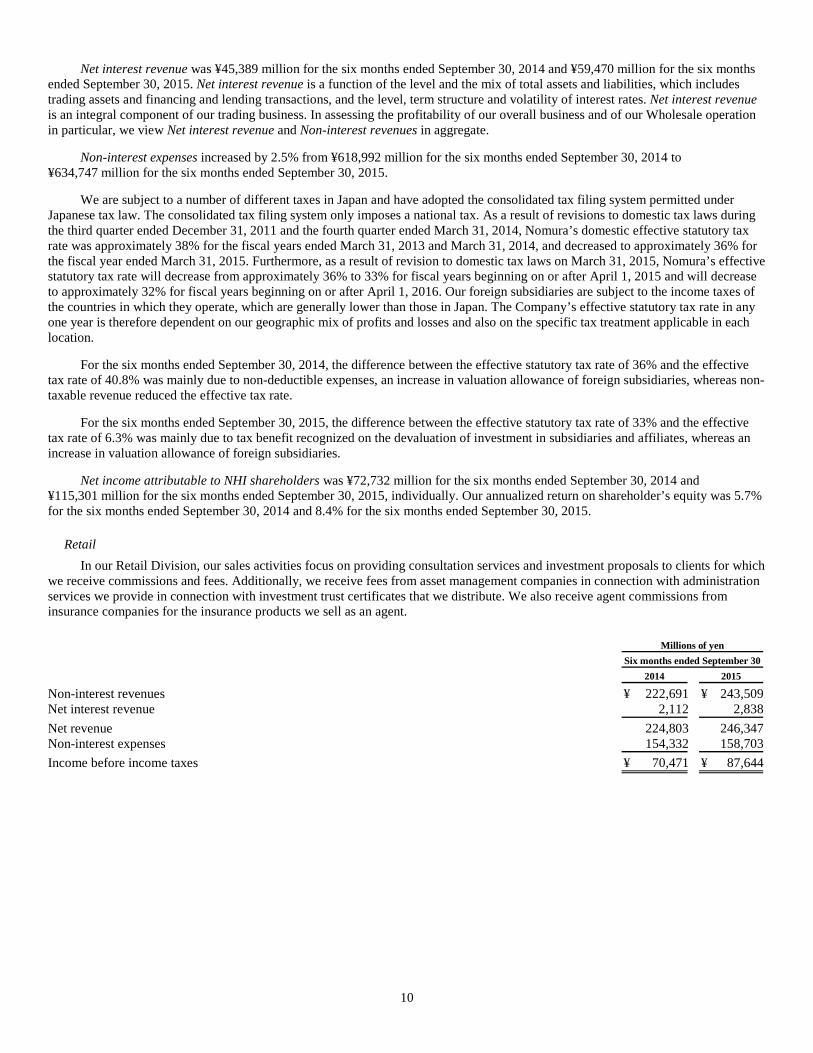
Retail In our Retail Division, our sales activities focus on providing consultation services and investment proposals to clients for which
we receive commissions and fees. Additionally, we receive fees from asset management companies in connection with administration services we provide in connection with investment trust certificates that we distribute. We also receive agent commissions from insurance companies for the insurance products we sell as an agent.
Millions of yen
Six months ended September 30
2014
2015
Non-interest revenues ¥ 222,691 ¥ 243,509 Net interest revenue 2,112 2,838
Net revenue 224,803 246,347 Non-interest expenses 154,332 158,703
Income before income taxes ¥ 70,471 ¥ 87,644
11
Net revenue increased by 9.6% from ¥224,803 million for the six months ended September 30, 2014 to ¥246,347 million for the six months ended September 30, 2015, primarily due to an increase in recurring revenue from investment trusts and discretionary investments, and the contribution from capital market transactions.
Non-interest expenses increased by 2.8% from ¥154,332 million for the six months ended September 30, 2014 to ¥158,703 million for the six months ended September 30, 2015.
Income before income taxes increased by 24.4% from ¥70,471 million for the six months ended September 30, 2014 to ¥87,644 million for the six months ended September 30, 2015.
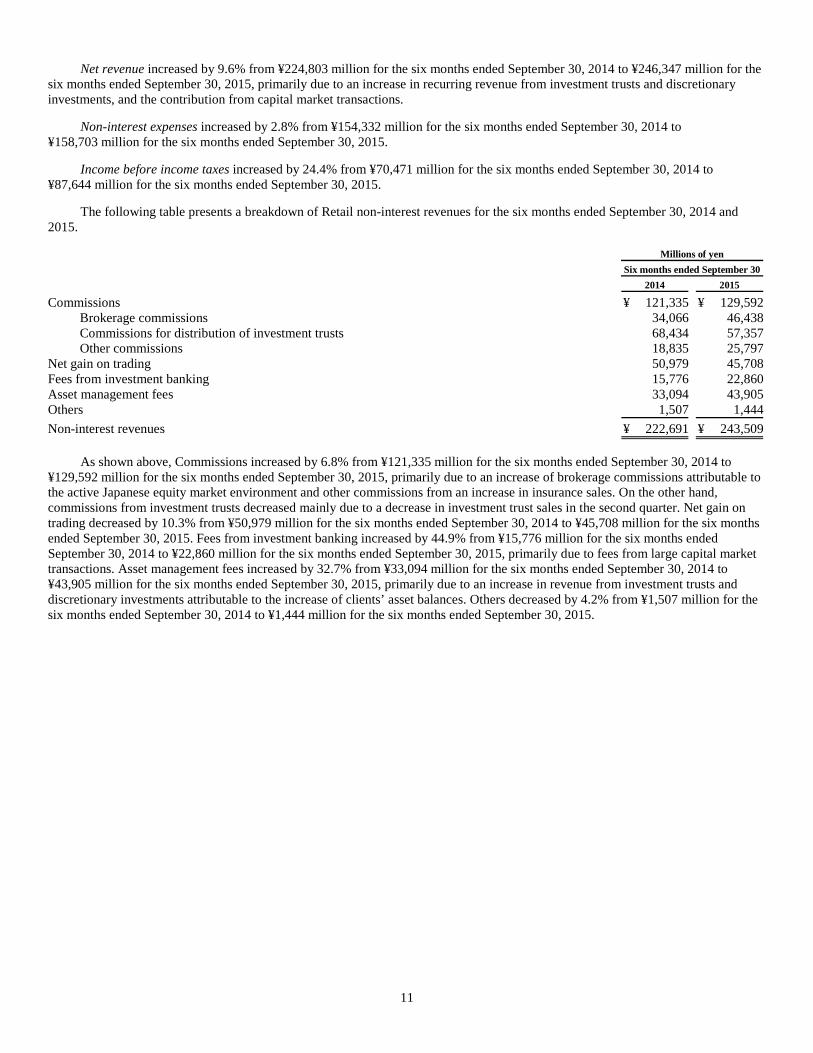
The following table presents a breakdown of Retail non-interest revenues for the six months ended September 30, 2014 and 2015.
Millions of yen
Six months ended September 30
2014
2015
Commissions ¥ 121,335 ¥ 129,592 Brokerage commissions 34,066 46,438 Commissions for distribution of investment trusts 68,434 57,357 Other commissions 18,835 25,797
Net gain on trading 50,979 45,708 Fees from investment banking 15,776 22,860 Asset management fees 33,094 43,905 Others 1,507 1,444
Non-interest revenues ¥ 222,691 ¥ 243,509
As shown above, Commissions increased by 6.8% from ¥121,335 million for the six months ended September 30, 2014 to ¥129,592 million for the six months ended September 30, 2015, primarily due to an increase of brokerage commissions attributable to the active Japanese equity market environment and other commissions from an increase in insurance sales. On the other hand, commissions from investment trusts decreased mainly due to a decrease in investment trust sales in the second quarter. Net gain on trading decreased by 10.3% from ¥50,979 million for the six months ended September 30, 2014 to ¥45,708 million for the six months ended September 30, 2015. Fees from investment banking increased by 44.9% from ¥15,776 million for the six months ended September 30, 2014 to ¥22,860 million for the six months ended September 30, 2015, primarily due to fees from large capital market transactions. Asset management fees increased by 32.7% from ¥33,094 million for the six months ended September 30, 2014 to ¥43,905 million for the six months ended September 30, 2015, primarily due to an increase in revenue from investment trusts and discretionary investments attributable to the increase of clients’ asset balances. Others decreased by 4.2% from ¥1,507 million for the six months ended September 30, 2014 to ¥1,444 million for the six months ended September 30, 2015.
12
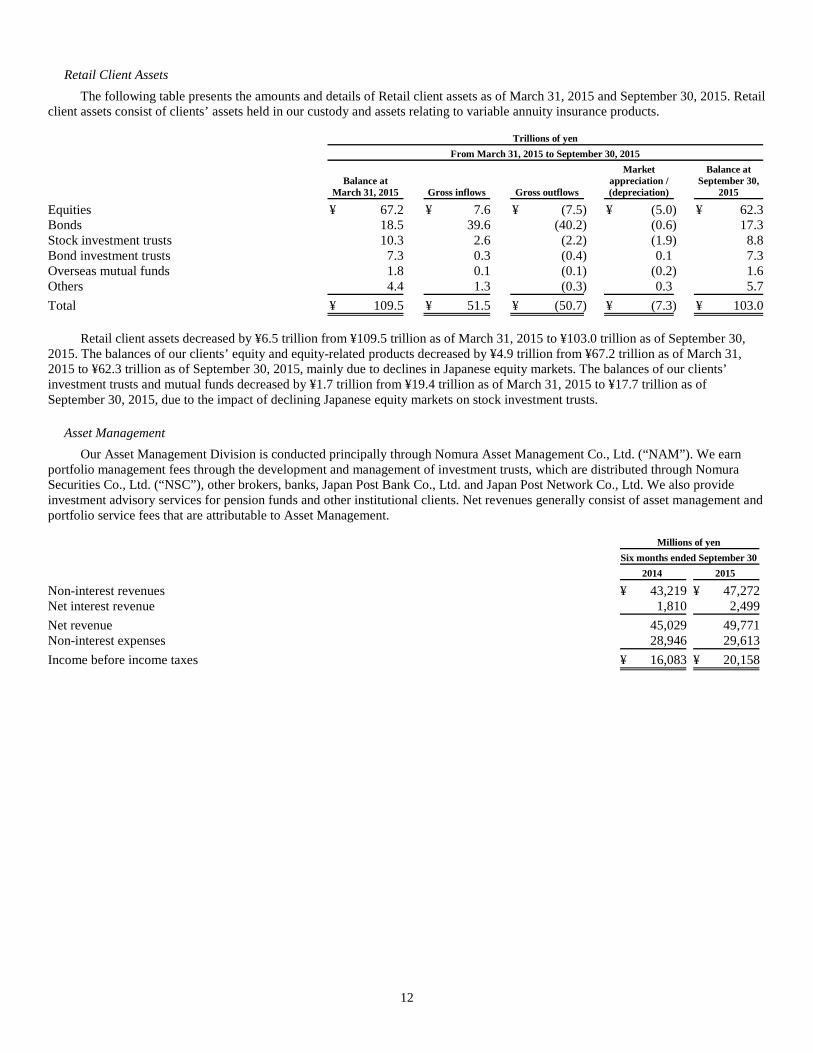
Retail Client Assets The following table presents the amounts and details of Retail client assets as of March 31, 2015 and September 30, 2015. Retail
client assets consist of clients’ assets held in our custody and assets relating to variable annuity insurance products.
Trillions of yen
From March 31, 2015 to September 30, 2015
Balance at March 31, 2015
Gross inflows
Gross outflows
Market appreciation / (depreciation)
Balance at September 30,
2015
Equities ¥ 67.2 ¥ 7.6 ¥ (7.5) ¥ (5.0) ¥ 62.3 Bonds 18.5 39.6 (40.2) (0.6) 17.3 Stock investment trusts 10.3 2.6 (2.2) (1.9) 8.8 Bond investment trusts 7.3 0.3 (0.4) 0.1 7.3 Overseas mutual funds 1.8 0.1 (0.1) (0.2) 1.6 Others 4.4 1.3 (0.3) 0.3 5.7
Total ¥ 109.5 ¥ 51.5 ¥ (50.7) ¥ (7.3) ¥ 103.0
Retail client assets decreased by ¥6.5 trillion from ¥109.5 trillion as of March 31, 2015 to ¥103.0 trillion as of September 30, 2015. The balances of our clients’ equity and equity-related products decreased by ¥4.9 trillion from ¥67.2 trillion as of March 31, 2015 to ¥62.3 trillion as of September 30, 2015, mainly due to declines in Japanese equity markets. The balances of our clients’ investment trusts and mutual funds decreased by ¥1.7 trillion from ¥19.4 trillion as of March 31, 2015 to ¥17.7 trillion as of September 30, 2015, due to the impact of declining Japanese equity markets on stock investment trusts.
Asset Management Our Asset Management Division is conducted principally through Nomura Asset Management Co., Ltd. (“NAM”). We earn
portfolio management fees through the development and management of investment trusts, which are distributed through Nomura Securities Co., Ltd. (“NSC”), other brokers, banks, Japan Post Bank Co., Ltd. and Japan Post Network Co., Ltd. We also provide investment advisory services for pension funds and other institutional clients. Net revenues generally consist of asset management and portfolio service fees that are attributable to Asset Management.
Millions of yen
Six months ended September 30
2014
2015
Non-interest revenues ¥ 43,219 ¥ 47,272 Net interest revenue 1,810 2,499
Net revenue 45,029 49,771 Non-interest expenses 28,946 29,613
Income before income taxes ¥ 16,083 ¥ 20,158
13
Net revenue increased by 10.5% from ¥45,029 million for the six months ended September 30, 2014 to ¥49,771 million for the six months ended September 30, 2015.
Non-interest expenses increased by 2.3% from ¥28,946 million for the six months ended September 30, 2014 to ¥29,613 million for the six months ended September 30, 2015.
Income before income taxes increased by 25.3% from ¥16,083 million for the six months ended September 30, 2014 to ¥20,158 million for the six months ended September 30, 2015.
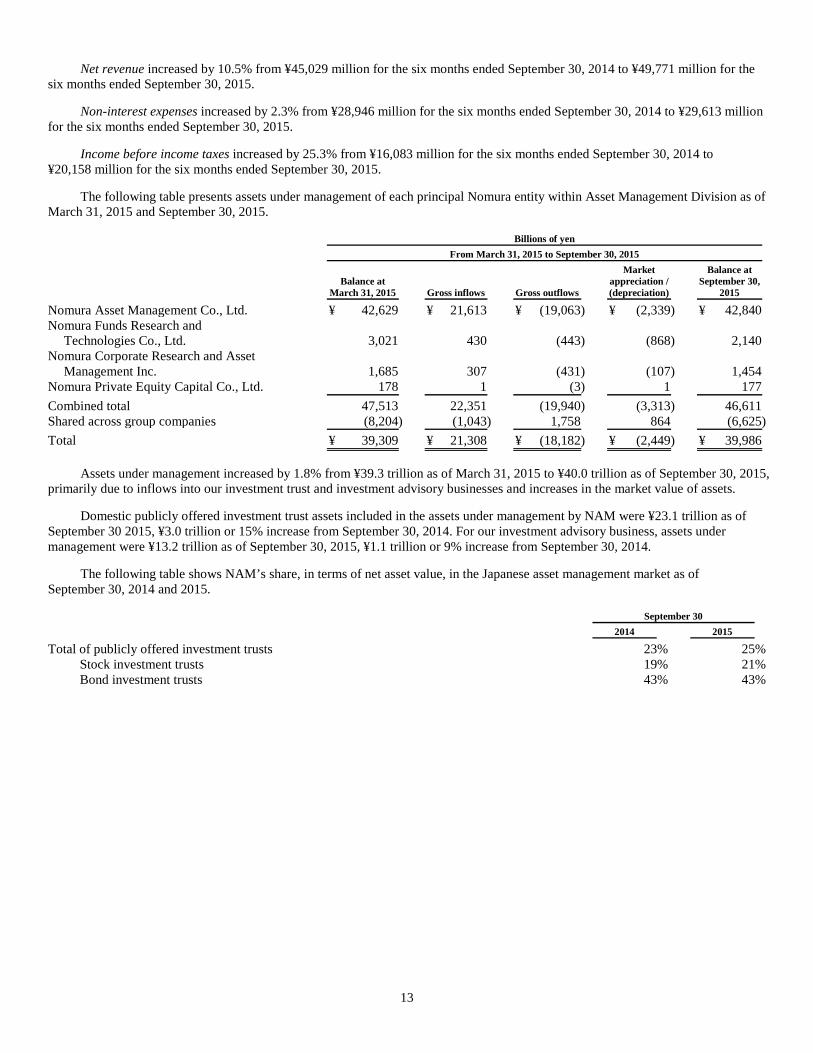
The following table presents assets under management of each principal Nomura entity within Asset Management Division as of March 31, 2015 and September 30, 2015.
Billions of yen
From March 31, 2015 to September 30, 2015
Balance at March 31, 2015
Gross inflows
Gross outflows
Market appreciation / (depreciation)
Balance at September 30,
2015
Nomura Asset Management Co., Ltd. ¥ 42,629 ¥ 21,613 ¥ (19,063) ¥ (2,339) ¥ 42,840 Nomura Funds Research and
Technologies Co., Ltd. 3,021 430 (443) (868) 2,140 Nomura Corporate Research and Asset
Management Inc. 1,685 307 (431) (107) 1,454 Nomura Private Equity Capital Co., Ltd. 178 1 (3) 1 177
Combined total 47,513 22,351 (19,940) (3,313) 46,611 Shared across group companies (8,204) (1,043) 1,758 864 (6,625)
Total ¥ 39,309 ¥ 21,308 ¥ (18,182) ¥ (2,449) ¥ 39,986
Assets under management increased by 1.8% from ¥39.3 trillion as of March 31, 2015 to ¥40.0 trillion as of September 30, 2015, primarily due to inflows into our investment trust and investment advisory businesses and increases in the market value of assets.
Domestic publicly offered investment trust assets included in the assets under management by NAM were ¥23.1 trillion as of September 30 2015, ¥3.0 trillion or 15% increase from September 30, 2014. For our investment advisory business, assets under management were ¥13.2 trillion as of September 30, 2015, ¥1.1 trillion or 9% increase from September 30, 2014.
The following table shows NAM’s share, in terms of net asset value, in the Japanese asset management market as of September 30, 2014 and 2015.
September 30
2014
2015
Total of publicly offered investment trusts 23% 25% Stock investment trusts 19% 21% Bond investment trusts 43% 43%
14
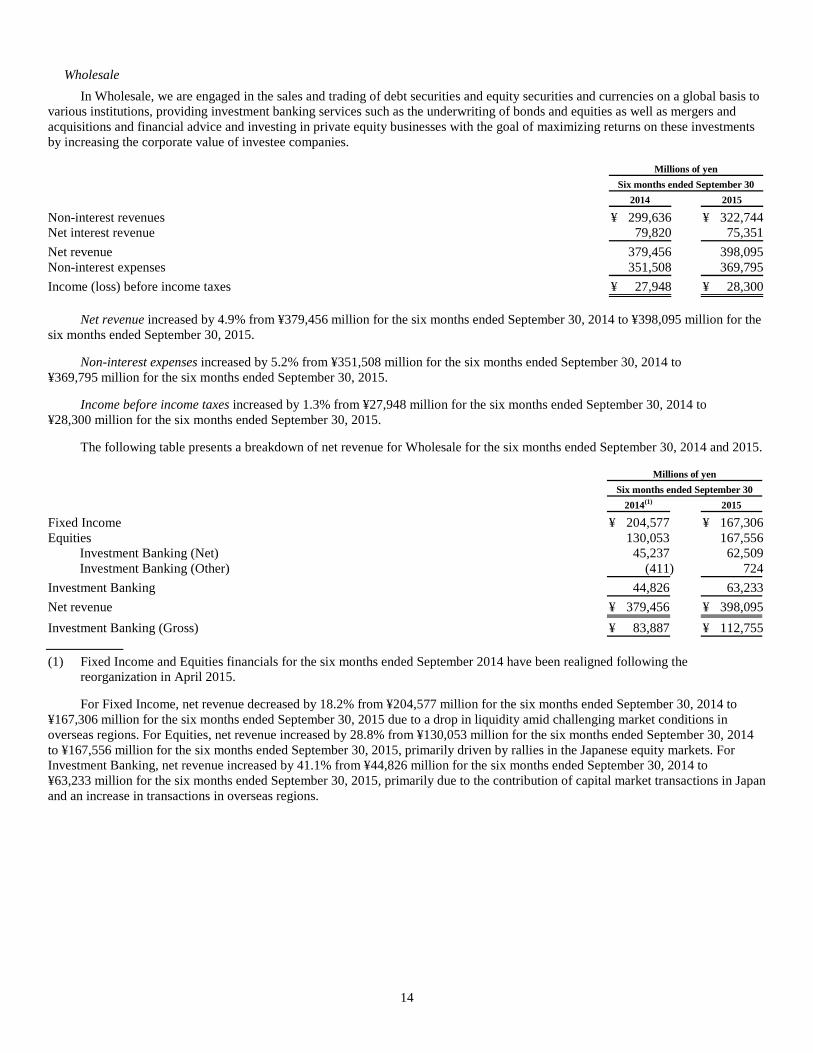
Wholesale In Wholesale, we are engaged in the sales and trading of debt securities and equity securities and currencies on a global basis to
various institutions, providing investment banking services such as the underwriting of bonds and equities as well as mergers and acquisitions and financial advice and investing in private equity businesses with the goal of maximizing returns on these investments by increasing the corporate value of investee companies.
Millions of yen
Six months ended September 30
2014
2015
Non-interest revenues ¥ 299,636 ¥ 322,744 Net interest revenue 79,820 75,351
Net revenue 379,456 398,095 Non-interest expenses 351,508 369,795
Income (loss) before income taxes ¥ 27,948 ¥ 28,300
Net revenue increased by 4.9% from ¥379,456 million for the six months ended September 30, 2014 to ¥398,095 million for the six months ended September 30, 2015.
Non-interest expenses increased by 5.2% from ¥351,508 million for the six months ended September 30, 2014 to ¥369,795 million for the six months ended September 30, 2015.
Income before income taxes increased by 1.3% from ¥27,948 million for the six months ended September 30, 2014 to ¥28,300 million for the six months ended September 30, 2015.
The following table presents a breakdown of net revenue for Wholesale for the six months ended September 30, 2014 and 2015.
Millions of yen
Six months ended September 30
2014(1)
2015
Fixed Income ¥ 204,577 ¥ 167,306 Equities 130,053 167,556
Investment Banking (Net) 45,237 62,509 Investment Banking (Other) (411) 724
Investment Banking 44,826 63,233
Net revenue ¥ 379,456 ¥ 398,095
Investment Banking (Gross) ¥ 83,887 ¥ 112,755
(1) Fixed Income and Equities financials for the six months ended September 2014 have been realigned following the
reorganization in April 2015.
For Fixed Income, net revenue decreased by 18.2% from ¥204,577 million for the six months ended September 30, 2014 to ¥167,306 million for the six months ended September 30, 2015 due to a drop in liquidity amid challenging market conditions in overseas regions. For Equities, net revenue increased by 28.8% from ¥130,053 million for the six months ended September 30, 2014 to ¥167,556 million for the six months ended September 30, 2015, primarily driven by rallies in the Japanese equity markets. For Investment Banking, net revenue increased by 41.1% from ¥44,826 million for the six months ended September 30, 2014 to ¥63,233 million for the six months ended September 30, 2015, primarily due to the contribution of capital market transactions in Japan and an increase in transactions in overseas regions.
15
Other Operating Results Other operating results include net gain (loss) related to economic hedging transactions, realized gain (loss) on investments in
equity securities held for operating purposes, equity in earnings of affiliates, corporate items, and other financial adjustments. See Note 15 “Segment and geographic information” in our interim consolidated financial statements.
Net revenue was ¥89,294 million for the six months ended September 30, 2014 and ¥68,324 million for the six months ended September 30, 2015. Non-interest expenses were ¥84,206 million for the six months ended September 30, 2014 and ¥76,636 million for the six months ended September 30, 2015. Income before income taxes in other operating results was ¥5,088 million for the six months ended September 30, 2014 and loss before income taxes in other operating results was ¥8,312 million for the six months ended September 30, 2015.
Other operating results for the six months ended September 30, 2015 include gains from changes in the fair value of the financial liabilities, for which the fair value option was elected, attributable to the change in our creditworthiness of ¥22.2 billion, the negative impact of our own creditworthiness on derivative liabilities, which resulted in losses of ¥6.6 billion and losses from changes in counterparty credit spreads of ¥8.1 billion.
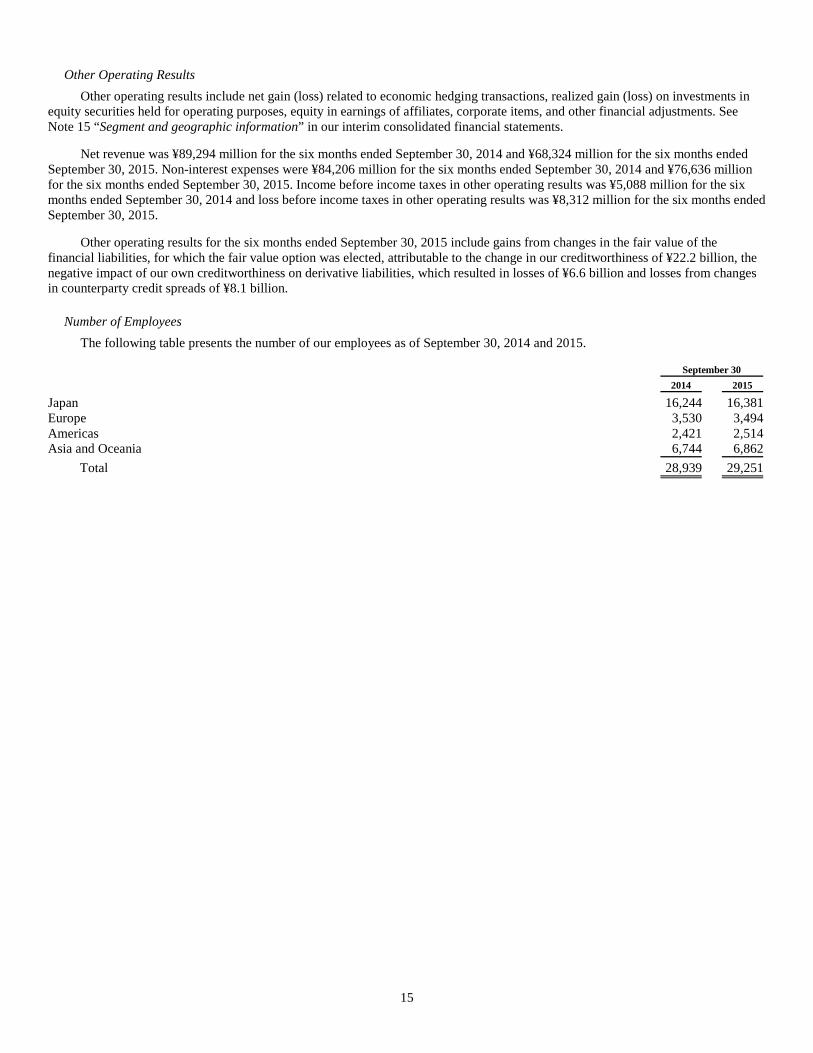
Number of Employees The following table presents the number of our employees as of September 30, 2014 and 2015.
September 30
2014
2015
Japan 16,244 16,381 Europe 3,530 3,494 Americas 2,421 2,514 Asia and Oceania 6,744 6,862
Total 28,939 29,251
16
Summary of Regional Contributions For a summary of our net revenue, income (loss) before income taxes and long-lived assets by geographic region, see Note 15
“Segment and geographic information” in our interim consolidated financial statements.
Regulatory Capital Requirements Many of our business activities are subject to statutory capital requirements, including those of Japan, the U.S., the U.K. and
certain other countries in which we operate.
Translation Exposure A significant portion of our business is conducted in currencies other than Japanese Yen—most significantly, U.S. Dollars,
British Pounds and Euros. We prepare financial statements of each of our consolidated subsidiaries in its functional currency, which is the currency of the primary economic environment in which the entity operates. Translation exposure is the risk arising from the effect of fluctuations in exchange rates on the net assets of our foreign subsidiaries. Translation exposure is not recognized in our consolidated statements of income unless and until we dispose of, or liquidate, the relevant foreign subsidiary.
Critical Accounting Policies and Estimates Use of Estimates
In preparing our interim consolidated financial statements, management makes estimates regarding certain financial instrument and investment valuations, the outcome of litigation and tax examinations, the recovery of the carrying value of goodwill, the allowance for doubtful accounts, the realization of deferred tax assets and other matters that affect the reported amounts of assets and liabilities as well as the disclosures in these interim consolidated financial statements. Estimates, by their nature, are based on judgment and available information. Therefore, actual results may differ from estimates, which could have a material impact on the interim consolidated financial statements, and it is possible that such adjustments could occur in the near term.
17
Fair value for financial instruments A significant amount of our financial instruments are carried at fair value, with changes in fair value recognized through the
consolidated statements of income or the consolidated statements of comprehensive income on a recurring basis. Use of fair value is either specifically required under U.S. GAAP or we make an election to use fair value for certain eligible items under the fair value option.
Other financial assets and financial liabilities are carried at fair value on a nonrecurring basis, where the primary measurement basis is not fair value. Fair value is only used in specific circumstances after initial recognition, such as to measure impairment.
In accordance with Accounting Standard Codification (“ASC”) 820 “Fair Value Measurements and Disclosures”, all financial instruments measured at fair value have been categorized into a three-level hierarchy based on the transparency of valuation inputs used to establish fair value.
Level 1: Unadjusted quoted prices for identical financial instruments in active markets accessible by Nomura at the measurement date. Level 2: Quoted prices in inactive markets or prices containing other inputs which are observable, either directly or indirectly. Valuation
techniques using observable inputs reflect assumptions used by market participants in pricing financial instruments and are based on data obtained from independent market sources at the measurement date.
Level 3: Unobservable inputs that are significant to the fair value measurement of the financial instrument. Valuation techniques using
unobservable inputs reflect management’s assumptions about the estimates used by other market participants in valuing similar financial instruments. These valuation techniques are developed based on the best available information at the measurement date.
The availability of inputs observable in the market varies by product and can be affected by a variety of factors. Significant factors include, but are not restricted to the prevalence of similar products in the market, especially for customized products, how established the product is in the market, for example, whether it is a new product or is relatively mature, and the reliability of information provided in the market which would depend, for example, on the frequency and volume of current data. A period of significant change in the market may reduce the availability of observable data. Under such circumstances, financial instruments may be reclassified into a lower level in the fair value hierarchy.
Significant judgments used in determining the classification of financial instruments include the nature of the market in which the product would be traded, the underlying risks, the type and liquidity of market data inputs and the nature of observed transactions for similar instruments.
Where valuation models include the use of parameters which are less observable or unobservable in the market, significant management judgment is used in establishing fair value. The valuations for Level 3 financial instruments, therefore, involve a greater degree of judgment than those valuations for Level 1 or Level 2 financial instruments.
Certain criteria management use to determine whether a market is active or inactive include the number of transactions, the frequency that pricing is updated by other market participants, the variability of price quotes among market participants, and the amount of publicly available information.
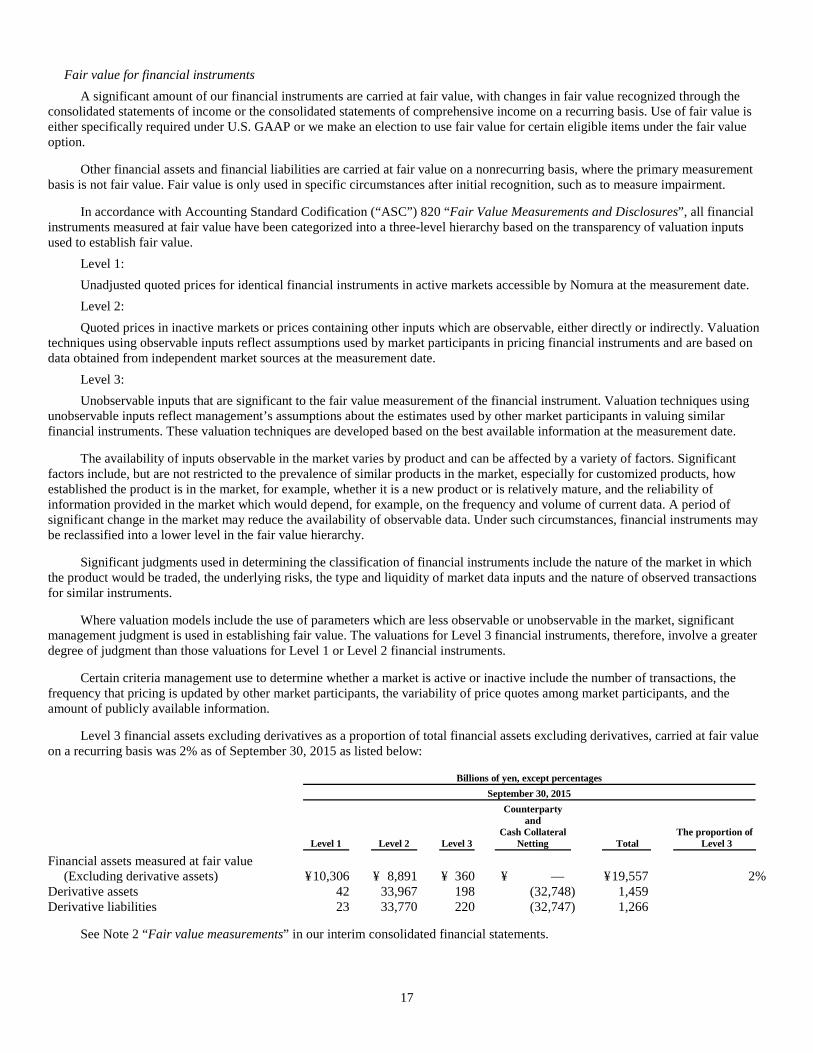
Level 3 financial assets excluding derivatives as a proportion of total financial assets excluding derivatives, carried at fair value on a recurring basis was 2% as of September 30, 2015 as listed below:
Billions of yen, except percentages
September 30, 2015
Level 1
Level 2
Level 3
Counterparty and
Cash Collateral Netting
Total
The proportion of Level 3
Financial assets measured at fair value (Excluding derivative assets) ¥ 10,306 ¥ 8,891 ¥ 360 ¥ — ¥ 19,557 2%
Derivative assets 42 33,967 198 (32,748) 1,459
Derivative liabilities 23 33,770 220 (32,747) 1,266
See Note 2 “Fair value measurements” in our interim consolidated financial statements.
18
Assets and Liabilities Associated with Investment and Financial Services Business Exposure to Certain Financial Instruments and Counterparties
Market conditions impact numerous products to which we have certain exposures. We also have exposures to Special Purpose Entities (“SPEs”) and others in the normal course of business.
Leveraged Finance We provide loans to clients in connection with leveraged buy-outs and leveraged buy-ins. As this type of finance is usually
initially provided through a commitment, we have both funded and unfunded exposures on these transactions.
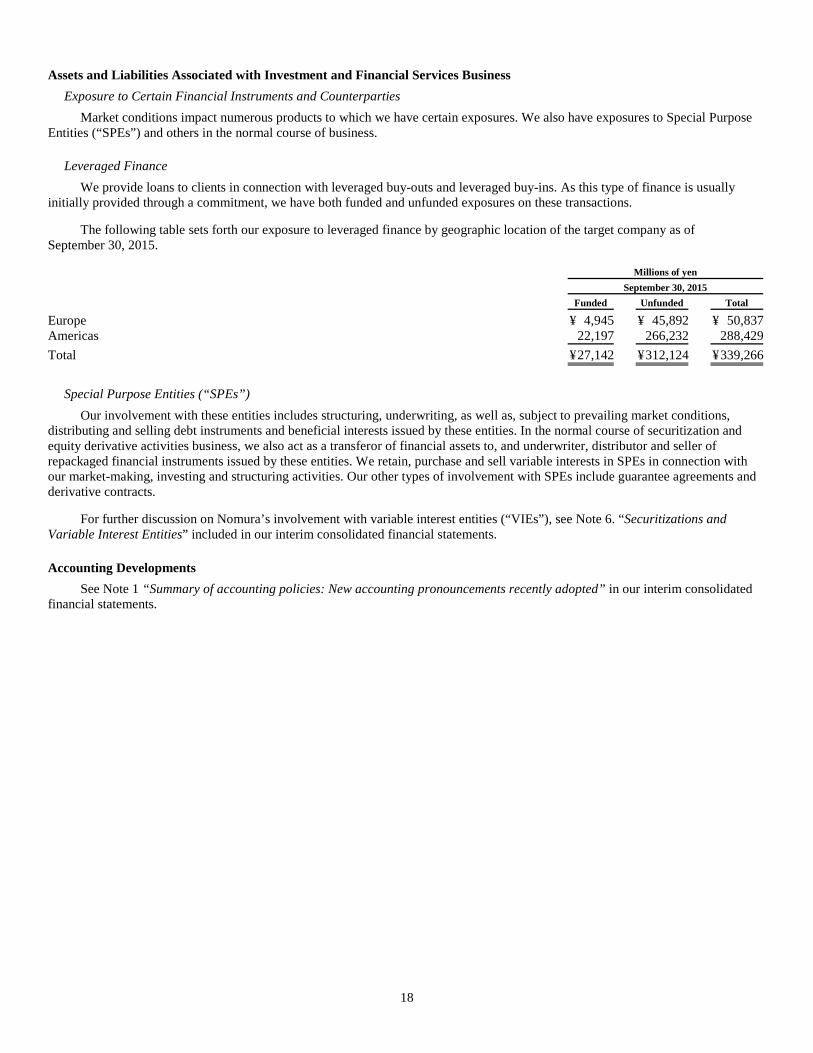
The following table sets forth our exposure to leveraged finance by geographic location of the target company as of September 30, 2015.
Millions of yen
September 30, 2015
Funded
Unfunded
Total
Europe ¥ 4,945 ¥ 45,892 ¥ 50,837 Americas 22,197 266,232 288,429
Total ¥ 27,142 ¥ 312,124 ¥ 339,266
Special Purpose Entities (“SPEs”) Our involvement with these entities includes structuring, underwriting, as well as, subject to prevailing market conditions,
distributing and selling debt instruments and beneficial interests issued by these entities. In the normal course of securitization and equity derivative activities business, we also act as a transferor of financial assets to, and underwriter, distributor and seller of repackaged financial instruments issued by these entities. We retain, purchase and sell variable interests in SPEs in connection with our market-making, investing and structuring activities. Our other types of involvement with SPEs include guarantee agreements and derivative contracts.
For further discussion on Nomura’s involvement with variable interest entities (“VIEs”), see Note 6. “Securitizations and Variable Interest Entities” included in our interim consolidated financial statements.
Accounting Developments See Note 1 “Summary of accounting policies: New accounting pronouncements recently adopted” in our interim consolidated
financial statements.
19
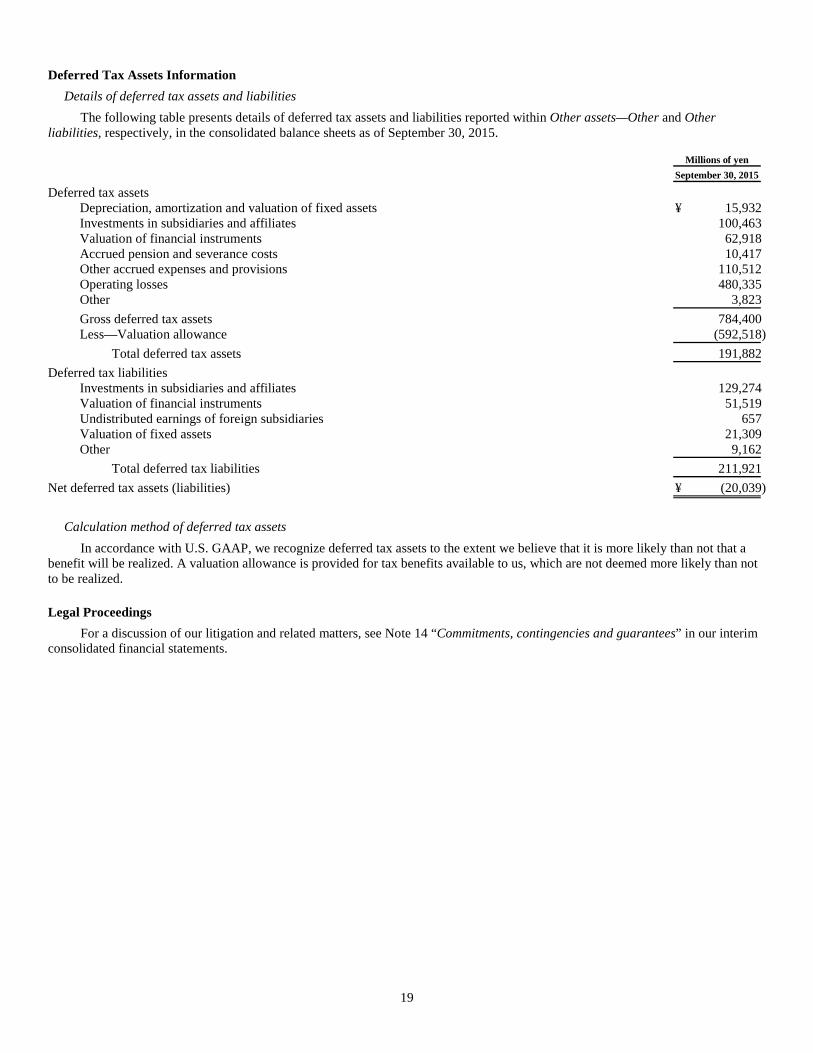
Deferred Tax Assets Information Details of deferred tax assets and liabilities
The following table presents details of deferred tax assets and liabilities reported within Other assets—Other and Other liabilities, respectively, in the consolidated balance sheets as of September 30, 2015.
Millions of yen
September 30, 2015
Deferred tax assets
Depreciation, amortization and valuation of fixed assets ¥ 15,932 Investments in subsidiaries and affiliates 100,463 Valuation of financial instruments 62,918 Accrued pension and severance costs 10,417 Other accrued expenses and provisions 110,512 Operating losses 480,335 Other 3,823
Gross deferred tax assets 784,400 Less—Valuation allowance (592,518)
Total deferred tax assets 191,882
Deferred tax liabilities
Investments in subsidiaries and affiliates 129,274 Valuation of financial instruments 51,519 Undistributed earnings of foreign subsidiaries 657 Valuation of fixed assets 21,309 Other 9,162
Total deferred tax liabilities 211,921
Net deferred tax assets (liabilities) ¥ (20,039)
Calculation method of deferred tax assets In accordance with U.S. GAAP, we recognize deferred tax assets to the extent we believe that it is more likely than not that a
benefit will be realized. A valuation allowance is provided for tax benefits available to us, which are not deemed more likely than not to be realized.
Legal Proceedings For a discussion of our litigation and related matters, see Note 14 “Commitments, contingencies and guarantees” in our interim
consolidated financial statements.
20
Liquidity and Capital Resources Funding and Liquidity Management Overview
We define liquidity risk as the risk of losses arising from difficulty in securing necessary funding or from a significantly higher cost of funding than normal levels due to deterioration of the Nomura Group’s creditworthiness or deterioration in market conditions. This risk could arise from Nomura-specific or market-wide events such as inability to access the secured or unsecured debt markets, a deterioration in our credit ratings, a failure to manage unplanned changes in funding requirements, a failure to liquidate assets quickly and with minimal loss in value, or changes in regulatory capital restrictions which may prevent the free flow of funds between different group entities. Our global liquidity risk management policy is based on liquidity risk appetite formulated by the Executive Management Board (“EMB”). Nomura’s liquidity risk management, under market-wide stress and in addition, under Nomura-specific stress, seeks to ensure enough continuous liquidity to meet all funding requirements and unsecured debt obligations across one year and one month periods, respectively, without raising funds through unsecured funding or through the liquidation of assets. We are required to meet regulatory notice on the liquidity coverage ratio issued by the FSA.
We have in place a number of liquidity risk management frameworks that enable us to achieve our primary liquidity objective. These frameworks include (1) Centralized Control of Residual Cash and Maintenance of Liquidity Portfolio; (2) Utilization of Unencumbered Assets as Part of Our Liquidity Portfolio; (3) Appropriate Funding and Diversification of Funding Sources and Maturities Commensurate with the Composition of Assets; (4) Management of Credit Lines to Nomura Group Entities; (5) Implementation of Liquidity Stress Tests; and (6) Contingency Funding Plan.
Our EMB has the authority to make decisions concerning group liquidity management. The Chief Financial Officer (“CFO”) has the operational authority and responsibility over our liquidity management based on decisions made by the EMB.
1. Centralized Control of Residual Cash and Maintenance of Liquidity Portfolio. We centrally control residual cash held at Nomura Group entities for effective liquidity utilization purposes. As for the usage of
funds, the CFO decides the maximum amount of available funds, provided without posting any collateral, for allocation within Nomura and the EMB allocates the funds to each business division. Global Treasury monitors usage by businesses and reports to the EMB.
In order to enable us to transfer funds smoothly between group entities, we limit the issuance of securities by regulated broker-dealers or banking entities within the Nomura Group and seek to raise unsecured funding primarily through the Company or through unregulated subsidiaries. The primary benefits of this strategy include cost minimization, wider investor name recognition and greater flexibility in providing funding to various subsidiaries across the Nomura Group.
To meet any potential liquidity requirement, we maintain a liquidity portfolio in the form of cash and highly liquid, unencumbered securities that may be sold or pledged to provide liquidity. As of September 30, 2015, our liquidity portfolio was ¥6,185.1 billion which generated a liquidity surplus taking into account stress scenarios.
21
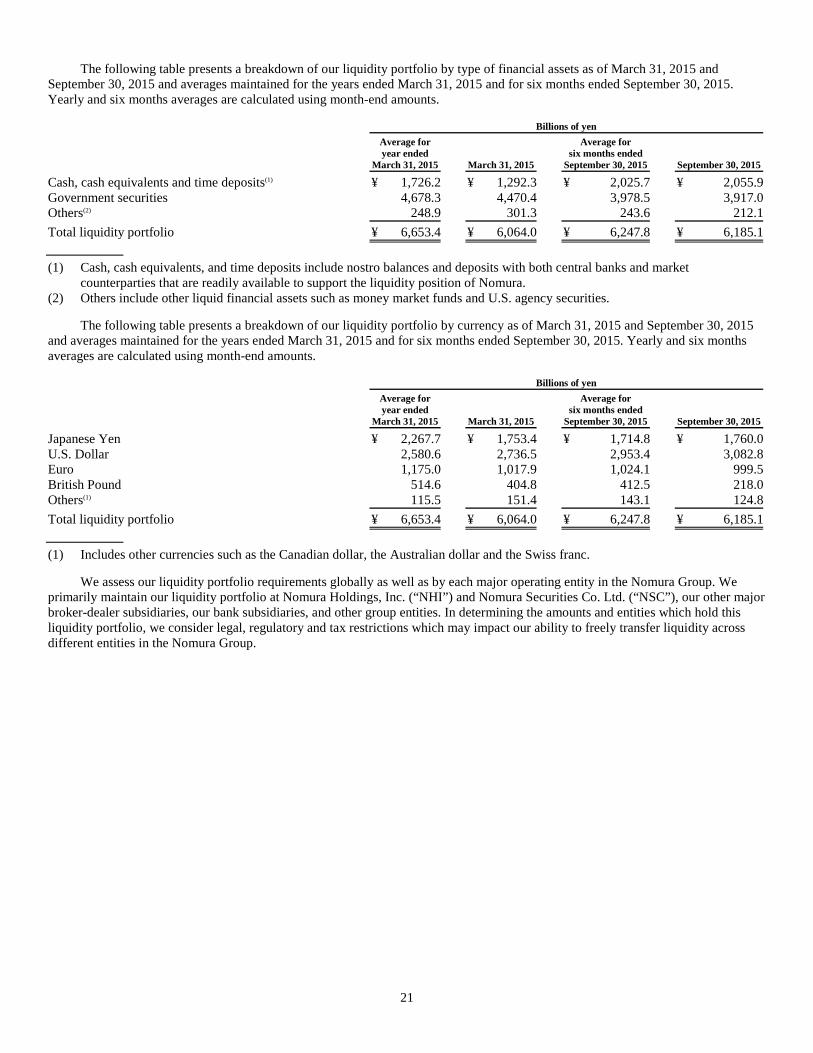
The following table presents a breakdown of our liquidity portfolio by type of financial assets as of March 31, 2015 and September 30, 2015 and averages maintained for the years ended March 31, 2015 and for six months ended September 30, 2015. Yearly and six months averages are calculated using month-end amounts.
Billions of yen
Average for year ended
March 31, 2015
March 31, 2015
Average for six months ended
September 30, 2015
September 30, 2015
Cash, cash equivalents and time deposits(1) ¥ 1,726.2 ¥ 1,292.3 ¥ 2,025.7 ¥ 2,055.9 Government securities 4,678.3 4,470.4 3,978.5 3,917.0 Others(2) 248.9 301.3 243.6 212.1
Total liquidity portfolio ¥ 6,653.4 ¥ 6,064.0 ¥ 6,247.8 ¥ 6,185.1
(1) Cash, cash equivalents, and time deposits include nostro balances and deposits with both central banks and market
counterparties that are readily available to support the liquidity position of Nomura. (2) Others include other liquid financial assets such as money market funds and U.S. agency securities.
The following table presents a breakdown of our liquidity portfolio by currency as of March 31, 2015 and September 30, 2015 and averages maintained for the years ended March 31, 2015 and for six months ended September 30, 2015. Yearly and six months averages are calculated using month-end amounts.
Billions of yen
Average for year ended
March 31, 2015
March 31, 2015
Average for six months ended
September 30, 2015
September 30, 2015
Japanese Yen ¥ 2,267.7 ¥ 1,753.4 ¥ 1,714.8 ¥ 1,760.0 U.S. Dollar 2,580.6 2,736.5 2,953.4 3,082.8 Euro 1,175.0 1,017.9 1,024.1 999.5 British Pound 514.6 404.8 412.5 218.0 Others(1) 115.5 151.4 143.1 124.8
Total liquidity portfolio ¥ 6,653.4 ¥ 6,064.0 ¥ 6,247.8 ¥ 6,185.1
(1) Includes other currencies such as the Canadian dollar, the Australian dollar and the Swiss franc.
We assess our liquidity portfolio requirements globally as well as by each major operating entity in the Nomura Group. We primarily maintain our liquidity portfolio at Nomura Holdings, Inc. (“NHI”) and Nomura Securities Co. Ltd. (“NSC”), our other major broker-dealer subsidiaries, our bank subsidiaries, and other group entities. In determining the amounts and entities which hold this liquidity portfolio, we consider legal, regulatory and tax restrictions which may impact our ability to freely transfer liquidity across different entities in the Nomura Group.
22
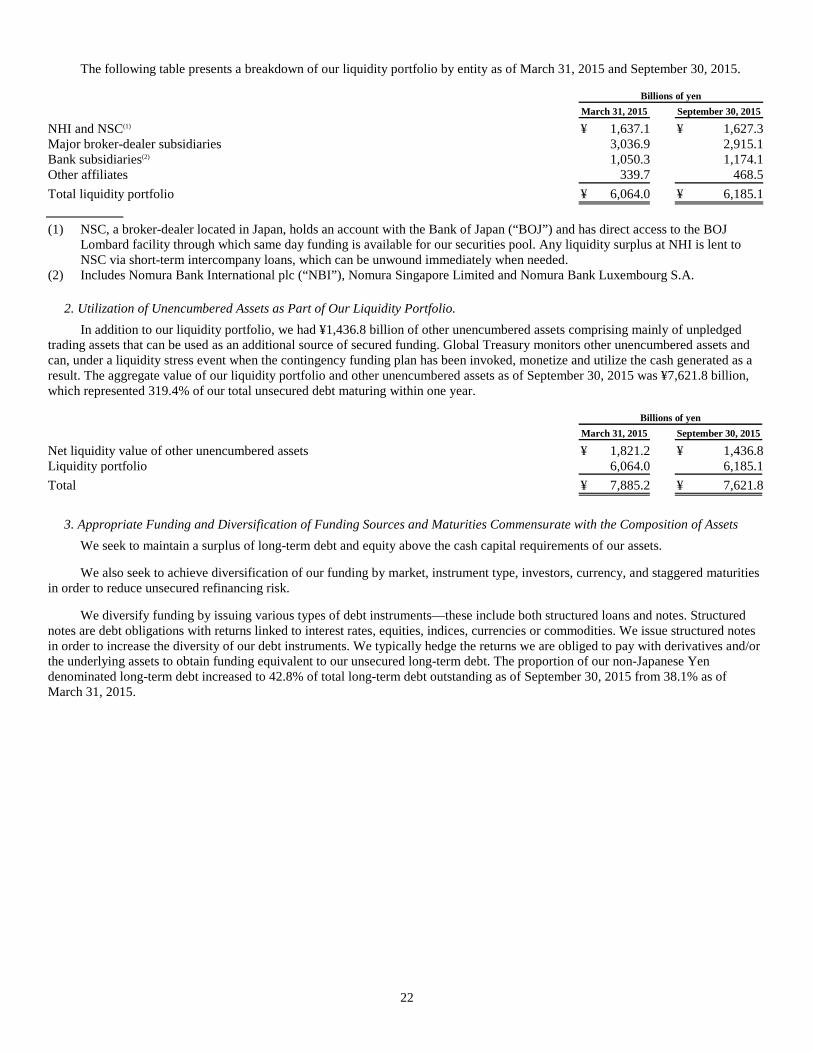
The following table presents a breakdown of our liquidity portfolio by entity as of March 31, 2015 and September 30, 2015.
Billions of yen
March 31, 2015
September 30, 2015
NHI and NSC(1) ¥ 1,637.1 ¥ 1,627.3 Major broker-dealer subsidiaries 3,036.9 2,915.1 Bank subsidiaries(2) 1,050.3 1,174.1 Other affiliates 339.7 468.5
Total liquidity portfolio ¥ 6,064.0 ¥ 6,185.1
(1) NSC, a broker-dealer located in Japan, holds an account with the Bank of Japan (“BOJ”) and has direct access to the BOJ
Lombard facility through which same day funding is available for our securities pool. Any liquidity surplus at NHI is lent to NSC via short-term intercompany loans, which can be unwound immediately when needed.
(2) Includes Nomura Bank International plc (“NBI”), Nomura Singapore Limited and Nomura Bank Luxembourg S.A.
2. Utilization of Unencumbered Assets as Part of Our Liquidity Portfolio. In addition to our liquidity portfolio, we had ¥1,436.8 billion of other unencumbered assets comprising mainly of unpledged
trading assets that can be used as an additional source of secured funding. Global Treasury monitors other unencumbered assets and can, under a liquidity stress event when the contingency funding plan has been invoked, monetize and utilize the cash generated as a result. The aggregate value of our liquidity portfolio and other unencumbered assets as of September 30, 2015 was ¥7,621.8 billion, which represented 319.4% of our total unsecured debt maturing within one year.
Billions of yen
March 31, 2015
September 30, 2015
Net liquidity value of other unencumbered assets ¥ 1,821.2 ¥ 1,436.8 Liquidity portfolio 6,064.0 6,185.1
Total ¥ 7,885.2 ¥ 7,621.8
3. Appropriate Funding and Diversification of Funding Sources and Maturities Commensurate with the Composition of Assets We seek to maintain a surplus of long-term debt and equity above the cash capital requirements of our assets.
We also seek to achieve diversification of our funding by market, instrument type, investors, currency, and staggered maturities in order to reduce unsecured refinancing risk.
We diversify funding by issuing various types of debt instruments—these include both structured loans and notes. Structured notes are debt obligations with returns linked to interest rates, equities, indices, currencies or commodities. We issue structured notes in order to increase the diversity of our debt instruments. We typically hedge the returns we are obliged to pay with derivatives and/or the underlying assets to obtain funding equivalent to our unsecured long-term debt. The proportion of our non-Japanese Yen denominated long-term debt increased to 42.8% of total long-term debt outstanding as of September 30, 2015 from 38.1% as of March 31, 2015.
23
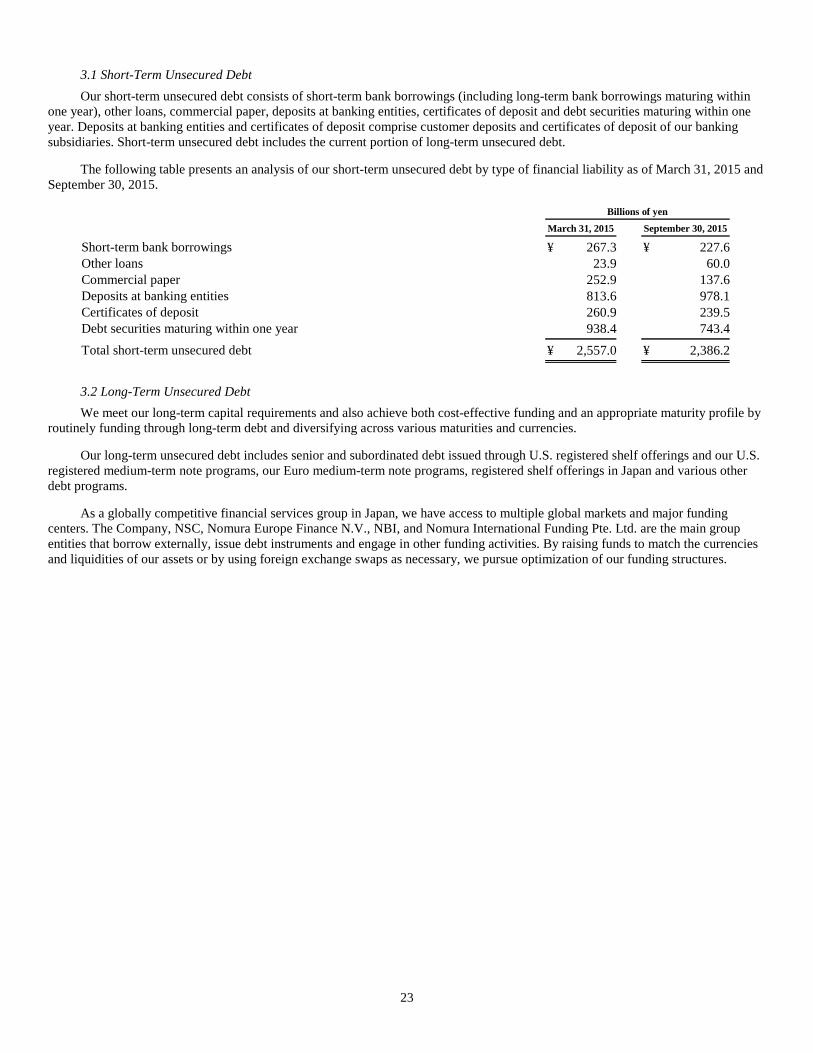
3.1 Short-Term Unsecured Debt Our short-term unsecured debt consists of short-term bank borrowings (including long-term bank borrowings maturing within
one year), other loans, commercial paper, deposits at banking entities, certificates of deposit and debt securities maturing within one year. Deposits at banking entities and certificates of deposit comprise customer deposits and certificates of deposit of our banking subsidiaries. Short-term unsecured debt includes the current portion of long-term unsecured debt.
The following table presents an analysis of our short-term unsecured debt by type of financial liability as of March 31, 2015 and September 30, 2015.
Billions of yen
March 31, 2015
September 30, 2015
Short-term bank borrowings ¥ 267.3 ¥ 227.6 Other loans 23.9 60.0 Commercial paper 252.9 137.6 Deposits at banking entities 813.6 978.1 Certificates of deposit 260.9 239.5 Debt securities maturing within one year 938.4 743.4
Total short-term unsecured debt ¥ 2,557.0 ¥ 2,386.2
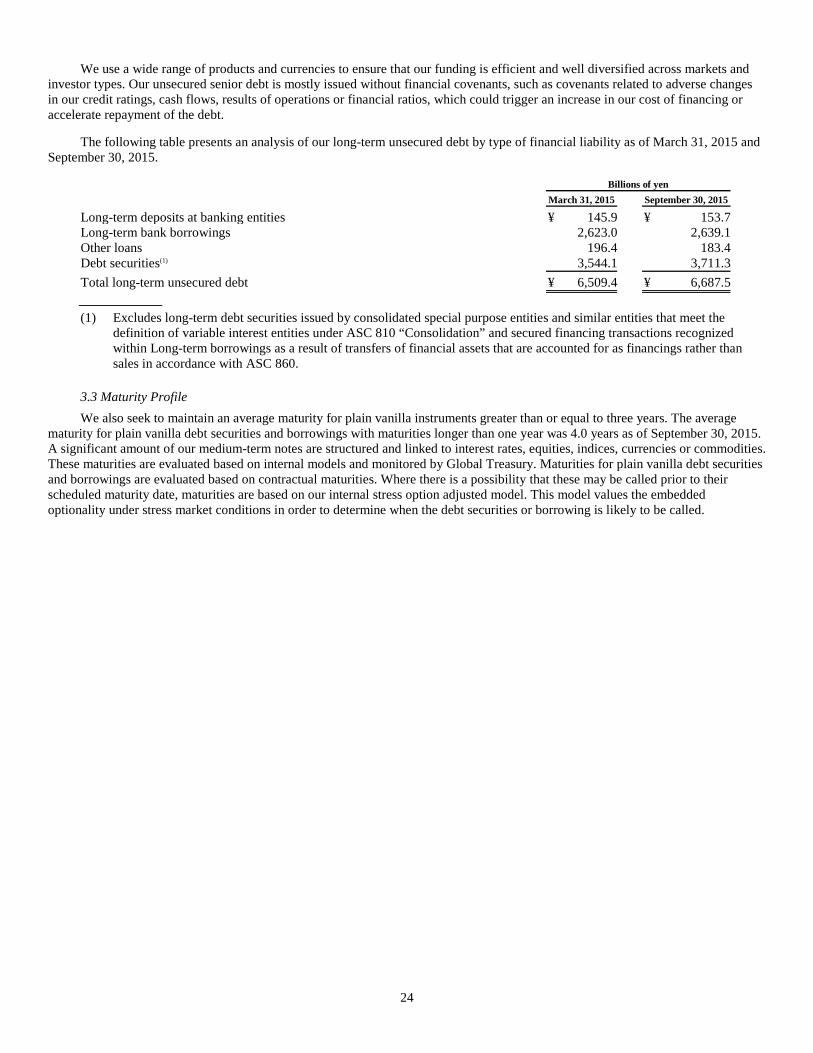
3.2 Long-Term Unsecured Debt We meet our long-term capital requirements and also achieve both cost-effective funding and an appropriate maturity profile by
routinely funding through long-term debt and diversifying across various maturities and currencies.
Our long-term unsecured debt includes senior and subordinated debt issued through U.S. registered shelf offerings and our U.S. registered medium-term note programs, our Euro medium-term note programs, registered shelf offerings in Japan and various other debt programs.
As a globally competitive financial services group in Japan, we have access to multiple global markets and major funding centers. The Company, NSC, Nomura Europe Finance N.V., NBI, and Nomura International Funding Pte. Ltd. are the main group entities that borrow externally, issue debt instruments and engage in other funding activities. By raising funds to match the currencies and liquidities of our assets or by using foreign exchange swaps as necessary, we pursue optimization of our funding structures.
24
We use a wide range of products and currencies to ensure that our funding is efficient and well diversified across markets and investor types. Our unsecured senior debt is mostly issued without financial covenants, such as covenants related to adverse changes in our credit ratings, cash flows, results of operations or financial ratios, which could trigger an increase in our cost of financing or accelerate repayment of the debt.
The following table presents an analysis of our long-term unsecured debt by type of financial liability as of March 31, 2015 and September 30, 2015.
Billions of yen
March 31, 2015
September 30, 2015
Long-term deposits at banking entities ¥ 145.9 ¥ 153.7 Long-term bank borrowings 2,623.0 2,639.1 Other loans 196.4 183.4 Debt securities(1) 3,544.1 3,711.3
Total long-term unsecured debt ¥ 6,509.4 ¥ 6,687.5
(1) Excludes long-term debt securities issued by consolidated special purpose entities and similar entities that meet the definition of variable interest entities under ASC 810 “Consolidation” and secured financing transactions recognized within Long-term borrowings as a result of transfers of financial assets that are accounted for as financings rather than sales in accordance with ASC 860.
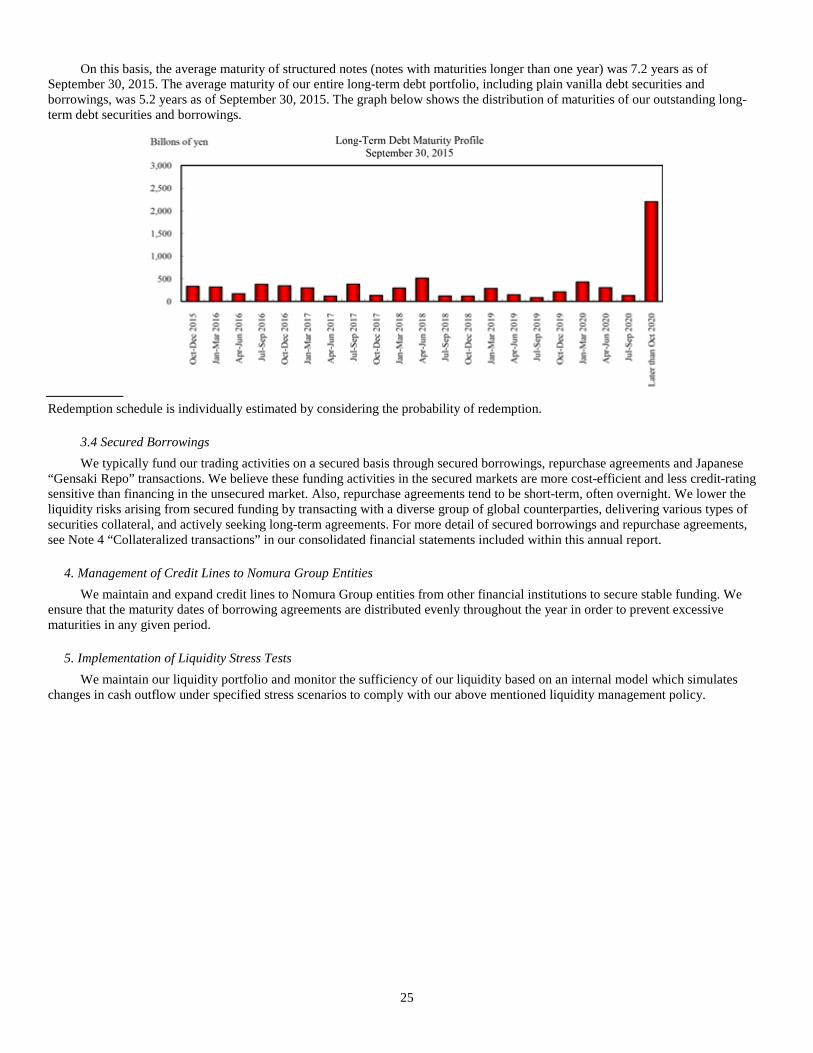
3.3 Maturity Profile We also seek to maintain an average maturity for plain vanilla instruments greater than or equal to three years. The average
maturity for plain vanilla debt securities and borrowings with maturities longer than one year was 4.0 years as of September 30, 2015. A significant amount of our medium-term notes are structured and linked to interest rates, equities, indices, currencies or commodities. These maturities are evaluated based on internal models and monitored by Global Treasury. Maturities for plain vanilla debt securities and borrowings are evaluated based on contractual maturities. Where there is a possibility that these may be called prior to their scheduled maturity date, maturities are based on our internal stress option adjusted model. This model values the embedded optionality under stress market conditions in order to determine when the debt securities or borrowing is likely to be called.
25
On this basis, the average maturity of structured notes (notes with maturities longer than one year) was 7.2 years as of September 30, 2015. The average maturity of our entire long-term debt portfolio, including plain vanilla debt securities and borrowings, was 5.2 years as of September 30, 2015. The graph below shows the distribution of maturities of our outstanding long-term debt securities and borrowings.
Redemption schedule is individually estimated by considering the probability of redemption.
3.4 Secured Borrowings We typically fund our trading activities on a secured basis through secured borrowings, repurchase agreements and Japanese
“Gensaki Repo” transactions. We believe these funding activities in the secured markets are more cost-efficient and less credit-rating sensitive than financing in the unsecured market. Also, repurchase agreements tend to be short-term, often overnight. We lower the liquidity risks arising from secured funding by transacting with a diverse group of global counterparties, delivering various types of securities collateral, and actively seeking long-term agreements. For more detail of secured borrowings and repurchase agreements, see Note 4 “Collateralized transactions” in our consolidated financial statements included within this annual report.
4. Management of Credit Lines to Nomura Group Entities We maintain and expand credit lines to Nomura Group entities from other financial institutions to secure stable funding. We
ensure that the maturity dates of borrowing agreements are distributed evenly throughout the year in order to prevent excessive maturities in any given period.
5. Implementation of Liquidity Stress Tests We maintain our liquidity portfolio and monitor the sufficiency of our liquidity based on an internal model which simulates
changes in cash outflow under specified stress scenarios to comply with our above mentioned liquidity management policy.

26
We assess the liquidity requirements of the Nomura Group under various stress scenarios with differing levels of severity over multiple time horizons. We evaluate these requirements under Nomura-specific and broad market-wide events, including potential credit rating downgrades at the Company and subsidiary levels that may impact us by loss of access to unsecured capital markets, additional collateral posting requirements, limited or no access to secured funding markets and other events. We call this risk analysis our Maximum Cumulative Outflow (“MCO”) framework.
The MCO framework is designed to incorporate the primary liquidity risks for Nomura and models the relevant cash flows in the following two primary scenarios:
• Stressed scenario—To maintain adequate liquidity during a severe market-wide liquidity event without raising funds through unsecured financing or through the liquidation of assets for a year; and
• Acute stress scenario—To maintain adequate liquidity during a severe market-wide liquidity event coupled with credit concerns regarding Nomura’s liquidity position, without raising funds through unsecured funding or through the liquidation of assets for one month.
We assume that Nomura will not be able to liquidate assets or adjust its business model during the time horizons used in each of these scenarios. The MCO framework therefore defines the amount of liquidity required to be held in order to meet our expected liquidity needs in a stress event to a level we believe appropriate based on our liquidity risk appetite.
As of September 30, 2015, our liquidity portfolio exceeded net cash outflows under the stress scenarios described above.
We constantly evaluate and modify our liquidity risk assumptions based on regulatory and market changes. The model we use in order to simulate the impact of stress scenarios includes the following assumptions:
• No liquidation of assets; • No ability to issue additional unsecured funding; • Upcoming maturities of unsecured debt (maturities less than one year); • Potential buybacks of our outstanding debt; • Loss of secured funding lines particularly for less liquid assets, over and above our cash capital estimates; • Fluctuation of funding needs under normal business circumstances; • Cash and collateral outflows in a stress event; • Widening of haircuts on outstanding repo funding; • Additional collateralization requirements of clearing banks and depositories; • Drawdown on loan commitments; • Loss of liquidity from market losses; • Assuming a two-notch downgrade of our credit ratings, the aggregate fair value of assets that we would be required to
post as additional collateral in connection with our derivative contracts; and • Legal and regulatory requirements that can restrict the flow of funds between entities in the Nomura Group.
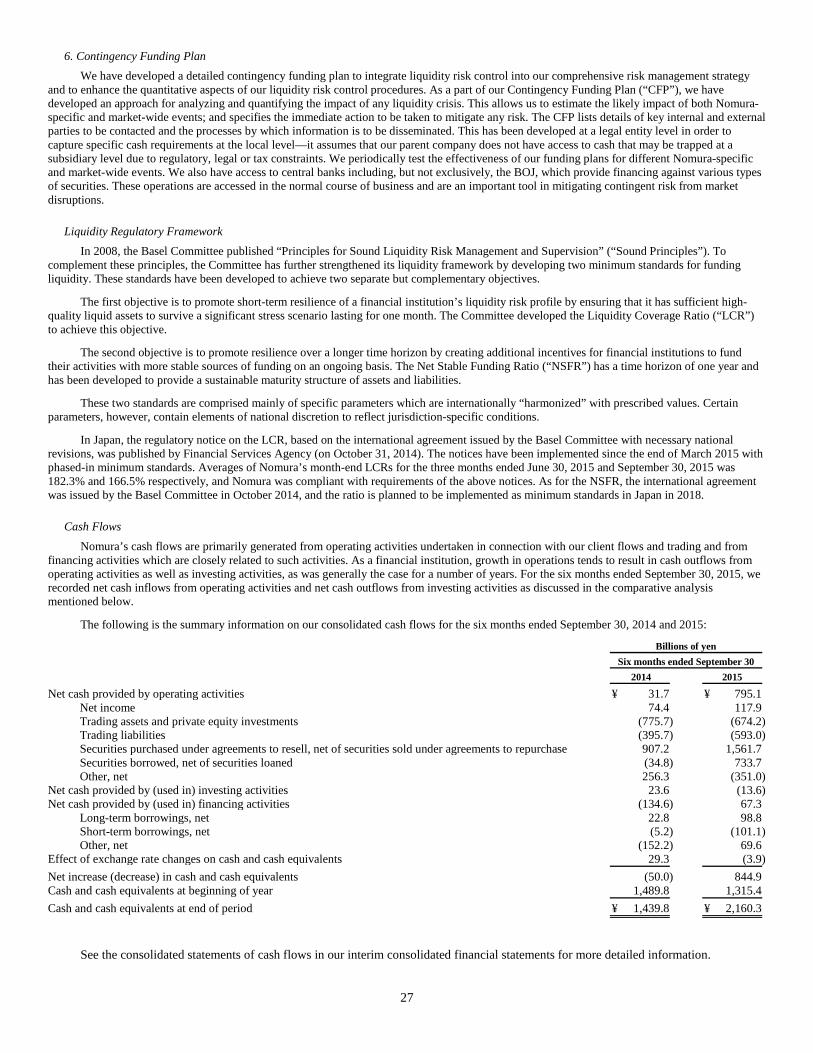
27
6. Contingency Funding Plan We have developed a detailed contingency funding plan to integrate liquidity risk control into our comprehensive risk management strategy
and to enhance the quantitative aspects of our liquidity risk control procedures. As a part of our Contingency Funding Plan (“CFP”), we have developed an approach for analyzing and quantifying the impact of any liquidity crisis. This allows us to estimate the likely impact of both Nomura-specific and market-wide events; and specifies the immediate action to be taken to mitigate any risk. The CFP lists details of key internal and external parties to be contacted and the processes by which information is to be disseminated. This has been developed at a legal entity level in order to capture specific cash requirements at the local level—it assumes that our parent company does not have access to cash that may be trapped at a subsidiary level due to regulatory, legal or tax constraints. We periodically test the effectiveness of our funding plans for different Nomura-specific and market-wide events. We also have access to central banks including, but not exclusively, the BOJ, which provide financing against various types of securities. These operations are accessed in the normal course of business and are an important tool in mitigating contingent risk from market disruptions.
Liquidity Regulatory Framework In 2008, the Basel Committee published “Principles for Sound Liquidity Risk Management and Supervision” (“Sound Principles”). To
complement these principles, the Committee has further strengthened its liquidity framework by developing two minimum standards for funding liquidity. These standards have been developed to achieve two separate but complementary objectives.
The first objective is to promote short-term resilience of a financial institution’s liquidity risk profile by ensuring that it has sufficient high-quality liquid assets to survive a significant stress scenario lasting for one month. The Committee developed the Liquidity Coverage Ratio (“LCR”) to achieve this objective.
The second objective is to promote resilience over a longer time horizon by creating additional incentives for financial institutions to fund their activities with more stable sources of funding on an ongoing basis. The Net Stable Funding Ratio (“NSFR”) has a time horizon of one year and has been developed to provide a sustainable maturity structure of assets and liabilities.
These two standards are comprised mainly of specific parameters which are internationally “harmonized” with prescribed values. Certain parameters, however, contain elements of national discretion to reflect jurisdiction-specific conditions.
In Japan, the regulatory notice on the LCR, based on the international agreement issued by the Basel Committee with necessary national revisions, was published by Financial Services Agency (on October 31, 2014). The notices have been implemented since the end of March 2015 with phased-in minimum standards. Averages of Nomura’s month-end LCRs for the three months ended June 30, 2015 and September 30, 2015 was 182.3% and 166.5% respectively, and Nomura was compliant with requirements of the above notices. As for the NSFR, the international agreement was issued by the Basel Committee in October 2014, and the ratio is planned to be implemented as minimum standards in Japan in 2018.
Cash Flows Nomura’s cash flows are primarily generated from operating activities undertaken in connection with our client flows and trading and from
financing activities which are closely related to such activities. As a financial institution, growth in operations tends to result in cash outflows from operating activities as well as investing activities, as was generally the case for a number of years. For the six months ended September 30, 2015, we recorded net cash inflows from operating activities and net cash outflows from investing activities as discussed in the comparative analysis mentioned below.
The following is the summary information on our consolidated cash flows for the six months ended September 30, 2014 and 2015:
Billions of yen
Six months ended September 30
2014
2015
Net cash provided by operating activities ¥ 31.7 ¥ 795.1 Net income 74.4 117.9 Trading assets and private equity investments (775.7) (674.2) Trading liabilities (395.7) (593.0) Securities purchased under agreements to resell, net of securities sold under agreements to repurchase 907.2 1,561.7 Securities borrowed, net of securities loaned (34.8) 733.7 Other, net 256.3 (351.0)
Net cash provided by (used in) investing activities 23.6 (13.6) Net cash provided by (used in) financing activities (134.6) 67.3
Long-term borrowings, net 22.8 98.8 Short-term borrowings, net (5.2) (101.1) Other, net (152.2) 69.6
Effect of exchange rate changes on cash and cash equivalents 29.3 (3.9) Net increase (decrease) in cash and cash equivalents (50.0) 844.9 Cash and cash equivalents at beginning of year 1,489.8 1,315.4 Cash and cash equivalents at end of period ¥ 1,439.8 ¥ 2,160.3
See the consolidated statements of cash flows in our interim consolidated financial statements for more detailed information.
28
For the six months ended September 30, 2015, our cash and cash equivalents increased by ¥844.9 billion to ¥2,160.3 billion. Net cash of ¥67.3 billion was provided by financing activities due to cash inflows of ¥1,162.9 billion by increase in long-term borrowings, which is included in Long-term borrowings, net. As part of trading activities, while there were net cash outflows of ¥674.2 billion due to an increase in Trading assets and Private equity investments, these cash outflows were offset by net cash inflows of ¥1,561.7 billion from cash inflow due to an increase in Securities purchased under agreements to resell, net of securities sold under agreements to repurchase. As a result, net cash of ¥795.1 billion was provided by operating activities.
For the six months ended September 30, 2014, our cash and cash equivalents decreased by ¥50.0 billion to ¥1,439.8 billion. Net cash of ¥134.6 billion was used in financing activities due to cash outflows of ¥1,188.5 billion by decrease in long-term borrowings, which is included in Long-term borrowings, net. As part of trading activities, while there were net cash outflows of ¥775.7 billion due to an increase in Trading assets and private equity investments, these cash outflows were offset by net cash inflows of ¥907.2 billion from cash inflow due to an increase in Securities purchased under agreements to resell, net of securities sold under agreements to repurchase. As a result, net cash of ¥31.7 billion was provided by operating activities.
Balance Sheet and Financial Leverage Total assets as of September 30, 2015, were ¥43,960.3 billion, an increase of ¥2,177.1 billion compared with ¥41,783.2 billion
as of March 31, 2015, reflecting increases such as in Securities purchased under agreements to resell. Total liabilities as of September 30, 2015, were ¥41,165.4 billion, an increase of ¥2,127.1 billion compared with ¥39,038.3 billion as of March 31, 2015, reflecting increases such as in Securities sold under agreements to repurchase. NHI shareholders’ equity as of September 30, 2015, was ¥2,761.7 billion, an increase of ¥53.9 billion compared with ¥2,707.8 billion as of March 31, 2015, reflecting increases such as in Retained earnings.
We seek to maintain sufficient capital at all times to withstand losses due to extreme market movements. The EMB is responsible for implementing and enforcing capital policies. This includes the determination of our balance sheet size and required capital levels. We continuously review our equity capital base to ensure that it can support the economic risk inherent in our business. There are also regulatory requirements for minimum capital of entities that operate in regulated securities or banking businesses.
As leverage ratios are commonly used by other financial institutions similar to us, we voluntarily provide a Leverage ratio and Adjusted leverage ratio primarily for benchmarking purposes so that users of our annual report can compare our leverage against other financial institutions. Adjusted leverage ratio is a non-GAAP financial measure that Nomura considers to be a useful supplemental measure of leverage. There are currently no regulatory or statutory reporting requirements which require us to disclose leverage ratios.
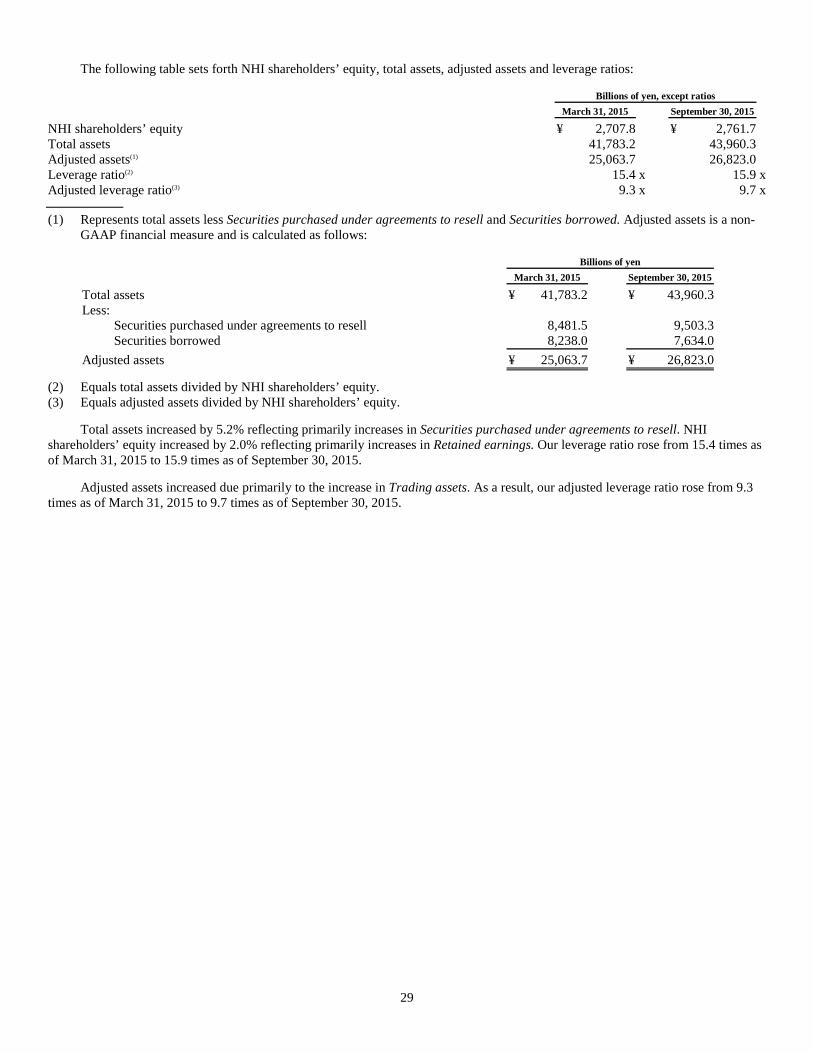
29
The following table sets forth NHI shareholders’ equity, total assets, adjusted assets and leverage ratios:
Billions of yen, except ratios
March 31, 2015
September 30, 2015
NHI shareholders’ equity ¥ 2,707.8 ¥ 2,761.7 Total assets 41,783.2 43,960.3 Adjusted assets(1) 25,063.7 26,823.0 Leverage ratio(2) 15.4 x 15.9 x Adjusted leverage ratio(3) 9.3 x 9.7 x (1) Represents total assets less Securities purchased under agreements to resell and Securities borrowed. Adjusted assets is a non-
GAAP financial measure and is calculated as follows:
Billions of yen
March 31, 2015
September 30, 2015
Total assets ¥ 41,783.2 ¥ 43,960.3 Less:
Securities purchased under agreements to resell 8,481.5 9,503.3 Securities borrowed 8,238.0 7,634.0
Adjusted assets ¥ 25,063.7 ¥ 26,823.0
(2) Equals total assets divided by NHI shareholders’ equity. (3) Equals adjusted assets divided by NHI shareholders’ equity.
Total assets increased by 5.2% reflecting primarily increases in Securities purchased under agreements to resell. NHI shareholders’ equity increased by 2.0% reflecting primarily increases in Retained earnings. Our leverage ratio rose from 15.4 times as of March 31, 2015 to 15.9 times as of September 30, 2015.
Adjusted assets increased due primarily to the increase in Trading assets. As a result, our adjusted leverage ratio rose from 9.3 times as of March 31, 2015 to 9.7 times as of September 30, 2015.
30
Capital Management Capital Management Policy
We seek to enhance shareholder value and to capture growing business opportunities by maintaining sufficient levels of capital. We will continue to review our levels of capital as appropriate, taking into consideration the economic risks inherent to operating our businesses, the regulatory requirements, and maintaining our ratings necessary to operate businesses globally.
Dividends We believe that raising corporate value over the long term and paying dividends is essential to rewarding shareholders. We will
strive to pay dividends using a consolidated pay-out ratio of 30 percent of each semi-annual consolidated earnings as a key indicator.
Dividend payments are determined taking into account a comprehensive range of factors such as the tightening of Basel regulations and other changes to the regulatory environment as well as the Company’s consolidated financial performance.
Dividends will in principle be paid on a semi-annual basis with record dates of September 30 and March 31.
With respect to retained earnings, in order to implement measures to adapt to regulatory changes and to increase shareholder value, we seek to efficiently invest in business areas where high profitability and growth may reasonably be expected, including the development and expansion of infrastructure.
We consider repurchases of treasury stock as an option in our financial strategy to respond quickly to changes in the business environment and to increase shareholder value. We make announcements immediately after any decision to set up a share buyback program and conduct such programs in accordance with internal guidelines.
Based on our Capital Management Policy described above, we paid a dividend of ¥10 per share to shareholders of record as of September 30, 2015.
The following table sets forth the amounts of dividends per share paid by us in respect of the periods indicated:
Fiscal year ended or ending March 31,
First Quarter
Second Quarter
Third Quarter
Fourth Quarter
Total
2011 ¥ — ¥ 4.00 ¥ — ¥ 4.00 ¥ 8.00 2012 — 4.00 — 2.00 6.00 2013 — 2.00 — 6.00 8.00 2014 — 8.00 — 9.00 17.00 2015 — 6.00 — 13.00 19.00 2016 — 10.00
Consolidated Regulatory Capital Requirements The FSA established the “Guideline for Financial Conglomerates Supervision” (“Financial Conglomerates Guideline”) in June
2005 and set out the rules on consolidated regulatory capital. We started monitoring our consolidated capital adequacy ratio in accordance with the Financial Conglomerates Guideline from April 2005.
The Company has been assigned as a Final Designated Parent Company who must calculate a consolidated capital adequacy ratio according to the Capital Adequacy Notice on Final Designated Parent Company in April 2011. Since then, we have been calculating our consolidated capital adequacy ratio according to the Capital Adequacy Notice on Final Designated Parent Company. Note that the Capital Adequacy Notice on Final Designated Parent Company has been revised to be in line with Basel 2.5 and Basel III, and we have calculated a Basel III-based consolidated capital adequacy ratio from the end of March 2013. Basel 2.5 includes significant change in calculation method of market risk and Basel III includes redefinition of capital items for the purpose of requiring higher quality of capital and expansion of the scope of credit risk-weighted assets calculation.
In accordance with Article 2 of the Capital Adequacy Notice on Final Designated Parent Company, our consolidated capital adequacy ratio is currently calculated based on the amounts of common equity Tier 1 capital, Tier 1 capital (sum of common equity Tier 1 capital and additional Tier 1 capital), total capital (sum of Tier 1 capital and Tier 2 capital), credit risk-weighted assets, market risk and operational risk. As of September 30, 2015, our common equity Tier 1 capital ratio (common equity Tier 1 capital divided by risk-weighted assets) is 13.2%, Tier 1 capital ratio (Tier 1 capital divided by risk-weighted assets) is 13.2% and consolidated capital adequacy ratio (total capital divided by risk-weighted assets) is 15.0% and we were in compliance with the requirement for each ratio set out in the Capital Adequacy Notice on Final Designated Parent Company (required level as of September 30, 2015 is 4.5% for common equity Tier 1 capital ratio, 6.0% for Tier 1 capital ratio and 8.0% for consolidated capital adequacy ratio).
31
The following table presents the Company’s consolidated capital adequacy ratio as of March 31, 2015 and September 30, 2015.
Billions of yen, except ratios
March 31, 2015
September 30, 2015
Common equity Tier 1 capital ¥ 2,459.2 ¥ 2,501.4 Tier 1 capital 2,459.2 2,501.4 Total capital 2,820.4 2,849.7 Risk-Weighted Assets
Credit risk-weighted assets 9,112.6 8,505.5 Market risk equivalent assets 7,113.0 7,558.4 Operational risk equivalent assets 2,703.5 2,851.6
Total risk-weighted assets ¥ 18,929.2 ¥ 18,915.5
Consolidated Capital Adequacy Ratios
Common equity Tier 1 capital ratio 12.9% 13.2% Tier 1 capital ratio 12.9% 13.2% Consolidated capital adequacy ratio 14.8% 15.0%
Common equity Tier 1 capital, additional Tier 1 capital and Tier 2 capital are calculated by deducting regulatory adjustment item from basic item for each capital class, respectively. If the amount of basic item is less than the amount of adjustment item, we need to deduct deficit amount from upper capital class. Each capital item and regulatory adjustment is defined in the Capital Adequacy Notice on Final Designated Parent Company and these new definitions of capital will come into effect gradually by transitional measures.
Since the end of March, 2011, we have been calculating credit risk-weighted assets and operational risk equivalent assets by using the foundation Internal Ratings-Based Approach and The Standardized Approach, respectively, with the approval of the FSA. Furthermore, Market risk equivalent assets are calculated by using the Internal Models Approach with approval of the FSA.
We provide consolidated capital adequacy ratios not only to demonstrate that we are in compliance with the requirements set out in the Capital Adequacy Notice on Final Designated Parent Company but also for benchmarking purposes so that users of our report can compare our capital position against those of other financial groups who are already subject to Basel III requirements. Management receives and reviews these capital ratios on a regular basis.
Consolidated Leverage Ratio Requirements In March 2015, the FSA issued guidance on the calculation methodology and disclosure requirements for a consolidated
regulatory leverage ratio by financial institutions through revisions to “Specification of items which a final designated parent company should disclose on documents to show the status of its sound management” (2010 FSA Regulatory Notice No. 132; “Notice on Pillar3 Disclosure”) and publishing “Consolidated Leverage Ratio prescribed by Commissioner of Financial Services Agency in accordance with Article 3, by paragraph 1 of Pillar3 Notice” (2015 FSA Regulatory Notice No. 11; “Notice on Consolidated Leverage Ratio”). As a result of this guidance, Nomura will now disclose a consolidated leverage ratio measure from March 31, 2015 which is calculated using the methodology prescribed by this guidance. Management will also receive and review this consolidated leverage ratio on a regular basis. As of September 30, 2015, our consolidated leverage ratio is 3.96%.
32
Changes to regulatory capital framework which affect us The Basel Committee has issued a series of announcements regarding a Basel III program designed to strengthen the regulatory
capital framework in light of weaknesses revealed by the financial crises. The following is a summary of the proposals which are most relevant to us.
On December 16, 2010, in an effort to promote a more resilient banking sector, the Basel Committee issued Basel III, that is, “International framework for liquidity risk measurement, standards and monitoring” and “A global regulatory framework for more resilient banks and banking systems”. The proposals include raising the quality, consistency and transparency of the capital base; strengthening the risk coverage of the capital framework such as the implementation of a credit value adjustment (“CVA”) charge for OTC derivative trades; introducing a leverage ratio requirement as a supplemental measure to the risk-based framework; introducing minimum standards for funding and liquidity; and introducing a series of measures to address concerns over the “procyclicality” of the current framework. Additional capital, liquidity or other supervisory measures to reduce the externalities created by systemically important institutions are also under review. These standards were implemented from 2013, which includes transitional treatment (i.e. they are phased in gradually from 2013). In addition, after two rounds of public consultation and discussions with the Committee on Payment and Settlement Systems (“CPSS”) and the International Organization of Securities Commissions (“IOSCO”), the Basel Committee issued interim rules for the capitalization of bank exposures to central counterparties (“CCPs”) on July 25, 2012, which were intended to come into effect as of January 2013 as part of Basel III. The first version of the CCPs rules came into the effect from 2013 and the final version of the CCPs rule was announced in April 2014 from the Basel Committee, which is not implemented. Moreover, a series of final standards on the regulatory frameworks such as Basel III leverage ratio framework and disclosure requirements, capital requirements for banks’ equity investments in funds, the standardized approach for measuring counterparty credit risk exposures, capital requirements for bank exposures to central counterparties, supervisory framework for measuring and controlling large exposures and revisions to the securitization framework have been published by the Basel Committee.
At the G-20 summit in November 2011, the Financial Stability Board (“FSB”) and the Basel Committee announced the list of global systemically important banks (“G-SIBs”) and the additional requirements for the G-SIBs including the establishment of a recovery and resolution plan. The FSB also announced the group of G-SIB will be updated annually and published by the FSB each November. In November 2013, the FSB and the Basel Committee updated the list of G-SIB. We have not been designated as a G-SIB in the past, since November 2013, and we were not designated as a G-SIB in November 2015. On the other hand, the FSB and the Basel Committee were asked to work on extending the framework for G-SIBs to domestic systemically important financial institutions (“D-SIBs”) and the Basel Committee developed and published a set of principles on the assessment methodology and the higher loss absorbency requirement for D-SIBs. We were designated as a D-SIB in December 2015 by the FSA. In addition to the above, the FSB and the IOSCO have published assessment methodologies for identifying Non-bank Non-insurer Global Systemically Important Financial Institutions “NBNI G-SIFIs”, for public consultation.
Following the change in international regulatory environment, the FSA introduced rules and notices such as the Capital Adequacy Notice on Final Designated Parent Company on consolidated regulation and supervision of securities companies on a consolidated basis on April 1, 2011 to improve the stability and transparency of Japan’s financial system and ensure the protection of investors. It is expected that such regulation and notice will be revised further to be in line with a series of rules and standards proposed by the Basel Committee, FSB or IOSCO.
33
Credit Ratings The cost and availability of unsecured funding are generally dependent on credit ratings. Our short-term and long-term debt is
rated by several recognized credit rating agencies. We believe that our credit ratings include the credit ratings agencies’ assessment of the general operating environment, our positions in the markets in which we operate, reputation, earnings structure, trend and volatility of our earnings, risk management framework, liquidity and capital management. An adverse change in any of these factors could result in a downgrade of our credit ratings, and that could, in turn, increase our borrowing costs and limit our access to the capital markets or require us to post additional collateral and permit counterparties to terminate transactions pursuant to certain contractual obligations. In addition, our credit ratings can have a significant impact on certain of our trading revenues, particularly in those businesses where longer term counterparty performance is critical, such as OTC derivative transactions.
As of November 30, 2015, the credit ratings of the Company and NSC were as follows:
Nomura Holdings, Inc.
Short-term Debt
Long-term Debt
Standard & Poor’s A-2 BBB+ Moody’s Investors Service — Baa1 Fitch Ratings F1 A- Rating and Investment Information, Inc. a-1 A+ Japan Credit Rating Agency, Ltd. — AA-
Nomura Securities Co., Ltd.
Short-term Debt
Long-term Debt
Standard & Poor’s A-2 A- Moody’s Investors Service P-2 A3 Fitch Ratings F1 A- Rating and Investment Information, Inc. a-1 A+ Japan Credit Rating Agency, Ltd. — AA-
Both Rating and Investment Information, Inc. and Japan Credit Rating Agency, Ltd. are credit rating agencies nationally recognized in Japan. We rely on, or utilize, credit ratings on our short-term and long-term provided by these Japanese credit rating agencies, as well as Standard & Poor’s, Moody’s Investors Service and Fitch Ratings, for unsecured funding and other financing purposes and also for our trading and other business activities.
There has been no change to the ratings in the above table since the date indicated.
34
Off-Balance Sheet Arrangements Off-balance sheet entities
In the normal course of business, we engage in a variety of off-balance sheet arrangements with off-balance sheet entities which may have an impact on Nomura’s future financial position and performance.
Off-balance sheet arrangements with off-balance sheet entities include where Nomura has: • an obligation under a guarantee contract; • a retained or contingent interest in assets transferred to an off-balance sheet entity or similar arrangement that serves to
provide credit, liquidity or market risk support to such entity; • any obligation, including a contingent obligation, under a contract that would be accounted for as a derivative instrument;
or • any obligation, including a contingent obligation, arising out of a variable interest in an off-balance sheet entity that is
held by, and material to, us, where such entity provides financing, liquidity, market risk or credit risk support to, or engages in leasing, hedging or research and development services with, us.
Off-balance sheet entities may take the form of a corporation, partnership, fund, trust or other legal vehicle which is designed to fulfill a limited, specific purpose by its sponsor. We both create or sponsor these entities and also enter into arrangements with entities created or sponsored by others.
Our involvement with these entities includes structuring, underwriting, distributing and selling debt instruments and beneficial interests issued by these entities, subject to prevailing market conditions. In connection with our securitization and equity derivative activities, we also act as a transferor of financial assets to these entities, as well as, underwriter, distributor and seller of asset-repackaged financial instruments issued by these entities. We retain, purchase and sell variable interests in SPEs in connection with our market-making, investing and structuring activities. Our other types of off-balance sheet arrangements include guarantee agreements and derivative contracts. Significant involvement is assessed based on all of our arrangements with these entities, even if the probability of loss, as assessed at the balance sheet date, is remote.
For further information about transactions with VIEs, see Note 6 “Securitizations and Variable Interest Entities” in our interim consolidated financial statements.
Contractual Obligations Since March 31, 2015, there have been no other material changes outside our ordinary course of business in connection with our
standby letters of credit and other guarantees, long-term borrowings and contractual interest payments, operating lease commitments, capital lease commitments, purchase obligations, commitments to extend credit and commitments to invest in partnerships.
For further details on our commitments, contingencies and guarantees, see Note 14 “Commitments, contingencies and guarantees” in our interim consolidated financial statements.
35
Quantitative and Qualitative Disclosures about Market Risk Risk Management
Nomura defines risks as (i) the potential erosion of Nomura’s capital base due to unexpected losses arising from risks to which its business operations are exposed, such as market risk, credit risk, operational risk and model risk, (ii) liquidity risk, the potential lack of access to funds or higher cost of funding than normal levels due to a deterioration in Nomura’s creditworthiness or deterioration in market conditions, and (iii) business risk, the potential failure of revenues to cover costs due to a deterioration in the earnings environment or a deterioration in the efficiency or effectiveness of its business operations.
A fundamental principle established by Nomura is that all employees shall regard themselves as principals of risk management and appropriately manage these risks. Nomura seeks to promote a culture of proactive risk management throughout all levels of the organization and to limit risks to the confines of its risk appetite. The risk management framework that Nomura uses to manage these risks consists of its risk appetite, risk management governance and oversight, the management of financial resources, the management of all risk classes, and processes to measure and control risks. Each of these key components is explained in further detail below.
Risk Appetite Nomura has determined the maximum level and types of risk that it is willing to assume in pursuit of its strategic objectives and
business plan and has articulated this in its Risk Appetite Statement. This document is jointly submitted by the Chief Risk Officer (“CRO”) and the Chief Financial Officer (“CFO”) to the Executive Management Board (“EMB”) for approval.
The Risk Appetite Statement provides an aggregated view of risk and includes capital adequacy and balance sheet measures, liquidity risk, market and credit risk, operational risk, and model risk, and consists of quantitative metrics and qualitative statements. It is subject to regular monitoring and breach escalation as appropriate by the owner of the relevant risk appetite statement.
Nomura’s Risk Appetite Statement is required to be reviewed annually by the EMB but it is reviewed on an ad hoc basis if necessary, and must specifically be reviewed following any significant changes in Nomura’s strategy. Risk appetite underpins all additional aspects of Nomura’s risk management framework.
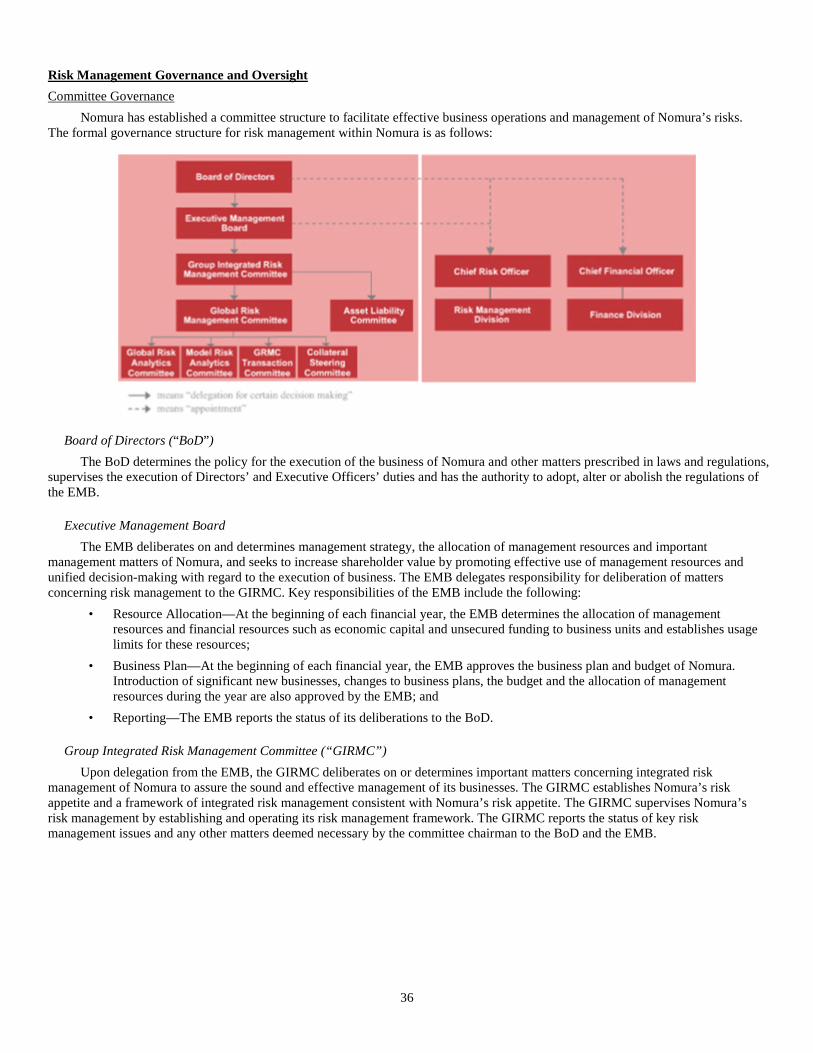
36
Risk Management Governance and Oversight Committee Governance
Nomura has established a committee structure to facilitate effective business operations and management of Nomura’s risks. The formal governance structure for risk management within Nomura is as follows:
Board of Directors (“BoD”) The BoD determines the policy for the execution of the business of Nomura and other matters prescribed in laws and regulations,
supervises the execution of Directors’ and Executive Officers’ duties and has the authority to adopt, alter or abolish the regulations of the EMB.
Executive Management Board The EMB deliberates on and determines management strategy, the allocation of management resources and important
management matters of Nomura, and seeks to increase shareholder value by promoting effective use of management resources and unified decision-making with regard to the execution of business. The EMB delegates responsibility for deliberation of matters concerning risk management to the GIRMC. Key responsibilities of the EMB include the following:
• Resource Allocation—At the beginning of each financial year, the EMB determines the allocation of management resources and financial resources such as economic capital and unsecured funding to business units and establishes usage limits for these resources;
• Business Plan—At the beginning of each financial year, the EMB approves the business plan and budget of Nomura. Introduction of significant new businesses, changes to business plans, the budget and the allocation of management resources during the year are also approved by the EMB; and
• Reporting—The EMB reports the status of its deliberations to the BoD.
Group Integrated Risk Management Committee (“GIRMC”) Upon delegation from the EMB, the GIRMC deliberates on or determines important matters concerning integrated risk
management of Nomura to assure the sound and effective management of its businesses. The GIRMC establishes Nomura’s risk appetite and a framework of integrated risk management consistent with Nomura’s risk appetite. The GIRMC supervises Nomura’s risk management by establishing and operating its risk management framework. The GIRMC reports the status of key risk management issues and any other matters deemed necessary by the committee chairman to the BoD and the EMB.
37
In addition, the GIRMC, upon delegation from the EMB, has established the Risk Management Policy, describing Nomura’s overall risk management framework including the fundamental risk management principles followed by Nomura.
Global Risk Management Committee (“GRMC”) Upon delegation from the GIRMC, the GRMC deliberates on or determines, based on strategic risk allocation and risk appetite
determined by the GIRMC, important matters concerning market, credit or reputational risk management of Nomura in order to assure the sound and effective management of Nomura’s businesses. The GRMC reports to the GIRMC the status of discussions at its meetings and any other matters as deemed necessary by the committee chairman.
Asset Liability Committee (“ALCO”) Upon delegation from the GIRMC, the ALCO deliberates on, based on Nomura’s risk appetite determined by the GIRMC,
balance sheet management, financial resource allocation, liquidity management and related matters. The ALCO reports to the GIRMC the status of discussions at its meetings and any other matters as deemed necessary by the committee chairman.
Global Risk Analytics Committee (“GRAC”) and Model Risk Analytics Committee (“MRAC”) Upon delegation from the GRMC, the GRAC and the MRAC deliberate on or determine matters concerning the development,
management and strategy of risk models and valuation models, respectively. The committees’ primary responsibility is to govern and provide oversight of model management, including the approval of new models and significant model changes. Both committees report all significant matters and material decisions taken to the GRMC, on a regular basis.
GRMC Transaction Committee Upon delegation from the GRMC, the GRMC Transaction Committee deliberates on or approves individual transactions in line
with Nomura’s risk appetite in order to assure the sound and effective management of Nomura’s businesses.
Collateral Steering Committee (“CSC”) Upon delegation from the GRMC, the CSC deliberates on or determines Nomura’s collateral risk management, including
concentrations, liquidity, collateral re-use, limits and stress tests, provides direction on Nomura’s collateral strategy and ensures compliance with regulatory collateral requirements.
Chief Risk Officer (“CRO”) The CRO is responsible for setting the overall strategy and direction of the Risk Management Division. The CRO is responsible
for supervising the Risk Management Division and maintaining the effectiveness of the risk management framework independently from the business units within Nomura. The CRO regularly reports on the status of Nomura’s risk management to the GIRMC, and reports to and seeks the approval of the GIRMC on measures required for risk management.
Chief Financial Officer (“CFO”) The CFO is responsible for overall financial strategy of Nomura, and has operational authority and responsibility over Nomura’s
liquidity management based on decisions made by the EMB.
38
Risk Management Division The Risk Management Division comprises various departments or units in charge of risk management established independently
from Nomura’s business units. The Risk Management Division is responsible for establishing and operating risk management processes, establishing and enforcing risk management policies and regulations, verifying the effectiveness of risk management methods, gathering reports from Nomura Group entities, reporting to Executive Officers/Senior Managing Directors and the GIRMC and others, as well as reporting to regulatory bodies and handling regulatory applications concerning risk management methods and other items as necessary. Important risk management issues are closely communicated between members of the Risk Management departments and the CRO. The CRO and/or Deputy CRO regularly attend the EMB and GIRMC meetings to report specific risk issues.
Risk Policy Framework Policies and procedures are essential tools of governance used by the Risk Management Division. They define principles, rules
and standards, and the specific processes that must be adhered to in order to effectively manage risk at Nomura. The Risk Management Division has established a risk policy framework to promote appropriate standards and consistency for risk policies and procedures and to articulate the principles and procedures conducive to effective risk management. All risk management policies and procedures are developed in line with this policy framework and a defined process is followed for any exceptions.
Monitoring, Reporting and Data Integrity Development, consolidation, monitoring and reporting of risk management information (“risk MI”) are fundamental to the
appropriate management of risk. The aim of all risk MI is to provide a basis for sound decision-making, action and escalation as required. The Risk Management Division and the Finance Division are responsible for producing regular risk MI, which reflects the position of Nomura relative to stated risk appetite. Risk MI includes information from across the risk classes defined in the risk management framework and reflect the use of the various risk tools used to identify and assess those risks. The Risk Management Division is responsible for implementing appropriate controls over data integrity for risk MI.
Management of Financial Resources Nomura has established a framework for management of financial resources in order to adequately manage utilization of these
resources. The EMB allocates financial resources to business units at the beginning of each financial year. These allocations are used to set revenue forecasts for each business units. Key components are set out below:
Risk-weighted assets A key component used in the calculation of our consolidated capital adequacy ratios is risk-weighted assets. The EMB
determines the risk appetite for our consolidated Tier 1 capital ratio on an annual basis and sets the limits for the usage of risk-weighted assets by each division and by additional lower levels of the division consistent with the risk appetite. See Item 4.B. “Business Overview—Regulatory Capital Rules” of our annual report on Form 20-F for the fiscal year ended March 31, 2015 and “Consolidated Regulatory Capital Requirements” in this report for further information on our consolidated capital adequacy ratios and risk-weighted assets.
39
Economic Capital Nomura’s internal measure of the capital required to support its business is the Nomura Capital Allocation Target (“NCAT”),
which is measured as the amount of capital required to absorb unexpected losses over a one-year time horizon under a severely adverse scenario. For quantification purposes, a severely adverse scenario is defined as the unexpected loss computed by risk models at the 99.95th percentile. NCAT consists of i) portfolio NCAT, which captures the risks directly impacting the value of specific positions such as market risk, credit risk, asset liquidity risk and other risks such as event risk to account for portfolio risks not easily covered in a historically calibrated model, and ii) non-portfolio NCAT, which captures the risks not directly affecting the value of specific positions, such as operational risk and business risk. Nomura’s NCAT limit is initially set by the EMB, and the EMB subsequently allocates it to each business division and additional lower levels of the organization.
Available Funds The CFO decides the maximum amount of available funds, provided without posting of any collateral, for allocation within
Nomura and the EMB approves the allocation of the funds to each business division. Global Treasury monitors the usage by businesses and reports to the EMB.
Classification and Definition of Risk Nomura classifies and defines risks as follows and has established departments or units to manage each risk type.
Risk Category
Definition
Market risk Risk of loss arising from fluctuations in the value of financial assets and liabilities (including off-balance sheet items) due to fluctuations in market risk factors (interest rates, foreign exchange rates, prices of securities and others).
Credit risk Risk of loss arising from an obligor or counterparty’s default, insolvency or administrative proceeding which results in the obligor’s failure to meet its contractual obligations in accordance with agreed terms. This includes both on and off-balance sheet exposures. It is also the risk of loss arising through a credit valuation adjustment (“CVA”) associated with deterioration in the creditworthiness of a counterparty.
Operational risk Risk of loss resulting from inadequate or failed internal processes, people and systems or from external events. It excludes strategic risk (the risk of loss as a result of poor strategic business decisions), but includes the risk of breach of legal and regulatory requirements, and the risk of damage to Nomura’s reputation if caused by an operational risk.
Model risk Risk arising from model errors or incorrect or inappropriate model application, which can lead to financial loss, poor business and strategic decision-making, restatement of external and internal reports, regulatory penalties and damage to Nomura’s reputation.
Funding and Liquidity risk
Risk of loss arising from difficulty in securing necessary funding or from a significantly higher cost of funding than normal levels due to a deterioration in Nomura’s creditworthiness or a deterioration in market conditions.
Business risk Risk of failure of revenues to cover costs due to a deterioration in the earnings environment or a deterioration in the efficiency or effectiveness of Nomura’s business operations. Managing business risk is the responsibility of Nomura’s Executive Managing Directors and Senior Managing Directors.
Market Risk Management Market risk is the risk of loss arising from fluctuations in the value of financial assets and liabilities (including off-balance sheet
items) due to fluctuations in market risk factors (interest rates, foreign exchange rates, prices of securities and others).
Market Risk Management Process Effective management of market risk requires the ability to analyze a complex and evolving portfolio in a constantly changing
global market environment, identify problematic trends and ensure that appropriate action is taken in a timely manner.
40
Nomura uses a variety of statistical risk measurement tools to assess and monitor market risk on an ongoing basis, including, but not limited to, Value at Risk (“VaR”), Stressed VaR (“SVaR”) and Incremental Risk Charge (“IRC”). In addition, Nomura uses sensitivity analysis and stress testing to measure and analyze its market risk. Sensitivities are measures used to show the potential changes to a portfolio due to standard moves in market risk factors. They are specific to each asset class and cannot usually be aggregated across risk factors. Stress testing enables the analysis of portfolio risks or tail risks, including non-linear behaviors and can be aggregated across risk factors at any level of the group hierarchy, from group level to business division, units or desk levels. Market risk is monitored against a set of approved limits, with daily reports and other management information provided to the business units and senior management.
Value at Risk VaR is a measure of the potential loss due to adverse movements of market factors, such as equity prices, interest rates, credit,
foreign exchange rates, and commodities with associated volatilities and correlations.
VaR Methodology Assumptions Nomura uses a single VaR model which has been implemented globally in order to determine the total trading VaR. A historical
simulation is implemented, where historical market moves over a two-year window are applied to current exposure in order to construct a profit and loss distribution. Potential losses can be estimated at required confidence levels or probabilities. A scenario weighting scheme is employed to ensure that the VaR model responds to changing market volatility. Nomura uses the same VaR model for both internal risk management purposes and for regulatory reporting. For internal risk management purposes, VaR is calculated across Nomura at a 99% confidence level and using a 1-day time horizon. For regulatory reporting purposes, Nomura uses the same confidence level but a 10-day time horizon, calculated using actual 10-day historical market moves. To complement VaR under Basel 2.5 regulations, Nomura also computes SVaR, which samples from a one-year window during a period of financial stress. The SVaR window is regularly calibrated and observations are equally weighted.
Nomura’s VaR model uses exact time series for each individual risk factor. However, if good quality data is not available, a ‘proxy logic’ maps the exposure to an appropriate time series. The level of proxying taking place is carefully monitored through internal risk management processes and there is a continual effort to source new time series to use in the VaR calculation.
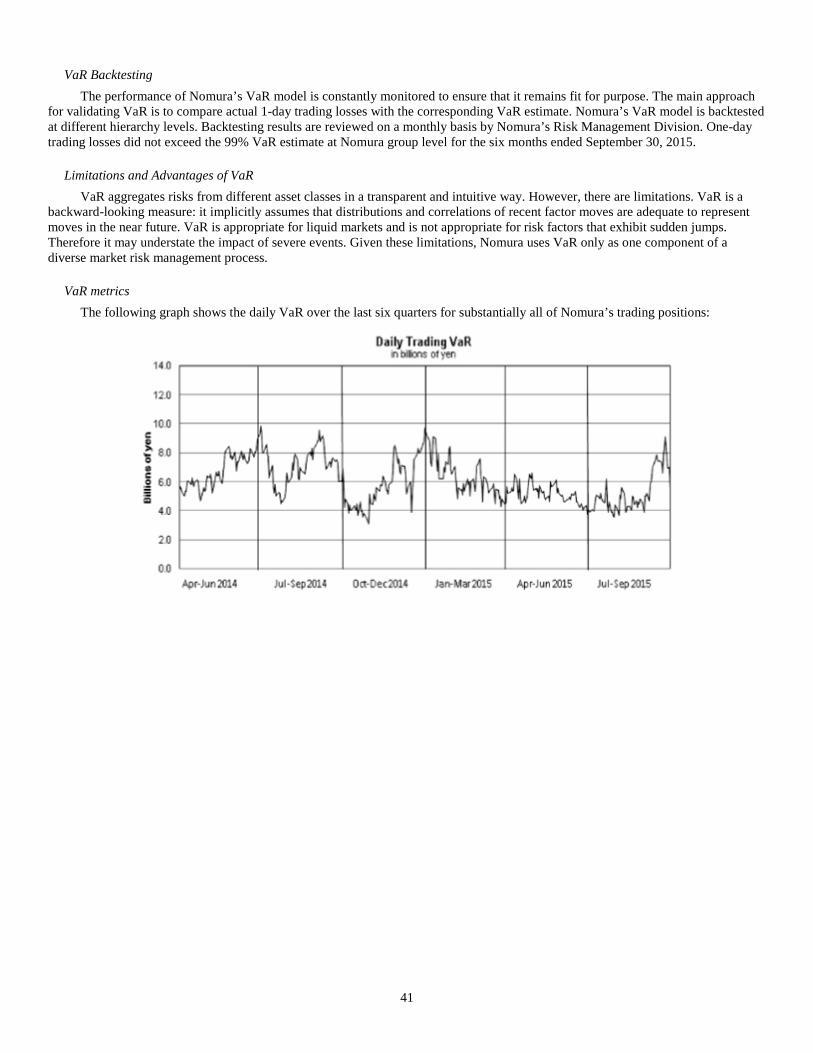
41
VaR Backtesting The performance of Nomura’s VaR model is constantly monitored to ensure that it remains fit for purpose. The main approach
for validating VaR is to compare actual 1-day trading losses with the corresponding VaR estimate. Nomura’s VaR model is backtested at different hierarchy levels. Backtesting results are reviewed on a monthly basis by Nomura’s Risk Management Division. One-day trading losses did not exceed the 99% VaR estimate at Nomura group level for the six months ended September 30, 2015.
Limitations and Advantages of VaR VaR aggregates risks from different asset classes in a transparent and intuitive way. However, there are limitations. VaR is a
backward-looking measure: it implicitly assumes that distributions and correlations of recent factor moves are adequate to represent moves in the near future. VaR is appropriate for liquid markets and is not appropriate for risk factors that exhibit sudden jumps. Therefore it may understate the impact of severe events. Given these limitations, Nomura uses VaR only as one component of a diverse market risk management process.
VaR metrics The following graph shows the daily VaR over the last six quarters for substantially all of Nomura’s trading positions:
42
The following tables show the VaR as of each of the dates indicated for substantially all of Nomura’s trading positions:
Billions of yen
As of
Mar. 31, 2014
Mar. 31, 2015
Sep. 30, 2015
Equity ¥ 1.28 ¥ 1.01 ¥ 1.53 Interest rate 3.95 4.17 5.24 Foreign exchange 2.79 1.06 1.39
Subtotal 8.02 6.23 8.17 Less: Diversification Benefit (2.86) (1.62) (2.80)
VaR ¥ 5.16 ¥ 4.62 ¥ 5.36
Billions of yen
For the twelve months ended
For the six months ended
Mar. 31, 2014
Mar. 31, 2015
Sep. 30, 2015
Maximum daily VaR(1) ¥ 9.90 ¥ 9.84 ¥ 9.13 Average daily VaR(1) 6.67 6.44 5.16 Minimum daily VaR(1) 4.45 3.11 3.54 (1) Represents the maximum, average and minimum VaR based on all daily calculations for the twelve months ended March 31,
2014, March 31, 2015, and for the six months ended September 30, 2015.
Total VaR increased to ¥5.36 billion as of September 30, 2015 from ¥4.62 billion as of March 31, 2015. VaR relating to foreign exchange risk increased to ¥1.39 billion as of Sep 30, 2015, compared to ¥1.06 billion as of March 31, 2015. VaR relating to equity risk increased to ¥1.53 billion as of September 30, 2015, compared to ¥1.01 billion as of March 31, 2015.VaR relating to interest rate risk increased to ¥5.24 billion as of September 30, 2015, compared to ¥4.17 billion as of March 31, 2015.
Total VaR decreased to ¥4.62 billion as of March 31, 2015 from ¥5.16 billion as of March 31, 2014. VaR relating to foreign exchange risk decreased to ¥1.06 billion as of March 31, 2015, compared to ¥2.79 billion as of March 31, 2014 due to lower outright foreign exchange risk taken. VaR relating to equity risk decreased to ¥1.01 billion as of March 31, 2015, compared to ¥1.28 billion as of March 31, 2014.VaR relating to interest rate risk increased to ¥4.17 billion as of March 31, 2015, compared to ¥3.95 billion as of March 31, 2014.
43
Stress Testing Nomura conducts market risk stress testing since VaR and sensitivity analysis have limited ability to capture all portfolio risks
or tail risks. Stress testing for market risk is conducted daily and weekly, using various scenarios based upon features of trading strategies. Nomura conducts stress testing not only at each desk level, but also at a Nomura group level with a set of common global scenarios in order to capture the impact of market fluctuations on the entire Nomura group.
Non-Trading Risk A major market risk in Nomura’s non-trading portfolio relates to equity investments held for operating purposes and on a long-
term basis. Equity investments held for operating purposes are minority stakes in the equity securities of unaffiliated Japanese financial institutions and corporations held in order to promote existing and potential business relationships. This non-trading portfolio is exposed mainly to volatility in the Japanese stock market. One method that can estimate the market risk in this portfolio is to analyze market sensitivity based on changes in the TOPIX, which is a leading index of prices of stocks on the First Section of the Tokyo Stock Exchange.
Nomura uses regression analysis covering the previous 90 days which tracks and compares fluctuations in the TOPIX and the market value of Nomura’s equity investments held for operating purposes. This analysis indicates that for each 10% change in the TOPIX, the market value of Nomura’s operating equity investments held for operating purposes can be expected to change by ¥23,271 million at the end of March 2015 and ¥23,299 million at the end of September 2015. The TOPIX closed at 1,543.11 points at the end of March 2015 and at 1,411.16 points at the end of September 2015. This simulation analyzes data for the entire portfolio of equity investments held for operating purposes at Nomura and therefore actual results may differ from Nomura’s expectations because of price fluctuations of individual equities.
Credit Risk Management Credit risk is the risk of loss arising from an obligor or counterparty’s default, insolvency or administrative proceeding which
results in the obligor’s failure to meet its contractual obligations in accordance with agreed terms. This includes both on and off-balance sheet exposures. It is also the risk of loss arising through a CVA associated with deterioration in the creditworthiness of a counterparty.
Nomura manages credit risk on a global basis and on an individual Nomura legal entity basis.
Credit Risk Management Framework The measurement, monitoring and management of credit risk at Nomura are governed by a set of global policies and procedures.
Credit Risk Management (“CRM”), a global function within the Risk Management Division, is responsible for the implementation and maintenance of these policies and procedures. These policies are authorized by the GIRMC and/or Global Risk Strategic Committee (“GRSC”), prescribe the basic principles of credit risk management and set credit limits to counterparties that are formally approved by CRM personnel with the appropriate level of credit authority.
Credit risk is managed by CRM together with various global and regional risk committees. This ensures transparency of material credit risks and compliance with established credit limits, the approval of material extensions of credit and the escalation of risk concentrations to appropriate senior management.
44
Credit Risk Management Process CRM operates as a credit risk control function within the Risk Management Division, reporting to the CRO. The process for
managing credit risk at Nomura includes: • Evaluation of likelihood that a counterparty defaults on its payments and obligations; • Assignment of internal ratings to all active counterparties; • Approval of extensions of credit and establishment of credit limits; • Measurement, monitoring and management of Nomura’s current and potential future credit exposures; • Setting credit terms in legal documentation including margin terms; and • Use of appropriate credit risk mitigants including netting, collateral and hedging.
The scope of credit risk management includes counterparty trading and various debt or equity instruments including loans, private equity investments, fund investments, investment securities and any other as deemed necessary from a credit risk management perspective. The evaluation of counterparties’ creditworthiness involves a thorough due diligence and analysis of the business environments in which they operate, their competitive positions, management and financial strength and flexibility. Credit analysts also take into account the corporate structure and any explicit or implicit credit support. CRM evaluates credit risk not only by counterparty, but also by counterparty group.
Following the credit analysis, CRM estimates the probability of default of a given counterparty or obligor through an alphanumeric ratings scale similar to that used by rating agencies and a corresponding numeric scale. Credit analysts are responsible for assigning and maintaining the internal ratings, ensuring that each rating is reviewed and approved at least annually.
Nomura’s internal rating system employs a range of ratings models to ensure global consistency and accuracy. These models are developed and maintained by the Risk Methodology Group. Internal ratings represent a critical component of Nomura’s approach to managing counterparty credit risk. They are used as key factors in:
• Establishing the amount of counterparty credit risk that Nomura is willing to take to an individual counterparty or counterparty group (setting of credit limits);
• Determining the level of delegated authority for setting credit limits (including tenor); • The frequency of credit reviews (renewal of credit limits); • Reporting counterparty credit risk to senior management within Nomura; and • Reporting counterparty credit risk to stakeholders outside of Nomura.
The Credit Risk Control Unit is a function that is independent of CRM. It ensures that Nomura’s internal rating system is properly reviewed and validated, reporting any breaks or issues to senior management for timely resolution. The unit is responsible for ensuring that the system remains accurate and predictive of risk and provides periodic reporting on the system to senior management.
Nomura has established an Internal Rating System to be a unified, exhaustive and objective framework to evaluate credit risk. Internal ratings are typically classified into obligor, facility and specialized lending ratings. Each rating classification serves to properly express the credit risk either in terms of probability of default, the level of potential recovery given its position in a capital structure or the probability of repayment under the terms of a specialized lending facility.
For regulatory capital calculation purposes, Nomura has been applying the Foundation Internal Rating Based Approach (“FIRB”) in calculating credit risk weighted assets since the end of March 2011. The Standardized Approach is applied to certain business units or asset types, which are considered immaterial to the calculation of credit risk-weighted assets.
45
Credit Limits and Risk Measures Internal ratings form an integral part in the assignment of credit limits to counterparties. Nomura’s credit limit framework is
designed to ensure that Nomura takes appropriate credit risk in a manner that is consistent with its overall risk appetite. Global Credit policies define the delegated authority matrices that establish the maximum aggregated limit amounts and tenors that may be set for any single counterparty group based on their internal rating.
Nomura’s main type of counterparty credit risk exposures arise from derivatives transactions or securities financing transactions. Credit exposures against counterparties are managed by means of setting credit limits based upon credit analysis of individual counterparty. Credit risk is managed daily through the monitoring of credit exposure against approved credit limits and the ongoing monitoring of the creditworthiness of Nomura’s counterparties. Any change in circumstance that alters Nomura’s risk appetite for any particular counterparty, sector, industry or country is reflected in changes to the internal rating and credit limit as appropriate.
Nomura’s global credit risk management systems record all credit limits and capture credit exposures to the Nomura’s counterparties allowing CRM to measure, monitor and manage utilization of credit limits, ensure appropriate reporting and escalation of any limit breaches.
For derivatives and securities financing transactions, Nomura measures credit risk primarily by way of a Monte Carlo-based simulation model that determines a Potential Exposure (“PE”) profile at a specified confidence level. The exposure calculation model used for counterparty credit risk management has also been used for the Internal Model Method (“IMM”) based exposure calculation for regulatory capital reporting purposes since the end of December 2012.
Loans and lending commitments are measured and monitored on both a funded and unfunded basis.
Wrong Way Risk Wrong Way Risk (“WWR”) occurs when exposure to a counterparty is highly correlated with the deterioration of
creditworthiness of that counterparty. Nomura has established global policies that govern the management of any WWR exposures. Stress testing is used to support the assessment of any WWR embedded within existing portfolios and adjustments are made to credit exposures and regulatory capital, as appropriate.
Stress Testing Stress Testing is an integral part of Nomura’s management of credit risk. Regular stress tests are used to support the assessment
of credit risks by counterparties, sectors and regions. The stress tests include potential concentrations that are highlighted as a result of applying shocks to risk factors, probabilities of default or rating migrations.
Risk Mitigation Nomura utilizes financial instruments, agreements and practices to assist in the management of credit risk. Nomura enters into
legal agreements, such as the International Swap and Derivatives Association, Inc. (“ISDA”) agreements or equivalent (referred to as “Master Netting Agreements”), with many of its counterparties. Master Netting Agreements allow netting of receivables and payables and reduce losses potentially incurred as a result of a counterparty default. Further reduction in credit risk is achieved through entering into collateral agreements that allow Nomura to obtain collateral from counterparties either upfront or contingent on exposure levels, changes in credit rating or other factors.
46
Credit Risk to Counterparties in Derivatives Transaction The credit exposures arising from Nomura’s trading-related derivatives as of March 31, 2015 are summarized in the table below,
showing the positive fair value of derivative assets by counterparty credit rating and by remaining contractual maturity. The credit ratings are internally determined by Nomura’s CRM.
Billions of yen
Years to Maturity
Cross-Maturity Netting(1)
Total Fair Value
Collateral obtained
Replacement cost(3)
Credit Rating
Less than 1 year
1 to 3 years
3 to 5 years
5 to 7 years
More than 7 years
(a) (b) (a)-(b) AAA ¥ 18 ¥ 103 ¥ 21 ¥ 9 ¥ 80 ¥ (192) ¥ 39 ¥ 4 ¥ 35 AA 299 451 422 513 1,732 (3,048) 369 70 299 A 462 372 360 308 892 (1,895) 499 54 445 BBB 177 151 144 131 530 (710) 423 261 162 BB and lower 58 73 71 45 349 (384) 212 400 0 Other(2) 43 2 3 1 17 (164) (98) 4 0
Sub-total 1,057 1,152 1,021 1,007 3,600 (6,393) 1,444 793 941 Listed 333 161 21 3 0 (376) 142 20 122
Total ¥ 1,390 ¥ 1,313 ¥ 1,042 ¥ 1,010 ¥ 3,600 ¥ (6,769) ¥ 1,586 ¥ 813 ¥ 1,063
(1) Represents netting of derivative liabilities against derivatives assets entered into with the same counterparty across different
maturity bands. Derivative assets and derivative liabilities with the same counterparty in the same maturity band are net within the relevant maturity band. Cash collateral netting against net derivative assets in accordance with ASC 210-20 “Balance Sheet—Offsetting” and ASC 815 “Derivatives and Hedging” is also included.
(2) “Other” comprises unrated counterparties and certain portfolio level valuation adjustments not allocated to specific counterparties
(3) Zero balances represent instances where total collateral received is in excess of the total fair value therefore Nomura’s credit exposure is zero.
Country Risk Country risk has continued to be a dominant theme given the heightened geopolitical risks affecting markets through the
reporting period. Security pressures related to conflicts in the Middle East and the rise of Islamic State have increased event risk. Anti-EU and populist sentiment is undermining political stability and fiscal orthodoxy in some EU member states, with ‘Brexit’ and Catalonia separatism as tail risks. Dollar strength and commodity weakness have increased pressure on emerging markets, with idiosyncratic political developments in countries such as Brazil and Turkey adding risk. Furthermore, although immediate concerns around Greece have subsided, fiscal and economic sustainability remains a concern for multiple eurozone countries.
Nomura manages country risk through a consolidated risk assessment and limit framework. The framework incorporates inventory positions, trades with counterparties and any other businesses or products as part of its diversified portfolio. Nomura does not have concentrated exposure to the countries directly impacted by the conflicts in the Middle East. Nomura’s total current net exposure to Russia and Ukraine as of September 30, 2015 was not material. Nomura’s emerging market exposures were principally in Turkey (¥36 billion) and Brazil (¥33 billion). Nomura maintained exposure to peripheral eurozone economies, with the largest as of September 30, 2015 being Italy (¥155 billion) and Spain (¥71 billion), the next largest being Portugal (¥12 billion), and the remainder being smaller. Peripheral eurozone exposure consisted of OTC derivatives, lending, deposits and trading positions.
47
Operational Risk Management Operational risk is the risk of loss resulting from inadequate or failed internal processes, people, and systems or from external
events. It excludes strategic risk (the risk of loss as a result of poor strategic business decisions), but includes the risk of breach of legal and regulatory requirements, and the risk of damage to Nomura’s reputation if caused by an operational risk.
The Three Lines of Defence Nomura adopts the industry standard “Three Lines of Defence” for the management of operational risk, comprising the
following elements: 1) 1st Line of Defence: The business which owns and manages its risks 2) 2nd Line of Defence: The Operational Risk Management (“ORM”) function, which defines and co-ordinates Nomura’s
operational risk strategy and framework and provides challenge to the 1st Line of Defence 3) 3rd Line of Defence: Internal and External Audit, who provide independent assurance
Operational Risk Management Framework An Operational Risk Management Framework has been established in order to allow Nomura to identify, assess, manage,
monitor and report on operational risk. The GIRMC, with delegated authority from the EMB has formal oversight over the management of operational risk.
This framework is set out below:
Infrastructure of the framework • Policy framework: Sets standards for managing operational risk and details how to monitor adherence to these standards. • Training and awareness: Action taken by ORM to improve business understanding of operational risk.
Products and Services • Risk and Control Self-Assessment (“RCSA”): The process used by business units to identify and assess the operational
risks to which they are exposed, the controls in place to mitigate risks, and action plans to further reduce risk. • Scenario Analysis: Process to identify and assess high impact, low probability ‘tail events’. • Event Reporting: Process to obtain information on and learn from actual events impacting Nomura and relevant external
events. A key step is to identify appropriate action plans to prevent or mitigate future occurrence of events. • Key Risk Indicators (“KRI”): Metrics which allow monitoring of certain key operational risks and trigger appropriate
responses as thresholds are breached.
Outputs • Analysis and reporting: A key aspect of ORM’s role is to analyze, report, and challenge operational risk information
provided by business units, and work with business units to develop action plans to mitigate risks. • Operational risk capital calculation: Calculate operational risk capital as required under applicable Basel standards and
local regulatory requirements.
48
Regulatory capital calculation for operational risk Nomura uses The Standardized Approach for calculating regulatory capital for operational risk. This involves using a three-year
average of gross income allocated to business lines, which is multiplied by a fixed percentage (“Beta Factor”) determined by the FSA, to establish the amount of required operational risk capital.
Nomura uses consolidated net revenue as gross income, however for certain consolidated subsidiaries, gross operating profit is used as gross income. Gross income allocation is performed by mapping the net revenue of each business segment as defined in Nomura’s management accounting data to each Basel business line as follows:
Business Line
Description
Beta Factor
Retail Banking Retail deposit and loan-related services 12% Commercial Banking Deposit and loan-related services except for Retail Banking business 15% Payment and Settlement Payment and settlement services for clients’ transactions 18% Retail Brokerage Securities-related services mainly for individuals 12% Trading and Sales Market-related business 18% Corporate Finance M&A, underwriting, secondary and private offerings, and other funding services for client 18% Agency Services Agency services for clients such as custody 15% Asset Management Fund management services for clients 12%
Nomura calculates the required amount of operational risk capital for each business line by multiplying the allocated annual gross income amount by the appropriate Beta Factor defined above. The operational risk capital for any gross income amount not allocated to a specific business line is determined by multiplying such unallocated gross income amount by a fixed percentage of 18%.
The total operational risk capital for Nomura is calculated by aggregating the total amount of operational risk capital required for each business line and unallocated amount and by determining a three-year average. Where the aggregated amount for a given year is negative, then the total operational risk capital amount for that year will be calculated as zero.
In any given year, negative amounts in any business line are offset against positive amounts in other business lines. However, negative unallocated amounts are not offset against positive amounts in other business lines and are calculated as zero.
Operational risk capital is calculated at the end of September and March each year.
Model Risk Management Model risk is the risk arising from model errors or incorrect or inappropriate model application, which can lead to financial loss,
poor business and strategic decision-making, restatement of external and internal reports, regulatory penalties and damage to Nomura’s reputation.
Errors can occur at any point from model assumptions through to implementation. In addition, the quality of model outputs depends on the quality of model parameters and any input data. Even a fundamentally sound model producing accurate outputs consistent with the design objective of the model may exhibit high model risk if it is misapplied or misused.
To address these risks, Nomura has established its model risk appetite. The quantitative risk appetite measure is based on the potential loss arising from model risk.
49
Model Management Framework The models within the model management framework are defined as either:
• valuation models, used for calculating prices and risk sensitivities of Nomura’s positions; or, • risk models, used by the Risk Management Division for quantifying the risk of a portfolio by calculating the potential
losses incurred from a specific type of risk, and used for regulatory or economic capital calculations, limit monitoring, trade approval and management reporting.
Before models are put into official use, the Model Validation Group (“MVG”) is responsible for validating their integrity and comprehensiveness independently from those who design and build them. As part of this validation process, the MVG analyzes a number of factors to assess a model’s suitability, to quantify model risk which is then mitigated by applying model reserves and capital adjustments. Valuation models are developed and maintained by the business units and risk models by the Risk Methodology Group (“RMG”) within the Risk Management Division. Certain models may also be developed by third party providers. The RMG has primary responsibility for the ongoing refinement and improvement of risk models and methodologies within Nomura.
All models are also subject to an annual re-approval process by MVG to ensure they remain suitable. Upon delegation from the GRMC, the MRAC’s and GRAC’s primary responsibility is to govern and provide oversight of model management for valuation and risk models, respectively.
Changes to valuation and risk models Nomura has documented policies and procedures in place, approved by the GIRMC and/or GRSC, which define the process and
validation requirements for implementing changes to valuation and risk models. For changes with an impact above certain materiality thresholds, model approval is required. These materiality thresholds are defined through procedures owned by MVG and reflect Nomura’s model risk appetite. For certain material changes to risk models, backtesting of the new model, parallel running of both models and stress-testing of the new model are required prior to the model being approved.
Funding and Liquidity Risk Management For further information on funding and liquidity risk management, see “Liquidity and Capital Resources—Funding and
Liquidity Management” in this report.
50
Risk Measures and Controls Limit Frameworks
The establishment of robust limit monitoring and management is central to appropriate monitoring and management of risk. The limit management frameworks incorporate clear escalation policies to ensure approval of limits at appropriate levels of seniority. The Risk Management Division is responsible for day-to-day operation of these limit frameworks including approval, monitoring, and reporting as required. Business units are responsible for complying with the agreed limits. Limits apply across a range of quantitative measures of risk and across market and credit risks.
New Business Risk Management The new business approval process represents the starting point for new business in Nomura and exists to support management
decision-making and ensure that risks associated with new products and transactions are identified and managed appropriately. The new business approval process consists of two components:
1) Transaction committees are in place to provide formal governance over the review and decision-making process for individual transactions.
2) The new product approval process allows business unit sponsors to submit applications for new products and obtain approval from relevant departments prior to execution of the new products. The process is designed to capture and assess risks across all risk classes as a result of the new product or business.
Stress Testing Stress testing is a process of assessing the stability or business continuity of Nomura from the view point of capital adequacy,
profit and loss impact or liquidity adequacy using plausible scenarios at various levels of the hierarchy from group level to division or desk levels, including those based on sensitivity analysis.
Nomura conducts a rigorous programme of stress testing through a comprehensive suite of top-down and bottom-up scenarios, covering different time horizons, severities, scope and methodologies and these are reviewed, run and presented on a regular basis to senior management, who can then take appropriate actions.
Stress testing is categorised either as sensitivity analysis, scenario analysis, goupwide stress testing or reverse stress testing. • Sensitivity analysis is used to quantify the impact of a market move in one or two associated risk factors across all
positions (e.g., equity prices or equity prices/equity volatility) using a variety of defined market shocks in order to assess specific risks or potential concentrations;
• Scenario analysis is used to quantify the impact of a specified event on Nomura’s portfolio, combining simultaneous cross- asset market shocks;
• Groupwide stress testing is applied consistently across risk classes, such as market, credit, operational, business and liquidity risks. It is used to assess Nomura’s capital adequacy under severe market scenarios; and
• Reverse stress testing is designed to identify a range of adverse circumstances which could cause Nomura’s business plan to become unviable. Such tests would stress Nomura’s exposures or business models in an “extreme” fashion until the point of capital failure, liquidity failure or business closure.
Stress tests are run on a regular basis as part of Nomura’s routine risk management process and on an ad hoc basis in response to market events or concerns. Stress testing is regarded as an integral part of Nomura’s risk management governance and used as a tool for forward-looking risk management and decision-making.
F-1
Interim Consolidated Financial Statements (UNAUDITED)
Page
Consolidated Balance Sheets as of March 31, 2015 and September 30, 2015 F-2
Consolidated Statements of Income for the Six Months Ended September 30, 2014 and 2015 and Three Months Ended September 30, 2014 and 2015 F-5
Consolidated Statements of Comprehensive Income for the Six Months Ended September 30, 2014 and 2015 and Three Months Ended September 30, 2014 and 2015 F-7
Consolidated Statements of Changes in Equity for the Six Months Ended September 30, 2014 and 2015 F-8
Consolidated Statements of Cash Flows for the Six Months Ended September 30, 2014 and 2015 F-9
Notes to the Interim Consolidated Financial Statements F-10
Report of Independent Registered Public Accounting Firm F-95
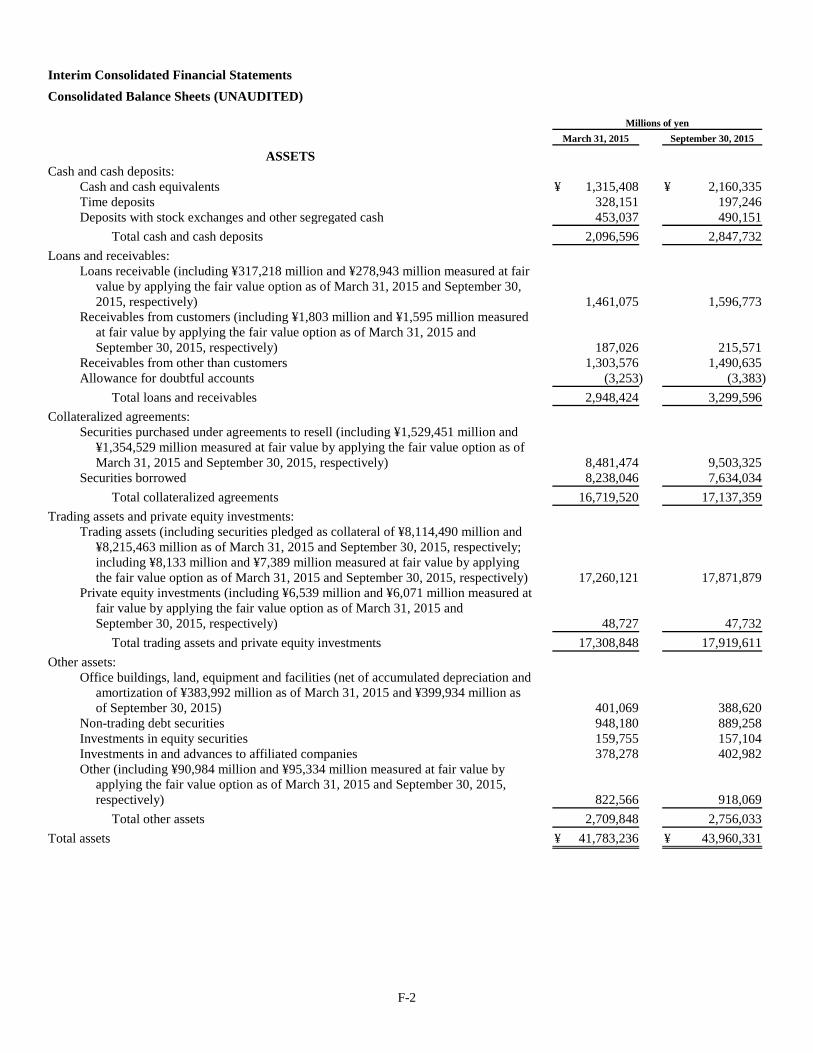
F-2
Interim Consolidated Financial Statements Consolidated Balance Sheets (UNAUDITED)
Millions of yen
March 31, 2015
September 30, 2015
ASSETS
Cash and cash deposits:
Cash and cash equivalents ¥ 1,315,408 ¥ 2,160,335 Time deposits 328,151 197,246 Deposits with stock exchanges and other segregated cash 453,037 490,151
Total cash and cash deposits 2,096,596 2,847,732
Loans and receivables:
Loans receivable (including ¥317,218 million and ¥278,943 million measured at fair value by applying the fair value option as of March 31, 2015 and September 30, 2015, respectively) 1,461,075 1,596,773
Receivables from customers (including ¥1,803 million and ¥1,595 million measured at fair value by applying the fair value option as of March 31, 2015 and September 30, 2015, respectively) 187,026 215,571
Receivables from other than customers 1,303,576 1,490,635 Allowance for doubtful accounts (3,253) (3,383)
Total loans and receivables 2,948,424 3,299,596
Collateralized agreements:
Securities purchased under agreements to resell (including ¥1,529,451 million and ¥1,354,529 million measured at fair value by applying the fair value option as of March 31, 2015 and September 30, 2015, respectively) 8,481,474 9,503,325
Securities borrowed 8,238,046 7,634,034
Total collateralized agreements 16,719,520 17,137,359
Trading assets and private equity investments:
Trading assets (including securities pledged as collateral of ¥8,114,490 million and ¥8,215,463 million as of March 31, 2015 and September 30, 2015, respectively; including ¥8,133 million and ¥7,389 million measured at fair value by applying the fair value option as of March 31, 2015 and September 30, 2015, respectively) 17,260,121 17,871,879
Private equity investments (including ¥6,539 million and ¥6,071 million measured at fair value by applying the fair value option as of March 31, 2015 and September 30, 2015, respectively) 48,727 47,732
Total trading assets and private equity investments 17,308,848 17,919,611
Other assets:
Office buildings, land, equipment and facilities (net of accumulated depreciation and amortization of ¥383,992 million as of March 31, 2015 and ¥399,934 million as of September 30, 2015) 401,069 388,620
Non-trading debt securities 948,180 889,258 Investments in equity securities 159,755 157,104 Investments in and advances to affiliated companies 378,278 402,982 Other (including ¥90,984 million and ¥95,334 million measured at fair value by
applying the fair value option as of March 31, 2015 and September 30, 2015, respectively) 822,566 918,069
Total other assets 2,709,848 2,756,033
Total assets ¥ 41,783,236 ¥ 43,960,331
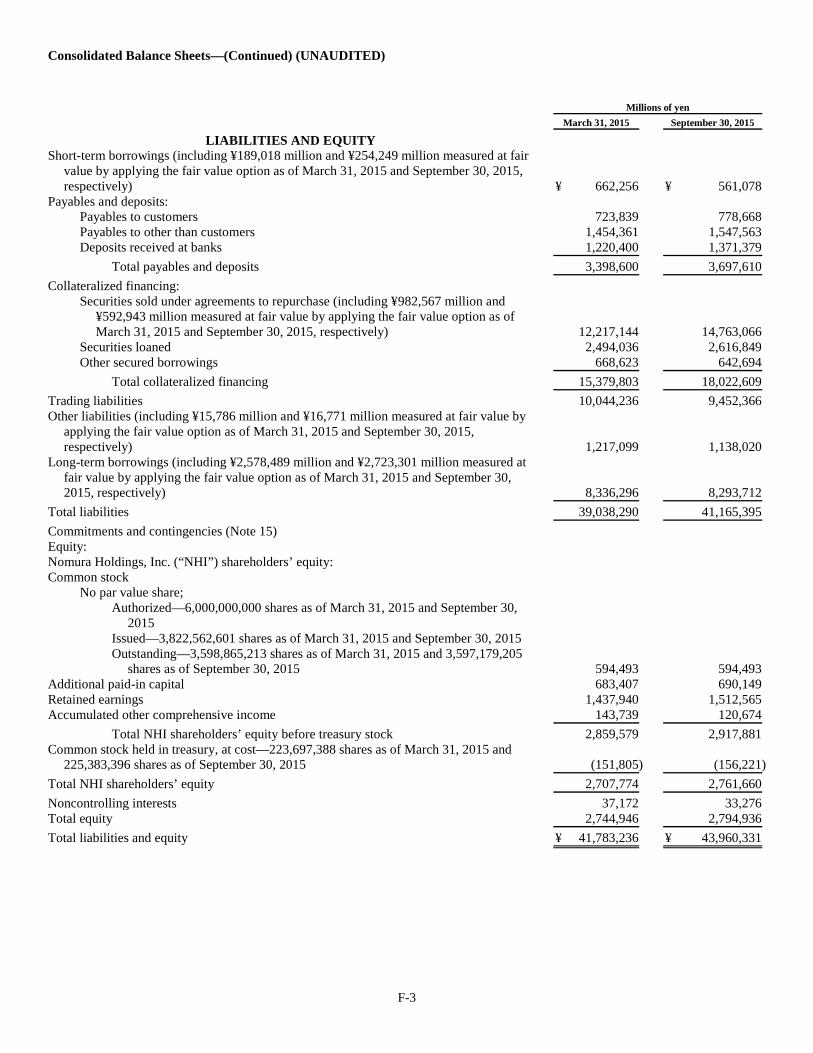
F-3
Consolidated Balance Sheets—(Continued) (UNAUDITED)
Millions of yen
March 31, 2015
September 30, 2015
LIABILITIES AND EQUITY
Short-term borrowings (including ¥189,018 million and ¥254,249 million measured at fair value by applying the fair value option as of March 31, 2015 and September 30, 2015, respectively) ¥ 662,256 ¥ 561,078
Payables and deposits:
Payables to customers 723,839 778,668 Payables to other than customers 1,454,361 1,547,563 Deposits received at banks 1,220,400 1,371,379
Total payables and deposits 3,398,600 3,697,610
Collateralized financing:
Securities sold under agreements to repurchase (including ¥982,567 million and ¥592,943 million measured at fair value by applying the fair value option as of March 31, 2015 and September 30, 2015, respectively) 12,217,144 14,763,066
Securities loaned 2,494,036 2,616,849 Other secured borrowings 668,623 642,694
Total collateralized financing 15,379,803 18,022,609
Trading liabilities 10,044,236 9,452,366 Other liabilities (including ¥15,786 million and ¥16,771 million measured at fair value by
applying the fair value option as of March 31, 2015 and September 30, 2015, respectively) 1,217,099 1,138,020
Long-term borrowings (including ¥2,578,489 million and ¥2,723,301 million measured at fair value by applying the fair value option as of March 31, 2015 and September 30, 2015, respectively) 8,336,296 8,293,712
Total liabilities 39,038,290 41,165,395
Commitments and contingencies (Note 15)
Equity:
Nomura Holdings, Inc. (“NHI”) shareholders’ equity:
Common stock
No par value share;
Authorized—6,000,000,000 shares as of March 31, 2015 and September 30, 2015
Issued—3,822,562,601 shares as of March 31, 2015 and September 30, 2015
Outstanding—3,598,865,213 shares as of March 31, 2015 and 3,597,179,205 shares as of September 30, 2015 594,493 594,493
Additional paid-in capital 683,407 690,149 Retained earnings 1,437,940 1,512,565 Accumulated other comprehensive income 143,739 120,674
Total NHI shareholders’ equity before treasury stock 2,859,579 2,917,881 Common stock held in treasury, at cost—223,697,388 shares as of March 31, 2015 and
225,383,396 shares as of September 30, 2015 (151,805) (156,221)
Total NHI shareholders’ equity 2,707,774 2,761,660
Noncontrolling interests 37,172 33,276 Total equity 2,744,946 2,794,936
Total liabilities and equity ¥ 41,783,236 ¥ 43,960,331
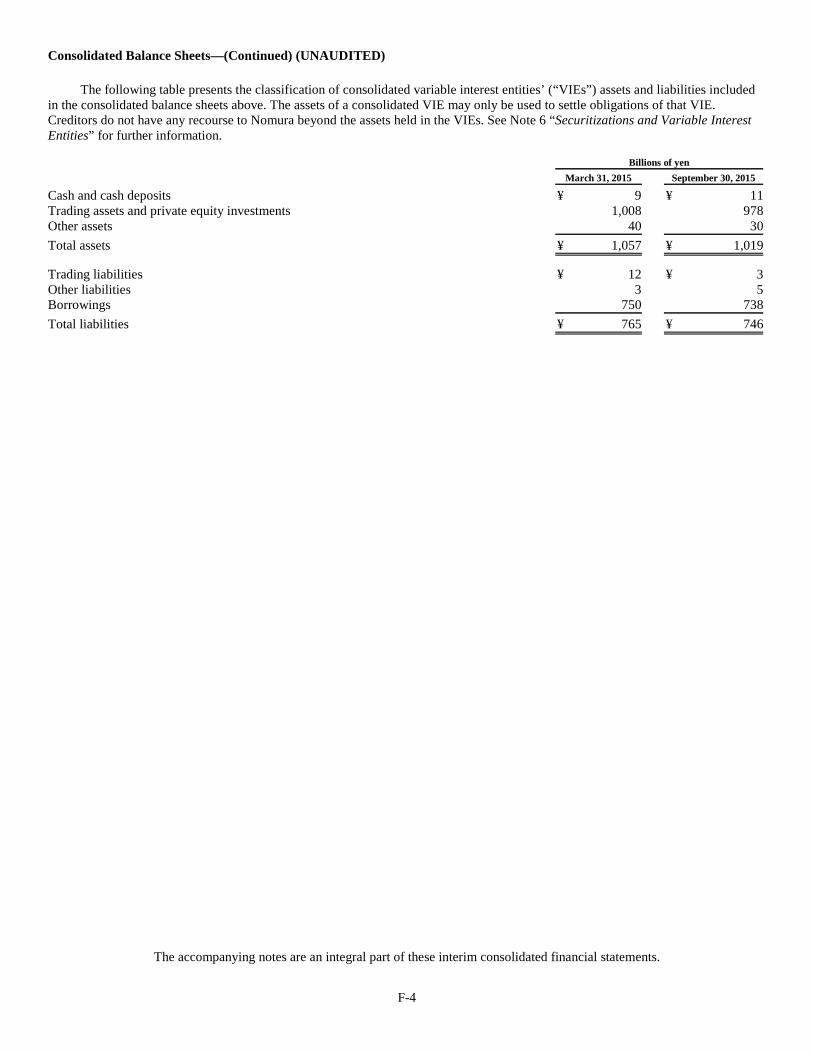
F-4
Consolidated Balance Sheets—(Continued) (UNAUDITED)
The following table presents the classification of consolidated variable interest entities’ (“VIEs”) assets and liabilities included in the consolidated balance sheets above. The assets of a consolidated VIE may only be used to settle obligations of that VIE. Creditors do not have any recourse to Nomura beyond the assets held in the VIEs. See Note 6 “Securitizations and Variable Interest Entities” for further information.
Billions of yen
March 31, 2015
September 30, 2015
Cash and cash deposits ¥ 9 ¥ 11 Trading assets and private equity investments 1,008 978 Other assets 40 30
Total assets ¥ 1,057 ¥ 1,019
Trading liabilities ¥ 12 ¥ 3 Other liabilities 3 5 Borrowings 750 738
Total liabilities ¥ 765 ¥ 746
The accompanying notes are an integral part of these interim consolidated financial statements.
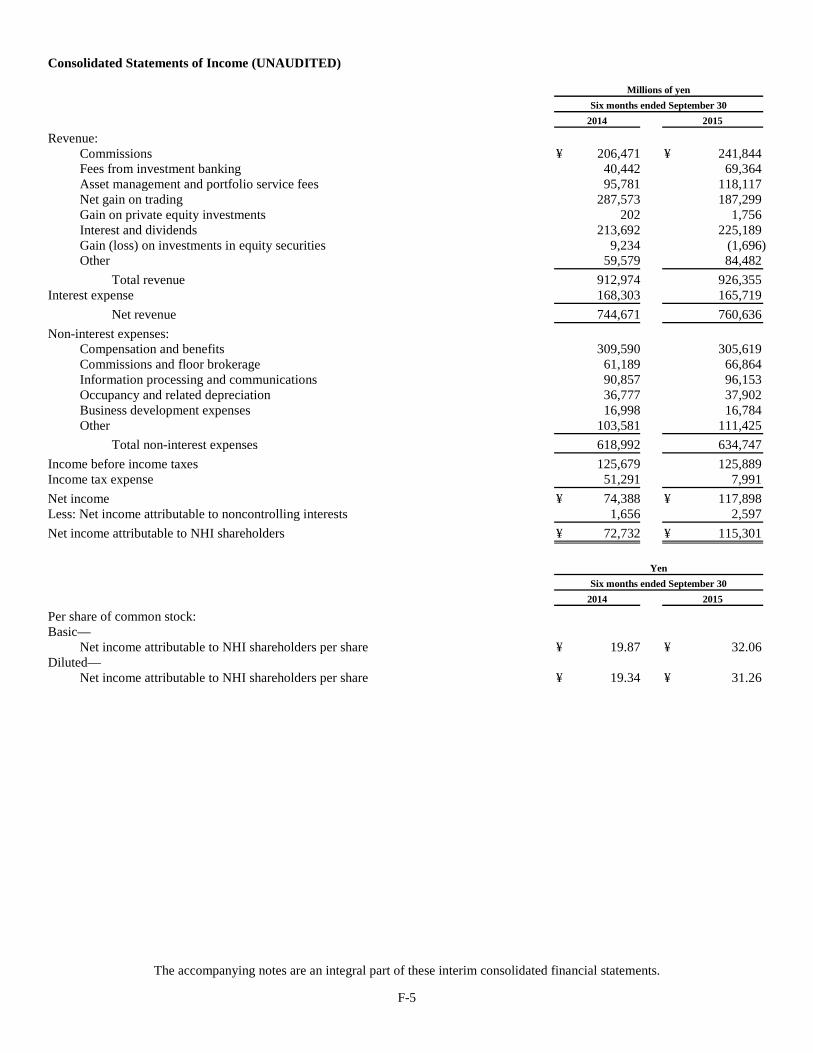
F-5
Consolidated Statements of Income (UNAUDITED)
Millions of yen
Six months ended September 30
2014
2015
Revenue:
Commissions ¥ 206,471 ¥ 241,844 Fees from investment banking 40,442 69,364 Asset management and portfolio service fees 95,781 118,117 Net gain on trading 287,573 187,299 Gain on private equity investments 202 1,756 Interest and dividends 213,692 225,189 Gain (loss) on investments in equity securities 9,234 (1,696) Other 59,579 84,482
Total revenue 912,974 926,355 Interest expense 168,303 165,719
Net revenue 744,671 760,636
Non-interest expenses:
Compensation and benefits 309,590 305,619 Commissions and floor brokerage 61,189 66,864 Information processing and communications 90,857 96,153 Occupancy and related depreciation 36,777 37,902 Business development expenses 16,998 16,784 Other 103,581 111,425
Total non-interest expenses 618,992 634,747
Income before income taxes 125,679 125,889 Income tax expense 51,291 7,991
Net income ¥ 74,388 ¥ 117,898 Less: Net income attributable to noncontrolling interests 1,656 2,597
Net income attributable to NHI shareholders ¥ 72,732 ¥ 115,301
Yen
Six months ended September 30
2014
2015
Per share of common stock:
Basic—
Net income attributable to NHI shareholders per share ¥ 19.87 ¥ 32.06 Diluted—
Net income attributable to NHI shareholders per share ¥ 19.34 ¥ 31.26
The accompanying notes are an integral part of these interim consolidated financial statements.
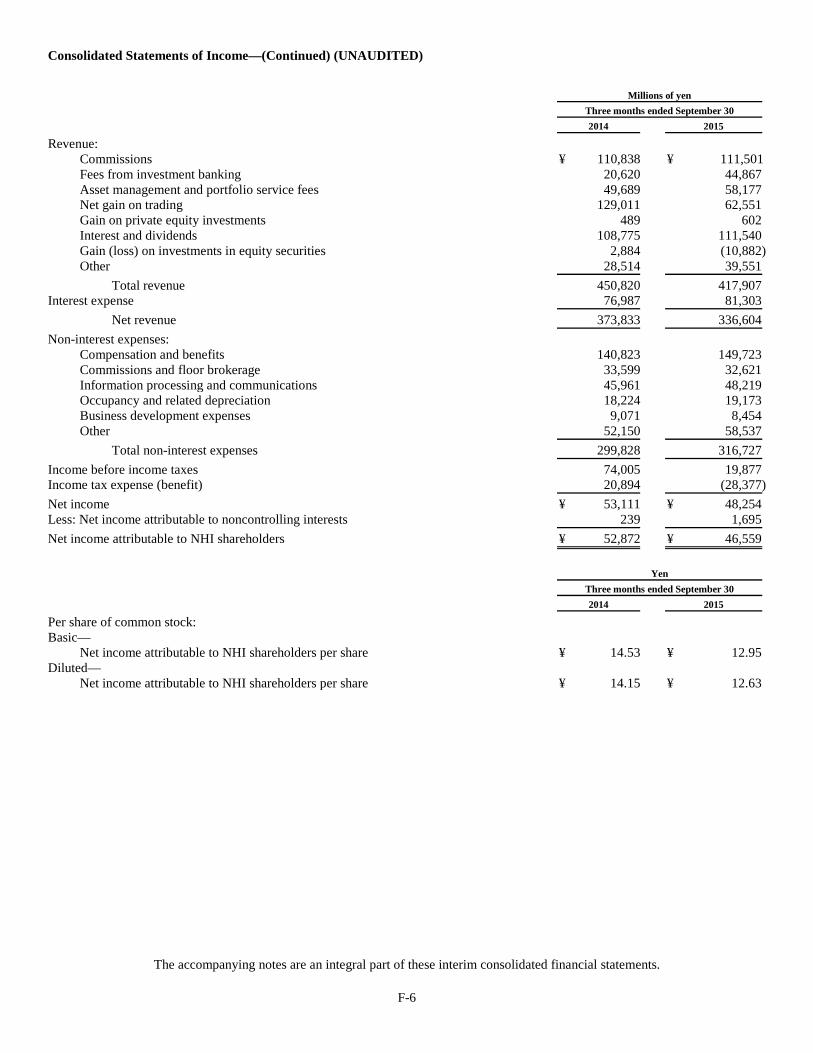
F-6
Consolidated Statements of Income—(Continued) (UNAUDITED)
Millions of yen
Three months ended September 30
2014
2015
Revenue:
Commissions ¥ 110,838 ¥ 111,501 Fees from investment banking 20,620 44,867 Asset management and portfolio service fees 49,689 58,177 Net gain on trading 129,011 62,551 Gain on private equity investments 489 602 Interest and dividends 108,775 111,540 Gain (loss) on investments in equity securities 2,884 (10,882) Other 28,514 39,551
Total revenue 450,820 417,907 Interest expense 76,987 81,303
Net revenue 373,833 336,604
Non-interest expenses:
Compensation and benefits 140,823 149,723 Commissions and floor brokerage 33,599 32,621 Information processing and communications 45,961 48,219 Occupancy and related depreciation 18,224 19,173 Business development expenses 9,071 8,454 Other 52,150 58,537
Total non-interest expenses 299,828 316,727
Income before income taxes 74,005 19,877 Income tax expense (benefit) 20,894 (28,377)
Net income ¥ 53,111 ¥ 48,254 Less: Net income attributable to noncontrolling interests 239 1,695
Net income attributable to NHI shareholders ¥ 52,872 ¥ 46,559
Yen
Three months ended September 30
2014
2015
Per share of common stock:
Basic—
Net income attributable to NHI shareholders per share ¥ 14.53 ¥ 12.95 Diluted—
Net income attributable to NHI shareholders per share ¥ 14.15 ¥ 12.63
The accompanying notes are an integral part of these interim consolidated financial statements.
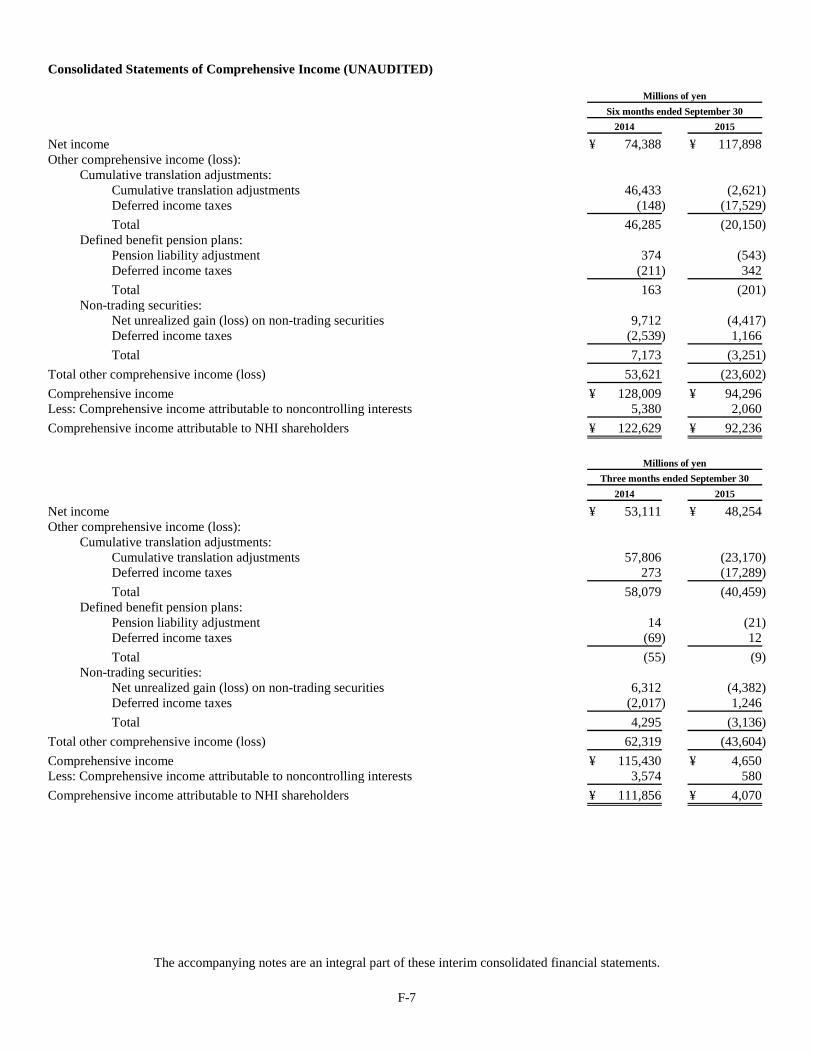
F-7
Consolidated Statements of Comprehensive Income (UNAUDITED)
Millions of yen
Six months ended September 30
2014
2015
Net income ¥ 74,388 ¥ 117,898 Other comprehensive income (loss):
Cumulative translation adjustments:
Cumulative translation adjustments 46,433 (2,621) Deferred income taxes (148) (17,529)
Total 46,285 (20,150) Defined benefit pension plans:
Pension liability adjustment 374 (543) Deferred income taxes (211) 342
Total 163 (201) Non-trading securities:
Net unrealized gain (loss) on non-trading securities 9,712 (4,417) Deferred income taxes (2,539) 1,166
Total 7,173 (3,251)
Total other comprehensive income (loss) 53,621 (23,602)
Comprehensive income ¥ 128,009 ¥ 94,296 Less: Comprehensive income attributable to noncontrolling interests 5,380 2,060
Comprehensive income attributable to NHI shareholders ¥ 122,629 ¥ 92,236
Millions of yen
Three months ended September 30
2014
2015
Net income ¥ 53,111 ¥ 48,254 Other comprehensive income (loss):
Cumulative translation adjustments:
Cumulative translation adjustments 57,806 (23,170) Deferred income taxes 273 (17,289)
Total 58,079 (40,459) Defined benefit pension plans:
Pension liability adjustment 14 (21) Deferred income taxes (69) 12
Total (55) (9) Non-trading securities:
Net unrealized gain (loss) on non-trading securities 6,312 (4,382) Deferred income taxes (2,017) 1,246
Total 4,295 (3,136)
Total other comprehensive income (loss) 62,319 (43,604)
Comprehensive income ¥ 115,430 ¥ 4,650 Less: Comprehensive income attributable to noncontrolling interests 3,574 580
Comprehensive income attributable to NHI shareholders ¥ 111,856 ¥ 4,070
The accompanying notes are an integral part of these interim consolidated financial statements.
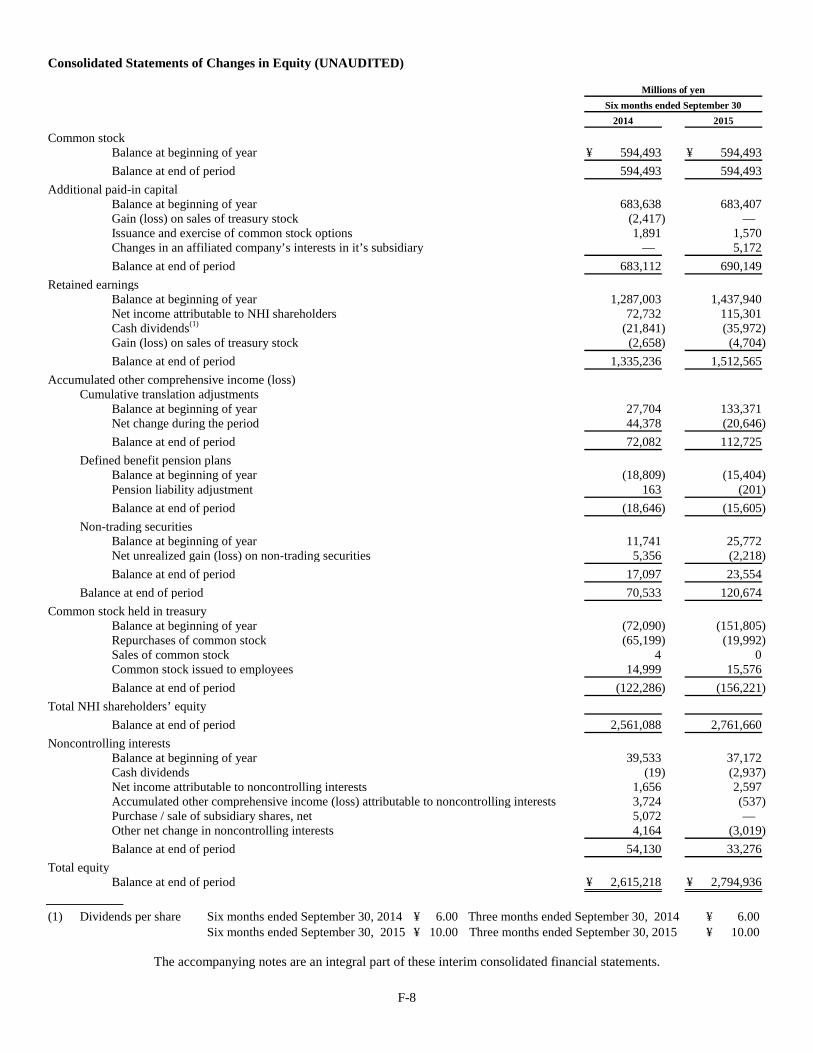
F-8
Consolidated Statements of Changes in Equity (UNAUDITED)
Millions of yen
Six months ended September 30
2014
2015
Common stock Balance at beginning of year ¥ 594,493 ¥ 594,493 Balance at end of period 594,493 594,493
Additional paid-in capital Balance at beginning of year 683,638 683,407 Gain (loss) on sales of treasury stock (2,417) — Issuance and exercise of common stock options 1,891 1,570 Changes in an affiliated company’s interests in it’s subsidiary — 5,172 Balance at end of period 683,112 690,149
Retained earnings Balance at beginning of year 1,287,003 1,437,940 Net income attributable to NHI shareholders 72,732 115,301 Cash dividends(1) (21,841) (35,972) Gain (loss) on sales of treasury stock (2,658) (4,704) Balance at end of period 1,335,236 1,512,565
Accumulated other comprehensive income (loss) Cumulative translation adjustments
Balance at beginning of year 27,704 133,371 Net change during the period 44,378 (20,646) Balance at end of period 72,082 112,725
Defined benefit pension plans Balance at beginning of year (18,809) (15,404) Pension liability adjustment 163 (201) Balance at end of period (18,646) (15,605)
Non-trading securities Balance at beginning of year 11,741 25,772 Net unrealized gain (loss) on non-trading securities 5,356 (2,218) Balance at end of period 17,097 23,554
Balance at end of period 70,533 120,674 Common stock held in treasury
Balance at beginning of year (72,090) (151,805) Repurchases of common stock (65,199) (19,992) Sales of common stock 4 0 Common stock issued to employees 14,999 15,576 Balance at end of period (122,286) (156,221)
Total NHI shareholders’ equity Balance at end of period 2,561,088 2,761,660
Noncontrolling interests Balance at beginning of year 39,533 37,172 Cash dividends (19) (2,937) Net income attributable to noncontrolling interests 1,656 2,597 Accumulated other comprehensive income (loss) attributable to noncontrolling interests 3,724 (537) Purchase / sale of subsidiary shares, net 5,072 — Other net change in noncontrolling interests 4,164 (3,019) Balance at end of period 54,130 33,276
Total equity Balance at end of period ¥ 2,615,218 ¥ 2,794,936
(1) Dividends per share Six months ended September 30, 2014 ¥ 6.00 Three months ended September 30, 2014 ¥ 6.00 Six months ended September 30, 2015 ¥ 10.00 Three months ended September 30, 2015 ¥ 10.00
The accompanying notes are an integral part of these interim consolidated financial statements.
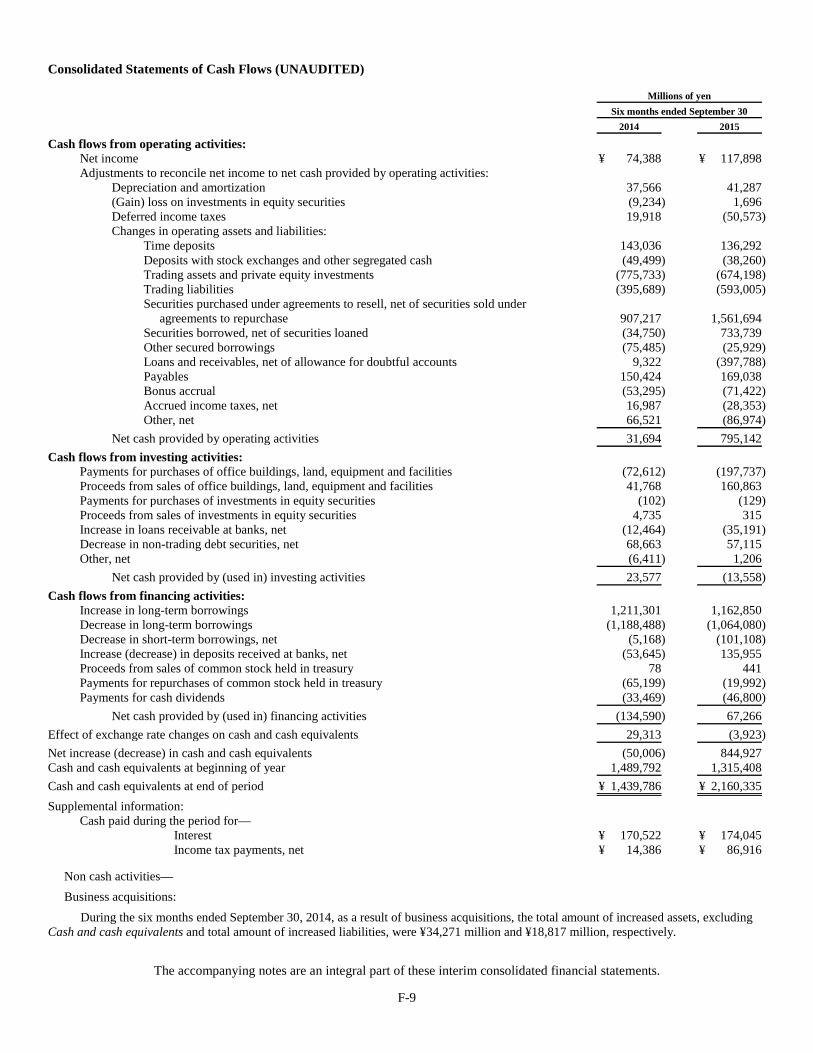
F-9
Consolidated Statements of Cash Flows (UNAUDITED)
Millions of yen
Six months ended September 30
2014
2015
Cash flows from operating activities: Net income ¥ 74,388 ¥ 117,898 Adjustments to reconcile net income to net cash provided by operating activities:
Depreciation and amortization 37,566 41,287 (Gain) loss on investments in equity securities (9,234) 1,696 Deferred income taxes 19,918 (50,573) Changes in operating assets and liabilities:
Time deposits 143,036 136,292 Deposits with stock exchanges and other segregated cash (49,499) (38,260) Trading assets and private equity investments (775,733) (674,198) Trading liabilities (395,689) (593,005) Securities purchased under agreements to resell, net of securities sold under
agreements to repurchase 907,217 1,561,694 Securities borrowed, net of securities loaned (34,750) 733,739 Other secured borrowings (75,485) (25,929) Loans and receivables, net of allowance for doubtful accounts 9,322 (397,788) Payables 150,424 169,038 Bonus accrual (53,295) (71,422) Accrued income taxes, net 16,987 (28,353) Other, net 66,521 (86,974)
Net cash provided by operating activities 31,694 795,142 Cash flows from investing activities:
Payments for purchases of office buildings, land, equipment and facilities (72,612) (197,737) Proceeds from sales of office buildings, land, equipment and facilities 41,768 160,863 Payments for purchases of investments in equity securities (102) (129) Proceeds from sales of investments in equity securities 4,735 315 Increase in loans receivable at banks, net (12,464) (35,191) Decrease in non-trading debt securities, net 68,663 57,115 Other, net (6,411) 1,206
Net cash provided by (used in) investing activities 23,577 (13,558) Cash flows from financing activities:
Increase in long-term borrowings 1,211,301 1,162,850 Decrease in long-term borrowings (1,188,488) (1,064,080) Decrease in short-term borrowings, net (5,168) (101,108) Increase (decrease) in deposits received at banks, net (53,645) 135,955 Proceeds from sales of common stock held in treasury 78 441 Payments for repurchases of common stock held in treasury (65,199) (19,992) Payments for cash dividends (33,469) (46,800)
Net cash provided by (used in) financing activities (134,590) 67,266 Effect of exchange rate changes on cash and cash equivalents 29,313 (3,923) Net increase (decrease) in cash and cash equivalents (50,006) 844,927 Cash and cash equivalents at beginning of year 1,489,792 1,315,408 Cash and cash equivalents at end of period ¥ 1,439,786 ¥ 2,160,335 Supplemental information:
Cash paid during the period for— Interest ¥ 170,522 ¥ 174,045 Income tax payments, net ¥ 14,386 ¥ 86,916
Non cash activities— Business acquisitions:
During the six months ended September 30, 2014, as a result of business acquisitions, the total amount of increased assets, excluding Cash and cash equivalents and total amount of increased liabilities, were ¥34,271 million and ¥18,817 million, respectively.
The accompanying notes are an integral part of these interim consolidated financial statements.
F-10
Notes to the Interim Consolidated Financial Statements (UNAUDITED)
1. Summary of accounting policies: Description of business—
Nomura Holdings, Inc. (“Company”) and its broker-dealer, banking and other financial services subsidiaries provide investment, financing and related services to individual, institutional and government clients on a global basis. The Company and other entities in which it has a controlling financial interest are collectively referred to as “Nomura” within these consolidated financial statements.
Nomura operates its business through various divisions based upon the nature of specific products and services, its main client base and its management structure. Nomura reports operating results through three business segments: Retail, Asset Management and Wholesale.
In its Retail segment, Nomura provides investment consultation services mainly to individual clients in Japan. In its Asset Management segment, Nomura develops and manages investment trusts, and provides investment advisory services. In its Wholesale segment, Nomura engages in the sales and trading of debt and equity securities, derivatives, and currencies on a global basis, and provides investment banking services such as the underwriting of debt and equity securities as well as mergers and acquisitions and financial advice.
The accounting and financial reporting policies of Nomura conform to U.S. generally accepted accounting principles (“U.S. GAAP”) as applicable to broker dealers. A summary of the significant accounting policies applied by Nomura within these interim consolidated financial statements is provided within in the notes to the consolidated financial statements of Nomura’s annual report on Form 20-F for the year ended March 31, 2015 as filed on June 25, 2015.
New accounting pronouncements recently adopted— No new accounting pronouncements relevant to Nomura were adopted during the three months ended September 30, 2015.
The following new accounting pronouncements relevant to Nomura were adopted during the three months ended June 30, 2015:
Repurchase agreements and similar transactions In June 2014, the FASB issued amendments to ASC 860 “Transfers and Servicing” (“ASC 860”) through issuance of
Accounting Standards Updates (“ASU”) 2014-11 “Repurchase-to-Maturity Transactions, Repurchase Financings, and Disclosures” (“ASU 2014-11”). These amendments change the accounting for repurchase-to-maturity transactions which are repurchase agreements where the maturity of the financial assets transferred as collateral matches the maturity of the repurchase agreement. Under ASU 2014-11, all repurchase-to-maturity transactions are now accounted for as secured borrowing transactions in the same way as most other repurchase agreements rather than as a sale of the transferred financial assets and a separate forward commitment to repurchase the financial assets. The amendments also change the accounting for repurchase financing arrangements which are transactions involving the transfer of financial assets to a counterparty executed contemporaneously with a reverse repurchase agreement with the same counterparty. Under ASU 2014-11, all repurchase financings are now accounted for separately, which result in secured lending accounting for the reverse repurchase agreement.
ASU 2014-11 also amends ASC 860 by introducing new disclosure requirements regarding the remaining contractual maturity of repurchase agreements and securities lending transactions accounted for as secured borrowings and nature of underlying financial assets transferred, as well as new disclosure requirements regarding certain other transactions which involve the transfer of financial assets accounted for as sales and where Nomura, as transferor, retains substantially all of the exposure to the economic return on the transferred financial assets throughout the term of the transaction through an agreement entered into in contemplation of the original transfer.
F-11
Notes to the Interim Consolidated Financial Statements—(Continued) (UNAUDITED)
The amendments to the accounting treatment of repurchase-to-maturity transactions and repurchase financing arrangements are effective for interim or annual periods beginning after December 15, 2014 with early adoption prohibited. As of adoption date, the accounting for all outstanding repurchase-to-maturity transactions and repurchase financing arrangements is adjusted by means of a cumulative-effect adjustment to the balance sheet and retained earnings.
Nomura adopted these accounting amendments from January 1, 2015 and these amendments have not had a material impact on these consolidated financial statements.
The new disclosure requirements regarding transfers of financial assets which are accounted for as sales and where the transferor retains substantially all of the exposure of the transferred financial assets are effective for interim or annual periods beginning after December 15, 2014.
Nomura adopted these disclosure requirements from January 1, 2015. Because these amendments only enhance disclosures around the nature of these transactions rather than change the accounting treatment, they have not had a material impact on these consolidated financial statements.
The new disclosure requirements regarding the remaining contractual maturity of repurchase agreements and securities lending transactions accounted for as secured borrowings and nature of underlying financial assets transferred, are effective for annual periods beginning after December 15, 2014 and interim periods beginning after March 15, 2015.
The new disclosure requirements regarding the remaining contractual maturity of repurchase agreements and securities lending transactions accounted for as secured borrowings and nature of underlying financial assets transferred, are effective for annual periods beginning after December 15, 2014 and interim periods beginning after March 15, 2015.
See Note 3 “Derivative instruments and hedging activities” and Note 4 “Collateralized transactions” where these new disclosures have been provided.
Foreclosed mortgage loans In January 2014, the FASB issued amendments to ASC 310-40 “Receivables—Troubled Debt Restructurings by Creditors”
(“ASC 310-40”) through issuance of ASU 2014-04 “Reclassification of Residential Real Estate Collateralized Consumer Mortgage Loans upon Foreclosure” (“ASU 2014-04”). ASU 2014-04 expands ASC 310-40 to provide guidance on when an in substance repossession or foreclosure occurs, when a creditor is considered to have received physical possession of a residential real estate property collateralizing a consumer mortgage loan and introduces new disclosure requirements regarding foreclosed residential real estate property held by the creditor and consumer mortgage loans currently in foreclosure proceedings.
ASU 2014-04 is effective for annual periods, and interim periods within those annual periods, beginning after December 15, 2014 with early adoption permitted.
Nomura adopted ASU 2014-04 from April 1, 2015 and these amendments have not had a material impact on these consolidated financial statements.
Foreclosed government-guaranteed mortgage loans In August 2014, the FASB issued amendments to ASC 310-40 through issuance of ASU 2014-14 “Classification of Certain
Government-Guaranteed Mortgage Loans upon Foreclosure” (“ASU 2014-14”). ASU 2014-14 expands ASC 310-40 to provide guidance on when a creditor should recognize a separate receivable instead of real estate upon foreclosure of a government-guaranteed mortgage loan.
F-12
Notes to the Interim Consolidated Financial Statements—(Continued) (UNAUDITED)
ASU 2014-14 is effective for annual periods, and interim periods within those annual periods, beginning after December 15, 2014 with early adoption permitted and may be adopted using either a modified retrospective approach or prospectively.
Nomura adopted ASU 2014-14 from April 1, 2015 and these amendments have not had a material impact on these consolidated financial statements.
Reporting discontinued operations In April 2014, the FASB issued amendments to ASC 205 “Presentation of Financial Statements” and ASC 360 “Property, Plant
and Equipment” (“ASC 360”) through issuance of ASU 2014-08 “Reporting Discontinued Operations and Disclosures of Disposals of Components of an Entity” (“ASU 2014-08”). ASU 2014-08 changes the criteria for discontinued operations reporting with the intention of less disposals qualifying and also introduces new presentation and disclosure requirements.
ASU 2014-08 is effective prospectively for all disposals or expected disposals classified as held for sale that occur within annual periods beginning on or after December 15, 2014 and interim periods within those years. Early adoption is permitted, but only for disposals or expected disposals classified as held for sale that have not been reported in financial statements previously issued or available for issue.
Nomura adopted ASU 2014-08 from April 1, 2015 and these amendments have not had a material impact on these consolidated financial statements.
Future accounting developments— The following new accounting pronouncements relevant to Nomura will be adopted in future periods:
Revenue recognition In May 2014, the FASB issued ASC 606 “Revenue from Contracts with Customers” (“ASC 606”) as well as amendments to
other pronouncements, including ASC 350 “Intangibles—Goodwill and Other”, ASC 360, and ASC 605-35 “Revenue Recognition—Construction-Type and Production-Type Contracts” through issuance of ASU 2014-09 “Revenue from Contracts with Customers” (“ASU 2014-09”). ASU 2014-09 replaces existing revenue recognition guidance in ASC 605 “Revenue Recognition” and certain other industry-specific revenue recognition guidance, and specifies the accounting for certain costs to obtain or fulfill a contract with a customer and provides recognition and measurement guidance in relation to sales of non-financial assets. The core principle of ASU 2014-09 is to account for the transfer of goods or services to customers at an amount that reflects the consideration to which an entity expects to be entitled in exchange for those goods or services. It provides guidance on how to achieve this core principle, including how to identify contracts with customers and separate performance obligations in the contract, how to determine and allocate the transaction price to such performance obligations and how to recognize revenue when a performance obligation has been satisfied.
In August 2015, the FASB issued further amendments to ASC 606 through issuance of ASU 2015-14 “Deferral of the Effective Date” (“ASU 2015-14”). ASU 2015-14 defers the effective date of the guidance in ASU 2014-09 for all entities by one year. As a result of the deferral, ASU 2014-09 is now effective for annual periods, and interim periods within those annual periods, beginning after December 15, 2017. Early adoption is permitted only for annual periods, and interim periods within those annual periods, beginning after December 15, 2016.
Nomura currently plans to adopt ASU 2014-09 from April 1, 2018 and is currently evaluating the potential impact these amendments may have on these consolidated financial statements.
F-13
Notes to the Interim Consolidated Financial Statements—(Continued) (UNAUDITED)
Stock compensation In June 2014, the FASB issued amendments to ASC 718 “Compensation—Stock Compensation” (“ASC 718”) through issuance
of ASU 2014-12 “Accounting for Share-Based Payments When the Terms of an Award Provide That a Performance Target Could Be Achieved after the Requisite Service Period” (“ASU 2014-12”). ASU 2014-12 requires a performance target that affects vesting and that could be achieved after the requisite service period be accounted for as a performance condition based on the existing guidance in ASC 718 rather than as a nonvesting condition that affects the grant-date fair value of the award.
ASU 2014-12 is effective for annual periods, and interim periods within those annual periods, beginning after December 15, 2015 with early adoption permitted. ASU 2014-12 may be applied either by prospectively or retrospectively.
Nomura currently plans to adopt ASU 2014-12 from April 1, 2016 and does not expect these amendments to have a material impact on these consolidated financial statements.
Collateralized financing entities In August 2014, the FASB issued amendments to ASC 810 “Consolidation” (“ASC 810”) through issuance of ASU 2014-13
“Measuring the Financial Assets and the Financial Liabilities of a Consolidated Collateralized Financing Entity” (“ASU 2014-13”) which provides an alternative to ASC 820 “Fair Value Measurements and Disclosures” (“ASC 820”) for measuring the fair value of financial assets and the financial liabilities of a consolidated variable interest entity which meet the definition of a collateralized financing entity.
When the measurement alternative of ASU 2014-13 is elected, both the financial assets and financial liabilities of a consolidated collateralized financing entity are measured using whichever fair value measurement is more observable, in order to eliminate differences that may arise when the fair value of financial assets and financial liabilities is determined separately.
ASU 2014-13 is effective for annual periods, and interim periods within those annual periods, beginning after December 15, 2015 with early adoption permitted at the beginning of an annual period.
Nomura will adopt ASU 2014-13 from April 1, 2016 and is currently evaluating the potential impact these amendments may have on these consolidated financial statements.
Consolidation In February 2015, the FASB issued amendments to ASC 810 through issuance of ASU 2015-02 “Amendments to the
Consolidation Analysis” (“ASU 2015-02”) which aims to simplify the existing complex guidance within ASC 810 for determining whether certain legal entities such as limited partnerships and similar entities should be consolidated. In particular, ASU 2015-02:
• Rescinds the indefinite deferral of FASB Statement No. 167 “Amendments to FASB Interpretation No. 46(R)” introduced by ASU 2010-10 “Amendments for Certain Investment Funds” applied to certain investment companies, money market funds, qualifying real estate funds and similar entities;
• Provides an exception from consolidation for certain registered money market funds and similar entities; • Modifies the evaluation of whether limited partnerships and similar legal entities are variable interest entities or voting
interest entities under ASC 810; • Modifies how fee arrangements and related party relationships should be considered in determining whether a variable
interest entity should be consolidated; and • Introduces new disclosure requirements regarding financial support arrangements with certain registered money market
funds and similar entities to which the exception from consolidation has been applied.
ASU 2015-02 is effective for annual periods, and for interim periods within those annual periods, beginning after December 15, 2015 with early adoption permitted, including adoption in an interim period.
F-14
Notes to the Interim Consolidated Financial Statements—(Continued) (UNAUDITED)
Nomura currently plans to adopt ASU 2015-02 from April 1, 2016 and is currently evaluating the potential impact these amendments may have on these consolidated financial statements.
Presentation of debt issuance costs In April 2015, the FASB issued amendments to ASC 835-30 “Interest—Imputation of Interest” (“ASC 835-30”) through issuance of
ASU 2015-03 “Simplifying the Presentation of Debt Issuance Costs” (“ASU 2015-03”). ASU 2015-03 requires that debt issuance costs related to a recognized debt liability, which are currently presented as a separate asset under ASC 835-30, be presented as a direct deduction from the carrying amount of that debt liability, consistent with debt discounts.
In August 2015, the FASB issued further amendments to ASC 835-30 through issuance of ASU 2015-15 “Presentation and Subsequent Measurement of Debt Issuance Costs Associated with Line-of-Credit Arrangements” (“ASU 2015-15”). ASU 2015-15 clarifies the SEC staff’s position on presentation and measurement of debt issuance costs associated with line-of-credit arrangements, which is to permit an entity to defer and present these costs as assets and subsequently amortize them ratably over the term of the line-of-credit arrangement.
ASU 2015-03 and ASU 2015-15 are effective for annual periods, and for interim periods within those annual periods, beginning after December 15, 2015 with early adoption permitted.
Nomura currently plans to adopt ASU 2015-03 and ASU 2015-15 from April 1, 2016 and does not expect these amendments to have a material impact on these consolidated financial statements.
Customers’ accounting for fees paid in a cloud computing arrangement In April 2015, the FASB issued amendments to ASC 350-40 “Intangibles—Goodwill and Other—Internal-Use Software” through
issuance of ASU 2015-05 “Customer’s Accounting for Fees Paid in a Cloud Computing Arrangement” (“ASU 2015-05”). ASU 2015-05 provides guidance on determining whether cloud computing arrangements, namely where software, platforms, infrastructure or similar hosting arrangements are provided by a third party, contain a software license that should be accounted for in the same way as the acquisition of other software licenses.
ASU 2015-05 is effective for annual periods, and interim periods within those annual periods, beginning after December 15, 2015 with early adoption permitted.
Nomura currently plans to adopt ASU 2015-05 from April 1, 2016 and does not expect these amendments to have a material impact on these consolidated financial statements.
Disclosures for investments in certain entities that calculate net asset value per share (or its equivalent) In May 2015, the FASB issued amendments to ASC 820 through issuance of ASU 2015-07 “Disclosures for Investments in Certain
Entities That Calculate Net Asset Value per Share (or Its Equivalent)” (“ASU 2015-07”). ASU 2015-07 removes the requirement to report the fair value of investments for which fair value is estimated using net asset value as a practical expedient within the fair value hierarchy and also revises certain other disclosure requirements for these types of investment.
ASU 2015-07 is effective for annual periods, and interim periods within those annual periods, beginning after December 15, 2015 with early adoption permitted.
Nomura currently plans to adopt ASU 2015-07 from April 1, 2016. Because these amendments only remove certain disclosure requirements around investments which are measured at fair value using net asset value as a practical expedient, rather than change when such practical expedient can be used, Nomura does not expect these amendments to have a material impact on these consolidated financial statements.
Simplification of the accounting for measurement-period adjustments In September 2015, the FASB issued amendments to ASC 805 “Business Combinations” through issuance of ASU 2015-16
“Simplifying the Accounting for Measurement-Period Adjustments” (“ASU 2015-16”). ASU 2015-16 eliminates the requirement to retrospectively account for the adjustments made to provisional amounts recognized in a business combination.
ASU 2015-16 is effective for annual periods, and interim periods within those annual periods, beginning after December 15, 2015 with early adoption permitted.
Nomura currently plans to adopt ASU 2015-16 from April 1, 2016. Because these amendments will only affect future business combinations which occur on or after the adoption date, Nomura does not expect these amendments to have a material impact on these consolidated financial statements.
F-15
Notes to the Interim Consolidated Financial Statements—(Continued) (UNAUDITED)
2. Fair value measurements: The fair value of financial instruments
A significant amount of Nomura’s financial instruments are carried at fair value. Financial assets carried at fair value on a recurring basis are reported in the consolidated balance sheets within Trading assets and private equity investments, Loans and receivables, Collateralized agreements and Other assets. Financial liabilities carried at fair value on a recurring basis are reported within Trading liabilities, Short-term borrowings, Payables and deposits, Collateralized financing, Long-term borrowings and Other liabilities.
Other financial assets and financial liabilities are measured at fair value on a nonrecurring basis, where the primary measurement basis is not fair value but where fair value is used in specific circumstances after initial recognition, such as to measure impairment.
In all cases, fair value is determined in accordance with ASC 820 which defines fair value as the amount that would be exchanged to sell a financial asset or transfer a financial liability in an orderly transaction between market participants at the measurement date. It assumes that the transaction occurs in Nomura’s principal market, or in the absence of the principal market, the most advantageous market for the relevant financial assets or financial liabilities.
Fair value is usually determined on an individual financial instrument basis consistent with the unit of account of the financial instrument. However, certain financial instruments managed on a portfolio basis are valued as a portfolio, namely based on the price that would be received to sell a net long position (i.e. a net financial asset) or transfer a net short position (i.e. a net financial liability) consistent with how market participants would price the net risk exposure at the measurement date.
Financial assets carried at fair value also include investments in certain funds where, as a practical expedient, fair value is determined on the basis of net asset value per share (“NAV per share”) if the NAV per share is calculated in accordance with certain industry standard principles.
Increases and decreases in the fair value of assets and liabilities will significantly impact Nomura’s position, performance, liquidity and capital resources. As explained below, valuation techniques applied contain inherent uncertainties and Nomura is unable to predict the accurate impact of future developments in the market. Where appropriate, Nomura uses economic hedging strategies to mitigate its risk, although these hedges are also subject to unpredictable movements in the market.
Valuation methodology for financial instruments carried at fair value on a recurring basis The fair value of financial instruments is based on quoted market prices including market indices, broker or dealer quotations or
an estimation by management of the expected exit price under current market conditions. Various financial instruments, including cash instruments and over-the-counter (“OTC”) contracts, have bid and offer prices that are observable in the market. These are measured at the point within the bid-offer range which best represents Nomura’s estimate of fair value. Where quoted market prices or broker or dealer quotations are not available, prices for similar instruments or valuation pricing models are considered in the determination of fair value.
Where quoted prices are available in active markets, no valuation adjustments are taken to modify the fair value of assets or liabilities marked using such prices. Other instruments may be measured using valuation techniques, such as valuation pricing models incorporating observable parameters, unobservable parameters or a combination of both. Valuation pricing models use parameters which would be considered by market participants in valuing similar financial instruments.
Valuation pricing models and their underlying assumptions impact the amount and timing of unrealized and realized gains and losses recognized, and the use of different valuation pricing models or underlying assumptions could produce different financial results. Valuation uncertainty results from a variety of factors, including the valuation technique or model selected, the quantitative assumptions used within the valuation model, the inputs into the model, as well as other factors. Valuation adjustments are used to reflect the assessment of this uncertainty. Common valuation adjustments include model reserves, credit adjustments, close-out adjustments, and other appropriate instrument-specific adjustments, such as those to reflect transfer or sale restrictions.
The level of adjustments is largely judgmental and is based on an assessment of the factors that management believe other market participants would use in determining the fair value of similar financial instruments. The type of adjustments taken, the methodology for the calculation of these adjustments, and the inputs for these calculations are reassessed periodically to reflect current market practice and the availability of new information.
F-16
Notes to the Interim Consolidated Financial Statements—(Continued) (UNAUDITED)
For example, the fair value of certain financial instruments includes adjustments for credit risk; both with regards to counterparty credit risk on positions held and Nomura’s own creditworthiness on positions issued. Credit risk on financial assets is significantly mitigated by credit enhancements such as collateral and netting arrangements. Any net credit exposure is measured using available and applicable inputs for the relevant counterparty. The same approach is used to measure the credit exposure on Nomura’s financial liabilities as is used to measure counterparty credit risk on Nomura’s financial assets.
Such valuation pricing models are calibrated to the market on a regular basis and inputs used are adjusted for current market conditions and risks. The Global Model Validation Group (“MVG”) within Nomura’s Risk Management Department reviews pricing models and assesses model appropriateness and consistency independently of the front office. The model reviews consider a number of factors about a model’s suitability for valuation and sensitivity of a particular product. Valuation models are calibrated to the market on a periodic basis by comparison to observable market pricing, comparison with alternative models and analysis of risk profiles.
As explained above, any changes in fixed income, equity, foreign exchange and commodity markets can impact Nomura’s estimates of fair value in the future, potentially affecting trading gains and losses. Where financial contracts have longer maturity dates, Nomura’s estimates of fair value may involve greater subjectivity due to the lack of transparent market data.
Fair value hierarchy All financial instruments measured at fair value, including those carried at fair value using the fair value option, have been
categorized into a three-level hierarchy (“fair value hierarchy”) based on the transparency of valuation inputs used by Nomura to estimate fair value. A financial instrument is classified in the fair value hierarchy based on the lowest level of input that is significant to the fair value measurement of the financial instrument. The three levels of the fair value hierarchy are defined as follows, with Level 1 representing the most transparent inputs and Level 3 representing the least transparent inputs:
Level 1: Unadjusted quoted prices for identical financial instruments in active markets accessible by Nomura at the measurement date. Level 2: Quoted prices in inactive markets or prices containing other inputs which are observable, either directly or indirectly. Valuation
techniques using observable inputs reflect assumptions used by market participants in pricing financial instruments and are based on data obtained from independent market sources at the measurement date.
Level 3: Unobservable inputs that are significant to the fair value measurement of the financial instrument. Valuation techniques using
unobservable inputs reflect management’s assumptions about the estimates used by other market participants in valuing similar financial instruments. These valuation techniques are developed based on the best available information at the measurement date.
The availability of inputs observable in the market varies by product and can be affected by a variety of factors. Significant factors include, but are not restricted to the prevalence of similar products in the market, especially for customized products, how established the product is in the market, for example, whether it is a new product or is relatively mature, and the reliability of information provided in the market which would depend, for example, on the frequency and volume of current data. A period of significant change in the market may reduce the availability of observable data. Under such circumstances, financial instruments may be reclassified into a lower level in the fair value hierarchy.
Significant judgments used in determining the classification of financial instruments include the nature of the market in which the product would be traded, the underlying risks, the type and liquidity of market data inputs and the nature of observed transactions for similar instruments.
Where valuation models include the use of parameters which are less observable or unobservable in the market, significant management judgment is used in establishing fair value. The valuations for Level 3 financial instruments, therefore, involve a greater degree of judgment than those valuations for Level 1 or Level 2 financial instruments.
Certain criteria management use to determine whether a market is active or inactive include the number of transactions, the frequency that pricing is updated by other market participants, the variability of price quotes among market participants, and the amount of publicly available information.
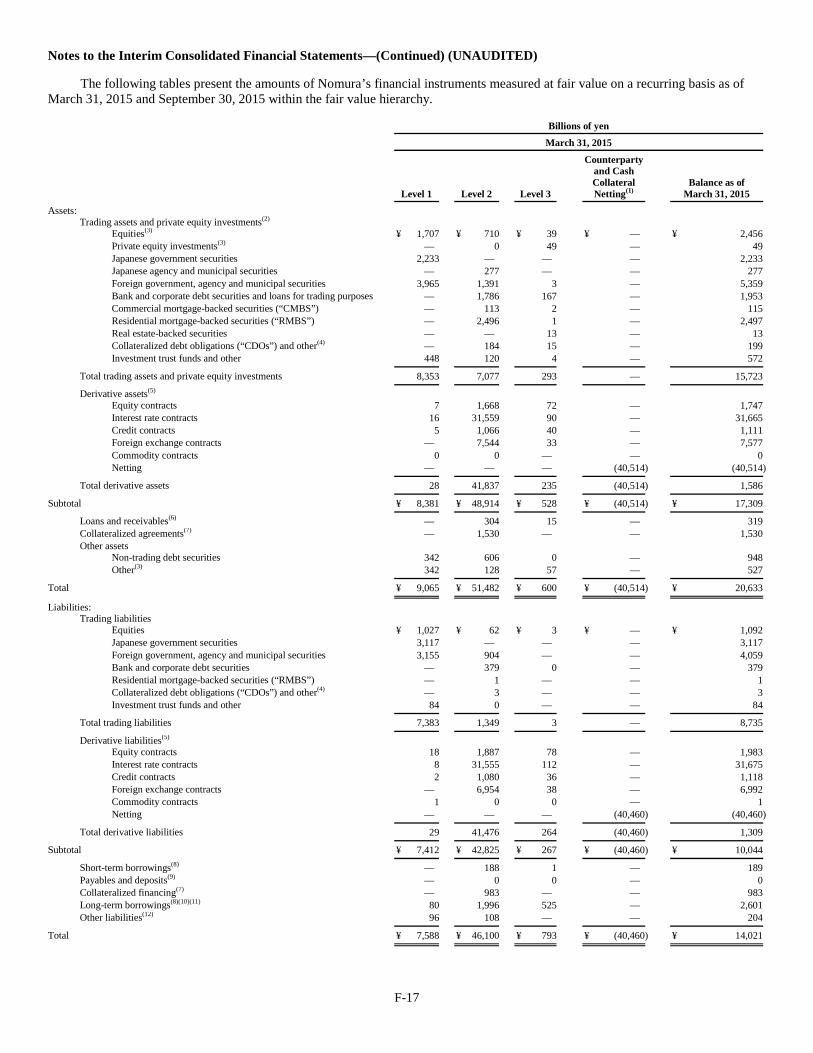
F-17
Notes to the Interim Consolidated Financial Statements—(Continued) (UNAUDITED)
The following tables present the amounts of Nomura’s financial instruments measured at fair value on a recurring basis as of March 31, 2015 and September 30, 2015 within the fair value hierarchy.
Billions of yen
March 31, 2015
Level 1
Level 2
Level 3
Counterparty and Cash Collateral Netting(1)
Balance as of March 31, 2015
Assets:
Trading assets and private equity investments(2)
Equities(3) ¥ 1,707 ¥ 710 ¥ 39 ¥ — ¥ 2,456 Private equity investments(3) — 0 49 — 49 Japanese government securities 2,233 — — — 2,233 Japanese agency and municipal securities — 277 — — 277 Foreign government, agency and municipal securities 3,965 1,391 3 — 5,359 Bank and corporate debt securities and loans for trading purposes — 1,786 167 — 1,953 Commercial mortgage-backed securities (“CMBS”) — 113 2 — 115 Residential mortgage-backed securities (“RMBS”) — 2,496 1 — 2,497 Real estate-backed securities — — 13 — 13 Collateralized debt obligations (“CDOs”) and other(4) — 184 15 — 199 Investment trust funds and other 448 120 4 — 572
Total trading assets and private equity investments 8,353 7,077 293 — 15,723
Derivative assets(5)
Equity contracts 7 1,668 72 — 1,747 Interest rate contracts 16 31,559 90 — 31,665 Credit contracts 5 1,066 40 — 1,111 Foreign exchange contracts — 7,544 33 — 7,577 Commodity contracts 0 0 — — 0 Netting — — — (40,514) (40,514)
Total derivative assets 28 41,837 235 (40,514) 1,586
Subtotal ¥ 8,381 ¥ 48,914 ¥ 528 ¥ (40,514) ¥ 17,309
Loans and receivables(6) — 304 15 — 319 Collateralized agreements(7) — 1,530 — — 1,530 Other assets
Non-trading debt securities 342 606 0 — 948 Other(3) 342 128 57 — 527
Total ¥ 9,065 ¥ 51,482 ¥ 600 ¥ (40,514) ¥ 20,633
Liabilities:
Trading liabilities
Equities ¥ 1,027 ¥ 62 ¥ 3 ¥ — ¥ 1,092 Japanese government securities 3,117 — — — 3,117 Foreign government, agency and municipal securities 3,155 904 — — 4,059 Bank and corporate debt securities — 379 0 — 379 Residential mortgage-backed securities (“RMBS”) — 1 — — 1 Collateralized debt obligations (“CDOs”) and other(4) — 3 — — 3 Investment trust funds and other 84 0 — — 84
Total trading liabilities 7,383 1,349 3 — 8,735
Derivative liabilities(5)
Equity contracts 18 1,887 78 — 1,983 Interest rate contracts 8 31,555 112 — 31,675 Credit contracts 2 1,080 36 — 1,118 Foreign exchange contracts — 6,954 38 — 6,992 Commodity contracts 1 0 0 — 1 Netting — — — (40,460) (40,460)
Total derivative liabilities 29 41,476 264 (40,460) 1,309
Subtotal ¥ 7,412 ¥ 42,825 ¥ 267 ¥ (40,460) ¥ 10,044
Short-term borrowings(8) — 188 1 — 189 Payables and deposits(9) — 0 0 — 0 Collateralized financing(7) — 983 — — 983 Long-term borrowings(8)(10)(11) 80 1,996 525 — 2,601 Other liabilities(12) 96 108 — — 204
Total ¥ 7,588 ¥ 46,100 ¥ 793 ¥ (40,460) ¥ 14,021
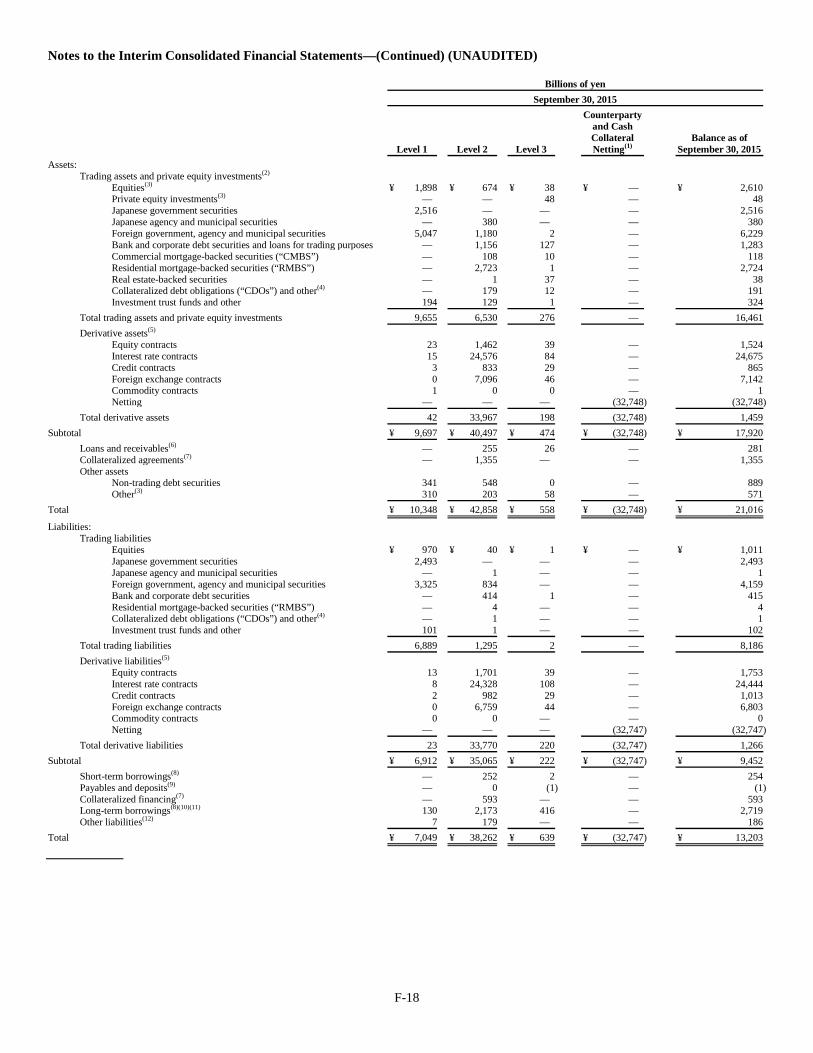
F-18
Notes to the Interim Consolidated Financial Statements—(Continued) (UNAUDITED)
Billions of yen
September 30, 2015
Level 1
Level 2
Level 3
Counterparty and Cash Collateral Netting(1)
Balance as of September 30, 2015
Assets:
Trading assets and private equity investments(2)
Equities(3) ¥ 1,898 ¥ 674 ¥ 38 ¥ — ¥ 2,610 Private equity investments(3) — — 48 — 48 Japanese government securities 2,516 — — — 2,516 Japanese agency and municipal securities — 380 — — 380 Foreign government, agency and municipal securities 5,047 1,180 2 — 6,229 Bank and corporate debt securities and loans for trading purposes — 1,156 127 — 1,283 Commercial mortgage-backed securities (“CMBS”) — 108 10 — 118 Residential mortgage-backed securities (“RMBS”) — 2,723 1 — 2,724 Real estate-backed securities — 1 37 — 38 Collateralized debt obligations (“CDOs”) and other(4) — 179 12 — 191 Investment trust funds and other 194 129 1 — 324
Total trading assets and private equity investments 9,655 6,530 276 — 16,461
Derivative assets(5)
Equity contracts 23 1,462 39 — 1,524 Interest rate contracts 15 24,576 84 — 24,675 Credit contracts 3 833 29 — 865 Foreign exchange contracts 0 7,096 46 — 7,142 Commodity contracts 1 0 0 — 1 Netting — — — (32,748) (32,748)
Total derivative assets 42 33,967 198 (32,748) 1,459
Subtotal ¥ 9,697 ¥ 40,497 ¥ 474 ¥ (32,748) ¥ 17,920
Loans and receivables(6) — 255 26 — 281 Collateralized agreements(7) — 1,355 — — 1,355 Other assets
Non-trading debt securities 341 548 0 — 889 Other(3) 310 203 58 — 571
Total ¥ 10,348 ¥ 42,858 ¥ 558 ¥ (32,748) ¥ 21,016
Liabilities:
Trading liabilities
Equities ¥ 970 ¥ 40 ¥ 1 ¥ — ¥ 1,011 Japanese government securities 2,493 — — — 2,493 Japanese agency and municipal securities — 1 — — 1 Foreign government, agency and municipal securities 3,325 834 — — 4,159 Bank and corporate debt securities — 414 1 — 415 Residential mortgage-backed securities (“RMBS”) — 4 — — 4 Collateralized debt obligations (“CDOs”) and other(4) — 1 — — 1 Investment trust funds and other 101 1 — — 102
Total trading liabilities 6,889 1,295 2 — 8,186
Derivative liabilities(5)
Equity contracts 13 1,701 39 — 1,753 Interest rate contracts 8 24,328 108 — 24,444 Credit contracts 2 982 29 — 1,013 Foreign exchange contracts 0 6,759 44 — 6,803 Commodity contracts 0 0 — — 0 Netting — — — (32,747) (32,747)
Total derivative liabilities 23 33,770 220 (32,747) 1,266
Subtotal ¥ 6,912 ¥ 35,065 ¥ 222 ¥ (32,747) ¥ 9,452
Short-term borrowings(8) — 252 2 — 254 Payables and deposits(9) — 0 (1) — (1) Collateralized financing(7) — 593 — — 593 Long-term borrowings(8)(10)(11) 130 2,173 416 — 2,719 Other liabilities(12) 7 179 — — 186
Total ¥ 7,049 ¥ 38,262 ¥ 639 ¥ (32,747) ¥ 13,203
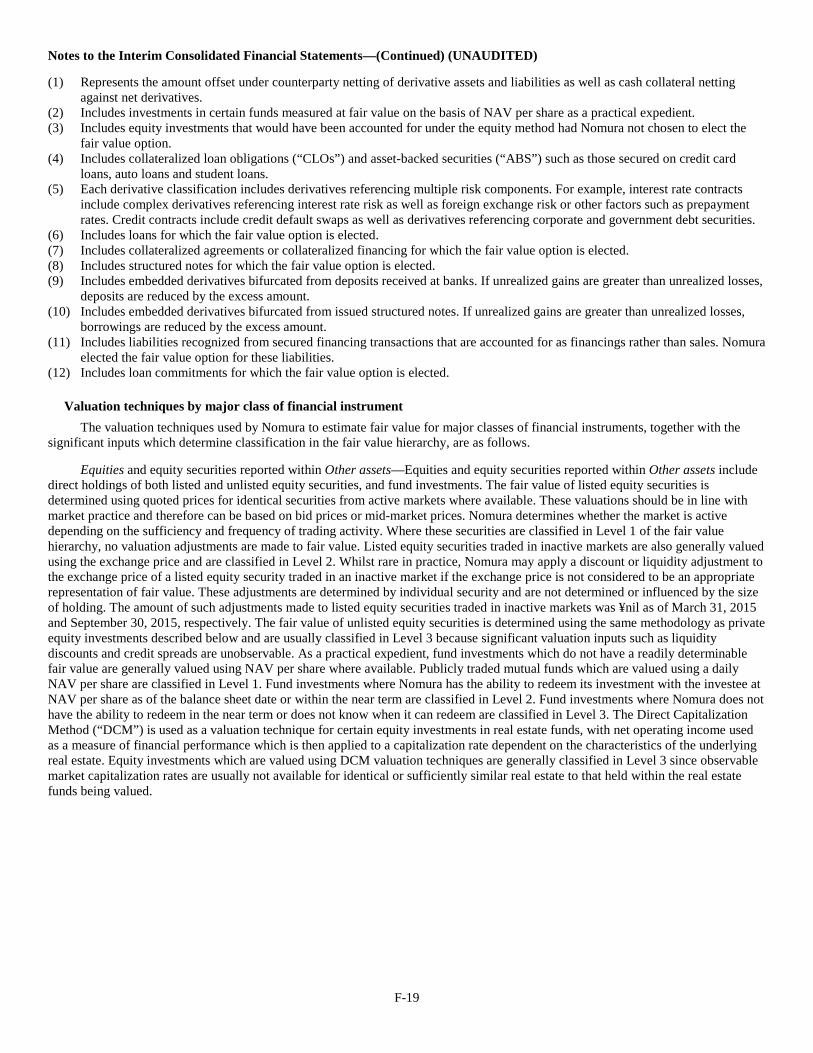
F-19
Notes to the Interim Consolidated Financial Statements—(Continued) (UNAUDITED) (1) Represents the amount offset under counterparty netting of derivative assets and liabilities as well as cash collateral netting
against net derivatives. (2) Includes investments in certain funds measured at fair value on the basis of NAV per share as a practical expedient. (3) Includes equity investments that would have been accounted for under the equity method had Nomura not chosen to elect the
fair value option. (4) Includes collateralized loan obligations (“CLOs”) and asset-backed securities (“ABS”) such as those secured on credit card
loans, auto loans and student loans. (5) Each derivative classification includes derivatives referencing multiple risk components. For example, interest rate contracts
include complex derivatives referencing interest rate risk as well as foreign exchange risk or other factors such as prepayment rates. Credit contracts include credit default swaps as well as derivatives referencing corporate and government debt securities.
(6) Includes loans for which the fair value option is elected. (7) Includes collateralized agreements or collateralized financing for which the fair value option is elected. (8) Includes structured notes for which the fair value option is elected. (9) Includes embedded derivatives bifurcated from deposits received at banks. If unrealized gains are greater than unrealized losses,
deposits are reduced by the excess amount. (10) Includes embedded derivatives bifurcated from issued structured notes. If unrealized gains are greater than unrealized losses,
borrowings are reduced by the excess amount. (11) Includes liabilities recognized from secured financing transactions that are accounted for as financings rather than sales. Nomura
elected the fair value option for these liabilities. (12) Includes loan commitments for which the fair value option is elected.
Valuation techniques by major class of financial instrument The valuation techniques used by Nomura to estimate fair value for major classes of financial instruments, together with the
significant inputs which determine classification in the fair value hierarchy, are as follows.
Equities and equity securities reported within Other assets—Equities and equity securities reported within Other assets include direct holdings of both listed and unlisted equity securities, and fund investments. The fair value of listed equity securities is determined using quoted prices for identical securities from active markets where available. These valuations should be in line with market practice and therefore can be based on bid prices or mid-market prices. Nomura determines whether the market is active depending on the sufficiency and frequency of trading activity. Where these securities are classified in Level 1 of the fair value hierarchy, no valuation adjustments are made to fair value. Listed equity securities traded in inactive markets are also generally valued using the exchange price and are classified in Level 2. Whilst rare in practice, Nomura may apply a discount or liquidity adjustment to the exchange price of a listed equity security traded in an inactive market if the exchange price is not considered to be an appropriate representation of fair value. These adjustments are determined by individual security and are not determined or influenced by the size of holding. The amount of such adjustments made to listed equity securities traded in inactive markets was ¥nil as of March 31, 2015 and September 30, 2015, respectively. The fair value of unlisted equity securities is determined using the same methodology as private equity investments described below and are usually classified in Level 3 because significant valuation inputs such as liquidity discounts and credit spreads are unobservable. As a practical expedient, fund investments which do not have a readily determinable fair value are generally valued using NAV per share where available. Publicly traded mutual funds which are valued using a daily NAV per share are classified in Level 1. Fund investments where Nomura has the ability to redeem its investment with the investee at NAV per share as of the balance sheet date or within the near term are classified in Level 2. Fund investments where Nomura does not have the ability to redeem in the near term or does not know when it can redeem are classified in Level 3. The Direct Capitalization Method (“DCM”) is used as a valuation technique for certain equity investments in real estate funds, with net operating income used as a measure of financial performance which is then applied to a capitalization rate dependent on the characteristics of the underlying real estate. Equity investments which are valued using DCM valuation techniques are generally classified in Level 3 since observable market capitalization rates are usually not available for identical or sufficiently similar real estate to that held within the real estate funds being valued.
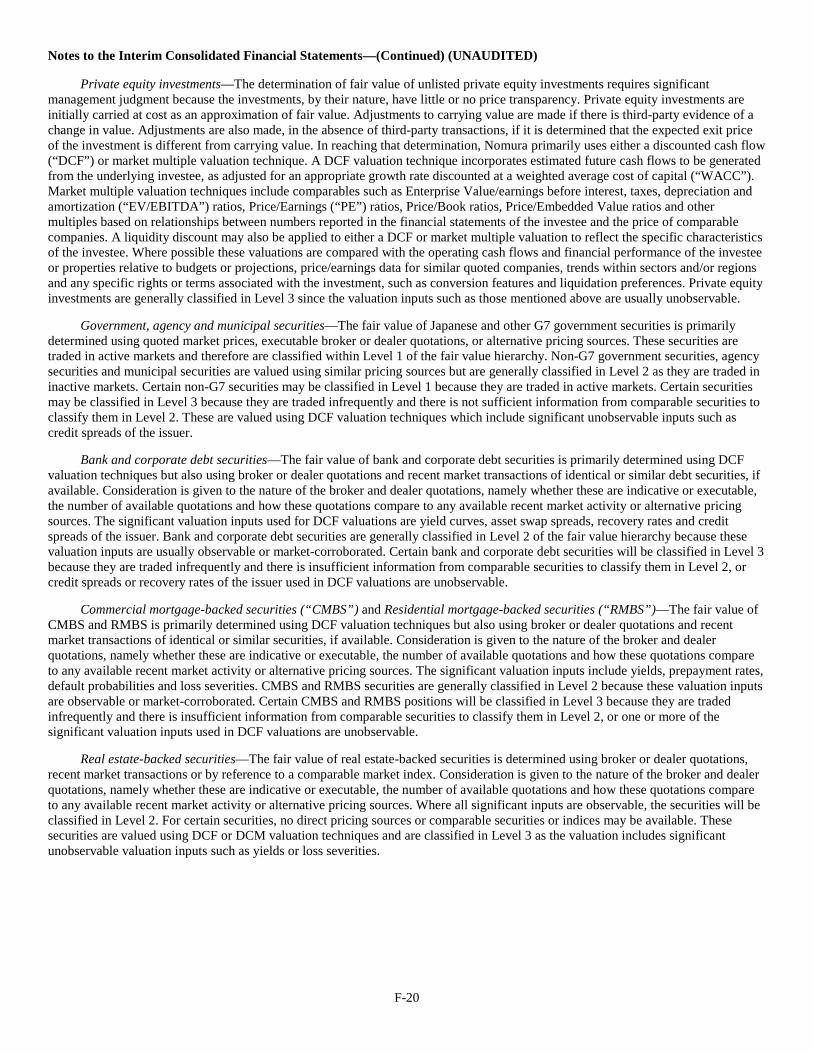
F-20
Notes to the Interim Consolidated Financial Statements—(Continued) (UNAUDITED)
Private equity investments—The determination of fair value of unlisted private equity investments requires significant management judgment because the investments, by their nature, have little or no price transparency. Private equity investments are initially carried at cost as an approximation of fair value. Adjustments to carrying value are made if there is third-party evidence of a change in value. Adjustments are also made, in the absence of third-party transactions, if it is determined that the expected exit price of the investment is different from carrying value. In reaching that determination, Nomura primarily uses either a discounted cash flow (“DCF”) or market multiple valuation technique. A DCF valuation technique incorporates estimated future cash flows to be generated from the underlying investee, as adjusted for an appropriate growth rate discounted at a weighted average cost of capital (“WACC”). Market multiple valuation techniques include comparables such as Enterprise Value/earnings before interest, taxes, depreciation and amortization (“EV/EBITDA”) ratios, Price/Earnings (“PE”) ratios, Price/Book ratios, Price/Embedded Value ratios and other multiples based on relationships between numbers reported in the financial statements of the investee and the price of comparable companies. A liquidity discount may also be applied to either a DCF or market multiple valuation to reflect the specific characteristics of the investee. Where possible these valuations are compared with the operating cash flows and financial performance of the investee or properties relative to budgets or projections, price/earnings data for similar quoted companies, trends within sectors and/or regions and any specific rights or terms associated with the investment, such as conversion features and liquidation preferences. Private equity investments are generally classified in Level 3 since the valuation inputs such as those mentioned above are usually unobservable.
Government, agency and municipal securities—The fair value of Japanese and other G7 government securities is primarily determined using quoted market prices, executable broker or dealer quotations, or alternative pricing sources. These securities are traded in active markets and therefore are classified within Level 1 of the fair value hierarchy. Non-G7 government securities, agency securities and municipal securities are valued using similar pricing sources but are generally classified in Level 2 as they are traded in inactive markets. Certain non-G7 securities may be classified in Level 1 because they are traded in active markets. Certain securities may be classified in Level 3 because they are traded infrequently and there is not sufficient information from comparable securities to classify them in Level 2. These are valued using DCF valuation techniques which include significant unobservable inputs such as credit spreads of the issuer.
Bank and corporate debt securities—The fair value of bank and corporate debt securities is primarily determined using DCF valuation techniques but also using broker or dealer quotations and recent market transactions of identical or similar debt securities, if available. Consideration is given to the nature of the broker and dealer quotations, namely whether these are indicative or executable, the number of available quotations and how these quotations compare to any available recent market activity or alternative pricing sources. The significant valuation inputs used for DCF valuations are yield curves, asset swap spreads, recovery rates and credit spreads of the issuer. Bank and corporate debt securities are generally classified in Level 2 of the fair value hierarchy because these valuation inputs are usually observable or market-corroborated. Certain bank and corporate debt securities will be classified in Level 3 because they are traded infrequently and there is insufficient information from comparable securities to classify them in Level 2, or credit spreads or recovery rates of the issuer used in DCF valuations are unobservable.
Commercial mortgage-backed securities (“CMBS”) and Residential mortgage-backed securities (“RMBS”)—The fair value of CMBS and RMBS is primarily determined using DCF valuation techniques but also using broker or dealer quotations and recent market transactions of identical or similar securities, if available. Consideration is given to the nature of the broker and dealer quotations, namely whether these are indicative or executable, the number of available quotations and how these quotations compare to any available recent market activity or alternative pricing sources. The significant valuation inputs include yields, prepayment rates, default probabilities and loss severities. CMBS and RMBS securities are generally classified in Level 2 because these valuation inputs are observable or market-corroborated. Certain CMBS and RMBS positions will be classified in Level 3 because they are traded infrequently and there is insufficient information from comparable securities to classify them in Level 2, or one or more of the significant valuation inputs used in DCF valuations are unobservable.
Real estate-backed securities—The fair value of real estate-backed securities is determined using broker or dealer quotations, recent market transactions or by reference to a comparable market index. Consideration is given to the nature of the broker and dealer quotations, namely whether these are indicative or executable, the number of available quotations and how these quotations compare to any available recent market activity or alternative pricing sources. Where all significant inputs are observable, the securities will be classified in Level 2. For certain securities, no direct pricing sources or comparable securities or indices may be available. These securities are valued using DCF or DCM valuation techniques and are classified in Level 3 as the valuation includes significant unobservable valuation inputs such as yields or loss severities.
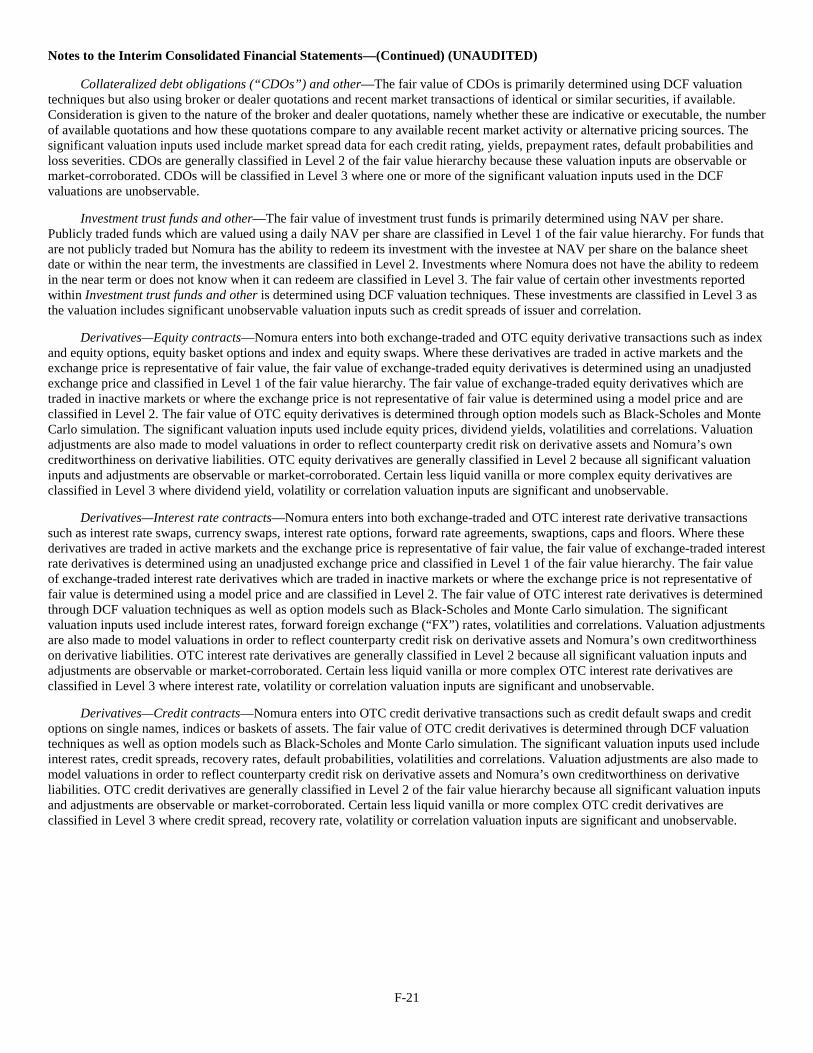
F-21
Notes to the Interim Consolidated Financial Statements—(Continued) (UNAUDITED)
Collateralized debt obligations (“CDOs”) and other—The fair value of CDOs is primarily determined using DCF valuation techniques but also using broker or dealer quotations and recent market transactions of identical or similar securities, if available. Consideration is given to the nature of the broker and dealer quotations, namely whether these are indicative or executable, the number of available quotations and how these quotations compare to any available recent market activity or alternative pricing sources. The significant valuation inputs used include market spread data for each credit rating, yields, prepayment rates, default probabilities and loss severities. CDOs are generally classified in Level 2 of the fair value hierarchy because these valuation inputs are observable or market-corroborated. CDOs will be classified in Level 3 where one or more of the significant valuation inputs used in the DCF valuations are unobservable.
Investment trust funds and other—The fair value of investment trust funds is primarily determined using NAV per share. Publicly traded funds which are valued using a daily NAV per share are classified in Level 1 of the fair value hierarchy. For funds that are not publicly traded but Nomura has the ability to redeem its investment with the investee at NAV per share on the balance sheet date or within the near term, the investments are classified in Level 2. Investments where Nomura does not have the ability to redeem in the near term or does not know when it can redeem are classified in Level 3. The fair value of certain other investments reported within Investment trust funds and other is determined using DCF valuation techniques. These investments are classified in Level 3 as the valuation includes significant unobservable valuation inputs such as credit spreads of issuer and correlation.
Derivatives—Equity contracts—Nomura enters into both exchange-traded and OTC equity derivative transactions such as index and equity options, equity basket options and index and equity swaps. Where these derivatives are traded in active markets and the exchange price is representative of fair value, the fair value of exchange-traded equity derivatives is determined using an unadjusted exchange price and classified in Level 1 of the fair value hierarchy. The fair value of exchange-traded equity derivatives which are traded in inactive markets or where the exchange price is not representative of fair value is determined using a model price and are classified in Level 2. The fair value of OTC equity derivatives is determined through option models such as Black-Scholes and Monte Carlo simulation. The significant valuation inputs used include equity prices, dividend yields, volatilities and correlations. Valuation adjustments are also made to model valuations in order to reflect counterparty credit risk on derivative assets and Nomura’s own creditworthiness on derivative liabilities. OTC equity derivatives are generally classified in Level 2 because all significant valuation inputs and adjustments are observable or market-corroborated. Certain less liquid vanilla or more complex equity derivatives are classified in Level 3 where dividend yield, volatility or correlation valuation inputs are significant and unobservable.
Derivatives—Interest rate contracts—Nomura enters into both exchange-traded and OTC interest rate derivative transactions such as interest rate swaps, currency swaps, interest rate options, forward rate agreements, swaptions, caps and floors. Where these derivatives are traded in active markets and the exchange price is representative of fair value, the fair value of exchange-traded interest rate derivatives is determined using an unadjusted exchange price and classified in Level 1 of the fair value hierarchy. The fair value of exchange-traded interest rate derivatives which are traded in inactive markets or where the exchange price is not representative of fair value is determined using a model price and are classified in Level 2. The fair value of OTC interest rate derivatives is determined through DCF valuation techniques as well as option models such as Black-Scholes and Monte Carlo simulation. The significant valuation inputs used include interest rates, forward foreign exchange (“FX”) rates, volatilities and correlations. Valuation adjustments are also made to model valuations in order to reflect counterparty credit risk on derivative assets and Nomura’s own creditworthiness on derivative liabilities. OTC interest rate derivatives are generally classified in Level 2 because all significant valuation inputs and adjustments are observable or market-corroborated. Certain less liquid vanilla or more complex OTC interest rate derivatives are classified in Level 3 where interest rate, volatility or correlation valuation inputs are significant and unobservable.
Derivatives—Credit contracts—Nomura enters into OTC credit derivative transactions such as credit default swaps and credit options on single names, indices or baskets of assets. The fair value of OTC credit derivatives is determined through DCF valuation techniques as well as option models such as Black-Scholes and Monte Carlo simulation. The significant valuation inputs used include interest rates, credit spreads, recovery rates, default probabilities, volatilities and correlations. Valuation adjustments are also made to model valuations in order to reflect counterparty credit risk on derivative assets and Nomura’s own creditworthiness on derivative liabilities. OTC credit derivatives are generally classified in Level 2 of the fair value hierarchy because all significant valuation inputs and adjustments are observable or market-corroborated. Certain less liquid vanilla or more complex OTC credit derivatives are classified in Level 3 where credit spread, recovery rate, volatility or correlation valuation inputs are significant and unobservable.
F-22
Notes to the Interim Consolidated Financial Statements—(Continued) (UNAUDITED)
Derivatives—Foreign exchange contracts—Nomura enters into both exchange-traded and OTC foreign exchange derivative transactions such as foreign exchange forwards and currency options. The fair value of exchange-traded foreign exchange derivatives which are traded in inactive markets or where the exchange price is not representative of fair value is determined using a model price and are classified in Level 2. The fair value of OTC foreign exchange derivatives is determined through DCF valuation techniques as well as option models such as Black-Scholes and Monte Carlo simulation. The significant valuation inputs used include interest rates, forward FX rates, spot FX rates and volatilities. Valuation adjustments are also made to model valuations in order to reflect counterparty credit risk on derivative assets and Nomura’s own creditworthiness on derivative liabilities. OTC foreign exchange derivatives are generally classified in Level 2 because all significant valuation inputs and adjustments are observable or market-corroborated. Certain foreign exchange derivatives are classified in Level 3 where volatility valuation inputs are significant and unobservable.
Derivatives—Commodity contracts—Nomura enters into OTC commodity derivative transactions such as commodity swaps, commodity forwards and commodity options. The fair value of OTC commodity derivatives is determined through DCF valuation techniques as well as option models such as Black-Scholes and Monte Carlo simulation. The significant valuation inputs used include commodity prices, interest rates, volatilities and correlations. Valuation adjustments are also made to model valuations in order to reflect counterparty credit risk on derivative assets and Nomura’s own creditworthiness on derivative liabilities. OTC commodity derivatives are generally classified in Level 2 of the fair value hierarchy because these valuation inputs and adjustments are observable or market-corroborated.
Loans—The fair value of loans carried at fair value either as trading assets or through election of the fair value option is primarily determined using DCF valuation techniques as quoted prices are typically not available. The significant valuation inputs used are similar to those used in the valuation of corporate debt securities described above. Loans are generally classified in Level 2 of the fair value hierarchy because all significant valuation inputs are observable. Certain loans, however, are classified in Level 3 because they are traded infrequently and there is not sufficient information from comparable securities to classify them in Level 2 or credit spreads of the issuer used in DCF valuations are significant and unobservable.
Collateralized agreements and Collateralized financing—The primary types of collateralized agreement and financing transactions carried at fair value are reverse repurchase and repurchase agreements elected for the fair value option. The fair value of these financial instruments is primarily determined using DCF valuation techniques. The significant valuation inputs used include interest rates and collateral funding spreads such as general collateral or special rates. Reverse repurchase and repurchase agreements are generally classified in Level 2 of the fair value hierarchy because these valuation inputs are usually observable.
Non-trading debt securities—These are debt securities held by certain non-trading subsidiaries in the group and are valued and classified in the fair value hierarchy using the same valuation techniques used for other debt securities classified as Government, agency and municipal securities and Bank and corporate debt securities described above.
Short-term and long-term borrowings (“Structured notes”)—Structured notes are debt securities issued by Nomura or by consolidated variable interest entities (“VIEs”) which contain embedded features that alter the return to the investor from simply receiving a fixed or floating rate of interest to a return that depends upon some other variables, such as an equity or equity index, commodity price, foreign exchange rate, credit rating of a third party or a more complex interest rate (i.e., an embedded derivative).
F-23
Notes to the Interim Consolidated Financial Statements—(Continued) (UNAUDITED)
The fair value of structured notes is determined using a quoted price in an active market for the identical liability if available, and where not available, using a mixture of valuation techniques that use the quoted price of the identical liability when traded as an asset, quoted prices for similar liabilities, similar liabilities when traded as assets, or an internal model which combines DCF valuation techniques and option pricing models, depending on the nature of the embedded features within the structured note. Where an internal model is used, Nomura estimates the fair value of both the underlying debt instrument and the embedded derivative components. The significant valuation inputs used to estimate the fair value of the debt instrument component include yield curves and prepayment rates. The significant valuation inputs used to estimate the fair value of the embedded derivative component are the same as those used for the relevant type of freestanding OTC derivative discussed above. A valuation adjustment is also made to the entire structured note in order to reflect Nomura’s own creditworthiness. As of March 31, 2015 and September 30, 2015, the fair value of structured notes includes a debit adjustment of ¥0 billion and ¥22 billion, respectively, to reflect Nomura’s own creditworthiness. The valuation methodology used to determine this adjustment was refined during the quarter ended June 30, 2015 by incorporating certain additional term features in Nomura’s credit spreads, which are a key valuation input used to determine the amount of the adjustment. This adjustment is determined based on recent observable secondary market transactions and executable broker quotes involving Nomura debt instruments and is therefore typically treated as a Level 2 valuation input. Structured notes are generally classified in Level 2 of the fair value hierarchy as all significant valuation inputs and adjustments are observable. Where any unobservable inputs are significant, such as volatilities and correlations used to estimate the fair value of the embedded derivative component, structured notes are classified in Level 3.
Long-term borrowings (“Secured financing transactions”)—Secured financing transactions are liabilities recognized when a transfer of a financial asset does not meet the criteria for sales accounting under ASC 860 and therefore the transaction is accounted for as a secured borrowing. These liabilities are valued using the same valuation techniques that are applied to the transferred financial assets which remain on the consolidated balance sheets and are therefore classified in the same level in the fair value hierarchy as the transferred financial assets. These liabilities do not provide general recourse to Nomura and therefore no adjustment is made to reflect Nomura’s own creditworthiness.
Valuation processes In order to ensure the appropriateness of any fair value measurement of a financial instrument used within these consolidated
financial statements, including those classified in Level 3 within the fair value hierarchy, Nomura operates a governance framework which mandates determination or validation of a fair value measurement by control and support functions independent of the trading businesses assuming the risk of the financial instrument. Such functions within Nomura with direct responsibility for either defining, implementing or maintaining valuation policies and procedures are as follows:
• The Product Control Valuations Group (“PCVG”) within Nomura’s Finance Department has primary responsibility for determining and implementing valuation policies and procedures in connection with determination of fair value measurements. In particular, this group will ensure that valuation policies are documented for each type of financial instrument in accordance with U.S. GAAP. While it is the responsibility of market makers and investment professionals in our trading businesses to price our financial instruments, the PCVG are responsible for independently verifying or validating these prices. In the event of a difference in opinion or where the estimate of fair value requires judgment, the valuation used within these consolidated financial statements is made by senior managers independent of the trading businesses. This group reports to the Global Head of Product Control and ultimately to the Chief Financial Officer (“CFO”);
• The Accounting Policy Group within Nomura’s Finance Department defines the group’s accounting policies and procedures in accordance with U.S. GAAP, including those associated with determination of fair value under ASC 820 and other relevant U.S. GAAP pronouncements. This group reports to the Global Head of Accounting Policy and ultimately to the CFO; and
• The MVG within Nomura’s Risk Management Department validates the appropriateness and consistency of pricing models used to determine fair value measurements independently of those who design and build the models. This group reports to the Chief Risk Officer.
F-24
Notes to the Interim Consolidated Financial Statements—(Continued) (UNAUDITED)
The fundamental components of this governance framework over valuation processes within Nomura particularly as it relates to Level 3 financial instruments are the procedures in place for independent price verification, pricing model validation and revenue substantiation.
Independent price verification processes The key objective of the independent price verification processes within Nomura is to verify the appropriateness of fair value
measurements applied to all financial instruments within Nomura. In applying these control processes, observable inputs are used whenever possible and when unobservable inputs are necessary, the processes seek to ensure the valuation technique and inputs are appropriate, reasonable and consistently applied.
The independent price verification processes aim to verify the fair value of all positions to external levels on a regular basis. The process will involve obtaining data such as trades, marks and prices from internal and external sources and examining the impact of marking the internal positions at the external prices. Margin disputes within the collateral process will also be investigated to determine if there is any impact on valuations.
Where third-party pricing information sourced from brokers, dealers and consensus pricing services is used as part of the price verification process, consideration is given as to whether that information reflects actual recent market transactions or prices at which transactions involving identical or similar financial instruments are currently executable. If such transactions or prices are not available, the financial instrument will generally be classified in Level 3.
Where there is a lack of observable market information around the inputs used in a fair value measurement, then the PCVG and the MVG will assess the inputs used for reasonableness considering available information including comparable products, surfaces, curves and past trades. Additional valuation adjustments may be taken for the uncertainty in the inputs used, such as correlation and where appropriate trading desks may be asked to execute trades to evidence market levels.
Model review and validation For more complex financial instruments pricing models are used to determine fair value measurements. The MVG performs an
independent model approval process which incorporates a review of the model assumptions across a diverse set of parameters. Considerations include:
• Scope of the model (different financial instruments may require different but consistent pricing approaches); • Mathematical and financial assumptions; • Full or partial independent benchmarking along with boundary and stability tests, numerical convergence, calibration
quality and stability; • Model integration within Nomura’s trading and risk systems; • Calculation of risk numbers and risk reporting; and • Hedging strategies/practical use of the model.
New models are reviewed and approved by the MVG. The frequency of subsequent MVG reviews (“Model Re-approvals”) is at least annually.
Revenue substantiation Nomura’s Product Control function also ensures adherence to Nomura’s valuation policies through daily and periodic analytical
review of net revenues. This process involves substantiating revenue amounts through explanations and attribution of revenue sources based on the underlying factors such as interest rates, credit spreads, volatilities, foreign exchange rates etc. In combination with the independent price verification processes, this daily, weekly, monthly and quarterly review substantiates the revenues made while helping to identify and resolve potential booking, pricing or risk quantification issues.
F-25
Notes to the Interim Consolidated Financial Statements—(Continued) (UNAUDITED)
Level 3 financial instruments As described above, the valuation of Level 3 financial assets and liabilities is dependent on certain significant inputs which
cannot be observed in the market. Common characteristics of an inactive market include a low number of transactions of the financial instrument, stale or non-current price quotes, price quotes that vary substantially either over time or among market makers, non-executable broker quotes or little publicly released information.
If corroborative evidence is not available to value Level 3 financial instruments, fair value may be established using other equivalent products in the market. The level of correlation between the specific Level 3 financial instrument and the available benchmark instrument is considered as an unobservable parameter. Other techniques for determining an appropriate value for unobservable parameters may consider information such as consensus pricing data among certain market participants, historical trends, extrapolation from observable market data and other information Nomura would expect market participants to use in valuing similar instruments.
Use of reasonably possible alternative input assumptions to value Level 3 financial instruments will significantly influence fair value determination. Ultimately, the uncertainties described above about input assumptions imply that the fair value of Level 3 financial instruments is a judgmental estimate. The specific valuation for each instrument is based on management’s judgment of prevailing market conditions, in accordance with Nomura’s established valuation policies and procedures.
Quantitative information regarding significant unobservable inputs and assumptions The following tables present information about the significant unobservable inputs and assumptions used by Nomura for
financial instruments classified in Level 3 as of March 31, 2015 and September 30, 2015. These financial instruments will also typically include observable valuation inputs (i.e. Level 1 or Level 2 valuation inputs) which are not included in the table and are also often hedged using financial instruments which are classified in Level 1 or Level 2 of the fair value hierarchy.
March 31, 2015
Financial Instrument
Fair value in billions of yen
Valuation technique(s)
Significant unobservable inputs
Range of valuation inputs(1)
Weighted Average(2)
Assets:
Trading assets and private equity investments
Equities ¥ 39 DCF Liquidity discounts 4.6 – 40.0% 21.6%
Private equity investments 49 Market multiples EV/EBITDA ratios Price/Embedded values
Liquidity discounts
10.0 x 0.4 x
30.0 – 33.0%
10.0 x 0.4 x
32.3%
Foreign government, agency and municipal securities
3 DCF Credit spreads 0.3 – 6.1% 1.1%
Bank and corporate debt securities and loans for trading purposes
167 DCF Credit spreads Recovery rates
0.0 – 33.4% 0.0 – 42.6%
10.4% 24.9%
Commercial mortgage-backed securities (“CMBS”)
2 DCF Yields 18.1 – 50.6% 15.3%
Residential mortgage-backed securities (“RMBS”)
1 DCF Yields Prepayment rates
0.1 – 10.6% 2.7 – 12.8%
2.2% 7.5%
Real estate-backed securities 13 DCF Yields Loss severities
17.0 – 26.0% 0.0 – 46.8%
24.3% 18.6%
Collateralized debt obligations (“CDOs”) and other
15 DCF Yields Prepayment rates
Default probabilities Loss severities
4.7 – 23.4% 0.0 – 20.0% 1.0 – 10.0%
30.0 – 100.0%
12.6% 19.0% 2.2% 32.7%
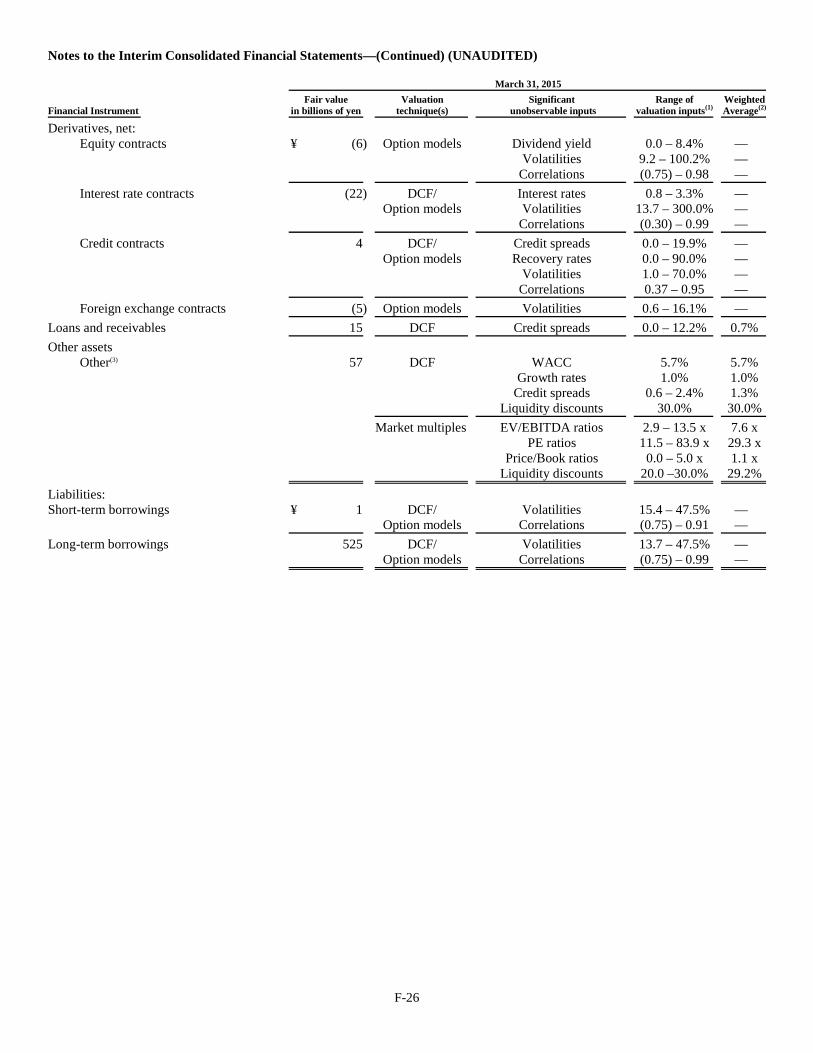
F-26
Notes to the Interim Consolidated Financial Statements—(Continued) (UNAUDITED)
March 31, 2015
Financial Instrument
Fair value in billions of yen
Valuation technique(s)
Significant unobservable inputs
Range of valuation inputs(1)
Weighted Average(2)
Derivatives, net:
Equity contracts ¥ (6) Option models Dividend yield Volatilities
Correlations
0.0 – 8.4% 9.2 – 100.2% (0.75) – 0.98
— — —
Interest rate contracts (22) DCF/ Option models
Interest rates Volatilities
Correlations
0.8 – 3.3% 13.7 – 300.0% (0.30) – 0.99
— — —
Credit contracts 4 DCF/ Option models
Credit spreads Recovery rates
Volatilities Correlations
0.0 – 19.9% 0.0 – 90.0% 1.0 – 70.0% 0.37 – 0.95
— — — —
Foreign exchange contracts (5) Option models Volatilities 0.6 – 16.1% —
Loans and receivables 15 DCF Credit spreads 0.0 – 12.2% 0.7%
Other assets
Other(3) 57 DCF WACC 5.7% 5.7%
Growth rates Credit spreads
Liquidity discounts
1.0% 0.6 – 2.4%
30.0%
1.0% 1.3% 30.0%
Market multiples EV/EBITDA ratios PE ratios
Price/Book ratios Liquidity discounts
2.9 – 13.5 x 11.5 – 83.9 x
0.0 – 5.0 x 20.0 –30.0%
7.6 x 29.3 x 1.1 x
29.2%
Liabilities:
Short-term borrowings ¥ 1 DCF/ Option models
Volatilities Correlations
15.4 – 47.5% (0.75) – 0.91
— —
Long-term borrowings 525 DCF/ Option models
Volatilities Correlations
13.7 – 47.5% (0.75) – 0.99
— —
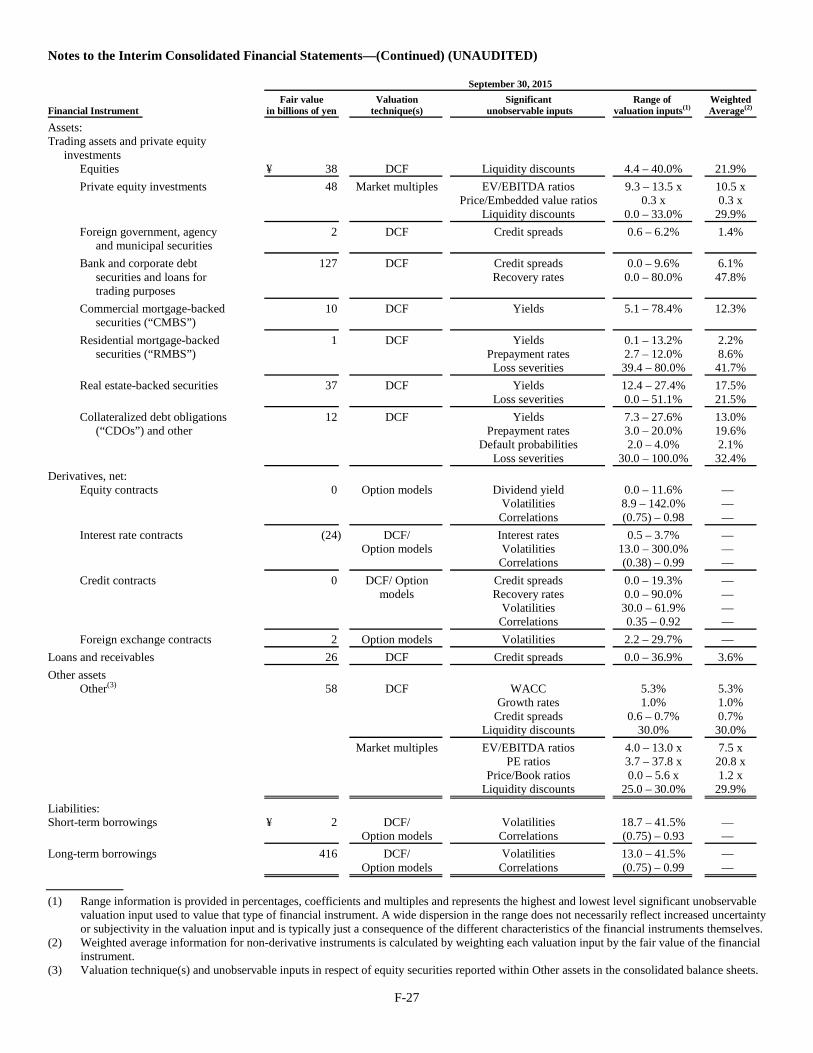
F-27
Notes to the Interim Consolidated Financial Statements—(Continued) (UNAUDITED)
September 30, 2015
Financial Instrument
Fair value in billions of yen
Valuation technique(s)
Significant unobservable inputs
Range of valuation inputs(1)
Weighted Average(2)
Assets: Trading assets and private equity
investments Equities ¥ 38 DCF Liquidity discounts 4.4 – 40.0% 21.9% Private equity investments 48 Market multiples EV/EBITDA ratios
Price/Embedded value ratios Liquidity discounts
9.3 – 13.5 x 0.3 x
0.0 – 33.0%
10.5 x 0.3 x
29.9% Foreign government, agency
and municipal securities 2 DCF Credit spreads 0.6 – 6.2% 1.4%
Bank and corporate debt
securities and loans for trading purposes
127 DCF Credit spreads Recovery rates
0.0 – 9.6% 0.0 – 80.0%
6.1% 47.8%
Commercial mortgage-backed
securities (“CMBS”) 10 DCF Yields 5.1 – 78.4% 12.3%
Residential mortgage-backed
securities (“RMBS”) 1 DCF Yields
Prepayment rates Loss severities
0.1 – 13.2% 2.7 – 12.0% 39.4 – 80.0%
2.2% 8.6%
41.7% Real estate-backed securities 37 DCF Yields
Loss severities 12.4 – 27.4% 0.0 – 51.1%
17.5% 21.5%
Collateralized debt obligations (“CDOs”) and other
12 DCF Yields Prepayment rates
Default probabilities Loss severities
7.3 – 27.6% 3.0 – 20.0% 2.0 – 4.0%
30.0 – 100.0%
13.0% 19.6% 2.1%
32.4% Derivatives, net:
Equity contracts 0 Option models Dividend yield Volatilities
Correlations
0.0 – 11.6% 8.9 – 142.0% (0.75) – 0.98
— — —
Interest rate contracts (24) DCF/ Option models
Interest rates Volatilities
Correlations
0.5 – 3.7% 13.0 – 300.0% (0.38) – 0.99
— — —
Credit contracts 0 DCF/ Option models
Credit spreads Recovery rates
Volatilities Correlations
0.0 – 19.3% 0.0 – 90.0% 30.0 – 61.9% 0.35 – 0.92
— — — —
Foreign exchange contracts 2 Option models Volatilities 2.2 – 29.7% — Loans and receivables 26 DCF Credit spreads 0.0 – 36.9% 3.6% Other assets
Other(3) 58 DCF WACC Growth rates
Credit spreads Liquidity discounts
5.3% 1.0%
0.6 – 0.7% 30.0%
5.3% 1.0% 0.7%
30.0%
Market multiples EV/EBITDA ratios PE ratios
Price/Book ratios Liquidity discounts
4.0 – 13.0 x 3.7 – 37.8 x 0.0 – 5.6 x
25.0 – 30.0%
7.5 x 20.8 x 1.2 x
29.9%
Liabilities: Short-term borrowings ¥ 2 DCF/
Option models Volatilities
Correlations 18.7 – 41.5% (0.75) – 0.93
— —
Long-term borrowings 416 DCF/ Option models
Volatilities Correlations
13.0 – 41.5% (0.75) – 0.99
— —
(1) Range information is provided in percentages, coefficients and multiples and represents the highest and lowest level significant unobservable
valuation input used to value that type of financial instrument. A wide dispersion in the range does not necessarily reflect increased uncertainty or subjectivity in the valuation input and is typically just a consequence of the different characteristics of the financial instruments themselves.
(2) Weighted average information for non-derivative instruments is calculated by weighting each valuation input by the fair value of the financial instrument.
(3) Valuation technique(s) and unobservable inputs in respect of equity securities reported within Other assets in the consolidated balance sheets.
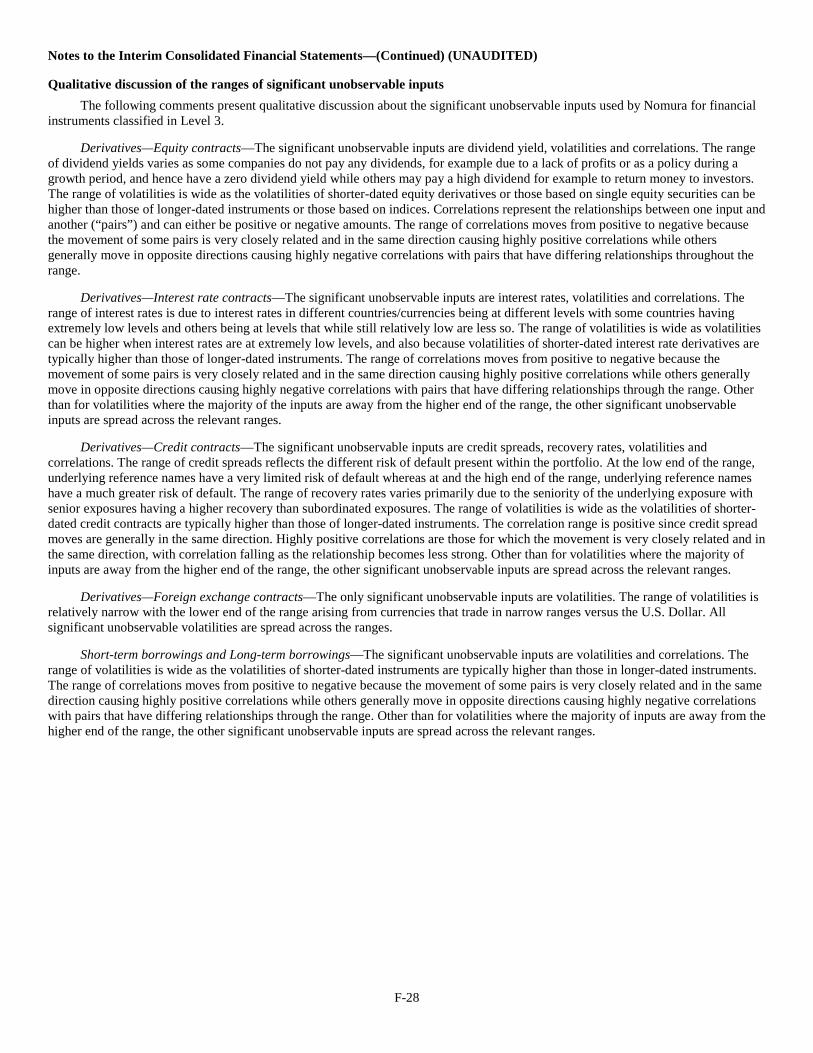
F-28
Notes to the Interim Consolidated Financial Statements—(Continued) (UNAUDITED)
Qualitative discussion of the ranges of significant unobservable inputs The following comments present qualitative discussion about the significant unobservable inputs used by Nomura for financial
instruments classified in Level 3.
Derivatives—Equity contracts—The significant unobservable inputs are dividend yield, volatilities and correlations. The range of dividend yields varies as some companies do not pay any dividends, for example due to a lack of profits or as a policy during a growth period, and hence have a zero dividend yield while others may pay a high dividend for example to return money to investors. The range of volatilities is wide as the volatilities of shorter-dated equity derivatives or those based on single equity securities can be higher than those of longer-dated instruments or those based on indices. Correlations represent the relationships between one input and another (“pairs”) and can either be positive or negative amounts. The range of correlations moves from positive to negative because the movement of some pairs is very closely related and in the same direction causing highly positive correlations while others generally move in opposite directions causing highly negative correlations with pairs that have differing relationships throughout the range.
Derivatives—Interest rate contracts—The significant unobservable inputs are interest rates, volatilities and correlations. The range of interest rates is due to interest rates in different countries/currencies being at different levels with some countries having extremely low levels and others being at levels that while still relatively low are less so. The range of volatilities is wide as volatilities can be higher when interest rates are at extremely low levels, and also because volatilities of shorter-dated interest rate derivatives are typically higher than those of longer-dated instruments. The range of correlations moves from positive to negative because the movement of some pairs is very closely related and in the same direction causing highly positive correlations while others generally move in opposite directions causing highly negative correlations with pairs that have differing relationships through the range. Other than for volatilities where the majority of the inputs are away from the higher end of the range, the other significant unobservable inputs are spread across the relevant ranges.
Derivatives—Credit contracts—The significant unobservable inputs are credit spreads, recovery rates, volatilities and correlations. The range of credit spreads reflects the different risk of default present within the portfolio. At the low end of the range, underlying reference names have a very limited risk of default whereas at and the high end of the range, underlying reference names have a much greater risk of default. The range of recovery rates varies primarily due to the seniority of the underlying exposure with senior exposures having a higher recovery than subordinated exposures. The range of volatilities is wide as the volatilities of shorter-dated credit contracts are typically higher than those of longer-dated instruments. The correlation range is positive since credit spread moves are generally in the same direction. Highly positive correlations are those for which the movement is very closely related and in the same direction, with correlation falling as the relationship becomes less strong. Other than for volatilities where the majority of inputs are away from the higher end of the range, the other significant unobservable inputs are spread across the relevant ranges.
Derivatives—Foreign exchange contracts—The only significant unobservable inputs are volatilities. The range of volatilities is relatively narrow with the lower end of the range arising from currencies that trade in narrow ranges versus the U.S. Dollar. All significant unobservable volatilities are spread across the ranges.
Short-term borrowings and Long-term borrowings—The significant unobservable inputs are volatilities and correlations. The range of volatilities is wide as the volatilities of shorter-dated instruments are typically higher than those in longer-dated instruments. The range of correlations moves from positive to negative because the movement of some pairs is very closely related and in the same direction causing highly positive correlations while others generally move in opposite directions causing highly negative correlations with pairs that have differing relationships through the range. Other than for volatilities where the majority of inputs are away from the higher end of the range, the other significant unobservable inputs are spread across the relevant ranges.
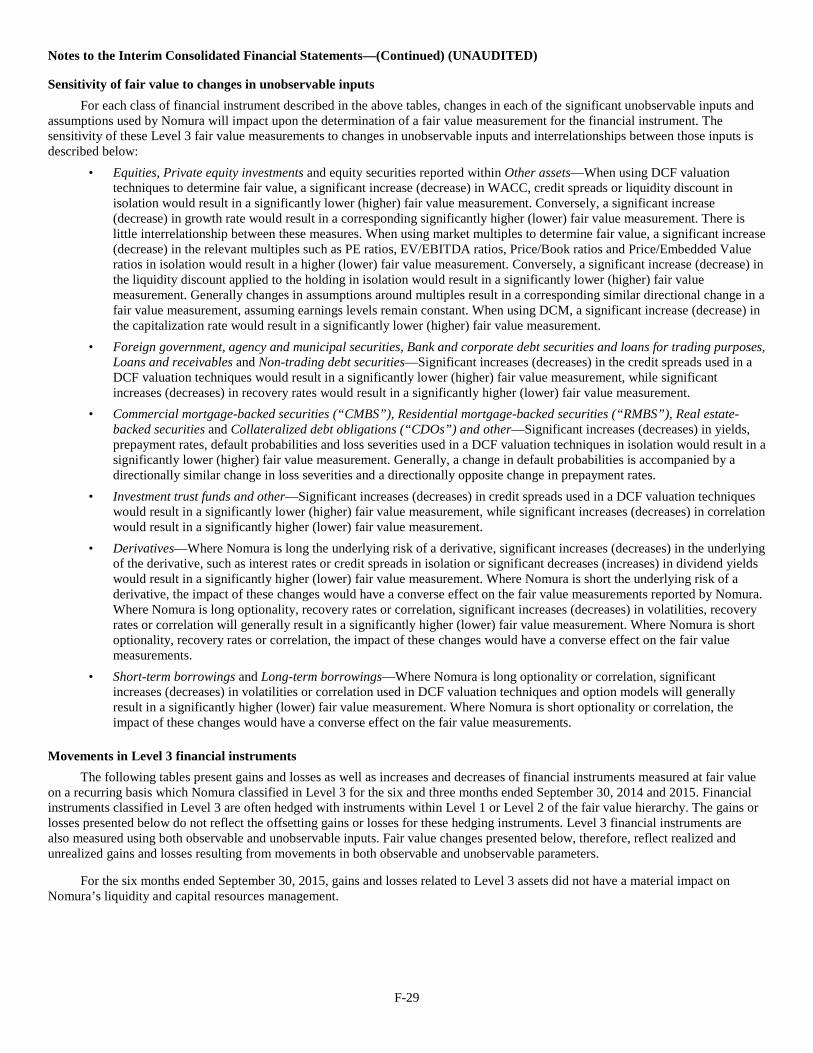
F-29
Notes to the Interim Consolidated Financial Statements—(Continued) (UNAUDITED)
Sensitivity of fair value to changes in unobservable inputs For each class of financial instrument described in the above tables, changes in each of the significant unobservable inputs and
assumptions used by Nomura will impact upon the determination of a fair value measurement for the financial instrument. The sensitivity of these Level 3 fair value measurements to changes in unobservable inputs and interrelationships between those inputs is described below:
• Equities, Private equity investments and equity securities reported within Other assets—When using DCF valuation techniques to determine fair value, a significant increase (decrease) in WACC, credit spreads or liquidity discount in isolation would result in a significantly lower (higher) fair value measurement. Conversely, a significant increase (decrease) in growth rate would result in a corresponding significantly higher (lower) fair value measurement. There is little interrelationship between these measures. When using market multiples to determine fair value, a significant increase (decrease) in the relevant multiples such as PE ratios, EV/EBITDA ratios, Price/Book ratios and Price/Embedded Value ratios in isolation would result in a higher (lower) fair value measurement. Conversely, a significant increase (decrease) in the liquidity discount applied to the holding in isolation would result in a significantly lower (higher) fair value measurement. Generally changes in assumptions around multiples result in a corresponding similar directional change in a fair value measurement, assuming earnings levels remain constant. When using DCM, a significant increase (decrease) in the capitalization rate would result in a significantly lower (higher) fair value measurement.
• Foreign government, agency and municipal securities, Bank and corporate debt securities and loans for trading purposes, Loans and receivables and Non-trading debt securities—Significant increases (decreases) in the credit spreads used in a DCF valuation techniques would result in a significantly lower (higher) fair value measurement, while significant increases (decreases) in recovery rates would result in a significantly higher (lower) fair value measurement.
• Commercial mortgage-backed securities (“CMBS”), Residential mortgage-backed securities (“RMBS”), Real estate-backed securities and Collateralized debt obligations (“CDOs”) and other—Significant increases (decreases) in yields, prepayment rates, default probabilities and loss severities used in a DCF valuation techniques in isolation would result in a significantly lower (higher) fair value measurement. Generally, a change in default probabilities is accompanied by a directionally similar change in loss severities and a directionally opposite change in prepayment rates.
• Investment trust funds and other—Significant increases (decreases) in credit spreads used in a DCF valuation techniques would result in a significantly lower (higher) fair value measurement, while significant increases (decreases) in correlation would result in a significantly higher (lower) fair value measurement.
• Derivatives—Where Nomura is long the underlying risk of a derivative, significant increases (decreases) in the underlying of the derivative, such as interest rates or credit spreads in isolation or significant decreases (increases) in dividend yields would result in a significantly higher (lower) fair value measurement. Where Nomura is short the underlying risk of a derivative, the impact of these changes would have a converse effect on the fair value measurements reported by Nomura. Where Nomura is long optionality, recovery rates or correlation, significant increases (decreases) in volatilities, recovery rates or correlation will generally result in a significantly higher (lower) fair value measurement. Where Nomura is short optionality, recovery rates or correlation, the impact of these changes would have a converse effect on the fair value measurements.
• Short-term borrowings and Long-term borrowings—Where Nomura is long optionality or correlation, significant increases (decreases) in volatilities or correlation used in DCF valuation techniques and option models will generally result in a significantly higher (lower) fair value measurement. Where Nomura is short optionality or correlation, the impact of these changes would have a converse effect on the fair value measurements.
Movements in Level 3 financial instruments The following tables present gains and losses as well as increases and decreases of financial instruments measured at fair value
on a recurring basis which Nomura classified in Level 3 for the six and three months ended September 30, 2014 and 2015. Financial instruments classified in Level 3 are often hedged with instruments within Level 1 or Level 2 of the fair value hierarchy. The gains or losses presented below do not reflect the offsetting gains or losses for these hedging instruments. Level 3 financial instruments are also measured using both observable and unobservable inputs. Fair value changes presented below, therefore, reflect realized and unrealized gains and losses resulting from movements in both observable and unobservable parameters.
For the six months ended September 30, 2015, gains and losses related to Level 3 assets did not have a material impact on Nomura’s liquidity and capital resources management.
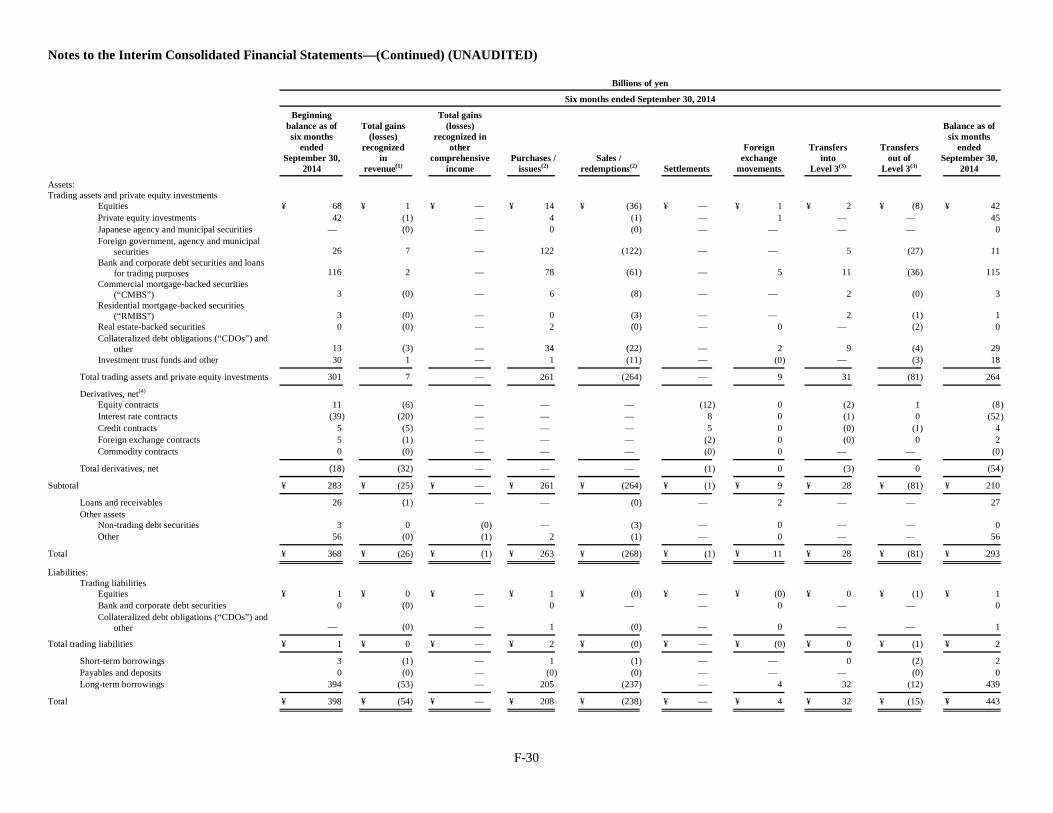
F-30
Notes to the Interim Consolidated Financial Statements—(Continued) (UNAUDITED)
Billions of yen
Six months ended September 30, 2014
Beginning balance as of six months
ended September 30,
2014
Total gains (losses)
recognized in
revenue(1)
Total gains (losses)
recognized in other
comprehensive income
Purchases / issues(2)
Sales / redemptions(2)
Settlements
Foreign exchange
movements
Transfers into
Level 3(3)
Transfers out of
Level 3(3)
Balance as of six months
ended September 30,
2014
Assets: Trading assets and private equity investments
Equities ¥ 68 ¥ 1 ¥ — ¥ 14 ¥ (36) ¥ — ¥ 1 ¥ 2 ¥ (8) ¥ 42 Private equity investments 42 (1) — 4 (1) — 1 — — 45 Japanese agency and municipal securities — (0) — 0 (0) — — — — 0 Foreign government, agency and municipal
securities 26 7 — 122 (122) — — 5 (27) 11 Bank and corporate debt securities and loans
for trading purposes 116 2 — 78 (61) — 5 11 (36) 115 Commercial mortgage-backed securities
(“CMBS”) 3 (0) — 6 (8) — — 2 (0) 3 Residential mortgage-backed securities
(“RMBS”) 3 (0) — 0 (3) — — 2 (1) 1 Real estate-backed securities 0 (0) — 2 (0) — 0 — (2) 0 Collateralized debt obligations (“CDOs”) and
other 13 (3) — 34 (22) — 2 9 (4) 29 Investment trust funds and other 30 1 — 1 (11) — (0) — (3) 18
Total trading assets and private equity investments 301 7 — 261 (264) — 9 31 (81) 264
Derivatives, net(4)
Equity contracts 11 (6) — — — (12) 0 (2) 1 (8 ) Interest rate contracts (39) (20) — — — 8 0 (1) 0 (52 ) Credit contracts 5 (5) — — — 5 0 (0) (1) 4 Foreign exchange contracts 5 (1) — — — (2) 0 (0) 0 2 Commodity contracts 0 (0) — — — (0) 0 — — (0 )
Total derivatives, net (18) (32) — — — (1) 0 (3) 0 (54 )
Subtotal ¥ 283 ¥ (25) ¥ — ¥ 261 ¥ (264) ¥ (1) ¥ 9 ¥ 28 ¥ (81) ¥ 210
Loans and receivables 26 (1) — — (0) — 2 — — 27 Other assets
Non-trading debt securities 3 0 (0) — (3) — 0 — — 0 Other 56 (0) (1) 2 (1) — 0 — — 56
Total ¥ 368 ¥ (26) ¥ (1) ¥ 263 ¥ (268) ¥ (1) ¥ 11 ¥ 28 ¥ (81) ¥ 293
Liabilities:
Trading liabilities Equities ¥ 1 ¥ 0 ¥ — ¥ 1 ¥ (0) ¥ — ¥ (0) ¥ 0 ¥ (1) ¥ 1 Bank and corporate debt securities 0 (0) — 0 — — 0 — — 0 Collateralized debt obligations (“CDOs”) and
other — (0) — 1 (0) — 0 — — 1
Total trading liabilities ¥ 1 ¥ 0 ¥ — ¥ 2 ¥ (0) ¥ — ¥ (0) ¥ 0 ¥ (1) ¥ 2
Short-term borrowings 3 (1) — 1 (1) — — 0 (2) 2 Payables and deposits 0 (0) — (0) (0) — — — (0) 0 Long-term borrowings 394 (53) — 205 (237) — 4 32 (12) 439
Total ¥ 398 ¥ (54) ¥ — ¥ 208 ¥ (238) ¥ — ¥ 4 ¥ 32 ¥ (15) ¥ 443
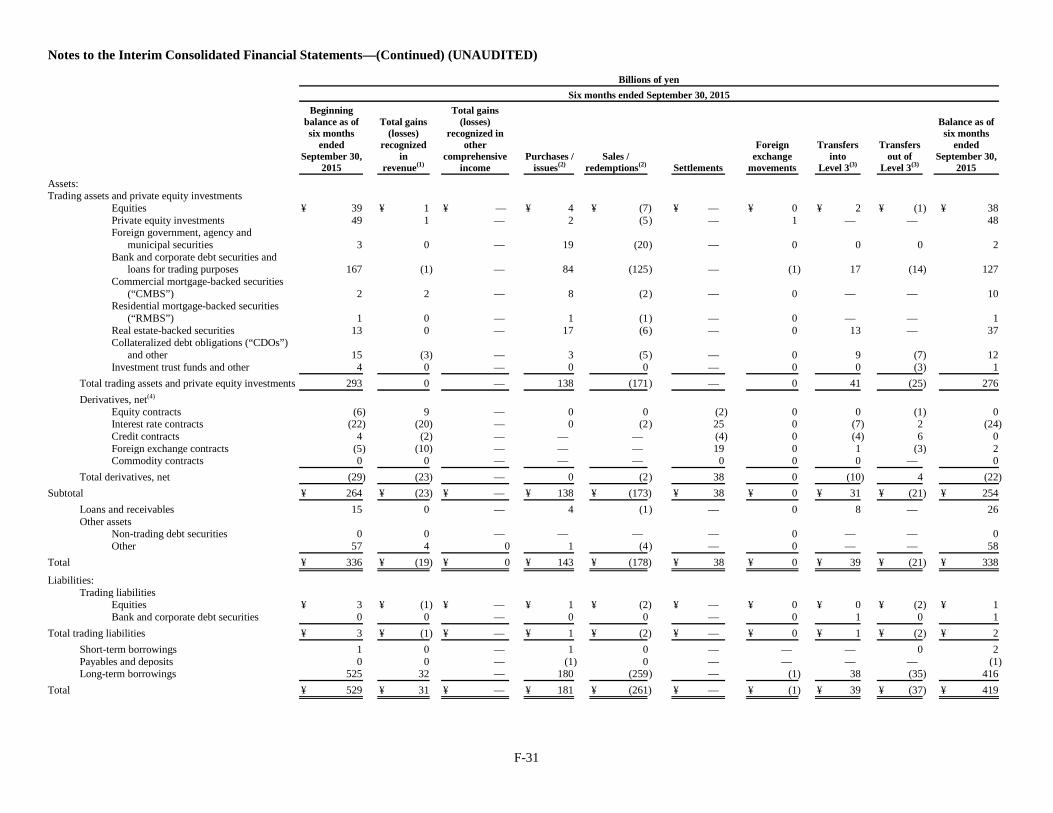
F-31
Notes to the Interim Consolidated Financial Statements—(Continued) (UNAUDITED)
Billions of yen
Six months ended September 30, 2015
Beginning balance as of six months
ended September 30,
2015
Total gains (losses)
recognized in
revenue(1)
Total gains (losses)
recognized in other
comprehensive income
Purchases / issues(2)
Sales / redemptions(2)
Settlements
Foreign exchange
movements
Transfers into
Level 3(3)
Transfers out of
Level 3(3)
Balance as of six months
ended September 30,
2015
Assets: Trading assets and private equity investments
Equities ¥ 39 ¥ 1 ¥ — ¥ 4 ¥ (7) ¥ — ¥ 0 ¥ 2 ¥ (1) ¥ 38 Private equity investments 49 1 — 2 (5 ) — 1 — — 48 Foreign government, agency and
municipal securities 3 0 — 19 (20 ) — 0 0 0 2 Bank and corporate debt securities and
loans for trading purposes 167 (1) — 84 (125 ) — (1) 17 (14) 127 Commercial mortgage-backed securities
(“CMBS”) 2 2 — 8 (2 ) — 0 — — 10 Residential mortgage-backed securities
(“RMBS”) 1 0 — 1 (1 ) — 0 — — 1 Real estate-backed securities 13 0 — 17 (6 ) — 0 13 — 37 Collateralized debt obligations (“CDOs”)
and other 15 (3) — 3 (5 ) — 0 9 (7) 12 Investment trust funds and other 4 0 — 0 0 — 0 0 (3) 1
Total trading assets and private equity investments 293 0 — 138 (171 ) — 0 41 (25) 276 Derivatives, net(4)
Equity contracts (6) 9 — 0 0 (2) 0 0 (1) 0 Interest rate contracts (22) (20) — 0 (2 ) 25 0 (7) 2 (24) Credit contracts 4 (2) — — — (4) 0 (4) 6 0 Foreign exchange contracts (5) (10) — — — 19 0 1 (3) 2 Commodity contracts 0 0 — — — 0 0 0 — 0
Total derivatives, net (29) (23) — 0 (2 ) 38 0 (10) 4 (22) Subtotal ¥ 264 ¥ (23) ¥ — ¥ 138 ¥ (173) ¥ 38 ¥ 0 ¥ 31 ¥ (21) ¥ 254
Loans and receivables 15 0 — 4 (1 ) — 0 8 — 26 Other assets
Non-trading debt securities 0 0 — — — — 0 — — 0 Other 57 4 0 1 (4 ) — 0 — — 58
Total ¥ 336 ¥ (19) ¥ 0 ¥ 143 ¥ (178) ¥ 38 ¥ 0 ¥ 39 ¥ (21) ¥ 338
Liabilities: Trading liabilities
Equities ¥ 3 ¥ (1) ¥ — ¥ 1 ¥ (2) ¥ — ¥ 0 ¥ 0 ¥ (2) ¥ 1 Bank and corporate debt securities 0 0 — 0 0 — 0 1 0 1
Total trading liabilities ¥ 3 ¥ (1) ¥ — ¥ 1 ¥ (2) ¥ — ¥ 0 ¥ 1 ¥ (2) ¥ 2 Short-term borrowings 1 0 — 1 0 — — — 0 2 Payables and deposits 0 0 — (1) 0 — — — — (1) Long-term borrowings 525 32 — 180 (259 ) — (1) 38 (35) 416
Total ¥ 529 ¥ 31 ¥ — ¥ 181 ¥ (261) ¥ — ¥ (1) ¥ 39 ¥ (37) ¥ 419
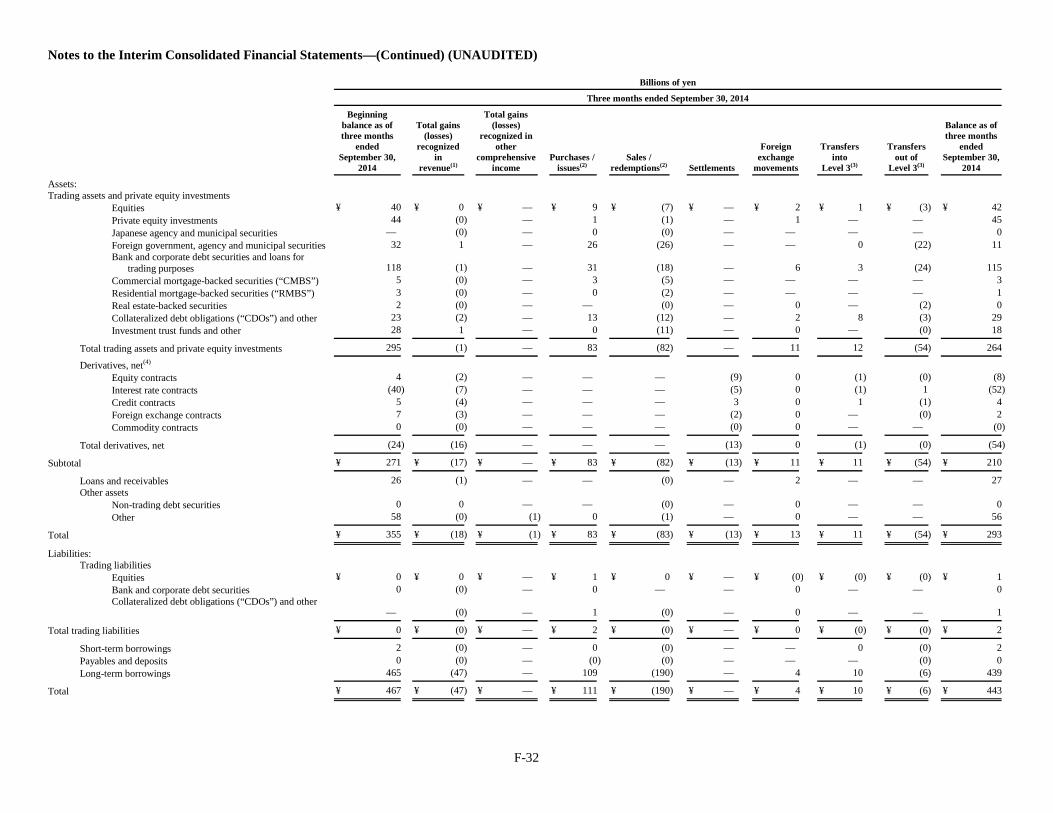
F-32
Notes to the Interim Consolidated Financial Statements—(Continued) (UNAUDITED)
Billions of yen
Three months ended September 30, 2014
Beginning balance as of three months
ended September 30,
2014
Total gains (losses)
recognized in
revenue(1)
Total gains (losses)
recognized in other
comprehensive income
Purchases / issues(2)
Sales / redemptions(2)
Settlements
Foreign exchange
movements
Transfers into
Level 3(3)
Transfers out of
Level 3(3)
Balance as of three months
ended September 30,
2014
Assets: Trading assets and private equity investments
Equities ¥ 40 ¥ 0 ¥ — ¥ 9 ¥ (7) ¥ — ¥ 2 ¥ 1 ¥ (3) ¥ 42 Private equity investments 44 (0) — 1 (1) — 1 — — 45 Japanese agency and municipal securities — (0) — 0 (0) — — — — 0 Foreign government, agency and municipal securities 32 1 — 26 (26) — — 0 (22) 11 Bank and corporate debt securities and loans for
trading purposes 118 (1) — 31 (18) — 6 3 (24) 115 Commercial mortgage-backed securities (“CMBS”) 5 (0) — 3 (5) — — — — 3 Residential mortgage-backed securities (“RMBS”) 3 (0) — 0 (2) — — — — 1 Real estate-backed securities 2 (0) — — (0) — 0 — (2) 0 Collateralized debt obligations (“CDOs”) and other 23 (2) — 13 (12) — 2 8 (3) 29 Investment trust funds and other 28 1 — 0 (11) — 0 — (0) 18
Total trading assets and private equity investments 295 (1) — 83 (82) — 11 12 (54) 264
Derivatives, net(4)
Equity contracts 4 (2) — — — (9) 0 (1) (0) (8) Interest rate contracts (40) (7) — — — (5) 0 (1) 1 (52) Credit contracts 5 (4) — — — 3 0 1 (1) 4 Foreign exchange contracts 7 (3) — — — (2) 0 — (0) 2 Commodity contracts 0 (0) — — — (0) 0 — — (0)
Total derivatives, net (24) (16) — — — (13) 0 (1) (0) (54)
Subtotal ¥ 271 ¥ (17) ¥ — ¥ 83 ¥ (82) ¥ (13) ¥ 11 ¥ 11 ¥ (54) ¥ 210
Loans and receivables 26 (1) — — (0) — 2 — — 27 Other assets
Non-trading debt securities 0 0 — — (0) — 0 — — 0 Other 58 (0) (1) 0 (1) — 0 — — 56
Total ¥ 355 ¥ (18) ¥ (1) ¥ 83 ¥ (83) ¥ (13) ¥ 13 ¥ 11 ¥ (54) ¥ 293
Liabilities:
Trading liabilities Equities ¥ 0 ¥ 0 ¥ — ¥ 1 ¥ 0 ¥ — ¥ (0) ¥ (0) ¥ (0) ¥ 1 Bank and corporate debt securities 0 (0) — 0 — — 0 — — 0 Collateralized debt obligations (“CDOs”) and other
— (0) — 1 (0) — 0 — — 1
Total trading liabilities ¥ 0 ¥ (0) ¥ — ¥ 2 ¥ (0) ¥ — ¥ 0 ¥ (0) ¥ (0) ¥ 2
Short-term borrowings 2 (0) — 0 (0) — — 0 (0) 2 Payables and deposits 0 (0) — (0 ) (0) — — — (0) 0 Long-term borrowings 465 (47) — 109 (190) — 4 10 (6) 439
Total ¥ 467 ¥ (47) ¥ — ¥ 111 ¥ (190) ¥ — ¥ 4 ¥ 10 ¥ (6) ¥ 443
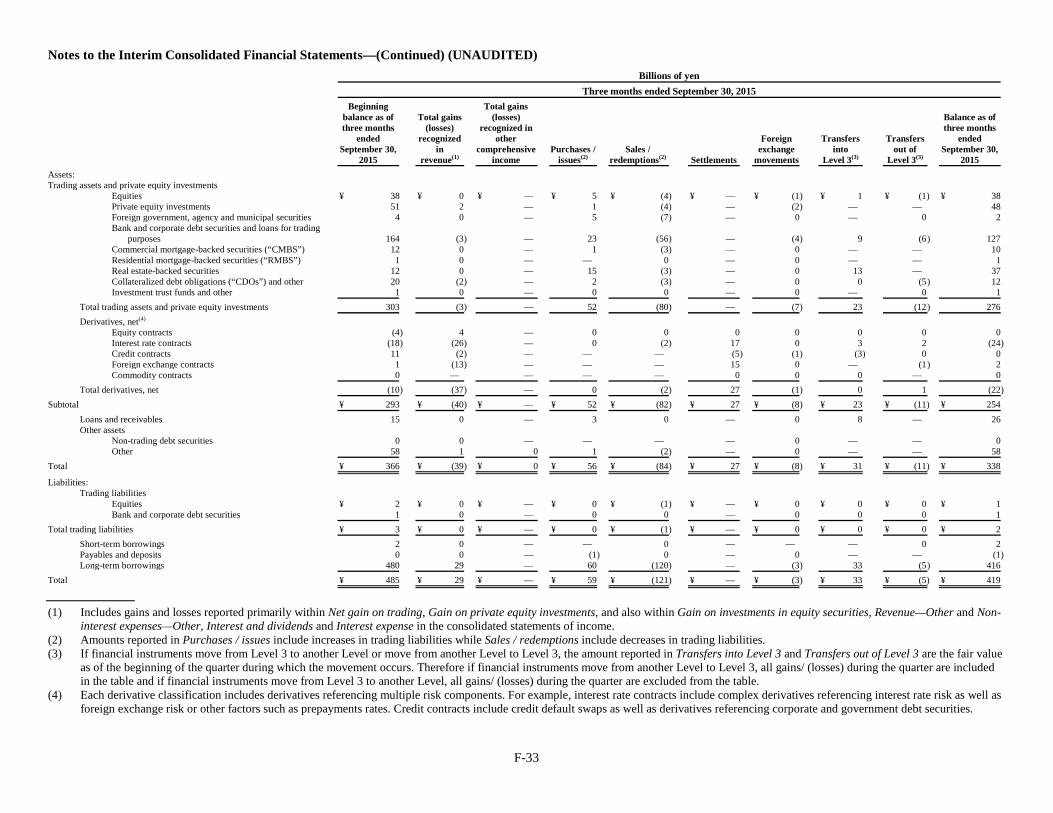
F-33
Notes to the Interim Consolidated Financial Statements—(Continued) (UNAUDITED)
Billions of yen
Three months ended September 30, 2015
Beginning balance as of three months
ended September 30,
2015
Total gains (losses)
recognized in
revenue(1)
Total gains (losses)
recognized in other
comprehensive income
Purchases / issues(2)
Sales / redemptions(2) Settlements
Foreign exchange
movements
Transfers into
Level 3(3)
Transfers out of
Level 3(3)
Balance as of three months
ended September 30,
2015 Assets: Trading assets and private equity investments
Equities ¥ 38 ¥ 0 ¥ — ¥ 5 ¥ (4) ¥ — ¥ (1) ¥ 1 ¥ (1) ¥ 38 Private equity investments 51 2 — 1 (4) — (2) — — 48 Foreign government, agency and municipal securities 4 0 — 5 (7) — 0 — 0 2 Bank and corporate debt securities and loans for trading
purposes 164 (3) — 23 (56) — (4) 9 (6 ) 127 Commercial mortgage-backed securities (“CMBS”) 12 0 — 1 (3) — 0 — — 10 Residential mortgage-backed securities (“RMBS”) 1 0 — — 0 — 0 — — 1 Real estate-backed securities 12 0 — 15 (3) — 0 13 — 37 Collateralized debt obligations (“CDOs”) and other 20 (2) — 2 (3) — 0 0 (5 ) 12 Investment trust funds and other 1 0 — 0 0 — 0 — 0 1
Total trading assets and private equity investments 303 (3) — 52 (80) — (7) 23 (12 ) 276 Derivatives, net(4)
Equity contracts (4) 4 — 0 0 0 0 0 0 0 Interest rate contracts (18) (26) — 0 (2) 17 0 3 2 (24) Credit contracts 11 (2) — — — (5) (1) (3) 0 0 Foreign exchange contracts 1 (13) — — — 15 0 — (1 ) 2 Commodity contracts 0 — — — — 0 0 0 — 0
Total derivatives, net (10) (37) — 0 (2) 27 (1) 0 1 (22) Subtotal ¥ 293 ¥ (40) ¥ — ¥ 52 ¥ (82) ¥ 27 ¥ (8) ¥ 23 ¥ (11) ¥ 254
Loans and receivables 15 0 — 3 0 — 0 8 — 26 Other assets
Non-trading debt securities 0 0 — — — — 0 — — 0 Other 58 1 0 1 (2) — 0 — — 58
Total ¥ 366 ¥ (39) ¥ 0 ¥ 56 ¥ (84) ¥ 27 ¥ (8) ¥ 31 ¥ (11) ¥ 338
Liabilities: Trading liabilities
Equities ¥ 2 ¥ 0 ¥ — ¥ 0 ¥ (1) ¥ — ¥ 0 ¥ 0 ¥ 0 ¥ 1 Bank and corporate debt securities 1 0 — 0 0 — 0 0 0 1
Total trading liabilities ¥ 3 ¥ 0 ¥ — ¥ 0 ¥ (1) ¥ — ¥ 0 ¥ 0 ¥ 0 ¥ 2 Short-term borrowings 2 0 — — 0 — — — 0 2 Payables and deposits 0 0 — (1) 0 — 0 — — (1) Long-term borrowings 480 29 — 60 (120) — (3) 33 (5 ) 416
Total ¥ 485 ¥ 29 ¥ — ¥ 59 ¥ (121) ¥ — ¥ (3) ¥ 33 ¥ (5) ¥ 419
(1) Includes gains and losses reported primarily within Net gain on trading, Gain on private equity investments, and also within Gain on investments in equity securities, Revenue—Other and Non-
interest expenses—Other, Interest and dividends and Interest expense in the consolidated statements of income. (2) Amounts reported in Purchases / issues include increases in trading liabilities while Sales / redemptions include decreases in trading liabilities. (3) If financial instruments move from Level 3 to another Level or move from another Level to Level 3, the amount reported in Transfers into Level 3 and Transfers out of Level 3 are the fair value
as of the beginning of the quarter during which the movement occurs. Therefore if financial instruments move from another Level to Level 3, all gains/ (losses) during the quarter are included in the table and if financial instruments move from Level 3 to another Level, all gains/ (losses) during the quarter are excluded from the table.
(4) Each derivative classification includes derivatives referencing multiple risk components. For example, interest rate contracts include complex derivatives referencing interest rate risk as well as foreign exchange risk or other factors such as prepayments rates. Credit contracts include credit default swaps as well as derivatives referencing corporate and government debt securities.
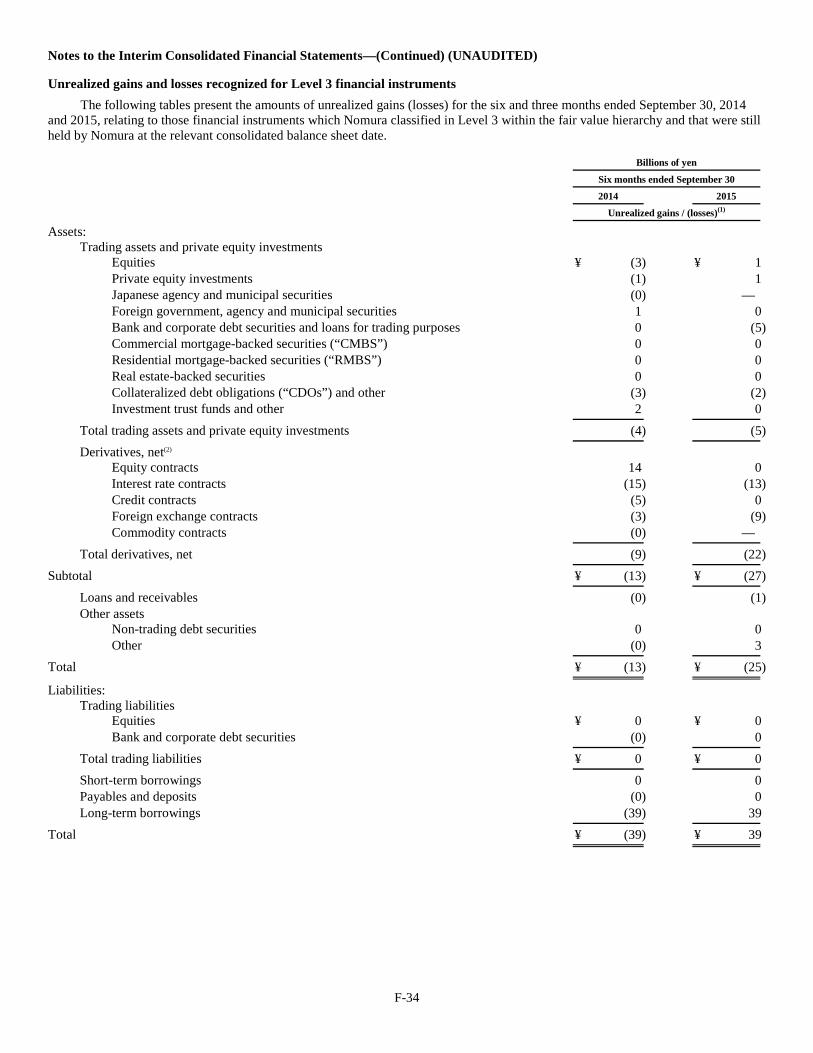
F-34
Notes to the Interim Consolidated Financial Statements—(Continued) (UNAUDITED)
Unrealized gains and losses recognized for Level 3 financial instruments The following tables present the amounts of unrealized gains (losses) for the six and three months ended September 30, 2014
and 2015, relating to those financial instruments which Nomura classified in Level 3 within the fair value hierarchy and that were still held by Nomura at the relevant consolidated balance sheet date.
Billions of yen
Six months ended September 30
2014
2015
Unrealized gains / (losses)(1)
Assets:
Trading assets and private equity investments
Equities ¥ (3) ¥ 1 Private equity investments (1) 1 Japanese agency and municipal securities (0) — Foreign government, agency and municipal securities 1 0 Bank and corporate debt securities and loans for trading purposes 0 (5) Commercial mortgage-backed securities (“CMBS”) 0 0 Residential mortgage-backed securities (“RMBS”) 0 0 Real estate-backed securities 0 0 Collateralized debt obligations (“CDOs”) and other (3) (2) Investment trust funds and other 2 0
Total trading assets and private equity investments (4) (5)
Derivatives, net(2)
Equity contracts 14 0 Interest rate contracts (15) (13) Credit contracts (5) 0 Foreign exchange contracts (3) (9) Commodity contracts (0) —
Total derivatives, net (9) (22)
Subtotal ¥ (13) ¥ (27)
Loans and receivables (0) (1) Other assets
Non-trading debt securities 0 0 Other (0) 3
Total ¥ (13) ¥ (25)
Liabilities:
Trading liabilities
Equities ¥ 0 ¥ 0 Bank and corporate debt securities (0) 0
Total trading liabilities ¥ 0 ¥ 0
Short-term borrowings 0 0 Payables and deposits (0) 0 Long-term borrowings (39) 39
Total ¥ (39) ¥ 39
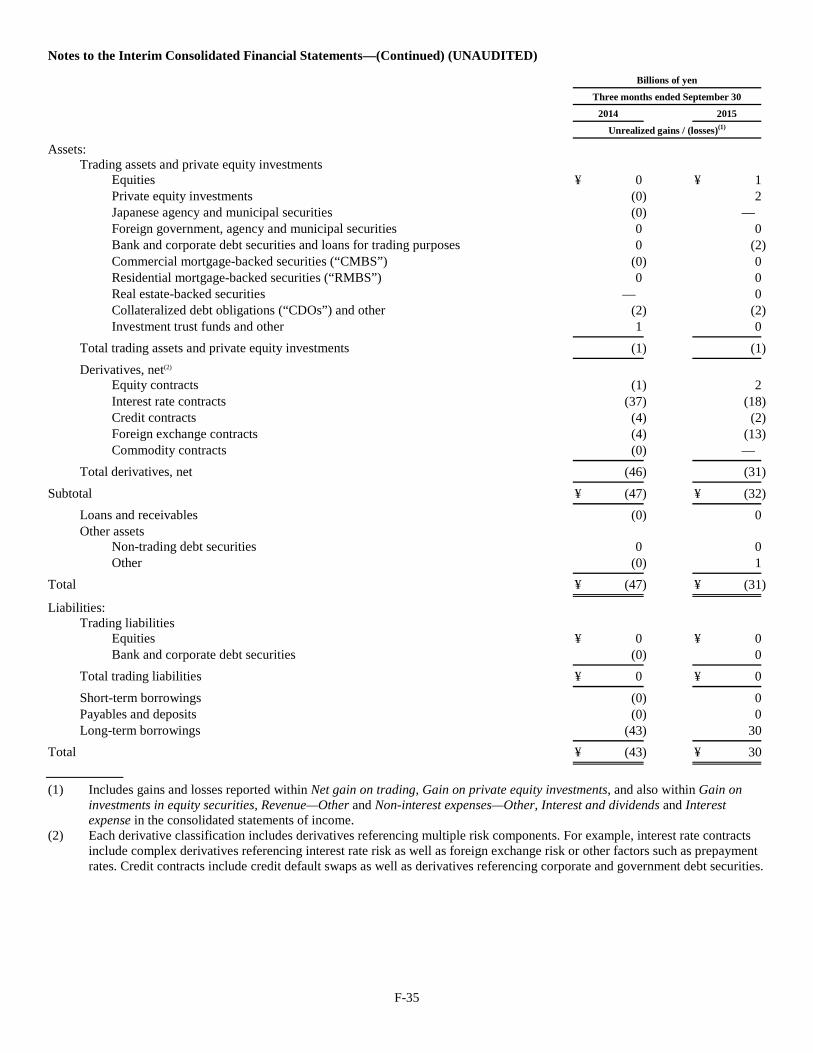
F-35
Notes to the Interim Consolidated Financial Statements—(Continued) (UNAUDITED)
Billions of yen
Three months ended September 30
2014
2015
Unrealized gains / (losses)(1)
Assets:
Trading assets and private equity investments
Equities ¥ 0 ¥ 1 Private equity investments (0) 2 Japanese agency and municipal securities (0) — Foreign government, agency and municipal securities 0 0 Bank and corporate debt securities and loans for trading purposes 0 (2) Commercial mortgage-backed securities (“CMBS”) (0) 0 Residential mortgage-backed securities (“RMBS”) 0 0 Real estate-backed securities — 0 Collateralized debt obligations (“CDOs”) and other (2) (2) Investment trust funds and other 1 0
Total trading assets and private equity investments (1) (1)
Derivatives, net(2)
Equity contracts (1) 2 Interest rate contracts (37) (18) Credit contracts (4) (2) Foreign exchange contracts (4) (13) Commodity contracts (0) —
Total derivatives, net (46) (31)
Subtotal ¥ (47) ¥ (32)
Loans and receivables (0) 0 Other assets
Non-trading debt securities 0 0 Other (0) 1
Total ¥ (47) ¥ (31)
Liabilities:
Trading liabilities
Equities ¥ 0 ¥ 0 Bank and corporate debt securities (0) 0
Total trading liabilities ¥ 0 ¥ 0
Short-term borrowings (0) 0 Payables and deposits (0) 0 Long-term borrowings (43) 30
Total ¥ (43) ¥ 30
(1) Includes gains and losses reported within Net gain on trading, Gain on private equity investments, and also within Gain on
investments in equity securities, Revenue—Other and Non-interest expenses—Other, Interest and dividends and Interest expense in the consolidated statements of income.
(2) Each derivative classification includes derivatives referencing multiple risk components. For example, interest rate contracts include complex derivatives referencing interest rate risk as well as foreign exchange risk or other factors such as prepayment rates. Credit contracts include credit default swaps as well as derivatives referencing corporate and government debt securities.
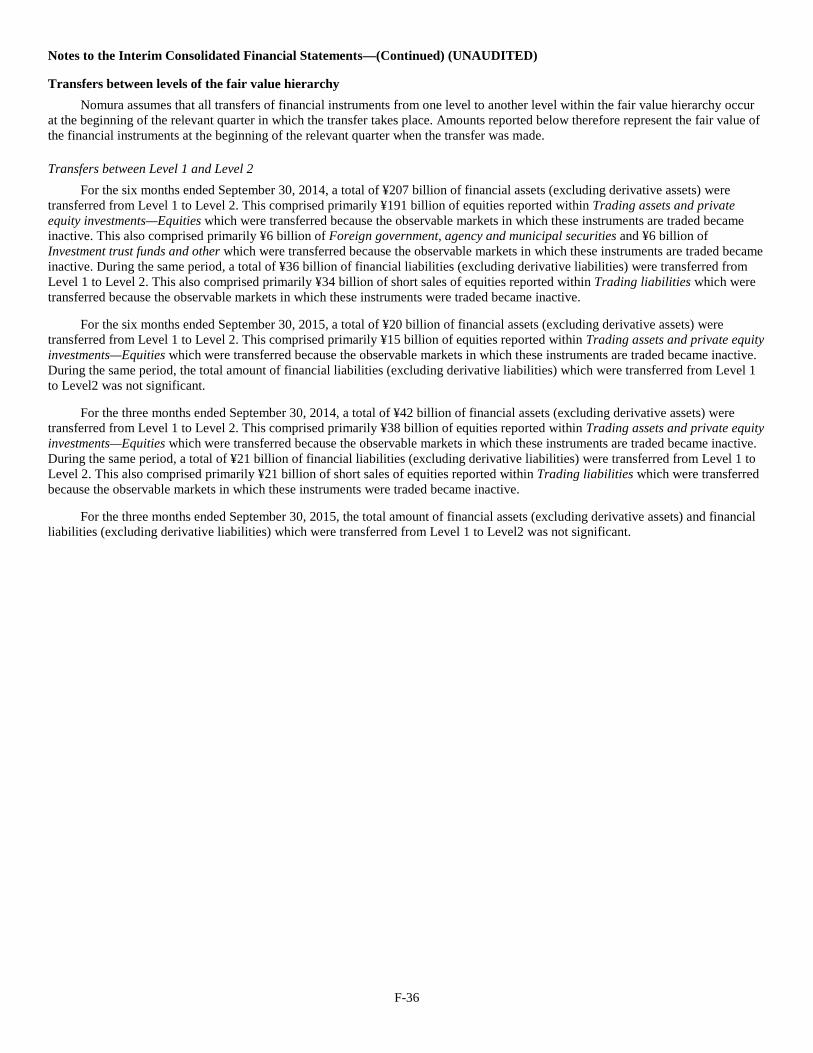
F-36
Notes to the Interim Consolidated Financial Statements—(Continued) (UNAUDITED)
Transfers between levels of the fair value hierarchy Nomura assumes that all transfers of financial instruments from one level to another level within the fair value hierarchy occur
at the beginning of the relevant quarter in which the transfer takes place. Amounts reported below therefore represent the fair value of the financial instruments at the beginning of the relevant quarter when the transfer was made.
Transfers between Level 1 and Level 2 For the six months ended September 30, 2014, a total of ¥207 billion of financial assets (excluding derivative assets) were
transferred from Level 1 to Level 2. This comprised primarily ¥191 billion of equities reported within Trading assets and private equity investments—Equities which were transferred because the observable markets in which these instruments are traded became inactive. This also comprised primarily ¥6 billion of Foreign government, agency and municipal securities and ¥6 billion of Investment trust funds and other which were transferred because the observable markets in which these instruments are traded became inactive. During the same period, a total of ¥36 billion of financial liabilities (excluding derivative liabilities) were transferred from Level 1 to Level 2. This also comprised primarily ¥34 billion of short sales of equities reported within Trading liabilities which were transferred because the observable markets in which these instruments were traded became inactive.
For the six months ended September 30, 2015, a total of ¥20 billion of financial assets (excluding derivative assets) were transferred from Level 1 to Level 2. This comprised primarily ¥15 billion of equities reported within Trading assets and private equity investments—Equities which were transferred because the observable markets in which these instruments are traded became inactive. During the same period, the total amount of financial liabilities (excluding derivative liabilities) which were transferred from Level 1 to Level2 was not significant.
For the three months ended September 30, 2014, a total of ¥42 billion of financial assets (excluding derivative assets) were transferred from Level 1 to Level 2. This comprised primarily ¥38 billion of equities reported within Trading assets and private equity investments—Equities which were transferred because the observable markets in which these instruments are traded became inactive. During the same period, a total of ¥21 billion of financial liabilities (excluding derivative liabilities) were transferred from Level 1 to Level 2. This also comprised primarily ¥21 billion of short sales of equities reported within Trading liabilities which were transferred because the observable markets in which these instruments were traded became inactive.
For the three months ended September 30, 2015, the total amount of financial assets (excluding derivative assets) and financial liabilities (excluding derivative liabilities) which were transferred from Level 1 to Level2 was not significant.
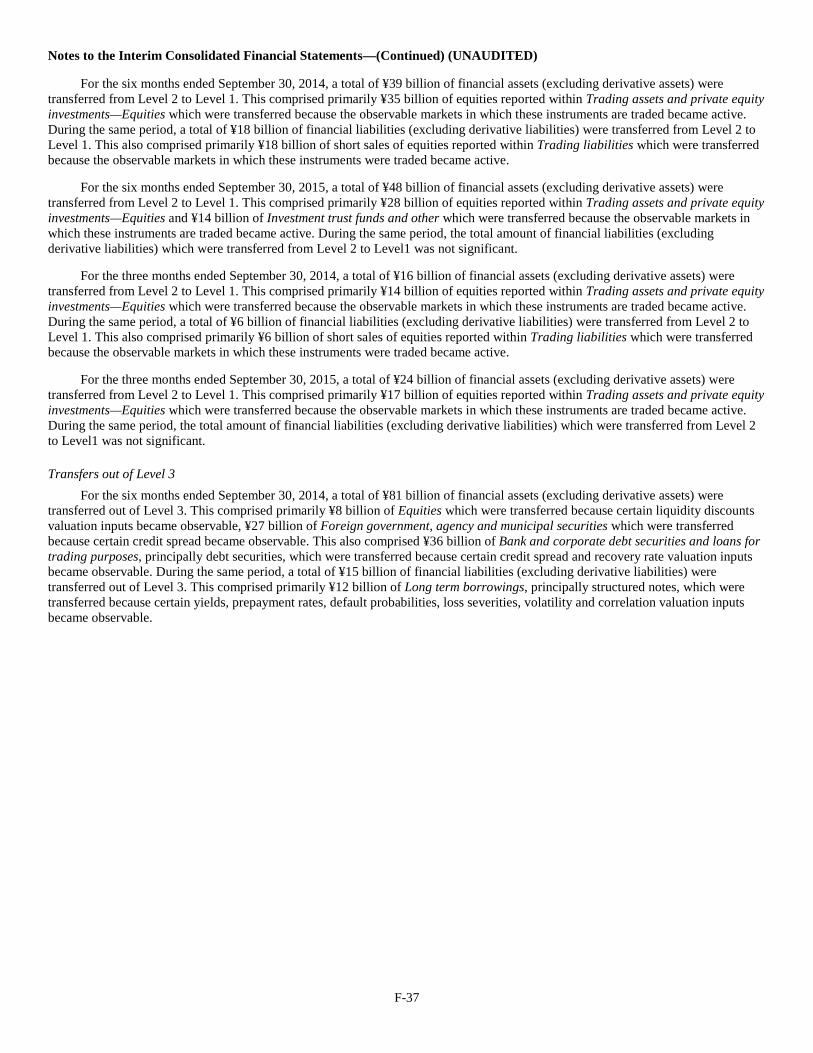
F-37
Notes to the Interim Consolidated Financial Statements—(Continued) (UNAUDITED)
For the six months ended September 30, 2014, a total of ¥39 billion of financial assets (excluding derivative assets) were transferred from Level 2 to Level 1. This comprised primarily ¥35 billion of equities reported within Trading assets and private equity investments—Equities which were transferred because the observable markets in which these instruments are traded became active. During the same period, a total of ¥18 billion of financial liabilities (excluding derivative liabilities) were transferred from Level 2 to Level 1. This also comprised primarily ¥18 billion of short sales of equities reported within Trading liabilities which were transferred because the observable markets in which these instruments were traded became active.
For the six months ended September 30, 2015, a total of ¥48 billion of financial assets (excluding derivative assets) were transferred from Level 2 to Level 1. This comprised primarily ¥28 billion of equities reported within Trading assets and private equity investments—Equities and ¥14 billion of Investment trust funds and other which were transferred because the observable markets in which these instruments are traded became active. During the same period, the total amount of financial liabilities (excluding derivative liabilities) which were transferred from Level 2 to Level1 was not significant.
For the three months ended September 30, 2014, a total of ¥16 billion of financial assets (excluding derivative assets) were transferred from Level 2 to Level 1. This comprised primarily ¥14 billion of equities reported within Trading assets and private equity investments—Equities which were transferred because the observable markets in which these instruments are traded became active. During the same period, a total of ¥6 billion of financial liabilities (excluding derivative liabilities) were transferred from Level 2 to Level 1. This also comprised primarily ¥6 billion of short sales of equities reported within Trading liabilities which were transferred because the observable markets in which these instruments were traded became active.
For the three months ended September 30, 2015, a total of ¥24 billion of financial assets (excluding derivative assets) were transferred from Level 2 to Level 1. This comprised primarily ¥17 billion of equities reported within Trading assets and private equity investments—Equities which were transferred because the observable markets in which these instruments are traded became active. During the same period, the total amount of financial liabilities (excluding derivative liabilities) which were transferred from Level 2 to Level1 was not significant.
Transfers out of Level 3 For the six months ended September 30, 2014, a total of ¥81 billion of financial assets (excluding derivative assets) were
transferred out of Level 3. This comprised primarily ¥8 billion of Equities which were transferred because certain liquidity discounts valuation inputs became observable, ¥27 billion of Foreign government, agency and municipal securities which were transferred because certain credit spread became observable. This also comprised ¥36 billion of Bank and corporate debt securities and loans for trading purposes, principally debt securities, which were transferred because certain credit spread and recovery rate valuation inputs became observable. During the same period, a total of ¥15 billion of financial liabilities (excluding derivative liabilities) were transferred out of Level 3. This comprised primarily ¥12 billion of Long term borrowings, principally structured notes, which were transferred because certain yields, prepayment rates, default probabilities, loss severities, volatility and correlation valuation inputs became observable.
F-38
Notes to the Interim Consolidated Financial Statements—(Continued) (UNAUDITED)
For the six months ended September 30, 2014, the total amount of net derivative liabilities which were transferred out of Level 3 was not significant.
For the six months ended September 30, 2015, a total of ¥25 billion of financial assets (excluding derivative assets) were transferred out of Level 3. This comprised ¥14 billion of Bank and corporate debt securities and loans for trading purposes, principally debt securities, which were transferred because certain credit spread and recovery rate valuation inputs became observable. During the same period, a total of ¥37 billion of financial liabilities (excluding derivative liabilities) were transferred out of Level 3. This comprised primarily ¥35 billion of Long term borrowings, principally structured notes, which were transferred because certain volatility and correlation valuation inputs became observable.
For the six months ended September 30, 2015, the total amount of net derivative liabilities which were transferred out of Level 3 was not significant.
For the three months ended September 30, 2014, a total of ¥54 billion of financial assets (excluding derivative assets) were transferred out of Level 3. This comprised primarily ¥22 billion of Foreign government, agency and municipal securities which were transferred because certain credit spread became observable. This also comprised ¥24 billion of Bank and corporate debt securities and loans for trading purposes, principally debt securities, which were transferred because certain credit spread and recovery rate valuation inputs became observable. During the same period, a total of ¥6 billion of financial liabilities (excluding derivative liabilities) were transferred out of Level 3. This comprised primarily ¥6 billion of Long term borrowings, principally structured notes, which were transferred because certain yields, prepayment rates, default probabilities, loss severities, volatility and correlation valuation inputs became observable.
For the three months ended September 30, 2014, the total amount of net derivative assets which were transferred out of Level 3 was not significant.
For the three months ended September 30, 2015, a total of ¥12 billion of financial assets (excluding derivative assets) were transferred out of Level 3. During the same period, the total amount of financial liabilities (excluding derivative liabilities) which were transferred out of Level3 was not significant.
For the three months ended September 30, 2015, the total amount of net derivative liabilities which were transferred out of Level 3 was not significant.
F-39
Notes to the Interim Consolidated Financial Statements—(Continued) (UNAUDITED)
Transfers into Level 3 For the six months ended September 30, 2014, a total of ¥31 billion of financial assets (excluding derivative assets) were
transferred into Level 3. This comprised primarily ¥5 billion of Foreign government, agency and municipal securities which were transferred because certain credit spread became unobservable and ¥11 billion of Bank and corporate debt securities and loans for trading purposes which were transferred because certain credit spread and recovery rate valuation inputs became unobservable. This also comprised primarily ¥9 billion of Collateralized debt obligations (“CDOs”) and other which were transferred because certain yields, prepayment rates, default probabilities and loss severities became unobservable. The amount of gains and losses on these transfers reported in Foreign government, agency and municipal securities, Bank and corporate debt securities and loans for trading purposes and Collateralized debt obligations (“CDOs”) and other which were recognized in the quarter when the transfer in to Level 3 occurred were not significant. During the same period, a total of ¥32 billion of financial liabilities (excluding derivative liabilities) were transferred into Level 3. This comprised primarily ¥32 billion of Long term borrowings, principally structured notes, which were transferred because certain yields, prepayment rates, default probabilities, loss severities, volatility and correlation valuation inputs became unobservable. The amount of gains and losses on these transfers reported in Long term borrowings which were recognized in the quarter when the transfer into Level 3 occurred was not significant.
For the six months ended September 30, 2014, a total of ¥3 billion of net derivative liabilities were also transferred into Level 3. The amount of gains and losses which were recognized in the quarter when the transfer into Level 3 occurred was not significant.
For the six months ended September 30, 2015, a total of ¥49 billion of financial assets (excluding derivative assets) were transferred into Level 3. This comprised primarily ¥17 billion of Bank and corporate debt securities and loans for trading purposes which were transferred because certain credit spread and recovery rate valuation inputs became unobservable. This also comprised primarily ¥13 billion of Real estate-backed securities which were transferred because certain yields and loss severities became unobservable. The amount of gains and losses on these transfers reported in Bank and corporate debt securities and loans for trading purposes and Real estate-backed securities which were recognized in the quarter when the transfer in to Level 3 occurred were not significant. During the same period, a total of ¥39 billion of financial liabilities (excluding derivative liabilities) were transferred into Level 3. This comprised primarily ¥38 billion of Long term borrowings, principally structured notes, which were transferred because certain volatility and correlation valuation inputs became unobservable. The amount of gains and losses on these transfers reported in Long term borrowings which were recognized in the quarter when the transfer into Level 3 occurred was not significant.
For the six months ended September 30, 2015, a total of ¥10 billion of net derivative liabilities were also transferred into Level 3. The amount of gains and losses which were recognized in the quarter when the transfer into Level 3 occurred was not significant.
For the three months ended September 30, 2014, a total of ¥12 billion of financial assets (excluding derivative assets) were transferred into Level 3. This comprised primarily ¥8 billion of Collateralized debt obligations (“CDOs”) and other which were transferred because certain yields, prepayment rates, default probabilities and loss severities became unobservable. The amount of gains and losses on these transfers reported in Collateralized debt obligations (“CDOs”) and other which were recognized in the quarter when the transfer in to Level 3 occurred were not significant. During the same period, a total of ¥10 billion of financial liabilities (excluding derivative liabilities) were transferred into Level 3. This comprised primarily ¥10 billion of Long term borrowings, principally structured notes, which were transferred because certain yields, prepayment rates, default probabilities, loss severities, volatility and correlation valuation inputs became unobservable. The amount of gains and losses on these transfers reported in Long term borrowings which were recognized in the quarter when the transfer into Level 3 occurred was not significant.
F-40
Notes to the Interim Consolidated Financial Statements—(Continued) (UNAUDITED)
For the three months ended September 30, 2014, a total amount of net derivative liabilities which were transferred into Level 3 was not significant. The amount of gains and losses which were recognized in the quarter when the transfer into Level 3 occurred was not significant.
For the three months ended September 30, 2015, a total of ¥31 billion of financial assets (excluding derivative assets) were transferred into Level 3. This comprised primarily ¥13 billion of Real estate-backed securities which were transferred because certain yields and loss severities became unobservable. The amount of gains and losses on these transfers reported in Real estate-backed securities which were recognized in the quarter when the transfer in to Level 3 occurred were not significant. During the same period, a total of ¥33 billion of financial liabilities (excluding derivative liabilities) were transferred into Level 3. This comprised primarily ¥33 billion of Long term borrowings, principally structured notes, which were transferred because certain volatility and correlation valuation inputs became unobservable. The amount of gains and losses on these transfers reported in Long term borrowings which were recognized in the quarter when the transfer into Level 3 occurred was not significant.
For the three months ended September 30, 2015, a total amount of net derivative liabilities which were transferred into Level 3 was not significant. The amount of gains and losses which were recognized in the quarter when the transfer into Level 3 occurred was not significant.
Investments in investment funds that calculate NAV per share In the normal course of business, Nomura invests in non-consolidated funds which meet the definition of investment companies
or are similar in nature and which do not have readily determinable fair values. For certain of these investments, Nomura uses NAV per share as the basis for valuation as a practical expedient. Some of these investments are redeemable at different amounts from NAV per share.
The following tables present information on these investments where NAV per share is calculated or disclosed as of March 31, 2015 and September 30, 2015. Investments are presented by major category relevant to the nature of Nomura’s business and risks.
Billions of yen
March 31, 2015
Fair value
Unfunded commitments(1)
Redemption frequency (if currently eligible)(2)
Redemption notice period(3)
Hedge funds ¥ 98 ¥ 0 Monthly Same day-90 days Venture capital funds 3 1 — — Private equity funds 47 20 — — Real estate funds 1 — — —
Total ¥ 149 ¥ 21
Billions of yen
September 30, 2015
Fair value
Unfunded commitments(1)
Redemption frequency (if currently eligible)(2)
Redemption notice period(3)
Hedge funds ¥ 83 ¥ 0 Monthly Same day-90 days Venture capital funds 2 1 — — Private equity funds 48 20 — — Real estate funds 1 — — —
Total ¥ 134 ¥ 21
(1) The contractual amount of any unfunded commitments Nomura is required to make to the entities in which the investment is
held. (2) The range in frequency with which Nomura can redeem investments. (3) The range in notice period required to be provided before redemption is possible.
F-41
Notes to the Interim Consolidated Financial Statements—(Continued) (UNAUDITED)
Hedge funds: These investments include funds of funds that invest in multiple asset classes. The fair values of these investments are
determined using NAV per share. Although most of these funds can be redeemed within six months, certain funds cannot be redeemed within six months due to contractual, liquidity or gating issues. The redemption period cannot be estimated for certain suspended or liquidating funds. Some of these investments contain restrictions against transfers of the investments to third parties.
Venture capital funds: These investments include primarily start-up funds. The fair values of these investments are determined using NAV per share.
Most of these funds cannot be redeemed within six months. The redemption period cannot be estimated for certain suspended or liquidating funds. These investments contain restrictions against transfers of the investments to third parties.
Private equity funds: These investments are made mainly in various sectors in Europe, United States and Japan. The fair values of these investments
are determined using NAV per share. Redemption is restricted for most of these investments. Some of these investments contain restrictions against transfers of the investments to third parties.
Real estate funds: These are investments in commercial and other types of real estate. The fair values of these investments are determined using
NAV per share. Redemption is restricted for most of these investments. These investments contain restrictions against transfers of the investments to third parties.
Fair value option for financial assets and financial liabilities Nomura carries certain eligible financial assets and liabilities at fair value through the election of the fair value option permitted
by ASC 815 “Derivatives and Hedging” (“ASC 815”) and ASC 825 “Financial Instruments”. When Nomura elects the fair value option for an eligible item, changes in that item’s fair value are recognized through earnings. Election of the fair value option is generally irrevocable unless an event occurs that gives rise to a new basis of accounting for that instrument.
The financial assets and financial liabilities primarily elected for the fair value option by Nomura, and the reasons for the election, are as follows:
• Equity method investments reported within Trading assets and private equity investments and Other assets held for capital appreciation or current income purposes which Nomura generally has an intention to exit rather than hold indefinitely. Nomura elects the fair value option to more appropriately represent the purpose of these investments in these consolidated financial statements.
• Loans reported within Loans and receivables which are risk managed on a fair value basis and loan commitments related to loans receivable for which the fair value option will be elected upon funding. Nomura elects the fair value option to mitigate volatility through earnings caused by the difference in measurement basis that otherwise would arise between loans and the derivatives used to risk manage those instruments.
• Reverse repurchase and repurchase agreements reported within Collateralized agreements and Collateralized financing which are risk managed on a fair value basis. Nomura elects the fair value option to mitigate volatility through earnings caused by the difference in measurement basis that otherwise would arise between the reverse repurchase and repurchase agreements and the derivatives used to risk manage those instruments.
• All structured notes issued on or after April 1, 2008 reported within Short-term borrowings and Long-term borrowings. Nomura elects the fair value option for those structured notes primarily to mitigate the volatility through earnings caused by differences in the measurement basis for structured notes and the derivatives Nomura uses to risk manage those positions. Nomura also elects the fair value option for certain notes issued by consolidated VIEs for the same purpose and for certain structured notes issued prior to April 1, 2008.
• Financial liabilities reported within Long-term borrowings recognized in transactions which are accounted for as secured financing transactions under ASC 860. Nomura elects the fair value option for these financial liabilities to mitigate volatility through earnings that otherwise would arise had this election not been made. Even though Nomura usually has little or no continuing economic exposure to the transferred financial assets, they remain on the consolidated balance sheets and continue to be carried at fair value, with changes in fair value recognized through earnings.
Interest and dividends arising from financial instruments for which the fair value option has been elected are recognized within Interest and dividends, Interest expense or Net gain on trading.
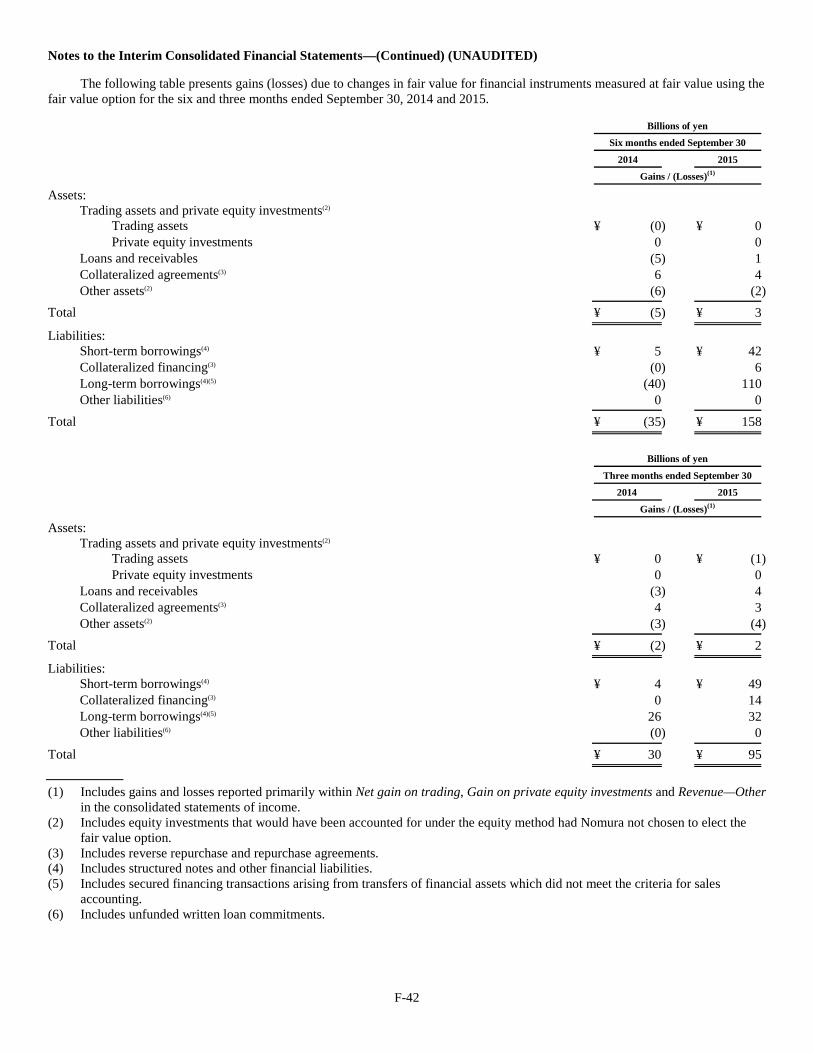
F-42
Notes to the Interim Consolidated Financial Statements—(Continued) (UNAUDITED)
The following table presents gains (losses) due to changes in fair value for financial instruments measured at fair value using the fair value option for the six and three months ended September 30, 2014 and 2015.
Billions of yen
Six months ended September 30
2014
2015
Gains / (Losses)(1)
Assets:
Trading assets and private equity investments(2)
Trading assets ¥ (0) ¥ 0 Private equity investments 0 0
Loans and receivables (5) 1 Collateralized agreements(3) 6 4 Other assets(2) (6) (2)
Total ¥ (5) ¥ 3
Liabilities:
Short-term borrowings(4) ¥ 5 ¥ 42 Collateralized financing(3) (0) 6 Long-term borrowings(4)(5) (40) 110 Other liabilities(6) 0 0
Total ¥ (35) ¥ 158
Billions of yen
Three months ended September 30
2014
2015
Gains / (Losses)(1)
Assets:
Trading assets and private equity investments(2)
Trading assets ¥ 0 ¥ (1) Private equity investments 0 0
Loans and receivables (3) 4 Collateralized agreements(3) 4 3 Other assets(2) (3) (4)
Total ¥ (2) ¥ 2
Liabilities:
Short-term borrowings(4) ¥ 4 ¥ 49 Collateralized financing(3) 0 14 Long-term borrowings(4)(5) 26 32 Other liabilities(6) (0) 0
Total ¥ 30 ¥ 95
(1) Includes gains and losses reported primarily within Net gain on trading, Gain on private equity investments and Revenue—Other
in the consolidated statements of income. (2) Includes equity investments that would have been accounted for under the equity method had Nomura not chosen to elect the
fair value option. (3) Includes reverse repurchase and repurchase agreements. (4) Includes structured notes and other financial liabilities. (5) Includes secured financing transactions arising from transfers of financial assets which did not meet the criteria for sales
accounting. (6) Includes unfunded written loan commitments.
F-43
Notes to the Interim Consolidated Financial Statements—(Continued) (UNAUDITED)
Nomura currently carries its investment in the common stock of Ashikaga Holdings Co., Ltd. (“Ashikaga Holdings”) at fair value through election of the fair value option. Nomura held 36.9% as of September 30, 2015. This investment was reported within Other assets—Other as of September 30, 2015 in the consolidated balance sheets.
On November 2, 2015, Ashikaga Holdings agreed to merge with Joyo Bank, Ltd. through a share exchange which is scheduled to be effective on October 1, 2016. Nomura’s investment in the common stock of Ashikaga Holdings will continuously be carried at fair value after the share exchange.
Nomura calculates the impact of changes in its own creditworthiness on certain financial liabilities for which the fair value option is elected by DCF valuation techniques at a rate which incorporates observable changes in its credit spread.
Losses from changes in the fair value of the financial liabilities for which the fair value option was elected, attributable to the change in its creditworthiness were ¥2 billion for the six months ended September 30, 2014, mainly due to the changes of Nomura’s credit spread. Gains from changes in the fair value of the financial liabilities for which the fair value option was elected, attributable to the change in its creditworthiness were ¥22 billion for the six months ended September 30, 2015, mainly because of the widening of Nomura’s credit spread.
Gains from changes in the fair value of the financial liabilities for which the fair value option was elected, attributable to the change in its creditworthiness were ¥7 billion for the three months ended September 30, 2014, mainly due to the widening of Nomura’s credit spread. Gains from changes in the fair value of the financial liabilities for which the fair value option was elected, attributable to the change in its creditworthiness were ¥9 billion for the three months ended September 30, 2015, mainly because of the widening of Nomura’s credit spread.
There was no significant impact on financial assets for which the fair value option was elected attributable to instrument-specific credit risk.
As of March 31, 2015, the fair value of the aggregate unpaid principal balance (which is contractually principally protected) of loans and receivables for which the fair value option was elected was ¥1 billion more than the principal balance of such loans and receivables. The fair value of the aggregate unpaid principal balance (which is contractually principally protected) of long-term borrowings for which the fair value option was elected was ¥1 billion more than the principal balance of such long-term borrowings. There were no loans and receivables for which the fair value option was elected that were 90 days or more past due.
As of September 30, 2015, the fair value of the aggregate unpaid principal balance (which is contractually principally protected) of loans and receivables for which the fair value option was elected was ¥1 billion more than the principal balance of such loans and receivables. The fair value of the aggregate unpaid principal balance (which is contractually principally protected) of long-term borrowings for which the fair value option was elected was ¥26 billion less than the principal balance of such long-term borrowings. There were no loans and receivables for which the fair value option was elected that were 90 days or more past due.
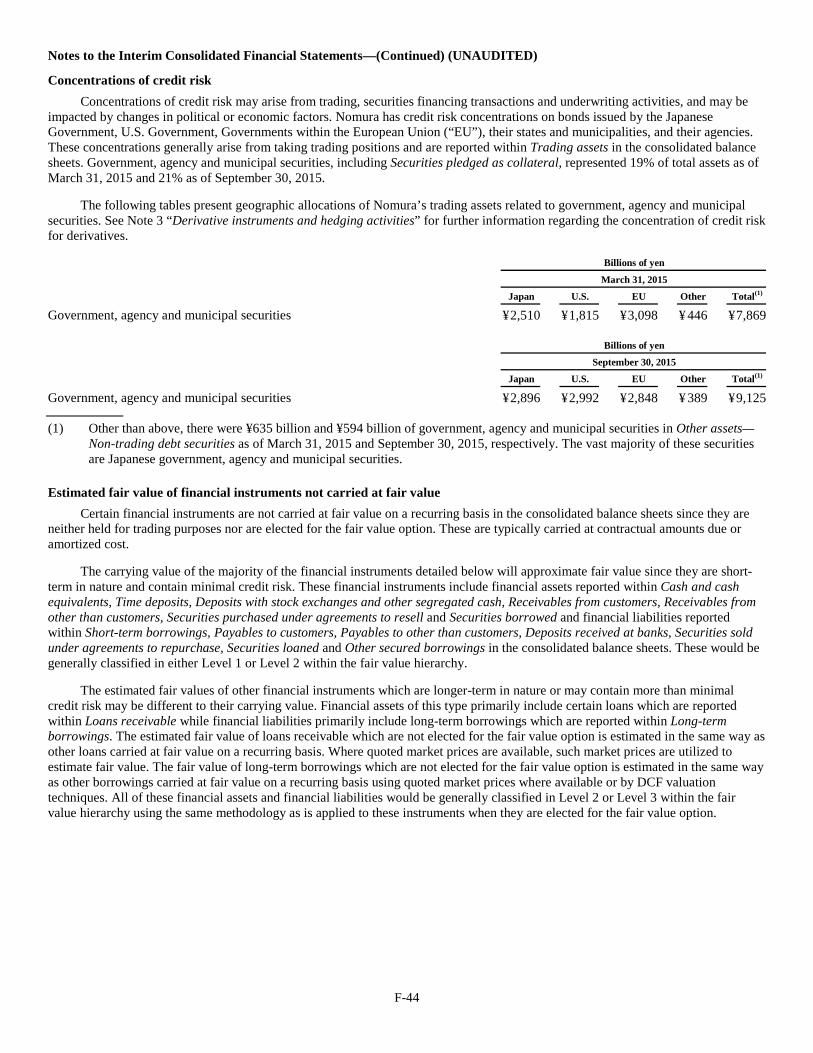
F-44
Notes to the Interim Consolidated Financial Statements—(Continued) (UNAUDITED)
Concentrations of credit risk Concentrations of credit risk may arise from trading, securities financing transactions and underwriting activities, and may be
impacted by changes in political or economic factors. Nomura has credit risk concentrations on bonds issued by the Japanese Government, U.S. Government, Governments within the European Union (“EU”), their states and municipalities, and their agencies. These concentrations generally arise from taking trading positions and are reported within Trading assets in the consolidated balance sheets. Government, agency and municipal securities, including Securities pledged as collateral, represented 19% of total assets as of March 31, 2015 and 21% as of September 30, 2015.
The following tables present geographic allocations of Nomura’s trading assets related to government, agency and municipal securities. See Note 3 “Derivative instruments and hedging activities” for further information regarding the concentration of credit risk for derivatives.
Billions of yen
March 31, 2015
Japan
U.S.
EU
Other
Total(1)
Government, agency and municipal securities ¥ 2,510 ¥ 1,815 ¥ 3,098 ¥ 446 ¥ 7,869
Billions of yen
September 30, 2015
Japan
U.S.
EU
Other
Total(1)
Government, agency and municipal securities ¥ 2,896 ¥ 2,992 ¥ 2,848 ¥ 389 ¥ 9,125 (1) Other than above, there were ¥635 billion and ¥594 billion of government, agency and municipal securities in Other assets—
Non-trading debt securities as of March 31, 2015 and September 30, 2015, respectively. The vast majority of these securities are Japanese government, agency and municipal securities.
Estimated fair value of financial instruments not carried at fair value Certain financial instruments are not carried at fair value on a recurring basis in the consolidated balance sheets since they are
neither held for trading purposes nor are elected for the fair value option. These are typically carried at contractual amounts due or amortized cost.
The carrying value of the majority of the financial instruments detailed below will approximate fair value since they are short-term in nature and contain minimal credit risk. These financial instruments include financial assets reported within Cash and cash equivalents, Time deposits, Deposits with stock exchanges and other segregated cash, Receivables from customers, Receivables from other than customers, Securities purchased under agreements to resell and Securities borrowed and financial liabilities reported within Short-term borrowings, Payables to customers, Payables to other than customers, Deposits received at banks, Securities sold under agreements to repurchase, Securities loaned and Other secured borrowings in the consolidated balance sheets. These would be generally classified in either Level 1 or Level 2 within the fair value hierarchy.
The estimated fair values of other financial instruments which are longer-term in nature or may contain more than minimal credit risk may be different to their carrying value. Financial assets of this type primarily include certain loans which are reported within Loans receivable while financial liabilities primarily include long-term borrowings which are reported within Long-term borrowings. The estimated fair value of loans receivable which are not elected for the fair value option is estimated in the same way as other loans carried at fair value on a recurring basis. Where quoted market prices are available, such market prices are utilized to estimate fair value. The fair value of long-term borrowings which are not elected for the fair value option is estimated in the same way as other borrowings carried at fair value on a recurring basis using quoted market prices where available or by DCF valuation techniques. All of these financial assets and financial liabilities would be generally classified in Level 2 or Level 3 within the fair value hierarchy using the same methodology as is applied to these instruments when they are elected for the fair value option.
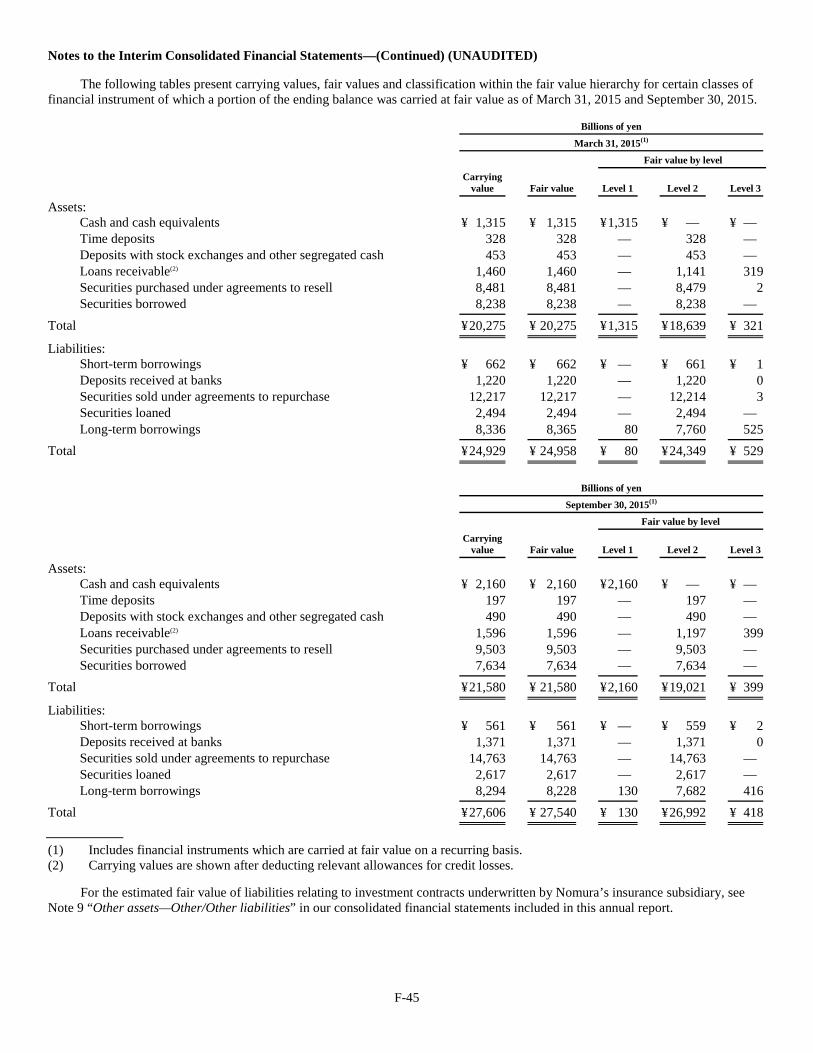
F-45
Notes to the Interim Consolidated Financial Statements—(Continued) (UNAUDITED)
The following tables present carrying values, fair values and classification within the fair value hierarchy for certain classes of financial instrument of which a portion of the ending balance was carried at fair value as of March 31, 2015 and September 30, 2015.
Billions of yen
March 31, 2015(1)
Fair value by level
Carrying value
Fair value
Level 1
Level 2
Level 3
Assets:
Cash and cash equivalents ¥ 1,315 ¥ 1,315 ¥ 1,315 ¥ — ¥ — Time deposits 328 328 — 328 — Deposits with stock exchanges and other segregated cash 453 453 — 453 — Loans receivable(2) 1,460 1,460 — 1,141 319 Securities purchased under agreements to resell 8,481 8,481 — 8,479 2 Securities borrowed 8,238 8,238 — 8,238 —
Total ¥ 20,275 ¥ 20,275 ¥ 1,315 ¥ 18,639 ¥ 321
Liabilities:
Short-term borrowings ¥ 662 ¥ 662 ¥ — ¥ 661 ¥ 1 Deposits received at banks 1,220 1,220 — 1,220 0 Securities sold under agreements to repurchase 12,217 12,217 — 12,214 3 Securities loaned 2,494 2,494 — 2,494 — Long-term borrowings 8,336 8,365 80 7,760 525
Total ¥ 24,929 ¥ 24,958 ¥ 80 ¥ 24,349 ¥ 529
Billions of yen
September 30, 2015(1)
Fair value by level
Carrying value
Fair value
Level 1
Level 2
Level 3
Assets:
Cash and cash equivalents ¥ 2,160 ¥ 2,160 ¥ 2,160 ¥ — ¥ — Time deposits 197 197 — 197 — Deposits with stock exchanges and other segregated cash 490 490 — 490 — Loans receivable(2) 1,596 1,596 — 1,197 399 Securities purchased under agreements to resell 9,503 9,503 — 9,503 — Securities borrowed 7,634 7,634 — 7,634 —
Total ¥ 21,580 ¥ 21,580 ¥ 2,160 ¥ 19,021 ¥ 399
Liabilities:
Short-term borrowings ¥ 561 ¥ 561 ¥ — ¥ 559 ¥ 2 Deposits received at banks 1,371 1,371 — 1,371 0 Securities sold under agreements to repurchase 14,763 14,763 — 14,763 — Securities loaned 2,617 2,617 — 2,617 — Long-term borrowings 8,294 8,228 130 7,682 416
Total ¥ 27,606 ¥ 27,540 ¥ 130 ¥ 26,992 ¥ 418
(1) Includes financial instruments which are carried at fair value on a recurring basis. (2) Carrying values are shown after deducting relevant allowances for credit losses.
For the estimated fair value of liabilities relating to investment contracts underwritten by Nomura’s insurance subsidiary, see Note 9 “Other assets—Other/Other liabilities” in our consolidated financial statements included in this annual report.
F-46
Notes to the Interim Consolidated Financial Statements—(Continued) (UNAUDITED) Assets and liabilities measured at fair value on a nonrecurring basis
In addition to financial instruments carried at fair value on a recurring basis, Nomura also measures other financial and non-financial assets and liabilities at fair value on a nonrecurring basis, where the primary measurement basis is not fair value. Fair value is only used in specific circumstances after initial recognition such as to measure impairment.
There were no significant amounts of assets and liabilities which were measured at fair value on a nonrecurring basis as of March 31, 2015 and September 30, 2015.
3. Derivative instruments and hedging activities: Nomura uses a variety of derivative financial instruments, including futures, forwards, options and swaps, for both trading and
non-trading purposes.
Derivatives used for trading purposes In the normal course of business, Nomura enters into transactions involving derivative financial instruments to meet client needs,
for trading purposes, and to reduce its own exposure to loss due to adverse fluctuations in interest rates, currency exchange rates and market prices of securities. These financial instruments include contractual agreements such as commitments to swap interest payment streams, exchange currencies or purchase or sell securities and other financial instruments on specific terms at specific future dates.
Nomura maintains active trading positions in a variety of derivative financial instruments. Most of Nomura’s trading activities are client oriented. Nomura utilizes a variety of derivative financial instruments as a means of bridging clients’ specific financial needs and investors’ demands in the securities markets. Nomura also actively trades securities and various derivatives to assist its clients in adjusting their risk profiles as markets change. In performing these activities, Nomura carries an inventory of capital markets instruments and maintains its access to market liquidity by quoting bid and offer prices to and trading with other market makers. These activities are essential to provide clients with securities and other capital market products at competitive prices.
Futures and forward contracts are commitments to either purchase or sell securities, foreign currency or other capital market instruments at a specific future date for a specified price and may be settled in cash or through delivery. Foreign exchange contracts include spot and forward contracts and involve the exchange of two currencies at a rate agreed by the contracting parties. Risks arise from the possible inability of counterparties to meet the terms of their contracts and from movements in market prices. Futures contracts are executed through regulated exchanges which clear and guarantee performance of counterparties. Accordingly, credit risk associated with futures contracts is considered minimal. In contrast, forward contracts are generally negotiated between two counterparties and, therefore, are subject to the performance of the related counterparties.
Options are contracts that grant the purchaser, for a premium payment, the right to either purchase or sell a financial instrument at a specified price within a specified period of time or on a specified date from or to the writer of the option. The writer of options receives premiums and bears the risk of unfavorable changes in the market price of the financial instruments underlying the options.
F-47
Notes to the Interim Consolidated Financial Statements—(Continued) (UNAUDITED)
Swaps are contractual agreements in which two counterparties agree to exchange certain cash flows, at specified future dates, based on an agreed contract. Certain agreements may result in combined interest rate and foreign currency exposures. Entering into swap agreements may involve the risk of credit losses in the event of counterparty default.
To the extent these derivative financial instruments are economically hedging financial instruments or securities positions of Nomura, the overall risk of loss may be fully or partly mitigated by the hedged position.
Nomura seeks to minimize its exposure to market risk arising from its use of these derivative financial instruments through various control policies and procedures, including position limits, monitoring procedures and hedging strategies whereby Nomura enters into offsetting or other positions in a variety of financial instruments.
Derivatives used for non-trading purposes Nomura’s principal objectives in using derivatives for non-trading purposes are to manage interest rate risk, to modify the
interest rate characteristics of certain financial liabilities, to manage foreign exchange risk of certain foreign currency denominated debt securities, to manage net investment exposure to fluctuations in foreign exchange rates arising from certain foreign operations and to mitigate equity price risk arising from certain stock-based compensation awards given to employees.
Credit risk associated with derivatives utilized for non-trading purposes is controlled and managed in the same way as credit risk associated with derivatives utilized for trading purposes.
Nomura designates certain derivative financial instruments as fair value hedges of interest rate risk arising from specific financial liabilities and foreign currency risk arising from specific foreign currency denominated debt securities. These derivatives are effective in reducing the risk associated with the exposure being hedged and are highly correlated with changes in the fair value and foreign currency rates of the underlying hedged items, both at inception and throughout the life of the hedge contract. Changes in fair value of the hedging derivatives are reported together with those of the hedged assets and liabilities through the consolidated statements of income within Interest expense or Revenue—Other.
F-48
Notes to the Interim Consolidated Financial Statements—(Continued) (UNAUDITED)
Derivative financial instruments designated as hedges of the net investment in foreign operations relate to specific subsidiaries with non-Japanese yen functional currencies. When determining the effectiveness of net investment hedges, the effective portion of the change in fair value of the hedging derivative is determined by changes in spot exchange rates and is reported through NHI shareholders’ equity within Accumulated other comprehensive income (loss). Changes in fair value of the hedging derivatives attributable to changes in the difference between the forward rate and spot rate are excluded from the measure of hedge effectiveness and are reported in the consolidated statements of income within Revenue—Other.
Concentrations of credit risk for derivatives The following tables present Nomura’s significant concentration of exposures to credit risk in OTC derivatives with financial
institutions including transactions cleared through central counterparties. The gross fair value of derivative assets represents the maximum amount of loss due to credit risk that Nomura would incur if the counterparties of Nomura failed to perform in accordance with the terms of the instruments and any collateral or other security Nomura held in relation to those instruments proved to be of no value.
Billions of yen
March 31, 2015
Gross fair value of derivative assets
Impact of master netting
agreements
Impact of collateral
Net exposure to credit risk
Financial institutions ¥ 33,930 ¥ (31,773) ¥ (1,713) ¥ 444
Billions of yen
September 30, 2015
Gross fair value of derivative assets
Impact of master netting
agreements
Impact of collateral
Net exposure to credit risk
Financial institutions ¥ 31,660 ¥ (29,607) ¥ (1,516) ¥ 537
Derivative activities The following tables quantify the volume of Nomura’s derivative activity through a disclosure of notional amounts, in
comparison with the fair value of those derivatives. All amounts are disclosed on a gross basis, prior to counterparty netting of derivative assets and liabilities and cash collateral netting against net derivatives.
Billions of yen
March 31, 2015
Derivative assets
Derivative liabilities
Notional
Fair value
Notional(1)
Fair value(1)
Derivatives used for trading and non-trading purposes(2)(3):
Equity contracts ¥ 20,681 ¥ 1,747 ¥ 20,431 ¥ 1,983 Interest rate contracts 1,367,970 31,611 1,343,616 31,691 Credit contracts 30,055 1,111 29,689 1,118 Foreign exchange contracts 136,683 7,576 126,750 6,990 Commodity contracts 13 0 39 1
Total ¥1,555,402 ¥ 42,045 ¥1,520,525 ¥ 41,783
Derivatives designated as hedging instruments:
Interest rate contracts ¥ 1,741 ¥ 54 ¥ 199 ¥ 0 Foreign exchange contracts 177 1 161 2
Total ¥ 1,918 ¥ 55 ¥ 360 ¥ 2
Total derivatives ¥1,557,320 ¥ 42,100 ¥1,520,885 ¥ 41,785
F-49
Notes to the Interim Consolidated Financial Statements—(Continued) (UNAUDITED)
Billions of yen
September 30, 2015
Derivative assets
Derivative liabilities
Notional
Fair value
Notional(1)
Fair value(1)
Derivatives used for trading and non-trading purposes(2)(3):
Equity contracts ¥ 21,162 ¥ 1,524 ¥ 26,071 ¥ 1,753 Interest rate contracts 1,220,627 24,620 1,263,443 24,440 Credit contracts 27,958 865 27,079 1,013 Foreign exchange contracts 186,392 7,138 185,357 6,801 Commodity contracts 3,637 1 6,837 0
Total ¥1,459,776 ¥ 34,148 ¥1,508,787 ¥ 34,007
Derivatives designated as hedging instruments:
Interest rate contracts ¥ 1,802 ¥ 55 ¥ 144 ¥ 0 Foreign exchange contracts 160 4 235 2
Total ¥ 1,962 ¥ 59 ¥ 379 ¥ 2
Total derivatives ¥1,461,738 ¥ 34,207 ¥1,509,166 ¥ 34,009
(1) Includes the amount of embedded derivatives bifurcated in accordance with ASC 815. (2) Each derivative classification includes derivatives referencing multiple risk components. For example, interest rate contracts
include complex derivatives referencing interest rate risk as well as foreign exchange risk or other factors such as prepayment rates. Credit contracts include credit default swaps as well as derivatives referencing corporate and government securities.
(3) As of March 31, 2015 and September 30, 2015, the amounts reported include derivatives used for non- trading purposes which are not designated as fair value or net investment hedges. These amounts have not been separately presented since such amounts were not significant.
Changes in fair value are recognized either through earnings or other comprehensive income depending on the purpose for which the derivatives are used.
Offsetting of derivatives Counterparty credit risk associated with derivative financial instruments is controlled by Nomura through credit approvals, limits and monitoring procedures. To reduce the risk of loss, Nomura requires collateral, principally cash collateral and government securities, for certain derivative transactions. In certain cases, Nomura may agree for such collateral to be posted to a third-party custodian under a control agreement that enables Nomura to take control of such collateral in the event of counterparty default. From an economic standpoint, Nomura evaluates default risk exposure net of related collateral. Furthermore, OTC derivative transactions are typically documented under industry standard master netting agreements which reduce Nomura’s credit exposure to counterparties as they permit the close-out and offset of transactions and collateral amounts in the event of default of the counterparty. For certain OTC centrally-cleared and exchange-traded derivatives, the clearing or membership agreements entered into by Nomura provide similar rights to Nomura in the event of default of the relevant central clearing party or exchange. In order to support the enforceability of the close-out and offsetting rights within these agreements, Nomura generally seeks to obtain an external legal opinion.
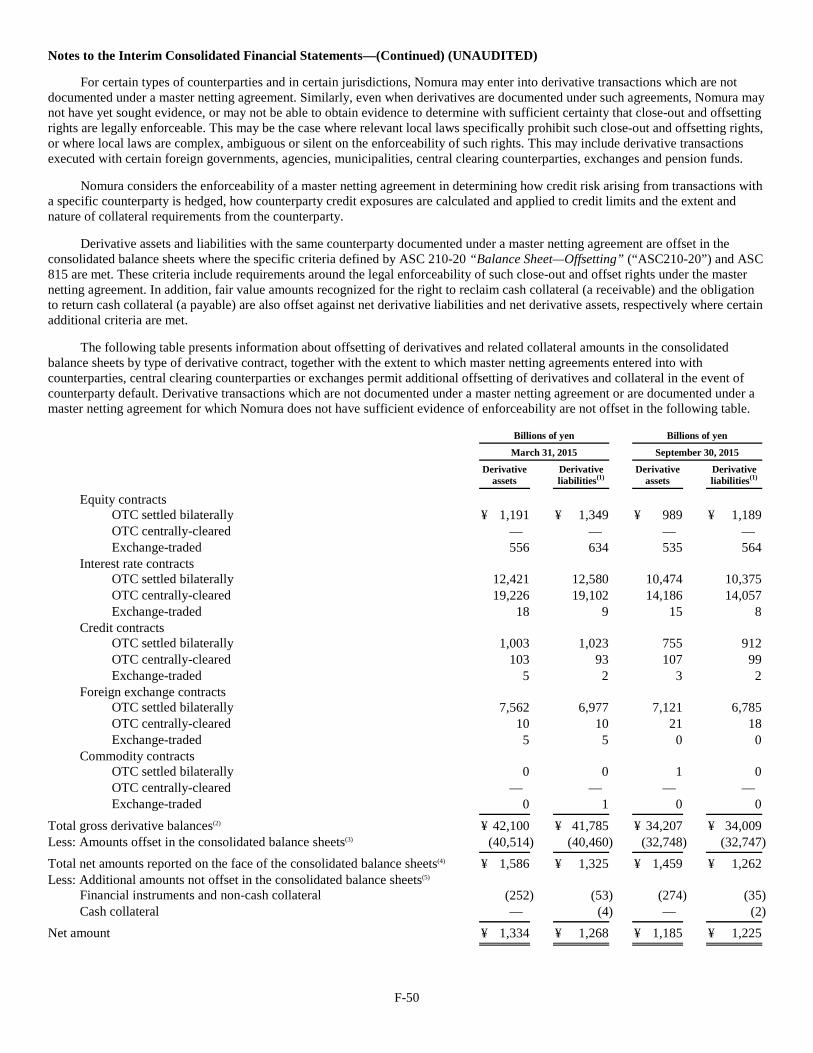
F-50
Notes to the Interim Consolidated Financial Statements—(Continued) (UNAUDITED)
For certain types of counterparties and in certain jurisdictions, Nomura may enter into derivative transactions which are not documented under a master netting agreement. Similarly, even when derivatives are documented under such agreements, Nomura may not have yet sought evidence, or may not be able to obtain evidence to determine with sufficient certainty that close-out and offsetting rights are legally enforceable. This may be the case where relevant local laws specifically prohibit such close-out and offsetting rights, or where local laws are complex, ambiguous or silent on the enforceability of such rights. This may include derivative transactions executed with certain foreign governments, agencies, municipalities, central clearing counterparties, exchanges and pension funds.
Nomura considers the enforceability of a master netting agreement in determining how credit risk arising from transactions with a specific counterparty is hedged, how counterparty credit exposures are calculated and applied to credit limits and the extent and nature of collateral requirements from the counterparty.
Derivative assets and liabilities with the same counterparty documented under a master netting agreement are offset in the consolidated balance sheets where the specific criteria defined by ASC 210-20 “Balance Sheet—Offsetting” (“ASC210-20”) and ASC 815 are met. These criteria include requirements around the legal enforceability of such close-out and offset rights under the master netting agreement. In addition, fair value amounts recognized for the right to reclaim cash collateral (a receivable) and the obligation to return cash collateral (a payable) are also offset against net derivative liabilities and net derivative assets, respectively where certain additional criteria are met.
The following table presents information about offsetting of derivatives and related collateral amounts in the consolidated balance sheets by type of derivative contract, together with the extent to which master netting agreements entered into with counterparties, central clearing counterparties or exchanges permit additional offsetting of derivatives and collateral in the event of counterparty default. Derivative transactions which are not documented under a master netting agreement or are documented under a master netting agreement for which Nomura does not have sufficient evidence of enforceability are not offset in the following table.
Billions of yen
Billions of yen
March 31, 2015
September 30, 2015
Derivative assets
Derivative liabilities(1)
Derivative assets
Derivative liabilities(1)
Equity contracts
OTC settled bilaterally ¥ 1,191 ¥ 1,349 ¥ 989 ¥ 1,189 OTC centrally-cleared — — — — Exchange-traded 556 634 535 564
Interest rate contracts
OTC settled bilaterally 12,421 12,580 10,474 10,375 OTC centrally-cleared 19,226 19,102 14,186 14,057 Exchange-traded 18 9 15 8
Credit contracts
OTC settled bilaterally 1,003 1,023 755 912 OTC centrally-cleared 103 93 107 99 Exchange-traded 5 2 3 2
Foreign exchange contracts
OTC settled bilaterally 7,562 6,977 7,121 6,785 OTC centrally-cleared 10 10 21 18 Exchange-traded 5 5 0 0
Commodity contracts
OTC settled bilaterally 0 0 1 0 OTC centrally-cleared — — — — Exchange-traded 0 1 0 0
Total gross derivative balances(2) ¥ 42,100 ¥ 41,785 ¥ 34,207 ¥ 34,009 Less: Amounts offset in the consolidated balance sheets(3) (40,514) (40,460) (32,748) (32,747)
Total net amounts reported on the face of the consolidated balance sheets(4) ¥ 1,586 ¥ 1,325 ¥ 1,459 ¥ 1,262 Less: Additional amounts not offset in the consolidated balance sheets(5)
Financial instruments and non-cash collateral (252) (53) (274) (35) Cash collateral — (4) — (2)
Net amount ¥ 1,334 ¥ 1,268 ¥ 1,185 ¥ 1,225
F-51
Notes to the Interim Consolidated Financial Statements—(Continued) (UNAUDITED)
(1) Includes the amount of embedded derivatives bifurcated in accordance with ASC 815. (2) Includes all gross derivative asset and liability balances irrespective of whether they are transacted under a master netting
agreement or whether Nomura has obtained sufficient evidence of enforceability of the master netting agreement. As of March 31, 2015, the gross balance of derivative assets and derivative liabilities which are not documented under master netting agreements or are documented under master netting agreements for which Nomura has not yet obtained sufficient evidence of enforceability was ¥298 billion and ¥447 billion, respectively. As of September 30, 2015, the gross balance of such derivative assets and derivative liabilities was ¥303 billion and ¥501 billion, respectively.
(3) Represents amounts offset through counterparty netting of derivative assets and liabilities as well as cash collateral netting against net derivatives under master netting and similar agreements for which Nomura has obtained sufficient evidence of enforceability in accordance with ASC 815. As of March 31, 2015, Nomura offset a total of ¥1,830 billion of cash collateral receivables against net derivative liabilities and ¥1,884 billion of cash collateral payables against net derivative assets. As of September 30, 2015, Nomura offset a total of ¥1,701 billion of cash collateral receivables against net derivative liabilities and ¥1,702 billion of cash collateral payables against net derivative assets.
(4) Net derivative assets and net derivative liabilities are generally reported within Trading assets and private equity investments—Trading assets and Trading liabilities, respectively in the consolidated balance sheet. Bifurcated embedded derivatives are reported within Short-term borrowings or Long-term borrowings depending on the maturity of the underlying host contract.
(5) Represents amounts which are not permitted to be offset on the face of the consolidated balance sheets in accordance with ASC 210-20 and ASC 815 but which provide Nomura with a legally enforceable right of offset in the event of counterparty default. Amounts relating to derivative and collateral agreements where Nomura has not yet obtained sufficient evidence of enforceability of such offsetting rights are excluded. As of March 31, 2015, a total of ¥223 billion of cash collateral receivables and ¥757 billion of cash collateral payables, including amounts reported in the table, have not been offset against net derivatives. As of September 30, 2015, a total of ¥367 billion of cash collateral receivables and ¥630 billion of cash collateral payables, including amounts reported in the table, have not been offset against net derivatives.
Derivatives used for trading purposes Derivative financial instruments used for trading purposes, including bifurcated embedded derivatives, are carried at fair value
with changes in fair value recognized through the consolidated statements of income within Revenue—Net gain on trading.
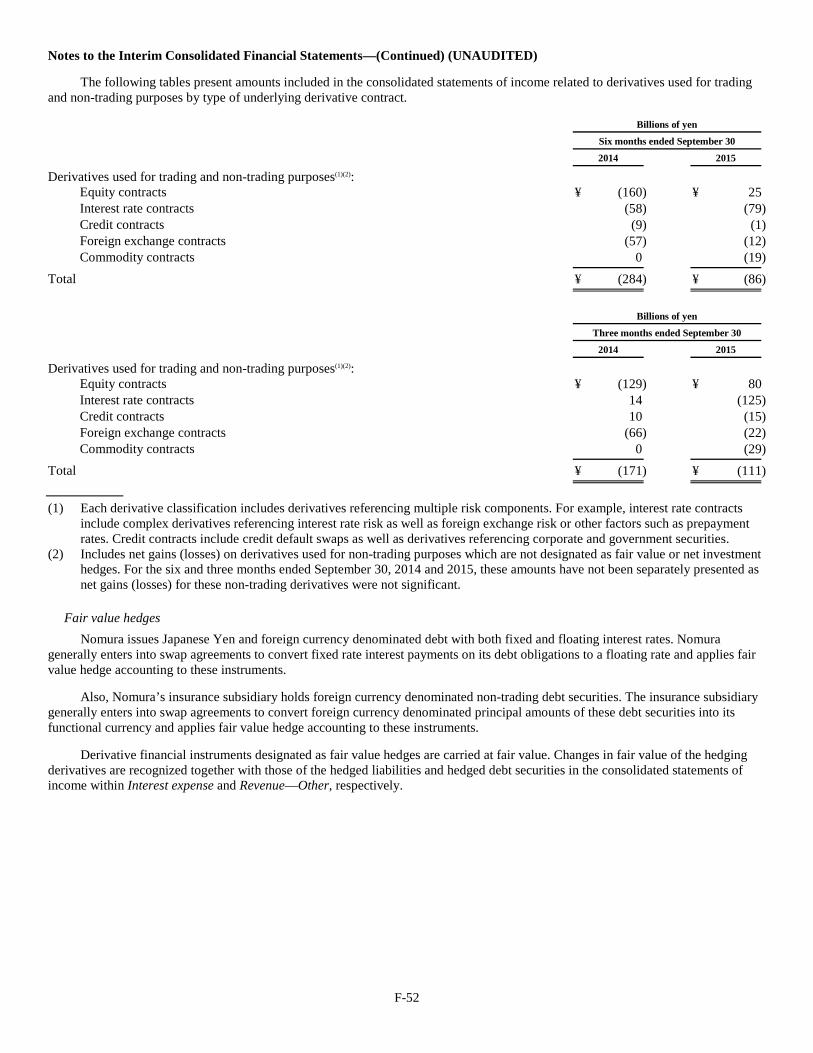
F-52
Notes to the Interim Consolidated Financial Statements—(Continued) (UNAUDITED)
The following tables present amounts included in the consolidated statements of income related to derivatives used for trading and non-trading purposes by type of underlying derivative contract.
Billions of yen
Six months ended September 30
2014
2015
Derivatives used for trading and non-trading purposes(1)(2):
Equity contracts ¥ (160) ¥ 25 Interest rate contracts (58) (79) Credit contracts (9) (1) Foreign exchange contracts (57) (12) Commodity contracts 0 (19)
Total ¥ (284) ¥ (86)
Billions of yen
Three months ended September 30
2014
2015
Derivatives used for trading and non-trading purposes(1)(2):
Equity contracts ¥ (129) ¥ 80 Interest rate contracts 14 (125) Credit contracts 10 (15) Foreign exchange contracts (66) (22) Commodity contracts 0 (29)
Total ¥ (171) ¥ (111)
(1) Each derivative classification includes derivatives referencing multiple risk components. For example, interest rate contracts
include complex derivatives referencing interest rate risk as well as foreign exchange risk or other factors such as prepayment rates. Credit contracts include credit default swaps as well as derivatives referencing corporate and government securities.
(2) Includes net gains (losses) on derivatives used for non-trading purposes which are not designated as fair value or net investment hedges. For the six and three months ended September 30, 2014 and 2015, these amounts have not been separately presented as net gains (losses) for these non-trading derivatives were not significant.
Fair value hedges Nomura issues Japanese Yen and foreign currency denominated debt with both fixed and floating interest rates. Nomura
generally enters into swap agreements to convert fixed rate interest payments on its debt obligations to a floating rate and applies fair value hedge accounting to these instruments.
Also, Nomura’s insurance subsidiary holds foreign currency denominated non-trading debt securities. The insurance subsidiary generally enters into swap agreements to convert foreign currency denominated principal amounts of these debt securities into its functional currency and applies fair value hedge accounting to these instruments.
Derivative financial instruments designated as fair value hedges are carried at fair value. Changes in fair value of the hedging derivatives are recognized together with those of the hedged liabilities and hedged debt securities in the consolidated statements of income within Interest expense and Revenue—Other, respectively.
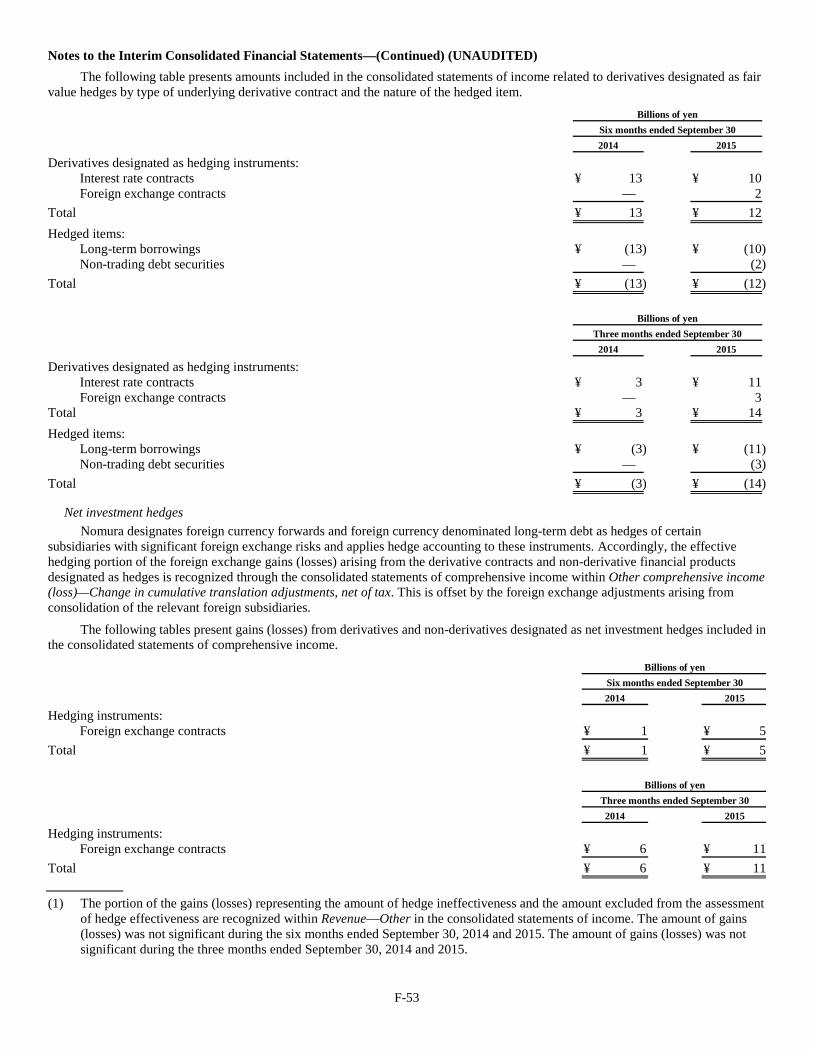
F-53
Notes to the Interim Consolidated Financial Statements—(Continued) (UNAUDITED)
The following table presents amounts included in the consolidated statements of income related to derivatives designated as fair value hedges by type of underlying derivative contract and the nature of the hedged item.
Billions of yen
Six months ended September 30
2014
2015
Derivatives designated as hedging instruments:
Interest rate contracts ¥ 13 ¥ 10 Foreign exchange contracts — 2
Total ¥ 13 ¥ 12
Hedged items:
Long-term borrowings ¥ (13) ¥ (10) Non-trading debt securities — (2)
Total ¥ (13) ¥ (12)
Billions of yen
Three months ended September 30
2014
2015
Derivatives designated as hedging instruments:
Interest rate contracts ¥ 3 ¥ 11 Foreign exchange contracts — 3
Total ¥ 3 ¥ 14
Hedged items:
Long-term borrowings ¥ (3) ¥ (11) Non-trading debt securities — (3)
Total ¥ (3) ¥ (14)
Net investment hedges Nomura designates foreign currency forwards and foreign currency denominated long-term debt as hedges of certain
subsidiaries with significant foreign exchange risks and applies hedge accounting to these instruments. Accordingly, the effective hedging portion of the foreign exchange gains (losses) arising from the derivative contracts and non-derivative financial products designated as hedges is recognized through the consolidated statements of comprehensive income within Other comprehensive income (loss)—Change in cumulative translation adjustments, net of tax. This is offset by the foreign exchange adjustments arising from consolidation of the relevant foreign subsidiaries.
The following tables present gains (losses) from derivatives and non-derivatives designated as net investment hedges included in the consolidated statements of comprehensive income.
Billions of yen
Six months ended September 30
2014
2015
Hedging instruments:
Foreign exchange contracts ¥ 1 ¥ 5
Total ¥ 1 ¥ 5
Billions of yen
Three months ended September 30
2014
2015
Hedging instruments:
Foreign exchange contracts ¥ 6 ¥ 11
Total ¥ 6 ¥ 11
(1) The portion of the gains (losses) representing the amount of hedge ineffectiveness and the amount excluded from the assessment
of hedge effectiveness are recognized within Revenue—Other in the consolidated statements of income. The amount of gains (losses) was not significant during the six months ended September 30, 2014 and 2015. The amount of gains (losses) was not significant during the three months ended September 30, 2014 and 2015.
F-54
Notes to the Interim Consolidated Financial Statements—(Continued) (UNAUDITED)
Derivatives containing credit risk related contingent features Nomura enters into certain OTC derivatives and other agreements containing credit-risk-related contingent features. These
features would require Nomura to post additional collateral or settle the instrument upon occurrence of a credit event, the most common of which would be a downgrade in the Company’s long-term credit rating.
The aggregate fair value of all derivative instruments with credit risk related contingent features that were in a liability position as of March 31, 2015, was ¥874 billion with related collateral pledged of ¥708 billion. In the event of a one-notch downgrade to Nomura’s long-term credit rating in effect as of March 31, 2015, the aggregate fair value of assets that would have been required to be posted as additional collateral or that would have been needed to settle the instruments immediately was ¥19 billion.
The aggregate fair value of all derivative instruments with credit risk related contingent features that were in a liability position as of September 30, 2015, was ¥863 billion with related collateral pledged of ¥757 billion. In the event of a one-notch downgrade to Nomura’s long-term credit rating in effect as of September 30, 2015, the aggregate fair value of assets that would have been required to be posted as additional collateral or that would have been needed to settle the instruments immediately was ¥13 billion.
Credit derivatives Credit derivatives are derivative instruments in which one or more of their underlyings are related to the credit risk of a
specified entity (or group of entities) or an index based on the credit risk of a group of entities that expose the seller of credit protection to potential loss from credit risk related events specified in the contract.
Written credit derivatives are instruments or embedded features where Nomura assumes third party credit risk, either as guarantor in a guarantee-type contract, or as the party that provides credit protection in an option-type contract, credit default swap, or any other credit derivative contract.
Nomura enters into credit derivatives as part of its normal trading activities as both purchaser and seller of protection for credit risk mitigation, proprietary trading positions and for client transactions.
The most significant type of credit derivatives used by Nomura are single-name credit default swaps where settlement of the derivative is based on the credit risk of a single third party. Nomura also writes credit derivatives linked to the performance of credit default indices and issues other credit risk related portfolio products.
Nomura would have to perform under a credit derivative contract if a credit event as defined in the respective contract occurs. Typical credit events include bankruptcy, failure to pay and restructuring of obligations of the reference asset.
F-55
Notes to the Interim Consolidated Financial Statements—(Continued) (UNAUDITED)
Credit derivative contracts written by Nomura are either cash or physically settled. In cash-settled instruments, once payment is made upon an event of a default, the contract usually terminates with no further payments due. Nomura generally has no right to assume the reference assets of the counterparty in exchange for payment, nor does Nomura usually have any direct recourse to the actual issuers of the reference assets to recover the amount paid. In physically settled contracts, upon a default event, Nomura takes delivery of the reference asset in return for payment of the full notional amount of the contract.
Nomura actively monitors and manages its credit derivative exposures. Where protection is sold, risks may be mitigated by purchasing credit protection from other third parties either on identical underlying reference assets or on underlying reference assets with the same issuer which would be expected to behave in a correlated fashion. The most common form of recourse provision to enable Nomura to recover from third parties any amounts paid under a written credit derivative is therefore not through the derivative itself but rather through the separate purchase of credit derivatives with identical or correlated underlyings.
Nomura quantifies the value of these purchased contracts in the following tables in the column titled “Purchased Credit Protection.” These amounts represent purchased credit protection with identical underlyings to the written credit derivative contracts which act as a hedge against Nomura’s exposure. To the extent Nomura is required to pay out under the written credit derivative, a similar amount would generally become due to Nomura under the purchased hedge.
Credit derivatives have a stated notional amount which represents the maximum payment Nomura may be required to make under the contract. However, this is generally not a true representation of the amount Nomura will actually pay as in addition to purchased credit protection, other risk mitigating factors reduce the likelihood and amount of any payment, including:
The probability of default: Nomura values credit derivatives taking into account the probability that the underlying reference asset will default and that Nomura will be required to make payments under the contract. Based on historical experience and Nomura’s assessment of the market, Nomura believes that the probability that all reference assets on which Nomura provides protection will default in a single period is remote. The disclosed notional amount, therefore, significantly overstates Nomura’s realistic exposure on these contracts.
The recovery value on the underlying asset: In the case of a default, Nomura’s liability on a contract is limited to the difference between the notional amount and the recovery value of the underlying reference asset. While the recovery value on a defaulted asset may be minimal, this does reduce amounts paid on these contracts.
Nomura holds assets as collateral in relation to written credit derivatives. However, these amounts do not enable Nomura to recover any amounts paid under the credit derivative but rather mitigate the risk of economic loss arising from a counterparty defaulting against amounts due to Nomura under the contract. Collateral requirements are determined on a counterparty level rather than individual contract, and also generally cover all types of derivative contracts rather than just credit derivatives.
F-56
Notes to the Interim Consolidated Financial Statements—(Continued) (UNAUDITED)
The following tables present information about Nomura’s written credit derivatives and purchased credit protection with identical underlyings as of March 31, 2015 and September 30, 2015.
Billions of yen
March 31, 2015
Maximum potential payout/Notional
Notional
Carrying value (Asset) / Liability(1)
Total
Years to maturity Purchased
credit protection
Less than 1 year
1 to 3 years
3 to 5 years
More than 5 years
Single-name credit default swaps ¥ (21) ¥ 18,808 ¥ 4,146 ¥ 7,396 ¥ 5,657 ¥ 1,609 ¥ 16,519 Credit default indices (22) 6,044 919 1,926 2,462 737 5,240 Other credit risk related portfolio
products (8) 673 324 217 117 15 293 Credit risk related options and
swaptions 0 300 — — 255 45 255
Total ¥ (51) ¥ 25,825 ¥ 5,389 ¥ 9,539 ¥ 8,491 ¥ 2,406 ¥ 22,307
Billions of yen
September 30, 2015
Maximum potential payout/Notional
Notional
Carrying value (Asset) / Liability(1)
Total
Years to maturity Purchased
credit protection
Less than 1 year
1 to 3 years
3 to 5 years
More than 5 years
Single-name credit default swaps ¥ 209 ¥ 17,746 ¥ 4,019 ¥ 6,254 ¥ 5,679 ¥ 1,794 ¥ 14,539 Credit default indices 82 6,224 1,019 1,681 2,671 853 4,677 Other credit risk related portfolio
products 8 527 182 304 24 17 208 Credit risk related options and
swaptions 2 95 — — 95 — 59
Total ¥ 301 ¥ 24,592 ¥ 5,220 ¥ 8,239 ¥ 8,469 ¥ 2,664 ¥ 19,483
(1) Carrying value amounts are shown on a gross basis prior to cash collateral or counterparty netting. Asset balances represent
positive fair value amounts caused by tightening of credit spreads of underlyings since inception of the credit derivative contracts.
F-57
Notes to the Interim Consolidated Financial Statements—(Continued) (UNAUDITED)
The following tables present information about Nomura’s written credit derivatives by external credit rating of the underlying asset. Ratings are based on Standard & Poor’s Financial Services LLC (“S&P”), or if not rated by S&P, based on Moody’s Investors Service, Inc. If ratings from either of these agencies are not available, the ratings are based on Fitch Ratings Ltd. or Japan Credit Rating Agency, Ltd. For credit default indices, the rating is determined by taking the weighted average of the external credit ratings given for each of the underlying reference entities comprising the portfolio or index.
Billions of yen
March 31, 2015
Maximum potential payout/Notional
AAA
AA
A
BBB
BB
Other(1)
Total
Single-name credit default swaps ¥ 1,768 ¥ 1,418 ¥ 4,766 ¥ 6,722 ¥ 2,526 ¥ 1,608 ¥ 18,808 Credit default indices 85 14 3,936 1,306 376 327 6,044 Other credit risk related portfolio products 38 — 1 4 1 629 673 Credit risk related options and swaptions — — 277 — — 23 300
Total ¥ 1,891 ¥ 1,432 ¥ 8,980 ¥ 8,032 ¥ 2,903 ¥ 2,587 ¥ 25,825
Billions of yen
September 30, 2015
Maximum potential payout/Notional
AAA
AA
A
BBB
BB
Other(1)
Total
Single-name credit default swaps ¥ 1,472 ¥ 1,391 ¥ 4,774 ¥ 6,205 ¥ 2,561 ¥ 1,343 ¥ 17,746 Credit default indices 77 16 4,221 1,227 370 313 6,224 Other credit risk related portfolio products 38 — 1 4 1 483 527 Credit risk related options and swaptions — — 20 — 75 — 95
Total ¥ 1,587 ¥ 1,407 ¥ 9,016 ¥ 7,436 ¥ 3,007 ¥ 2,139 ¥ 24,592
(1) “Other” includes credit derivatives where the credit rating of the underlying reference asset is below investment grade or where
a rating is unavailable.
Derivatives entered into in contemplation of sales of financial assets Nomura enters into transactions which involve both the transfer of financial assets to a third party counterparty and a separate
agreement with the same counterparty entered into in contemplation of the initial transfer through which Nomura retains substantially all of the exposure to the economic return on the transferred financial assets throughout the term of the transaction. These transactions primarily include sales of securities with bilateral OTC total return swaps or other derivative agreements which are in-substance total return swaps. These transactions are accounted for as sales of the securities with the derivative accounted for separately if the criteria for derecognition of the securities under ASC 860 are met. Where the derecognition criteria are not met, the transfer and separate derivative are accounted for as a single collateralized financing transaction which is reported within Long-term borrowings—Trading balances of secured borrowings in the consolidated balance sheets.
As of September 30, 2015 there were no outstanding sales with total return swap or in-substance total return swap transactions accounted for as sales rather than collateralized financing transactions.
F-58
Notes to the Interim Consolidated Financial Statements—(Continued) (UNAUDITED)
4. Collateralized transactions: Nomura enters into collateralized transactions, including reverse repurchase agreements, repurchase agreements, securities
borrowing transactions, securities lending transactions, other secured borrowings and similar transactions mainly to meet clients’ needs, finance trading inventory positions and obtain securities for settlements.
Reverse repurchase agreements, repurchase agreements, securities borrowing transactions and securities lending transactions are typically documented under industry standard master netting agreements which reduce Nomura’s credit exposure to counterparties as they permit the close-out and offset of transactions and collateral amounts in the event of default of the counterparty. For certain centrally-cleared reverse repurchase and repurchase agreements, the clearing or membership agreements entered into by Nomura provide similar rights to Nomura in the event of default of the relevant central clearing counterparty. In order to support the enforceability of the close-out and offsetting rights within these agreements, Nomura generally seeks to obtain an external legal opinion.
For certain types of counterparty and in certain jurisdictions, Nomura may enter into reverse repurchase agreements, repurchase agreements, securities borrowing and securities lending transactions which are not documented under a master netting agreement. Similarly, even when these transactions are documented under such agreements, Nomura may not have yet sought evidence, or may not be able to obtain evidence to determine with sufficient certainty that the close-out and offsetting rights are legally enforceable. This may be the case where relevant local laws specifically prohibit such close-out and offsetting rights, or where local laws are complex, ambiguous or silent on the enforceability of such rights. This may include reverse repurchase agreements, repurchase agreements, securities borrowing and securities lending transactions executed with certain foreign governments, agencies, municipalities, central clearing counterparties, agent banks and pension funds.
Nomura considers the enforceability of a master netting agreement in determining how credit risk arising from transactions with a specific counterparty is hedged, how counterparty credit exposures are calculated and applied to credit limits and the extent and nature of collateral requirements from the counterparty.
In all of these transactions, Nomura either receives or provides collateral, including Japanese and non-Japanese government, agency, mortgage-backed, bank and corporate debt securities and equities. In most cases, Nomura is permitted to use the securities received to enter into repurchase agreements, enter into securities lending transactions or to cover short positions with counterparties. In repurchase and reverse repurchase agreements, the value of collateral typically exceeds the amount of cash transferred. Collateral is generally in the form of securities. Securities borrowing transactions generally require Nomura to provide the counterparty with collateral in the form of cash or other securities. For securities lending transactions, Nomura generally receives collateral in the form of cash or other securities. Nomura monitors the market value of the securities either received from or provided to the counterparty. Additional cash or securities are exchanged as necessary, to ensure that such transactions are adequately collateralized throughout the life of the transactions.
Offsetting of certain collateralized transactions Reverse repurchase agreements and repurchase agreements, securities borrowing and lending transactions with the same
counterparty documented under a master netting agreement are offset in the consolidated balance sheets where the specific criteria defined by ASC 210-20 are met. These criteria include requirements around the maturity of the transactions, the underlying systems on which the collateral is settled, associated banking arrangements and the legal enforceability of close-out and offsetting rights under the master netting agreement.
F-59
Notes to the Interim Consolidated Financial Statements—(Continued) (UNAUDITED)
The following tables present information about offsetting of these transactions in the consolidated balance sheets, together with the extent to which master netting agreements entered into with counterparties and central clearing parties permit additional offsetting in the event of counterparty default. Transactions which are not documented under a master netting agreement or are documented under a master netting agreement for which Nomura does not have sufficient evidence of enforceability are not offset in the following tables.
Billions of yen
March 31, 2015
Assets
Liabilities
Reverse repurchase agreements
Securities borrowing
transactions
Repurchase agreements
Securities lending
transactions
Total gross balance(1) ¥ 25,532 ¥ 8,460 ¥ 29,268 ¥ 2,924 Less: Amounts offset in the consolidated balance sheets(2) (17,051) (242) (17,051) (242)
Total net amounts of reported on the face of the consolidated balance sheets(3) ¥ 8,481 ¥ 8,218 ¥ 12,217 ¥ 2,682
Less: Additional amounts not offset in the consolidated balance sheets(4)
Financial instruments and non-cash collateral (6,295) (6,531) (10,058) (2,371) Cash collateral (1) — — —
Net amount ¥ 2,185 ¥ 1,687 ¥ 2,159 ¥ 311
Billions of yen
September 30, 2015
Assets
Liabilities
Reverse repurchase agreements
Securities borrowing
transactions
Repurchase agreements
Securities lending
transactions
Total gross balance(1) ¥ 28,300 ¥ 7,628 ¥ 33,560 ¥ 2,849 Less: Amounts offset in the consolidated balance sheets(2) (18,797) 0 (18,797) 0
Total net amounts of reported on the face of the consolidated balance sheets(3) ¥ 9,503 ¥ 7,628 ¥ 14,763 ¥ 2,849
Less: Additional amounts not offset in the consolidated balance sheets(4)
Financial instruments and non-cash collateral (7,668) (6,128) (12,278) (2,286) Cash collateral 0 — 0 —
Net amount ¥ 1,835 ¥ 1,500 ¥ 2,485 ¥ 563
(1) Includes all recognized balances irrespective of whether they are transacted under a master netting agreement or whether
Nomura has obtained sufficient evidence of enforceability of the master netting agreement. Amounts include transactions carried at fair value through election of the fair value option. As of March 31, 2015, the gross balance of reverse repurchase agreements and repurchase agreements which were not transacted under master netting agreements or are documented under master netting agreements for which Nomura has not yet obtained sufficient evidence of enforceability was ¥1,979 billion and ¥2,091 billion, respectively. As of March 31, 2015, the gross balance of securities borrowing transactions and securities lending transactions which were not transacted under master netting agreements or are documented under master netting agreements for which Nomura has not yet obtained sufficient evidence of enforceability was ¥1,507 billion and ¥52 billion, respectively. As of September 30, 2015, the gross balance of reverse repurchase agreements and repurchase agreements which were not transacted under master netting agreements or are documented under master netting agreements for which Nomura has not yet obtained sufficient evidence of enforceability was ¥831 billion and ¥1,710 billion, respectively. As of September 30, 2015, the gross balance of securities borrowing transactions and securities lending transactions which were not transacted under master netting agreements or are documented under master netting agreements for which Nomura has not yet obtained sufficient evidence of enforceability was ¥1,392 billion and ¥151 billion, respectively.
F-60
Notes to the Interim Consolidated Financial Statements—(Continued) (UNAUDITED) (2) Represents amounts offset through counterparty netting under master netting and similar agreements for which Nomura has
obtained sufficient evidence of enforceability in accordance with ASC 210-20. Amounts offset include transactions carried at fair value through election of the fair value option.
(3) Reverse repurchase agreements and securities borrowing transactions are reported within Collateralized agreements—Securities purchased under agreements to resell and Collateralized agreements—Securities borrowed in the consolidated balance sheets, respectively. Repurchase agreements and securities lending transactions are reported within Collateralized financing—Securities sold under agreements to repurchase and Collateralized financing—Securities loaned in the consolidated balance sheets, respectively. Amounts reported under securities lending transactions also include transactions where Nomura lends securities and receives securities that can be sold or pledged as collateral. Nomura recognizes the securities received at fair value and a liability for the same amount, representing the obligation to return those securities. The liability is reported within Other liabilities in the consolidated balance sheets.
(4) Represents amounts which are not permitted to be offset on the face of the balance sheet in accordance with ASC 210-20 but which provide Nomura with the right of offset in the event of counterparty default. Amounts relating to agreements where Nomura has not yet obtained sufficient evidence of enforceability of such offsetting rights are excluded.
Maturity analysis of repurchase agreements and securities lending transactions The following table presents an analysis of the total carrying value of liabilities recognized in the consolidated balance sheets
for repurchase agreements and securities lending transactions by remaining contractual maturity of the agreement as of September 30, 2015. Amounts reported are shown prior to counterparty netting in accordance with ASC 210-20.
Billions of yen
September 30, 2015
Overnight and open(1)
Up to 30 days
30 – 90 days
90 days – 1 year
Greater than 1 year
Total
Repurchase agreements ¥ 13,145 ¥ 16,599 ¥ 2,320 ¥ 1,130 ¥ 366 ¥ 33,560 Securities lending transactions 1,851 712 195 67 24 2,849
Total gross recognized liabilities(2) ¥ 14,996 ¥ 17,311 ¥ 2,515 ¥ 1,197 ¥ 390 ¥ 36,409
(1) Open transactions do not have an explicit contractual maturity date and are terminable on demand by Nomura or the
counterparty. (2) Repurchase agreements and securities lending transactions are reported within Collateralized financing—Securities sold under
agreements to repurchase and Collateralized financing—Securities loaned in the consolidated balance sheets, respectively. Amounts reported for securities lending transactions also include transactions where Nomura lends securities and receives securities that can be sold or pledged as collateral. Nomura recognizes the securities received at fair value and a liability for the same amount, representing the obligation to return those securities. The liability is reported within Other liabilities in the consolidated balance sheets. The total gross recognized liabilities reported for repurchase agreements and securities lending transactions are consistent with the total gross balances reported in the offsetting disclosures above.
F-61
Notes to the Interim Consolidated Financial Statements—(Continued) (UNAUDITED) Securities transferred in repurchase agreements and securities lending transactions
The following table presents an analysis of the total carrying value of liabilities recognized in the consolidated balance sheets for repurchase agreements and securities lending transactions by class of securities transferred by Nomura to counterparties as of September 30, 2015. Amounts reported are shown prior to counterparty netting in accordance with ASC 210-20.
Billions of yen
September 30, 2015
Repurchase agreements
Securities lending
transactions
Total
Equities and convertible securities ¥ 222 ¥ 2,823 ¥ 3,045 Japanese government, agency and municipal securities 445 0 445 Foreign government, agency and municipal securities 26,044 22 26,066 Bank and corporate debt securities 3,008 3 3,011 Commercial mortgage-backed securities (“CMBS”) 27 — 27 Residential mortgage-backed securities (“RMBS”)(1) 3,691 — 3,691 Collateralized debt obligations (“CDOs”) and other 123 — 123 Investment trust funds and other — 1 1
Total gross recognized liabilities(2) ¥ 33,560 ¥ 2,849 ¥ 36,409
(1) Includes ¥3,605 billion of U.S. government sponsored agency mortgage pass-through securities and collateralized mortgage
obligations (2) Repurchase agreements and securities lending transactions are reported within Collateralized financing—Securities sold under
agreements to repurchase and Collateralized financing—Securities loaned in the consolidated balance sheets, respectively. Amounts reported for securities lending transactions also include transactions where Nomura lends securities and receives securities that can be sold or pledged as collateral. Nomura recognizes the securities received at fair value and a liability for the same amount, representing the obligation to return those securities. The liability is reported within Other liabilities in the consolidated balance sheets. The total gross recognized liabilities reported for repurchase agreements and securities lending transactions are consistent with the total gross balances reported in the offsetting disclosures above.
Collateral received by Nomura The following table presents the fair value of securities received as collateral, securities borrowed with collateral and securities
borrowed without collateral, which Nomura is permitted to sell or repledge, and the portion that has been sold or repledged as of March 31, 2015 and September 30, 2015.
Billions of yen
March 31, 2015
September 30, 2015
The fair value of securities received as collateral, securities borrowed as collateral and securities borrowed without collateral where Nomura is permitted by contract or custom to sell or repledge the securities ¥ 45,397 ¥ 45,079
The portion of the above that has been sold (reported within Trading liabilities in the consolidated balance sheets) or repledged 39,165 39,320
Collateral pledged by Nomura Nomura pledges firm-owned securities to collateralize repurchase transactions, other secured financings and derivative
transactions. Pledged securities that can be sold or repledged by the transferee, including Gensaki Repo transactions, are reported in parentheses as Securities pledged as collateral within Trading assets in the consolidated balance sheets.
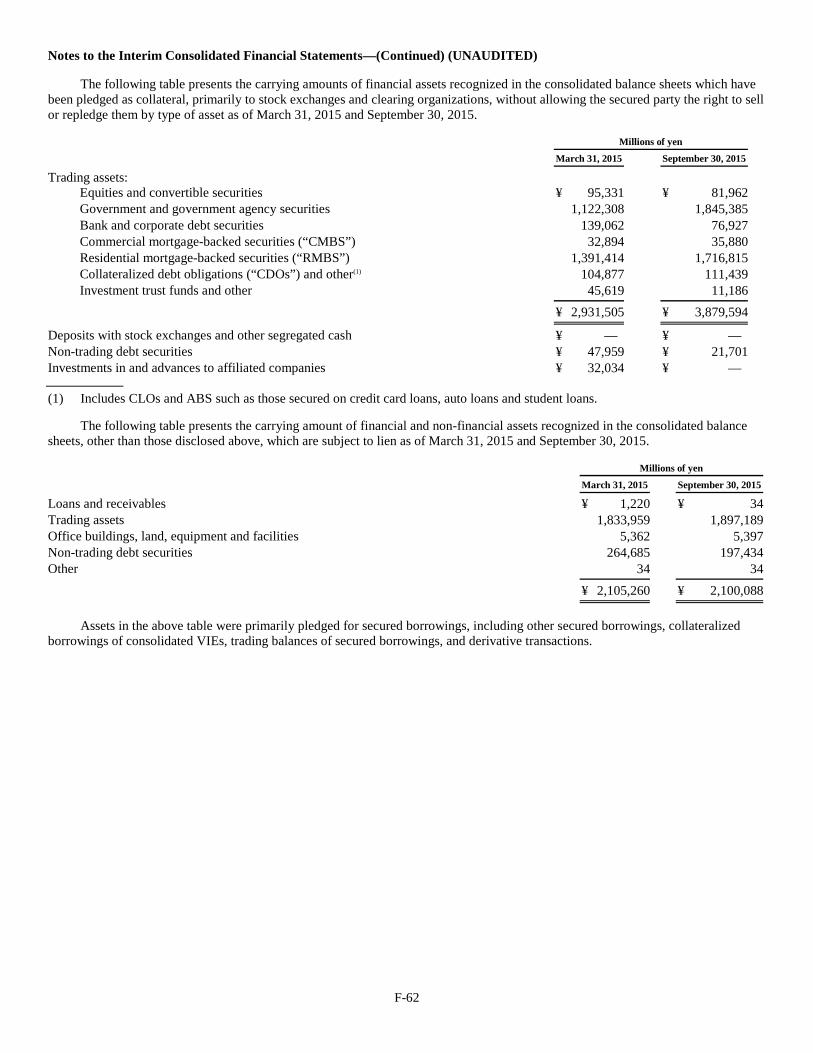
F-62
Notes to the Interim Consolidated Financial Statements—(Continued) (UNAUDITED)
The following table presents the carrying amounts of financial assets recognized in the consolidated balance sheets which have been pledged as collateral, primarily to stock exchanges and clearing organizations, without allowing the secured party the right to sell or repledge them by type of asset as of March 31, 2015 and September 30, 2015.
Millions of yen
March 31, 2015
September 30, 2015
Trading assets:
Equities and convertible securities ¥ 95,331 ¥ 81,962 Government and government agency securities 1,122,308 1,845,385 Bank and corporate debt securities 139,062 76,927 Commercial mortgage-backed securities (“CMBS”) 32,894 35,880 Residential mortgage-backed securities (“RMBS”) 1,391,414 1,716,815 Collateralized debt obligations (“CDOs”) and other(1) 104,877 111,439 Investment trust funds and other 45,619 11,186
¥ 2,931,505 ¥ 3,879,594
Deposits with stock exchanges and other segregated cash ¥ — ¥ — Non-trading debt securities ¥ 47,959 ¥ 21,701 Investments in and advances to affiliated companies ¥ 32,034 ¥ — (1) Includes CLOs and ABS such as those secured on credit card loans, auto loans and student loans.
The following table presents the carrying amount of financial and non-financial assets recognized in the consolidated balance sheets, other than those disclosed above, which are subject to lien as of March 31, 2015 and September 30, 2015.
Millions of yen
March 31, 2015
September 30, 2015
Loans and receivables ¥ 1,220 ¥ 34 Trading assets 1,833,959 1,897,189 Office buildings, land, equipment and facilities 5,362 5,397 Non-trading debt securities 264,685 197,434 Other 34 34
¥ 2,105,260 ¥ 2,100,088
Assets in the above table were primarily pledged for secured borrowings, including other secured borrowings, collateralized borrowings of consolidated VIEs, trading balances of secured borrowings, and derivative transactions.
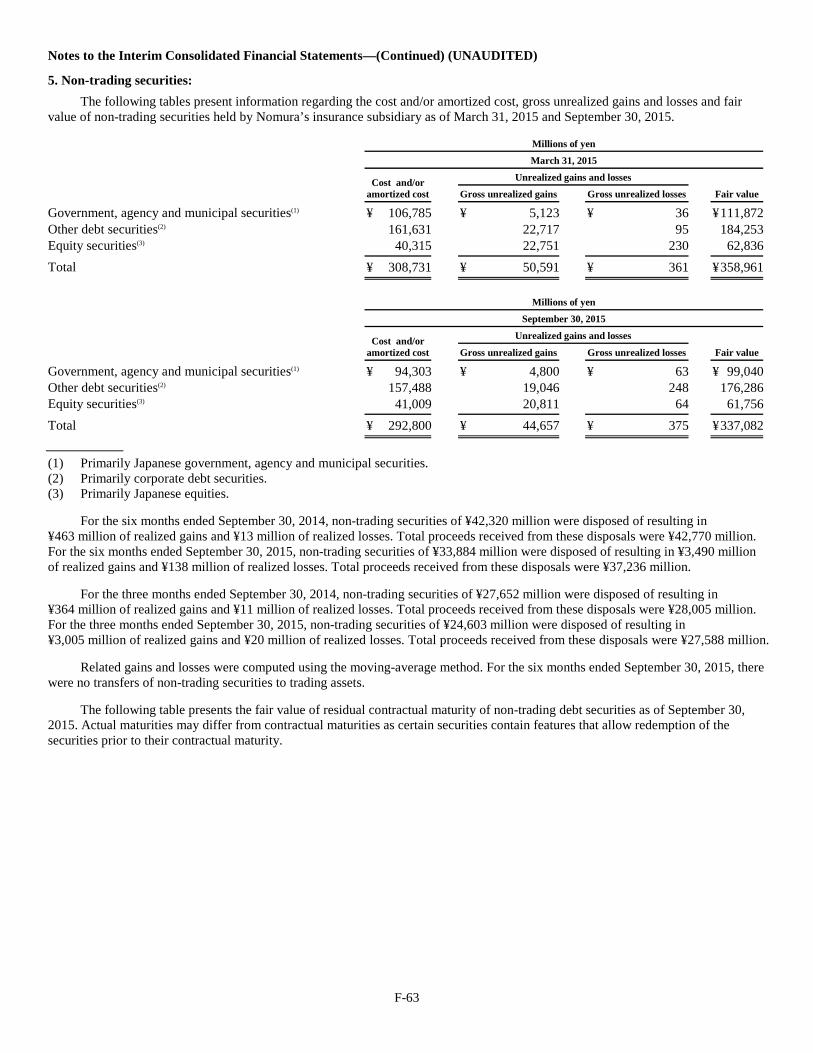
F-63
Notes to the Interim Consolidated Financial Statements—(Continued) (UNAUDITED)
5. Non-trading securities: The following tables present information regarding the cost and/or amortized cost, gross unrealized gains and losses and fair
value of non-trading securities held by Nomura’s insurance subsidiary as of March 31, 2015 and September 30, 2015.
Millions of yen
March 31, 2015
Cost and/or amortized cost
Unrealized gains and losses
Fair value
Gross unrealized gains
Gross unrealized losses
Government, agency and municipal securities(1) ¥ 106,785 ¥ 5,123 ¥ 36 ¥ 111,872 Other debt securities(2) 161,631 22,717 95 184,253 Equity securities(3) 40,315 22,751 230 62,836
Total ¥ 308,731 ¥ 50,591 ¥ 361 ¥ 358,961
Millions of yen
September 30, 2015
Cost and/or amortized cost
Unrealized gains and losses
Fair value
Gross unrealized gains
Gross unrealized losses
Government, agency and municipal securities(1) ¥ 94,303 ¥ 4,800 ¥ 63 ¥ 99,040 Other debt securities(2) 157,488 19,046 248 176,286 Equity securities(3) 41,009 20,811 64 61,756
Total ¥ 292,800 ¥ 44,657 ¥ 375 ¥ 337,082
(1) Primarily Japanese government, agency and municipal securities. (2) Primarily corporate debt securities. (3) Primarily Japanese equities.
For the six months ended September 30, 2014, non-trading securities of ¥42,320 million were disposed of resulting in ¥463 million of realized gains and ¥13 million of realized losses. Total proceeds received from these disposals were ¥42,770 million. For the six months ended September 30, 2015, non-trading securities of ¥33,884 million were disposed of resulting in ¥3,490 million of realized gains and ¥138 million of realized losses. Total proceeds received from these disposals were ¥37,236 million.
For the three months ended September 30, 2014, non-trading securities of ¥27,652 million were disposed of resulting in ¥364 million of realized gains and ¥11 million of realized losses. Total proceeds received from these disposals were ¥28,005 million. For the three months ended September 30, 2015, non-trading securities of ¥24,603 million were disposed of resulting in ¥3,005 million of realized gains and ¥20 million of realized losses. Total proceeds received from these disposals were ¥27,588 million.
Related gains and losses were computed using the moving-average method. For the six months ended September 30, 2015, there were no transfers of non-trading securities to trading assets.
The following table presents the fair value of residual contractual maturity of non-trading debt securities as of September 30, 2015. Actual maturities may differ from contractual maturities as certain securities contain features that allow redemption of the securities prior to their contractual maturity.
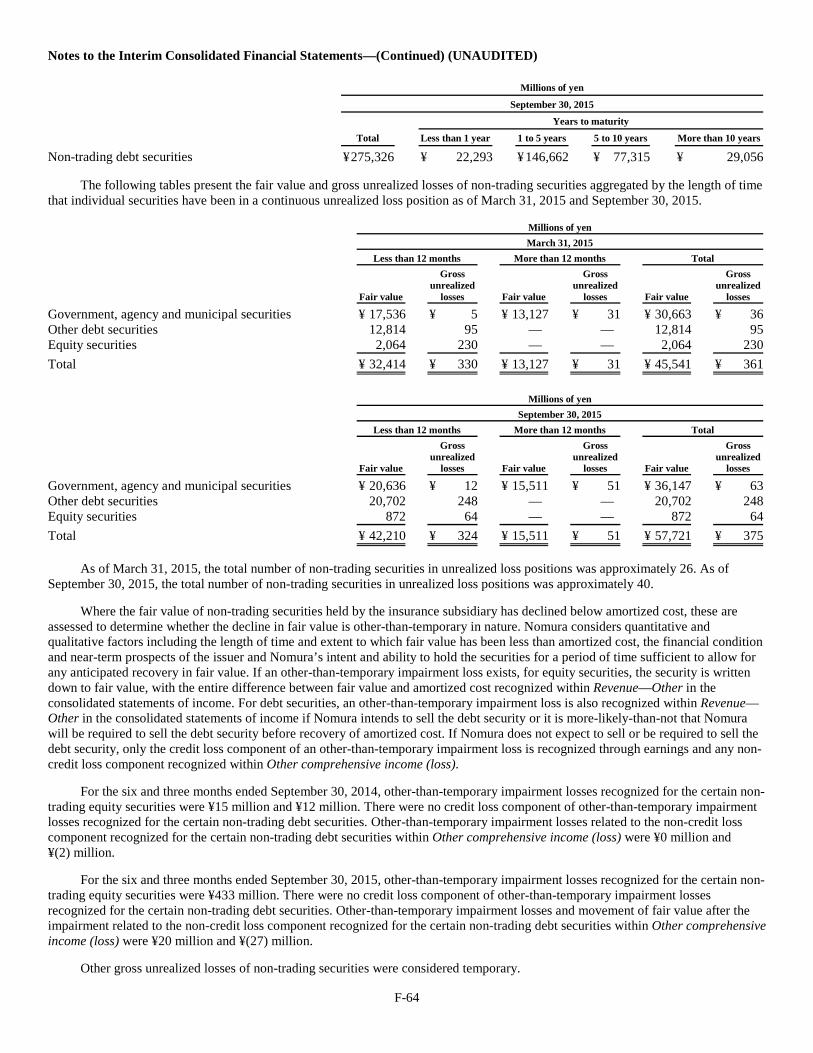
F-64
Notes to the Interim Consolidated Financial Statements—(Continued) (UNAUDITED)
Millions of yen
September 30, 2015
Total
Years to maturity
Less than 1 year
1 to 5 years
5 to 10 years
More than 10 years
Non-trading debt securities ¥ 275,326 ¥ 22,293 ¥ 146,662 ¥ 77,315 ¥ 29,056
The following tables present the fair value and gross unrealized losses of non-trading securities aggregated by the length of time that individual securities have been in a continuous unrealized loss position as of March 31, 2015 and September 30, 2015.
Millions of yen
March 31, 2015
Less than 12 months
More than 12 months
Total
Fair value
Gross unrealized
losses
Fair value
Gross unrealized
losses
Fair value
Gross unrealized
losses
Government, agency and municipal securities ¥ 17,536 ¥ 5 ¥ 13,127 ¥ 31 ¥ 30,663 ¥ 36 Other debt securities 12,814 95 — — 12,814 95 Equity securities 2,064 230 — — 2,064 230
Total ¥ 32,414 ¥ 330 ¥ 13,127 ¥ 31 ¥ 45,541 ¥ 361
Millions of yen
September 30, 2015
Less than 12 months
More than 12 months
Total
Fair value
Gross unrealized
losses
Fair value
Gross unrealized
losses
Fair value
Gross unrealized
losses
Government, agency and municipal securities ¥ 20,636 ¥ 12 ¥ 15,511 ¥ 51 ¥ 36,147 ¥ 63 Other debt securities 20,702 248 — — 20,702 248 Equity securities 872 64 — — 872 64
Total ¥ 42,210 ¥ 324 ¥ 15,511 ¥ 51 ¥ 57,721 ¥ 375
As of March 31, 2015, the total number of non-trading securities in unrealized loss positions was approximately 26. As of September 30, 2015, the total number of non-trading securities in unrealized loss positions was approximately 40.
Where the fair value of non-trading securities held by the insurance subsidiary has declined below amortized cost, these are assessed to determine whether the decline in fair value is other-than-temporary in nature. Nomura considers quantitative and qualitative factors including the length of time and extent to which fair value has been less than amortized cost, the financial condition and near-term prospects of the issuer and Nomura’s intent and ability to hold the securities for a period of time sufficient to allow for any anticipated recovery in fair value. If an other-than-temporary impairment loss exists, for equity securities, the security is written down to fair value, with the entire difference between fair value and amortized cost recognized within Revenue—Other in the consolidated statements of income. For debt securities, an other-than-temporary impairment loss is also recognized within Revenue—Other in the consolidated statements of income if Nomura intends to sell the debt security or it is more-likely-than-not that Nomura will be required to sell the debt security before recovery of amortized cost. If Nomura does not expect to sell or be required to sell the debt security, only the credit loss component of an other-than-temporary impairment loss is recognized through earnings and any non-credit loss component recognized within Other comprehensive income (loss).
For the six and three months ended September 30, 2014, other-than-temporary impairment losses recognized for the certain non-trading equity securities were ¥15 million and ¥12 million. There were no credit loss component of other-than-temporary impairment losses recognized for the certain non-trading debt securities. Other-than-temporary impairment losses related to the non-credit loss component recognized for the certain non-trading debt securities within Other comprehensive income (loss) were ¥0 million and ¥(2) million.
For the six and three months ended September 30, 2015, other-than-temporary impairment losses recognized for the certain non-trading equity securities were ¥433 million. There were no credit loss component of other-than-temporary impairment losses recognized for the certain non-trading debt securities. Other-than-temporary impairment losses and movement of fair value after the impairment related to the non-credit loss component recognized for the certain non-trading debt securities within Other comprehensive income (loss) were ¥20 million and ¥(27) million.
Other gross unrealized losses of non-trading securities were considered temporary.
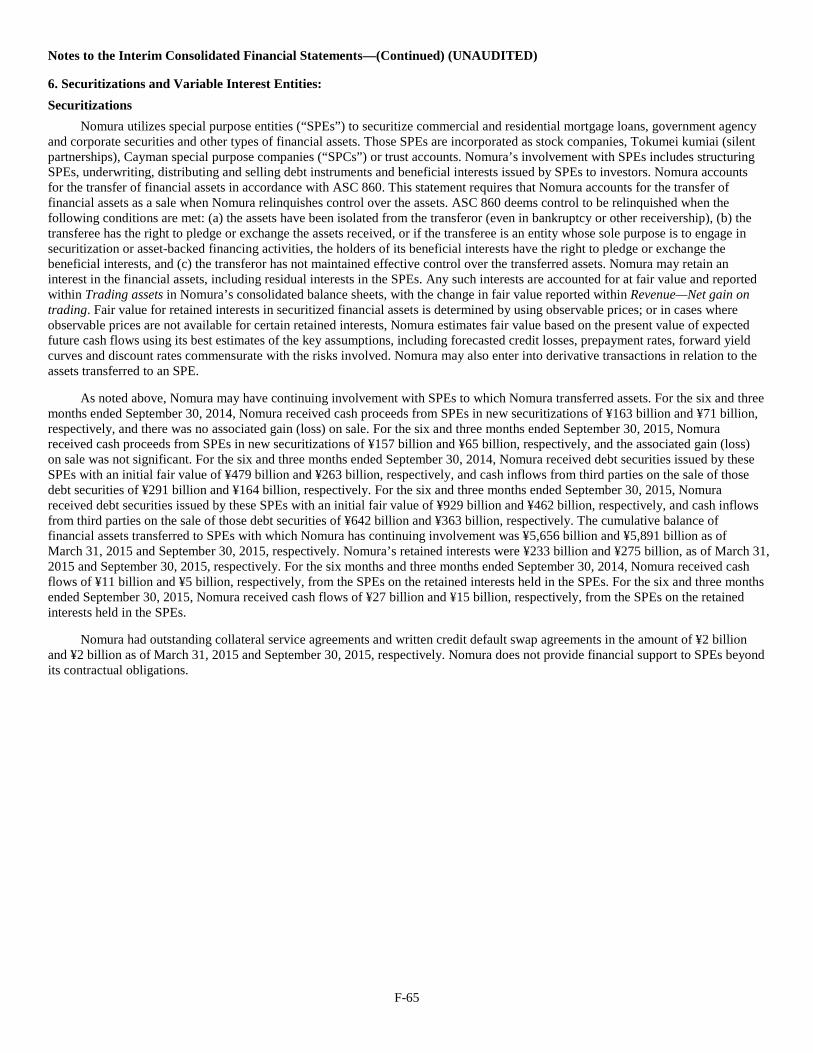
F-65
Notes to the Interim Consolidated Financial Statements—(Continued) (UNAUDITED)
6. Securitizations and Variable Interest Entities: Securitizations
Nomura utilizes special purpose entities (“SPEs”) to securitize commercial and residential mortgage loans, government agency and corporate securities and other types of financial assets. Those SPEs are incorporated as stock companies, Tokumei kumiai (silent partnerships), Cayman special purpose companies (“SPCs”) or trust accounts. Nomura’s involvement with SPEs includes structuring SPEs, underwriting, distributing and selling debt instruments and beneficial interests issued by SPEs to investors. Nomura accounts for the transfer of financial assets in accordance with ASC 860. This statement requires that Nomura accounts for the transfer of financial assets as a sale when Nomura relinquishes control over the assets. ASC 860 deems control to be relinquished when the following conditions are met: (a) the assets have been isolated from the transferor (even in bankruptcy or other receivership), (b) the transferee has the right to pledge or exchange the assets received, or if the transferee is an entity whose sole purpose is to engage in securitization or asset-backed financing activities, the holders of its beneficial interests have the right to pledge or exchange the beneficial interests, and (c) the transferor has not maintained effective control over the transferred assets. Nomura may retain an interest in the financial assets, including residual interests in the SPEs. Any such interests are accounted for at fair value and reported within Trading assets in Nomura’s consolidated balance sheets, with the change in fair value reported within Revenue—Net gain on trading. Fair value for retained interests in securitized financial assets is determined by using observable prices; or in cases where observable prices are not available for certain retained interests, Nomura estimates fair value based on the present value of expected future cash flows using its best estimates of the key assumptions, including forecasted credit losses, prepayment rates, forward yield curves and discount rates commensurate with the risks involved. Nomura may also enter into derivative transactions in relation to the assets transferred to an SPE.
As noted above, Nomura may have continuing involvement with SPEs to which Nomura transferred assets. For the six and three months ended September 30, 2014, Nomura received cash proceeds from SPEs in new securitizations of ¥163 billion and ¥71 billion, respectively, and there was no associated gain (loss) on sale. For the six and three months ended September 30, 2015, Nomura received cash proceeds from SPEs in new securitizations of ¥157 billion and ¥65 billion, respectively, and the associated gain (loss) on sale was not significant. For the six and three months ended September 30, 2014, Nomura received debt securities issued by these SPEs with an initial fair value of ¥479 billion and ¥263 billion, respectively, and cash inflows from third parties on the sale of those debt securities of ¥291 billion and ¥164 billion, respectively. For the six and three months ended September 30, 2015, Nomura received debt securities issued by these SPEs with an initial fair value of ¥929 billion and ¥462 billion, respectively, and cash inflows from third parties on the sale of those debt securities of ¥642 billion and ¥363 billion, respectively. The cumulative balance of financial assets transferred to SPEs with which Nomura has continuing involvement was ¥5,656 billion and ¥5,891 billion as of March 31, 2015 and September 30, 2015, respectively. Nomura’s retained interests were ¥233 billion and ¥275 billion, as of March 31, 2015 and September 30, 2015, respectively. For the six months and three months ended September 30, 2014, Nomura received cash flows of ¥11 billion and ¥5 billion, respectively, from the SPEs on the retained interests held in the SPEs. For the six and three months ended September 30, 2015, Nomura received cash flows of ¥27 billion and ¥15 billion, respectively, from the SPEs on the retained interests held in the SPEs.
Nomura had outstanding collateral service agreements and written credit default swap agreements in the amount of ¥2 billion and ¥2 billion as of March 31, 2015 and September 30, 2015, respectively. Nomura does not provide financial support to SPEs beyond its contractual obligations.
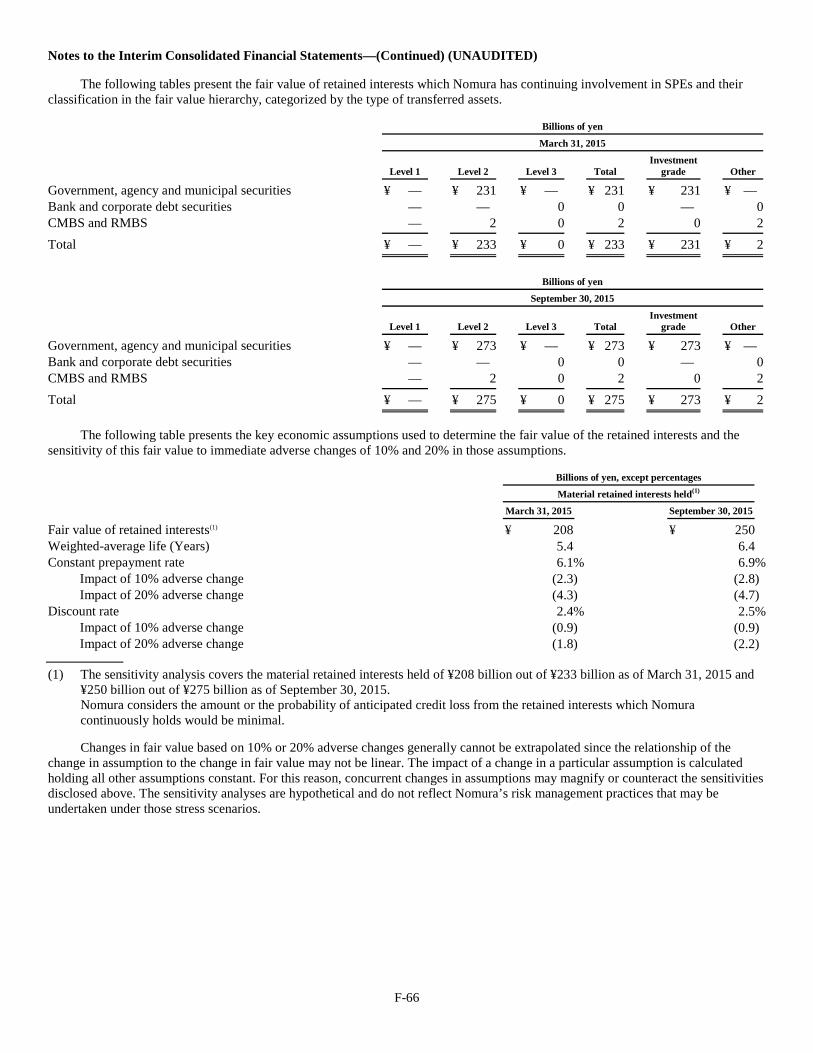
F-66
Notes to the Interim Consolidated Financial Statements—(Continued) (UNAUDITED)
The following tables present the fair value of retained interests which Nomura has continuing involvement in SPEs and their classification in the fair value hierarchy, categorized by the type of transferred assets.
Billions of yen
March 31, 2015
Level 1
Level 2
Level 3
Total
Investment grade
Other
Government, agency and municipal securities ¥ — ¥ 231 ¥ — ¥ 231 ¥ 231 ¥ — Bank and corporate debt securities — — 0 0 — 0 CMBS and RMBS — 2 0 2 0 2
Total ¥ — ¥ 233 ¥ 0 ¥ 233 ¥ 231 ¥ 2
Billions of yen
September 30, 2015
Level 1
Level 2
Level 3
Total
Investment grade
Other
Government, agency and municipal securities ¥ — ¥ 273 ¥ — ¥ 273 ¥ 273 ¥ — Bank and corporate debt securities — — 0 0 — 0 CMBS and RMBS — 2 0 2 0 2
Total ¥ — ¥ 275 ¥ 0 ¥ 275 ¥ 273 ¥ 2
The following table presents the key economic assumptions used to determine the fair value of the retained interests and the sensitivity of this fair value to immediate adverse changes of 10% and 20% in those assumptions.
Billions of yen, except percentages
Material retained interests held(1)
March 31, 2015
September 30, 2015
Fair value of retained interests(1) ¥ 208 ¥ 250 Weighted-average life (Years) 5.4 6.4 Constant prepayment rate 6.1% 6.9%
Impact of 10% adverse change (2.3) (2.8) Impact of 20% adverse change (4.3) (4.7)
Discount rate 2.4% 2.5% Impact of 10% adverse change (0.9) (0.9) Impact of 20% adverse change (1.8) (2.2)
(1) The sensitivity analysis covers the material retained interests held of ¥208 billion out of ¥233 billion as of March 31, 2015 and
¥250 billion out of ¥275 billion as of September 30, 2015. Nomura considers the amount or the probability of anticipated credit loss from the retained interests which Nomura
continuously holds would be minimal.
Changes in fair value based on 10% or 20% adverse changes generally cannot be extrapolated since the relationship of the change in assumption to the change in fair value may not be linear. The impact of a change in a particular assumption is calculated holding all other assumptions constant. For this reason, concurrent changes in assumptions may magnify or counteract the sensitivities disclosed above. The sensitivity analyses are hypothetical and do not reflect Nomura’s risk management practices that may be undertaken under those stress scenarios.
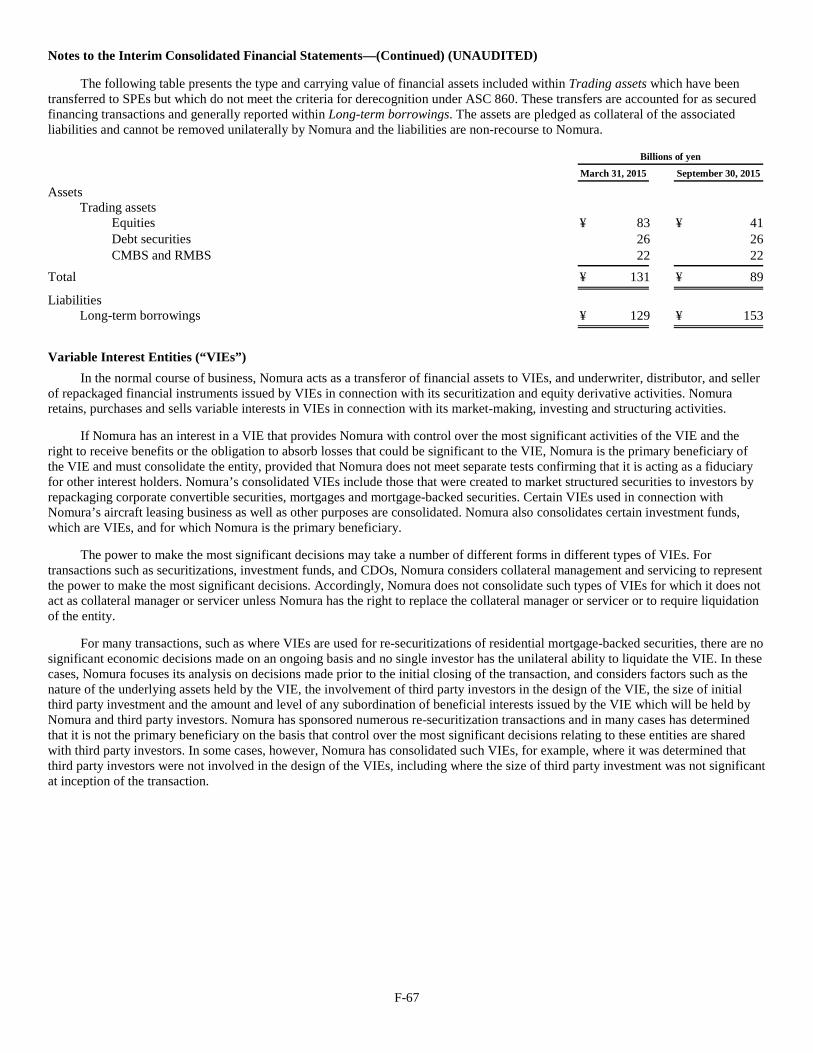
F-67
Notes to the Interim Consolidated Financial Statements—(Continued) (UNAUDITED)
The following table presents the type and carrying value of financial assets included within Trading assets which have been transferred to SPEs but which do not meet the criteria for derecognition under ASC 860. These transfers are accounted for as secured financing transactions and generally reported within Long-term borrowings. The assets are pledged as collateral of the associated liabilities and cannot be removed unilaterally by Nomura and the liabilities are non-recourse to Nomura.
Billions of yen
March 31, 2015
September 30, 2015
Assets
Trading assets
Equities ¥ 83 ¥ 41 Debt securities 26 26 CMBS and RMBS 22 22
Total ¥ 131 ¥ 89
Liabilities
Long-term borrowings ¥ 129 ¥ 153
Variable Interest Entities (“VIEs”) In the normal course of business, Nomura acts as a transferor of financial assets to VIEs, and underwriter, distributor, and seller
of repackaged financial instruments issued by VIEs in connection with its securitization and equity derivative activities. Nomura retains, purchases and sells variable interests in VIEs in connection with its market-making, investing and structuring activities.
If Nomura has an interest in a VIE that provides Nomura with control over the most significant activities of the VIE and the right to receive benefits or the obligation to absorb losses that could be significant to the VIE, Nomura is the primary beneficiary of the VIE and must consolidate the entity, provided that Nomura does not meet separate tests confirming that it is acting as a fiduciary for other interest holders. Nomura’s consolidated VIEs include those that were created to market structured securities to investors by repackaging corporate convertible securities, mortgages and mortgage-backed securities. Certain VIEs used in connection with Nomura’s aircraft leasing business as well as other purposes are consolidated. Nomura also consolidates certain investment funds, which are VIEs, and for which Nomura is the primary beneficiary.
The power to make the most significant decisions may take a number of different forms in different types of VIEs. For transactions such as securitizations, investment funds, and CDOs, Nomura considers collateral management and servicing to represent the power to make the most significant decisions. Accordingly, Nomura does not consolidate such types of VIEs for which it does not act as collateral manager or servicer unless Nomura has the right to replace the collateral manager or servicer or to require liquidation of the entity.
For many transactions, such as where VIEs are used for re-securitizations of residential mortgage-backed securities, there are no significant economic decisions made on an ongoing basis and no single investor has the unilateral ability to liquidate the VIE. In these cases, Nomura focuses its analysis on decisions made prior to the initial closing of the transaction, and considers factors such as the nature of the underlying assets held by the VIE, the involvement of third party investors in the design of the VIE, the size of initial third party investment and the amount and level of any subordination of beneficial interests issued by the VIE which will be held by Nomura and third party investors. Nomura has sponsored numerous re-securitization transactions and in many cases has determined that it is not the primary beneficiary on the basis that control over the most significant decisions relating to these entities are shared with third party investors. In some cases, however, Nomura has consolidated such VIEs, for example, where it was determined that third party investors were not involved in the design of the VIEs, including where the size of third party investment was not significant at inception of the transaction.
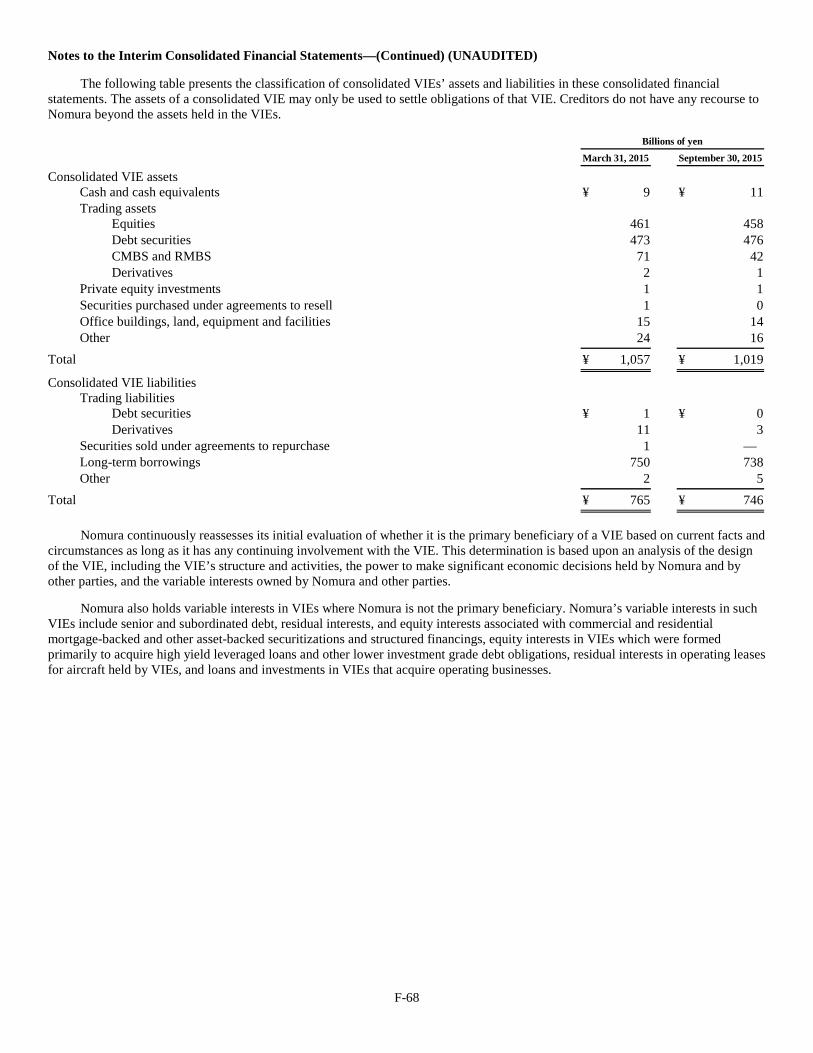
F-68
Notes to the Interim Consolidated Financial Statements—(Continued) (UNAUDITED)
The following table presents the classification of consolidated VIEs’ assets and liabilities in these consolidated financial statements. The assets of a consolidated VIE may only be used to settle obligations of that VIE. Creditors do not have any recourse to Nomura beyond the assets held in the VIEs.
Billions of yen
March 31, 2015
September 30, 2015
Consolidated VIE assets
Cash and cash equivalents ¥ 9 ¥ 11 Trading assets
Equities 461 458 Debt securities 473 476 CMBS and RMBS 71 42 Derivatives 2 1
Private equity investments 1 1 Securities purchased under agreements to resell 1 0 Office buildings, land, equipment and facilities 15 14 Other 24 16
Total ¥ 1,057 ¥ 1,019
Consolidated VIE liabilities
Trading liabilities
Debt securities ¥ 1 ¥ 0 Derivatives 11 3
Securities sold under agreements to repurchase 1 — Long-term borrowings 750 738 Other 2 5
Total ¥ 765 ¥ 746
Nomura continuously reassesses its initial evaluation of whether it is the primary beneficiary of a VIE based on current facts and circumstances as long as it has any continuing involvement with the VIE. This determination is based upon an analysis of the design of the VIE, including the VIE’s structure and activities, the power to make significant economic decisions held by Nomura and by other parties, and the variable interests owned by Nomura and other parties.
Nomura also holds variable interests in VIEs where Nomura is not the primary beneficiary. Nomura’s variable interests in such VIEs include senior and subordinated debt, residual interests, and equity interests associated with commercial and residential mortgage-backed and other asset-backed securitizations and structured financings, equity interests in VIEs which were formed primarily to acquire high yield leveraged loans and other lower investment grade debt obligations, residual interests in operating leases for aircraft held by VIEs, and loans and investments in VIEs that acquire operating businesses.
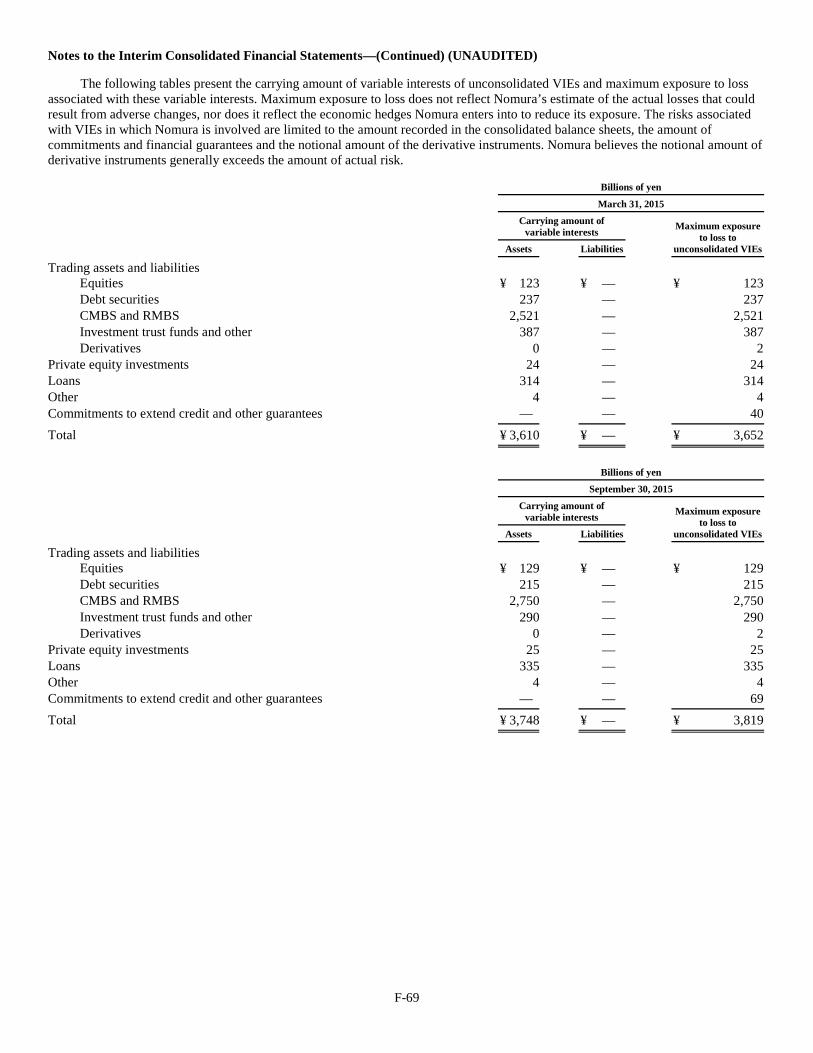
F-69
Notes to the Interim Consolidated Financial Statements—(Continued) (UNAUDITED)
The following tables present the carrying amount of variable interests of unconsolidated VIEs and maximum exposure to loss associated with these variable interests. Maximum exposure to loss does not reflect Nomura’s estimate of the actual losses that could result from adverse changes, nor does it reflect the economic hedges Nomura enters into to reduce its exposure. The risks associated with VIEs in which Nomura is involved are limited to the amount recorded in the consolidated balance sheets, the amount of commitments and financial guarantees and the notional amount of the derivative instruments. Nomura believes the notional amount of derivative instruments generally exceeds the amount of actual risk.
Billions of yen
March 31, 2015
Carrying amount of variable interests
Maximum exposure to loss to
unconsolidated VIEs
Assets
Liabilities
Trading assets and liabilities
Equities ¥ 123 ¥ — ¥ 123 Debt securities 237 — 237 CMBS and RMBS 2,521 — 2,521 Investment trust funds and other 387 — 387 Derivatives 0 — 2
Private equity investments 24 — 24 Loans 314 — 314 Other 4 — 4 Commitments to extend credit and other guarantees — — 40
Total ¥ 3,610 ¥ — ¥ 3,652
Billions of yen
September 30, 2015
Carrying amount of variable interests
Maximum exposure to loss to
unconsolidated VIEs
Assets
Liabilities
Trading assets and liabilities
Equities ¥ 129 ¥ — ¥ 129 Debt securities 215 — 215 CMBS and RMBS 2,750 — 2,750 Investment trust funds and other 290 — 290 Derivatives 0 — 2
Private equity investments 25 — 25 Loans 335 — 335 Other 4 — 4 Commitments to extend credit and other guarantees — — 69
Total ¥ 3,748 ¥ — ¥ 3,819
F-70
Notes to the Interim Consolidated Financial Statements—(Continued) (UNAUDITED)
7. Financing receivables: In the normal course of business, Nomura extends financing to clients primarily in the form of loans and collateralized
agreements such as reverse repurchase agreements and securities borrowing transactions. These financing receivables are recognized as assets on Nomura’s consolidated balance sheets and provide a contractual right to receive money either on demand or on future fixed or determinable dates.
Collateralized agreements Collateralized agreements consist of reverse repurchase agreements disclosed as Securities purchased under agreements to
resell and securities borrowing transactions disclosed as Securities borrowed in the consolidated balance sheets, including those executed under Gensaki Repo agreements. Reverse repurchase agreements and securities borrowing transactions principally involve the buying of government and government agency securities from customers under agreements that also require Nomura to resell these securities to those customers, or borrowing these securities with cash collateral. Nomura monitors the value of the underlying securities on a daily basis to the related receivables, including accrued interest, and requests or returns additional collateral when appropriate. Reverse repurchase agreements are generally recognized in the consolidated balance sheets at the amount for which the securities were originally acquired with applicable accrued interest. Securities borrowing transactions are generally recognized in the consolidated balance sheets at the amount of cash collateral advanced. No allowance for credit losses is generally recognized against these transactions due to the strict collateralization requirements.
Loans receivable The key types of loans receivable recognized by Nomura are loans at banks, short-term secured margin loans, inter-bank money
market loans and corporate loans.
Loans at banks include both retail and commercial secured and unsecured loans extended by licensed banking entities within Nomura such as The Nomura Trust & Banking Co., Ltd. and Nomura Bank International plc. For both retail and commercial loans secured by real estate or securities, Nomura is exposed to the risk of a decline in the value of the underlying collateral. Loans at banks also include unsecured commercial loans provided to investment banking clients for relationship purposes. Nomura is exposed to risk of default of the counterparty, although these counterparties usually have high credit ratings. Where loans are secured by guarantees, Nomura is also exposed to the risk of default by the guarantor.
Short-term secured margin loans are loans provided to clients in connection with securities brokerage business. These loans provide funding for clients in order to purchase securities. Nomura requests initial margin in the form of acceptable collateral securities or deposits against these loans and holds the purchased securities as collateral through the life of the loans. If the value of the securities declines by more than specified amounts, Nomura can make additional margin calls in order to maintain a specified ratio of loan-to-value (“LTV”) ratio. For these reasons, the risk to Nomura of providing these loans is limited.
Inter-bank money market loans are loans to financial institutions in the inter-bank money market, where overnight and intra-day financings are traded through money market dealers. The risk to Nomura of making these loans is not significant as only qualified financial institutions can participate in these markets and these loans are usually overnight or short-term in nature.
Corporate loans are primarily commercial loans provided to corporate clients extended by non-licensed banking entities within Nomura. Corporate loans include loans secured by real estate or securities, as well as unsecured commercial loans provided to investment banking clients for relationship purposes. The risk to Nomura of making these loans is similar to those risks arising from commercial loans reported in loans at banks.
F-71
Notes to the Interim Consolidated Financial Statements—(Continued) (UNAUDITED)
In addition to the loans above, Nomura has advances to affiliated companies which are loans provided to related parties of Nomura. As these loans are generally not secured, Nomura is exposed to the risk of default of the counterparty.
The following tables present a summary of loans receivable reported within Loans receivable or Investments in and advances to affiliated companies in the consolidated balance sheets by portfolio segment.
Millions of yen
March 31, 2015
Carried at amortized cost
Carried at fair value(1)
Total
Loans receivable
Loans at banks ¥ 324,503 ¥ — ¥ 324,503 Short-term secured margin loans 425,245 — 425,245 Inter-bank money market loans 16,995 — 16,995 Corporate loans 377,114 317,218 694,332
Total loans receivable ¥ 1,143,857 ¥ 317,218 ¥1,461,075
Advances to affiliated companies 2,104 — 2,104
Total ¥ 1,145,961 ¥ 317,218 ¥1,463,179
Millions of yen
September 30, 2015
Carried at amortized cost
Carried at fair value(1)
Total
Loans receivable
Loans at banks ¥ 359,669 ¥ — ¥ 359,669 Short-term secured margin loans 497,459 — 497,459 Inter-bank money market loans 13,709 — 13,709 Corporate loans 446,993 278,943 725,936
Total loans receivable ¥ 1,317,830 ¥ 278,943 ¥ 1,596,773
Advances to affiliated companies 761 — 761
Total ¥ 1,318,591 ¥ 278,943 ¥ 1,597,534
(1) Includes loans receivable and loan commitments carried at fair value through election of the fair value option.
The amounts of significant purchases of corporate loans during the six months ended September 30, 2014, were ¥62,309 million. There were no significant purchases of loans receivable during the three months ended September 30, 2014. The amounts of significant sales of corporate loans during the six and three months ended September 30, 2014, were ¥8,636 million. During the same period, there were no significant reclassifications of loans receivable to trading assets. The amount of significant purchases of corporate loans during the six months ended September 30, 2015, was ¥49,140 million. The amount of purchases of corporate loans during the three months ended September 30, 2015, was ¥27,997 million. There were no significant sales of loans receivable during the six and three months ended September 30, 2015. During the same period, there were no significant reclassifications of loans receivable to trading assets.
Allowance for credit losses Management establishes an allowance for credit losses against loans carried at amortized cost which reflects management’s best
estimate of probable losses incurred. The allowance for credit losses against loans, which is reported in the consolidated balance sheets within Allowance for doubtful accounts, comprises two components:
• A specific component for loans which have been individually evaluated for impairment; and • A general component for loans which, while not individually evaluated for impairment, have been collectively evaluated
for impairment based on historical loss experience.
F-72
Notes to the Interim Consolidated Financial Statements—(Continued) (UNAUDITED)
The specific component of the allowance reflects probable losses incurred within loans which have been individually evaluated for impairment. A loan is defined as being impaired when, based on current information and events, it is probable that all amounts due according to the contractual terms of the loan agreement will not be collected. Factors considered by management in determining impairment include an assessment of the ability of borrowers to pay by considering various factors such as the nature of the loan, prior credit loss experience, current economic conditions, the current financial situation of the borrower and the fair value of any underlying collateral. Loans that experience insignificant payment delays or insignificant payment shortfalls are not classified as impaired. Impairment is measured on a loan by loan basis by adjusting the carrying value of the loan to either the present value of expected future cash flows discounted at the loan’s effective interest rate, the loan’s observable market price, or the fair value of the collateral if the loan is collateral dependent.
The general component of the allowance is for loans not individually evaluated for impairment and includes judgment about collectability based on available information at the balance sheet date and the uncertainties inherent in those underlying assumptions. The allowance is based on historical loss experience adjusted for qualitative factors such as current economic conditions.
While management has based its estimate of the allowance for credit losses against loans on the best information available, future adjustments to the allowance may be necessary as a result of changes in the economic environment or variances between actual results and original assumptions.
Loans are charged-off when Nomura determines that the loans are uncollectible. This determination is based on factors such as the occurrence of significant changes in the borrower’s financial position such that the borrower can no longer pay the obligation or that the proceeds from collateral will not be sufficient to pay the loans.
F-73
Notes to the Interim Consolidated Financial Statements—(Continued) (UNAUDITED)
The following tables present changes in the allowance for credit losses for the six and three months ended September 30, 2014 and 2015.
Millions of yen
Six months ended September 30, 2014
Allowance for credit losses against loans
Allowance for credit losses
against receivables other than
loans
Total allowance for
doubtful accounts
Loans at banks
Short-term secured margin loans
Inter-bank money
market loans
Corporate loans
Advances to affiliated
companies
Subtotal
Opening balance ¥ 678 ¥ 87 ¥ — ¥ 82 ¥ 1 ¥ 848 ¥ 2,161 ¥ 3,009 Provision for credit losses (139) (35) — (13) (0) (187 ) 34 (153) Charge-offs — — — — — — (121) (121) Other(1) — — — 0 — 0 19 19
Ending balance ¥ 539 ¥ 52 ¥ — ¥ 69 ¥ 1 ¥ 661 ¥ 2,093 ¥ 2,754
Millions of yen
Six months ended September 30, 2015
Allowance for credit losses against loans
Allowance for credit losses
against receivables other than
loans
Total allowance for
doubtful accounts
Loans at banks
Short-term secured margin loans
Inter-bank money
market loans
Corporate loans
Advances to affiliated
companies
Subtotal
Opening balance ¥ 739 ¥ 142 ¥ — ¥ 79 ¥ 1 ¥ 961 ¥ 2,292 ¥ 3,253 Provision for credit losses 96 4 — (71) (1) 28 127 155 Charge-offs — — — — — — — — Other(1) — 1 — 0 — 1 (26) (25)
Ending balance ¥ 835 ¥ 147 ¥ — ¥ 8 ¥ 0 ¥ 990 ¥ 2,393 ¥ 3,383
Millions of yen
Three months ended September 30, 2014
Allowance for credit losses against loans
Allowance for credit losses
against receivables other than
loans
Total allowance for
doubtful accounts
Loans at banks
Short-term secured margin loans
Inter-bank money
market loans
Corporate loans
Advances to affiliated
companies
Subtotal
Opening balance ¥ 678 ¥ 58 ¥ — ¥ 69 ¥ 1 ¥ 806 ¥ 2,050 ¥ 2,856 Provision for credit losses (139) (6) — 0 (0) (145) 29 (116) Charge-offs — — — — — — (8) (8) Other(1) — — — 0 — 0 22 22
Ending balance ¥ 539 ¥ 52 ¥ — ¥ 69 ¥ 1 ¥ 661 ¥ 2,093 ¥ 2,754
Millions of yen
Three months ended September 30, 2015
Allowance for credit losses against loans
Allowance for credit losses
against receivables other than
loans
Total allowance for
doubtful accounts
Loans at banks
Short-term secured margin loans
Inter-bank money
market loans
Corporate loans
Advances to affiliated
companies
Subtotal
Opening balance ¥ 739 ¥ 155 ¥ — ¥ 8 ¥ 1 ¥ 903 ¥ 2,306 ¥ 3,209 Provision for credit losses 96 (8) — — (1) 87 123 210 Charge-offs — — — — — — — — Other(1) — 0 — 0 — 0 (36) (36)
Ending balance ¥ 835 ¥ 147 ¥ — ¥ 8 ¥ 0 ¥ 990 ¥ 2,393 ¥ 3,383
(1) Includes the effect of foreign exchange movements.
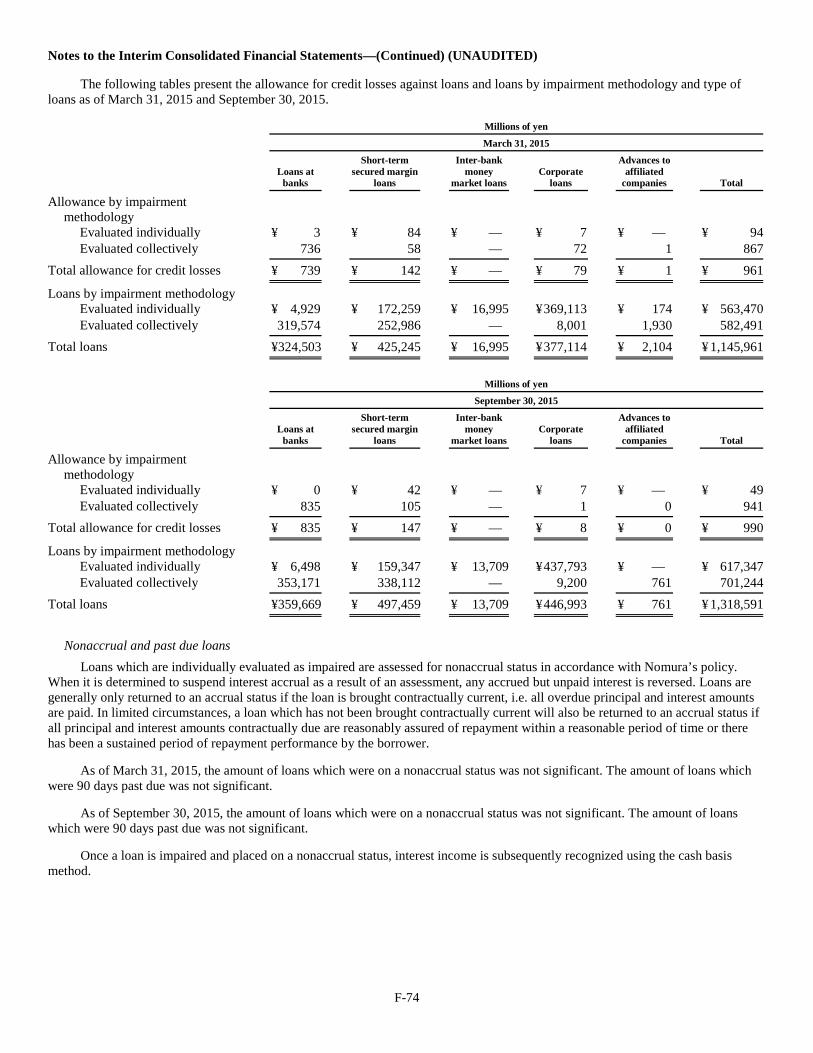
F-74
Notes to the Interim Consolidated Financial Statements—(Continued) (UNAUDITED)
The following tables present the allowance for credit losses against loans and loans by impairment methodology and type of loans as of March 31, 2015 and September 30, 2015.
Millions of yen
March 31, 2015
Loans at banks
Short-term secured margin
loans
Inter-bank money
market loans
Corporate loans
Advances to affiliated
companies
Total
Allowance by impairment methodology
Evaluated individually ¥ 3 ¥ 84 ¥ — ¥ 7 ¥ — ¥ 94 Evaluated collectively 736 58 — 72 1 867
Total allowance for credit losses ¥ 739 ¥ 142 ¥ — ¥ 79 ¥ 1 ¥ 961
Loans by impairment methodology
Evaluated individually ¥ 4,929 ¥ 172,259 ¥ 16,995 ¥ 369,113 ¥ 174 ¥ 563,470 Evaluated collectively 319,574 252,986 — 8,001 1,930 582,491
Total loans ¥324,503 ¥ 425,245 ¥ 16,995 ¥ 377,114 ¥ 2,104 ¥ 1,145,961
Millions of yen
September 30, 2015
Loans at banks
Short-term secured margin
loans
Inter-bank money
market loans
Corporate loans
Advances to affiliated
companies
Total
Allowance by impairment methodology
Evaluated individually ¥ 0 ¥ 42 ¥ — ¥ 7 ¥ — ¥ 49 Evaluated collectively 835 105 — 1 0 941
Total allowance for credit losses ¥ 835 ¥ 147 ¥ — ¥ 8 ¥ 0 ¥ 990
Loans by impairment methodology
Evaluated individually ¥ 6,498 ¥ 159,347 ¥ 13,709 ¥ 437,793 ¥ — ¥ 617,347 Evaluated collectively 353,171 338,112 — 9,200 761 701,244
Total loans ¥359,669 ¥ 497,459 ¥ 13,709 ¥ 446,993 ¥ 761 ¥ 1,318,591
Nonaccrual and past due loans Loans which are individually evaluated as impaired are assessed for nonaccrual status in accordance with Nomura’s policy.
When it is determined to suspend interest accrual as a result of an assessment, any accrued but unpaid interest is reversed. Loans are generally only returned to an accrual status if the loan is brought contractually current, i.e. all overdue principal and interest amounts are paid. In limited circumstances, a loan which has not been brought contractually current will also be returned to an accrual status if all principal and interest amounts contractually due are reasonably assured of repayment within a reasonable period of time or there has been a sustained period of repayment performance by the borrower.
As of March 31, 2015, the amount of loans which were on a nonaccrual status was not significant. The amount of loans which were 90 days past due was not significant.
As of September 30, 2015, the amount of loans which were on a nonaccrual status was not significant. The amount of loans which were 90 days past due was not significant.
Once a loan is impaired and placed on a nonaccrual status, interest income is subsequently recognized using the cash basis method.
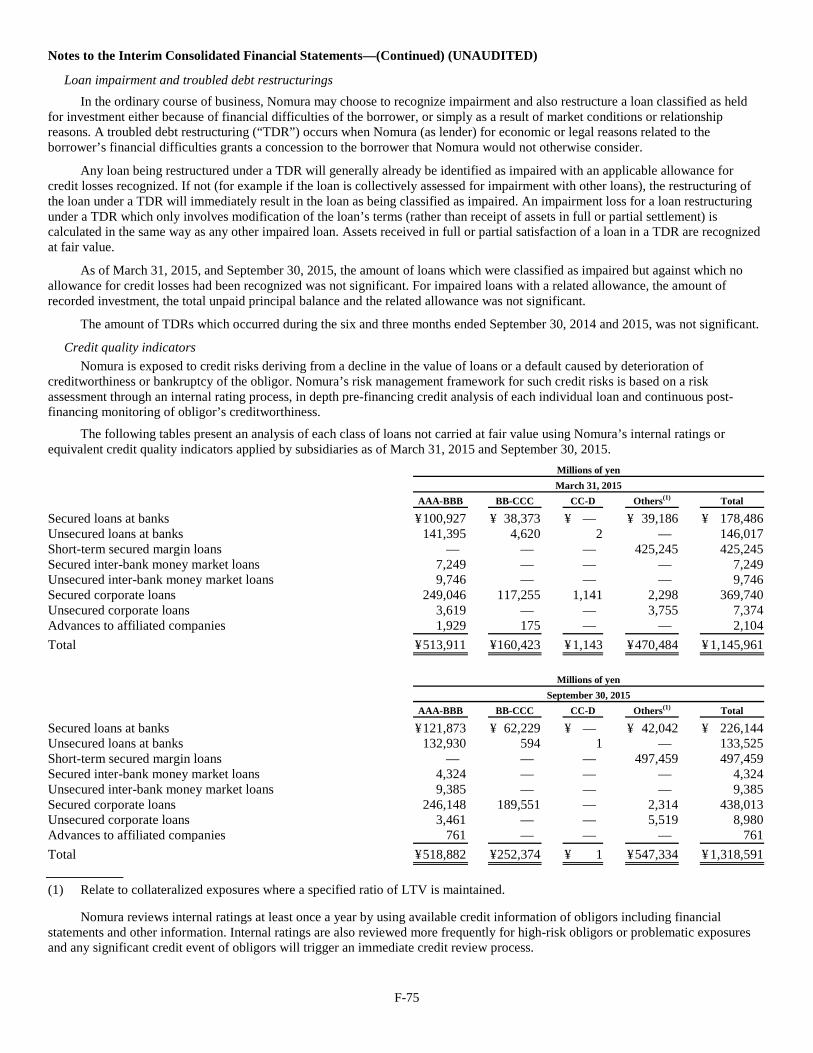
F-75
Notes to the Interim Consolidated Financial Statements—(Continued) (UNAUDITED)
Loan impairment and troubled debt restructurings In the ordinary course of business, Nomura may choose to recognize impairment and also restructure a loan classified as held
for investment either because of financial difficulties of the borrower, or simply as a result of market conditions or relationship reasons. A troubled debt restructuring (“TDR”) occurs when Nomura (as lender) for economic or legal reasons related to the borrower’s financial difficulties grants a concession to the borrower that Nomura would not otherwise consider.
Any loan being restructured under a TDR will generally already be identified as impaired with an applicable allowance for credit losses recognized. If not (for example if the loan is collectively assessed for impairment with other loans), the restructuring of the loan under a TDR will immediately result in the loan as being classified as impaired. An impairment loss for a loan restructuring under a TDR which only involves modification of the loan’s terms (rather than receipt of assets in full or partial settlement) is calculated in the same way as any other impaired loan. Assets received in full or partial satisfaction of a loan in a TDR are recognized at fair value.
As of March 31, 2015, and September 30, 2015, the amount of loans which were classified as impaired but against which no allowance for credit losses had been recognized was not significant. For impaired loans with a related allowance, the amount of recorded investment, the total unpaid principal balance and the related allowance was not significant.
The amount of TDRs which occurred during the six and three months ended September 30, 2014 and 2015, was not significant. Credit quality indicators
Nomura is exposed to credit risks deriving from a decline in the value of loans or a default caused by deterioration of creditworthiness or bankruptcy of the obligor. Nomura’s risk management framework for such credit risks is based on a risk assessment through an internal rating process, in depth pre-financing credit analysis of each individual loan and continuous post-financing monitoring of obligor’s creditworthiness.
The following tables present an analysis of each class of loans not carried at fair value using Nomura’s internal ratings or equivalent credit quality indicators applied by subsidiaries as of March 31, 2015 and September 30, 2015.
Millions of yen
March 31, 2015
AAA-BBB
BB-CCC
CC-D
Others(1)
Total
Secured loans at banks ¥ 100,927 ¥ 38,373 ¥ — ¥ 39,186 ¥ 178,486 Unsecured loans at banks 141,395 4,620 2 — 146,017 Short-term secured margin loans — — — 425,245 425,245 Secured inter-bank money market loans 7,249 — — — 7,249 Unsecured inter-bank money market loans 9,746 — — — 9,746 Secured corporate loans 249,046 117,255 1,141 2,298 369,740 Unsecured corporate loans 3,619 — — 3,755 7,374 Advances to affiliated companies 1,929 175 — — 2,104
Total ¥ 513,911 ¥ 160,423 ¥ 1,143 ¥ 470,484 ¥ 1,145,961
Millions of yen
September 30, 2015
AAA-BBB
BB-CCC
CC-D
Others(1)
Total
Secured loans at banks ¥ 121,873 ¥ 62,229 ¥ — ¥ 42,042 ¥ 226,144 Unsecured loans at banks 132,930 594 1 — 133,525 Short-term secured margin loans — — — 497,459 497,459 Secured inter-bank money market loans 4,324 — — — 4,324 Unsecured inter-bank money market loans 9,385 — — — 9,385 Secured corporate loans 246,148 189,551 — 2,314 438,013 Unsecured corporate loans 3,461 — — 5,519 8,980 Advances to affiliated companies 761 — — — 761
Total ¥ 518,882 ¥ 252,374 ¥ 1 ¥ 547,334 ¥ 1,318,591
(1) Relate to collateralized exposures where a specified ratio of LTV is maintained.
Nomura reviews internal ratings at least once a year by using available credit information of obligors including financial statements and other information. Internal ratings are also reviewed more frequently for high-risk obligors or problematic exposures and any significant credit event of obligors will trigger an immediate credit review process.
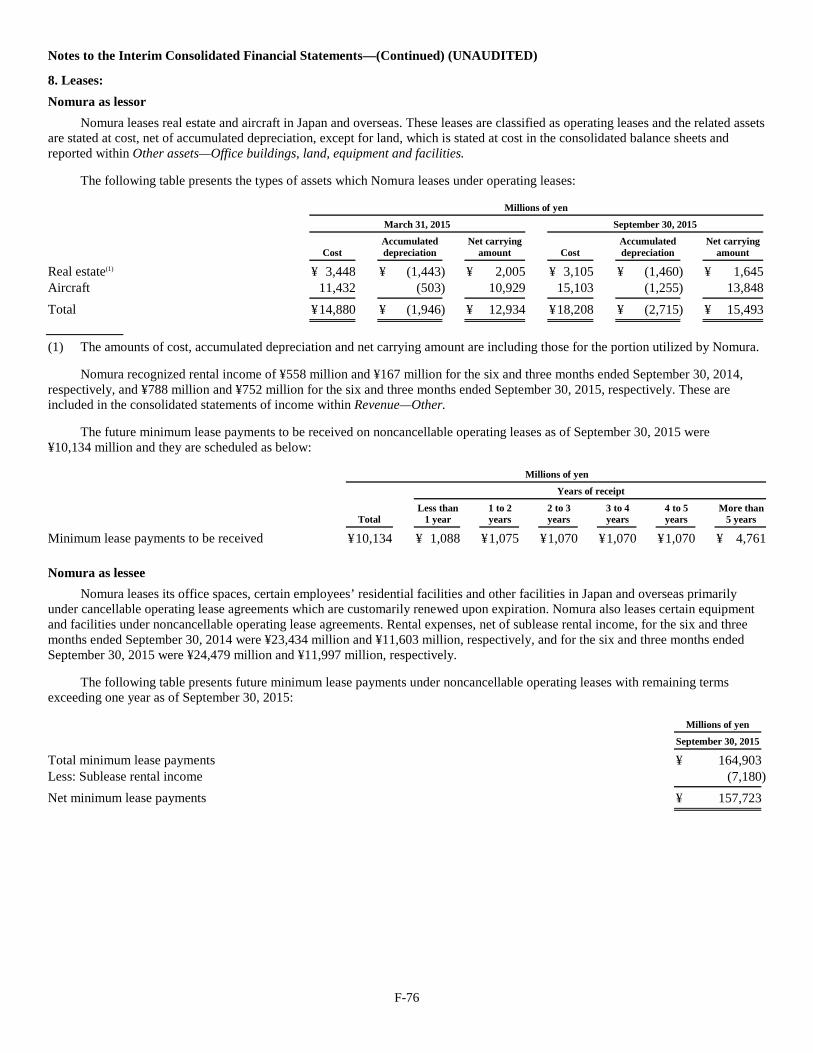
F-76
Notes to the Interim Consolidated Financial Statements—(Continued) (UNAUDITED)
8. Leases: Nomura as lessor
Nomura leases real estate and aircraft in Japan and overseas. These leases are classified as operating leases and the related assets are stated at cost, net of accumulated depreciation, except for land, which is stated at cost in the consolidated balance sheets and reported within Other assets—Office buildings, land, equipment and facilities.
The following table presents the types of assets which Nomura leases under operating leases:
Millions of yen
March 31, 2015
September 30, 2015
Cost
Accumulated depreciation
Net carrying amount
Cost
Accumulated depreciation
Net carrying amount
Real estate(1) ¥ 3,448 ¥ (1,443) ¥ 2,005 ¥ 3,105 ¥ (1,460) ¥ 1,645 Aircraft 11,432 (503) 10,929 15,103 (1,255) 13,848
Total ¥ 14,880 ¥ (1,946) ¥ 12,934 ¥ 18,208 ¥ (2,715) ¥ 15,493
(1) The amounts of cost, accumulated depreciation and net carrying amount are including those for the portion utilized by Nomura.
Nomura recognized rental income of ¥558 million and ¥167 million for the six and three months ended September 30, 2014, respectively, and ¥788 million and ¥752 million for the six and three months ended September 30, 2015, respectively. These are included in the consolidated statements of income within Revenue—Other.
The future minimum lease payments to be received on noncancellable operating leases as of September 30, 2015 were ¥10,134 million and they are scheduled as below:
Millions of yen
Years of receipt
Total
Less than 1 year
1 to 2 years
2 to 3 years
3 to 4 years
4 to 5 years
More than 5 years
Minimum lease payments to be received ¥ 10,134 ¥ 1,088 ¥ 1,075 ¥ 1,070 ¥ 1,070 ¥ 1,070 ¥ 4,761
Nomura as lessee Nomura leases its office spaces, certain employees’ residential facilities and other facilities in Japan and overseas primarily
under cancellable operating lease agreements which are customarily renewed upon expiration. Nomura also leases certain equipment and facilities under noncancellable operating lease agreements. Rental expenses, net of sublease rental income, for the six and three months ended September 30, 2014 were ¥23,434 million and ¥11,603 million, respectively, and for the six and three months ended September 30, 2015 were ¥24,479 million and ¥11,997 million, respectively.
The following table presents future minimum lease payments under noncancellable operating leases with remaining terms exceeding one year as of September 30, 2015:
Millions of yen
September 30, 2015
Total minimum lease payments ¥ 164,903 Less: Sublease rental income (7,180)
Net minimum lease payments ¥ 157,723
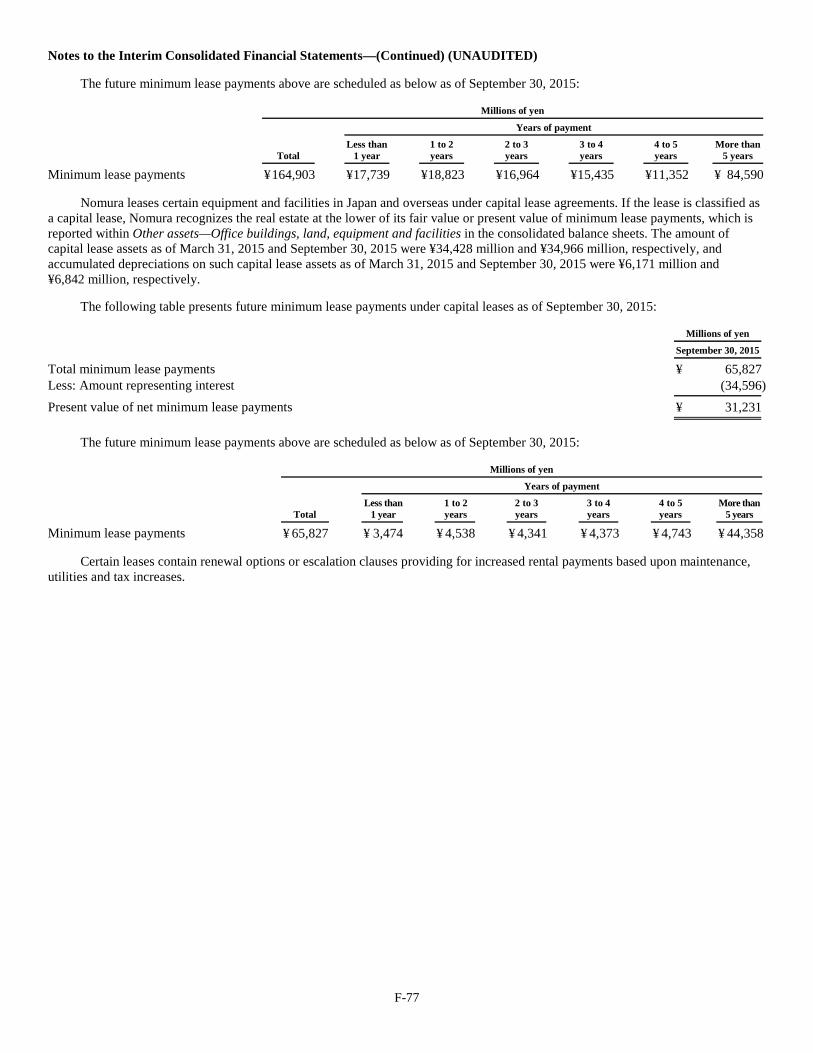
F-77
Notes to the Interim Consolidated Financial Statements—(Continued) (UNAUDITED)
The future minimum lease payments above are scheduled as below as of September 30, 2015:
Millions of yen
Years of payment
Total
Less than 1 year
1 to 2 years
2 to 3 years
3 to 4 years
4 to 5 years
More than 5 years
Minimum lease payments ¥ 164,903 ¥ 17,739 ¥ 18,823 ¥ 16,964 ¥ 15,435 ¥ 11,352 ¥ 84,590
Nomura leases certain equipment and facilities in Japan and overseas under capital lease agreements. If the lease is classified as a capital lease, Nomura recognizes the real estate at the lower of its fair value or present value of minimum lease payments, which is reported within Other assets—Office buildings, land, equipment and facilities in the consolidated balance sheets. The amount of capital lease assets as of March 31, 2015 and September 30, 2015 were ¥34,428 million and ¥34,966 million, respectively, and accumulated depreciations on such capital lease assets as of March 31, 2015 and September 30, 2015 were ¥6,171 million and ¥6,842 million, respectively.
The following table presents future minimum lease payments under capital leases as of September 30, 2015:
Millions of yen
September 30, 2015
Total minimum lease payments ¥ 65,827 Less: Amount representing interest (34,596)
Present value of net minimum lease payments ¥ 31,231
The future minimum lease payments above are scheduled as below as of September 30, 2015:
Millions of yen
Years of payment
Total
Less than 1 year
1 to 2 years
2 to 3 years
3 to 4 years
4 to 5 years
More than 5 years
Minimum lease payments ¥ 65,827 ¥ 3,474 ¥ 4,538 ¥ 4,341 ¥ 4,373 ¥ 4,743 ¥ 44,358
Certain leases contain renewal options or escalation clauses providing for increased rental payments based upon maintenance, utilities and tax increases.
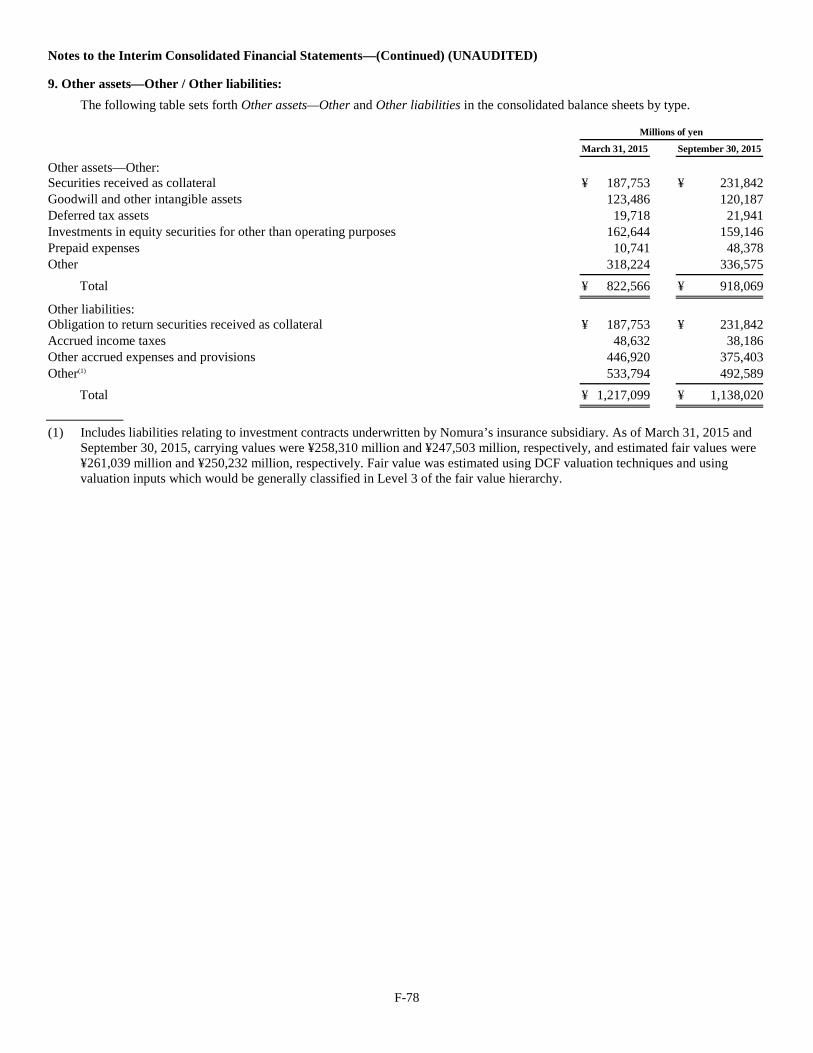
F-78
Notes to the Interim Consolidated Financial Statements—(Continued) (UNAUDITED)
9. Other assets—Other / Other liabilities: The following table sets forth Other assets—Other and Other liabilities in the consolidated balance sheets by type.
Millions of yen
March 31, 2015
September 30, 2015
Other assets—Other:
Securities received as collateral ¥ 187,753 ¥ 231,842 Goodwill and other intangible assets 123,486 120,187 Deferred tax assets 19,718 21,941 Investments in equity securities for other than operating purposes 162,644 159,146 Prepaid expenses 10,741 48,378 Other 318,224 336,575
Total ¥ 822,566 ¥ 918,069
Other liabilities:
Obligation to return securities received as collateral ¥ 187,753 ¥ 231,842 Accrued income taxes 48,632 38,186 Other accrued expenses and provisions 446,920 375,403 Other(1) 533,794 492,589
Total ¥ 1,217,099 ¥ 1,138,020
(1) Includes liabilities relating to investment contracts underwritten by Nomura’s insurance subsidiary. As of March 31, 2015 and
September 30, 2015, carrying values were ¥258,310 million and ¥247,503 million, respectively, and estimated fair values were ¥261,039 million and ¥250,232 million, respectively. Fair value was estimated using DCF valuation techniques and using valuation inputs which would be generally classified in Level 3 of the fair value hierarchy.
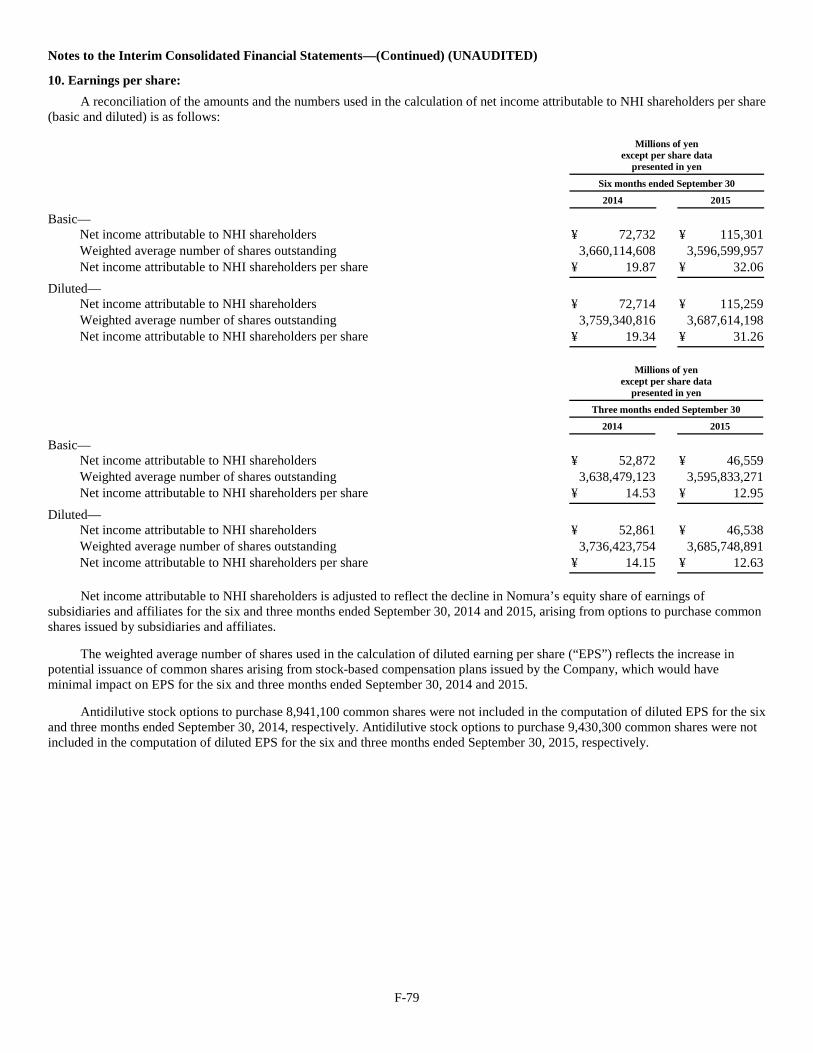
F-79
Notes to the Interim Consolidated Financial Statements—(Continued) (UNAUDITED)
10. Earnings per share: A reconciliation of the amounts and the numbers used in the calculation of net income attributable to NHI shareholders per share
(basic and diluted) is as follows:
Millions of yen except per share data
presented in yen
Six months ended September 30
2014
2015
Basic—
Net income attributable to NHI shareholders ¥ 72,732 ¥ 115,301 Weighted average number of shares outstanding 3,660,114,608 3,596,599,957 Net income attributable to NHI shareholders per share ¥ 19.87 ¥ 32.06
Diluted—
Net income attributable to NHI shareholders ¥ 72,714 ¥ 115,259 Weighted average number of shares outstanding 3,759,340,816 3,687,614,198 Net income attributable to NHI shareholders per share ¥ 19.34 ¥ 31.26
Millions of yen except per share data
presented in yen
Three months ended September 30
2014
2015
Basic—
Net income attributable to NHI shareholders ¥ 52,872 ¥ 46,559 Weighted average number of shares outstanding 3,638,479,123 3,595,833,271 Net income attributable to NHI shareholders per share ¥ 14.53 ¥ 12.95
Diluted—
Net income attributable to NHI shareholders ¥ 52,861 ¥ 46,538 Weighted average number of shares outstanding 3,736,423,754 3,685,748,891 Net income attributable to NHI shareholders per share ¥ 14.15 ¥ 12.63
Net income attributable to NHI shareholders is adjusted to reflect the decline in Nomura’s equity share of earnings of subsidiaries and affiliates for the six and three months ended September 30, 2014 and 2015, arising from options to purchase common shares issued by subsidiaries and affiliates.
The weighted average number of shares used in the calculation of diluted earning per share (“EPS”) reflects the increase in potential issuance of common shares arising from stock-based compensation plans issued by the Company, which would have minimal impact on EPS for the six and three months ended September 30, 2014 and 2015.
Antidilutive stock options to purchase 8,941,100 common shares were not included in the computation of diluted EPS for the six and three months ended September 30, 2014, respectively. Antidilutive stock options to purchase 9,430,300 common shares were not included in the computation of diluted EPS for the six and three months ended September 30, 2015, respectively.
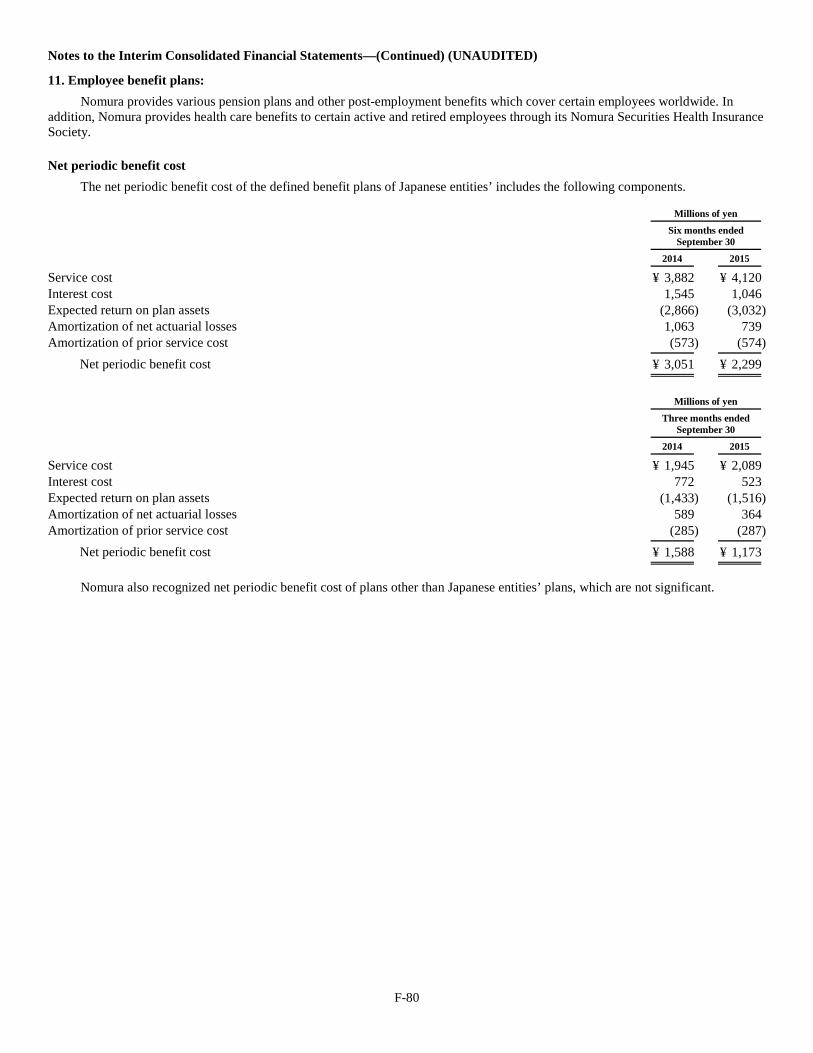
F-80
Notes to the Interim Consolidated Financial Statements—(Continued) (UNAUDITED)
11. Employee benefit plans: Nomura provides various pension plans and other post-employment benefits which cover certain employees worldwide. In
addition, Nomura provides health care benefits to certain active and retired employees through its Nomura Securities Health Insurance Society.
Net periodic benefit cost The net periodic benefit cost of the defined benefit plans of Japanese entities’ includes the following components.
Millions of yen
Six months ended September 30
2014
2015
Service cost ¥ 3,882 ¥ 4,120 Interest cost 1,545 1,046 Expected return on plan assets (2,866) (3,032) Amortization of net actuarial losses 1,063 739 Amortization of prior service cost (573) (574)
Net periodic benefit cost ¥ 3,051 ¥ 2,299
Millions of yen
Three months ended September 30
2014
2015
Service cost ¥ 1,945 ¥ 2,089 Interest cost 772 523 Expected return on plan assets (1,433) (1,516) Amortization of net actuarial losses 589 364 Amortization of prior service cost (285) (287)
Net periodic benefit cost ¥ 1,588 ¥ 1,173
Nomura also recognized net periodic benefit cost of plans other than Japanese entities’ plans, which are not significant.
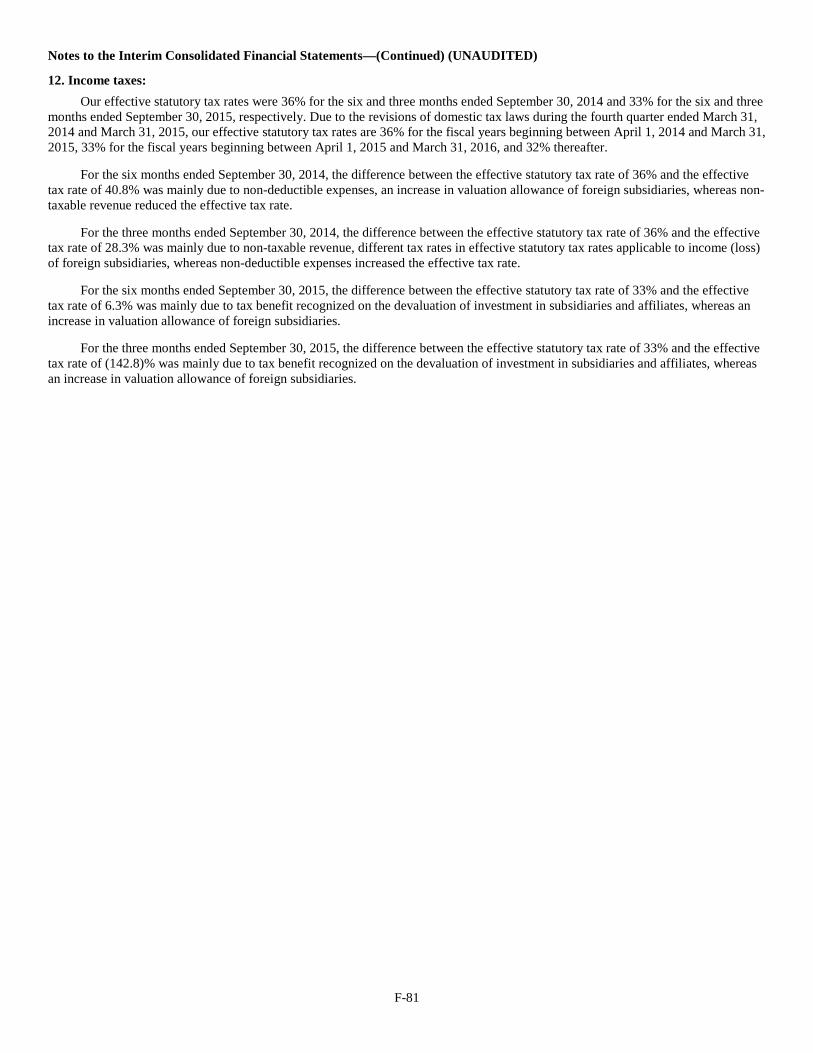
F-81
Notes to the Interim Consolidated Financial Statements—(Continued) (UNAUDITED)
12. Income taxes: Our effective statutory tax rates were 36% for the six and three months ended September 30, 2014 and 33% for the six and three
months ended September 30, 2015, respectively. Due to the revisions of domestic tax laws during the fourth quarter ended March 31, 2014 and March 31, 2015, our effective statutory tax rates are 36% for the fiscal years beginning between April 1, 2014 and March 31, 2015, 33% for the fiscal years beginning between April 1, 2015 and March 31, 2016, and 32% thereafter.
For the six months ended September 30, 2014, the difference between the effective statutory tax rate of 36% and the effective tax rate of 40.8% was mainly due to non-deductible expenses, an increase in valuation allowance of foreign subsidiaries, whereas non-taxable revenue reduced the effective tax rate.
For the three months ended September 30, 2014, the difference between the effective statutory tax rate of 36% and the effective tax rate of 28.3% was mainly due to non-taxable revenue, different tax rates in effective statutory tax rates applicable to income (loss) of foreign subsidiaries, whereas non-deductible expenses increased the effective tax rate.
For the six months ended September 30, 2015, the difference between the effective statutory tax rate of 33% and the effective tax rate of 6.3% was mainly due to tax benefit recognized on the devaluation of investment in subsidiaries and affiliates, whereas an increase in valuation allowance of foreign subsidiaries.
For the three months ended September 30, 2015, the difference between the effective statutory tax rate of 33% and the effective tax rate of (142.8)% was mainly due to tax benefit recognized on the devaluation of investment in subsidiaries and affiliates, whereas an increase in valuation allowance of foreign subsidiaries.
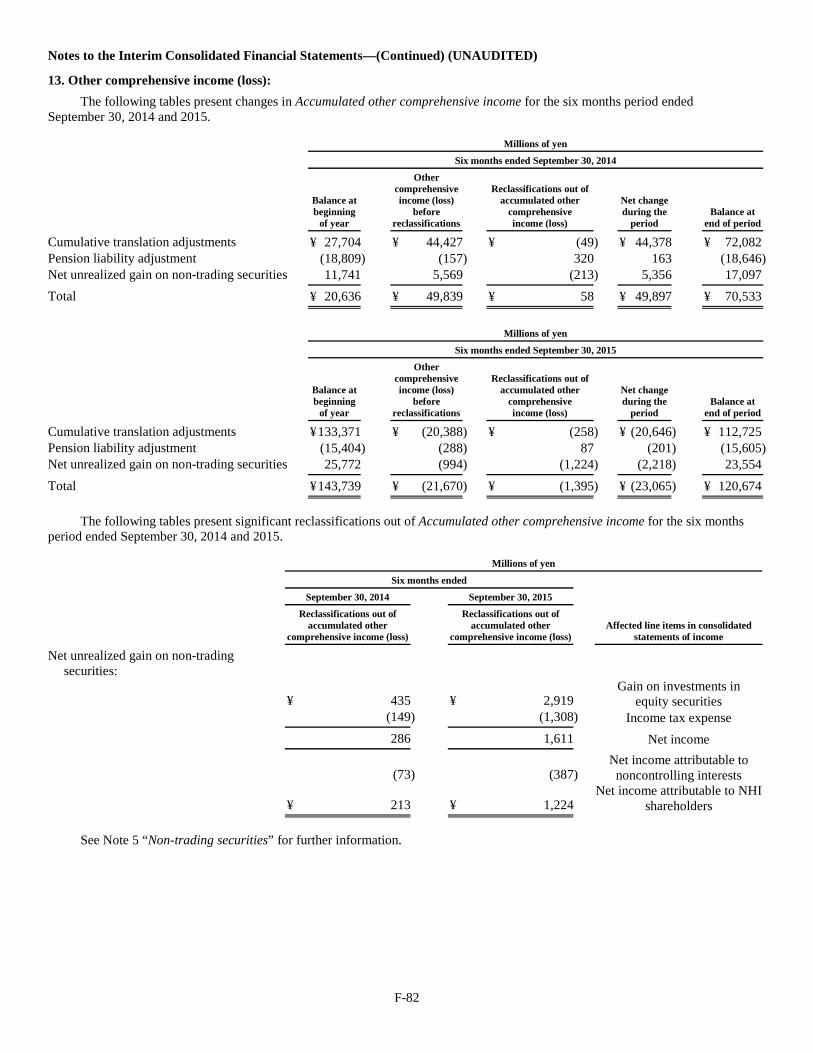
F-82
Notes to the Interim Consolidated Financial Statements—(Continued) (UNAUDITED)
13. Other comprehensive income (loss): The following tables present changes in Accumulated other comprehensive income for the six months period ended
September 30, 2014 and 2015.
Millions of yen
Six months ended September 30, 2014
Balance at beginning
of year
Other comprehensive income (loss)
before reclassifications
Reclassifications out of accumulated other
comprehensive income (loss)
Net change during the
period
Balance at end of period
Cumulative translation adjustments ¥ 27,704 ¥ 44,427 ¥ (49) ¥ 44,378 ¥ 72,082 Pension liability adjustment (18,809) (157) 320 163 (18,646) Net unrealized gain on non-trading securities 11,741 5,569 (213) 5,356 17,097
Total ¥ 20,636 ¥ 49,839 ¥ 58 ¥ 49,897 ¥ 70,533
Millions of yen
Six months ended September 30, 2015
Balance at beginning
of year
Other comprehensive income (loss)
before reclassifications
Reclassifications out of accumulated other
comprehensive income (loss)
Net change during the
period
Balance at end of period
Cumulative translation adjustments ¥ 133,371 ¥ (20,388) ¥ (258) ¥ (20,646) ¥ 112,725 Pension liability adjustment (15,404) (288) 87 (201) (15,605) Net unrealized gain on non-trading securities 25,772 (994) (1,224) (2,218) 23,554
Total ¥ 143,739 ¥ (21,670) ¥ (1,395) ¥ (23,065) ¥ 120,674
The following tables present significant reclassifications out of Accumulated other comprehensive income for the six months period ended September 30, 2014 and 2015.
Millions of yen
Six months ended
Affected line items in consolidated statements of income
September 30, 2014
September 30, 2015
Reclassifications out of accumulated other
comprehensive income (loss)
Reclassifications out of accumulated other
comprehensive income (loss)
Net unrealized gain on non-trading securities:
¥ 435 ¥ 2,919 Gain on investments in
equity securities
(149) (1,308) Income tax expense
286 1,611 Net income
(73) (387) Net income attributable to
noncontrolling interests
¥ 213 ¥ 1,224 Net income attributable to NHI
shareholders
See Note 5 “Non-trading securities” for further information.
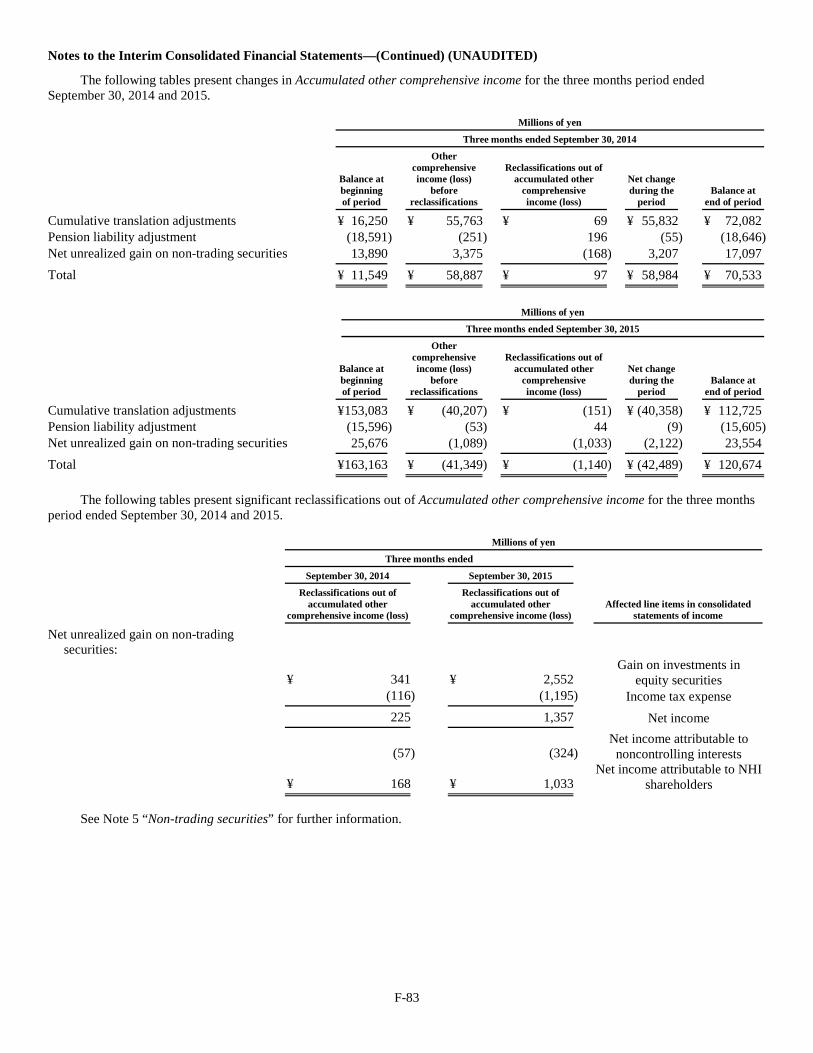
F-83
Notes to the Interim Consolidated Financial Statements—(Continued) (UNAUDITED)
The following tables present changes in Accumulated other comprehensive income for the three months period ended September 30, 2014 and 2015.
Millions of yen
Three months ended September 30, 2014
Balance at beginning of period
Other comprehensive income (loss)
before reclassifications
Reclassifications out of accumulated other
comprehensive income (loss)
Net change during the
period
Balance at end of period
Cumulative translation adjustments ¥ 16,250 ¥ 55,763 ¥ 69 ¥ 55,832 ¥ 72,082 Pension liability adjustment (18,591) (251) 196 (55) (18,646) Net unrealized gain on non-trading securities 13,890 3,375 (168) 3,207 17,097
Total ¥ 11,549 ¥ 58,887 ¥ 97 ¥ 58,984 ¥ 70,533
Millions of yen
Three months ended September 30, 2015
Balance at beginning of period
Other comprehensive income (loss)
before reclassifications
Reclassifications out of accumulated other
comprehensive income (loss)
Net change during the
period
Balance at end of period
Cumulative translation adjustments ¥ 153,083 ¥ (40,207) ¥ (151) ¥ (40,358) ¥ 112,725 Pension liability adjustment (15,596) (53) 44 (9) (15,605) Net unrealized gain on non-trading securities 25,676 (1,089) (1,033) (2,122) 23,554
Total ¥ 163,163 ¥ (41,349) ¥ (1,140) ¥ (42,489) ¥ 120,674
The following tables present significant reclassifications out of Accumulated other comprehensive income for the three months period ended September 30, 2014 and 2015.
Millions of yen
Three months ended
Affected line items in consolidated statements of income
September 30, 2014
September 30, 2015
Reclassifications out of accumulated other
comprehensive income (loss)
Reclassifications out of accumulated other
comprehensive income (loss)
Net unrealized gain on non-trading securities:
¥ 341 ¥ 2,552 Gain on investments in
equity securities
(116) (1,195) Income tax expense
225 1,357 Net income
(57) (324) Net income attributable to
noncontrolling interests
¥ 168 ¥ 1,033 Net income attributable to NHI
shareholders
See Note 5 “Non-trading securities” for further information.
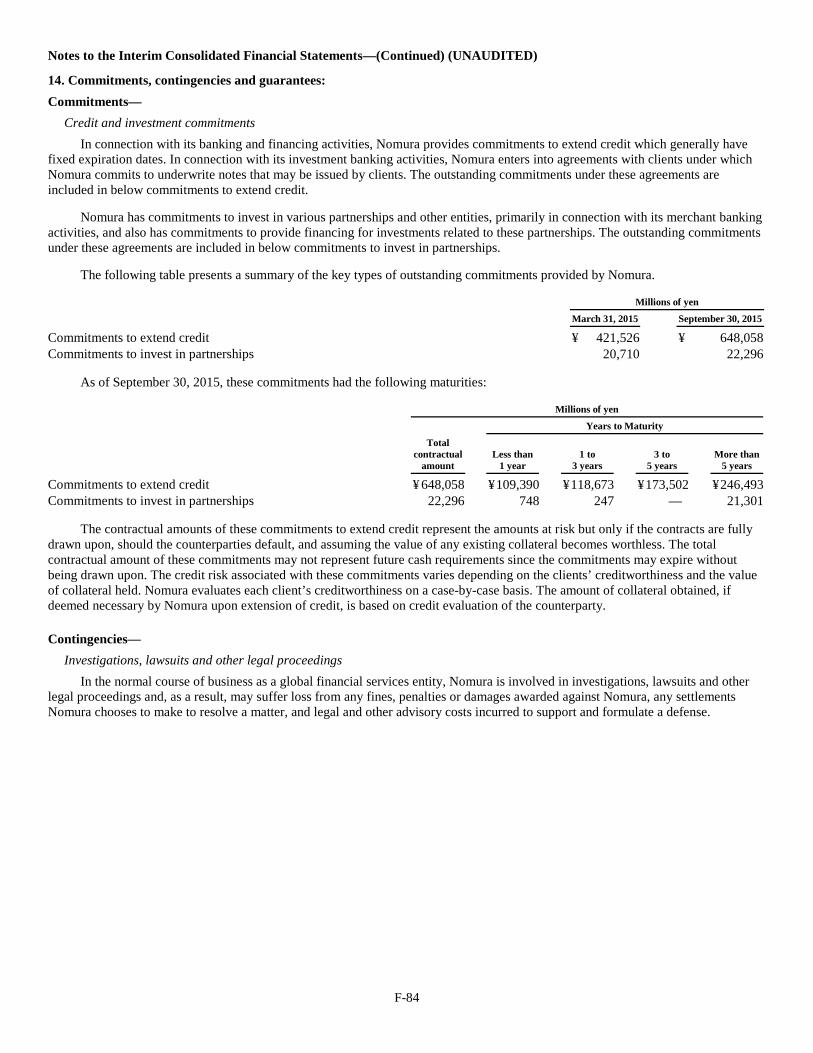
F-84
Notes to the Interim Consolidated Financial Statements—(Continued) (UNAUDITED)
14. Commitments, contingencies and guarantees: Commitments—
Credit and investment commitments In connection with its banking and financing activities, Nomura provides commitments to extend credit which generally have
fixed expiration dates. In connection with its investment banking activities, Nomura enters into agreements with clients under which Nomura commits to underwrite notes that may be issued by clients. The outstanding commitments under these agreements are included in below commitments to extend credit.
Nomura has commitments to invest in various partnerships and other entities, primarily in connection with its merchant banking activities, and also has commitments to provide financing for investments related to these partnerships. The outstanding commitments under these agreements are included in below commitments to invest in partnerships.
The following table presents a summary of the key types of outstanding commitments provided by Nomura.
Millions of yen
March 31, 2015
September 30, 2015
Commitments to extend credit ¥ 421,526 ¥ 648,058 Commitments to invest in partnerships 20,710 22,296
As of September 30, 2015, these commitments had the following maturities:
Millions of yen
Years to Maturity
Total contractual
amount
Less than 1 year
1 to 3 years
3 to 5 years
More than 5 years
Commitments to extend credit ¥ 648,058 ¥ 109,390 ¥ 118,673 ¥ 173,502 ¥ 246,493 Commitments to invest in partnerships 22,296 748 247 — 21,301
The contractual amounts of these commitments to extend credit represent the amounts at risk but only if the contracts are fully drawn upon, should the counterparties default, and assuming the value of any existing collateral becomes worthless. The total contractual amount of these commitments may not represent future cash requirements since the commitments may expire without being drawn upon. The credit risk associated with these commitments varies depending on the clients’ creditworthiness and the value of collateral held. Nomura evaluates each client’s creditworthiness on a case-by-case basis. The amount of collateral obtained, if deemed necessary by Nomura upon extension of credit, is based on credit evaluation of the counterparty.
Contingencies— Investigations, lawsuits and other legal proceedings
In the normal course of business as a global financial services entity, Nomura is involved in investigations, lawsuits and other legal proceedings and, as a result, may suffer loss from any fines, penalties or damages awarded against Nomura, any settlements Nomura chooses to make to resolve a matter, and legal and other advisory costs incurred to support and formulate a defense.
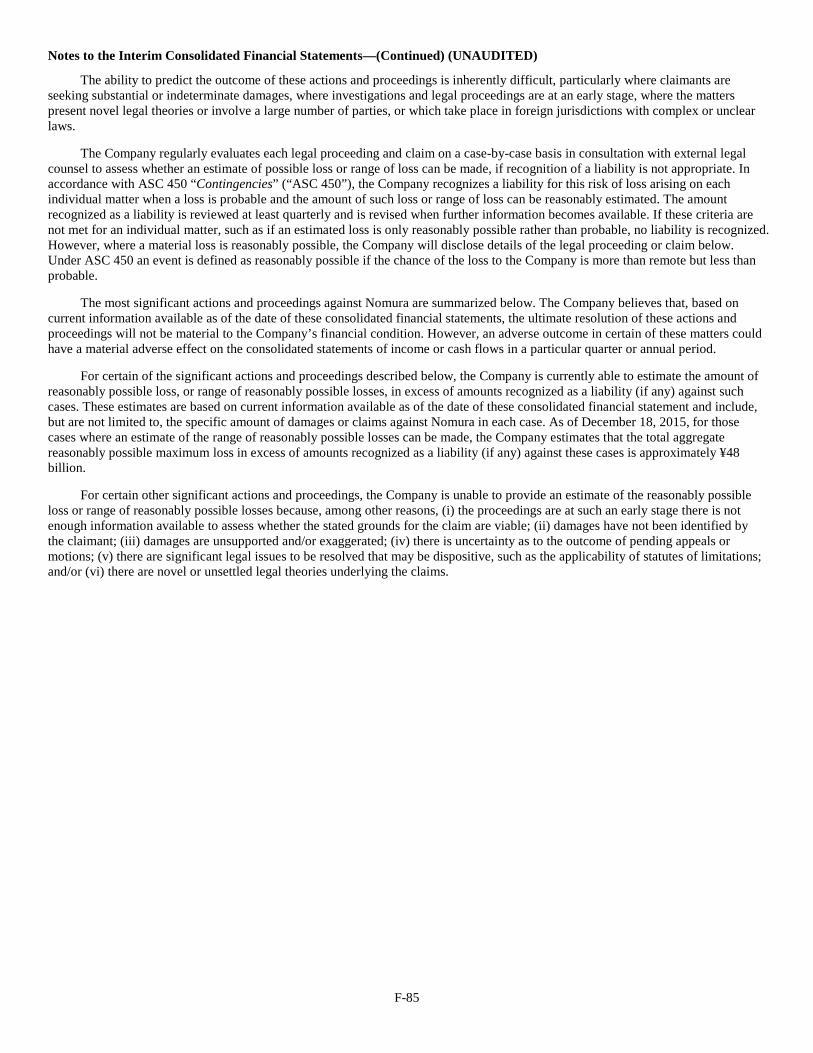
F-85
Notes to the Interim Consolidated Financial Statements—(Continued) (UNAUDITED)
The ability to predict the outcome of these actions and proceedings is inherently difficult, particularly where claimants are seeking substantial or indeterminate damages, where investigations and legal proceedings are at an early stage, where the matters present novel legal theories or involve a large number of parties, or which take place in foreign jurisdictions with complex or unclear laws.
The Company regularly evaluates each legal proceeding and claim on a case-by-case basis in consultation with external legal counsel to assess whether an estimate of possible loss or range of loss can be made, if recognition of a liability is not appropriate. In accordance with ASC 450 “Contingencies” (“ASC 450”), the Company recognizes a liability for this risk of loss arising on each individual matter when a loss is probable and the amount of such loss or range of loss can be reasonably estimated. The amount recognized as a liability is reviewed at least quarterly and is revised when further information becomes available. If these criteria are not met for an individual matter, such as if an estimated loss is only reasonably possible rather than probable, no liability is recognized. However, where a material loss is reasonably possible, the Company will disclose details of the legal proceeding or claim below. Under ASC 450 an event is defined as reasonably possible if the chance of the loss to the Company is more than remote but less than probable.
The most significant actions and proceedings against Nomura are summarized below. The Company believes that, based on current information available as of the date of these consolidated financial statements, the ultimate resolution of these actions and proceedings will not be material to the Company’s financial condition. However, an adverse outcome in certain of these matters could have a material adverse effect on the consolidated statements of income or cash flows in a particular quarter or annual period.
For certain of the significant actions and proceedings described below, the Company is currently able to estimate the amount of reasonably possible loss, or range of reasonably possible losses, in excess of amounts recognized as a liability (if any) against such cases. These estimates are based on current information available as of the date of these consolidated financial statement and include, but are not limited to, the specific amount of damages or claims against Nomura in each case. As of December 18, 2015, for those cases where an estimate of the range of reasonably possible losses can be made, the Company estimates that the total aggregate reasonably possible maximum loss in excess of amounts recognized as a liability (if any) against these cases is approximately ¥48 billion.
For certain other significant actions and proceedings, the Company is unable to provide an estimate of the reasonably possible loss or range of reasonably possible losses because, among other reasons, (i) the proceedings are at such an early stage there is not enough information available to assess whether the stated grounds for the claim are viable; (ii) damages have not been identified by the claimant; (iii) damages are unsupported and/or exaggerated; (iv) there is uncertainty as to the outcome of pending appeals or motions; (v) there are significant legal issues to be resolved that may be dispositive, such as the applicability of statutes of limitations; and/or (vi) there are novel or unsettled legal theories underlying the claims.
F-86
Notes to the Interim Consolidated Financial Statements—(Continued) (UNAUDITED)
In January 2008, Nomura International plc (“NIP”) was served with a tax notice issued by the tax authorities in Pescara, Italy alleging breaches by NIP of the U.K.-Italy Double Taxation Treaty of 1998 (“Tax Notice”). The alleged breaches relate to payments to NIP of tax credits on dividends on Italian shares. The Tax Notice not only denies certain payments to which NIP claims to be entitled but also seeks reimbursement of approximately EUR 33.8 million, plus interest, already refunded. NIP continues vigorously to challenge the Pescara Tax Court’s decisions in favor of the local tax authorities.
In October 2010 and June 2012, two actions were brought against NIP, seeking recovery of payments allegedly made to NIP by Fairfield Sentry Ltd. and Fairfield Sigma Ltd. (collectively, “Fairfield Funds”), which are now in liquidation and were feeder funds to Bernard L. Madoff Investment Securities LLC (in liquidation pursuant to the Securities Investor Protection Act in the U.S. since December 2008) (“BLMIS”). The first suit was brought by the liquidators of the Fairfield Funds. It was filed on October 5, 2010 in the Supreme Court of the State of New York, but was subsequently removed to the U.S. Bankruptcy Court, where it is presently pending. The second suit was brought by the Trustee for the liquidation of BLMIS (“Madoff Trustee”). NIP was added as a defendant in June 2012 when the Madoff Trustee filed an amended complaint in the U.S. Bankruptcy Court. Both actions seek to recover approximately $35 million.
In March 2011, PT Bank Mutiara Tbk. (“Bank Mutiara”) commenced proceedings in the Commercial Court of the Canton of Zurich (“Zurich Commercial Court”) against a special purpose entity (“SPE”) established at the request of NIP. The proceedings were to challenge the SPE’s rights over approximately $156 million in an account held in Switzerland. The SPE, which is consolidated by NIP, had a security interest over the money pursuant to a loan facility with Telltop Holdings Limited (“Telltop”), a third party company. Telltop is currently in liquidation. The SPE did not believe that Bank Mutiara had any enforceable security interest over the funds and sought release of the monies. NIP was notified on October 2, 2014 that the Zurich Commercial Court had found that the SPE alone is entitled to the funds. Bank Mutiara appealed this decision. On July 9, 2015 the Federal Supreme Court of Switzerland upheld the decision of the Zurich Commercial Court. Bank Mutiara has no further right of appeal so the funds have been released to the SPE.
In April 2011, the Federal Home Loan Bank of Boston (“FHLB-Boston”) commenced proceedings in the Superior Court of Massachusetts against numerous issuers, sponsors and underwriters of residential mortgage-backed securities (“RMBS”), and their controlling persons, including Nomura Asset Acceptance Corporation (“NAAC”), Nomura Credit & Capital, Inc. (“NCCI”), Nomura Securities International, Inc. (“NSI”) and Nomura Holding America Inc. (“NHA”). The action alleges that FHLB-Boston purchased RMBS issued by NAAC for which the offering materials contained untrue statements or omitted material facts concerning the underwriting standards used by the original lenders and the characteristics of the loans underlying the securities. FHLB-Boston seeks rescission of its purchases or compensatory damages pursuant to state law. FHLB-Boston alleges that it purchased certificates in four offerings issued by NAAC in the original principal amount of approximately $406 million. The case is currently in the discovery phase.
In July 2011, the National Credit Union Administration Board (“NCUA”) commenced proceedings in the United States District Court for the Central District of California as liquidating agent of Western Corporate Federal Credit Union (“WesCorp”) against various issuers, sponsors and underwriters of RMBS purchased by WesCorp. The complaint alleges that WesCorp purchased RMBS issued by NAAC and Nomura Home Equity Loan Inc. (“NHEL”), among others, for which the offering materials contained untrue statements or omitted material facts concerning the underwriting standards used by the original lenders. The complaint alleges that WesCorp purchased certificates in two offerings in the original principal amount of approximately $83 million and seeks rescission of its purchases or compensatory damages. The Court has dismissed NCUA’s claims against NHEL and NCUA has appealed to the Ninth Circuit and the appeal is pending. NCUA’s claim against NAAC is proceeding and is currently in the expert discovery phase.
F-87
Notes to the Interim Consolidated Financial Statements—(Continued) (UNAUDITED)
In September 2011, the Federal Housing Finance Agency (“FHFA”), as conservator for the government sponsored enterprises, Federal National Mortgage Association and Federal Home Loan Mortgage Corporation (“GSEs”), commenced proceedings in the United States District Court for the Southern District of New York against numerous issuers, sponsors and underwriters of RMBS, and their controlling persons, including NAAC, NHEL, NCCI, NSI and NHA, (the Company’s U.S. subsidiaries). The action alleged that the GSEs purchased RMBS issued by NAAC and NHEL for which the offering materials contained untrue statements or omitted material facts concerning the underwriting standards used by the original lenders and the characteristics of the loans underlying the securities. FHFA alleged that the GSEs purchased certificates in seven offerings in the original principal amount of approximately $2,046 million and sought rescission of its purchases. The case was tried before the Court beginning March 16, 2015 and closing arguments were completed on April 9, 2015. On May 15, 2015, the Court issued a judgment and ordered the defendants to pay $806 million to GSEs upon GSEs’ delivery of the certificates at issue to the defendants. The Company’s U.S. subsidiaries have appealed the decision to the United States Court of Appeals for the Second Circuit. Subject to the outcome of the appeal, the defendants agreed to a consent judgment for costs and attorneys’ fees recoverable under the blue sky statutes at issue in the maximum amount of $33 million.
In October 2011, the NCUA commenced proceedings in the United States District Court for the District of Kansas as liquidating agent of U.S. Central Federal Credit Union (“U.S. Central”) against various issuers, sponsors and underwriters of RMBS purchased by U.S. Central, including NHEL. The complaint alleges that U.S. Central purchased RMBS issued by NHEL, among others, for which the offering materials contained untrue statements or omitted material facts concerning the underwriting standards used by the original lenders. The complaint alleges that U.S. Central purchased a certificate in one offering in the original principal amount of approximately $50 million and seeks rescission of its purchase or compensatory damages. The Court denied, in part, motions to dismiss filed by the defendants, and the Tenth Circuit Court of Appeals affirmed the trial court’s holding; the Supreme Court vacated that decision and remanded the matter to the Tenth Circuit Court of Appeals for reconsideration in light of recent Supreme Court authority. Upon remand, the Tenth Circuit reinstated its decision, and the parties are involved in the expert discovery process.
In November 2011, NIP was served with a claim filed by the Madoff Trustee appointed for the liquidation of BLMIS in the United States Bankruptcy Court Southern District of New York. This is a clawback action similar to claims filed by the Madoff Trustee against numerous other institutions. The Madoff Trustee alleges that NIP received redemptions from the BLMIS feeder fund, Harley International (Cayman) Limited in the six years prior to December 11, 2008 (the date proceedings were commenced against BLMIS) and that these are avoidable and recoverable under the U.S. Bankruptcy Code and New York law. The amount that the Madoff Trustee is currently seeking to recover from NIP is approximately $21 million.
In August 2012, The Prudential Insurance Company of America and certain of its affiliates filed several complaints in the Superior Court of New Jersey, which was removed to federal court, against various issuers, sponsors and underwriters of RMBS, including an action against NHEL, NCCI and NSI. The complaint alleged that the plaintiffs purchased over $183 million in RMBS from five different offerings, the offering materials for which contained fraudulent misrepresentations regarding the underwriting practices and quality of the loans underlying the securities. On August 11, 2015, the parties entered into a confidential settlement and the action has been dismissed with prejudice.
F-88
Notes to the Interim Consolidated Financial Statements—(Continued) (UNAUDITED)
In March 2013, Banca Monte dei Paschi di Siena SpA (“MPS”) issued a claim in the Italian Courts against (1) two former directors of MPS and (2) NIP. MPS alleged that the former directors improperly caused MPS to enter into certain structured financial transactions with NIP in 2009 (“Transactions”) and that NIP acted fraudulently and was jointly liable for the unlawful conduct of MPS’s former directors. MPS claimed damages of not less than EUR 1.142 billion. In July 2013 a claim was also issued against the same former directors of MPS, and NIP, by the shareholder group Fondazione Monte dei Paschi di Siena (“FMPS”). The grounds of the FMPS claim are similar to those on which the MPS claim was founded. The level of damages sought by FMPS is not less than EUR 315.2 million. NIP filed and served Defences to both the MPS and the FMPS claims.
In April 2013, an investigation was commenced by the Public Prosecutor’s office in Siena, Italy, into various allegations against MPS and certain of its former directors, including in relation to the Transactions. The investigation was subsequently transferred to the Public Prosecutor of Milan. On April 3, 2015, the Public Prosecutor’s office in Milan issued a notice concluding its preliminary investigation. The Public Prosecutor is seeking to indict MPS, three individuals from MPS’s former management, NIP and two NIP individuals for the offences of false accounting and market manipulation in relation to MPS’s accounts for 2009. The preliminary hearing at which the court will consider whether or not to grant the indictment started on October 12, 2015.
Additionally, NIP commenced a claim against MPS in the English Courts in March 2013. The claim was for declaratory relief confirming that the Transactions remained valid and contractually binding. MPS filed and served its Defence and Counterclaim to these proceedings in March 2014. MPS alleged in its Counterclaim that NIP was liable to make restitution of a net amount of approximately EUR 1.5 billion, and sought declarations regarding the illegality and invalidity of the Transactions. NIP filed and served its Reply and Defence to Counterclaim in June 2014.
On September 23, 2015, NIP entered into a settlement agreement with MPS to terminate the Transactions. NIP believes that the Transactions were conducted legally and appropriately, and does not accept the allegations made against it or admit any wrongdoing. Taking into account the views of relevant European financial authorities and the advice provided by external experts, NIP considered it to be in its best interests to reach a settlement in relation to this matter. As part of the agreement, the Transactions were unwound at a discount of EUR 440 million in favour of MPS and the civil proceedings between MPS and NIP in Italy and England, respectively, will no longer be pursued. The financial impact of the settlement on the Company’s consolidated results for the fiscal year ending March 31, 2016 is a loss of approximately ¥35.0 billion and has been included in Net gain on trading in the consolidated statement of income for the six months ended September 30, 2015. The civil proceedings by FMPS and criminal proceedings in Milan remain pending. NIP will continue to vigorously defend its position in the ongoing proceedings.
F-89
Notes to the Interim Consolidated Financial Statements—(Continued) (UNAUDITED)
Nomura Securities Co., Ltd. (“NSC”) is the leading securities firm in Japan with approximately 5.37 million client accounts. Accordingly, with a significant number of client transactions, NSC is from time to time party to various Japanese civil litigation and other dispute resolution proceedings with clients relating to investment losses. These include an action commenced against NSC in April 2012 by a corporate client seeking ¥5,102 million in damages for losses on the pre-maturity cash out of 16 series of currency-linked structured notes purchased from NSC between 2003 and 2008, an action commenced in April 2013 by a corporate client seeking ¥10,247 million in damages for losses on currency derivative transactions and the pre-maturity cash out or redemption of 11 series of equity-linked structured notes purchased from NSC between 2005 and 2011, and an action commenced in October 2014 by a corporate client seeking ¥2,143 million in damages for losses on currency derivative transactions conducted between 2006 and 2012. Although the allegations of the clients involved in such actions include the allegation that NSC’s explanation was insufficient at the time the contracts were entered into, NSC believes these allegations are without merit.
The Company supports the position of its subsidiaries in each of these claims.
Other mortgage-related contingencies in the U.S. Certain of the Company’s subsidiaries in the U.S. securitized residential mortgage loans in the form of RMBS. These
subsidiaries did not generally originate mortgage loans, but purchased mortgage loans from third-party loan originators (“originators”). In connection with such purchases, these subsidiaries received loan level representations from the originators. In connection with the securitizations, the relevant subsidiaries provided loan level representations and warranties of the type generally described below, which mirror the representations the subsidiaries received from the originators.
The loan level representations made in connection with the securitization of mortgage loans were generally detailed representations applicable to each loan and addressed characteristics of the borrowers and properties. The representations included, but were not limited to, information concerning the borrower’s credit status, the loan-to-value ratio, the owner occupancy status of the property, the lien position, the fact that the loan was originated in accordance with the originator’s guidelines, and the fact that the loan was originated in compliance with applicable laws. Certain of the RMBS issued by the subsidiaries were structured with credit protection provided to specified classes of certificates by monoline insurers.
The relevant subsidiaries have received claims demanding the repurchase of certain loans from trustees of various securitization trusts, made at the instance of one or more investors, or from certificate insurers. The total original principal amount of loans for which repurchase claims were received by the relevant subsidiaries within six-years of each securitization is $3,203 million. The relevant subsidiaries summarily rejected any demand for repurchase received after the expiration of the statute of limitations applicable to breach of representation claims. For those claims received within six years, the relevant subsidiaries reviewed each claim received, and rejected those claims believed to be without merit or agreed to repurchase certain loans for those claims that the relevant subsidiaries determined to have merit. In several instances, following the rejection of repurchase demands, investors instituted actions through the trustee alleging breach of contract. The breach of contract claims that were brought within the six-year statute of limitations for breach of contract actions have survived motions to dismiss and are at early stages. These claims involve substantial legal, as well as factual, uncertainty and the Company cannot provide an estimate of reasonably possible loss at this time, in excess of the existing reserve.
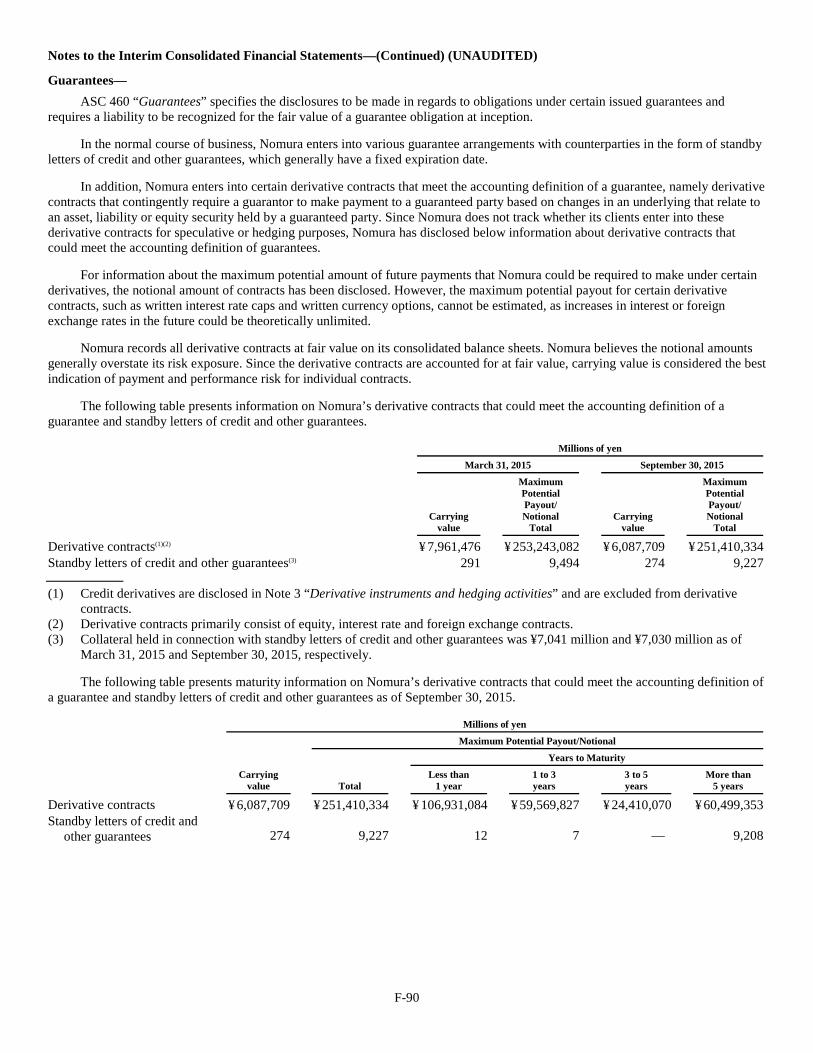
F-90
Notes to the Interim Consolidated Financial Statements—(Continued) (UNAUDITED)
Guarantees— ASC 460 “Guarantees” specifies the disclosures to be made in regards to obligations under certain issued guarantees and
requires a liability to be recognized for the fair value of a guarantee obligation at inception.
In the normal course of business, Nomura enters into various guarantee arrangements with counterparties in the form of standby letters of credit and other guarantees, which generally have a fixed expiration date.
In addition, Nomura enters into certain derivative contracts that meet the accounting definition of a guarantee, namely derivative contracts that contingently require a guarantor to make payment to a guaranteed party based on changes in an underlying that relate to an asset, liability or equity security held by a guaranteed party. Since Nomura does not track whether its clients enter into these derivative contracts for speculative or hedging purposes, Nomura has disclosed below information about derivative contracts that could meet the accounting definition of guarantees.
For information about the maximum potential amount of future payments that Nomura could be required to make under certain derivatives, the notional amount of contracts has been disclosed. However, the maximum potential payout for certain derivative contracts, such as written interest rate caps and written currency options, cannot be estimated, as increases in interest or foreign exchange rates in the future could be theoretically unlimited.
Nomura records all derivative contracts at fair value on its consolidated balance sheets. Nomura believes the notional amounts generally overstate its risk exposure. Since the derivative contracts are accounted for at fair value, carrying value is considered the best indication of payment and performance risk for individual contracts.
The following table presents information on Nomura’s derivative contracts that could meet the accounting definition of a guarantee and standby letters of credit and other guarantees.
Millions of yen
March 31, 2015
September 30, 2015
Carrying value
Maximum Potential Payout/ Notional
Total
Carrying value
Maximum Potential Payout/ Notional
Total
Derivative contracts(1)(2) ¥ 7,961,476 ¥ 253,243,082 ¥ 6,087,709 ¥ 251,410,334 Standby letters of credit and other guarantees(3) 291 9,494 274 9,227 (1) Credit derivatives are disclosed in Note 3 “Derivative instruments and hedging activities” and are excluded from derivative
contracts. (2) Derivative contracts primarily consist of equity, interest rate and foreign exchange contracts. (3) Collateral held in connection with standby letters of credit and other guarantees was ¥7,041 million and ¥7,030 million as of
March 31, 2015 and September 30, 2015, respectively.
The following table presents maturity information on Nomura’s derivative contracts that could meet the accounting definition of a guarantee and standby letters of credit and other guarantees as of September 30, 2015.
Millions of yen
Maximum Potential Payout/Notional
Years to Maturity
Carrying value
Total
Less than 1 year
1 to 3 years
3 to 5 years
More than 5 years
Derivative contracts ¥ 6,087,709 ¥ 251,410,334 ¥ 106,931,084 ¥ 59,569,827 ¥ 24,410,070 ¥ 60,499,353 Standby letters of credit and
other guarantees 274 9,227 12 7 — 9,208
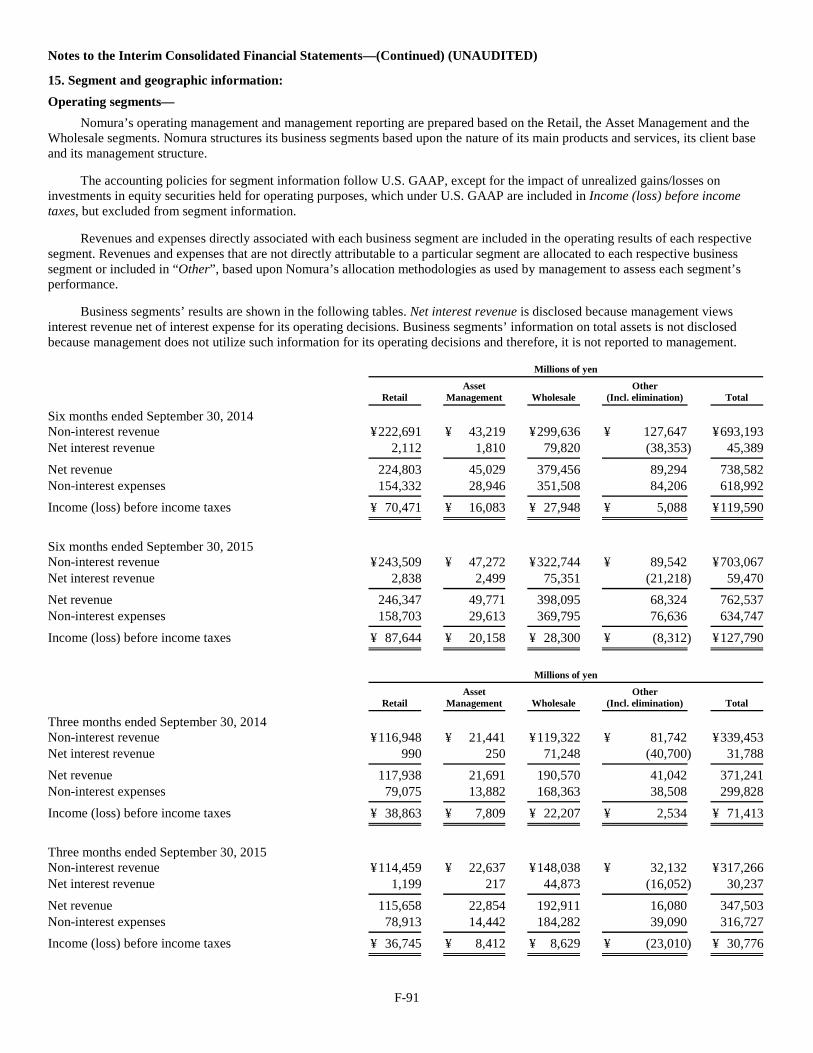
F-91
Notes to the Interim Consolidated Financial Statements—(Continued) (UNAUDITED)
15. Segment and geographic information: Operating segments—
Nomura’s operating management and management reporting are prepared based on the Retail, the Asset Management and the Wholesale segments. Nomura structures its business segments based upon the nature of its main products and services, its client base and its management structure.
The accounting policies for segment information follow U.S. GAAP, except for the impact of unrealized gains/losses on investments in equity securities held for operating purposes, which under U.S. GAAP are included in Income (loss) before income taxes, but excluded from segment information.
Revenues and expenses directly associated with each business segment are included in the operating results of each respective segment. Revenues and expenses that are not directly attributable to a particular segment are allocated to each respective business segment or included in “Other”, based upon Nomura’s allocation methodologies as used by management to assess each segment’s performance.
Business segments’ results are shown in the following tables. Net interest revenue is disclosed because management views interest revenue net of interest expense for its operating decisions. Business segments’ information on total assets is not disclosed because management does not utilize such information for its operating decisions and therefore, it is not reported to management.
Millions of yen
Retail
Asset Management
Wholesale
Other (Incl. elimination)
Total
Six months ended September 30, 2014
Non-interest revenue ¥ 222,691 ¥ 43,219 ¥ 299,636 ¥ 127,647 ¥ 693,193 Net interest revenue 2,112 1,810 79,820 (38,353) 45,389
Net revenue 224,803 45,029 379,456 89,294 738,582 Non-interest expenses 154,332 28,946 351,508 84,206 618,992
Income (loss) before income taxes ¥ 70,471 ¥ 16,083 ¥ 27,948 ¥ 5,088 ¥ 119,590
Six months ended September 30, 2015
Non-interest revenue ¥ 243,509 ¥ 47,272 ¥ 322,744 ¥ 89,542 ¥ 703,067 Net interest revenue 2,838 2,499 75,351 (21,218) 59,470
Net revenue 246,347 49,771 398,095 68,324 762,537 Non-interest expenses 158,703 29,613 369,795 76,636 634,747
Income (loss) before income taxes ¥ 87,644 ¥ 20,158 ¥ 28,300 ¥ (8,312) ¥ 127,790
Millions of yen
Retail
Asset Management
Wholesale
Other (Incl. elimination)
Total
Three months ended September 30, 2014
Non-interest revenue ¥ 116,948 ¥ 21,441 ¥ 119,322 ¥ 81,742 ¥ 339,453 Net interest revenue 990 250 71,248 (40,700) 31,788
Net revenue 117,938 21,691 190,570 41,042 371,241 Non-interest expenses 79,075 13,882 168,363 38,508 299,828
Income (loss) before income taxes ¥ 38,863 ¥ 7,809 ¥ 22,207 ¥ 2,534 ¥ 71,413
Three months ended September 30, 2015
Non-interest revenue ¥ 114,459 ¥ 22,637 ¥ 148,038 ¥ 32,132 ¥ 317,266 Net interest revenue 1,199 217 44,873 (16,052) 30,237
Net revenue 115,658 22,854 192,911 16,080 347,503 Non-interest expenses 78,913 14,442 184,282 39,090 316,727
Income (loss) before income taxes ¥ 36,745 ¥ 8,412 ¥ 8,629 ¥ (23,010) ¥ 30,776
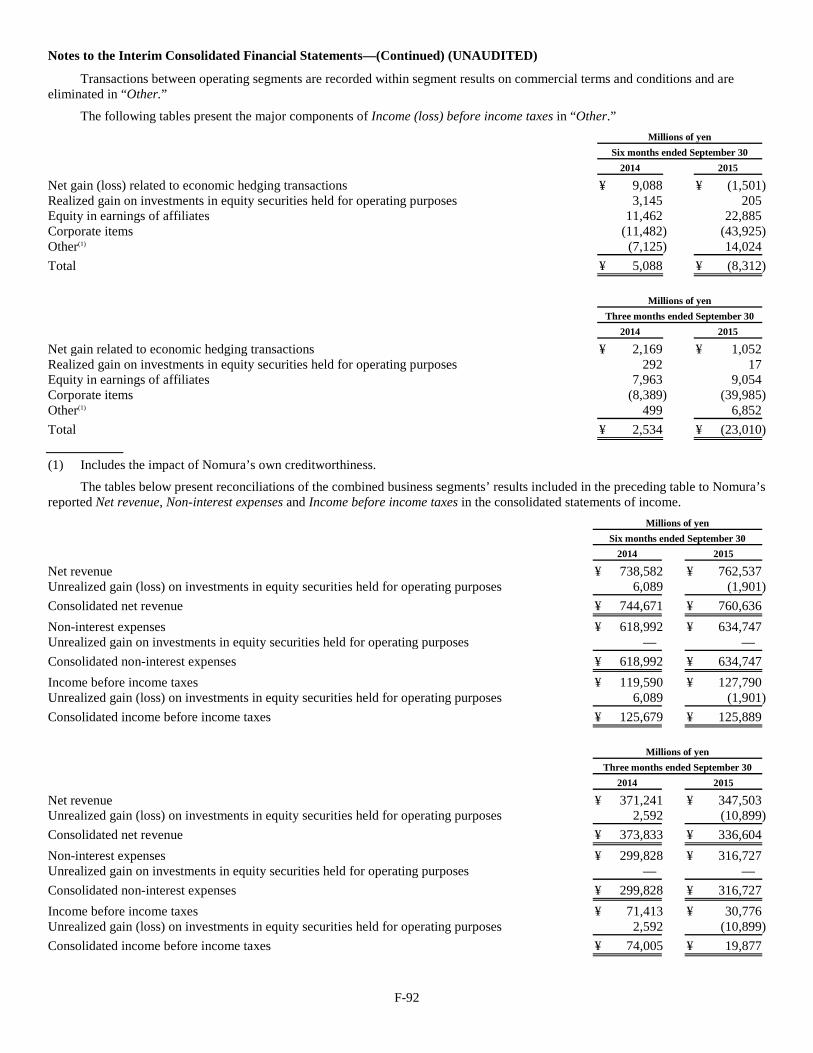
F-92
Notes to the Interim Consolidated Financial Statements—(Continued) (UNAUDITED)
Transactions between operating segments are recorded within segment results on commercial terms and conditions and are eliminated in “Other.”
The following tables present the major components of Income (loss) before income taxes in “Other.”
Millions of yen
Six months ended September 30
2014
2015
Net gain (loss) related to economic hedging transactions ¥ 9,088 ¥ (1,501) Realized gain on investments in equity securities held for operating purposes 3,145 205 Equity in earnings of affiliates 11,462 22,885 Corporate items (11,482) (43,925) Other(1) (7,125) 14,024
Total ¥ 5,088 ¥ (8,312)
Millions of yen
Three months ended September 30
2014
2015
Net gain related to economic hedging transactions ¥ 2,169 ¥ 1,052 Realized gain on investments in equity securities held for operating purposes 292 17 Equity in earnings of affiliates 7,963 9,054 Corporate items (8,389) (39,985) Other(1) 499 6,852
Total ¥ 2,534 ¥ (23,010)
(1) Includes the impact of Nomura’s own creditworthiness.
The tables below present reconciliations of the combined business segments’ results included in the preceding table to Nomura’s reported Net revenue, Non-interest expenses and Income before income taxes in the consolidated statements of income.
Millions of yen
Six months ended September 30
2014
2015
Net revenue ¥ 738,582 ¥ 762,537 Unrealized gain (loss) on investments in equity securities held for operating purposes 6,089 (1,901)
Consolidated net revenue ¥ 744,671 ¥ 760,636
Non-interest expenses ¥ 618,992 ¥ 634,747 Unrealized gain on investments in equity securities held for operating purposes — —
Consolidated non-interest expenses ¥ 618,992 ¥ 634,747
Income before income taxes ¥ 119,590 ¥ 127,790 Unrealized gain (loss) on investments in equity securities held for operating purposes 6,089 (1,901)
Consolidated income before income taxes ¥ 125,679 ¥ 125,889
Millions of yen
Three months ended September 30
2014
2015
Net revenue ¥ 371,241 ¥ 347,503 Unrealized gain (loss) on investments in equity securities held for operating purposes 2,592 (10,899)
Consolidated net revenue ¥ 373,833 ¥ 336,604
Non-interest expenses ¥ 299,828 ¥ 316,727 Unrealized gain on investments in equity securities held for operating purposes — —
Consolidated non-interest expenses ¥ 299,828 ¥ 316,727
Income before income taxes ¥ 71,413 ¥ 30,776 Unrealized gain (loss) on investments in equity securities held for operating purposes 2,592 (10,899)
Consolidated income before income taxes ¥ 74,005 ¥ 19,877
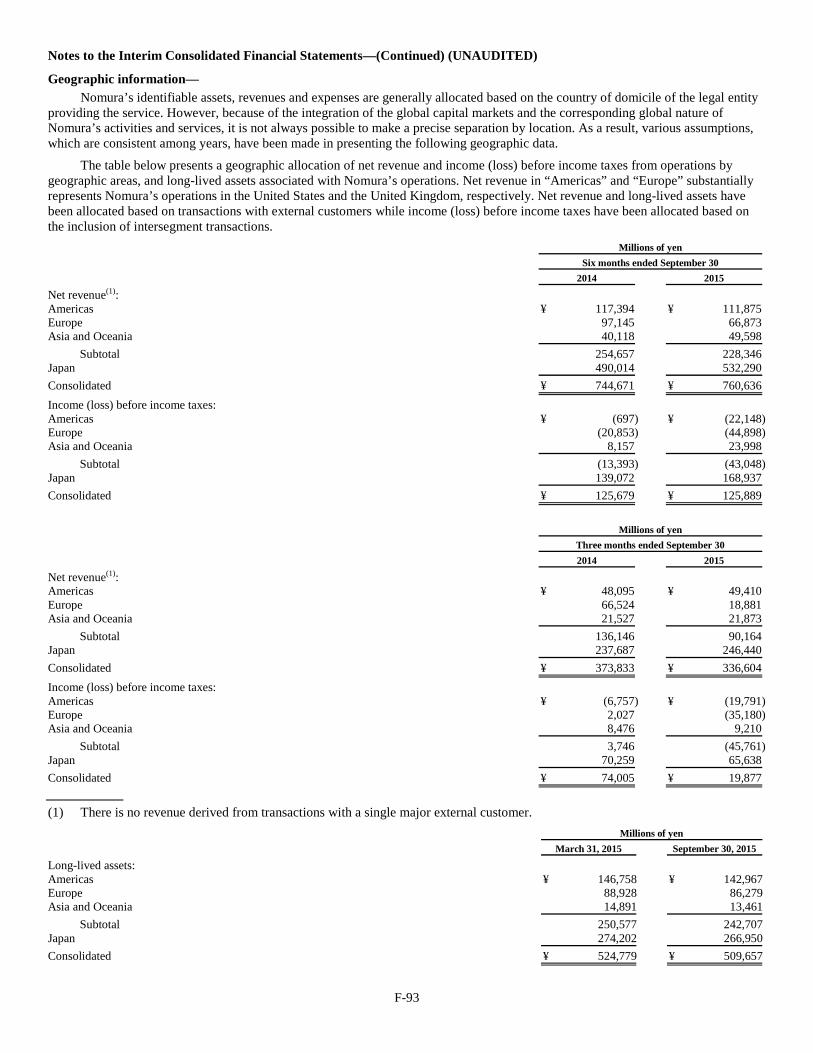
F-93
Notes to the Interim Consolidated Financial Statements—(Continued) (UNAUDITED)
Geographic information— Nomura’s identifiable assets, revenues and expenses are generally allocated based on the country of domicile of the legal entity
providing the service. However, because of the integration of the global capital markets and the corresponding global nature of Nomura’s activities and services, it is not always possible to make a precise separation by location. As a result, various assumptions, which are consistent among years, have been made in presenting the following geographic data.
The table below presents a geographic allocation of net revenue and income (loss) before income taxes from operations by geographic areas, and long-lived assets associated with Nomura’s operations. Net revenue in “Americas” and “Europe” substantially represents Nomura’s operations in the United States and the United Kingdom, respectively. Net revenue and long-lived assets have been allocated based on transactions with external customers while income (loss) before income taxes have been allocated based on the inclusion of intersegment transactions.
Millions of yen
Six months ended September 30
2014
2015
Net revenue(1): Americas ¥ 117,394 ¥ 111,875 Europe 97,145 66,873 Asia and Oceania 40,118 49,598
Subtotal 254,657 228,346 Japan 490,014 532,290 Consolidated ¥ 744,671 ¥ 760,636
Income (loss) before income taxes: Americas ¥ (697) ¥ (22,148) Europe (20,853) (44,898) Asia and Oceania 8,157 23,998
Subtotal (13,393) (43,048) Japan 139,072 168,937 Consolidated ¥ 125,679 ¥ 125,889
Millions of yen
Three months ended September 30
2014
2015
Net revenue(1): Americas ¥ 48,095 ¥ 49,410 Europe 66,524 18,881 Asia and Oceania 21,527 21,873
Subtotal 136,146 90,164 Japan 237,687 246,440 Consolidated ¥ 373,833 ¥ 336,604
Income (loss) before income taxes: Americas ¥ (6,757) ¥ (19,791) Europe 2,027 (35,180) Asia and Oceania 8,476 9,210
Subtotal 3,746 (45,761) Japan 70,259 65,638 Consolidated ¥ 74,005 ¥ 19,877
(1) There is no revenue derived from transactions with a single major external customer.
Millions of yen
March 31, 2015
September 30, 2015
Long-lived assets: Americas ¥ 146,758 ¥ 142,967 Europe 88,928 86,279 Asia and Oceania 14,891 13,461
Subtotal 250,577 242,707 Japan 274,202 266,950 Consolidated ¥ 524,779 ¥ 509,657

F-94
Notes to the Interim Consolidated Financial Statements—(Continued) (UNAUDITED)
16. Supplementary subsidiary guarantee information required under SEC rules: The Company provides several guarantees of borrowings of its subsidiaries. The Company has fully and unconditionally
guaranteed the securities issued or to be issued by Nomura America Finance LLC, which is an indirect, wholly owned finance subsidiary of the Company.
F-95
Report of Independent Registered Public Accounting Firm
The Board of Directors Nomura Holdings, Inc.
We have reviewed the consolidated balance sheet of Nomura Holdings, Inc. (the “Company”) as of September 30, 2015, and the related consolidated statements of income and comprehensive income for the three and six-month periods ended September 30, 2015 and 2014, and the consolidated statements of changes in equity and cash flows for the six-month periods ended September 30, 2015 and 2014. These financial statements are the responsibility of the Company’s management.
We conducted our review in accordance with the standards of the Public Company Accounting Oversight Board (United States). A review of interim financial information consists principally of applying analytical procedures and making inquiries of persons responsible for financial and accounting matters. It is substantially less in scope than an audit conducted in accordance with the standards of the Public Company Accounting Oversight Board (United States), the objective of which is the expression of an opinion regarding the financial statements taken as a whole. Accordingly, we do not express such an opinion.
Based on our review, we are not aware of any material modifications that should be made to the consolidated financial statements referred to above for them to be in conformity with U.S. generally accepted accounting principles.
We have previously audited, in accordance with the standards of the Public Company Accounting Oversight Board (United States), the consolidated balance sheet of Nomura Holdings, Inc. as of March 31, 2015, and the related consolidated statements of income, comprehensive income, changes in equity and cash flows for the year then ended (not presented herein) and we expressed an unqualified opinion on those consolidated financial statements in our report dated June 25, 2015. In our opinion, the accompanying consolidated balance sheet of Nomura Holdings, Inc. as of March 31, 2015, is fairly stated, in all material respects, in relation to the consolidated balance sheet from which it has been derived.
/s/ Ernst & Young ShinNihon LLC
Tokyo, Japan December 18, 2015
Exhibit 15
December 18, 2015 The Board of Directors Nomura Holdings, Inc.
We are aware of the incorporation by reference in the Registration Statements (Form F-3 No. 333-191250, No. 333-186755, No. 333-169682, and No. 333-165049 and Form S-8 No. 333-158344, No. 333-203049, No. 333-150267, No. 333-195004, No. 333-144112, No. 333-187585, No. 333-135430, No. 333-180506, No. 333-126203, No. 333-173244, No. 333-165925, No. 333-116985, No. 333-158344, No. 333-150267, No. 333-144112, No. 333-141988, No. 333-135430, No. 333-134590, No. 333-126203, No. 333-116985) and related Prospectus of Nomura Holdings, Inc. of our report dated December 18, 2015 relating to the unaudited interim consolidated financial statements of Nomura Holdings, Inc. as of September 30, 2015 and for the quarter ended September 30, 2015 that are included in its Form 6-K dated December 18, 2015.
/s/ Ernst & Young ShinNihon LLC