Embed Size (px)
Citation preview

Common Assessments: The Key to Uncommon Results
for Student and Teacher Learning
Maria Nielsen


Common Assessments The Key to Uncommon Results for Student and Teacher Learning
“With so many unsuccessful reform efforts coming and going in our schools, many principals and teachers have become disillusioned. It can be painful to consider making yet another change. Despite all the programs and innovations designed to fix our schools and improve student achievement, there is one basic question that has often gone unasked: Are students actually being taught those things we expect them to learn?”
—Lisa Carter
“With further reflection, most [teachers] recognize that effectiveness in teaching is not defined on the basis of what they do as teachers. Rather, it is defined by what their students are able to do.”
—Thomas Guskey
“When teachers emphasize learning and performance, rather than competition and grades, students are more likely to be intrinsically motivated and encouraged to take risks that challenge and expand their learning.”
—Anne Davies
“The true value of an assessment is its ability to help educators make accurate and timely inferences about student progress so that they can modify instruction accordingly.”
—Rick Stiggins
“What is essential to learning is that students are provided with regular and specific feedback on what they have learned well, and what problems or difficulties they are experiencing.”
—Ken O’Connor
“Collaborative practices and public display of data are closely correlated with student achievement.”
—Stephen White
“Teachers become confident that their students will succeed on the common summative assessments because they wisely used the results of their common formative assessments to make needed “mid‐course” corrections ahead of time.”
—Larry Ainsworth
Maria Nielsen [email protected]
© Nielsen 2015. solution-tree.comDo not duplicate. 1

Your name: _______________________________________________
Lemon, Lime, Twist Partners
Find someone to be your lemon partner. Sign each other’s paper. Find someone to be your lime partner. Sign each other’s paper. Find someone to be your twist partner. Sign each other’s paper.
Lemon partner: _____________________________ Lime partner: ______________________________ Twist partner: ______________________________
© Nielsen 2015. solution-tree.comDo not duplicate.2
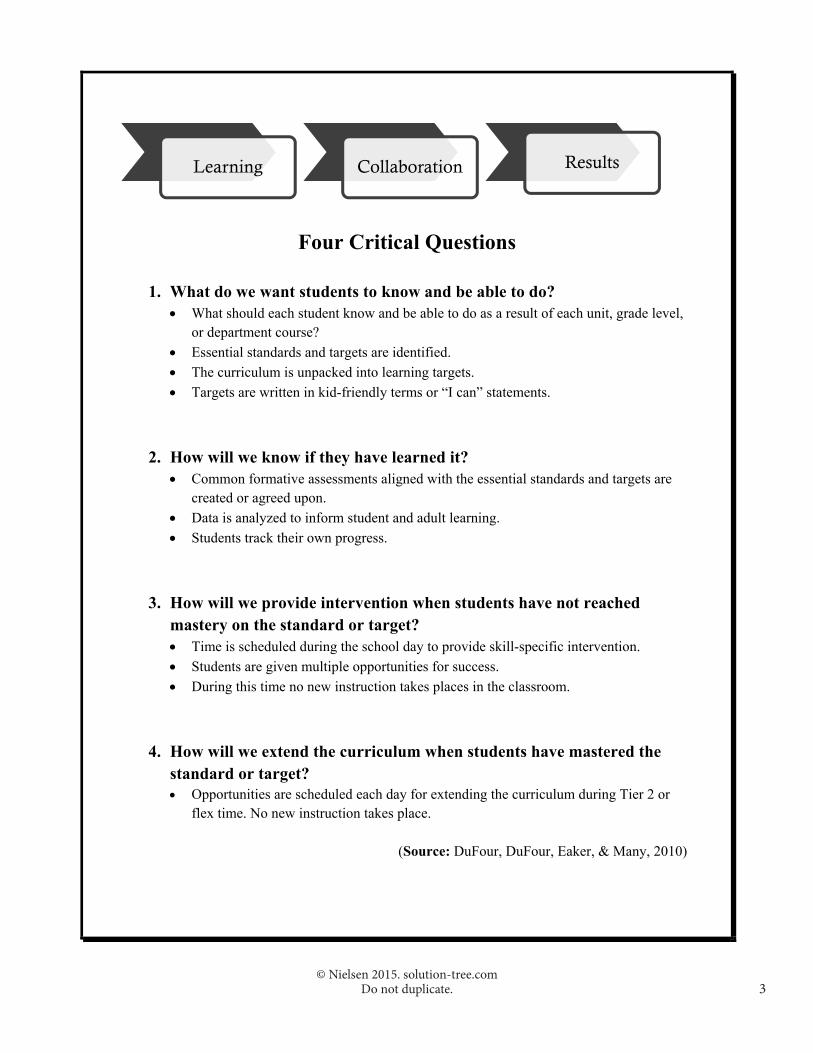
Four Critical Questions
1. What do we want students to know and be able to do?
What should each student know and be able to do as a result of each unit, grade level, or department course?
Essential standards and targets are identified. The curriculum is unpacked into learning targets. Targets are written in kid-friendly terms or “I can” statements.
2. How will we know if they have learned it? Common formative assessments aligned with the essential standards and targets are
created or agreed upon. Data is analyzed to inform student and adult learning. Students track their own progress.
3. How will we provide intervention when students have not reached mastery on the standard or target? Time is scheduled during the school day to provide skill-specific intervention. Students are given multiple opportunities for success. During this time no new instruction takes places in the classroom.
4. How will we extend the curriculum when students have mastered the standard or target? Opportunities are scheduled each day for extending the curriculum during Tier 2 or
flex time. No new instruction takes place.
(Source: DuFour, DuFour, Eaker, & Many, 2010)
Learning Collaboration Results
© Nielsen 2015. solution-tree.comDo not duplicate. 3

Common Assessments What the Experts Say:
The focus is on student learning.
Assessments are created and agreed upon by teams.
Results are collaboratively analyzed and acted upon.
Students and teachers receive immediate feedback.
Students have multiple opportunities for success.
(Source: DuFour, DuFour, Eaker, & Many, 2010)
© Nielsen 2015. solution-tree.comDo not duplicate.4
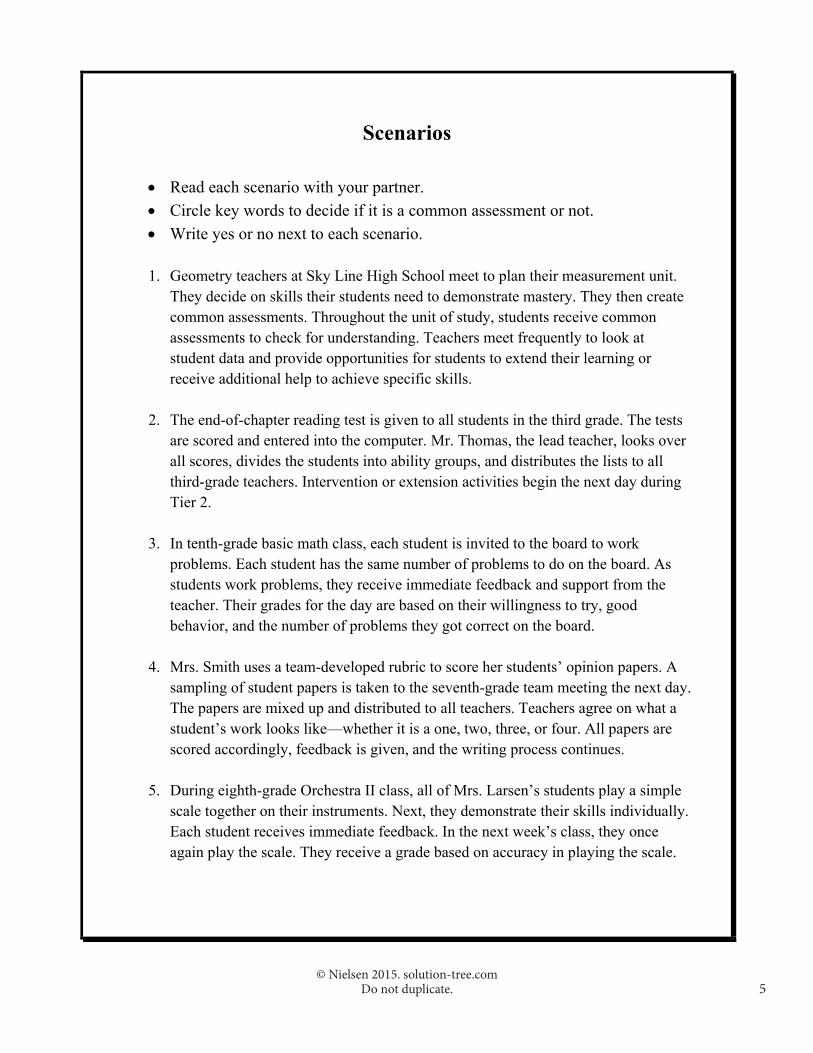
Scenarios
Read each scenario with your partner. Circle key words to decide if it is a common assessment or not. Write yes or no next to each scenario.
1. Geometry teachers at Sky Line High School meet to plan their measurement unit.
They decide on skills their students need to demonstrate mastery. They then create common assessments. Throughout the unit of study, students receive common assessments to check for understanding. Teachers meet frequently to look at student data and provide opportunities for students to extend their learning or receive additional help to achieve specific skills.
2. The end-of-chapter reading test is given to all students in the third grade. The tests
are scored and entered into the computer. Mr. Thomas, the lead teacher, looks over all scores, divides the students into ability groups, and distributes the lists to all third-grade teachers. Intervention or extension activities begin the next day during Tier 2.
3. In tenth-grade basic math class, each student is invited to the board to work
problems. Each student has the same number of problems to do on the board. As students work problems, they receive immediate feedback and support from the teacher. Their grades for the day are based on their willingness to try, good behavior, and the number of problems they got correct on the board.
4. Mrs. Smith uses a team-developed rubric to score her students’ opinion papers. A
sampling of student papers is taken to the seventh-grade team meeting the next day. The papers are mixed up and distributed to all teachers. Teachers agree on what a student’s work looks like—whether it is a one, two, three, or four. All papers are scored accordingly, feedback is given, and the writing process continues.
5. During eighth-grade Orchestra II class, all of Mrs. Larsen’s students play a simple
scale together on their instruments. Next, they demonstrate their skills individually. Each student receives immediate feedback. In the next week’s class, they once again play the scale. They receive a grade based on accuracy in playing the scale.
© Nielsen 2015. solution-tree.comDo not duplicate. 5

Formative Versus Summative
Formative (Doctor Visit) Summative (Autopsy) Assessment for student learning Often nongraded Moving picture of their learning A process during learning
It asks: how can we guide learning?
Assessment of learning Typically graded Snapshot of their learning An event after learning
It asks: what have students learned?
What is balanced assessment?
__________________________________________________________
__________________________________________________________
__________________________________________________________
__________________________________________________________
© Nielsen 2015. solution-tree.comDo not duplicate.6

Common Assessment Implementation
Rate where you are as a team 1 = lowest level of proficiency 4 = highest level of proficiency
The focus of the assessment is on students learning essential knowledge. 1 2 3 4
The assessment is collaboratively created or agreed upon. 1 2 3 4
The team delivers the common assessment in the same time frame. 1 2 3 4
Results are collaboratively analyzed, and action is taken. 1 2 3 4
There is immediate feedback for students and teachers. 1 2 3 4
The assessment is formative and guides student and adult learning. 1 2 3 4
Students receive multiple opportunities for success. 1 2 3 4
Students who are not proficient are provided with skill-specific interventions. 1 2 3 4
Students who have mastered the targets receive rigorous extensions of the targets. 1 2 3 4
Students are involved in monitoring their progress. 1 2 3 4
Student progress is acknowledged and celebrated. 1 2 3 4
Next steps for our team:
© Nielsen 2015. solution-tree.comDo not duplicate. 7

Name: ____________________________________________________________
I Can Statements Teach This to Others
Do This by Myself
Do This With Help
Cannot Do
This
Strong mathematicians can determine a fraction by finding a part of a whole. (5.1)
Strong mathematicians can write mixed numbers and improper fractions by understanding the whole or one. (5.2)
Strong mathematicians can compare fractions by: Thinking which is closest to 0, ½, or 1. Finding common denominators. Noticing all the numerators are all the same.
(5.3)
Strong mathematicians can write equivalent fractions by multiplying or dividing the numerator and the denominator. (5.4)
Strong mathematicians can rename fractions as decimals by: Finding equivalent fractions with 10 or 100 as
the denominator. Dividing the fraction. (5.5 and 5.6)
Strong mathematicians can find decimal equivalents by using a calculator. (5.7)
Strong mathematicians can convert fractions to percentages by changing the fractions to a decimal then to a percent. (5.8)
Strong mathematicians can identify different graphs by knowing the properties of each. (5.9)
Strong mathematicians can find the percent of the area on a circle graph by using a percent circle. (5.10)
© Nielsen 2015. solution-tree.comDo not duplicate.8

Student Teacher: Standards: Score %
1 2 3 4 5 6 7 8 9 10 11 12 13 14 15 16 17 18 19 20 21 22 23 24 25
1 2 3 4 5 6 7 8 9 10 11 12 13 14 15 16 17 18 19 20 21 22 23 24 25
1 2 3 4 5 6 7 8 9 10 11 12 13 14 15 16 17 18 19 20 21 22 23 24 25
1 2 3 4 5 6 7 8 9 10 11 12 13 14 15 16 17 18 19 20 21 22 23 24 25
1 2 3 4 5 6 7 8 9 10 11 12 13 14 15 16 17 18 19 20 21 22 23 24 25
1 2 3 4 5 6 7 8 9 10 11 12 13 14 15 16 17 18 19 20 21 22 23 24 25
1 2 3 4 5 6 7 8 9 10 11 12 13 14 15 16 17 18 19 20 21 22 23 24 25
1 2 3 4 5 6 7 8 9 10 11 12 13 14 15 16 17 18 19 20 21 22 23 24 25
1 2 3 4 5 6 7 8 9 10 11 12 13 14 15 16 17 18 19 20 21 22 23 24 25
1 2 3 4 5 6 7 8 9 10 11 12 13 14 15 16 17 18 19 20 21 22 23 24 25
1 2 3 4 5 6 7 8 9 10 11 12 13 14 15 16 17 18 19 20 21 22 23 24 25
1 2 3 4 5 6 7 8 9 10 11 12 13 14 15 16 17 18 19 20 21 22 23 24 25
1 2 3 4 5 6 7 8 9 10 11 12 13 14 15 16 17 18 19 20 21 22 23 24 25
1 2 3 4 5 6 7 8 9 10 11 12 13 14 15 16 17 18 19 20 21 22 23 24 25
1 2 3 4 5 6 7 8 9 10 11 12 13 14 15 16 17 18 19 20 21 22 23 24 25
1 2 3 4 5 6 7 8 9 10 11 12 13 14 15 16 17 18 19 20 21 22 23 24 25
1 2 3 4 5 6 7 8 9 10 11 12 13 14 15 16 17 18 19 20 21 22 23 24 25
1 2 3 4 5 6 7 8 9 10 11 12 13 14 15 16 17 18 19 20 21 22 23 24 25
1 2 3 4 5 6 7 8 9 10 11 12 13 14 15 16 17 18 19 20 21 22 23 24 25
1 2 3 4 5 6 7 8 9 10 11 12 13 14 15 16 17 18 19 20 21 22 23 24 25
1 2 3 4 5 6 7 8 9 10 11 12 13 14 15 16 17 18 19 20 21 22 23 24 25
1 2 3 4 5 6 7 8 9 10 11 12 13 14 15 16 17 18 19 20 21 22 23 24 25
1 2 3 4 5 6 7 8 9 10 11 12 13 14 15 16 17 18 19 20 21 22 23 24 25
1 2 3 4 5 6 7 8 9 10 11 12 13 14 15 16 17 18 19 20 21 22 23 24 25
1 2 3 4 5 6 7 8 9 10 11 12 13 14 15 16 17 18 19 20 21 22 23 24 25
1 2 3 4 5 6 7 8 9 10 11 12 13 14 15 16 17 18 19 20 21 22 23 24 25
1 2 3 4 5 6 7 8 9 10 11 12 13 14 15 16 17 18 19 20 21 22 23 24 25
1 2 3 4 5 6 7 8 9 10 11 12 13 14 15 16 17 18 19 20 21 22 23 24 25
1 2 3 4 5 6 7 8 9 10 11 12 13 14 15 16 17 18 19 20 21 22 23 24 25 Total # Missed
Target
© Nielsen 2015. solution-tree.comDo not duplicate. 9

© Nielsen 2015. solution-tree.comDo not duplicate.10

Geometry Unit 1, Common Assessment 1
Teacher #
Stud
ents
W
ho T
ook
Ass
essm
ent
Ove
rall
Ave
rage
Sco
re
# St
uden
ts
Prof
icie
nt
(19/
23)
# St
uden
ts
Not
Pro
ficie
nt
(18/
23 a
nd
Bel
ow)
Names of Students Needing Additional Intervention
Clark 20 20.5
(89%) 15 5
Chase—passed; Wyatt, Daxton, Chelsey, Tyler—Tier 2
intervention
Wall 18 21
(91%) 15 3
Kaden—retaught/retested—passed; Emma—Tier 2; Audrey—resource push in
model
Jones 22 20.5
(89%) 18 4
Samantha—sick three days; Tayla, Griffin, Danee—Tier 2 intervention
Total 60 20.6
(90%) 48 12
Teacher
# St
uden
ts
Who
Too
k A
sses
smen
t
Ove
rall
Ave
rage
Sco
re
# St
uden
ts
Prof
icie
nt
( /
)
# St
uden
ts
Not
Pro
ficie
nt
( /
) Names of Students Needing Additional Intervention
Total
© Nielsen 2015. solution-tree.comDo not duplicate. 11

Data Analysis
Questions Responses
What worked well?
Where do our students struggle the most?
Item analysis: Which problems are most frequently missed? Why?
How can we improve the assessment?
What teaching strategies can we share?
What resources are available for intervention and extension?
Names of students needing intervention:
12© Nielsen 2015. solution-tree.com
Reproducible.
REPRODUCIBLE
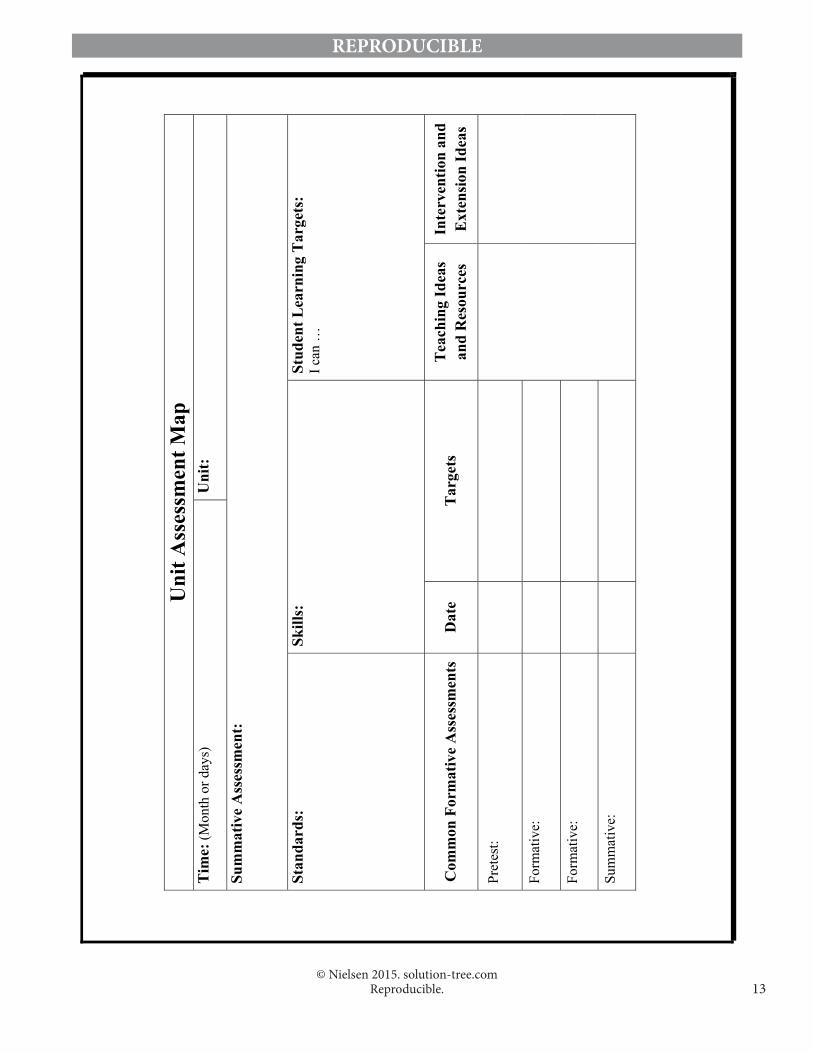
Uni
t Ass
essm
ent M
ap
Tim
e: (M
onth
or d
ays)
U
nit:
Sum
mat
ive
Ass
essm
ent:
Stan
dard
s:
Skill
s:
Stud
ent L
earn
ing
Targ
ets:
I c
an …
Com
mon
For
mat
ive
Ass
essm
ents
D
ate
Targ
ets
Tea
chin
g Id
eas
and
Res
ourc
es
Inte
rven
tion
and
Ext
ensio
n Id
eas
Pret
est:
Form
ativ
e:
Form
ativ
e:
Sum
mat
ive:
13© Nielsen 2015. solution-tree.com
Reproducible.
REPRODUCIBLE

Common Assessment Checklist
1• Clarify essential knowledge and skills.
2• Develop a common pacing guide or unit assessment map.
3• Create common formative assessments.
4• Establish a common standard of proficiency.
5• Use common assessment results to identify students for
intervention and extension.
6• Designate a block of time for intervention and extension
during the school day.
© Nielsen 2015. solution-tree.comDo not duplicate.14

Effective PLC Look-Fors
Clarification: What Is a Professional Learning Community?
Knowledge of the PLC process and its links to research on effective school practices is established with the staff.
Collaborative Culture A collaborative culture is established among grade levels. The school day is structured to provide time for team collaboration. Grade‐levels or department teams meet in a general area for a specified time. The principal meets with collaborative teams during PLC time. Team feedback and log sheets are turned into the principals at the end of each meeting. Team norms are established.
Critical Questions Are Considered by the Team at Every Meeting What should each student know and be able to do as a result of the unit of instruction? How do we know if students have learned the content? How do we monitor student
progress on a timely basis? What do we do if students didn’t learn the content? What processes are in place to
provide additional time and support for these students? How do we enrich the core curriculum for students who know and understand
the content?
Focus on Results Collaborative teams focus on core standards and objectives. Common formative assessments inform student and adult learning. Common pacing is established. Assessment data are analyzed by the collaborative team. Strengths and weaknesses are identified by the team. Instructional strategies are shared by the collaborative team. Assessment data informs teaching practices. Decisions are made regarding the critical questions: who provides intervention,
extension, and remediation?
© Nielsen 2015. solution-tree.comDo not duplicate. 15

References and Resources
Book Title or Website Authors Publisher (Copyright)
Ahead of the Curve: The Power of Assessment to Transform Teaching and Learning Douglas B. Reeves, Editor Solution Tree Press (2007)
Balanced Assessment: From Formative to Summative Kay Burke Solution Tree Press (2010)
Common Formative Assessment: A Toolkit for Professional Learning Communities at Work™
Kim Bailey & Chris Jakicic Solution Tree Press (2010)
Common Formative Assessments: How to Connect Standards-Based Instruction and Assessment
Larry B. Ainsworth & Donald J. Viegut
Corwin Press (2006)
Embedded Formative Assessment Dylan Wiliam Solution Tree Press (2011)
Every School, Every Team, Every Classroom: District Leadership for Growing Professional Learning Communities at Work™
Robert Eaker & Janel Keating Solution Tree Press (2011)
Leading by Design: An Action Framework for PLC at Work™ Leaders Cassandra Erkens & Eric Twadell Solution Tree Press (2012)
Learning by Doing: A Handbook for Professional Learning Communities at Work™ (Second Edition)
Richard DuFour, Rebecca DuFour, Robert Eaker, & Thomas W. Many Solution Tree Press (2009)
The PLC at Work™ Cartoon Book Martha F. Campbell Solution Tree Press (2011) The Teacher as Assessment Leader Thomas R. Guskey (Editor) Solution Tree Press (2009) On Common Ground: The Power of Professional Learning Communities
Richard DuFour, Robert Eaker, & Rebecca DuFour (Editors)
Solution Tree Press (2005)
Raising the Bar and Closing the Gap: Whatever It Takes
Richard DuFour, Rebecca DuFour, Robert Eaker, & Gayle Karhanek Solution Tree Press (2009)
Revisiting Professional Communities at Work™: New Insights for Improving Schools
Richard DuFour, Rebecca DuFour, & Robert Eaker Solution Tree Press (2008)
Simplifying Response to Intervention: Four Essential Guiding Principles
Austin G. Buffum, Mike Mattos, & Chris Weber
Solution Tree Press (2011)
Using Formative Assessment in the RTI Framework Kay Burke & Eileen Depka Solution Tree Press (2011)
The Collaborative Teacher: Working Together as a Professional Learning Community
Cassandra Erkens, Chris Jakicic, Lillie G. Jessie, et al. [anthology]
Solution Tree Press (2008)
Building a Professional Learning Community at Work™: A Guide to the First Year Parry Graham & William M. Ferriter Solution Tree Press (2009)
AllThingsPLC.info [website] —— Solution Tree (solution-tree.com) [website] —— Maria Nielsen [email protected] 800.733.6786, ext. 263
Visit www.solution-tree.com/free-resources for any free resources, including shareable
tools and study guides.
© Nielsen 2015. solution-tree.comDo not duplicate.16