Embed Size (px)
Citation preview
molecules
Article
Common Trends and Differences in Antioxidant ActivityAnalysis of Phenolic Substances Using Single Electron TransferBased Assays
Melanie Platzer 1,2,* , Sandra Kiese 2,3 , Thomas Herfellner 2, Ute Schweiggert-Weisz 2,4, Oliver Miesbauer 3
and Peter Eisner 1,2
�����������������
Citation: Platzer, M.; Kiese, S.;
Herfellner, T.; Schweiggert-Weisz, U.;
Miesbauer, O.; Eisner, P. Common
Trends and Differences in Antioxidant
Activity Analysis of Phenolic
Substances Using Single Electron
Transfer Based Assays. Molecules 2021,
26, 1244. https://doi.org/10.3390/
molecules26051244
Academic Editor: Renata Bilewicz
Received: 23 January 2021
Accepted: 23 February 2021
Published: 25 February 2021
Publisher’s Note: MDPI stays neutral
with regard to jurisdictional claims in
published maps and institutional affil-
iations.
Copyright: c© 2021 by the authors.
Licensee MDPI, Basel, Switzerland.
This article is an open access article
distributed under the terms and
conditions of the Creative Commons
Attribution (CC BY) license (https://
creativecommons.org/licenses/by/
4.0/).
1 ZIEL-Institute for Food & Health, TUM School of Life Sciences Weihenstephan,Technical University of Munich, Weihenstephaner Berg 1, 85354 Freising, Germany;[email protected]
2 Fraunhofer Institue for Process Engineering and Packaging IVV, Giggenhauser Str. 35, 85354 Freising,Germany; [email protected] (S.K.); [email protected] (T.H.);[email protected] (U.S.-W.)
3 Chair of Food Packaging Technology, TUM School of Life Sciences Weihenstephan,Technical University of Munich, Weihenstephaner Steig 22, 85354 Freising, Germany;[email protected]
4 Chair of Food Science, Institute for Nutritional and Food Sciences, University of Bonn,Meckenheimer Allee 166a, 53113 Bonn, Germany
* Correspondence: [email protected]
Abstract: Numerous assays were developed to measure the antioxidant activity, but each has limita-tions and the results obtained by different methods are not always comparable. Popular examplesare the DPPH and ABTS assay. Our aim was to study similarities and differences of these twoassay regarding the measured antioxidant potentials of 24 phenolic compounds using the samemeasurement and evaluation methods. This should allow conclusions to be drawn as to whetherone of the assays is more suitable for measuring specific subgroups like phenolic acids, flavonols,flavanones, dihydrochalcones or flavanols. The assays showed common trends for the mean valuesof most of the subgroups. Some dihydrochalcones and flavanones did not react with the DPPHradical in contrast to the ABTS radical, leading to significant differences. Therefore, to determinethe antioxidant potential of dihydrochalcone or flavanone-rich extracts, the ABTS assay should bepreferred. We found that the results of the flavonoids in the DPPH assay were dependent on the Borscriteria, whereas the structure–activity relationship in the ABTS assay was not clear. For the phenolicacids, the results in the ABTS assay were only high for pyrogallol structures, while the DPPH assaywas mainly determined by the number of OH groups.
Keywords: antioxidant capacity; flavonoids; phenolic acids; reaction kinetics; stoichiometry
1. Introduction
Plant-based antioxidants are known for their ability to limit radical reactions bytransferring hydrogen atoms or electrons and to interrupt the chain reactions of oxidativedegradation [1–5]. Among the most important groups of plant-based antioxidants arephenolic compounds, which have one or more aromatic rings with one or more hydroxygroups. They are common plant secondary metabolites and are divided into severalmajor families according to their chemical structure, including the flavonoids and phenolicacids [6]. The phenolic compounds investigated in this article are listed in Table 1.
Molecules 2021, 26, 1244. https://doi.org/10.3390/molecules26051244 https://www.mdpi.com/journal/molecules
Molecules 2021, 26, 1244 2 of 17
Table 1. Summary of the phenolic compounds, reference standards, sample codes and corresponding side groups.
Group Reference Standard Sample Code Side Group
phenolic acids 1 3 4 5
A
1
3
26
5
4
caffeic acids CAA (CH)2COOH OH OH H3,4-dihydroxybenzoic acid DBA COOH OH OH Hferulic acid FEA (CH)2COOH OH OCH3 Hgallic acid GAA COOH OH OH OH4-hydroxybenzoic acid HBA COOH H OH Hp-coumaric aicid PCA (CH)2COOH H OH Hsinapic acid SIA (CH)2COOH OCH3 OH OCH3siringic acid SRA COOH OCH3 OH OCH3
flavonols 2′ 3′ 4′ 5′ 3 5 7
O
OOH
A C
B1
2
345
6
7
8
1´
2´
3´
4´
5´
kaempferol KAE H H OH H OH OH OHmyricetin MYR H OH OH OH OH OH OHmorin MOR OH H OH H OH OH OHquercetin-3-D-galactoside QGA3 H OH OH H Glc OH OHquercetin-3-D-glucoside QGU3 H OH OH H Gal OH OHquercetin QUR H OH OH H OH OH OH
flavanones 3′ 4′ 5 7
O
O
A C
B1
2
345
6
7
8
1´
2´
3´
4´
5´
hesperetin HES OH OCH3 OH OHnarirutin NAR H OH OH 2 Glcnaringenin NAN H OH OH OHtaxifolin TAF OH OH OH OH
dihydrochalcones 4 2′ 4′ 6′
phloridzin PHD OH OH OH Glcphloretin PHT OH OH OH OH
flavanols 3′ 4′ 3 4 5 7
O
A C
B1
2
345
6
7
8
1´
2´
3´
4´
5´
OH
(+)-catechin CAT OH OH OH H OH OH(−)-epicatechin EPC OH OH OH H OH OHproanthocyanidin B1 PCB1 OH OH OH CAT OH OHproanthocyanidin B2 PCB2 OH OH OH EPC OH OH
Three criteria for the structure-activity relationship (SAR) of antioxidant compoundshave been defined by Bors [7]:
• Bors 1—due to hydrogen bonding, the presence of a catechol group on the B-ring leadsto a high stability of the antioxidant radical (AO·);
• Bors 2—a 2,3 double bond in combination with a 4-oxo group on the C-ring facilitateselectron delocalization;
• Bors 3—the presence of OH groups at position 3 and 5 in combination with the 4-oxogroup enables electron delocalization via hydrogen bonds.
The presence of a pyrogallol structure on the B-ring can also increase the antioxidantactivity [8]. Molecules that fulfil all of the Bors’ criteria, such as quercetin (QUR) andmyricetin (MYR), should therefore achieve the most efficient electron delocalization andaccordingly should possess the highest antioxidant activity [7,9]. Attempts to correlatechemical structures with antioxidant activity are usually based on the analysis of naturalphenolic compounds and extracts using various antioxidant assays [3]. The most widelyused methods are based on oxygen radical absorbance capacity (ORAC) [10], 2,2′-azino-bis(3-ethylbenzothiazoline-6-sulfonic acid) (ABTS) [11] and 2,2-diphenyl-1-picrylhydrazyl(DPPH) [12] assays. The underlying chemistry involves either hydrogen atom transfer(HAT) or single electron transfer (SET) as shown in Figure 1 [3].
Molecules 2021, 26, 1244 3 of 17
AO· + ROOH
AOH
AOH·+ + ROO¯
AO ¯
AO· + ROO¯
ROO·
- H+H+
ROO·
ROO·
SET-PT
SPLET- H+
Figure 1. Schematic representation of HAT, single electron transfer followed by a proton transfer(SET-PT) and sequential proton loss electron transfer (SPLET) antioxidant reaction mechanisms(reproduced from Shang et al. (2009) [13] with some modifications).
HAT assays (such as ORAC) measure the ability of an antioxidant (AOH) to inactivatea free radical (ROO·) by releasing a hydrogen atom [3,4,14]. In contrast, assays that aredominated by SET-based reaction mechanisms, such as ABTS and DPPH, measure therelease of an electron to the (ROO·), converting it into an anion (ROO−) [4,15,16]. The lat-ter causes reversible deprotonation and a color decrease in the solution, which not onlyindicates the reaction endpoint but simultaneously reports the concentration of the antioxi-dant [3,17]. SET mechanisms can be subdivided into SET-PT and SPLET. The two-stageSET-PT mechanism strongly depends on the ionization potential and proton dissociationenergy. Antioxidants, which are easily ionized and deprotonated, are highly reactive.In contrast, the SPLET mechanism involves the initial loss of a proton from the antioxi-dant followed by anion transfer to the radical, which then reacts with the proton. This isinfluenced by the proton affinity and electron transfer enthalpy. SET-PT and SPLET arein thermodynamic equilibrium with each other (and also with the HAT mechanism), be-cause the reactants and end products are identical. However, the reaction rate in each assaydepends on different physical processes [4,15,16]. The dominant reaction depends on thepH and solvent [16], resulting in different SARs for each assay. The ABTS radical preferablyreacts via the SPLET mechanism in aqueous solutions, whereas the DPPH radical prefer-ably reacts via the SPLET mechanism in solvents such as ethanol and methanol [18,19].Some authors have theoretically investigated the reaction mechanisms and classified theantioxidant effect of substances via the SPLET mechanism on the basis of electron transferenergy and proton affinity, but the dependence of these effects on the pH and solventmakes it difficult to make accurate predictions [20–22].
Each of these assays has unique properties and limitations, making it difficult tocompare results generated using different methods—for example, measurement at a fixedtime or kinetic, measurement of different concentrations or only one concentration, and theuse of different solvents [23–26]. Furthermore, the outcome of the assays can be evaluatedin different ways, resulting in metrics, such as half maximal effective concentration (EC50),time to reach the EC50 (TEC50 ), antiradical efficiency, antiradical power (ARP), stoichiometry,kinetic behavior and rate constant, radical scavenging activity, or trolox equivalent antioxi-dant capacity (TEAC) [23,24,27–32]. Although there is a large number of publications onthe assays and their limitations, little is found on the most suitable use of the assays fordifferent types and applications of extracts.
Our aim was to study whether the DPPH or the ABTS assay should be preferred to an-alyze the antioxidant potential of extracts rich in different phenolic components, or whetherthey lead to similar results. Therefore, we investigated the SAR of 24 different phenoliccompounds by comparing two SET assays (ABTS and DPPH). The phenolic compounds
Molecules 2021, 26, 1244 4 of 17
represented the phenolic acids, flavonols, flavanones, dihydrochalcones, and flavanols,allowing us to compare the antioxidant properties of different groups as well as individualsubstances within a group and thus determine structural features correlating with highantioxidant activity. We used the same measurement as well as evaluation methods inour study. To ensure that the reactions were complete and the reported values are notunderestimated, all measurements were recorded as a function of time. Furthermore,second order kinetic equations were used to verify the endpoint values. EC50, ARP andstoichiometry values are interconvertible without affecting the outcome, so all results arepresented herein as stoichiometry values [29].
2. Materials and Methods
Chemicals (antioxidant reference standards) were obtained from MilliporeSigma(Steinheim, Germany): caffeic acid (CAA), (+)-catechin (CAT), 3,4-dihydroxybenzoic acid(DBA), (−)-epicatechin (EPC), ferulic acid (FEA), gallic acid (GAA), 4-hydroxybenzoic acid(HBA), hesperetin (HES), kaempferol (KAE), morin (MOR), myricetin (MYR), naringenin(NAN), p-coumaric acid (PCA), proanthocyanidin B1 (PCB1), proanthocyanidin B2 (PCB2),phloridzin (PHD), phloretin (PHT), quercetin-3-D-galactosides (QGA3), quercetin-3-D-glucosides (QGU3), quercetin QUR, sinapic acid (SIA), siringic acid (SRA) and taxifolin(TAF). These are shown in Table 1. We also obtained DPPH radical, ABTS diammoniumsalt and potassium persulfate from the same supplier. The narirutin (NAR) referencestandard was purchased from J&K Scientific (Marbach am Neckar, Germany) and is alsoshown in Table 1. Stock solutions were prepared by dissolving the reference standards inabsolute ethanol (analytical grade), taking into account the purity, and diluting them inseven steps (0.075–1 mM) for the measurements.
The antioxidant activity was measured using the DPPH [23] and ABTS [11] methodsas previously described, with slight modifications. The stock solution for the DPPH assaywas prepared by dissolving 24 mg of the radical in 100 mL absolute ethanol. The workingsolution was prepared diluting the stock solution 1:10. We mixed 50 µL of the sample (ref-erence standard dilution or ethanol blank) with 1950 µL of the working solution for eachmeasurement, and the absorbance was determined by spectrophotometry at 515 nm [23].The stock solution for the ABTS assay was prepared by dissolving 6.62 mg potassiumpersulfate and 38.4 µg ABTS diammonium salt in 10 mL demineralized water. This solu-tion was incubated in the dark for 12–16 h and then the working solution was preparedby diluting 1:100 with demineralized water. We mixed 10 µL of each sample (referencestandard dilution or ethanol blank) with 990 µL of the working solution for each mea-surement, and the absorbance was determined by spectrophotometry at 734 nm using aSpecord 210 plus spectrophotometer (Analytik Jena, Jena, Germany) [11]. In both assaysthe absorption was measured as a function of time and the color decrease of the respectiveradical (DPPH or ABTS) was detected. All measurements were performed in triplicate.The decrease of absorbance in percent was then used to calculate the decrease of initialradical concentration in percent. This corresponds to the amount of radical reduced inmM and was plotted as a function of time. The reaction mechanism is explained belowusing the DPPH radical, but the principle is the same in the ABTS assay. As mentionedabove, all HAT- and SET-based mechanisms lead to identical products (see Figure 1) andtherefore can be summarized to Equation (1), where the AOH reacts with DPPH· to formthe intermediate AO·
AOH + α DPPH· −−→ DPPH−H + AO·, (1)
which reacts with DPPH· in a second step to yield DPPH-AO Equation (2)
AO·+ β DPPH· −−→ DPPH−AO, (2)
where α and β are stoichiometric coefficients [23,29]. Since only the color decrease of theDPPH radical (DPPH·) is measured and it is not possible to distinguish in which of the
Molecules 2021, 26, 1244 5 of 17
Equations (1) or (2) the radical reacts, only a total stoichiometry (α + β) can be determinedwith this method. Furthermore, as shown in Equation (3):
AO·+ AO· −−→ AO−AO. (3)
Since this reaction does not cause any color decrease in the assay, it is neglected forthe following considerations. The reaction of an antioxidant with the DPPH and ABTSreagents follows second-order kinetics [28,29]. Therefore, the changing concentrations ofAOH, AO· and DPPH· over time are given as shown in Equations (4)–(6):
d[AOH]
dt= −k1[AOH][DPPH·], (4)
d[AO·]dt
= k1[AOH][DPPH·]− k2[AO·][DPPH·], (5)
d[DPPH·]dt
= −αk1[AOH][DPPH·]− βk2[AO·][DPPH·], (6)
where k1 and k2 are the reaction rate constants. The initial concentrations [AOH]0 and[DPPH·]0 are assumed to be positive, whereas [DPPH-H]0 and [AO·]0 are set to zero.In our experiments, DPPH· was available in excess and accordingly, we assume that itsconcentration [DPPH·] on the right side of Equations (4)–(6) is constant. In this case,the reactions follow pseudo-first order kinetics [33] as shown in Equations (7)–(9):
d[AOH]
dt= −k1[AOH], (7)
d[AO·]dt
= k1[AOH]− k2[AO·], (8)
d[DPPH·]dt
= −αk1[AOH]− βk2[AO·], (9)
where the reaction rate constants are defined as k1 = k1[DPPH·]0 and k2 = k2[DPPH·]0.Equation (7) is a first-order linear homogenous differential equation and its analyticalsolution is given by
[AOH]t = [AOH]0 exp(−k1t
). (10)
This expression is substituted in Equation (8), which is a first-order linear inhomoge-neous differential equation. Its solution is obtained as the sum of the general solution ofthe corresponding homogeneous equation and a particular solution of the inhomogeneousequation, which is determined by an exponential ansatz as well. Considering the initialcondition [AO·]0 = 0 gives
[AO·]t =[AOH]0k1
k2 − k1
(exp
(−k1t
)− exp
(−k2t
)). (11)
Substituting [AOH]t and [AO·]t in Equation (9) and integrating over time leads to theexpression for [DPPH]t, allowing to calculate the amount of DPPH· per volume, which isconsumed up to time t, as shown in Equation (12):
∆[DPPH·]t = [DPPH·]0 − [DPPH·]t
= [AOH]0
(α + β +
αk1 − (α + β)k2
k2 − k1exp
(−k1t
)+
βk1
k2 − k1exp
(−k2t
)).
(12)
The steady-state values are the asymptotic values of Equation (12) for t→ ∞. We adaptedthis model function to the concentration of reduced radicals, allowing the stationary endpointof the kinetics to be determined even if the reaction did not reach completion within themeasurement time. Assuming that the AOH had completely reacted with the radicals by
Molecules 2021, 26, 1244 6 of 17
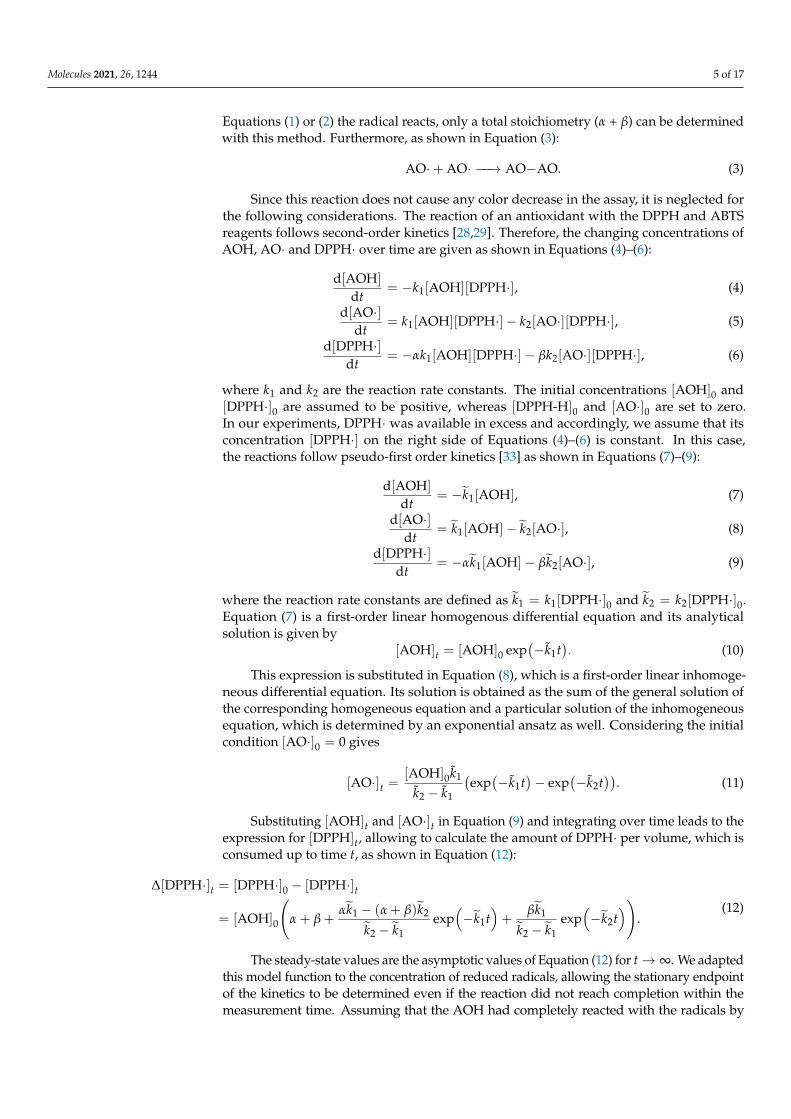
the reaction endpoint, the measured amount of reduced DPPH and ABTS was plotted as afunction of the AOH concentration initially used ([AOH]0). When plotting the concentrationof reduced DPPH (∆[DPPH·]t = [DPPH·]0 − [DPPH·]t), the positive slope of the linearregression directly indicates the total stoichiometry of the number of DPPH radicals, neededto oxidize the complete AOH in all subreactions (steady state). As shown in Figure 2 as aschematic example, the last two points are in the saturation range, since all DPPH radicalshave already been consumed here. In order not to underestimate the stoichiometry, only theconcentrations below this range were used for the linear regression. Furthermore, the linearregression equation can be used to calculate the amount of reduced DPPH for higher AOHconcentrations, which cannot be determined experimentally.
redu
ced
DPP
H [m
M]
AOH concentration [mM]Figure 2. Schematic example of the linear regression for the evaluation of the total stoichiometry ofall subreactions.
To determine the stoichiometry values after 5 and 30 min, the fit values after 5 and30 min were evaluated in the same manner as the steady state stoichiometry. The kineticbehavior of each substance was assigned to one of three groups (fast, medium and slow)as previously described [23]. The fast substances reached steady state within 5 min andthe medium ones within 30 min. All substances that needed more than 30 min to reachsteady state were assigned to the slow kinetic behavior group. The slower the reaction rate,the more complex the reaction, as previously shown using butylated hydroxytoluene [30].
Statistical evaluation was carried out by one-way analysis of variance (ANOVA)with all significant decimal places using Sigma Plot (Systat Software, San Jose, CA, USA),corresponding to an unpaired t-test. If there was a significant difference, an additionalpairwise test was performed using the Holm–Šidák method. The significance level for bothtests was 0.05.
3. Results and Discussion
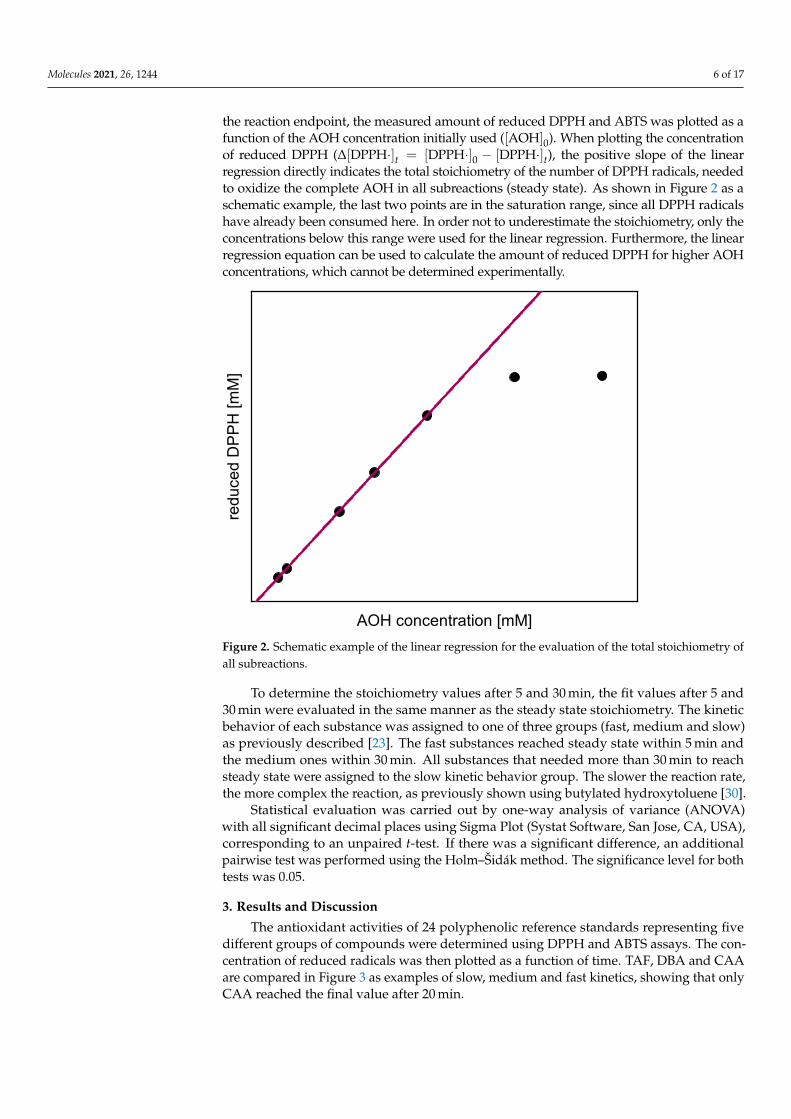
The antioxidant activities of 24 polyphenolic reference standards representing fivedifferent groups of compounds were determined using DPPH and ABTS assays. The con-centration of reduced radicals was then plotted as a function of time. TAF, DBA and CAAare compared in Figure 3 as examples of slow, medium and fast kinetics, showing that onlyCAA reached the final value after 20 min.
Molecules 2021, 26, 1244 7 of 17
0 10 20 30 40 50 600.0
5.0x10⁻³
1.0x10⁻²
1.5x10⁻²
2.0x10⁻²
2.5x10⁻²
3.0x10⁻²
DBA (medium) TAF (slow) CAA (fast)
redu
ced
DPP
H [m
M]
time [min]
Figure 3. Representative fit curves showing the quantity of reduced DPPH radical(∆[DPPH·]t = [DPPH·]0 − [DPPH·]t) in reactions with DBA, CAA and TAF as a function of time,demonstrating different kinetic behaviors.
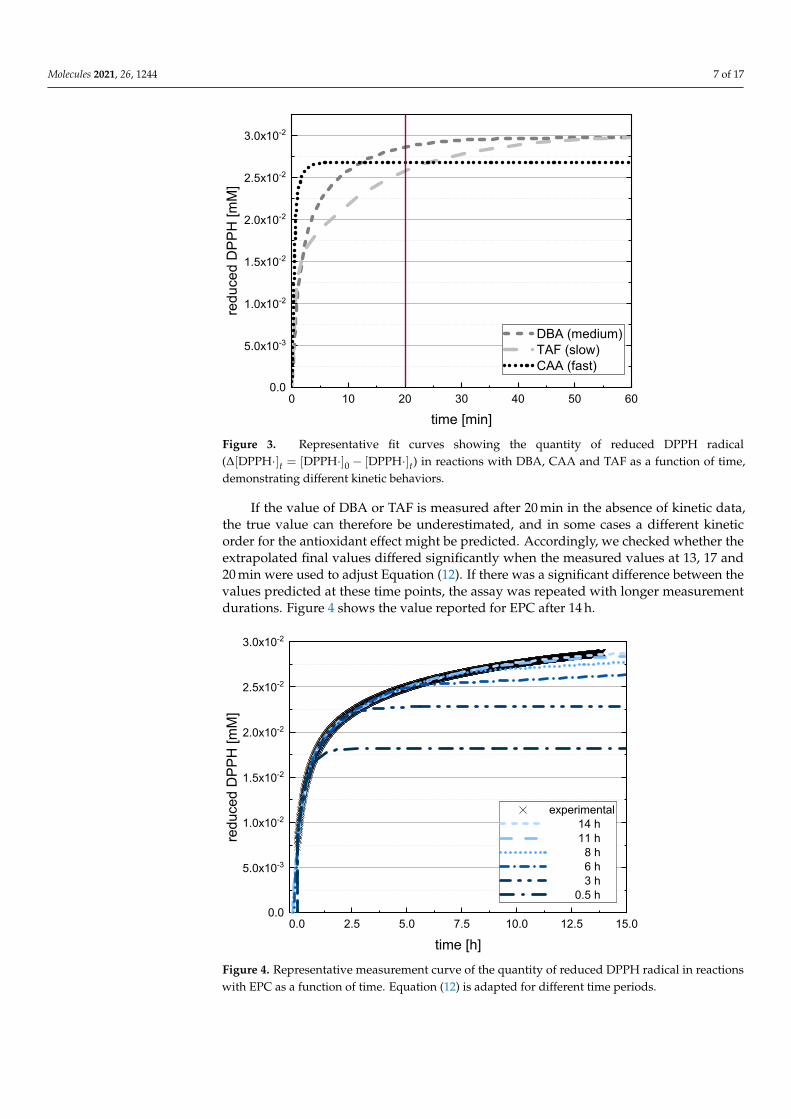
If the value of DBA or TAF is measured after 20 min in the absence of kinetic data,the true value can therefore be underestimated, and in some cases a different kineticorder for the antioxidant effect might be predicted. Accordingly, we checked whether theextrapolated final values differed significantly when the measured values at 13, 17 and20 min were used to adjust Equation (12). If there was a significant difference between thevalues predicted at these time points, the assay was repeated with longer measurementdurations. Figure 4 shows the value reported for EPC after 14 h.
0.0 2.5 5.0 7.5 10.0 12.5 15.00.0
5.0x10⁻³
1.0x10⁻²
1.5x10⁻²
2.0x10⁻²
2.5x10⁻²
3.0x10⁻²
experimental 14 h 11 h 8 h 6 h 3 h 0.5 h
redu
ced
DPP
H [m
M]
time [h]Figure 4. Representative measurement curve of the quantity of reduced DPPH radical in reactionswith EPC as a function of time. Equation (12) is adapted for different time periods.
Molecules 2021, 26, 1244 8 of 17
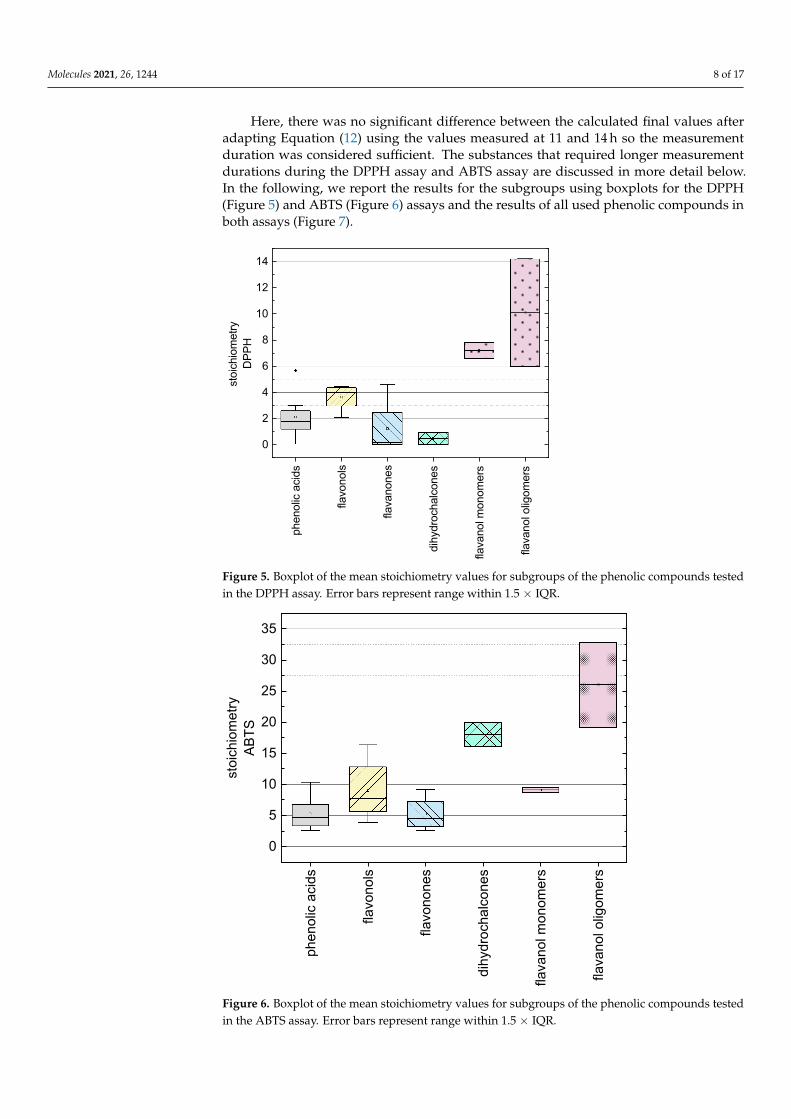
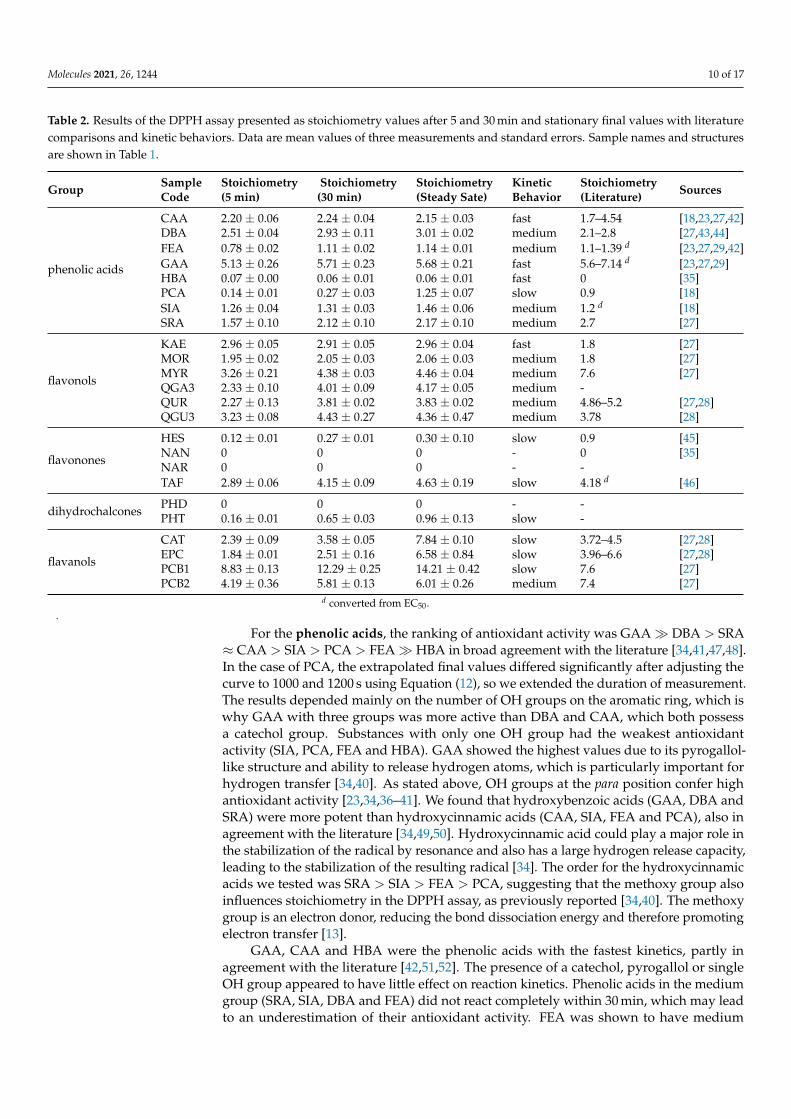
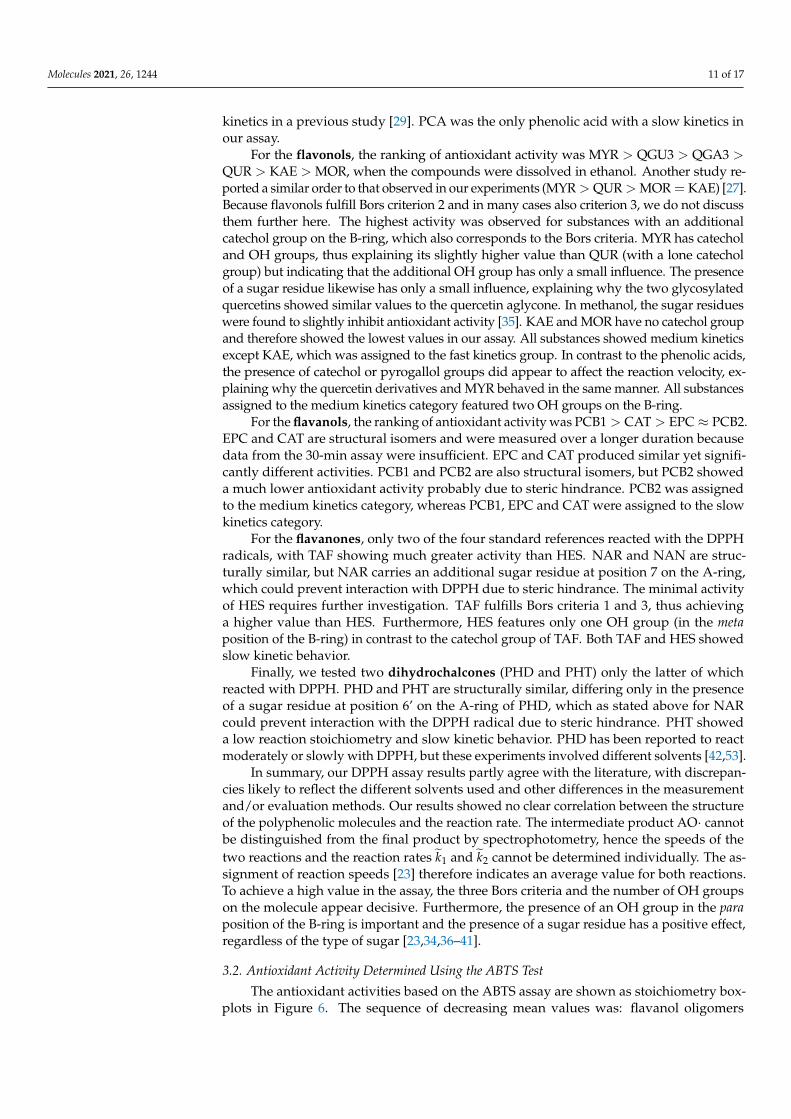
Here, there was no significant difference between the calculated final values afteradapting Equation (12) using the values measured at 11 and 14 h so the measurementduration was considered sufficient. The substances that required longer measurementdurations during the DPPH assay and ABTS assay are discussed in more detail below.In the following, we report the results for the subgroups using boxplots for the DPPH(Figure 5) and ABTS (Figure 6) assays and the results of all used phenolic compounds inboth assays (Figure 7).
phen
olic
aci
ds
flavo
nols
flava
none
s
dihy
droc
halc
ones
flava
nol m
onom
ers
flava
nol o
ligom
ers
0
2
4
6
8
10
12
14
stoi
chio
met
ryD
PPH
Figure 5. Boxplot of the mean stoichiometry values for subgroups of the phenolic compounds testedin the DPPH assay. Error bars represent range within 1.5 × IQR.
phen
olic
aci
ds
flavo
nols
flavo
none
s
dihy
droc
halc
ones
flava
nol m
onom
ers
flava
nol o
ligom
ers
0
5
10
15
20
25
30
35
stoi
chio
met
ryAB
TS
Figure 6. Boxplot of the mean stoichiometry values for subgroups of the phenolic compounds testedin the ABTS assay. Error bars represent range within 1.5 × IQR.
Molecules 2021, 26, 1244 9 of 17
flavanols
stoi
chio
met
ryD
PPH
(a)
(b)
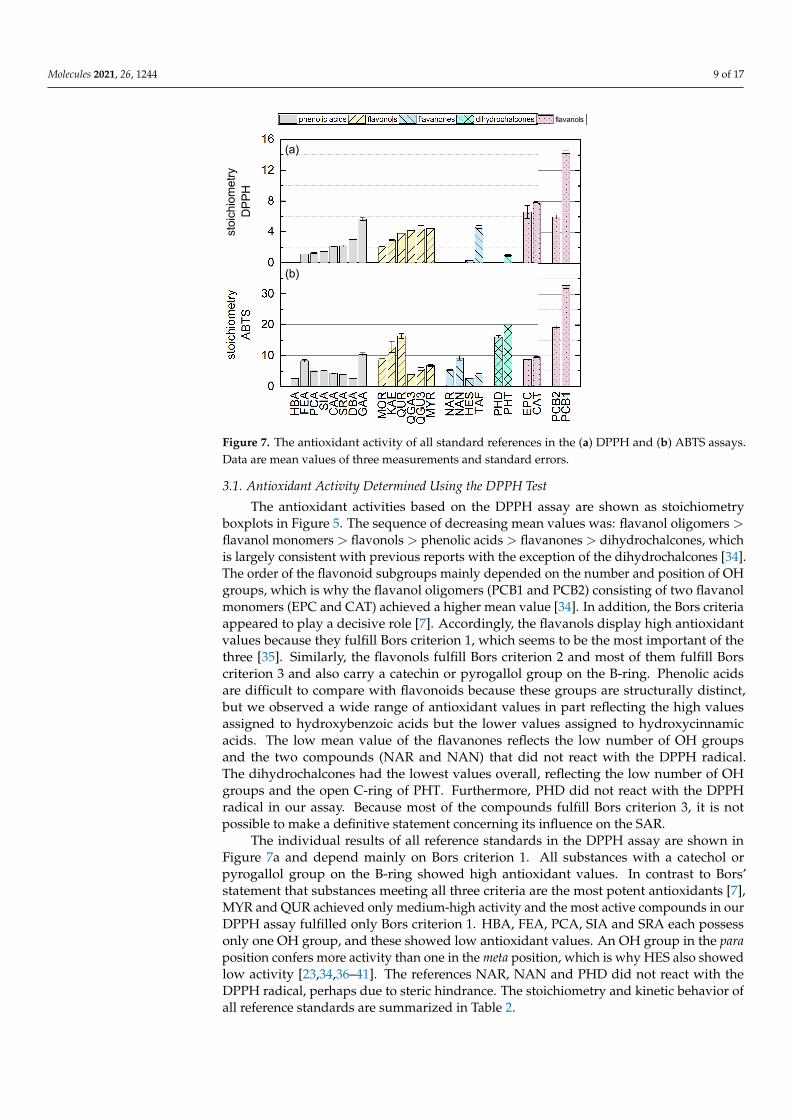
Figure 7. The antioxidant activity of all standard references in the (a) DPPH and (b) ABTS assays.Data are mean values of three measurements and standard errors.
3.1. Antioxidant Activity Determined Using the DPPH Test
The antioxidant activities based on the DPPH assay are shown as stoichiometryboxplots in Figure 5. The sequence of decreasing mean values was: flavanol oligomers >flavanol monomers > flavonols > phenolic acids > flavanones > dihydrochalcones, whichis largely consistent with previous reports with the exception of the dihydrochalcones [34].The order of the flavonoid subgroups mainly depended on the number and position of OHgroups, which is why the flavanol oligomers (PCB1 and PCB2) consisting of two flavanolmonomers (EPC and CAT) achieved a higher mean value [34]. In addition, the Bors criteriaappeared to play a decisive role [7]. Accordingly, the flavanols display high antioxidantvalues because they fulfill Bors criterion 1, which seems to be the most important of thethree [35]. Similarly, the flavonols fulfill Bors criterion 2 and most of them fulfill Borscriterion 3 and also carry a catechin or pyrogallol group on the B-ring. Phenolic acidsare difficult to compare with flavonoids because these groups are structurally distinct,but we observed a wide range of antioxidant values in part reflecting the high valuesassigned to hydroxybenzoic acids but the lower values assigned to hydroxycinnamicacids. The low mean value of the flavanones reflects the low number of OH groupsand the two compounds (NAR and NAN) that did not react with the DPPH radical.The dihydrochalcones had the lowest values overall, reflecting the low number of OHgroups and the open C-ring of PHT. Furthermore, PHD did not react with the DPPHradical in our assay. Because most of the compounds fulfill Bors criterion 3, it is notpossible to make a definitive statement concerning its influence on the SAR.
The individual results of all reference standards in the DPPH assay are shown inFigure 7a and depend mainly on Bors criterion 1. All substances with a catechol orpyrogallol group on the B-ring showed high antioxidant values. In contrast to Bors’statement that substances meeting all three criteria are the most potent antioxidants [7],MYR and QUR achieved only medium-high activity and the most active compounds in ourDPPH assay fulfilled only Bors criterion 1. HBA, FEA, PCA, SIA and SRA each possessonly one OH group, and these showed low antioxidant values. An OH group in the paraposition confers more activity than one in the meta position, which is why HES also showedlow activity [23,34,36–41]. The references NAR, NAN and PHD did not react with theDPPH radical, perhaps due to steric hindrance. The stoichiometry and kinetic behavior ofall reference standards are summarized in Table 2.
Molecules 2021, 26, 1244 10 of 17
Table 2. Results of the DPPH assay presented as stoichiometry values after 5 and 30 min and stationary final values with literaturecomparisons and kinetic behaviors. Data are mean values of three measurements and standard errors. Sample names and structuresare shown in Table 1.
Group Sample Stoichiometry Stoichiometry Stoichiometry Kinetic Stoichiometry SourcesCode (5 min) (30 min) (Steady Sate) Behavior (Literature)
phenolic acids
CAA 2.20 ± 0.06 2.24 ± 0.04 2.15 ± 0.03 fast 1.7–4.54 [18,23,27,42]DBA 2.51 ± 0.04 2.93 ± 0.11 3.01 ± 0.02 medium 2.1–2.8 [27,43,44]FEA 0.78 ± 0.02 1.11 ± 0.02 1.14 ± 0.01 medium 1.1–1.39 d [23,27,29,42]GAA 5.13 ± 0.26 5.71 ± 0.23 5.68 ± 0.21 fast 5.6–7.14 d [23,27,29]HBA 0.07 ± 0.00 0.06 ± 0.01 0.06 ± 0.01 fast 0 [35]PCA 0.14 ± 0.01 0.27 ± 0.03 1.25 ± 0.07 slow 0.9 [18]SIA 1.26 ± 0.04 1.31 ± 0.03 1.46 ± 0.06 medium 1.2 d [18]SRA 1.57 ± 0.10 2.12 ± 0.10 2.17 ± 0.10 medium 2.7 [27]
flavonols
KAE 2.96 ± 0.05 2.91 ± 0.05 2.96 ± 0.04 fast 1.8 [27]MOR 1.95 ± 0.02 2.05 ± 0.03 2.06 ± 0.03 medium 1.8 [27]MYR 3.26 ± 0.21 4.38 ± 0.03 4.46 ± 0.04 medium 7.6 [27]QGA3 2.33 ± 0.10 4.01 ± 0.09 4.17 ± 0.05 medium -QUR 2.27 ± 0.13 3.81 ± 0.02 3.83 ± 0.02 medium 4.86–5.2 [27,28]QGU3 3.23 ± 0.08 4.43 ± 0.27 4.36 ± 0.47 medium 3.78 [28]
flavonones
HES 0.12 ± 0.01 0.27 ± 0.01 0.30 ± 0.10 slow 0.9 [45]NAN 0 0 0 - 0 [35]NAR 0 0 0 - -TAF 2.89 ± 0.06 4.15 ± 0.09 4.63 ± 0.19 slow 4.18 d [46]
dihydrochalcones PHD 0 0 0 - -PHT 0.16 ± 0.01 0.65 ± 0.03 0.96 ± 0.13 slow -
flavanols
CAT 2.39 ± 0.09 3.58 ± 0.05 7.84 ± 0.10 slow 3.72–4.5 [27,28]EPC 1.84 ± 0.01 2.51 ± 0.16 6.58 ± 0.84 slow 3.96–6.6 [27,28]PCB1 8.83 ± 0.13 12.29 ± 0.25 14.21 ± 0.42 slow 7.6 [27]PCB2 4.19 ± 0.36 5.81 ± 0.13 6.01 ± 0.26 medium 7.4 [27]
d converted from EC50..
For the phenolic acids, the ranking of antioxidant activity was GAA� DBA > SRA≈ CAA > SIA > PCA > FEA� HBA in broad agreement with the literature [34,41,47,48].In the case of PCA, the extrapolated final values differed significantly after adjusting thecurve to 1000 and 1200 s using Equation (12), so we extended the duration of measurement.The results depended mainly on the number of OH groups on the aromatic ring, which iswhy GAA with three groups was more active than DBA and CAA, which both possessa catechol group. Substances with only one OH group had the weakest antioxidantactivity (SIA, PCA, FEA and HBA). GAA showed the highest values due to its pyrogallol-like structure and ability to release hydrogen atoms, which is particularly important forhydrogen transfer [34,40]. As stated above, OH groups at the para position confer highantioxidant activity [23,34,36–41]. We found that hydroxybenzoic acids (GAA, DBA andSRA) were more potent than hydroxycinnamic acids (CAA, SIA, FEA and PCA), also inagreement with the literature [34,49,50]. Hydroxycinnamic acid could play a major role inthe stabilization of the radical by resonance and also has a large hydrogen release capacity,leading to the stabilization of the resulting radical [34]. The order for the hydroxycinnamicacids we tested was SRA > SIA > FEA > PCA, suggesting that the methoxy group alsoinfluences stoichiometry in the DPPH assay, as previously reported [34,40]. The methoxygroup is an electron donor, reducing the bond dissociation energy and therefore promotingelectron transfer [13].
GAA, CAA and HBA were the phenolic acids with the fastest kinetics, partly inagreement with the literature [42,51,52]. The presence of a catechol, pyrogallol or singleOH group appeared to have little effect on reaction kinetics. Phenolic acids in the mediumgroup (SRA, SIA, DBA and FEA) did not react completely within 30 min, which may leadto an underestimation of their antioxidant activity. FEA was shown to have medium
Molecules 2021, 26, 1244 11 of 17
kinetics in a previous study [29]. PCA was the only phenolic acid with a slow kinetics inour assay.
For the flavonols, the ranking of antioxidant activity was MYR > QGU3 > QGA3 >QUR > KAE > MOR, when the compounds were dissolved in ethanol. Another study re-ported a similar order to that observed in our experiments (MYR > QUR > MOR = KAE) [27].Because flavonols fulfill Bors criterion 2 and in many cases also criterion 3, we do not discussthem further here. The highest activity was observed for substances with an additionalcatechol group on the B-ring, which also corresponds to the Bors criteria. MYR has catecholand OH groups, thus explaining its slightly higher value than QUR (with a lone catecholgroup) but indicating that the additional OH group has only a small influence. The presenceof a sugar residue likewise has only a small influence, explaining why the two glycosylatedquercetins showed similar values to the quercetin aglycone. In methanol, the sugar residueswere found to slightly inhibit antioxidant activity [35]. KAE and MOR have no catechol groupand therefore showed the lowest values in our assay. All substances showed medium kineticsexcept KAE, which was assigned to the fast kinetics group. In contrast to the phenolic acids,the presence of catechol or pyrogallol groups did appear to affect the reaction velocity, ex-plaining why the quercetin derivatives and MYR behaved in the same manner. All substancesassigned to the medium kinetics category featured two OH groups on the B-ring.
For the flavanols, the ranking of antioxidant activity was PCB1 > CAT > EPC ≈ PCB2.EPC and CAT are structural isomers and were measured over a longer duration becausedata from the 30-min assay were insufficient. EPC and CAT produced similar yet signifi-cantly different activities. PCB1 and PCB2 are also structural isomers, but PCB2 showeda much lower antioxidant activity probably due to steric hindrance. PCB2 was assignedto the medium kinetics category, whereas PCB1, EPC and CAT were assigned to the slowkinetics category.
For the flavanones, only two of the four standard references reacted with the DPPHradicals, with TAF showing much greater activity than HES. NAR and NAN are struc-turally similar, but NAR carries an additional sugar residue at position 7 on the A-ring,which could prevent interaction with DPPH due to steric hindrance. The minimal activityof HES requires further investigation. TAF fulfills Bors criteria 1 and 3, thus achievinga higher value than HES. Furthermore, HES features only one OH group (in the metaposition of the B-ring) in contrast to the catechol group of TAF. Both TAF and HES showedslow kinetic behavior.
Finally, we tested two dihydrochalcones (PHD and PHT) only the latter of whichreacted with DPPH. PHD and PHT are structurally similar, differing only in the presenceof a sugar residue at position 6’ on the A-ring of PHD, which as stated above for NARcould prevent interaction with the DPPH radical due to steric hindrance. PHT showeda low reaction stoichiometry and slow kinetic behavior. PHD has been reported to reactmoderately or slowly with DPPH, but these experiments involved different solvents [42,53].
In summary, our DPPH assay results partly agree with the literature, with discrepan-cies likely to reflect the different solvents used and other differences in the measurementand/or evaluation methods. Our results showed no clear correlation between the structureof the polyphenolic molecules and the reaction rate. The intermediate product AO· cannotbe distinguished from the final product by spectrophotometry, hence the speeds of thetwo reactions and the reaction rates k1 and k2 cannot be determined individually. The as-signment of reaction speeds [23] therefore indicates an average value for both reactions.To achieve a high value in the assay, the three Bors criteria and the number of OH groupson the molecule appear decisive. Furthermore, the presence of an OH group in the paraposition of the B-ring is important and the presence of a sugar residue has a positive effect,regardless of the type of sugar [23,34,36–41].
3.2. Antioxidant Activity Determined Using the ABTS Test
The antioxidant activities based on the ABTS assay are shown as stoichiometry box-plots in Figure 6. The sequence of decreasing mean values was: flavanol oligomers
Molecules 2021, 26, 1244 12 of 17
> dihydrochalcones > flavanol monomers > flavonols > phenolic acids > flavanones,which again is largely consistent with the literature with the exception of the dihydrochal-cones [34]. In general, the number of OH groups seemed to determine the order. The highvalues of dihydrochalcones may reflect the lower steric hindrance of their relatively openstructures. When comparing all 24 substances regardless of their subgroup, there wereno conspicuous structural features that explained the ranking [37]. The stoichiometryand kinetic behavior of all the reference standards are shown in Table 3. However, ABTSresults from literature are not shown because they are usually provided as TEAC values,which correlate poorly with the reaction kinetics [54]. The individual results of all referencestandards in the ABTS assay are shown in Figure 7b.
For the phenolic acids, the ranking of antioxidant activity was GAA� FEA > SIA≈ PCA > CAA > SRA > DBA ≈ HBA. GAA achieved the highest value due to thepyrogallol group on the aromatic ring. However, the presence of a single OH or catecholgroup appeared to be less important, explaining the similar values of HBA vs DBA andCAA vs PCA, all lower than GAA. Furthermore, the hydroxybenzoic acids appearedmore active than the hydroxycinnamic acids, the exception being the benzoic acid GAA,which achieved the highest value. The presence of a methoxy group also affected theactivity, explaining why SRA, SIA and FEA achieved higher values than HBA and PCA.FEA, which has two methoxy groups, achieved a higher value than SIA with only one.CAA, FEA, GAA and SIA were assigned to the medium kinetics category, whereas all theothers showed fast kinetics. There was no clear correlation between the reaction velocityand chemical structure, and the type of acid group appeared to have no influence on thevelocity of the reaction.
Table 3. Results of the ABTS assay presented as stoichiometry values after 5 and 30 min and stationary final values andkinetic behaviors. Data are mean values of three measurements and standard errors. Sample names and structures areshown in Table 1.
Group Sample Code Stoichiometry (5 min) Stoichiometry (30 min) Stoichiometry (Steady Sate) Kinetic Behavior
phenolic acids
CAA 3.93 ± 0.14 4.35 ± 0.10 4.31 ± 0.13 mediumDBA 2.60 ± 0.06 2.61 ± 0.06 2.66 ± 0.04 fastFEA 6.14 ± 0.25 8.46 ± 0.41 8.34 ± 0.37 mediumGAA 8.47 ± 0.35 10.77 ± 0.50 10.38 ± 0.54 mediumHBA 2.60 ± 0.02 2.59 ± 0.02 2.61 ± 0.02 fastPCA 4.58 ± 0.38 5.17 ± 0.23 4.95 ± 0.16 fastSIA 4.21 ± 0.06 5.04 ± 0.08 5.07 ± 0.08 mediumSRA 3.98 ± 0.06 4.21 ± 0.05 3.96 ± 0.08 fast
flavonols
KAE 3.89 ± 0.46 5.33 ± 0.74 12.81 ± 1.82 slowMOR 8.64 ± 0.36 8.96 ± 0.50 7.45 ± 0.34 mediumMYR 6.09 ± 0.16 6.86 ± 0.22 6.78 ± 0.18 mediumQGA3 2.79 ± 0.09 3.69 ± 0.18 3.88 ± 0.20 mediumQGU3 4.29 ± 0.19 5.84 ± 0.39 5.64 ± 0.43 mediumQUR 9.67 ± 0.82 11.38 ± 0.28 12.42 ± 0.64 slow
flavonones
HES 2.93 ± 0.16 3.11 ± 0.11 2.66 ± 0.09 fastNAN 2.68 ± 0.21 4.63 ± 0.44 9.17 ± 0.69 slowNAR 0.69 ± 0.22 2.28 ± 0.34 5.39 ± 0.14 slowTAF 3.14 ± 0.12 3.76 ± 0.39 3.76 ± 0.43 fast
dihydrochalcones PHD 5.20 ± 0.07 9.08 ± 0.06 16.05 ± 0.40 slowPHT 6.50 ± 0.29 12.56 ± 0.50 19.90 ± 0.96 slow
flavanols
CAT 9.30 ± 0.18 10.00 ± 0.26 9.47 ± 0.18 mediumEPC 8.16 ± 0.05 8.78 ± 0.14 8.74 ± 0.12 mediumPCB1 26.57 ± 0.41 31.48 ± 0.52 32.87 ± 1.06 mediumPCB2 15.22 ± 0.23 18.61 ± 0.45 19.19 ± 0.50 medium
For the flavonols, the ranking of antioxidant activity was QUR > KAE > MOR >MYR > QGU3 > QGA3. As discussed for the phenolic acids, the activity of the flavonolsdoes not appear to depend on the presence of the catechol group, which is why QUR and
Molecules 2021, 26, 1244 13 of 17
KAE reached similar values. Additional OH groups had a negative impact, hence MYRachieved a much lower value than QUR, possibly caused by steric hindrance. Furthermore,the presence of any sugar residue also caused a negative impact. A second OH groupon the B-ring only influenced the activity if it formed a catechol group, which is whyMOR did not show a higher value than KAE. The flavonol standard references showedmedium kinetics, except QUR and KAE, which were assigned to the slow kinetics category.For these two substances, it was necessary to repeat the measurement with an extendedduration, although it is unclear which chemical groups were responsible for the effect.There may be steric hindrance in some molecules, for example due to the presence of asugar residue or a pyrogallol group.
For the flavanols, the ranking of antioxidant activity was PCB1 > PCB2 > EPC ≈ CAT.As stated above, EPC and CAT are structural isomers and so are PCB1 and PCB2. PCB2consists of two EPC molecules and thus has twice the number of catechol and OH groups,explaining its higher activity than EPC/CAT. PCB1 achieved the highest value overall,suggesting that PCB2 again suffers from a steric hindrance effect. All standard referencesshowed medium kinetic behavior, which was expected due to the structural similarity ofthe molecules.
For the flavanones, the ranking of antioxidant activity was NAN > NAR > TAF > HES.The order appeared to depend mainly on the position of the OH group in the B-ring. HES,with its meta OH group, showed the lowest activity, whereas the more active TAF, NARand NAN all have an OH group in the para position [23,34,36–41]. The presence of a sugarresidue appeared to inhibit antioxidant activity, hence the lower value of NAR comparedto NAN. TAF achieved a higher value than NAN because it fulfills the second and thirdBors criteria. NAR and NAN were assigned to the slow kinetics category requiring a longerduration of measurement, whereas TAF and HES showed fast kinetics.
Finally, we found that both dihydrochalcones (PHD and PHT) were active in theABTS assay, although PHT was more active than PHD. The only difference between thesecompounds is the presence of a sugar residue on the A-ring of PHD, which appears toexert a negative influence on antioxidant activity. Both PHD and PHT showed slow kineticbehavior and were analyzed by extending the measurement duration.
In summary, it was not possible to compare the sequences of all substances becausedifferent trends were observed within each group, hence no SAR and no clear correlationbetween molecular structure and reaction rate in the assay could be established. The precisestructural properties that are important in the ABTS assay could not be determined, and theBors criteria seem to play a minor role. The kinetic behavior of the reaction reflects thecomplexity of the reactant, with large polyphenolic molecules reacting more slowly thansimpler ones because the former must reorient before reaction with the ABTS radical.However, substances that show fast kinetics can also have low antioxidant capacities,and substances that show a high stoichiometry with the ABTS radical do not necessarilyachieve high reactivity [54].
3.3. Comparison of the DPPH and ABTS Assays
When comparing the boxplots (Figures 5 and 6), the mean values of the polyphenolsubgroups, with the exception of the dihydrochalcones, revealed similar trends in bothassays. The subgroup of the dihydrochalcones showed radically different mean values,reflecting the fact that one of the two tested compounds did not react with the DPPH radical.
We observed no clear correlation when comparing the results of the individual sub-stances in the two assays, suggesting that antioxidant activity is dependent on multiplecriteria (Figure 7).
Results in the DPPH assay appeared to depend mainly on the number of OH groupsand Bors criteria 1 and 3, but further investigation is required because most of the standardreference compounds we used conformed at least to Bors criterion 3. In contrast, there wasno clear relationship between the results in the ABTS assay and the number of OH groups,and the Bors criteria were much less important.
Molecules 2021, 26, 1244 14 of 17
For the phenolic acids, the hydroxycinnamic acids achieved higher values than thehydroxybenzoic acids in the ABTS assay, whereas this was not the case in the DPPH assay.Furthermore, compounds with an additional methoxy group showed higher activities inboth assays. However, compounds with both OH and methoxy groups achieved highervalues than those with a catechol group in the ABTS assay but not in the DPPH assay.For the DPPH assay, activity was mainly dependent on the number of OH groups and thepresence of catechol or pyrogallol groups.
For the flavonols, the first Bors criterion was important in both assays. An additionalOH group on the B-ring increased the activity in the DPPH assay but not the ABTS assay.The presence of a sugar residue conferred a slightly negative effect in the ABTS assaybut had no significant impact on the DPPH assay. The presence of an OH group at position2 did not affect the results of either assay.
For the flavanones, the presence of an OH group at position 3 in the C-ring had amajor effect on the results of the DPPH assay, and the presence of a sugar residue tendedto abolish the reaction. The para position of an OH group in the B-ring appeared to play animportant role in both assays.
Among the four flavanols we tested, PCB1 achieved high values in both assays,perhaps due to the high number of catechol and OH groups. In contrast, PCB2 showedhigh activity only in the ABTS assay, suggesting steric hindrance may inhibit its activityin the DPPH assay. CAT and EPC are structural isomers that do not seem prone to sterichindrance, thus the differences between these compounds were small in both assays.
Finally, although we tested only two dihydrochalcones, making it difficult to drawgeneral conclusions for this group of molecules, it appears that the sugar residue on PHDhad a negative impact on activity, and this aspect could be explored by testing morediverse compounds.
4. Conclusions
The mean values of most of the polyphenol subgroups revealed similar trends inboth assays. The dihydrochalcones were the only compounds to show radically differentmean values, reflecting the fact that we tested only two compounds and one of them didnot react with the DPPH radical. Therefore, dihydrochalcone-rich extracts should notbe measured using the DPPH assay because this underestimates the antioxidant activity.The same caveat applies to the flavanones. If these substances are divided into subgroups,the assays reported different results despite the identical measurement and evaluationmethods. In general, the results of the DPPH assay correlated mainly with the Bors criteria,whereas the SAR was not clear in the ABTS assay. This may be due the type of solvent,which was not possible to be the same in the two assays. Furthermore, the DPPH andABTS model radicals are structurally distinct. In terms of kinetic behavior, we observedno clear correlation between structure and reaction velocity. However, to ensure thatendpoint values are reported, the duration of measurement should be at least 30 min andEquation (12) should be used to calculate the final values, thus avoiding measurementtimes of several hours. This also ensures that the measurement duration can be extendedif necessary. Additionally, the potential synergistic effects of pure substances should betaken into account when measuring the reaction kinetics of extracts containing mixturesof substances that react at different speeds. In order to use these assays as rapid testsfor specific applications, they must be matched to the antioxidant effect required in theapplication medium (e.g., food matrix or body tissue). Other relevant parameters suchas pH, solvent, and the content of carbohydrate and protein should also be considered,because these may affect the reported activity of natural extracts.
Author Contributions: Conceptualization, M.P. and S.K.; methodology, M.P., S.K. and O.M.; valida-tion, M.P.; formal analysis, M.P.; investigation, M.P.; resources, S.K. and T.H.; data curation, M.P.;writing—original draft preparation, M.P.; writing—review and editing, S.K., T.H., U.S.-W., O.M.and P.E.; visualization, M.P. and S.K.; supervision, S.K., T.H., U.S.-W. and P.E.; funding acquisition,S.K.and T.H. All authors have read and agreed to the published version of the manuscript.
Molecules 2021, 26, 1244 15 of 17
Funding: This research was partly funded by the German Federal Ministry of Education and Research(grant numbers: 031B0387A and 031B0360A).
Institutional Review Board Statement: Not applicable.
Informed Consent Statement: Not applicable.
Data Availability Statement: Data of the measurement results are available from the authors.
Acknowledgments: The authors thank Veronika Wildgruber and Adrian Knoll for their assistance inanalytical work.
Conflicts of Interest: The authors declare no conflict of interest. The funders had no role in the designof the study; in the collection, analyses, or interpretation of data; in the writing of the manuscript,or in the decision to publish the results.
AbbreviationsThe following abbreviations are used in this manuscript:
ABTS 2,2′-azino-bis (3-ethylbenzothiazoline-6-sulfonic acid)AOH antioxidantARP antiradical powerCAA caffeic acidCAT (+)-catechinDBA 3,4-dihydroxybenzoic acidDPPH 2,2-diphenyl-1-picrylhydrazylEC50 half maximal effective concentrationEPC (−)-epicatechinFEA ferulic acidGAA gallic acidHAT hydrogen atom transferHBA 4-hydroxybenzoic acidHES hesperetinKAE kaempferolMOR morinMYR myricetinNAN naringeninNAR narirutinORAC oxygen radical absorbance capacityPCA p-coumaric acidPCB1 proanthocyanidin B1
PCB2 proanthocyanidin B2PHD phloridzinPHT phloretinQGA3 quercetin-3-D-galactosidesQGU3 quercetin-3-D-glucosidesQUR quercetinSAR structure-activity relationshipSET single electron transferSET-PT single electron transfer followed by a proton transferSIA sinapic acidSPLET sequential proton loss electron transferSRA siringic acidTAF taxifolinTEAC trolox equivalent antioxidant capacity
Molecules 2021, 26, 1244 16 of 17
References1. Zheng, W.; Wang, S.Y. Antioxidant activity and phenolic compounds in selected herbs. J. Agric. Food Chem. 2001, 49, 5165–5170.
[CrossRef] [PubMed]2. Shahidi, F.; Zhong, H.J.; Ambigaipalan, P. Antioxidants: Regulatory status. In Bailey’s Industrial Oil and Fat Products; John Wiley &
Sons, Ltd.: London, UK, 2005; pp. 1–21.3. Huang, D.; Ou, B.; Prior, R.L. The chemistry behind antioxidant capacity assays. J. Agric. Food Chem. 2005, 53, 1841–1856.
[CrossRef] [PubMed]4. Wright, J.S.; Johnson, E.R.; DiLabio, G.A. Predicting the activity of phenolic antioxidants: Theoretical method, analysis of
substituent effects, and application to major families of antioxidants. J. Am. Chem. Soc. 2001, 123, 1173–1183. [CrossRef]5. Visioli, F.; Galli, C. Olive oil phenols and their potential effects on human health. J. Agric. Food Chem. 1998, 46, 4292–4296.
[CrossRef]6. D Archivio, M.; Filesi, C.; Di Benedetto, R.; Gargiulo, R.; Giovannini, C.; Masella, R. Polyphenols, dietary sources and
bioavailability. Ann. Ist. Super. Di Sanita 2007, 43, 348.7. Bors, W.; Heller, W.; Michel, C.; Saran, M. Radical Chemistry of Flavonoid Antioxidants. In Antioxidants in Therapy and Preventive
Medicine; Emerit, I., Packer, L., Auclair, C., Eds.; Springer: Boston, MA, USA, 1990; pp. 165–170. [CrossRef]8. Van Acker, S.A.; Van Den Berg, D.J.; Tromp, M.N.; Griffioen, D.H.; Van Bennekom, W.P.; Van Der Vijgh, W.J.; Bast, A. Structural
aspects of antioxidant activity of flavonoids. Free Radic. Biol. Med. 1996, 20, 331–342. [CrossRef]9. Wolfe, K.L.; Liu, R.H. Structure- activity relationships of flavonoids in the cellular antioxidant activity assay. J. Agric. Food Chem.
2008, 56, 8404–8411. [CrossRef] [PubMed]10. Prior, R.L.; Cao, G. Analysis of botanicals and dietary supplements for antioxidant capacity: A review. J. AOAC Int. 2000,
83, 950–956. [CrossRef] [PubMed]11. Re, R.; Pellegrini, N.; Proteggente, A.; Pannala, A.; Yang, M.; Rice-Evans, C. Antioxidant activity applying an improved ABTS
radical cation decolorization assay. Free Radic. Biol. Med. 1999, 26, 1231–1237. [CrossRef]12. Sánchez-Moreno, C. Methods used to evaluate the free radical scavenging activity in foods and biological systems. Food Sci.
Technol. Int. 2002, 8, 121–137. [CrossRef]13. Shang, Y.J.; Qian, Y.P.; Liu, X.D.; Dai, F.; Shang, X.L.; Jia, W.Q.; Liu, Q.; Fang, J.G.; Zhou, B. Radical-scavenging activity and
mechanism of resveratrol-oriented analogues: Influence of the solvent, radical, and substitution. J. Org. Chem. 2009, 74, 5025–5031.[CrossRef]
14. Zou, T.B.; He, T.P.; Li, H.B.; Tang, H.W.; Xia, E.Q. The structure-activity relationship of the antioxidant peptides from naturalproteins. Molecules 2016, 21, 72. [CrossRef] [PubMed]
15. Di Meo, F.; Lemaur, V.; Cornil, J.; Lazzaroni, R.; Duroux, J.L.; Olivier, Y.; Trouillas, P. Free radical scavenging by naturalpolyphenols: Atom versus electron transfer. J. Phys. Chem. A 2013, 117, 2082–2092. [CrossRef] [PubMed]
16. Lemanska, K.; Szymusiak, H.; Tyrakowska, B.; Zielinski, R.; Soffers, A.E.; Rietjens, I.M. The influence of pH on antioxidantproperties and the mechanism of antioxidant action of hydroxyflavones. Free Radic. Biol. Med. 2001, 31, 869–881. [CrossRef]
17. Benzie, I.F.; Strain, J. [2] Ferric reducing/antioxidant power assay: Direct measure of total antioxidant activity of biological fluidsand modified version for simultaneous measurement of total antioxidant power and ascorbic acid concentration. Methods Enzymol.1999, 299, 15–27.
18. Foti, M.C.; Daquino, C.; Geraci, C. Electron-transfer reaction of cinnamic acids and their methyl esters with the DPPH• radical inalcoholic solutions. J. Org. Chem. 2004, 69, 2309–2314. [CrossRef] [PubMed]
19. Xiao, Z.; Wang, Y.; Wang, J.; Li, P.; Ma, F. Structure-antioxidant capacity relationship of dihydrochalcone compounds in Malus.Food Chem. 2019, 275, 354–360. [CrossRef]
20. Zheng, Y.Z.; Deng, G.; Liang, Q.; Chen, D.F.; Guo, R.; Lai, R.C. Antioxidant activity of quercetin and its glucosides from propolis:A theoretical study. Sci. Rep. 2017, 7, 7543. [CrossRef] [PubMed]
21. Wang, G.; Xue, Y.; An, L.; Zheng, Y.; Dou, Y.; Zhang, L.; Liu, Y. Theoretical study on the structural and antioxidant properties ofsome recently synthesised 2, 4, 5-trimethoxy chalcones. Food Chem. 2015, 171, 89–97. [CrossRef] [PubMed]
22. Xue, Y.; Zheng, Y.; Zhang, L.; Wu, W.; Yu, D.; Liu, Y. Theoretical study on the antioxidant properties of 2’-hydroxychalcones:H-atom vs. electron transfer mechanism. J. Mol. Model. 2013, 19, 3851–3862. [CrossRef] [PubMed]
23. Brand-Williams, W.; Cuvelier, M.E.; Berset, C. Use of a free radical method to evaluate antioxidant activity. LWT-Food Sci. Technol.1995, 28, 25–30. [CrossRef]
24. Sánchez-Moreno, C.; Larrauri, J.A.; Saura-Calixto, F. A procedure to measure the antiradical efficiency of polyphenols. J. Sci.Food Agric. 1998, 76, 270–276. [CrossRef]
25. Litwinienko, G.; Ingold, K. Abnormal solvent effects on hydrogen atom abstractions. 1. The reactions of phenols with 2,2-diphenyl-1-picrylhydrazyl (dpph•) in alcohols. J. Org. Chem. 2003, 68, 3433–3438. [CrossRef] [PubMed]
26. Bibi Sadeer, N.; Montesano, D.; Albrizio, S.; Zengin, G.; Mahomoodally, M.F. The versatility of antioxidant assays in food scienceand safety—Chemistry, applications, strengths, and limitations. Antioxidants 2020, 9, 709. [CrossRef] [PubMed]
27. Villaño, D.; Fernández-Pachón, M.; Moyá, M.L.; Troncoso, A.; García-Parrilla, M. Radical scavenging ability of polyphenoliccompounds towards DPPH free radical. Talanta 2007, 71, 230–235. [CrossRef]
28. Goupy, P.; Dufour, C.; Loonis, M.; Dangles, O. Quantitative kinetic analysis of hydrogen transfer reactions from dietarypolyphenols to the DPPH radical. J. Agric. Food Chem. 2003, 51, 615–622. [CrossRef] [PubMed]
Molecules 2021, 26, 1244 17 of 17
29. Mishra, K.; Ojha, H.; Chaudhury, N.K. Estimation of antiradical properties of antioxidants using DPPH assay: A critical reviewand results. Food Chem. 2012, 130, 1036–1043. [CrossRef]
30. Bondet, V.; Brand-Williams, W.; Berset, C. Kinetics and mechanisms of antioxidant activity using the DPPH. free radical method.LWT Food Sci. Technol. 1997, 30, 609–615. [CrossRef]
31. Musa, K.H.; Abdullah, A.; Al-Haiqi, A. Determination of DPPH free radical scavenging activity: Application of artificial neuralnetworks. Food Chem. 2016, 194, 705–711. [CrossRef]
32. Tabart, J.; Kevers, C.; Pincemail, J.; Defraigne, J.O.; Dommes, J. Comparative antioxidant capacities of phenolic compoundsmeasured by various tests. Food Chem. 2009, 113, 1226–1233. [CrossRef]
33. Atkins, P.W.; De Paula, J. Chapter 22 The rates of chemical reactions. In Physical Chemistry, 8th ed.; Oxford University Press:Oxford, UK, 2006; p. 797.
34. Cai, Y.Z.; Sun, M.; Xing, J.; Luo, Q.; Corke, H. Structure–radical scavenging activity relationships of phenolic compounds fromtraditional Chinese medicinal plants. Life Sci. 2006, 78, 2872–2888. [CrossRef]
35. Csepregi, K.; Neugart, S.; Schreiner, M.; Hideg, É. Comparative evaluation of total antioxidant capacities of plant polyphenols.Molecules 2016, 21, 208. [CrossRef]
36. Bendary, E.; Francis, R.; Ali, H.; Sarwat, M.; El Hady, S. Antioxidant and structure–activity relationships (SARs) of some phenolicand anilines compounds. Ann. Agric. Sci. 2013, 58, 173–181. [CrossRef]
37. Alcalde, B.; Granados, M.; Saurina, J. Exploring the antioxidant features of polyphenols by spectroscopic and electrochemicalmethods. Antioxidants 2019, 8, 523. [CrossRef] [PubMed]
38. Apak, R.; Güçlü, K.; Demirata, B.; Özyürek, M.; Çelik, S.E.; Bektasoglu, B.; Berker, K.I.; Özyurt, D. Comparative evaluation ofvarious total antioxidant capacity assays applied to phenolic compounds with the CUPRAC assay. Molecules 2007, 12, 1496–1547.[CrossRef] [PubMed]
39. Ma, X.; Li, H.; Dong, J.; Qian, W. Determination of hydrogen peroxide scavenging activity of phenolic acids by employing goldnanoshells precursor composites as nanoprobes. Food Chem. 2011, 126, 698–704. [CrossRef]
40. Jing, P.; Zhao, S.J.; Jian, W.J.; Qian, B.J.; Dong, Y.; Pang, J. Quantitative studies on structure-DPPH• scavenging activityrelationships of food phenolic acids. Molecules 2012, 17, 12910–12924. [CrossRef]
41. Velkov, Z.A.; Kolev, M.K.; Tadjer, A.V. Modeling and statistical analysis of DPPH scavenging activity of phenolics.Collect. Czechoslov. Chem. Commun. 2007, 72, 1461–1471. [CrossRef]
42. Bandoniene, D.; Murkovic, M.; Pfannhauser, W.; Venskutonis, P.; Gruzdiene, D. Detection and activity evaluation of radicalscavenging compounds by using DPPH free radical and on-line HPLC-DPPH methods. Eur. Food Res. Technol. 2002, 214, 143–147.[CrossRef]
43. Ordoudi, S.A.; Tsimidou, M.Z.; Vafiadis, A.P.; Bakalbassis, E.G. Structure- DPPH• scavenging activity relationships: Parallelstudy of catechol and guaiacol acid derivatives. J. Agric. Food Chem. 2006, 54, 5763–5768. [CrossRef] [PubMed]
44. Kwek, S.; Leong, L.; Bettens, R. Effects of Different Functional Group on Antioxidant Activity; Department of Chemistry, Faculty ofScience, National University of Singapore: Singapore, 2003.
45. Hirata, A.; Murakami, Y.; Shoji, M.; Kadoma, Y.; Fujisawa, S. Kinetics of radical-scavenging activity of hesperetin and hesperidinand their inhibitory activity on COX-2 expression. Anticancer Res. 2005, 25, 3367–3374. [PubMed]
46. Tsimogiannis, D.I.; Oreopoulou, V. The contribution of flavonoid C-ring on the DPPH free radical scavenging efficiency. A kineticapproach for the 3′, 4′-hydroxy substituted members. Innov. Food Sci. Emerg. Technol. 2006, 7, 140–146. [CrossRef]
47. Zhou, K.; Yin, J.J.; Yu, L.L. ESR determination of the reactions between selected phenolic acids and free radicals or transitionmetals. Food Chem. 2006, 95, 446–457. [CrossRef]
48. Terpinc, P.; Abramovic, H. A kinetic approach for evaluation of the antioxidant activity of selected phenolic acids. Food Chem.2010, 121, 366–371. [CrossRef]
49. Rice-Evans, C.A.; Miller, N.J.; Paganga, G. Structure-antioxidant activity relationships of flavonoids and phenolic acids. Free Radic.Biol. Med. 1996, 20, 933–956. [CrossRef]
50. Natella, F.; Nardini, M.; Di Felice, M.; Scaccini, C. Benzoic and cinnamic acid derivatives as antioxidants: Structure-activityrelation. J. Agric. Food Chem. 1999, 47, 1453–1459. [CrossRef]
51. Nenadis, N.; Tsimidou, M. Observations on the estimation of scavenging activity of phenolic compounds using rapid 1,1-diphenyl-2-picrylhydrazyl (DPPH•) tests. J. Am. Oil Chem. Soc. 2002, 79, 1191. [CrossRef]
52. Jabbari, M.; Jabbari, A. Antioxidant potential and DPPH radical scavenging kinetics of water-insoluble flavonoid naringenin inaqueous solution of micelles. Colloids Surfaces A Physicochem. Eng. Asp. 2016, 489, 392–399. [CrossRef]
53. Lu, Y.; Foo, L.Y. Antioxidant and radical scavenging activities of polyphenols from apple pomace. Food Chem. 2000, 68, 81–85.[CrossRef]
54. Tian, X.; Schaich, K. Effects of molecular structure on kinetics and dynamics of the trolox equivalent antioxidant capacity assaywith ABTS+•. J. Agric. Food Chem. 2013, 61, 5511–5519. [CrossRef] [PubMed]