Embed Size (px)
Citation preview
Overview Preface 2Snapshot 3Tracking changes 4
Population Aboriginal population and growth 5Life stages 6Age profile 7Population Indicators 8
Households Household types and sizes 9Household Indicators 10Types of housing 11Housing costs and tenure 12Housing Indicators 13Internet @ home 14
Incomes Personal income 15Household income 16Income Indicators 17Employment 18Workforce Gap Indicators 19
Education Education participation by age 20Current education 21Education Attendance Indicators 22Schooling levels 23Education Achievement Indicators 24Tertiary qualifications 25Higher Education Indicators 26
Disability Disability levels 27Disability care given 28Disability Indicators 29
Community Portrait:
Narrabri LGAA portrait of the Aboriginal community of Narrabri, compared with NSW, from
the 2016 and earlier Censuses.
Contents
Narrabri is the Local Government Area of Narrabri at the 2016 Census.
Prepared for Aboriginal Affairs NSW
Community Portrait: Narrabri LGA page 1
Indigenous Portrait2016D Narrabri.xlsx Version D of 17 November 2017
The copyright in all Census data is held by the Australian Bureau of Statistics (ABS) for the Commonwealth
of Australia. The copyright in the design, text and software code used in this product, called a Portrait, is held
by The Public Practice Pty Ltd, ABN 003 052 140.
The data for this report are drawn from the Aboriginal and Torres Strait Islander
Peoples (Indigenous) Profiles and Community Profiles published by the ABS from the
2006, 2011 and 2016 Censuses. Data in this portrait for 2011 and 2006 censuses have
been produced using the 2016 boundary regardless of changes to previous LGA or
other geographical classifications over time.
Preface
Who is included?
Who are Aboriginal?
Sources of data
National trends
This report uses data from the Census, held every five years by the Australian Bureau of Statistics (ABS), to paint a profile of the Aboriginal population of Narrabri as it was in August 2016, and show how it had changed over the previous decade.
Are all Aboriginal people counted?
While care has been taken to ensure that this Portrait accurately transcribes and reports on data loaded from
the Australian Bureau of Statistics website, neither The Public Practice nor the Australian Bureau of
Statistics, nor any publisher or distributor of this Portrait, in whatever format, gives any guarantee that this
report is accurate and correct in every detail. Before making important decisions, you are advised to check
the data and calculations yourself using original data sources.
Copyright and disclaimer
Language in this report
Where it is used in this Portrait, the term 'Aboriginal' is used to describe the many
nations, language groups and clans in Narrabri, including those from the Torres Strait.
This usage recognises that Aboriginal people are the original inhabitants of NSW.
The people described in this Portrait were the usual residents of Narrabri in 2016, even
if they completed the Census away from home. People who were visiting Narrabri on
Census night are not included.
Aboriginal people, in this Portrait, means all people who, in completing the Census,
responded that they had Aboriginal or Torres Strait Islander origins, or both. Non-
Aboriginal people are those who said they did not have these origins. Note: the Census
question asks people about their origins; it does not ask how they identify in their daily
lives.
Not all Aboriginal people completed the Census and identified their origins: 12.2% of
Narrabri's Census respondents said they had Aboriginal origins, but another 10.6% did
not answer this question.
The ABS estimates that the net undercount rate for Aboriginal and Torres Strait Islander
peoples was 17.5% in 2016 (equivalent to 137,750 persons nationally). This is slightly
higher than 2011 (17.2%). This means that, on average, the Aboriginal population was
about a fifth larger than counted. However, despite such omissions, the Census is a
vital source of information about Aboriginal Australians.
Nationally, the number of people with Aboriginal origins counted in the Census rose by
a fifth (21%) between 2011 and 2016. Almost three-quarters of the increase was from
births; the rest was caused by more people identifying Aboriginal origins than
previously.
Note: difference and changes shown in this Portrait are rounded to the nearest
significant figure but are calculated from the unrounded data, so small anomalies are
possible when comparing differences. Small Census counts are randomised by the
ABS to protect privacy so are not precise; in this Portrait, numbers less than 5 are
reported as 'a few'.
Community Portrait: Narrabri LGA page 2
�
¤
¤
�
¤¤
�
¤¤¤
�
¤
�
¤�
¤
�
¤
¤
¤
�
¤
¤
�
37% of Aboriginal adults had some type of post-school qualification, compared with 59% of non-
Aboriginal adults in the LGA (2% had a degree or higher, compared with 25%).
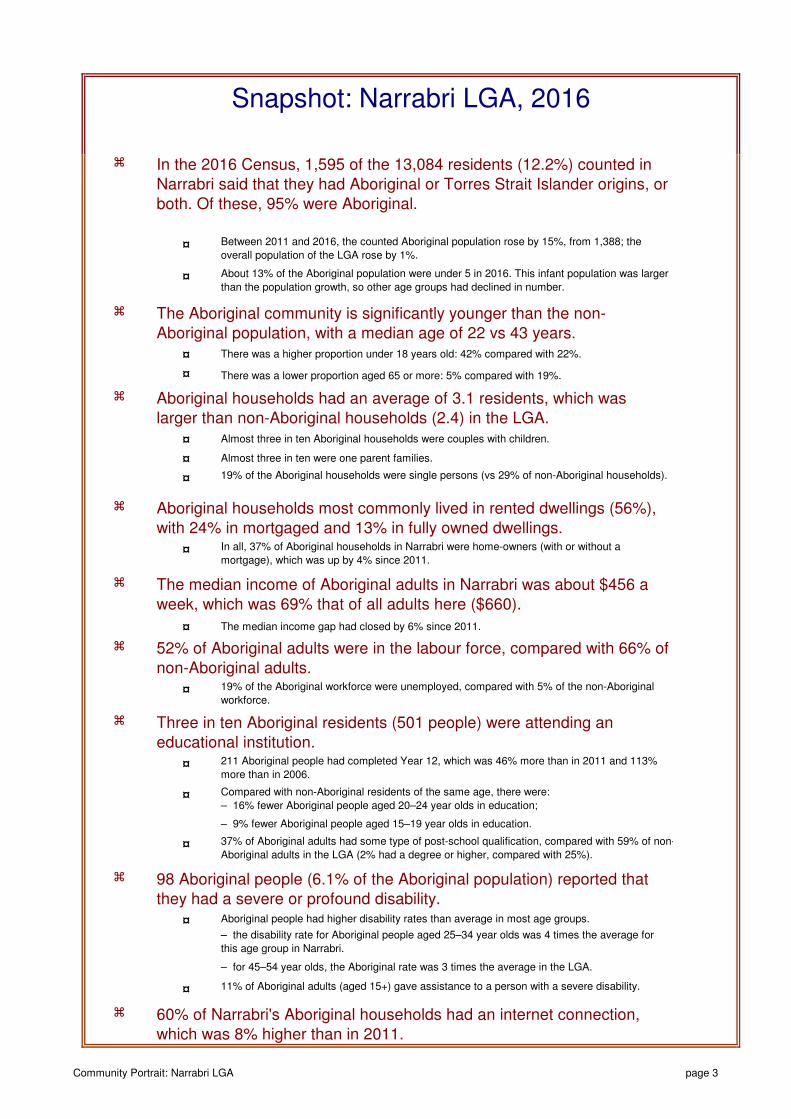
Aboriginal households had an average of 3.1 residents, which was larger than non-Aboriginal households (2.4) in the LGA.
52% of Aboriginal adults were in the labour force, compared with 66% of non-Aboriginal adults.
– for 45–54 year olds, the Aboriginal rate was 3 times the average in the LGA.
Three in ten Aboriginal residents (501 people) were attending an educational institution.
11% of Aboriginal adults (aged 15+) gave assistance to a person with a severe disability.
Aboriginal people had higher disability rates than average in most age groups.
Almost three in ten Aboriginal households were couples with children.
Almost three in ten were one parent families.
In the 2016 Census, 1,595 of the 13,084 residents (12.2%) counted in Narrabri said that they had Aboriginal or Torres Strait Islander origins, or both. Of these, 95% were Aboriginal.
Between 2011 and 2016, the counted Aboriginal population rose by 15%, from 1,388; the
overall population of the LGA rose by 1%.
About 13% of the Aboriginal population were under 5 in 2016. This infant population was larger
than the population growth, so other age groups had declined in number.
Snapshot: Narrabri LGA, 2016
The Aboriginal community is significantly younger than the non-Aboriginal population, with a median age of 22 vs 43 years.
98 Aboriginal people (6.1% of the Aboriginal population) reported that they had a severe or profound disability.
There was a higher proportion under 18 years old: 42% compared with 22%.
There was a lower proportion aged 65 or more: 5% compared with 19%.
60% of Narrabri's Aboriginal households had an internet connection, which was 8% higher than in 2011.
211 Aboriginal people had completed Year 12, which was 46% more than in 2011 and 113%
more than in 2006.
– the disability rate for Aboriginal people aged 25–34 year olds was 4 times the average for
this age group in Narrabri.
– 9% fewer Aboriginal people aged 15–19 year olds in education.
19% of the Aboriginal households were single persons (vs 29% of non-Aboriginal households).
In all, 37% of Aboriginal households in Narrabri were home-owners (with or without a
mortgage), which was up by 4% since 2011.
Aboriginal households most commonly lived in rented dwellings (56%), with 24% in mortgaged and 13% in fully owned dwellings.
The median income gap had closed by 6% since 2011.
Compared with non-Aboriginal residents of the same age, there were:
– 16% fewer Aboriginal people aged 20–24 year olds in education;
19% of the Aboriginal workforce were unemployed, compared with 5% of the non-Aboriginal
workforce.
The median income of Aboriginal adults in Narrabri was about $456 a week, which was 69% that of all adults here ($660).
Community Portrait: Narrabri LGA page 3
Aboriginal non-Aboriginal Gap in 2016
last 5 years
2011–2016
last decade
2006–2016
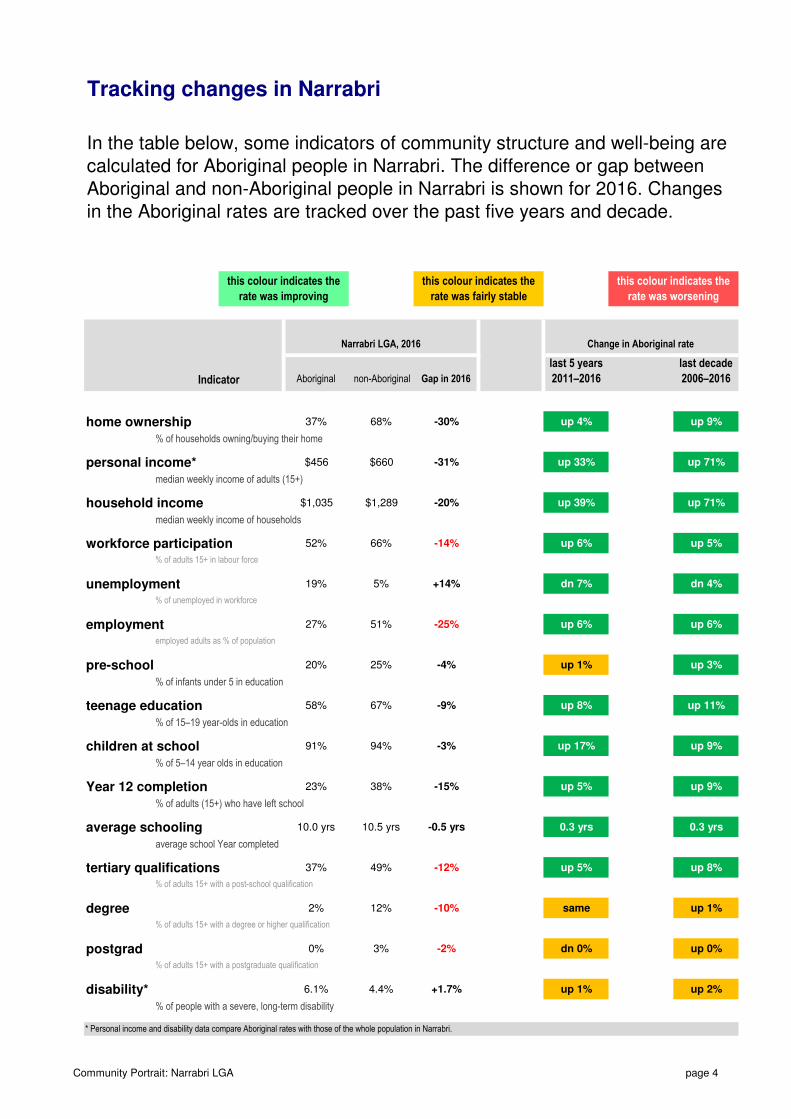
home ownership 37% 68% -30% up 4% up 9%
% of households owning/buying their home
personal income* $456 $660 -31% up 33% up 71%
median weekly income of adults (15+)
household income $1,035 $1,289 -20% up 39% up 71%
median weekly income of households
workforce participation 52% 66% -14% up 6% up 5%
% of adults 15+ in labour force
unemployment 19% 5% +14% dn 7% dn 4%
% of unemployed in workforce
employment 27% 51% -25% up 6% up 6%
employed adults as % of population
pre-school 20% 25% -4% up 1% up 3%
% of infants under 5 in education
teenage education 58% 67% -9% up 8% up 11%
% of 15–19 year-olds in education
children at school 91% 94% -3% up 17% up 9%
% of 5–14 year olds in education
Year 12 completion 23% 38% -15% up 5% up 9%
% of adults (15+) who have left school
average schooling 10.0 yrs 10.5 yrs -0.5 yrs 0.3 yrs 0.3 yrs
average school Year completed
tertiary qualifications 37% 49% -12% up 5% up 8%
% of adults 15+ with a post-school qualification
degree 2% 12% -10% same up 1%
% of adults 15+ with a degree or higher qualification
postgrad 0% 3% -2% dn 0% up 0%
% of adults 15+ with a postgraduate qualification
disability* 6.1% 4.4% +1.7% up 1% up 2%
% of people with a severe, long-term disability
Indicator
* Personal income and disability data compare Aboriginal rates with those of the whole population in Narrabri.
this colour indicates the
rate was worsening
In the table below, some indicators of community structure and well-being are calculated for Aboriginal people in Narrabri. The difference or gap between Aboriginal and non-Aboriginal people in Narrabri is shown for 2016. Changes in the Aboriginal rates are tracked over the past five years and decade.
Tracking changes in Narrabri
this colour indicates the
rate was improving
this colour indicates the
rate was fairly stable
Change in Aboriginal rateNarrabri LGA, 2016
Community Portrait: Narrabri LGA page 4
�
�
�
�
�
�
�
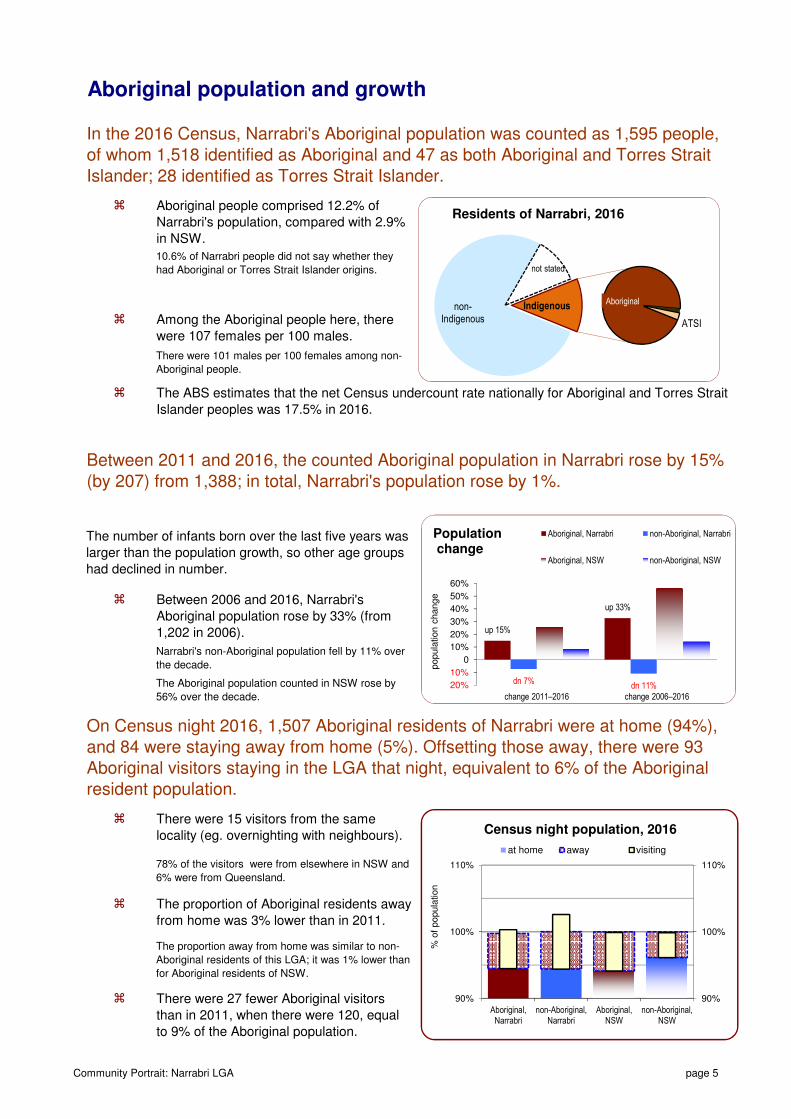
Narrabri's non-Aboriginal population fell by 11% over
the decade.
Between 2011 and 2016, the counted Aboriginal population in Narrabri rose by 15% (by 207) from 1,388; in total, Narrabri's population rose by 1%.
Among the Aboriginal people here, there
were 107 females per 100 males.
On Census night 2016, 1,507 Aboriginal residents of Narrabri were at home (94%), and 84 were staying away from home (5%). Offsetting those away, there were 93 Aboriginal visitors staying in the LGA that night, equivalent to 6% of the Aboriginal resident population.
10.6% of Narrabri people did not say whether they
had Aboriginal or Torres Strait Islander origins.
Aboriginal population and growth
There were 27 fewer Aboriginal visitors
than in 2011, when there were 120, equal
to 9% of the Aboriginal population.
78% of the visitors were from elsewhere in NSW and
6% were from Queensland.
The proportion of Aboriginal residents away
from home was 3% lower than in 2011.
In the 2016 Census, Narrabri's Aboriginal population was counted as 1,595 people, of whom 1,518 identified as Aboriginal and 47 as both Aboriginal and Torres Strait Islander; 28 identified as Torres Strait Islander.
There were 101 males per 100 females among non-
Aboriginal people.
There were 15 visitors from the same
locality (eg. overnighting with neighbours).
The number of infants born over the last five years was
larger than the population growth, so other age groups
had declined in number.
Between 2006 and 2016, Narrabri's
Aboriginal population rose by 33% (from
1,202 in 2006).
The Aboriginal population counted in NSW rose by
56% over the decade.
The proportion away from home was similar to non-
Aboriginal residents of this LGA; it was 1% lower than
for Aboriginal residents of NSW.
The ABS estimates that the net Census undercount rate nationally for Aboriginal and Torres Strait
Islander peoples was 17.5% in 2016.
Aboriginal people comprised 12.2% of
Narrabri's population, compared with 2.9%
in NSW.
non-Indigenous
not stated
Aboriginal
ATSI
Indigenous
Residents of Narrabri, 2016
up 15%
up 33%
dn 7%dn 11%20%
10%
0
10%
20%
30%
40%
50%
60%
change 2011–2016 change 2006–2016
popula
tion c
hange
Populationchange
Aboriginal, Narrabri non-Aboriginal, Narrabri
Aboriginal, NSW non-Aboriginal, NSW
90%
100%
110%
90%
100%
110%
Aboriginal,Narrabri
non-Aboriginal,Narrabri
Aboriginal,NSW
non-Aboriginal,NSW
% o
f popula
tion
Census night population, 2016
at home away visiting
Community Portrait: Narrabri LGA page 5
�
�
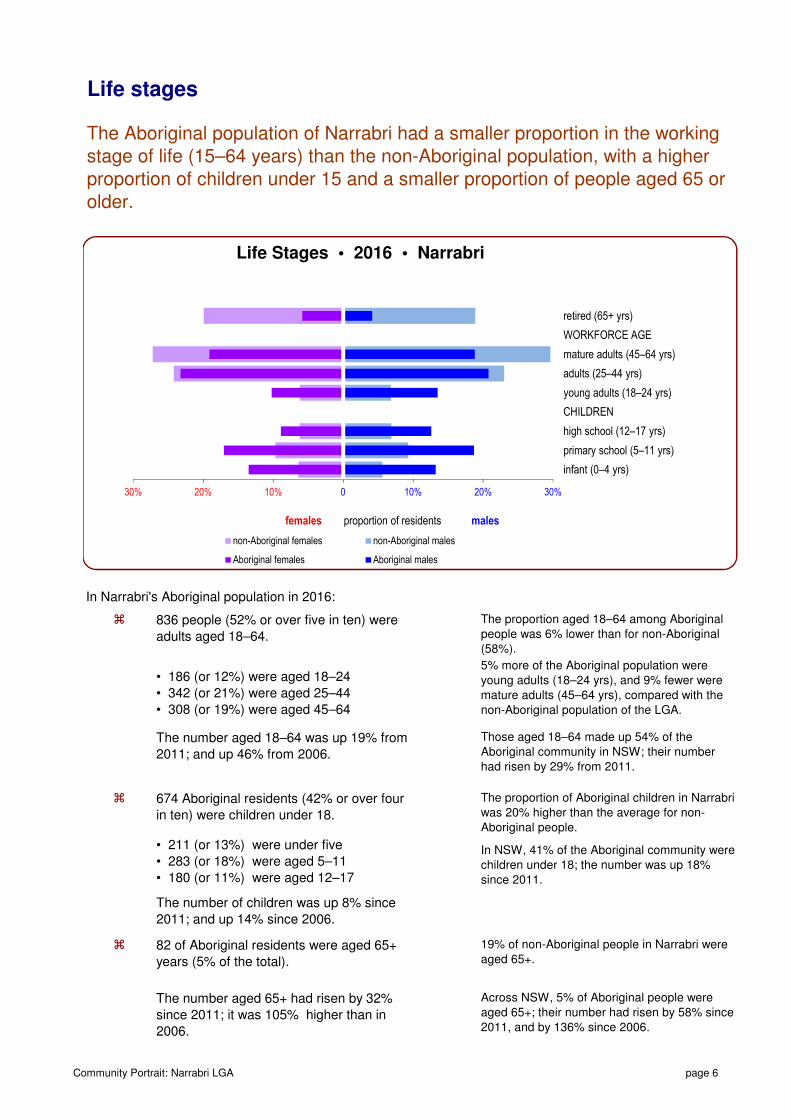
� 82 of Aboriginal residents were aged 65+
years (5% of the total).
The number of children was up 8% since
2011; and up 14% since 2006.
The number aged 65+ had risen by 32%
since 2011; it was 105% higher than in
2006.
Across NSW, 5% of Aboriginal people were
aged 65+; their number had risen by 58% since
2011, and by 136% since 2006.
19% of non-Aboriginal people in Narrabri were
aged 65+.
In Narrabri's Aboriginal population in 2016:
Life stages
5% more of the Aboriginal population were
young adults (18–24 yrs), and 9% fewer were
mature adults (45–64 yrs), compared with the
non-Aboriginal population of the LGA.
In NSW, 41% of the Aboriginal community were
children under 18; the number was up 18%
since 2011.
• 186 (or 12%) were aged 18–24
• 342 (or 21%) were aged 25–44
• 308 (or 19%) were aged 45–64
The proportion aged 18–64 among Aboriginal
people was 6% lower than for non-Aboriginal
(58%).
836 people (52% or over five in ten) were
adults aged 18–64.
• 211 (or 13%) were under five
• 283 (or 18%) were aged 5–11
• 180 (or 11%) were aged 12–17
674 Aboriginal residents (42% or over four
in ten) were children under 18.
The proportion of Aboriginal children in Narrabri
was 20% higher than the average for non-
Aboriginal people.
The number aged 18–64 was up 19% from
2011; and up 46% from 2006.
Those aged 18–64 made up 54% of the
Aboriginal community in NSW; their number
had risen by 29% from 2011.
The Aboriginal population of Narrabri had a smaller proportion in the working stage of life (15–64 years) than the non-Aboriginal population, with a higher proportion of children under 15 and a smaller proportion of people aged 65 or older.
30% 20% 10% 0 10% 20% 30%
infant (0–4 yrs)
primary school (5–11 yrs)
high school (12–17 yrs)
CHILDREN
young adults (18–24 yrs)
adults (25–44 yrs)
mature adults (45–64 yrs)
WORKFORCE AGE
retired (65+ yrs)
Life Stages • 2016 • Narrabri
females proportion of residents males
non-Aboriginal females non-Aboriginal males
Aboriginal females Aboriginal males
Community Portrait: Narrabri LGA page 6
�
�
�
�
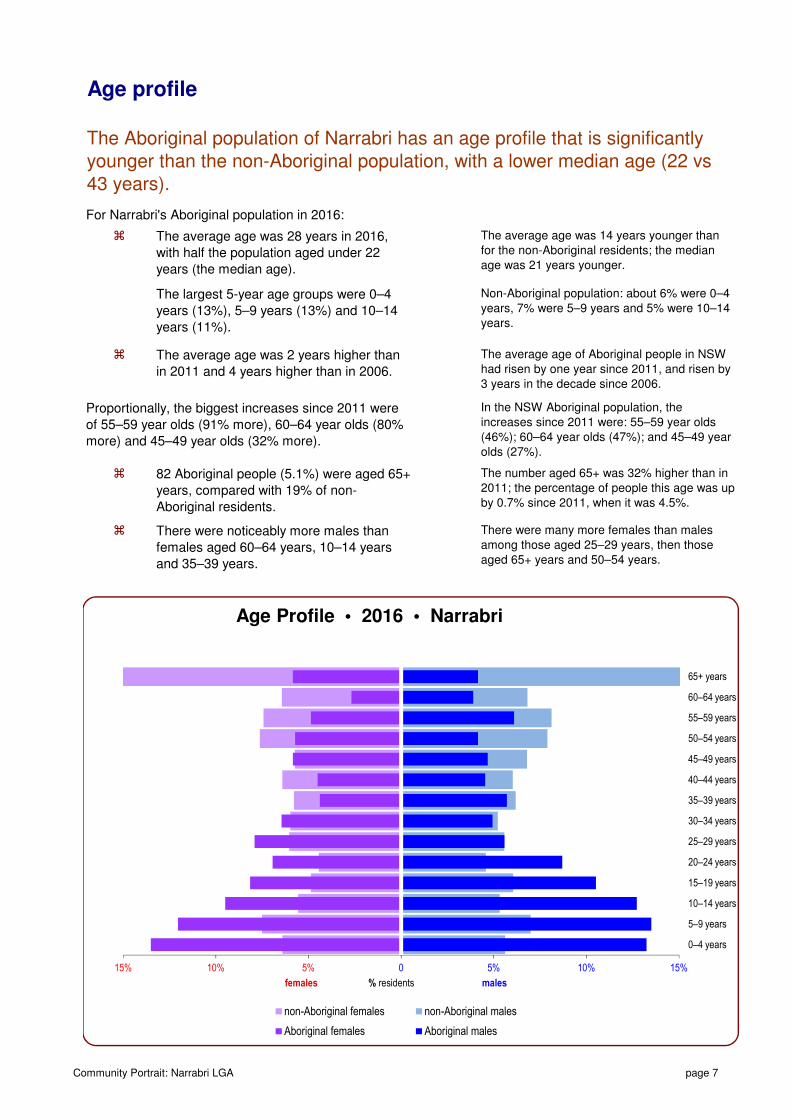
82 Aboriginal people (5.1%) were aged 65+
years, compared with 19% of non-
Aboriginal residents.
Proportionally, the biggest increases since 2011 were
of 55–59 year olds (91% more), 60–64 year olds (80%
more) and 45–49 year olds (32% more).
In the NSW Aboriginal population, the
increases since 2011 were: 55–59 year olds
(46%); 60–64 year olds (47%); and 45–49 year
olds (27%).
For Narrabri's Aboriginal population in 2016:
The average age was 2 years higher than
in 2011 and 4 years higher than in 2006.
The largest 5-year age groups were 0–4
years (13%), 5–9 years (13%) and 10–14
years (11%).
Age profile
Non-Aboriginal population: about 6% were 0–4
years, 7% were 5–9 years and 5% were 10–14
years.
The average age of Aboriginal people in NSW
had risen by one year since 2011, and risen by
3 years in the decade since 2006.
The number aged 65+ was 32% higher than in
2011; the percentage of people this age was up
by 0.7% since 2011, when it was 4.5%.
The Aboriginal population of Narrabri has an age profile that is significantly younger than the non-Aboriginal population, with a lower median age (22 vs 43 years).
The average age was 28 years in 2016,
with half the population aged under 22
years (the median age).
The average age was 14 years younger than
for the non-Aboriginal residents; the median
age was 21 years younger.
There were many more females than males
among those aged 25–29 years, then those
aged 65+ years and 50–54 years.
There were noticeably more males than
females aged 60–64 years, 10–14 years
and 35–39 years.
15% 10% 5% 0 5% 10% 15%
0–4 years
5–9 years
10–14 years
15–19 years
20–24 years
25–29 years
30–34 years
35–39 years
40–44 years
45–49 years
50–54 years
55–59 years
60–64 years
65+ years
Age Profile • 2016 • Narrabri
females % residents males
non-Aboriginal females non-Aboriginal males
Aboriginal females Aboriginal males
Community Portrait: Narrabri LGA page 7
�
�
�
�
�
�
�
�
�
% aged 65+ in population
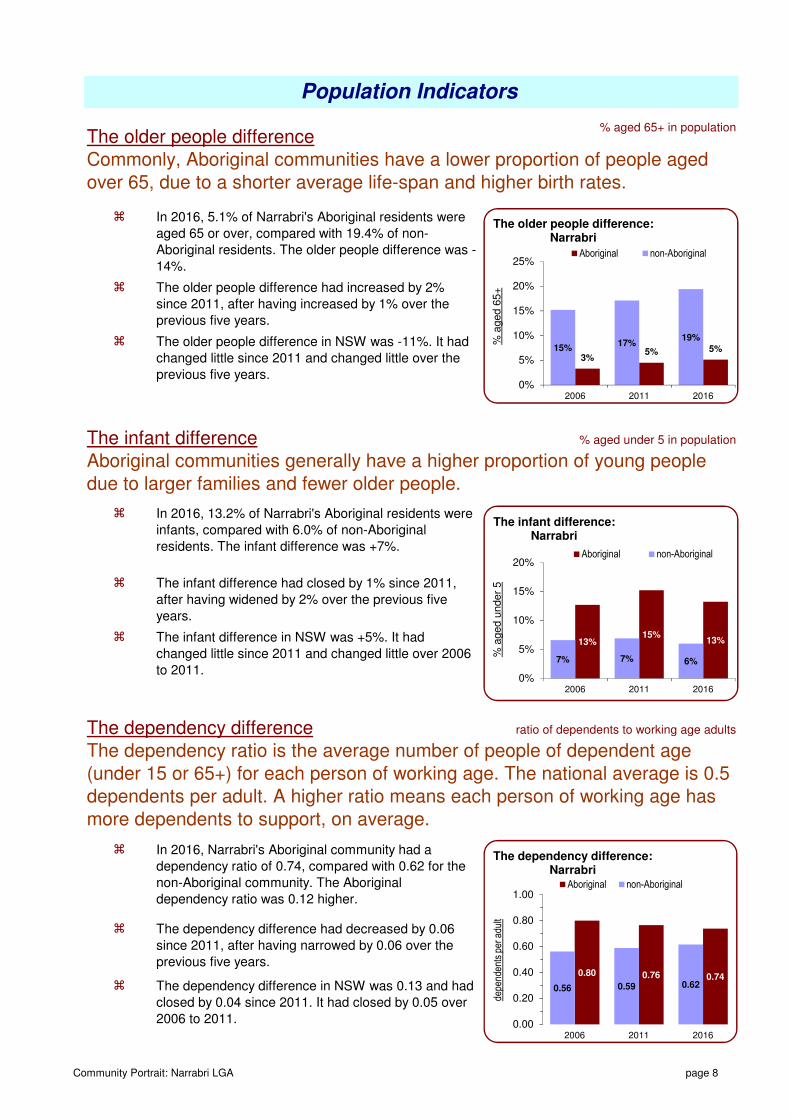
Aboriginal communities generally have a higher proportion of young people due to larger families and fewer older people.
The older people difference had increased by 2%
since 2011, after having increased by 1% over the
previous five years.
The older people difference in NSW was -11%. It had
changed little since 2011 and changed little over the
previous five years.
The dependency difference in NSW was 0.13 and had
closed by 0.04 since 2011. It had closed by 0.05 over
2006 to 2011.
ratio of dependents to working age adults
The dependency ratio is the average number of people of dependent age (under 15 or 65+) for each person of working age. The national average is 0.5 dependents per adult. A higher ratio means each person of working age has more dependents to support, on average.
In 2016, Narrabri's Aboriginal community had a
dependency ratio of 0.74, compared with 0.62 for the
non-Aboriginal community. The Aboriginal
dependency ratio was 0.12 higher.
% aged under 5 in population
The infant difference had closed by 1% since 2011,
after having widened by 2% over the previous five
years.
The older people difference
Population Indicators
Commonly, Aboriginal communities have a lower proportion of people aged over 65, due to a shorter average life-span and higher birth rates.
The infant difference
The infant difference in NSW was +5%. It had
changed little since 2011 and changed little over 2006
to 2011.
In 2016, 13.2% of Narrabri's Aboriginal residents were
infants, compared with 6.0% of non-Aboriginal
residents. The infant difference was +7%.
In 2016, 5.1% of Narrabri's Aboriginal residents were
aged 65 or over, compared with 19.4% of non-
Aboriginal residents. The older people difference was -
14%.
The dependency difference had decreased by 0.06
since 2011, after having narrowed by 0.06 over the
previous five years.
The dependency difference
5%5%3%
19%17%
15%
0%
5%
10%
15%
20%
25%
201620112006
% a
ged 6
5+
The older people difference:Narrabri
Aboriginal non-Aboriginal
13%15%
13%
6%7%7%
0%
5%
10%
15%
20%
201620112006
% a
ged u
nder
5
The infant difference:Narrabri
Aboriginal non-Aboriginal
0.740.760.80
0.620.590.56
0.00
0.20
0.40
0.60
0.80
1.00
201620112006
depe
nden
ts p
er a
dult
The dependency difference:Narrabri
Aboriginal non-Aboriginal
Community Portrait: Narrabri LGA page 8
�
�
�
�
�
�
�
�
�
�
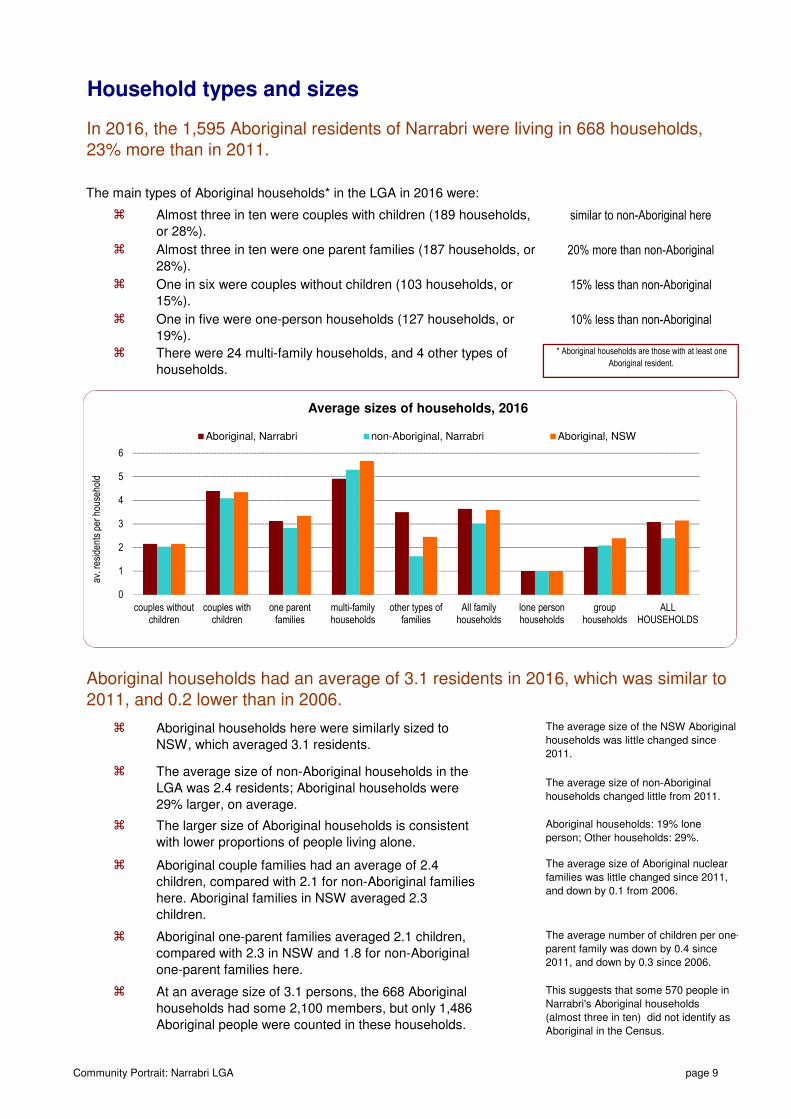
� At an average size of 3.1 persons, the 668 Aboriginal
households had some 2,100 members, but only 1,486
Aboriginal people were counted in these households.
The average size of non-Aboriginal households in the
LGA was 2.4 residents; Aboriginal households were
29% larger, on average.
The larger size of Aboriginal households is consistent
with lower proportions of people living alone.
This suggests that some 570 people in
Narrabri's Aboriginal households
(almost three in ten) did not identify as
Aboriginal in the Census.
Aboriginal couple families had an average of 2.4
children, compared with 2.1 for non-Aboriginal families
here. Aboriginal families in NSW averaged 2.3
children.
One in six were couples without children (103 households, or
15%).
The main types of Aboriginal households* in the LGA in 2016 were:
Household types and sizes
15% less than non-Aboriginal
Almost three in ten were one parent families (187 households, or
28%).
Aboriginal households here were similarly sized to
NSW, which averaged 3.1 residents.
The average size of the NSW Aboriginal
households was little changed since
2011.
The average size of non-Aboriginal
households changed little from 2011.
20% more than non-Aboriginal
Almost three in ten were couples with children (189 households,
or 28%).
In 2016, the 1,595 Aboriginal residents of Narrabri were living in 668 households, 23% more than in 2011.
similar to non-Aboriginal here
The average number of children per one-
parent family was down by 0.4 since
2011, and down by 0.3 since 2006.
Aboriginal one-parent families averaged 2.1 children,
compared with 2.3 in NSW and 1.8 for non-Aboriginal
one-parent families here.
One in five were one-person households (127 households, or
19%).10% less than non-Aboriginal
* Aboriginal households are those with at least one
Aboriginal resident.
The average size of Aboriginal nuclear
families was little changed since 2011,
and down by 0.1 from 2006.
Aboriginal households: 19% lone
person; Other households: 29%.
Aboriginal households had an average of 3.1 residents in 2016, which was similar to 2011, and 0.2 lower than in 2006.
There were 24 multi-family households, and 4 other types of
households.
0
1
2
3
4
5
6
couples withoutchildren
couples withchildren
one parentfamilies
multi-familyhouseholds
other types offamilies
All familyhouseholds
lone personhouseholds
grouphouseholds
ALLHOUSEHOLDS
av. r
esid
ents
per
hou
seho
ld
Average sizes of households, 2016
Aboriginal, Narrabri non-Aboriginal, Narrabri Aboriginal, NSW
Community Portrait: Narrabri LGA page 9
�
�
�
�
�
�
�
�
�
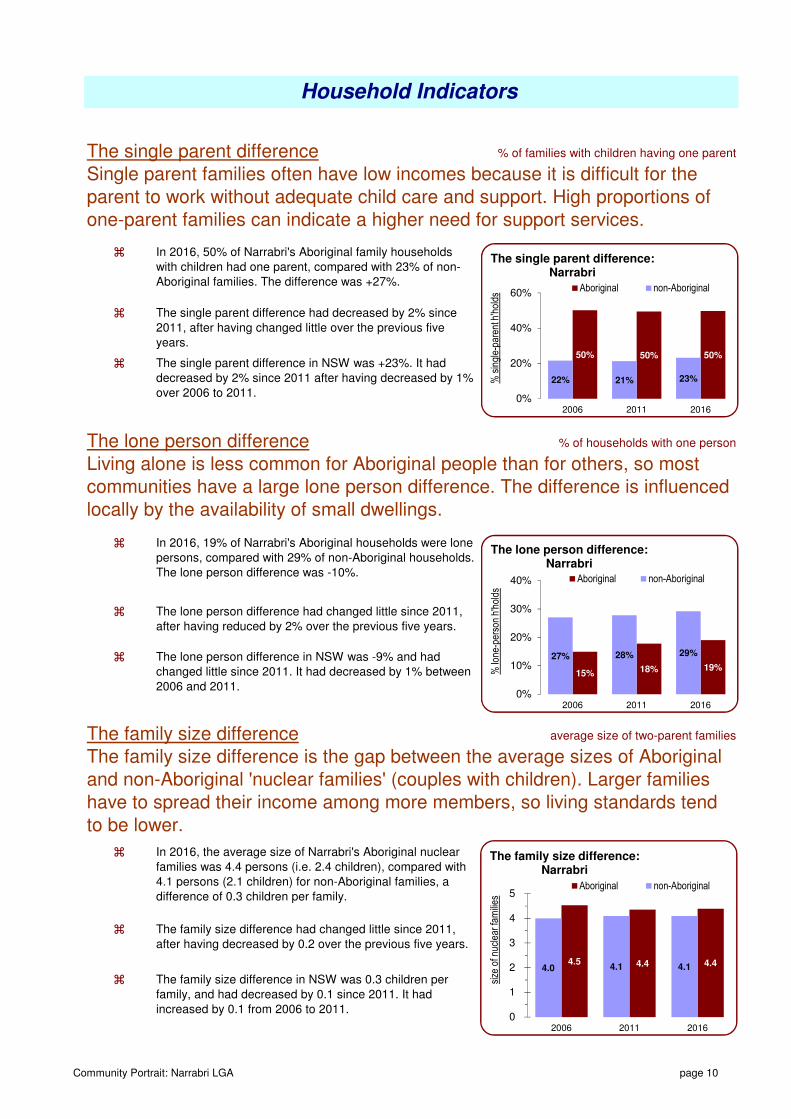
In 2016, 50% of Narrabri's Aboriginal family households
with children had one parent, compared with 23% of non-
Aboriginal families. The difference was +27%.
The single parent difference had decreased by 2% since
2011, after having changed little over the previous five
years.
Household Indicators
% of households with one person
The family size difference is the gap between the average sizes of Aboriginal and non-Aboriginal 'nuclear families' (couples with children). Larger families have to spread their income among more members, so living standards tend to be lower.
The lone person differenceLiving alone is less common for Aboriginal people than for others, so most communities have a large lone person difference. The difference is influenced locally by the availability of small dwellings.
The lone person difference in NSW was -9% and had
changed little since 2011. It had decreased by 1% between
2006 and 2011.
In 2016, the average size of Narrabri's Aboriginal nuclear
families was 4.4 persons (i.e. 2.4 children), compared with
4.1 persons (2.1 children) for non-Aboriginal families, a
difference of 0.3 children per family.
% of families with children having one parent
Single parent families often have low incomes because it is difficult for the parent to work without adequate child care and support. High proportions of one-parent families can indicate a higher need for support services.
In 2016, 19% of Narrabri's Aboriginal households were lone
persons, compared with 29% of non-Aboriginal households.
The lone person difference was -10%.
The single parent difference
average size of two-parent families
The lone person difference had changed little since 2011,
after having reduced by 2% over the previous five years.
The family size difference in NSW was 0.3 children per
family, and had decreased by 0.1 since 2011. It had
increased by 0.1 from 2006 to 2011.
The single parent difference in NSW was +23%. It had
decreased by 2% since 2011 after having decreased by 1%
over 2006 to 2011.
The family size difference had changed little since 2011,
after having decreased by 0.2 over the previous five years.
The family size difference
19%18%15%
29%28%27%
0%
10%
20%
30%
40%
201620112006
% lo
ne-p
erso
n h'
hold
s
The lone person difference:Narrabri
Aboriginal non-Aboriginal
4.4 4.4 4.5 4.1 4.1 4.0
0
1
2
3
4
5
201620112006
size
of n
ucle
ar fa
mili
es
The family size difference:Narrabri
Aboriginal non-Aboriginal
50%50%50%
23%21%22%
0%
20%
40%
60%
201620112006
% s
ingl
e-pa
rent
h'h
olds
The single parent difference:Narrabri
Aboriginal non-Aboriginal
Community Portrait: Narrabri LGA page 10
�
�
�
�
� This was virtually unchanged since 2011.
8 Aboriginal people in the LGA were counted living in institutional accommodation on Census night (eg. nursing homes, hospitals, boarding houses, correctional centres, barracks or boarding schools).
Note: very small numbers are randomly altered by the
ABS to protect privacy, so are not precise.
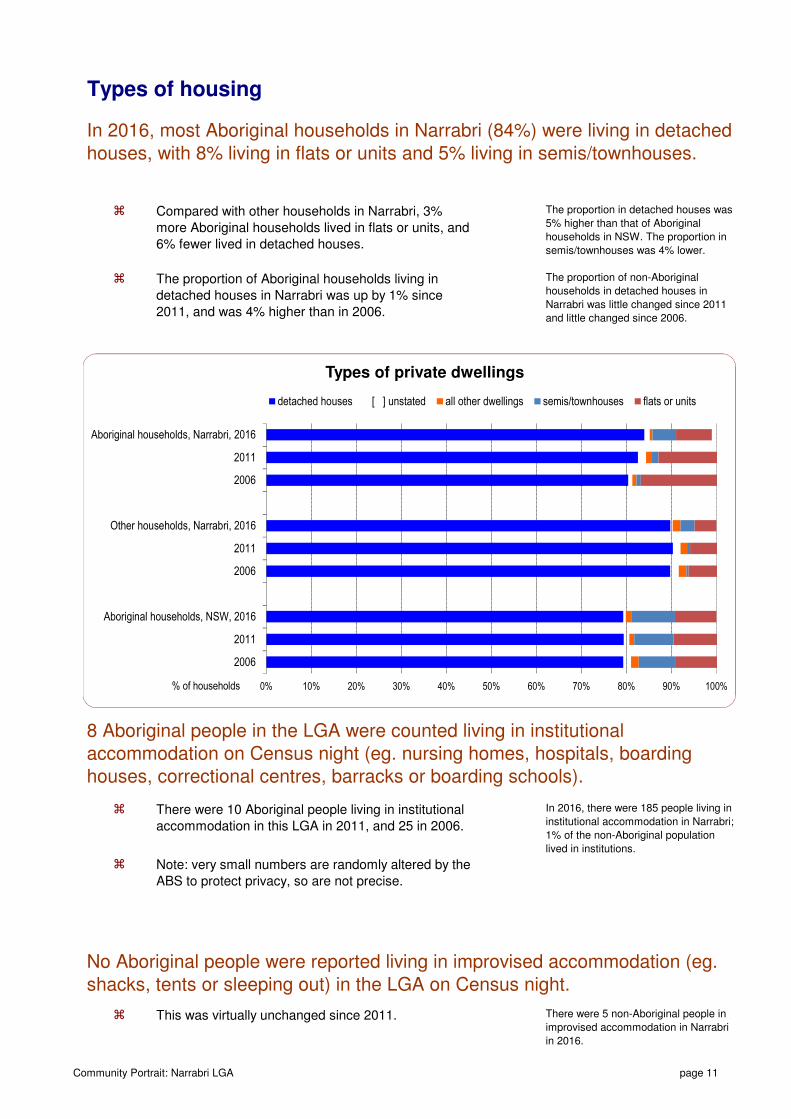
In 2016, most Aboriginal households in Narrabri (84%) were living in detached houses, with 8% living in flats or units and 5% living in semis/townhouses.
The proportion in detached houses was
5% higher than that of Aboriginal
households in NSW. The proportion in
semis/townhouses was 4% lower.
Compared with other households in Narrabri, 3%
more Aboriginal households lived in flats or units, and
6% fewer lived in detached houses.
The proportion of Aboriginal households living in
detached houses in Narrabri was up by 1% since
2011, and was 4% higher than in 2006.
The proportion of non-Aboriginal
households in detached houses in
Narrabri was little changed since 2011
and little changed since 2006.
Types of housing
No Aboriginal people were reported living in improvised accommodation (eg. shacks, tents or sleeping out) in the LGA on Census night.
In 2016, there were 185 people living in
institutional accommodation in Narrabri;
1% of the non-Aboriginal population
lived in institutions.
There were 5 non-Aboriginal people in
improvised accommodation in Narrabri
in 2016.
There were 10 Aboriginal people living in institutional
accommodation in this LGA in 2011, and 25 in 2006.
0% 10% 20% 30% 40% 50% 60% 70% 80% 90% 100%
Aboriginal households, Narrabri, 2016
2011
2006
Other households, Narrabri, 2016
2011
2006
Aboriginal households, NSW, 2016
2011
2006
% of households
Types of private dwellings
detached houses [ ] unstated all other dwellings semis/townhouses flats or units
Community Portrait: Narrabri LGA page 11
�
�
�
� Only 2% of the Other households lived in public
housing.
Housing costs and tenure
In NSW, 27% of Aboriginal households were home-
buyers with a mortgage.
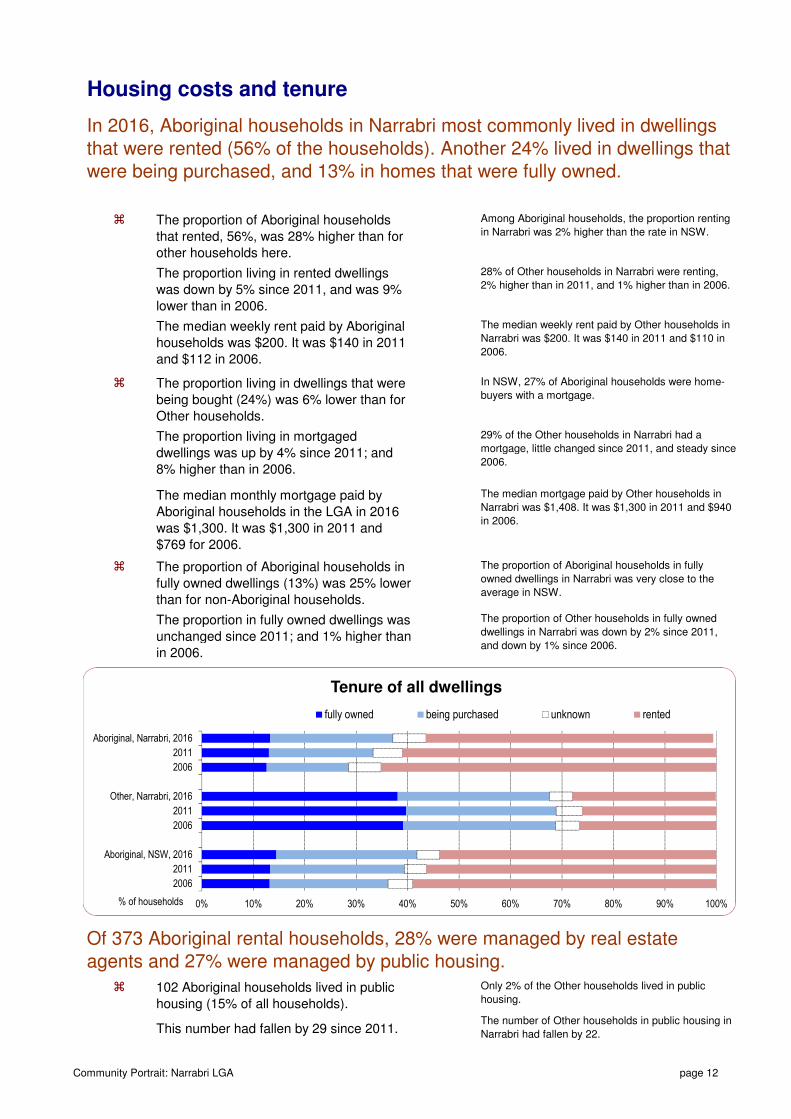
The proportion of Aboriginal households
that rented, 56%, was 28% higher than for
other households here.
The proportion living in rented dwellings
was down by 5% since 2011, and was 9%
lower than in 2006.
The proportion of Aboriginal households in
fully owned dwellings (13%) was 25% lower
than for non-Aboriginal households.
The proportion of Aboriginal households in fully
owned dwellings in Narrabri was very close to the
average in NSW.
In 2016, Aboriginal households in Narrabri most commonly lived in dwellings that were rented (56% of the households). Another 24% lived in dwellings that were being purchased, and 13% in homes that were fully owned.
The proportion living in dwellings that were
being bought (24%) was 6% lower than for
Other households.
The median weekly rent paid by Aboriginal
households was $200. It was $140 in 2011
and $112 in 2006.
The proportion living in mortgaged
dwellings was up by 4% since 2011; and
8% higher than in 2006.
Among Aboriginal households, the proportion renting
in Narrabri was 2% higher than the rate in NSW.
The median weekly rent paid by Other households in
Narrabri was $200. It was $140 in 2011 and $110 in
2006.
29% of the Other households in Narrabri had a
mortgage, little changed since 2011, and steady since
2006.
28% of Other households in Narrabri were renting,
2% higher than in 2011, and 1% higher than in 2006.
The median monthly mortgage paid by
Aboriginal households in the LGA in 2016
was $1,300. It was $1,300 in 2011 and
$769 for 2006.
The median mortgage paid by Other households in
Narrabri was $1,408. It was $1,300 in 2011 and $940
in 2006.
102 Aboriginal households lived in public
housing (15% of all households).
The proportion in fully owned dwellings was
unchanged since 2011; and 1% higher than
in 2006.
The proportion of Other households in fully owned
dwellings in Narrabri was down by 2% since 2011,
and down by 1% since 2006.
Of 373 Aboriginal rental households, 28% were managed by real estate agents and 27% were managed by public housing.
This number had fallen by 29 since 2011.The number of Other households in public housing in
Narrabri had fallen by 22.
0% 10% 20% 30% 40% 50% 60% 70% 80% 90% 100%
Aboriginal, Narrabri, 2016
2011
2006
Other, Narrabri, 2016
2011
2006
Aboriginal, NSW, 2016
2011
2006
% of households
Tenure of all dwellings
fully owned being purchased unknown rented
Community Portrait: Narrabri LGA page 12
�
�
�
�
�
�
The institutional difference
The institutional difference in NSW was 9 per 1000
and had changed little since 2011. It had also changed
little between 2006 and 2011.
The institutional gap had increased by 1 per 1000
since 2011, after having decreased by 5 per 1000 over
the previous five years.
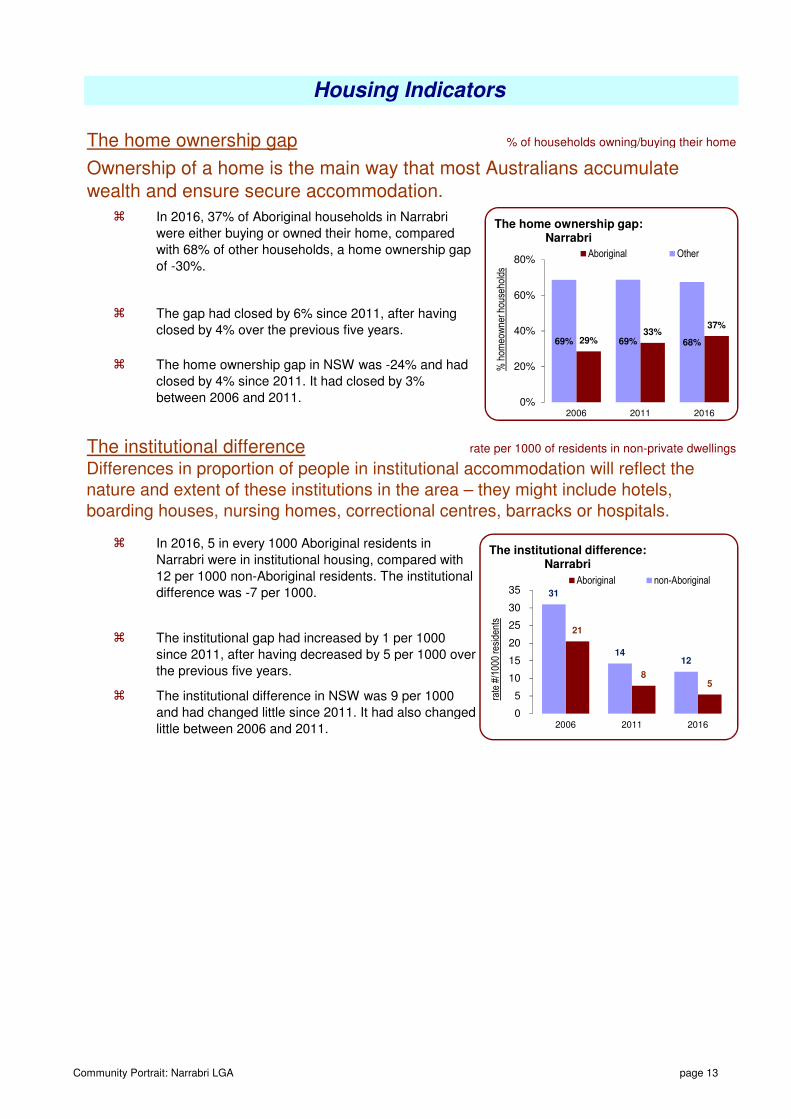
The home ownership gap % of households owning/buying their home
In 2016, 37% of Aboriginal households in Narrabri
were either buying or owned their home, compared
with 68% of other households, a home ownership gap
of -30%.
The home ownership gap in NSW was -24% and had
closed by 4% since 2011. It had closed by 3%
between 2006 and 2011.
In 2016, 5 in every 1000 Aboriginal residents in
Narrabri were in institutional housing, compared with
12 per 1000 non-Aboriginal residents. The institutional
difference was -7 per 1000.
Housing Indicators
Differences in proportion of people in institutional accommodation will reflect the nature and extent of these institutions in the area – they might include hotels, boarding houses, nursing homes, correctional centres, barracks or hospitals.
The gap had closed by 6% since 2011, after having
closed by 4% over the previous five years.
rate per 1000 of residents in non-private dwellings
Ownership of a home is the main way that most Australians accumulate wealth and ensure secure accommodation.
37%33%
29% 68%69%69%
0%
20%
40%
60%
80%
201620112006
% h
omeo
wne
r hou
seho
lds
The home ownership gap:Narrabri
Aboriginal Other
58
21
1214
31
0
5
10
15
20
25
30
35
201620112006
rate
#/1
000
resi
dent
s
The institutional difference:Narrabri
Aboriginal non-Aboriginal
Community Portrait: Narrabri LGA page 13
�
�
�
�
�
�
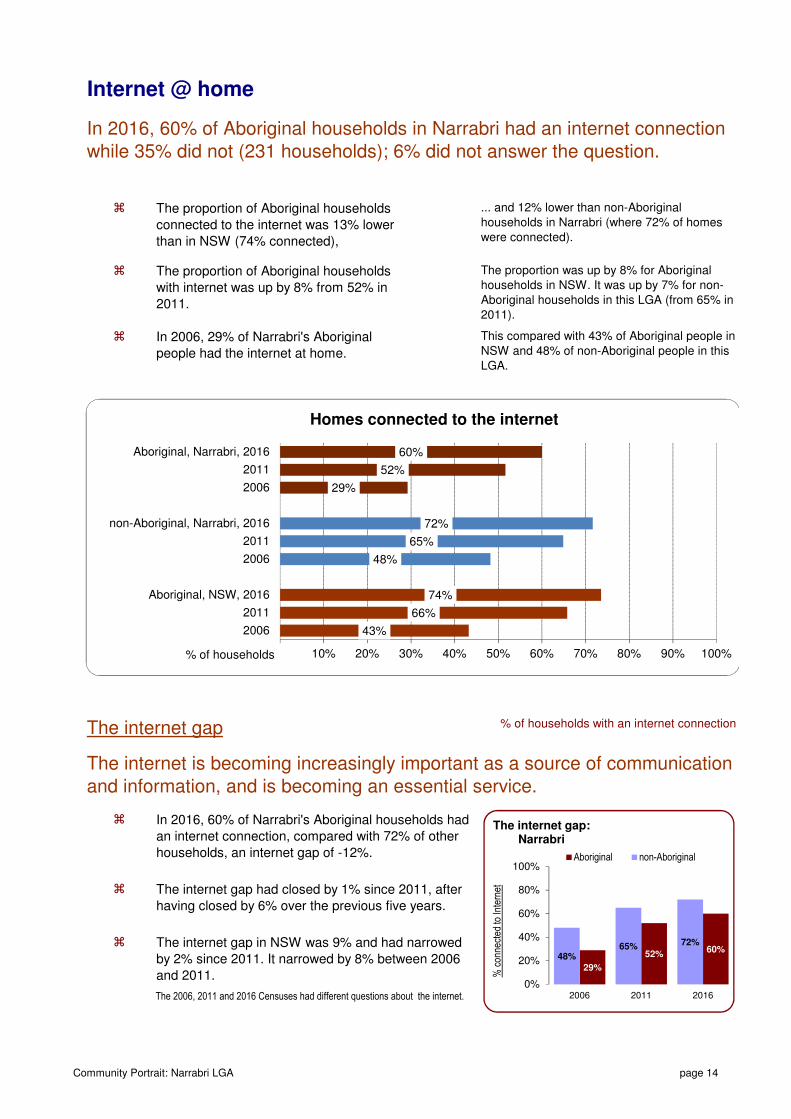
In 2016, 60% of Aboriginal households in Narrabri had an internet connection while 35% did not (231 households); 6% did not answer the question.
Internet @ home
In 2006, 29% of Narrabri's Aboriginal
people had the internet at home.
The proportion was up by 8% for Aboriginal
households in NSW. It was up by 7% for non-
Aboriginal households in this LGA (from 65% in
2011).
This compared with 43% of Aboriginal people in
NSW and 48% of non-Aboriginal people in this
LGA.
The internet gap had closed by 1% since 2011, after
having closed by 6% over the previous five years.
The 2006, 2011 and 2016 Censuses had different questions about the internet.
In 2016, 60% of Narrabri's Aboriginal households had
an internet connection, compared with 72% of other
households, an internet gap of -12%.
... and 12% lower than non-Aboriginal
households in Narrabri (where 72% of homes
were connected).
The proportion of Aboriginal households
with internet was up by 8% from 52% in
2011.
The proportion of Aboriginal households
connected to the internet was 13% lower
than in NSW (74% connected),
The internet is becoming increasingly important as a source of communication and information, and is becoming an essential service.
The internet gap % of households with an internet connection
The internet gap in NSW was 9% and had narrowed
by 2% since 2011. It narrowed by 8% between 2006
and 2011.
60%
52%
29%
72%
65%
48%
74%
66%
43%
10% 20% 30% 40% 50% 60% 70% 80% 90% 100%
Aboriginal, Narrabri, 2016
2011
2006
non-Aboriginal, Narrabri, 2016
2011
2006
Aboriginal, NSW, 2016
2011
2006
% of households
Homes connected to the internet
60%52%
29%
72%65%48%
0%
20%
40%
60%
80%
100%
201620112006
% c
onne
cted
to In
tern
et
The internet gap:Narrabri
Aboriginal non-Aboriginal
Community Portrait: Narrabri LGA page 14
�
�
�
�
�
�
�
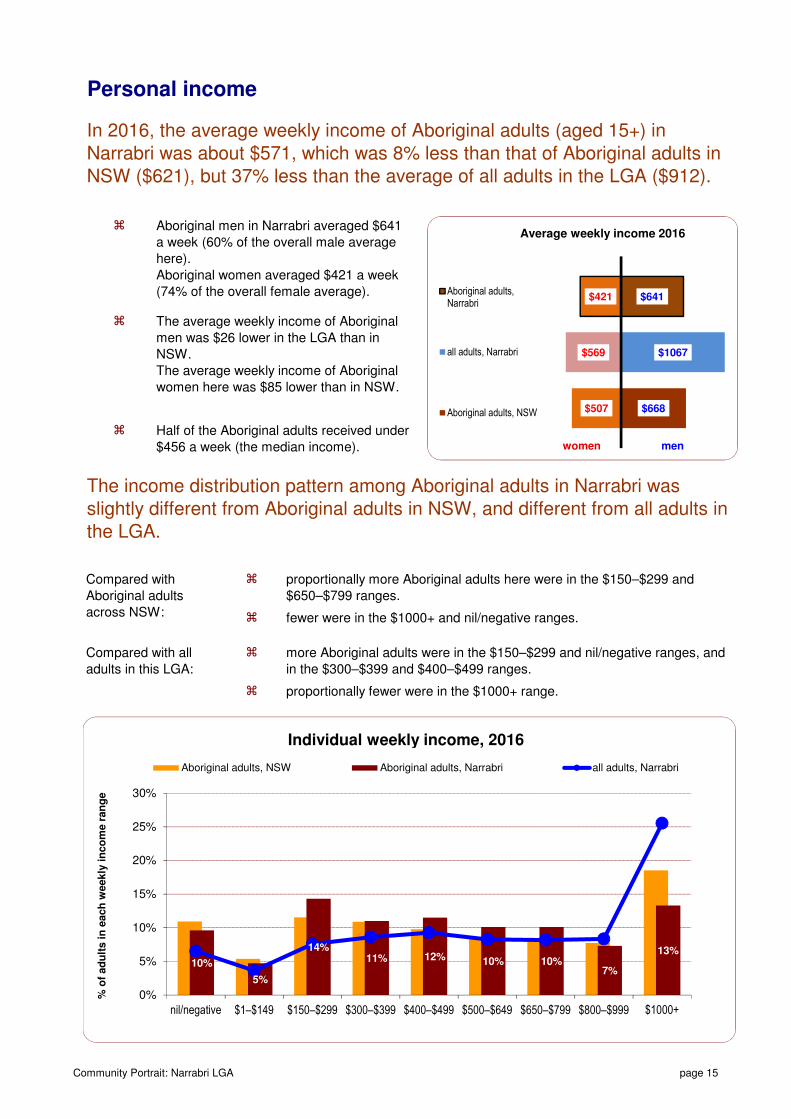
more Aboriginal adults were in the $150–$299 and nil/negative ranges, and
in the $300–$399 and $400–$499 ranges.
proportionally more Aboriginal adults here were in the $150–$299 and
$650–$799 ranges.
Aboriginal men in Narrabri averaged $641
a week (60% of the overall male average
here).
Aboriginal women averaged $421 a week
(74% of the overall female average).
fewer were in the $1000+ and nil/negative ranges.
proportionally fewer were in the $1000+ range.
Half of the Aboriginal adults received under
$456 a week (the median income).
Compared with all
adults in this LGA:
The average weekly income of Aboriginal
men was $26 lower in the LGA than in
NSW.
The average weekly income of Aboriginal
women here was $85 lower than in NSW.
The income distribution pattern among Aboriginal adults in Narrabri was slightly different from Aboriginal adults in NSW, and different from all adults in the LGA.
In 2016, the average weekly income of Aboriginal adults (aged 15+) in Narrabri was about $571, which was 8% less than that of Aboriginal adults in NSW ($621), but 37% less than the average of all adults in the LGA ($912).
Personal income
Compared with
Aboriginal adults
across NSW:
$668
$1067
$641
$507
$569
$421
women men
Average weekly income 2016
Aboriginal adults,Narrabri
all adults, Narrabri
Aboriginal adults, NSW
10%
5%
14%11% 12% 10% 10%
7%
13%
0%
5%
10%
15%
20%
25%
30%
nil/negative $1–$149 $150–$299 $300–$399 $400–$499 $500–$649 $650–$799 $800–$999 $1000+
% o
f ad
ult
s in
each
weekly
in
co
me r
an
ge
Individual weekly income, 2016
Aboriginal adults, NSW Aboriginal adults, Narrabri all adults, Narrabri
Community Portrait: Narrabri LGA page 15
�
�
�
�
�
�
�
�
Compared with non-
Aboriginal households
in this LGA:
Household income
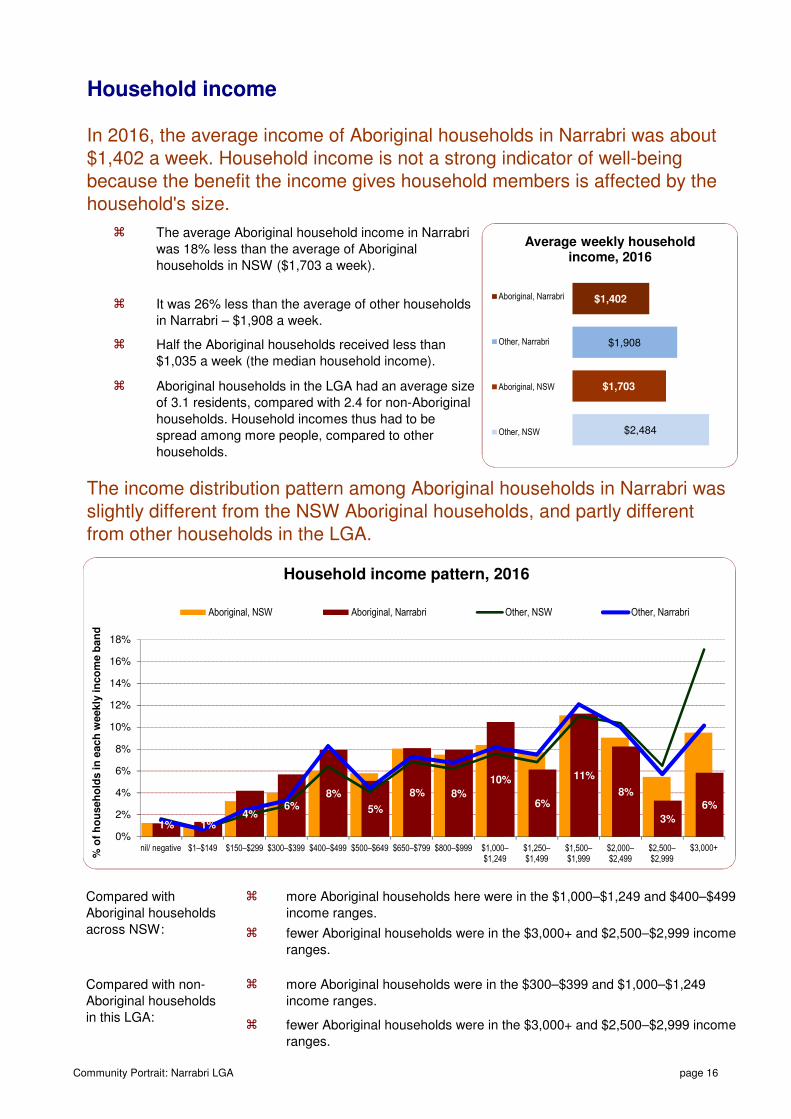
more Aboriginal households here were in the $1,000–$1,249 and $400–$499
income ranges.
It was 26% less than the average of other households
in Narrabri – $1,908 a week.
The income distribution pattern among Aboriginal households in Narrabri was slightly different from the NSW Aboriginal households, and partly different from other households in the LGA.
more Aboriginal households were in the $300–$399 and $1,000–$1,249
income ranges.
Half the Aboriginal households received less than
$1,035 a week (the median household income).
In 2016, the average income of Aboriginal households in Narrabri was about $1,402 a week. Household income is not a strong indicator of well-being because the benefit the income gives household members is affected by the household's size.
Compared with
Aboriginal households
across NSW: fewer Aboriginal households were in the $3,000+ and $2,500–$2,999 income
ranges.
The average Aboriginal household income in Narrabri
was 18% less than the average of Aboriginal
households in NSW ($1,703 a week).
fewer Aboriginal households were in the $3,000+ and $2,500–$2,999 income
ranges.
Aboriginal households in the LGA had an average size
of 3.1 residents, compared with 2.4 for non-Aboriginal
households. Household incomes thus had to be
spread among more people, compared to other
households.
$2,484
$1,703
$1,908
$1,402
Average weekly household income, 2016
Aboriginal, Narrabri
Other, Narrabri
Aboriginal, NSW
Other, NSW
1% 1%4%
6%8%
5%
8% 8%
10%
6%
11%
8%
3%
6%
0%
2%
4%
6%
8%
10%
12%
14%
16%
18%
nil/ negative $1–$149 $150–$299 $300–$399 $400–$499 $500–$649 $650–$799 $800–$999 $1,000–$1,249
$1,250–$1,499
$1,500–$1,999
$2,000–$2,499
$2,500–$2,999
$3,000+
% o
f h
ou
seh
old
s in
each
weekly
in
co
me b
an
d
Household income pattern, 2016
Aboriginal, NSW Aboriginal, Narrabri Other, NSW Other, Narrabri
Community Portrait: Narrabri LGA page 16
�
�
�
�
�
�
Income Indicators
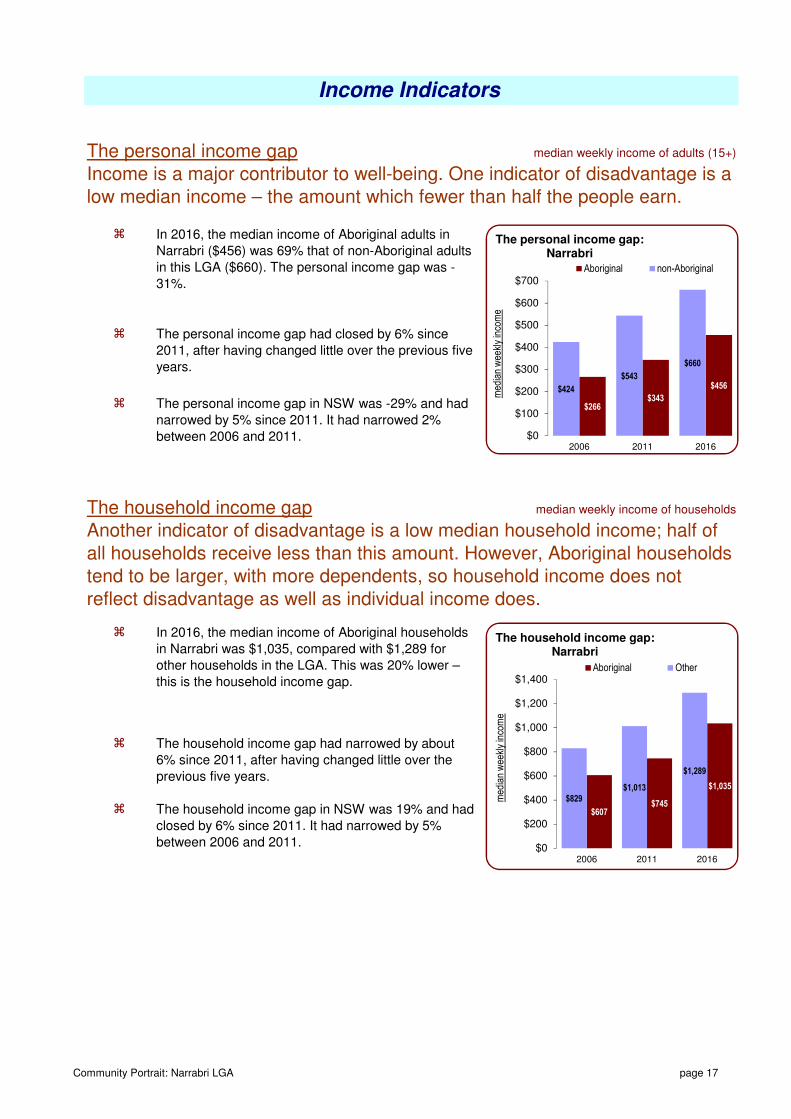
In 2016, the median income of Aboriginal households
in Narrabri was $1,035, compared with $1,289 for
other households in the LGA. This was 20% lower –
this is the household income gap.
The household income gap in NSW was 19% and had
closed by 6% since 2011. It had narrowed by 5%
between 2006 and 2011.
Another indicator of disadvantage is a low median household income; half of all households receive less than this amount. However, Aboriginal households tend to be larger, with more dependents, so household income does not reflect disadvantage as well as individual income does.
The household income gap had narrowed by about
6% since 2011, after having changed little over the
previous five years.
In 2016, the median income of Aboriginal adults in
Narrabri ($456) was 69% that of non-Aboriginal adults
in this LGA ($660). The personal income gap was -
31%.
median weekly income of households
The personal income gap had closed by 6% since
2011, after having changed little over the previous five
years.
Income is a major contributor to well-being. One indicator of disadvantage is a low median income – the amount which fewer than half the people earn.
median weekly income of adults (15+)
The personal income gap in NSW was -29% and had
narrowed by 5% since 2011. It had narrowed 2%
between 2006 and 2011.
The household income gap
The personal income gap
$456
$343$266
$660
$543
$424
$0
$100
$200
$300
$400
$500
$600
$700
201620112006
med
ian
wee
kly
inco
me
The personal income gap:Narrabri
Aboriginal non-Aboriginal
$1,035
$745$607
$1,289
$1,013$829
$0
$200
$400
$600
$800
$1,000
$1,200
$1,400
201620112006
med
ian
wee
kly
inco
me
The household income gap:Narrabri
Aboriginal Other
Community Portrait: Narrabri LGA page 17
�
�
�
�
�
�
�
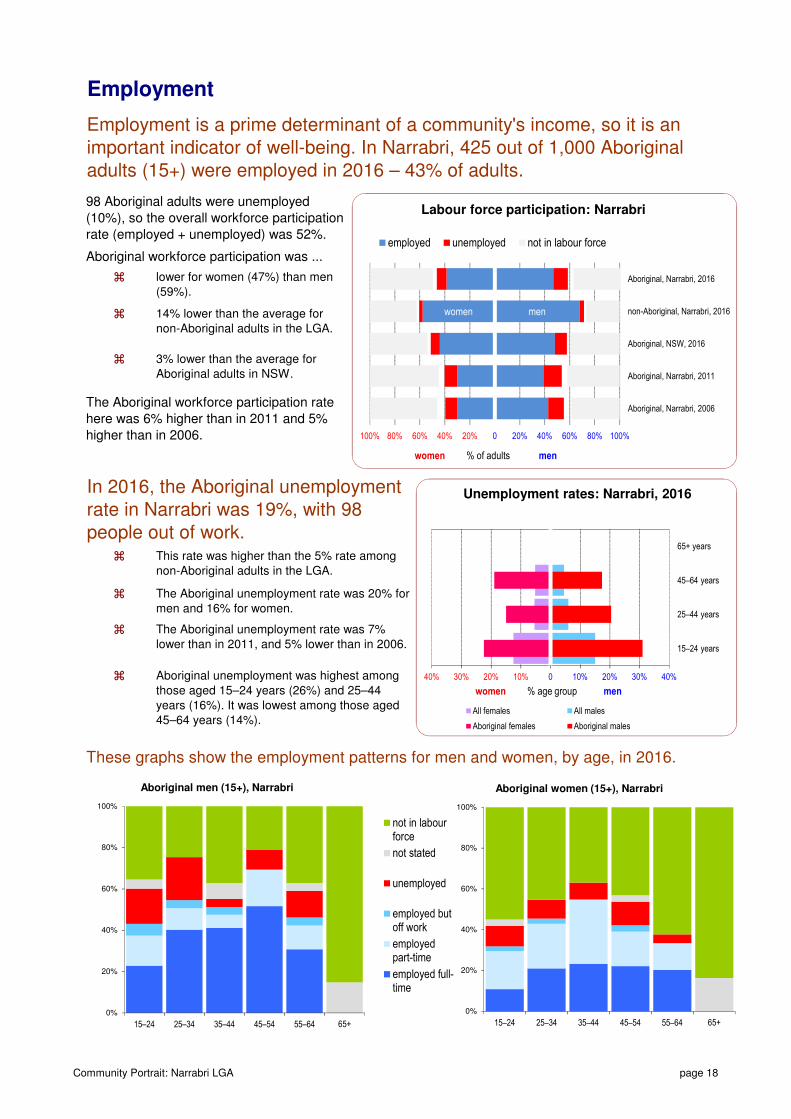
98 Aboriginal adults were unemployed
(10%), so the overall workforce participation
rate (employed + unemployed) was 52%.
Employment is a prime determinant of a community's income, so it is an important indicator of well-being. In Narrabri, 425 out of 1,000 Aboriginal adults (15+) were employed in 2016 – 43% of adults.
lower for women (47%) than men
(59%).
Employment
These graphs show the employment patterns for men and women, by age, in 2016.
This rate was higher than the 5% rate among
non-Aboriginal adults in the LGA.
In 2016, the Aboriginal unemployment rate in Narrabri was 19%, with 98 people out of work.
Aboriginal workforce participation was ...
14% lower than the average for
non-Aboriginal adults in the LGA.
The Aboriginal unemployment rate was 20% for
men and 16% for women.
Aboriginal unemployment was highest among
those aged 15–24 years (26%) and 25–44
years (16%). It was lowest among those aged
45–64 years (14%).
3% lower than the average for
Aboriginal adults in NSW.
The Aboriginal unemployment rate was 7%
lower than in 2011, and 5% lower than in 2006.
The Aboriginal workforce participation rate
here was 6% higher than in 2011 and 5%
higher than in 2006.
menwomen
100% 80% 60% 40% 20% 0 20% 40% 60% 80% 100%
Aboriginal, Narrabri, 2016
non-Aboriginal, Narrabri, 2016
Aboriginal, NSW, 2016
Aboriginal, Narrabri, 2011
Aboriginal, Narrabri, 2006
women % of adults men
Labour force participation: Narrabri
employed unemployed not in labour force
40% 30% 20% 10% 0 10% 20% 30% 40%
15–24 years
25–44 years
45–64 years
65+ years
Unemployment rates: Narrabri, 2016
women % age group men
All females All males
Aboriginal females Aboriginal males
0%
20%
40%
60%
80%
100%
15–24 25–34 35–44 45–54 55–64 65+
Aboriginal men (15+), Narrabri
0%
20%
40%
60%
80%
100%
15–24 25–34 35–44 45–54 55–64 65+
Aboriginal women (15+), Narrabri
not in labourforce
not stated
unemployed
employed butoff work
employedpart-time
employed full-time
Community Portrait: Narrabri LGA page 18
�
�
�
�
�
�
�
�
�
employed adults as % of population
The employment gap in NSW was -18% and had closed by
3% since 2011. It had narrowed by 1% between 2006 and
2011.
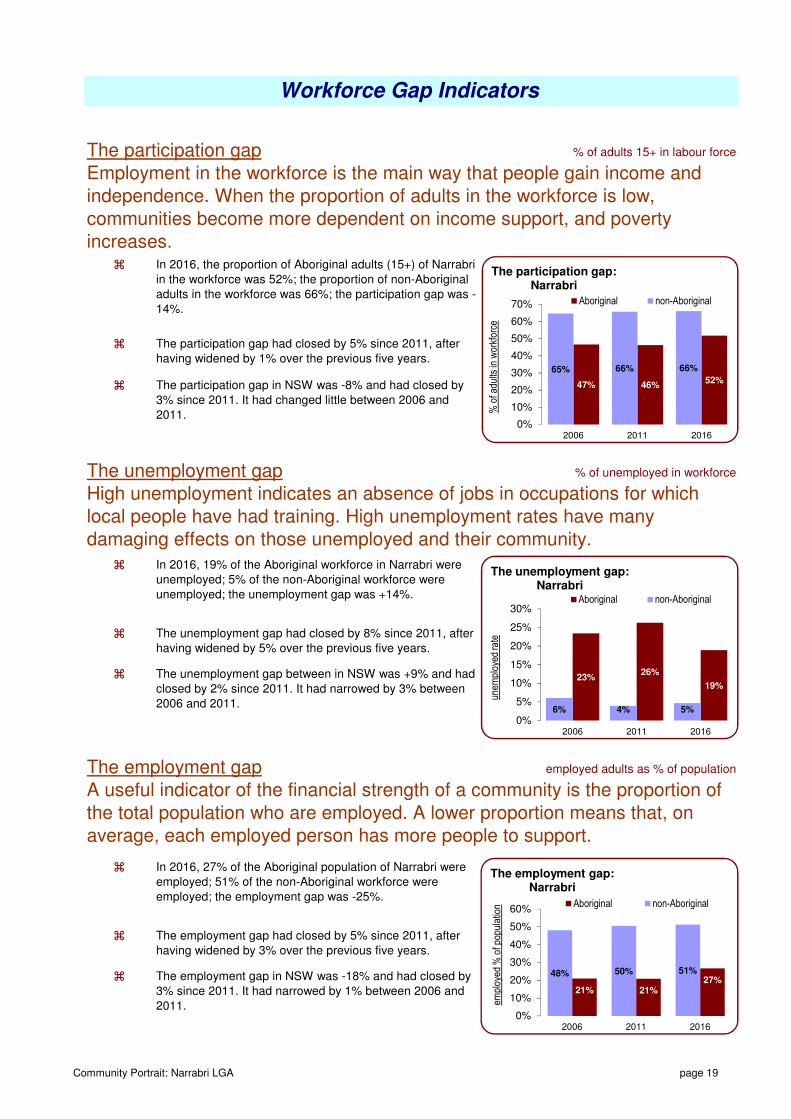
In 2016, the proportion of Aboriginal adults (15+) of Narrabri
in the workforce was 52%; the proportion of non-Aboriginal
adults in the workforce was 66%; the participation gap was -
14%.
The employment gapA useful indicator of the financial strength of a community is the proportion of the total population who are employed. A lower proportion means that, on average, each employed person has more people to support.
The participation gap
The unemployment gap had closed by 8% since 2011, after
having widened by 5% over the previous five years.
The participation gap had closed by 5% since 2011, after
having widened by 1% over the previous five years.
The participation gap in NSW was -8% and had closed by
3% since 2011. It had changed little between 2006 and
2011.
Workforce Gap Indicators
% of unemployed in workforce
High unemployment indicates an absence of jobs in occupations for which local people have had training. High unemployment rates have many damaging effects on those unemployed and their community.
The unemployment gap between in NSW was +9% and had
closed by 2% since 2011. It had narrowed by 3% between
2006 and 2011.
In 2016, 27% of the Aboriginal population of Narrabri were
employed; 51% of the non-Aboriginal workforce were
employed; the employment gap was -25%.
The employment gap had closed by 5% since 2011, after
having widened by 3% over the previous five years.
% of adults 15+ in labour force
Employment in the workforce is the main way that people gain income and independence. When the proportion of adults in the workforce is low, communities become more dependent on income support, and poverty increases.
The unemployment gap
In 2016, 19% of the Aboriginal workforce in Narrabri were
unemployed; 5% of the non-Aboriginal workforce were
unemployed; the unemployment gap was +14%.
52%46%47%
66%66%65%
0%
10%
20%
30%
40%
50%
60%
70%
201620112006
% o
f adu
lts in
wor
kfor
ce
The participation gap:Narrabri
Aboriginal non-Aboriginal
27%21%21%
51%50%48%
0%
10%
20%
30%
40%
50%
60%
201620112006
empl
oyed
% o
f pop
ulat
ion
The employment gap:Narrabri
Aboriginal non-Aboriginal
19%
26%23%
5%4%6%0%
5%
10%
15%
20%
25%
30%
201620112006
unem
ploy
ed ra
te
The unemployment gap:Narrabri
Aboriginal non-Aboriginal
Community Portrait: Narrabri LGA page 19
•••••
•••••
•••••
•••••
The proportion of 20–24 year olds in education was down by 11% since 2011, and down by 10% since 2006.
The proportion of 25+ year olds in education was down by 3% since 2011, and down by 2% since 2006.
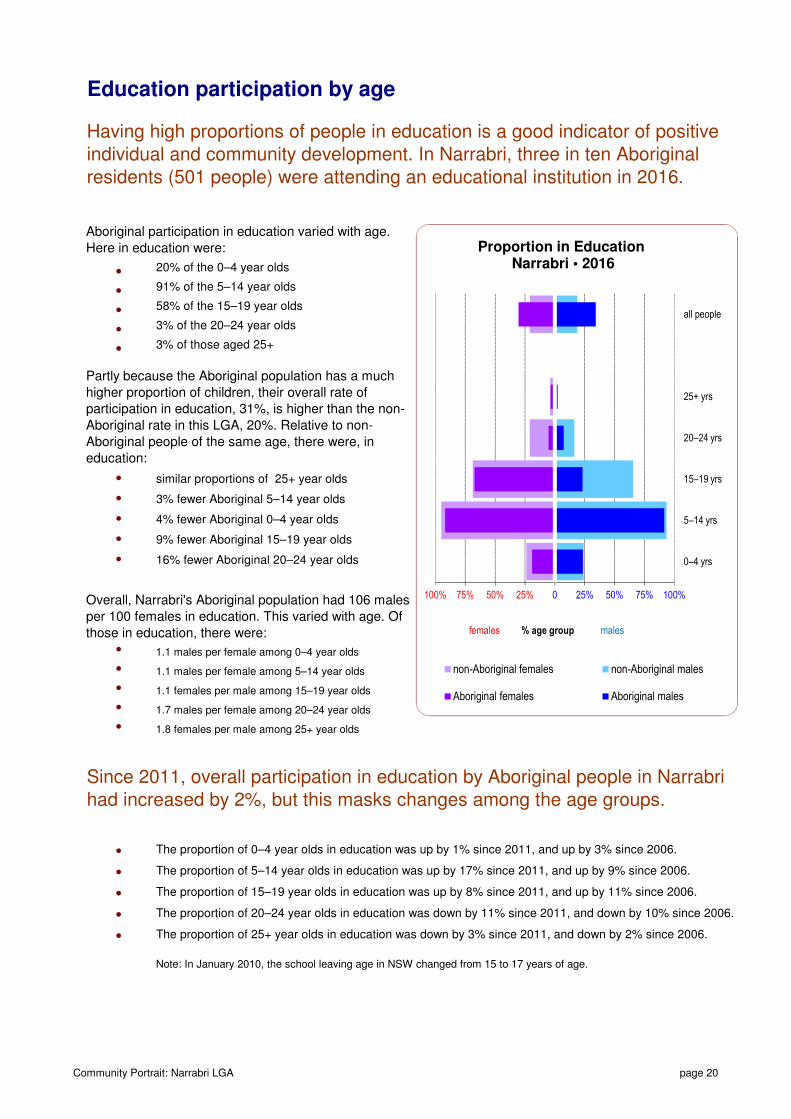
Partly because the Aboriginal population has a much
higher proportion of children, their overall rate of
participation in education, 31%, is higher than the non-
Aboriginal rate in this LGA, 20%. Relative to non-
Aboriginal people of the same age, there were, in
education:
1.1 females per male among 15–19 year olds
3% of those aged 25+
Aboriginal participation in education varied with age.
Here in education were:
16% fewer Aboriginal 20–24 year olds
similar proportions of 25+ year olds
Having high proportions of people in education is a good indicator of positive individual and community development. In Narrabri, three in ten Aboriginal residents (501 people) were attending an educational institution in 2016.
Education participation by age
The proportion of 5–14 year olds in education was up by 17% since 2011, and up by 9% since 2006.
3% fewer Aboriginal 5–14 year olds
The proportion of 15–19 year olds in education was up by 8% since 2011, and up by 11% since 2006.
9% fewer Aboriginal 15–19 year olds
The proportion of 0–4 year olds in education was up by 1% since 2011, and up by 3% since 2006.
1.1 males per female among 0–4 year olds
Overall, Narrabri's Aboriginal population had 106 males
per 100 females in education. This varied with age. Of
those in education, there were:
3% of the 20–24 year olds
91% of the 5–14 year olds
20% of the 0–4 year olds
1.1 males per female among 5–14 year olds
58% of the 15–19 year olds
1.8 females per male among 25+ year olds
Since 2011, overall participation in education by Aboriginal people in Narrabri had increased by 2%, but this masks changes among the age groups.
1.7 males per female among 20–24 year olds
4% fewer Aboriginal 0–4 year olds
Note: In January 2010, the school leaving age in NSW changed from 15 to 17 years of age.
100% 75% 50% 25% 0 25% 50% 75% 100%
0–4 yrs
5–14 yrs
15–19 yrs
20–24 yrs
25+ yrs
all people
Proportion in Education Narrabri • 2016
females % age group males
non-Aboriginal females non-Aboriginal males
Aboriginal females Aboriginal males
Community Portrait: Narrabri LGA page 20
�
�
�
�
�
�
�
�
�
�
�
�
�
�
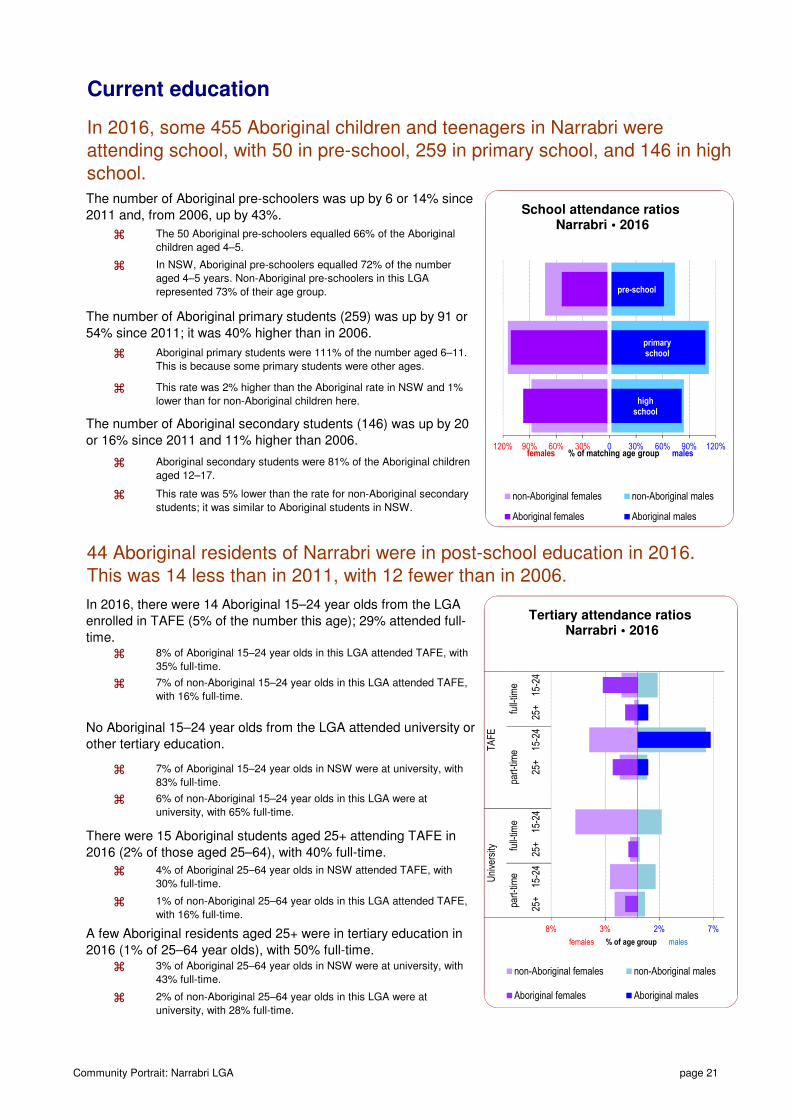
The 50 Aboriginal pre-schoolers equalled 66% of the Aboriginal
children aged 4–5.
The number of Aboriginal pre-schoolers was up by 6 or 14% since
2011 and, from 2006, up by 43%.
7% of Aboriginal 15–24 year olds in NSW were at university, with
83% full-time.
44 Aboriginal residents of Narrabri were in post-school education in 2016. This was 14 less than in 2011, with 12 fewer than in 2006.
4% of Aboriginal 25–64 year olds in NSW attended TAFE, with
30% full-time.
There were 15 Aboriginal students aged 25+ attending TAFE in
2016 (2% of those aged 25–64), with 40% full-time.
A few Aboriginal residents aged 25+ were in tertiary education in
2016 (1% of 25–64 year olds), with 50% full-time.
2% of non-Aboriginal 25–64 year olds in this LGA were at
university, with 28% full-time.
8% of Aboriginal 15–24 year olds in this LGA attended TAFE, with
35% full-time.
The number of Aboriginal primary students (259) was up by 91 or
54% since 2011; it was 40% higher than in 2006.
Current education
1% of non-Aboriginal 25–64 year olds in this LGA attended TAFE,
with 16% full-time.
In 2016, some 455 Aboriginal children and teenagers in Narrabri were attending school, with 50 in pre-school, 259 in primary school, and 146 in high school.
The number of Aboriginal secondary students (146) was up by 20
or 16% since 2011 and 11% higher than 2006.
Aboriginal primary students were 111% of the number aged 6–11.
This is because some primary students were other ages.
7% of non-Aboriginal 15–24 year olds in this LGA attended TAFE,
with 16% full-time.
6% of non-Aboriginal 15–24 year olds in this LGA were at
university, with 65% full-time.
In NSW, Aboriginal pre-schoolers equalled 72% of the number
aged 4–5 years. Non-Aboriginal pre-schoolers in this LGA
represented 73% of their age group.
This rate was 2% higher than the Aboriginal rate in NSW and 1%
lower than for non-Aboriginal children here.
In 2016, there were 14 Aboriginal 15–24 year olds from the LGA
enrolled in TAFE (5% of the number this age); 29% attended full-
time.
This rate was 5% lower than the rate for non-Aboriginal secondary
students; it was similar to Aboriginal students in NSW.
Aboriginal secondary students were 81% of the Aboriginal children
aged 12–17.
No Aboriginal 15–24 year olds from the LGA attended university or
other tertiary education.
3% of Aboriginal 25–64 year olds in NSW were at university, with
43% full-time.
pre-school
primary school
high school
120% 90% 60% 30% 0 30% 60% 90% 120%
School attendance ratios Narrabri • 2016
females % of matching age group males
non-Aboriginal females non-Aboriginal males
Aboriginal females Aboriginal males
8% 3% 2% 7%
15-2
425
+15
-24
25+
15-2
425
+15
-24
25+
full-
time
part-
time
full-
time
part-
time
TAFE
Uni
vers
ity
Tertiary attendance ratios Narrabri • 2016
females % of age group males
non-Aboriginal females non-Aboriginal males
Aboriginal females Aboriginal males
Community Portrait: Narrabri LGA page 21
�
�
�
�
�
�
�
�
�
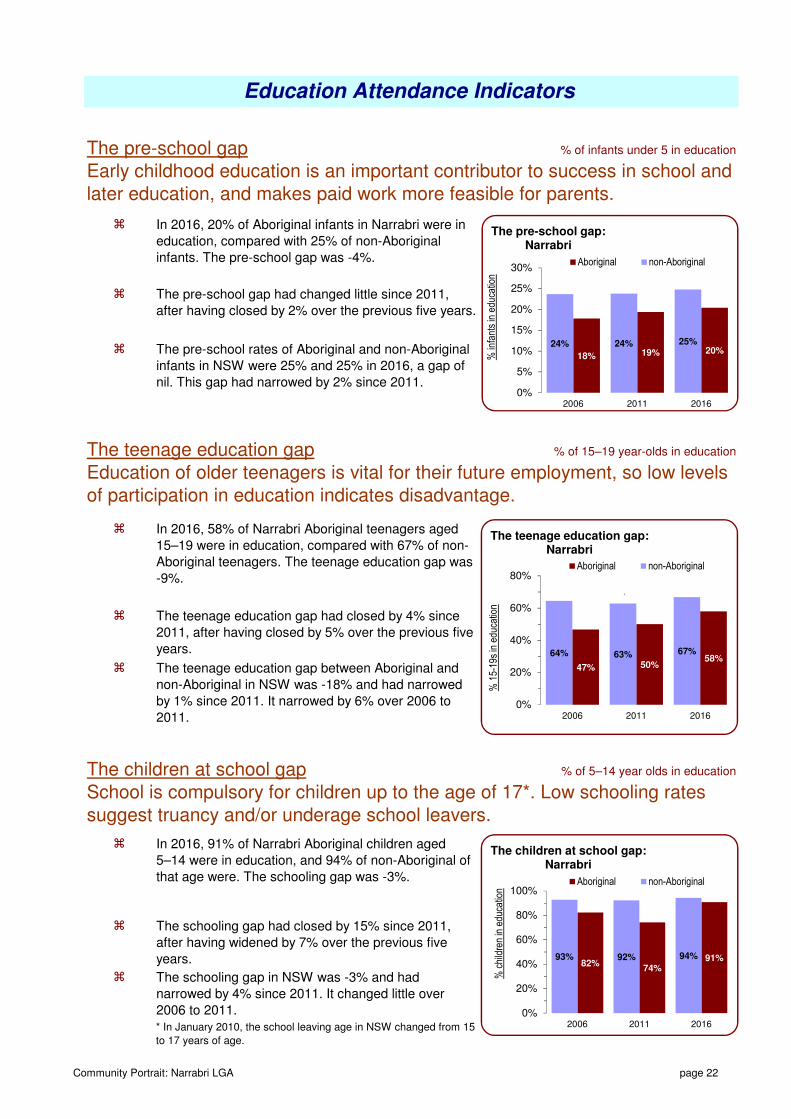
The teenage education gap
School is compulsory for children up to the age of 17*. Low schooling rates suggest truancy and/or underage school leavers.
The schooling gap in NSW was -3% and had
narrowed by 4% since 2011. It changed little over
2006 to 2011.
In 2016, 58% of Narrabri Aboriginal teenagers aged
15–19 were in education, compared with 67% of non-
Aboriginal teenagers. The teenage education gap was
-9%.
The schooling gap had closed by 15% since 2011,
after having widened by 7% over the previous five
years.
Education of older teenagers is vital for their future employment, so low levels of participation in education indicates disadvantage.
In 2016, 20% of Aboriginal infants in Narrabri were in
education, compared with 25% of non-Aboriginal
infants. The pre-school gap was -4%.
% of infants under 5 in educationThe pre-school gapEarly childhood education is an important contributor to success in school and later education, and makes paid work more feasible for parents.
% of 15–19 year-olds in education
The pre-school rates of Aboriginal and non-Aboriginal
infants in NSW were 25% and 25% in 2016, a gap of
nil. This gap had narrowed by 2% since 2011.
In 2016, 91% of Narrabri Aboriginal children aged
5–14 were in education, and 94% of non-Aboriginal of
that age were. The schooling gap was -3%.
The teenage education gap between Aboriginal and
non-Aboriginal in NSW was -18% and had narrowed
by 1% since 2011. It narrowed by 6% over 2006 to
2011.
% of 5–14 year olds in educationThe children at school gap
The teenage education gap had closed by 4% since
2011, after having closed by 5% over the previous five
years.
Education Attendance Indicators
The pre-school gap had changed little since 2011,
after having closed by 2% over the previous five years.
* In January 2010, the school leaving age in NSW changed from 15
to 17 years of age.
20%19%18%
25%24%24%
0%
5%
10%
15%
20%
25%
30%
201620112006
% in
fant
s in
edu
catio
n
The pre-school gap:Narrabri
Aboriginal non-Aboriginal
58%50%47%
67%63%64%
0%
20%
40%
60%
80%
201620112006
% 1
5-19
s in
edu
catio
n
The teenage education gap:Narrabri
Aboriginal non-Aboriginal
1
91%74%
82%94%92%93%
0%
20%
40%
60%
80%
100%
201620112006
% c
hild
ren
in e
duca
tion
The children at school gap:Narrabri
Aboriginal non-Aboriginal
Community Portrait: Narrabri LGA page 22
�
�
�
�
�
�
�
�
�
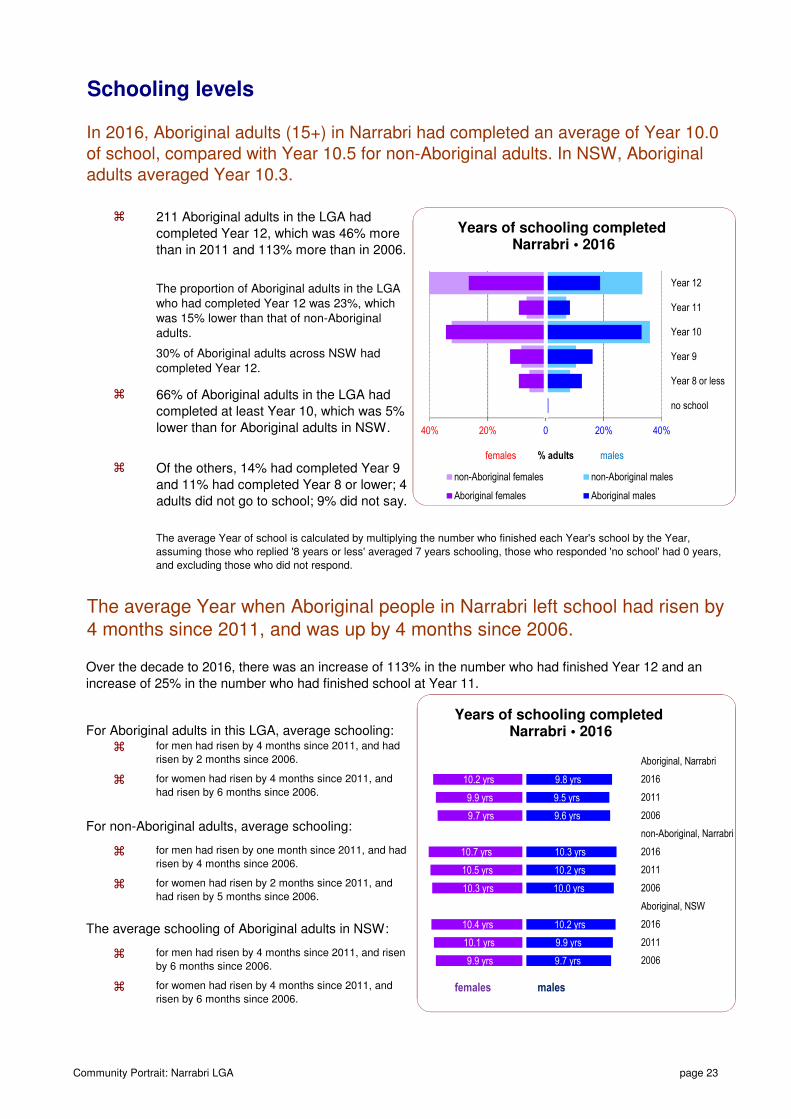
211 Aboriginal adults in the LGA had
completed Year 12, which was 46% more
than in 2011 and 113% more than in 2006.
for women had risen by 4 months since 2011, and
risen by 6 months since 2006.
66% of Aboriginal adults in the LGA had
completed at least Year 10, which was 5%
lower than for Aboriginal adults in NSW.
For non-Aboriginal adults, average schooling:
for men had risen by one month since 2011, and had
risen by 4 months since 2006.
for men had risen by 4 months since 2011, and had
risen by 2 months since 2006.
The average Year when Aboriginal people in Narrabri left school had risen by 4 months since 2011, and was up by 4 months since 2006.
Of the others, 14% had completed Year 9
and 11% had completed Year 8 or lower; 4
adults did not go to school; 9% did not say.
The average schooling of Aboriginal adults in NSW:
for men had risen by 4 months since 2011, and risen
by 6 months since 2006.
The average Year of school is calculated by multiplying the number who finished each Year's school by the Year,
assuming those who replied '8 years or less' averaged 7 years schooling, those who responded 'no school' had 0 years,
and excluding those who did not respond.
for women had risen by 4 months since 2011, and
had risen by 6 months since 2006.
For Aboriginal adults in this LGA, average schooling:
30% of Aboriginal adults across NSW had
completed Year 12.
Schooling levels
The proportion of Aboriginal adults in the LGA
who had completed Year 12 was 23%, which
was 15% lower than that of non-Aboriginal
adults.
for women had risen by 2 months since 2011, and
had risen by 5 months since 2006.
In 2016, Aboriginal adults (15+) in Narrabri had completed an average of Year 10.0 of school, compared with Year 10.5 for non-Aboriginal adults. In NSW, Aboriginal adults averaged Year 10.3.
Over the decade to 2016, there was an increase of 113% in the number who had finished Year 12 and an
increase of 25% in the number who had finished school at Year 11.
40% 20% 0 20% 40%
Year 12
Year 11
Year 10
Year 9
Year 8 or less
no school
Years of schooling completed Narrabri • 2016
females % adults males
non-Aboriginal females non-Aboriginal males
Aboriginal females Aboriginal males
9.8 yrs
9.5 yrs
9.6 yrs
10.3 yrs
10.2 yrs
10.0 yrs
10.2 yrs
9.9 yrs
9.7 yrs
10.2 yrs
9.9 yrs
9.7 yrs
10.7 yrs
10.5 yrs
10.3 yrs
10.4 yrs
10.1 yrs
9.9 yrs
Aboriginal, Narrabri
2016
2011
2006
non-Aboriginal, Narrabri
2016
2011
2006
Aboriginal, NSW
2016
2011
2006
females males
Years of schooling completed Narrabri • 2016
Community Portrait: Narrabri LGA page 23
�
�
�
�
�
�
% of adults (15+) who have left school
average school Year completed
The Year 12 gap
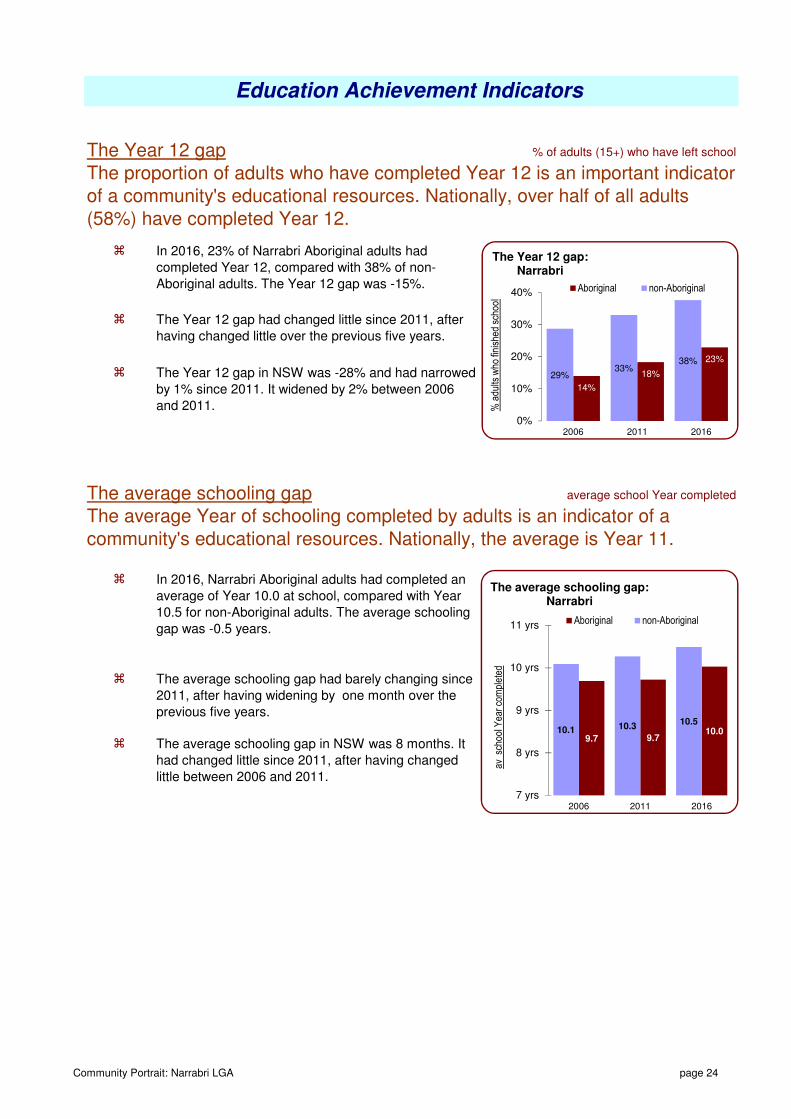
In 2016, 23% of Narrabri Aboriginal adults had
completed Year 12, compared with 38% of non-
Aboriginal adults. The Year 12 gap was -15%.
The Year 12 gap had changed little since 2011, after
having changed little over the previous five years.
The average schooling gapThe average Year of schooling completed by adults is an indicator of a community's educational resources. Nationally, the average is Year 11.
In 2016, Narrabri Aboriginal adults had completed an
average of Year 10.0 at school, compared with Year
10.5 for non-Aboriginal adults. The average schooling
gap was -0.5 years.
The average schooling gap in NSW was 8 months. It
had changed little since 2011, after having changed
little between 2006 and 2011.
The average schooling gap had barely changing since
2011, after having widening by one month over the
previous five years.
The proportion of adults who have completed Year 12 is an important indicator of a community's educational resources. Nationally, over half of all adults (58%) have completed Year 12.
The Year 12 gap in NSW was -28% and had narrowed
by 1% since 2011. It widened by 2% between 2006
and 2011.
Education Achievement Indicators
23%
18%
14%
38%33%
29%
0%
10%
20%
30%
40%
201620112006
% a
dults
who
fini
shed
sch
ool
The Year 12 gap:Narrabri
Aboriginal non-Aboriginal
10.09.79.7
10.510.310.1
7 yrs
8 yrs
9 yrs
10 yrs
11 yrs
201620112006
av s
choo
l Yea
r com
plet
ed
The average schooling gap:Narrabri
Aboriginal non-Aboriginal
Community Portrait: Narrabri LGA page 24
�
�
•
•
•
•
•
•
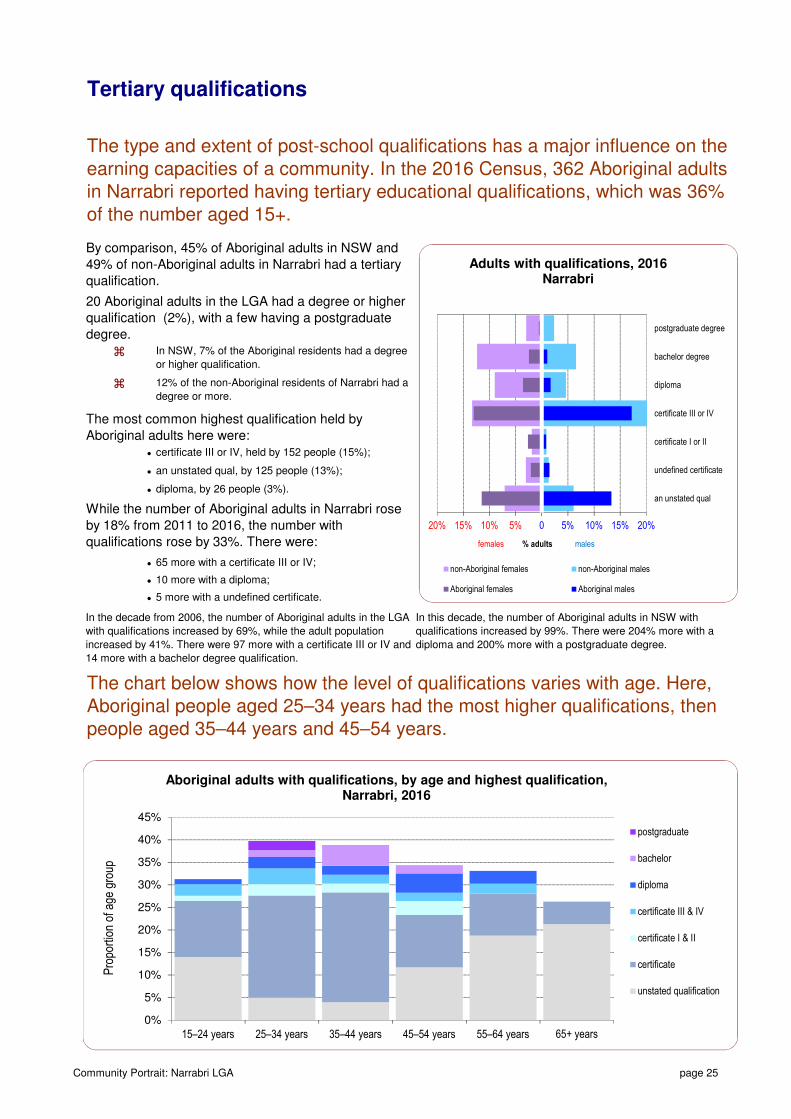
20 Aboriginal adults in the LGA had a degree or higher
qualification (2%), with a few having a postgraduate
degree.
certificate III or IV, held by 152 people (15%);
While the number of Aboriginal adults in Narrabri rose
by 18% from 2011 to 2016, the number with
qualifications rose by 33%. There were:
In this decade, the number of Aboriginal adults in NSW with
qualifications increased by 99%. There were 204% more with a
diploma and 200% more with a postgraduate degree.
diploma, by 26 people (3%).
an unstated qual, by 125 people (13%);
10 more with a diploma;
The most common highest qualification held by
Aboriginal adults here were:
In the decade from 2006, the number of Aboriginal adults in the LGA
with qualifications increased by 69%, while the adult population
increased by 41%. There were 97 more with a certificate III or IV and
14 more with a bachelor degree qualification.
By comparison, 45% of Aboriginal adults in NSW and
49% of non-Aboriginal adults in Narrabri had a tertiary
qualification.
Tertiary qualifications
65 more with a certificate III or IV;
The chart below shows how the level of qualifications varies with age. Here, Aboriginal people aged 25–34 years had the most higher qualifications, then people aged 35–44 years and 45–54 years.
In NSW, 7% of the Aboriginal residents had a degree
or higher qualification.
12% of the non-Aboriginal residents of Narrabri had a
degree or more.
The type and extent of post-school qualifications has a major influence on the earning capacities of a community. In the 2016 Census, 362 Aboriginal adults in Narrabri reported having tertiary educational qualifications, which was 36% of the number aged 15+.
5 more with a undefined certificate.
20% 15% 10% 5% 0 5% 10% 15% 20%
postgraduate degree
bachelor degree
diploma
certificate III or IV
certificate I or II
undefined certificate
an unstated qual
Adults with qualifications, 2016Narrabri
females % adults males
non-Aboriginal females non-Aboriginal males
Aboriginal females Aboriginal males
0%
5%
10%
15%
20%
25%
30%
35%
40%
45%
15–24 years 25–34 years 35–44 years 45–54 years 55–64 years 65+ years
Pro
port
ion
of a
ge g
roup
Aboriginal adults with qualifications, by age and highest qualification,Narrabri, 2016
postgraduate
bachelor
diploma
certificate III & IV
certificate I & II
certificate
unstated qualification
Community Portrait: Narrabri LGA page 25
�
�
�
�
�
�
�
�
�
% of adults 15+ with a degree or higher qualification
The qualification gap
The degree gap
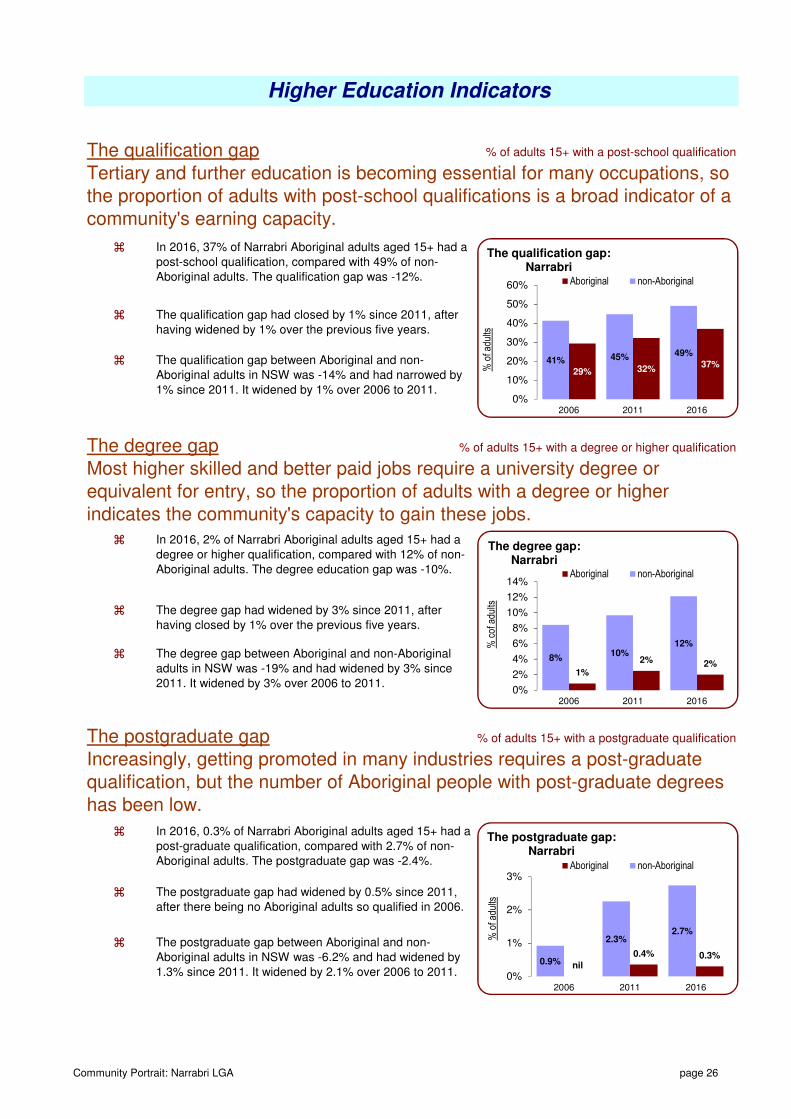
In 2016, 37% of Narrabri Aboriginal adults aged 15+ had a
post-school qualification, compared with 49% of non-
Aboriginal adults. The qualification gap was -12%.
The degree gap had widened by 3% since 2011, after
having closed by 1% over the previous five years.
% of adults 15+ with a post-school qualification
Higher Education Indicators
Most higher skilled and better paid jobs require a university degree or equivalent for entry, so the proportion of adults with a degree or higher indicates the community's capacity to gain these jobs.
In 2016, 2% of Narrabri Aboriginal adults aged 15+ had a
degree or higher qualification, compared with 12% of non-
Aboriginal adults. The degree education gap was -10%.
The degree gap between Aboriginal and non-Aboriginal
adults in NSW was -19% and had widened by 3% since
2011. It widened by 3% over 2006 to 2011.
Tertiary and further education is becoming essential for many occupations, so the proportion of adults with post-school qualifications is a broad indicator of a community's earning capacity.
The qualification gap had closed by 1% since 2011, after
having widened by 1% over the previous five years.
% of adults 15+ with a postgraduate qualification
The qualification gap between Aboriginal and non-
Aboriginal adults in NSW was -14% and had narrowed by
1% since 2011. It widened by 1% over 2006 to 2011.
Increasingly, getting promoted in many industries requires a post-graduate qualification, but the number of Aboriginal people with post-graduate degrees has been low.
The postgraduate gap
The postgraduate gap between Aboriginal and non-
Aboriginal adults in NSW was -6.2% and had widened by
1.3% since 2011. It widened by 2.1% over 2006 to 2011.
The postgraduate gap had widened by 0.5% since 2011,
after there being no Aboriginal adults so qualified in 2006.
In 2016, 0.3% of Narrabri Aboriginal adults aged 15+ had a
post-graduate qualification, compared with 2.7% of non-
Aboriginal adults. The postgraduate gap was -2.4%.
37%32%29%
49%45%41%
0%
10%
20%
30%
40%
50%
60%
201620112006
% o
f adu
lts
The qualification gap:Narrabri
Aboriginal non-Aboriginal
2%2%
1%
12%10%
8%
0%
2%
4%
6%
8%
10%
12%
14%
201620112006
% c
of a
dults
The degree gap:Narrabri
Aboriginal non-Aboriginal
0.3%0.4%
nil
2.7%2.3%
0.9%
0%
1%
2%
3%
201620112006
% o
f adu
lts
The postgraduate gap:Narrabri
Aboriginal non-Aboriginal
Community Portrait: Narrabri LGA page 26
�
�
�
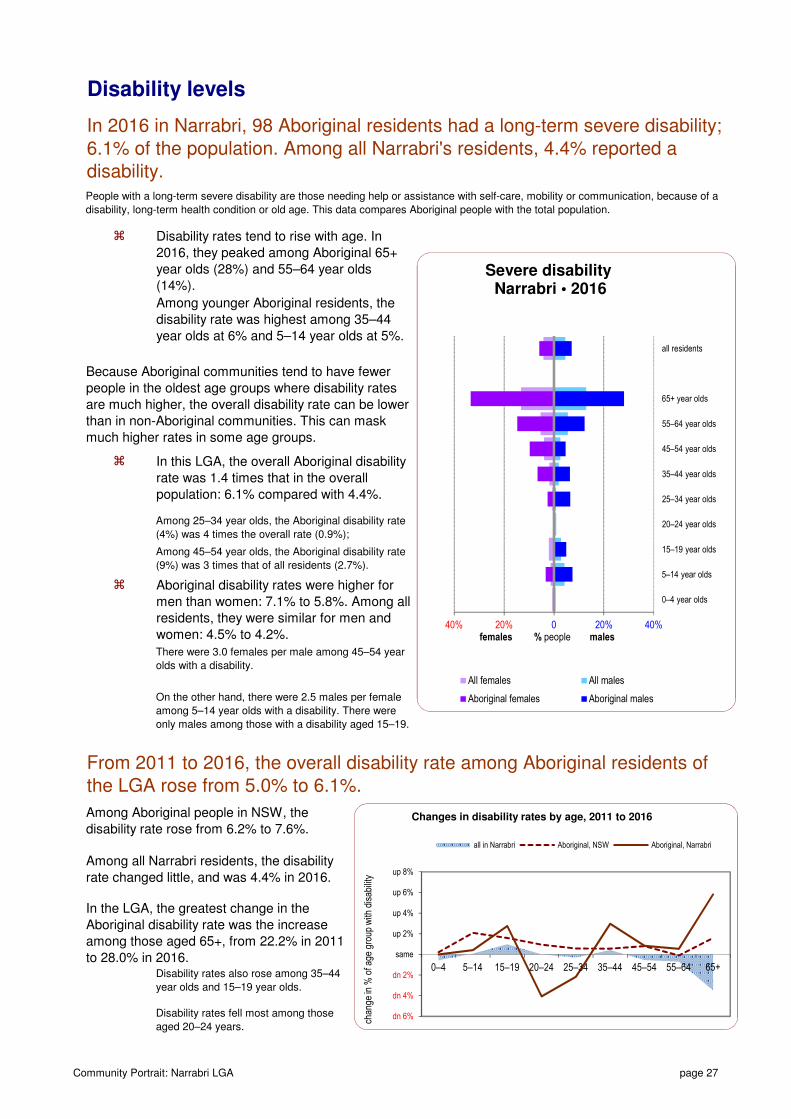
Disability rates tend to rise with age. In
2016, they peaked among Aboriginal 65+
year olds (28%) and 55–64 year olds
(14%).
There were 3.0 females per male among 45–54 year
olds with a disability.
Among 45–54 year olds, the Aboriginal disability rate
(9%) was 3 times that of all residents (2.7%).
Among younger Aboriginal residents, the
disability rate was highest among 35–44
year olds at 6% and 5–14 year olds at 5%.
From 2011 to 2016, the overall disability rate among Aboriginal residents of the LGA rose from 5.0% to 6.1%.
Among Aboriginal people in NSW, the
disability rate rose from 6.2% to 7.6%.
People with a long-term severe disability are those needing help or assistance with self-care, mobility or communication, because of a
disability, long-term health condition or old age. This data compares Aboriginal people with the total population.
In this LGA, the overall Aboriginal disability
rate was 1.4 times that in the overall
population: 6.1% compared with 4.4%.
Because Aboriginal communities tend to have fewer
people in the oldest age groups where disability rates
are much higher, the overall disability rate can be lower
than in non-Aboriginal communities. This can mask
much higher rates in some age groups.
In 2016 in Narrabri, 98 Aboriginal residents had a long-term severe disability; 6.1% of the population. Among all Narrabri's residents, 4.4% reported a disability.
Among 25–34 year olds, the Aboriginal disability rate
(4%) was 4 times the overall rate (0.9%);
Disability levels
On the other hand, there were 2.5 males per female
among 5–14 year olds with a disability. There were
only males among those with a disability aged 15–19.
Aboriginal disability rates were higher for
men than women: 7.1% to 5.8%. Among all
residents, they were similar for men and
women: 4.5% to 4.2%.
Disability rates also rose among 35–44
year olds and 15–19 year olds.
Disability rates fell most among those
aged 20–24 years.
Among all Narrabri residents, the disability
rate changed little, and was 4.4% in 2016.
In the LGA, the greatest change in the
Aboriginal disability rate was the increase
among those aged 65+, from 22.2% in 2011
to 28.0% in 2016.
40% 20% 0 20% 40%
0–4 year olds
5–14 year olds
15–19 year olds
20–24 year olds
25–34 year olds
35–44 year olds
45–54 year olds
55–64 year olds
65+ year olds
all residents
Severe disabilityNarrabri • 2016
females % people males
All females All males
Aboriginal females Aboriginal males
dn 6%
dn 4%
dn 2%
same
up 2%
up 4%
up 6%
up 8%
0–4 5–14 15–19 20–24 25–34 35–44 45–54 55–64 65+
chan
ge in
% o
f age
gro
up w
ith d
isab
ility
Changes in disability rates by age, 2011 to 2016
all in Narrabri Aboriginal, NSW Aboriginal, Narrabri
Community Portrait: Narrabri LGA page 27
�
�
�
�
�
�
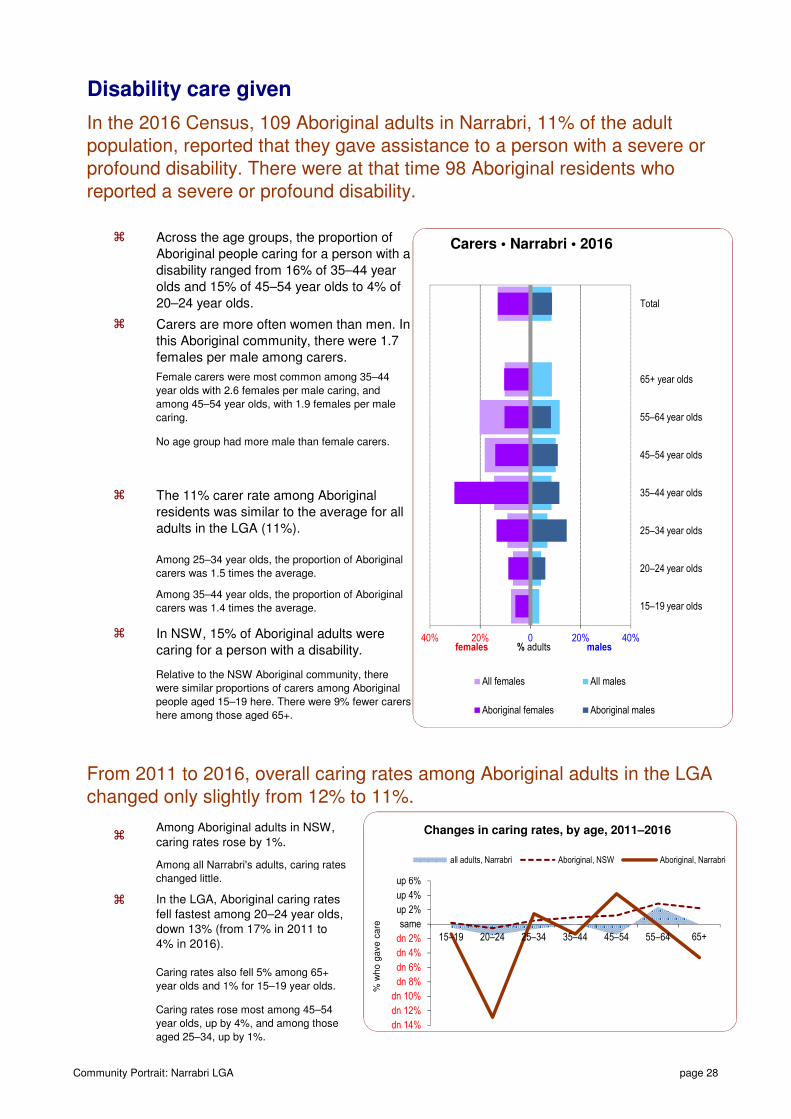
No age group had more male than female carers.
Female carers were most common among 35–44
year olds with 2.6 females per male caring, and
among 45–54 year olds, with 1.9 females per male
caring.
The 11% carer rate among Aboriginal
residents was similar to the average for all
adults in the LGA (11%).
Relative to the NSW Aboriginal community, there
were similar proportions of carers among Aboriginal
people aged 15–19 here. There were 9% fewer carers
here among those aged 65+.
Across the age groups, the proportion of
Aboriginal people caring for a person with a
disability ranged from 16% of 35–44 year
olds and 15% of 45–54 year olds to 4% of
20–24 year olds.
In the 2016 Census, 109 Aboriginal adults in Narrabri, 11% of the adult population, reported that they gave assistance to a person with a severe or profound disability. There were at that time 98 Aboriginal residents who reported a severe or profound disability.
Among 35–44 year olds, the proportion of Aboriginal
carers was 1.4 times the average.
In NSW, 15% of Aboriginal adults were
caring for a person with a disability.
From 2011 to 2016, overall caring rates among Aboriginal adults in the LGA changed only slightly from 12% to 11%.
Caring rates rose most among 45–54
year olds, up by 4%, and among those
aged 25–34, up by 1%.
Among all Narrabri's adults, caring rates
changed little.
Among Aboriginal adults in NSW,
caring rates rose by 1%.
Disability care given
Among 25–34 year olds, the proportion of Aboriginal
carers was 1.5 times the average.
Carers are more often women than men. In
this Aboriginal community, there were 1.7
females per male among carers.
Caring rates also fell 5% among 65+
year olds and 1% for 15–19 year olds.
In the LGA, Aboriginal caring rates
fell fastest among 20–24 year olds,
down 13% (from 17% in 2011 to
4% in 2016).
40% 20% 0 20% 40%
15–19 year olds
20–24 year olds
25–34 year olds
35–44 year olds
45–54 year olds
55–64 year olds
65+ year olds
Total
Carers • Narrabri • 2016
females % adults males
All females All males
Aboriginal females Aboriginal males
dn 14%
dn 12%
dn 10%
dn 8%
dn 6%
dn 4%
dn 2%
same
up 2%
up 4%
up 6%
15–19 20–24 25–34 35–44 45–54 55–64 65+
% w
ho g
ave c
are
Changes in caring rates, by age, 2011–2016
all adults, Narrabri Aboriginal, NSW Aboriginal, Narrabri
Community Portrait: Narrabri LGA page 28
�
�
�
�
�
�
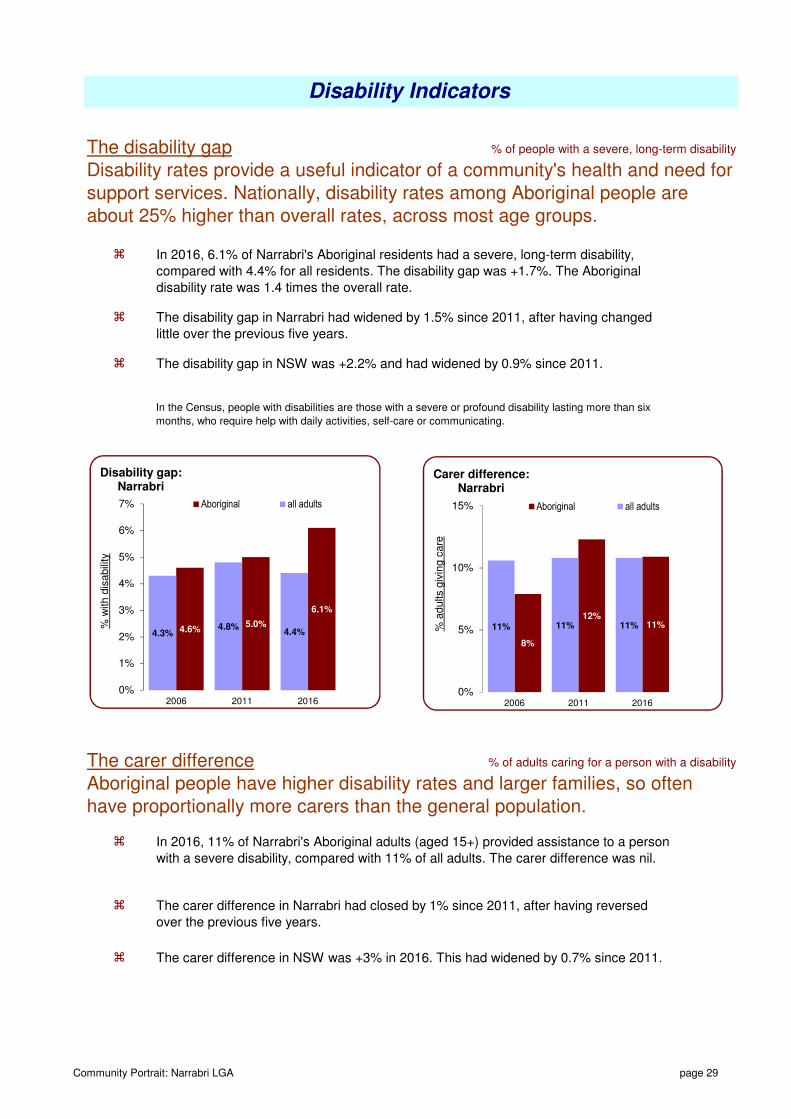
The disability gap in NSW was +2.2% and had widened by 0.9% since 2011.
% of adults caring for a person with a disability
Aboriginal people have higher disability rates and larger families, so often have proportionally more carers than the general population.
The disability gap in Narrabri had widened by 1.5% since 2011, after having changed
little over the previous five years.
In 2016, 6.1% of Narrabri's Aboriginal residents had a severe, long-term disability,
compared with 4.4% for all residents. The disability gap was +1.7%. The Aboriginal
disability rate was 1.4 times the overall rate.
The carer difference
Disability rates provide a useful indicator of a community's health and need for support services. Nationally, disability rates among Aboriginal people are about 25% higher than overall rates, across most age groups.
% of people with a severe, long-term disability
In the Census, people with disabilities are those with a severe or profound disability lasting more than six
months, who require help with daily activities, self-care or communicating.
In 2016, 11% of Narrabri's Aboriginal adults (aged 15+) provided assistance to a person
with a severe disability, compared with 11% of all adults. The carer difference was nil.
The carer difference in Narrabri had closed by 1% since 2011, after having reversed
over the previous five years.
Disability Indicators
The disability gap
The carer difference in NSW was +3% in 2016. This had widened by 0.7% since 2011.
6.1%
5.0%4.6% 4.4%
4.8%4.3%
0%
1%
2%
3%
4%
5%
6%
7%
201620112006
% w
ith d
isabili
ty
Disability gap:Narrabri
Aboriginal all adults
11%12%
8%
11%11%11%
0%
5%
10%
15%
201620112006
% a
dults g
ivin
g c
are
Carer difference:Narrabri
Aboriginal all adults
Community Portrait: Narrabri LGA page 29