Embed Size (px)
Citation preview
7/23/2019 Comparation of Project Evaluation Using Cost Benefit Analysis
http://slidepdf.com/reader/full/comparation-of-project-evaluation-using-cost-benefit-analysis 1/13
1
Second International Symposium on Engineering Systems MIT, Cambridge, Massachusetts, June 15-17, 2009
Comparison of Project Evaluation Using Cost-Benefit Analysis and Multi-
Attribute Tradespace Exploration in the Transportation Domain
Julia Nickel1, Adam M. Ross
2 and Donna H. Rhodes
3
Massachusetts Institute of Technology, Cambridge, MA, 02139
The paper discusses the application of two decision methods, Cost-Benefit Analysis (CBA) and
Multi-Attribute Tradespace Exploration (MATE), to the selection of “best” design alternativesacross two case studies in the transportation domain. The cases are an airport express for the
city of Chicago, and a freight rail line linking Lisbon, Portugal to Madrid, Spain. Through the joint use of MATE and CBA in project selection, shortcomings of CBA can be mitigated.
Additional insight is gained with MATE through the ability to explore the distribution of projectcosts and benefits and related incentives for behavioral shifts, the keeping separate of different
types of costs (for example, tangible and intangible), and the systematic exploration of a largenumber of designs early on in the process of conceptual design.
Key words: Engineering Systems, Cost-Benefit Analysis, Multi-Attribute Tradespace
Exploration, Transportation, Project Evaluation
Copyright © 2009 by Julia Nickel, Adam M. Ross and Donna H. Rhodes. Published and used byMIT ESD and CESUN with permission.
1
Introduction
“Engineering Systems” as understood by MIT’s Engineering Systems Division is the study of
enabling large-scale complex technical systems, taking into account not only their engineeringrelationships but also their relationships to public policy, management, and other social sciences.
Examples of Engineering Systems are transportation systems, energy generation and distributionsystems, or satellite systems. While very different, these systems exhibit a number of common
characteristics: long lifecycles, high price tags, and individualized or unique designs. Good and bad choices in the process of conceptual design are locked in and have long-lastingconsequences. In this situation, the exploration of a large number of designs in the early design
phase increases the odds of selecting a “good” design, where “good” is determined by specific
criteria the system stakeholders wish to use. At the same time, the evaluation of candidateengineering systems is resource-intensive because of the large number of complexities that thesesystems exhibit. Sussman identifies four kinds of complexity that are of primary concern for
1 ESD SM Student, Engineering Systems Division (ESD), 77 Massachusetts Ave, E38-575, Cambridge, MA 02139,
[email protected]!Research Scientist, ESD, 77 Massachusetts Ave, E38-575, Cambridge, MA 02139, [email protected]
3 Principal Research Scientist, ESD, 77 Massachusetts Ave, E38-575, Cambridge, MA 02139, [email protected]
7/23/2019 Comparation of Project Evaluation Using Cost Benefit Analysis
http://slidepdf.com/reader/full/comparation-of-project-evaluation-using-cost-benefit-analysis 2/13
2
Complex Large-scale Interconnected Open Socio-Technical (CLIOS) Systems: structural,evaluative, behavioral and nested complexity (Lloyd 2002; Sussman 2002). He lays out how
each of the four characteristics of CLIOS systems is fulfilled for transportation systems(Sussman 2000; Sussman 2002). “Complexity” means that a system is composed of a group of
interrelated components and subsystems, for which the degree and nature of the relationships
between them is imperfectly known, with varying directionality, magnitude and time-scales ofinteractions (Sussman 2002). “Evaluative complexity” means that multiple stakeholders exist fora system, who hold different views of what desirable and undesirable aspects of system
performance constitute. Even if the behavior of the system could be predicted accurately, whichit often cannot, different people will evaluate that behavior differently, making decision-making
difficult. The last point is particularly important in the case of transportation systems, in whichthe interests of economic stimulation and viability, a small environmental footprint, and
equitable accessibility for different population groups are often in direct competition. Methodsfor project appraisal need to account for these complexities of engineering systems. In the
context of the examples from the transportation domain in this paper, the term “projectappraisal” is used synonymously with the term “system design evaluation”.
This paper discusses the specific insights that two methods provide for project evaluation: Cost-
Benefit Analysis and Multi-Attribute Tradespace Exploration. Through the application of bothmethods to two case studies from the transportation domain, the paper demonstrates the
complementary insights provided by both methods, and the potential to thereby improvetransportation decision making. A complete application of both methods is demonstrated for
Case 1 (Chicago Airport Express), whereas the set-up of MATE and the results of a CBA arediscussed for the more complex Case 2 (Portuguese High-Speed Rail). The evaluations in this
paper are not intended to provide technical guidance but to illustrate different methods for project appraisal.
2 Cost-Benefit Analysis
Cost-Benefit Analysis (CBA) is one of the most widely accepted and applied methods for project
appraisal for large-scale infrastructure investments in the public sector (e.g., by the FederalAviation Administration, National Highway Safety Administration, Environmental Protection
Agency, European Union). CBA is a prescriptive method that provides guidance on the criteriato take into account in decision making, ensuring that the net aggregate benefits to society
outweigh net aggregate costs. Typical criteria such as reduction in emissions, delays, crash costsor noise are imposed by the policymaking bodies who designed CBA guidelines that analysts use
as references (California Department of Transportation; US Federal Highway Administration2003); CBA seeks to enumerate all direct costs and benefits to society (directly experienced,
first-order effects) of a particular design, assigns them monetary equivalents, discounts futurevalues to a Net Present Value (NPV), and adds them to a single number. In line with FHA
recommendations (US Federal Highway Administration 2003) only first-order effects arequantified in the CBA analyses cited in this paper. The differences in CBA scores among
alternatives allow a ranking of alternatives and a reduction of feasible designs to those thatwould constitute Kaldor-Hicks improvements. Recognizing suggestions for the improvement of
CBA (Wang and Liang 1995; Rivey 2007), classical CBA as referred to in this paper shares theunderstanding that is defined by the FHA in a primer on Cost-Benefit Analysis (US Federal
7/23/2019 Comparation of Project Evaluation Using Cost Benefit Analysis
http://slidepdf.com/reader/full/comparation-of-project-evaluation-using-cost-benefit-analysis 3/13
3
Highway Administration 2003). Other important studies that are typically performed alongsideCBA in project evaluation are a financial feasibility study, Economic Impact Analysis and
Environmental Impact Analysis (in the form of an Environmental Impact Analysis (EIA) orStatement). While the National Environmental Policy Act of 1969 (NEPA) requires that external
costs be mitigated, the CBA is typically performed before Economic or Environmental Impact
Analyses are conducted. CBA can therefore inform the later two analyses and mitigation costscan be included in the EIA, but an analysis of environmental consequences is not performed untilafter CBA and is typically not therein included.
CBA allows a certain transparency that helps to justify political decisions and makes possible the
comparison of different designs on a common scale. The prescription of attributes, such asemissions or reductions in delays, seeks to assure that they are sufficiently prioritized in an
evaluation. Two reasons for insufficient prioritization are the overriding of dispersed interests(e.g., emissions) by concentrated interests (e.g., trucking industry), or by agency-focused
objectives of the evaluating body that potentially conflict with the public interest.
There are, however, a number of flaws inherent in CBA (Gomez-Ibanez, Tye et al. 1999;Heinzerling and Ackerman 2002). Some of these flaws are the introduction of critical value
assumptions through the discounting of non-monetary goods, widely differing practices for themonetizing of non-monetary goods, performance of interpersonal utility comparisons and loss of
information about the distribution of costs and benefits, and the aggregation of certain anduncertain costs on a common scale. One methodological source of error when performing a CBA
is the comparison of only one, or a limited number of alternatives, to the base case. The FHAtherefore recommends that “proper” CBA should consider a “full range of reasonable
alternatives” (US Federal Highway Administration 2003). Without a systematic approach toexploring a larger number of feasible alternatives, however, the risk of sub-optimizing always
remains.
3
Multi-Attribute Tradespace Exploration
Multi-Attribute Tradespace Exploration (MATE) is a method for system design selection andgeneration developed and matured at MIT. MATE is a value-based decision and design method
for the conceptual design of complex technical systems through tradespace exploration.Developed using aerospace examples, it is ultimately intended to be useful for engineering
systems across domains. Ross and Hastings provide an extensive description of the MATE process and give example applications (Ross and Hastings 2006; Ross 2006). Nickel, Ross and
Rhodes (2009) demonstrate the first application of MATE to a design problem in thetransportation domain (Chicago airport express). This case study is referred to in abbreviated
form in this paper as Case 1. The underlying idea of MATE is the use of perceived value bystakeholders as decision metrics. MATE therefore places high importance on the preferences of
key decision makers. The method seeks to avoid suboptimal outcomes that are caused by settlingon a single point-design early on in the design process, by supporting the systematic
development and exploration of a large number of designs early on in the design process. MATE provides a framework for discovering efficient compromise solutions in multi-decision maker
tradespaces. The information obtained through the MATE process may help multiple decisionmakers with differing interests achieve an acceptable consensus faster in negotiations.
7/23/2019 Comparation of Project Evaluation Using Cost Benefit Analysis
http://slidepdf.com/reader/full/comparation-of-project-evaluation-using-cost-benefit-analysis 4/13
4
The set-up of a MATE study starts with a definition of mission objective, contexts andconstraints on the system. Key decision makers, their attributes, utilities and acceptable ranges
for each attribute are identified. Attributes are typically performance metrics that the decisionmaker values. In the next step, system concepts, mappings of function to form, and design
variables are derived. Design variables are designer-controlled, tradable quantitative parameters
that in their entirety characterize a specific design. The design variables are derived from thedesigner’s expertise and knowledge as to how an attribute can be displayed by a system, whichthen leads to the definition of systems concepts. The relationships between attributes and design
parameters and attributes and utility, including Multi-Attribute Utility (Keeney and Raiffa 1993),are modeled. The relationships modeled in the last step are sufficient to graphically display
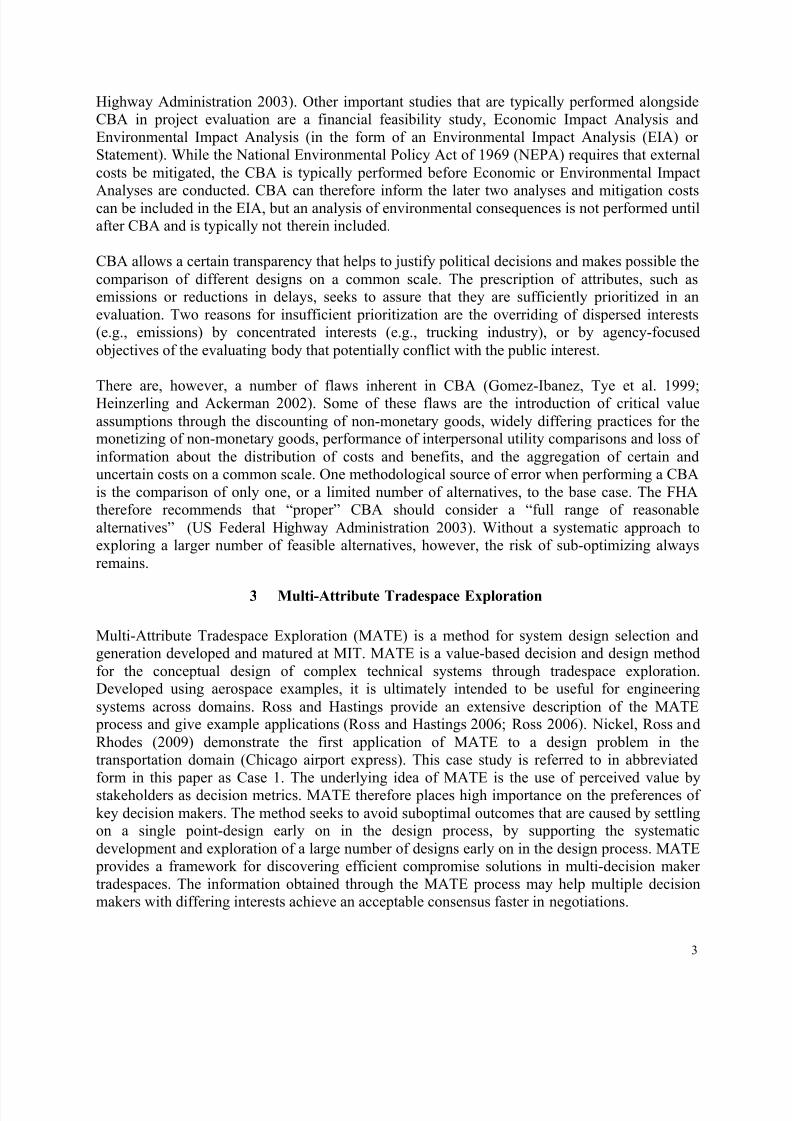
several designs in a tradespace. Utility and expense allow the display between two axes of bothdesirable and undesirable attributes for applications in the transportation domain. Expense is akin
to the idea of “negative utility” that attributes provide which the designer wants to keep at lowlevels, like development time or emissions. The idea of Single- Attribute Expense Functions was
proposed by Diller in the context of space system development expenses (Diller 2002). Theexample in (Figure 1) illustrates how a tradespace is read: The Pareto Front consists of designs
that are available at the lowest cost for a desired level of utility.
Figure 1: Tradespace for
transportation example (Source:
(Nickel, Ross et al. 2009)
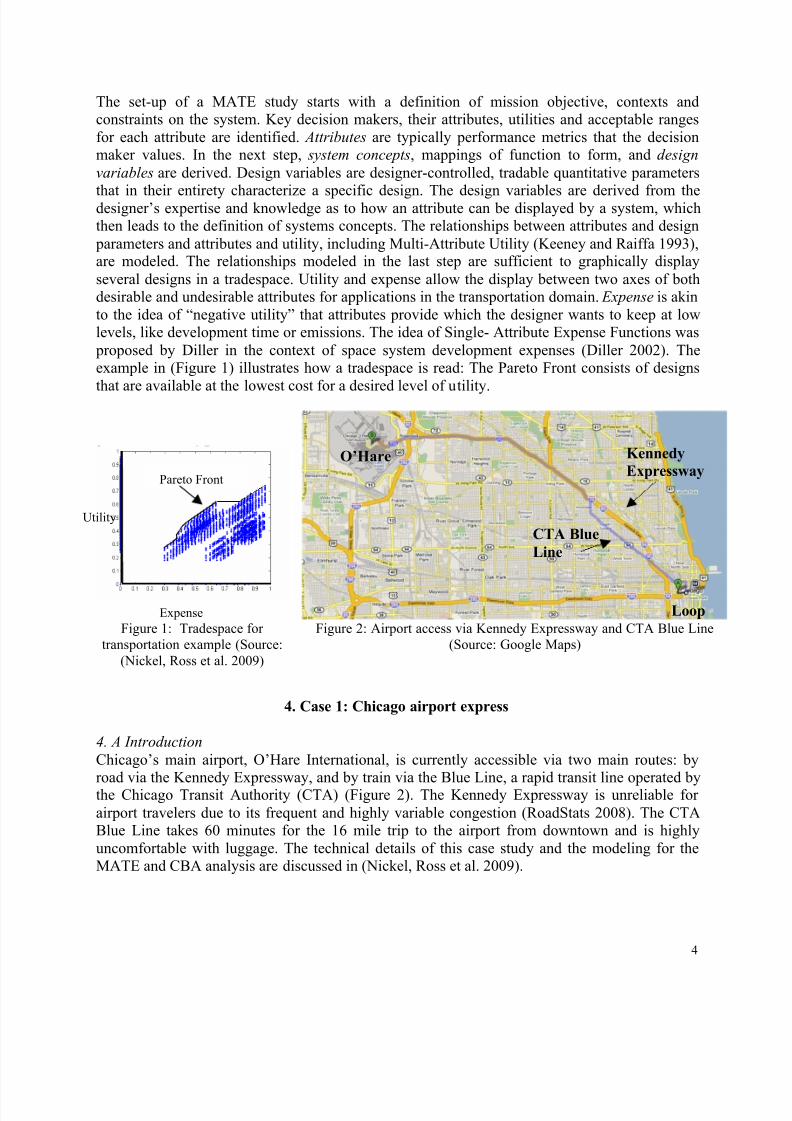
Figure 2: Airport access via Kennedy Expressway and CTA Blue Line
(Source: Google Maps)
4. Case 1: Chicago airport express
4. A Introduction
Chicago’s main airport, O’Hare International, is currently accessible via two main routes: byroad via the Kennedy Expressway, and by train via the Blue Line, a rapid transit line operated bythe Chicago Transit Authority (CTA) (Figure 2). The Kennedy Expressway is unreliable for
airport travelers due to its frequent and highly variable congestion (RoadStats 2008). The CTABlue Line takes 60 minutes for the 16 mile trip to the airport from downtown and is highly
uncomfortable with luggage. The technical details of this case study and the modeling for theMATE and CBA analysis are discussed in (Nickel, Ross et al. 2009).
Loop
O’Hare
Pareto Front
Expense
Utility
Kennedy
Expressway
CTA Blue
Line
7/23/2019 Comparation of Project Evaluation Using Cost Benefit Analysis
http://slidepdf.com/reader/full/comparation-of-project-evaluation-using-cost-benefit-analysis 5/13
5
4. B Stakeholder identificationThe main decision making stakeholders of this project are those that are expected to contribute to
the funding of the airport express: the City of Chicago, the CTA, and a Private Operator. Inaddition, the affected public and travelers to the airport have a stake but no formal decision
making power. Although application for federal grants is an option once a decision for a design
has been made, a preference for a design that could be self-financed is assumed in case noadditional funding becomes available. To leverage business experience from the private sectorand to secure a contribution to construction expenses, a private sector concessionaire (the Private
Operator) was suggested to be charged with the management of the airport express (ParsonsBrinckerhoff Consult Inc. 2006). O’Hare and airlines have been excluded as stakeholders from
the City’s technical studies with no reason given. It appears that the planners at the Mayor’soffice and the CTA do not count on funding from these parties and therefore do not pay them
much attention. An agreement with O’Hare is mentioned stating that permission is given to theCTA to modify its O’Hare terminal to accommodate an airport express (WilburSmith Associates
2004).
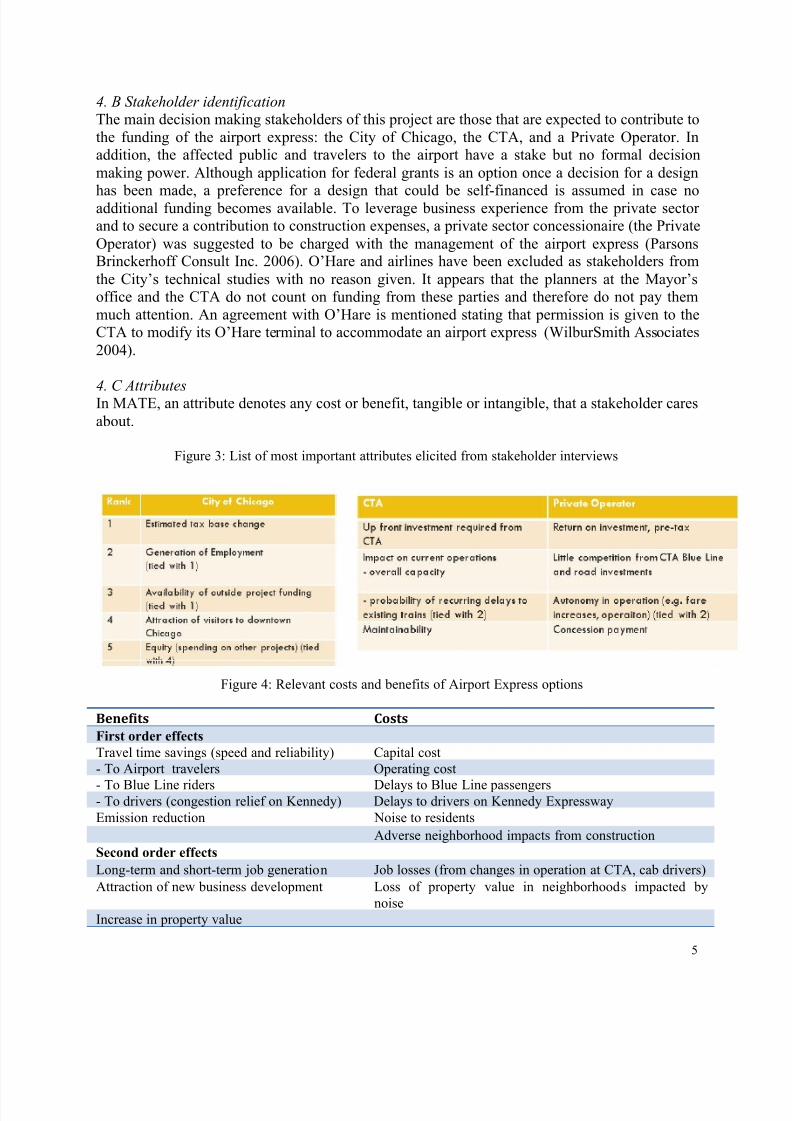
4. C AttributesIn MATE, an attribute denotes any cost or benefit, tangible or intangible, that a stakeholder cares
about.
Figure 3: List of most important attributes elicited from stakeholder interviews
Figure 4: Relevant costs and benefits of Airport Express options
!"#"$%&' )*'&'
First order effects
Travel time savings (speed and reliability) Capital cost
- To Airport travelers Operating cost
- To Blue Line riders Delays to Blue Line passengers- To drivers (congestion relief on Kennedy) Delays to drivers on Kennedy Expressway
Emission reduction Noise to residents
Adverse neighborhood impacts from construction
Second order effects
Long-term and short-term job generation Job losses (from changes in operation at CTA, cab drivers)
Attraction of new business development Loss of property value in neighborhoods impacted by
noise
Increase in property value
7/23/2019 Comparation of Project Evaluation Using Cost Benefit Analysis
http://slidepdf.com/reader/full/comparation-of-project-evaluation-using-cost-benefit-analysis 6/13
6
The lists of attributes are abbreviated versions of those that were elicited in interviews with proxy representatives for MATE, and using guidelines provided by the (US Federal Highway
Administration 2003), and the (California Department of Transportation) for CBA, respectively.Figures 3 and 4 highlight the importance of the selection method for the criteria that are
prioritized. Stakeholders in the MATE interviews expressed a more agency-focused point of
view pertaining to their respective organizations. The first order costs and benefits mandated bythe CBA guidelines were not prioritized at all by the interviewed stakeholders. The interests ofthe City of Chicago are more aligned with the second order effects of CBA, whereas the other
two stakeholders are completely detached from the CBA attributes.
4.D Generation of system conceptsThree alternative system concepts were evaluated in detail: Route 2, in which a separate right-of-
way for the airline express would be built; Bus Rapid Transit (BRT) along the KennedyExpressway, and an option in which local service would be provided by BRTs, and airport
passengers carried along the freed-up tracks of the current Blue Line (Blue Line Switch option,BLS).
4. E Calculate aggregate Cost-Benefit
The focus in the CBA is on changes in travel time, emissions, capital cost and operating cost.Five models were used to simulate cash flows over an assumed useful life of 50 years: an
emissions model from the CalTrans website (California Department of Transportation)# a self-
developed model for maintenance and operating costs, respectively, and a self-developed modelfor reductions in delays and overall running time to different groups of travelers. Construction
costs were taken from look-up tables in technical reports (WilburSmith Associates 2004; ParsonsBrinckerhoff Consult Inc. 2006).
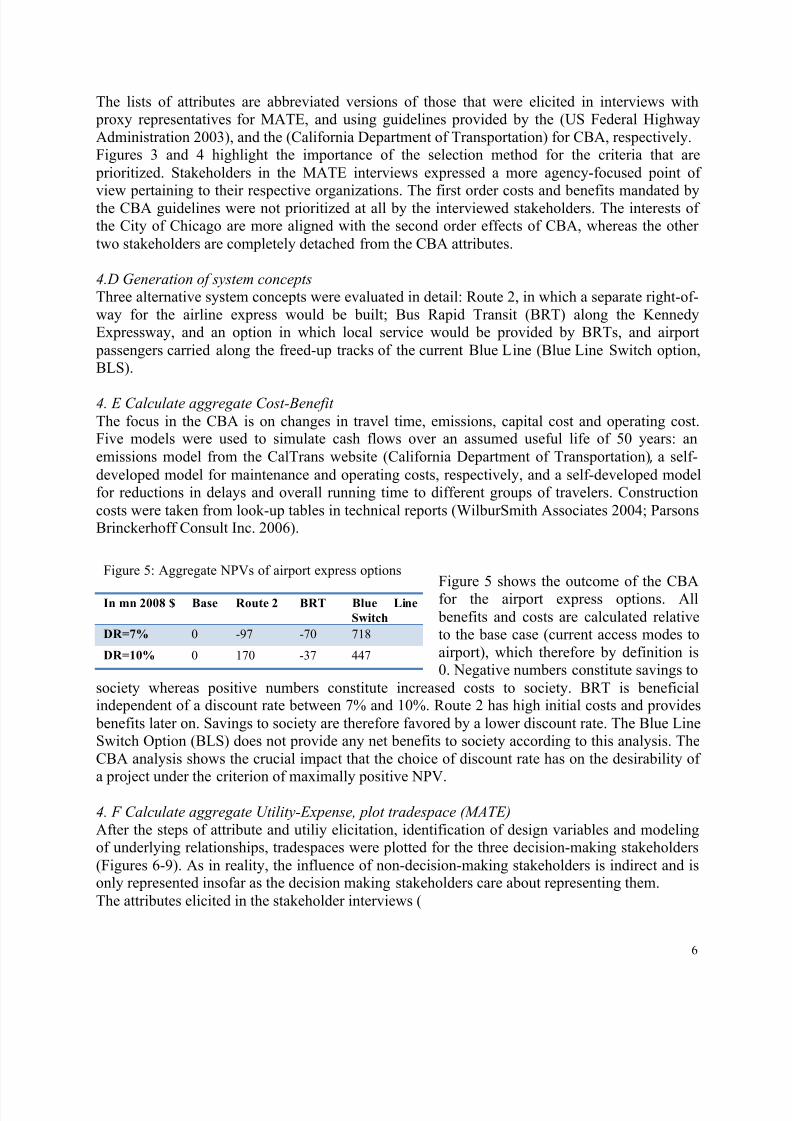
Figure 5: Aggregate NPVs of airport express options
In mn 2008 $ Base Route 2 BRT Blue Line
Switch
DR=7% 0 -97 -70 718
DR=10% 0 170 -37 447
Figure 5 shows the outcome of the CBAfor the airport express options. All
benefits and costs are calculated relativeto the base case (current access modes to
airport), which therefore by definition is0. Negative numbers constitute savings to
society whereas positive numbers constitute increased costs to society. BRT is beneficialindependent of a discount rate between 7% and 10%. Route 2 has high initial costs and provides
benefits later on. Savings to society are therefore favored by a lower discount rate. The Blue LineSwitch Option (BLS) does not provide any net benefits to society according to this analysis. The
CBA analysis shows the crucial impact that the choice of discount rate has on the desirability ofa project under the criterion of maximally positive NPV.
4. F Calculate aggregate Utility-Expense, plot tradespace (MATE)
After the steps of attribute and utiliy elicitation, identification of design variables and modelingof underlying relationships, tradespaces were plotted for the three decision-making stakeholders
(Figures 6-9). As in reality, the influence of non-decision-making stakeholders is indirect and isonly represented insofar as the decision making stakeholders care about representing them.
The attributes elicited in the stakeholder interviews (
7/23/2019 Comparation of Project Evaluation Using Cost Benefit Analysis
http://slidepdf.com/reader/full/comparation-of-project-evaluation-using-cost-benefit-analysis 7/13
7
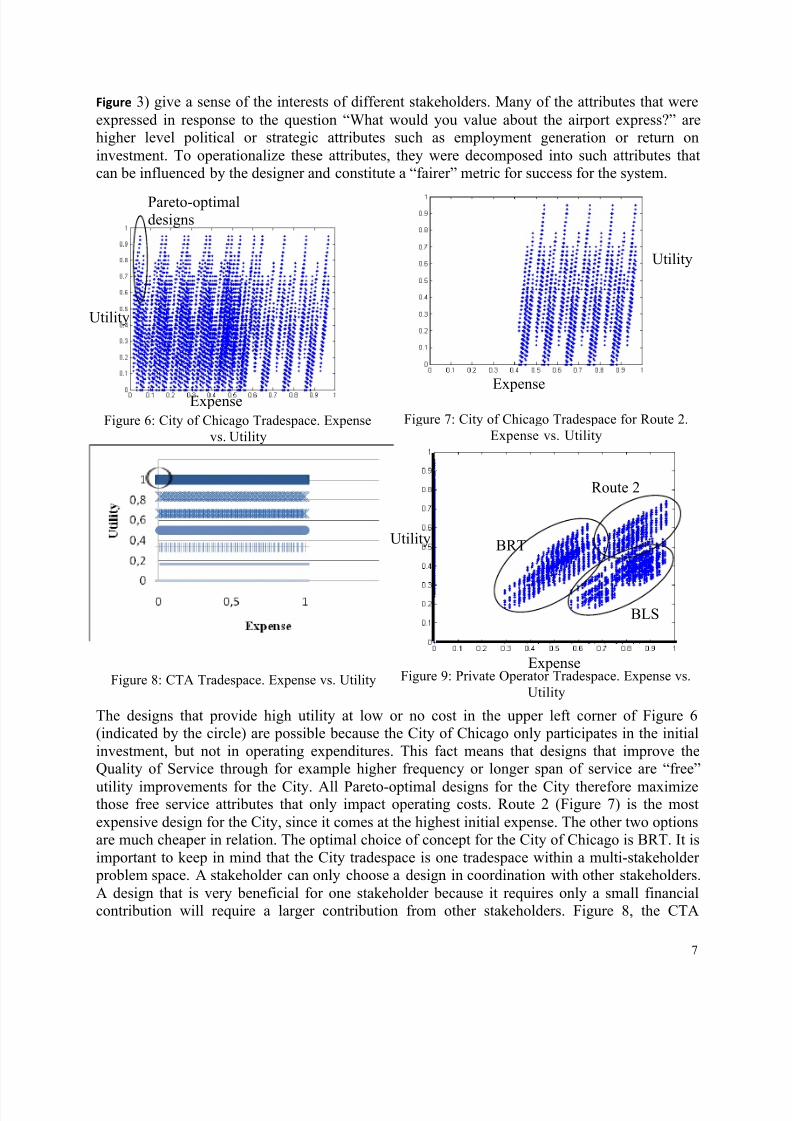
!"#$%& 3) give a sense of the interests of different stakeholders. Many of the attributes that were
expressed in response to the question “What would you value about the airport express?” arehigher level political or strategic attributes such as employment generation or return on
investment. To operationalize these attributes, they were decomposed into such attributes thatcan be influenced by the designer and constitute a “fairer” metric for success for the system.
The designs that provide high utility at low or no cost in the upper left corner of Figure 6(indicated by the circle) are possible because the City of Chicago only participates in the initial
investment, but not in operating expenditures. This fact means that designs that improve theQuality of Service through for example higher frequency or longer span of service are “free”
utility improvements for the City. All Pareto-optimal designs for the City therefore maximizethose free service attributes that only impact operating costs. Route 2 (Figure 7) is the most
expensive design for the City, since it comes at the highest initial expense. The other two optionsare much cheaper in relation. The optimal choice of concept for the City of Chicago is BRT. It is
important to keep in mind that the City tradespace is one tradespace within a multi-stakeholder problem space. A stakeholder can only choose a design in coordination with other stakeholders.
A design that is very beneficial for one stakeholder because it requires only a small financialcontribution will require a larger contribution from other stakeholders. Figure 8, the CTA
Figure 6: City of Chicago Tradespace. Expense
vs. Utility
Figure 7: City of Chicago Tradespace for Route 2.
Expense vs. Utility
Figure 9: Private Operator Tradespace. Expense vs.
Utility
Pareto-optimaldesigns
Expense
Utility
BRT
Route 2
BLS
Expense
Utility
Figure 8: CTA Tradespace. Expense vs. Utility
Utility
Expense
7/23/2019 Comparation of Project Evaluation Using Cost Benefit Analysis
http://slidepdf.com/reader/full/comparation-of-project-evaluation-using-cost-benefit-analysis 8/13
8
tradespace, is very simple due to only two considered variables which turn out to be independent.The optimal design minimizes the contribution that the CTA needs to make and minimizes span
of services to allow enough time for maintenance works. The Private Operator prefers eitherBRT or Route 2 as concept choice, depending on the desired level of utility.
4. G Determine “best” alternativesThe results of the CBA indicate that BRT is the only solution that provides net benefits to societyindependent of the discount rate. If a low government discount rate is used, both BRT and Route
2 can be justified. In the tradespace analysis, BRT emerges as the best option for the PrivateOperator until a utility of approximately 0.6. The tradespace of the CTA is not particularly
helpful in selecting a design concept, since the value delivery to the CTA is not affected by thechoice of concept. The City of Chicago has the clearest preference for BRT as a concept and
maximization of service variables that would only impact operating cost. Overall, there is noclear dominant design that emerges from both analyses. From a combined perspective, BRT
seems most likely to achieve the approval of the majority of stakeholders since it providessavings to society independent of discount rate, minimizes initial investment costs for all parties
and is the preferred design for the Private Investor (up until a utility of 0.6) and the City ofChicago.
5. Case 2: High-Speed Rail in Portugal
5. A IntroductionCurrently no High-Speed Rail (HSR) network exists in Portugal and the existing conventional
rail network has several shortcomings, including one-track and indirect connections betweenimportant areas of Portugal and Spain. Among the benefits that the construction of an HSR
network is expected to deliver to Portugal are capacity expansion of the current congestedtransportation infrastructure; reducing the geographical isolation of the country within Europe;
improving cohesion and quality of life in Portugal; stimulating the economy; and reducing the
external costs of transportation in the country. The case study concentrates on the axis betweenLisbon and Madrid, with a possible extension of HSR to the important seaport of Sines.
5. B StakeholdersThis major project will affect a broad number of stakeholders across the entire nation of Portugal
and beyond Portuguese borders. The most important decision-making stakeholders are Portugal,Spain, the EU, and a Private Investor. Those stakeholders will contribute to the project funding.
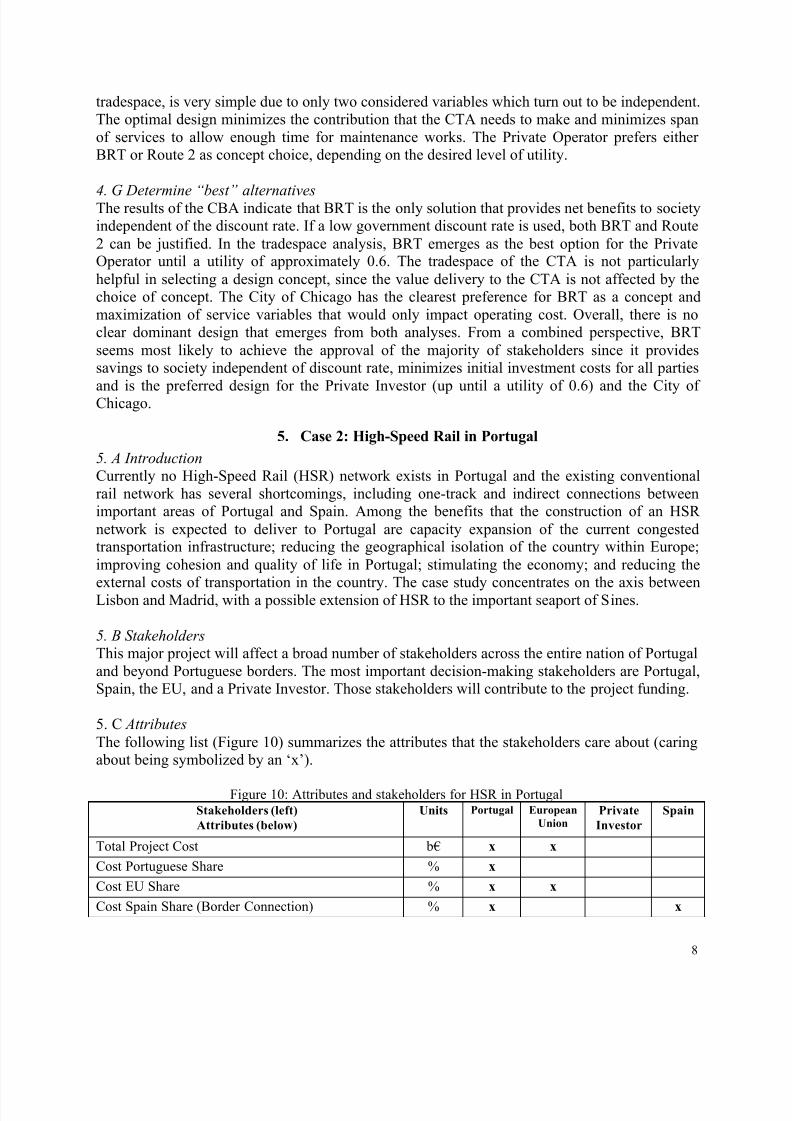
5. C Attributes
The following list (Figure 10) summarizes the attributes that the stakeholders care about (caringabout being symbolized by an ‘x’).
Figure 10: Attributes and stakeholders for HSR in PortugalStakeholders (left)
Attributes (below)
Units Portugal European
UnionPrivate
Investor
Spain
Total Project Cost b ! x x
Cost Portuguese Share % x
Cost EU Share % x x
Cost Spain Share (Border Connection) % x x
7/23/2019 Comparation of Project Evaluation Using Cost Benefit Analysis
http://slidepdf.com/reader/full/comparation-of-project-evaluation-using-cost-benefit-analysis 9/13
9
Private Invester Contribution mn ! x x
Cost Maintenance !/yr x
Cost Operation !/run x
Portuguese Cost Share Operations % x
Spanish Cost Share Operations % x
Net Travel Time Sines-Madrid min x x
# Stops # x
Overall Travel Time (Pax) min x x x
Overall Travel Time (Freight) min x x x
Quality of Coordination at border connection [1-5] x x x
Max Troughput (Freight) ton/day x
Max Capacity (Pax) pax/day x
Ease of Transfer to HSR in Evora [1-5] x x
Risk (for private investor) [1-9] x
Security [1-5] x
Prestige [1-5] x
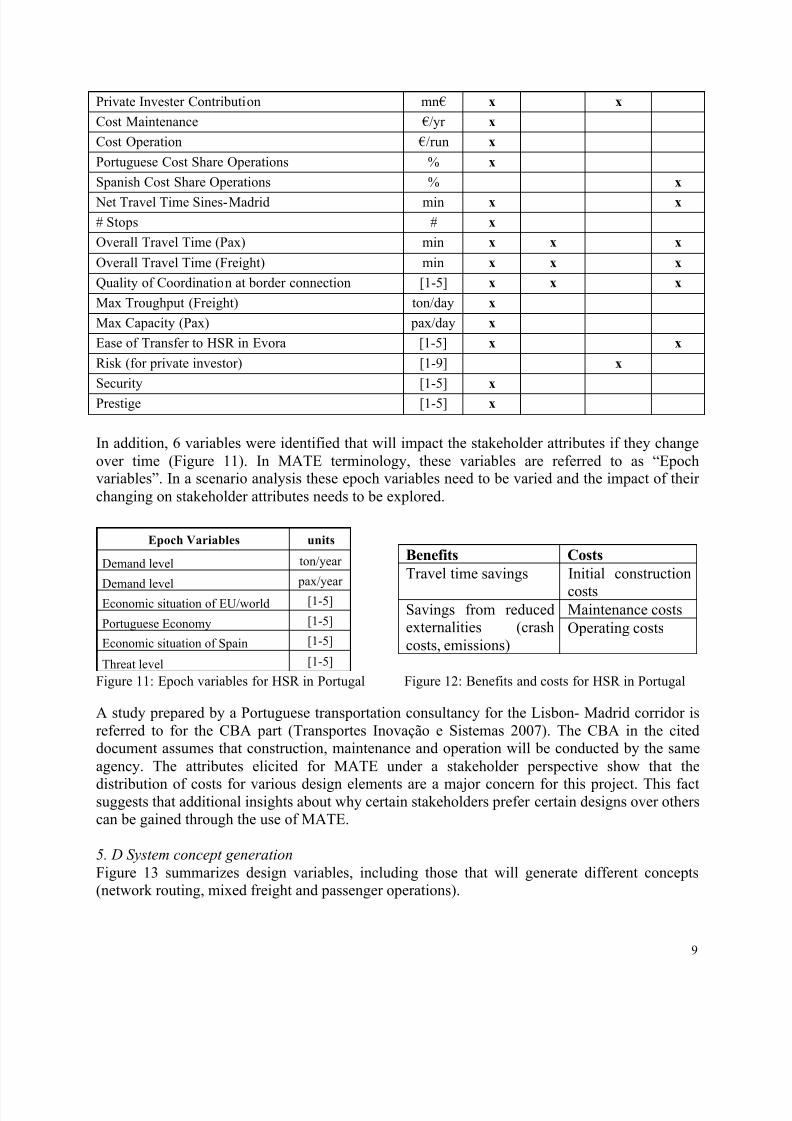
In addition, 6 variables were identified that will impact the stakeholder attributes if they change
over time (Figure 11). In MATE terminology, these variables are referred to as “Epochvariables”. In a scenario analysis these epoch variables need to be varied and the impact of their
changing on stakeholder attributes needs to be explored.
Epoch Variables units
Demand level ton/year
Demand level pax/year
Economic situation of EU/world [1-5]
Portuguese Economy [1-5]
Economic situation of Spain [1-5]
Threat level [1-5]
Benefits Costs
Travel time savings Initial construction
costsMaintenance costsSavings from reduced
externalities (crash
costs, emissions)Operating costs
Figure 11: Epoch variables for HSR in Portugal Figure 12: Benefits and costs for HSR in Portugal
A study prepared by a Portuguese transportation consultancy for the Lisbon- Madrid corridor is
referred to for the CBA part (Transportes Inovação e Sistemas 2007). The CBA in the citeddocument assumes that construction, maintenance and operation will be conducted by the same
agency. The attributes elicited for MATE under a stakeholder perspective show that the
distribution of costs for various design elements are a major concern for this project. This factsuggests that additional insights about why certain stakeholders prefer certain designs over otherscan be gained through the use of MATE.
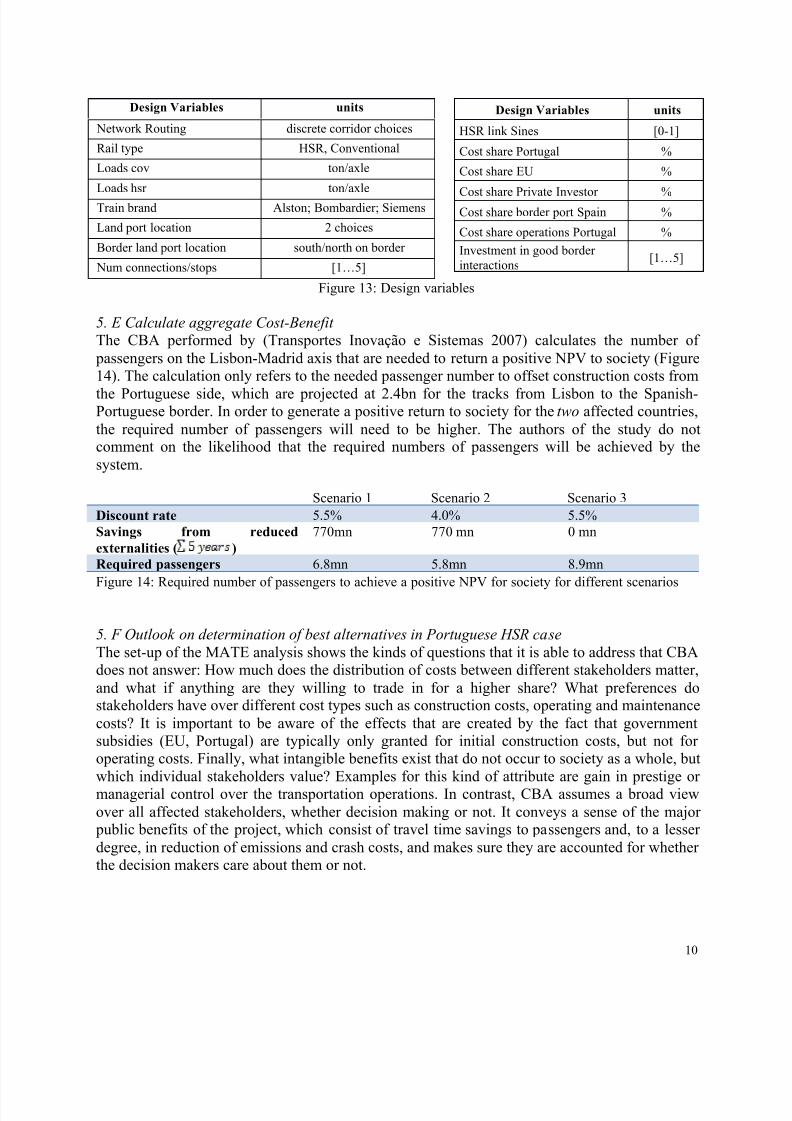
5. D System concept generation
Figure 13 summarizes design variables, including those that will generate different concepts(network routing, mixed freight and passenger operations).
7/23/2019 Comparation of Project Evaluation Using Cost Benefit Analysis
http://slidepdf.com/reader/full/comparation-of-project-evaluation-using-cost-benefit-analysis 10/13
10
Design Variables units
Network Routing discrete corridor choices
Rail type HSR, Conventional
Loads cov ton/axle
Loads hsr ton/axle
Train brand Alston; Bombardier; Siemens
Land port location 2 choices
Border land port location south/north on border
Num connections/stops [1…5]
Design Variables units
HSR link Sines [0-1]
Cost share Portugal %
Cost share EU %
Cost share Private Investor %Cost share border port Spain %
Cost share operations Portugal %
Investment in good border
interactions[1…5]
Figure 13: Design variables
5. E Calculate aggregate Cost-BenefitThe CBA performed by (Transportes Inovação e Sistemas 2007) calculates the number of
passengers on the Lisbon-Madrid axis that are needed to return a positive NPV to society (Figure14). The calculation only refers to the needed passenger number to offset construction costs from
the Portuguese side, which are projected at 2.4bn for the tracks from Lisbon to the Spanish-Portuguese border. In order to generate a positive return to society for the two affected countries,
the required number of passengers will need to be higher. The authors of the study do notcomment on the likelihood that the required numbers of passengers will be achieved by the
system.
Scenario 1 Scenario 2 Scenario 3
Discount rate 5.5% 4.0% 5.5%
Savings from reduced
externalities ( )
770mn 770 mn 0 mn
Required passengers 6.8mn 5.8mn 8.9mn
Figure 14: Required number of passengers to achieve a positive NPV for society for different scenarios
5. F Outlook on determination of best alternatives in Portuguese HSR case
The set-up of the MATE analysis shows the kinds of questions that it is able to address that CBAdoes not answer: How much does the distribution of costs between different stakeholders matter,
and what if anything are they willing to trade in for a higher share? What preferences dostakeholders have over different cost types such as construction costs, operating and maintenance
costs? It is important to be aware of the effects that are created by the fact that governmentsubsidies (EU, Portugal) are typically only granted for initial construction costs, but not foroperating costs. Finally, what intangible benefits exist that do not occur to society as a whole, but
which individual stakeholders value? Examples for this kind of attribute are gain in prestige ormanagerial control over the transportation operations. In contrast, CBA assumes a broad view
over all affected stakeholders, whether decision making or not. It conveys a sense of the major public benefits of the project, which consist of travel time savings to passengers and, to a lesser
degree, in reduction of emissions and crash costs, and makes sure they are accounted for whetherthe decision makers care about them or not.
7/23/2019 Comparation of Project Evaluation Using Cost Benefit Analysis
http://slidepdf.com/reader/full/comparation-of-project-evaluation-using-cost-benefit-analysis 11/13
11
6. Discussion of complementary insights from both methods
Inner dynamics of interests between different decision-making stakeholders remain hidden inCBA. Even though Economic Impact Analysis as an additional method tends to shed more light
on the distribution of costs and benefits through revelation of such effects as travel time savings
or land value increases, the analysis does not apply to the personal interests of involved decision-making stakeholders. The analysis of the Chicago airport express for demonstrative purposes hasalready revealed several patterns of interests that will be most interesting for all stakeholders in
actual negotiations. The CTA has not much to gain and tries to cut their losses. The City is in asituation in which it is only responsible for contributing to the initial investment, but not to
operating expenses (this prediction assumes operating self-sufficiency, as is the result fromseveral studies under conservative estimates). The same situation applies to the EU in the case of
Portuguese HSR. A trade-off exists between the goals of ridership maximization (City ofChicago) and profit maximization (Private Investor), which also plays an important role for the
Portuguese case. The set-up of the MATE analysis for Portuguese HSR suggests that differentstakeholders are similarly driven by personal interests that they care strongly about. Interestingly,
those attributes do not always need to come at monetary cost or expenses that could be expressedin monetary terms, such as prestige or managerial control. They are simply attributes that
stakeholders care strongly about. It is questionable if and to what extent these details would have been revealed in a traditional project evaluation process.
However, in both example cases MATE cannot be relied upon to bring up all important
considerations that need to be weighed in a decision. The mandate to capture aggregate small benefits to dispersed stakeholders in CBA proved important in both cases. Both CBAs
demonstrated that substantial savings in travel time was the major benefit to the public of therespective projects. If decision makers do not prioritize this attribute in the MATE analysis, a
substantial benefit of the project would be overlooked.
While the two CBAs showed that travel time savings are substantial, the evaluation is skewedthrough the practice of discounting these non-monetary benefits. The desirability of a concept
within the same project and the required number of passengers for social viability wereinfluenced heavily by the discount rate, leaving aside problems with the quantification (e.g.,
impact of low wage levels in Portugal compared with other European countries). A long-termassessment of attributes can for example be made more specific in MATE, through separation
into different types of tangible and intangibles costs and benefits and the choice of appropriatediscount rates for each. The flexibility to separate out attributes and keep them separate also
mitigates the risk of skewing the analysis through the aggregation of more or less certain projections for different attributes.
CBA and the studies that typically follow it (Economic Impact Analysis, Environmental Impact
Analysis) are very resource-intensive. Through the use of MATE a broader filtering at a low-fidelity level can be conducted early on in the design process which increases the odds that
scarce resources for detailed studies are invested in those that are most worthwhile.
7/23/2019 Comparation of Project Evaluation Using Cost Benefit Analysis
http://slidepdf.com/reader/full/comparation-of-project-evaluation-using-cost-benefit-analysis 12/13
12
7. Conclusion
Through the joint use of MATE and CBA in project selection, shortcomings of CBA can bemitigated through additional insight into “blind spot” areas. The focus of both methods is
different, however, which is why they should be used in a complementary way to improve
decision making. MATE seeks to best meet stakeholders’ expectations of what a project shoulddeliver, whereas CBA ensures that dispersed interests of society are taken into account.
Future research should address the best way to use both methods, or how to potentially mergethem into a joint process. As a high-level method for the conceptual design of systems, MATE is
intended to provide high-level architectural guidance. MATE is intended for both conceptgeneration and concept evaluation, while CBA is only intended for concept evaluation. Even
though MATE feeds into more detailed planning steps of construction, operation and contractdesign, CBA will help in eliciting attributes that may have remained unarticulated or
unconsidered by the stakeholders at the time of the utility interview. Bearing in mind the publicmandate of most design decisions in the infrastructure domain, this information can be fed back
into the MATE analysis where it will potentially change attributes or weightings.
The identification of attributes in the Portuguese HSR case suggests that inner dynamics of
stakeholder preferences play an extremely important role and need to be understood if asuccessful project shall be delivered. The MATE analysis of this project is therefore an important
area of ongoing research. By revealing and visualizing information about stakeholder preference patterns, MATE contributes to better accounting for the hard-to-come by “evaluative
complexity” in project appraisal, which ultimately has to be resolved in negotiations.
Acknowledgements
The authors gratefully acknowledge the funding for this research provided by the Systems
Engineering Advancement Research Initiative (SEAri), a research initiative within theEngineering Systems Division at MIT. SEAri (http://seari.mit.edu) brings together a set of
sponsored research projects and a consortium of systems engineering leaders from industry,government, and academia. SEAri gratefully acknowledges the support of the MIT-Portugal
Program in this research. The authors thank Ms. Diana Rita da Silva Leal of the University ofCoimbra, Portugal and visiting student at MIT for her contribution to the case study on
Portuguese High-Speed Rail. The paper does not represent any official views or positions by theagencies that are named herein.
References
[1] California Department of Transportation. "Benefit-Cost-Analysis." Retrieved 12/11/2008, from
http://www.dot.ca.gov/hq/tpp/offices/ote/benefit_cost/.
[2] Diller, N. P. (2002). Utilizing Multiple Attribute Tradespace Exploration with Concurrent Design for Creating
Aerospace Systems Requirements. Aeronautics and Astronautics. Cambridge, MA, Massachusetts Institute of
Technology. S.M.
[3] Gomez-Ibanez, J., W. B. Tye, et al. (1999). Essays in Transportation Economics and Policy. Washington D.C.,
Brookings Institution Press.
[4] Heinzerling, L. and F. Ackerman (2002). Pricing the Priceless: Cost-Benefit Analysis of Environmental
Protection. Washington D.C. , Georgetown University Law Center.
7/23/2019 Comparation of Project Evaluation Using Cost Benefit Analysis
http://slidepdf.com/reader/full/comparation-of-project-evaluation-using-cost-benefit-analysis 13/13
13
[5] Keeney, R. L. and H. Raiffa (1993). Decisions with Multiple Objectives- Preferences and Value Tradeoffs.
Cambridge, England, UK, Cambridge University Press.
[6] Lloyd, S. (2002). Complex Systems: A Review. Proceedings of the ESD Internal Symposium, Cambridge, MA.
[7] Nickel, J., A. M. Ross, and D. H. Rhodes. (2009). Trading Project Costs and Benefits using Multi-Attribute
Tradespace Exploration. 7th Conference on Systems Engineering Research. Loughborough, UK.
[8]
Parsons Brinckerhoff Consult Inc. (2006). Express Airport Train Service Business Plan. Final Report.
[9] Rivey, D. (2007). A Practical Method for Incorporating Real Options Analysis into US Federal Benefit-Cost
Procedures. Engineering and Management. Cambridge, MA, Massachusetts Institute of Technology. S.M. .
[10] RoadStats, L. (2008). "Gary- Chicago- Milwaukee Corridor Travel Statistics Kennedy to O’Hare 2008."
Retrieved 12/07/2008, from http://www.gcmtravelstats.com/Default.aspx?selLinks1=24.
[11] Ross, A. M. (2006). Managing Unarticulated Value: Changeability in Multi-Attribute Tradespace Exploration.
Engineering Systems Division. Cambridge, MA, Massachusetts Institute of Technology. PhD.
[12] Ross, A. M. and D. E. Hastings (2006). Assessing Changeability in Aerospace Systems Architecting and Design
Using Dynamic Multi-Attribute Tradespace Exploration. AIAA Space 2006 San Jose, CA.
[13] Sussman, J. (2000). Introduction to Transportation Systems. Norwood, MA, Artech House Publishers.
[14]
Sussman, J. (2002). Collected Views on Complexity in Systems. Proceedings of the ESD Internal Symposium.Cambridge, MA
[15] Transportes Inovação e Sistemas (2007). Análise custo-benefício das linhas de alta velocidade Lisboa-Porto e
Lisboa-Madrid.
[16] US Federal Highway Administration. (2003). "Economic Analysis Primer: Benefit-Cost Analysis." Retrieved
2/19/2009, from http://www.fhwa.dot.gov/infrastructure/asstmgmt/primer05.cfm .
[17] Wang, M.-J. and G. S. Liang (1995). "Benefit-Cost Analysis using Fuzzy Concept." The Engineering
Economist 40(4): 359- 376.
[18] WilburSmith Associates (2004). Ridership and Revenue Forecast Final Report. Prepared for the Chicago
Department of Transportation and the Chicago Transit Authority.