Embed Size (px)
Citation preview
Comparative Analysis of MDGsWhere do the Districts Stands?
By Sajjad Akhtar
Director
Center for Research on Poverty Reduction and Income Distribution
Planning Commission Islamabad
April 28th 2007
Background
The Millennium Development Goals emerged from the UN Millennium Declaration adopted by the leaders of 147 countries in September 2000.
The Declaration reflected a shift in the paradigm that governs relations among countries – from emphasizing competition for the world’s resources, to one that places high value to cooperation for the benefit of people – particularly the poor.
Pakistan as a signatory to the declaration has adopted eight goals and 34 indicators for tracking progress towards them.
The Goals are specific measurable targets for the year 2015 thatinclude halving the poverty, improving health and education indicators and promoting peace, human rights and environmental sustainability.
With South Asia home to 30 percent of 1 billion people living below the $1 a day, millions are expected to come out of extreme poverty and improve their living standards in the regionif a holistic and integrated approach is adopted towards achieving MDG goals.
The goals and indicators are comprehensive as they cover health, education, sustainable development and gender empowerment. They are also data intensive, have specific time line and can be monitored regularly.
OBJECTIVES and Characteristics of Goals
There should be wide-spread ownership of goals at the three tiers of the government, civil society including NGOs, academia and the private sector.
If the goals are ‘Provincialized” and/or “localized” it will give a sense of participation to local communities and enhance the chances of achieving the goals within the time frame work set by the UN.
Continued on next slide…
Responsibilities of Individual Countries
Responsibilities of Individual Countries
At the Millennium +5 Summit of 2005, it has been realized that a) Inspite of encouraging progress made since 2000, business-as-usual will not work in realizing the MDG targets for many of the countries and b) localization or MDGs or main streaming of Sub-National local targets into the national targets and priorities is needed to achieve the MDGsby 2015
In August 2004, the UN Secretary General acknowledged in Brazil that as many as 70% of the MDGs and Johannesburg plan of implementation targets would be achieved primarily through local/district governments working in consultation with nationalgovernments and other stake holders.
Continued on next slide…
Responsibilities of Individual Countries
Increasing domestic resource mobilization, budgeting and prioritizing expenditures within Goals at the three tiers of government is an essential pre-requisite for the Goal’s attainability
Implications for Developing Partners
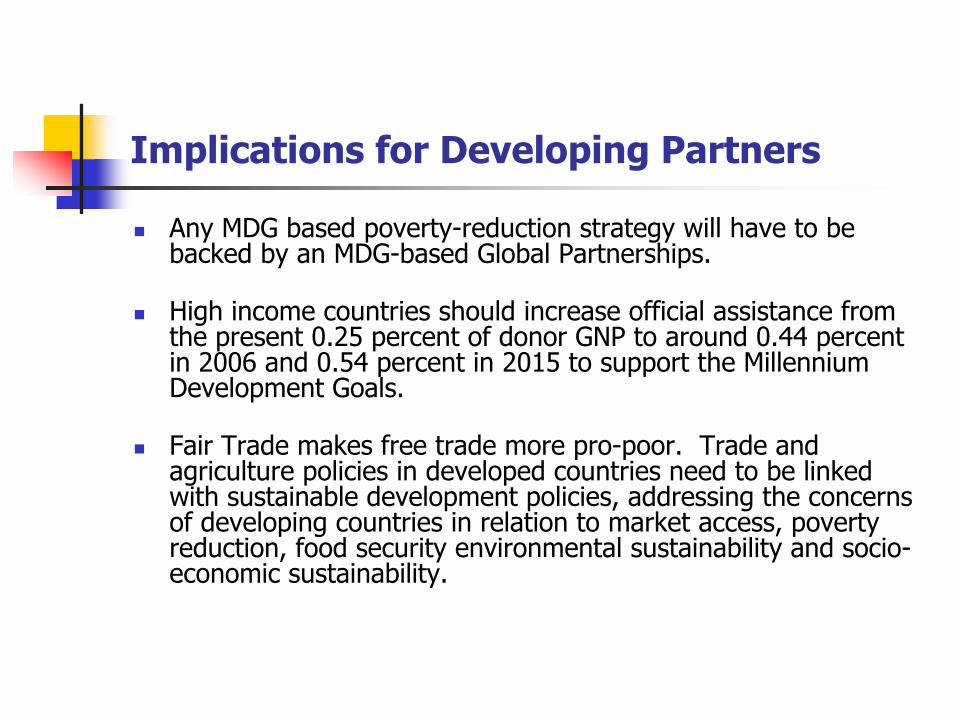
Any MDG based poverty-reduction strategy will have to be backed by an MDG-based Global Partnerships.
High income countries should increase official assistance from the present 0.25 percent of donor GNP to around 0.44 percent in 2006 and 0.54 percent in 2015 to support the Millennium Development Goals.
Fair Trade makes free trade more pro-poor. Trade and agriculture policies in developed countries need to be linked with sustainable development policies, addressing the concerns of developing countries in relation to market access, poverty reduction, food security environmental sustainability and socio-economic sustainability.
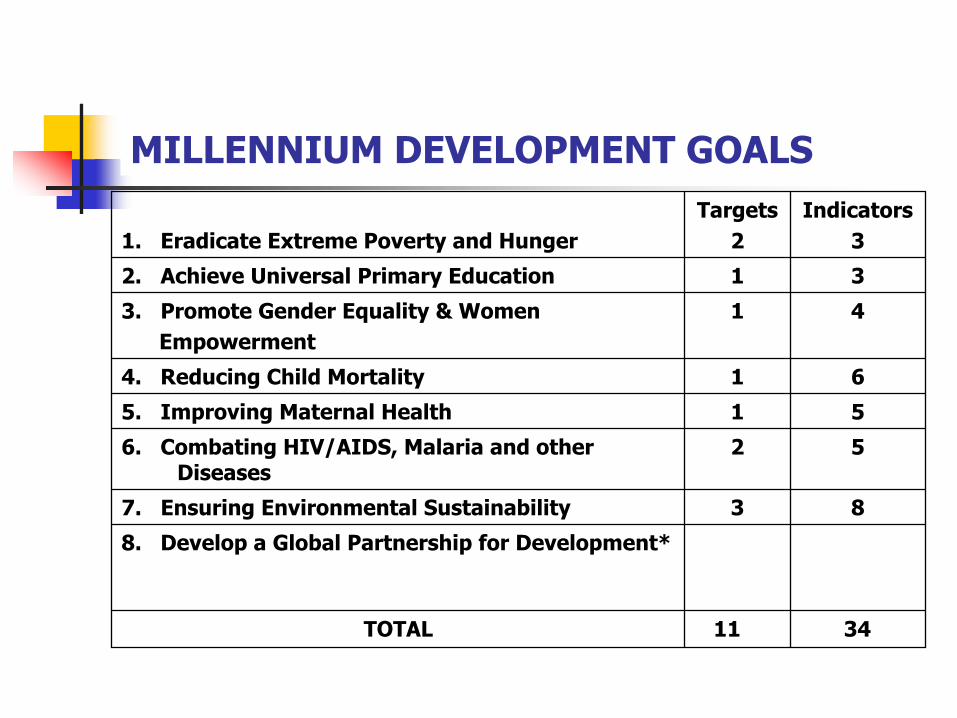
MILLENNIUM DEVELOPMENT GOALS
3411TOTAL
8. Develop a Global Partnership for Development*
837. Ensuring Environmental Sustainability
526. Combating HIV/AIDS, Malaria and other Diseases
515. Improving Maternal Health
614. Reducing Child Mortality
413. Promote Gender Equality & WomenEmpowerment
312. Achieve Universal Primary Education
Indicators3
Targets21. Eradicate Extreme Poverty and Hunger
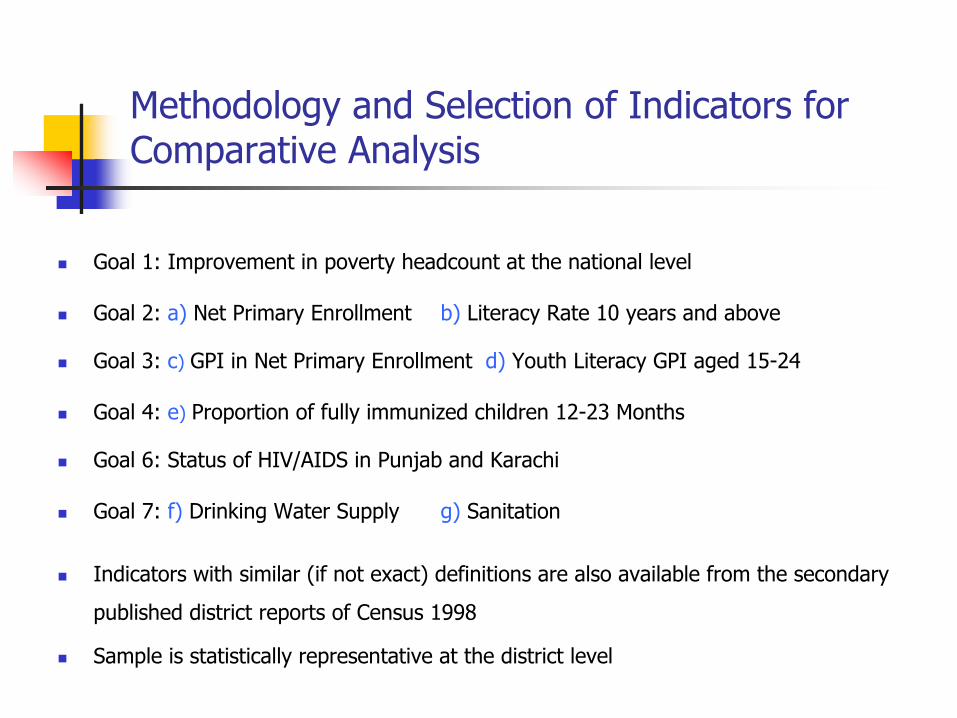
Methodology and Selection of Indicators for Comparative Analysis
Goal 1: Improvement in poverty headcount at the national level
Goal 2: a) Net Primary Enrollment b) Literacy Rate 10 years and above
Goal 3: c) GPI in Net Primary Enrollment d) Youth Literacy GPI aged 15-24
Goal 4: e) Proportion of fully immunized children 12-23 Months
Goal 6: Status of HIV/AIDS in Punjab and Karachi
Goal 7: f) Drinking Water Supply g) Sanitation
Indicators with similar (if not exact) definitions are also available from the secondary
published district reports of Census 1998
Sample is statistically representative at the district level
Goal 1Eradicate Extreme Poverty and Hunger
Main Findings
The confluence of favorable government policies, bumper cotton crop in 2004-05, rescheduling and re-profiling of foreign debt, growth of pro-poor expenditures at the rate of 16 percent per annum against the backdrop of slow-moving and partly drought-stricken economy in 2001 has led to a marked reduction in population below the poverty line from 34.5 to 23.9 percent during the period.
In absolute numbers the count of poor persons has fallen from 49.23 million in 2001 to 36.45 million in 2004-05
Goal 1Eradicate Extreme Poverty and Hunger
Main Findings
The absolute fall in poverty headcount in rural areas from 39.3 percent in
2001 to 28.1 percent in 2005 is higher than in urban areas.
The Gini Coefficient of Expenditure inequality increased marginally from
0.2750 to 0.2976 during the 2001-2005 period.
Access to services, e.g., literacy, gross enrolment rates, primary school
completion rate, immunization rate, pre and post natal care consultation
improved for poor vs non-poor and inequalities in access also declined.
Goal 2Achieve Universal Primary Education
Net Primary Enrolment Ratio
The analysis shows that intra-national and intra-provincial disparities in net primary enrolment rate lessened in 2005 compared to 1998. In terms of attainment of net primary enrolment, districts of Punjab continue to dominate, although 5 of the fastest growing districts during the period were from Baluchistan.
None of the districts have yet attained the MDG target of 100 percent for 2015. A successful targeting of primary education program of the provincial and districts governments, NGOs and development partners will increase net primary enrolment rate and help the targets under MDG 2.
Literacy Rate 10 Years and Above
The sub-national analysis indicates that intra-national and intra-provincial disparities in literacy rates narrowed in 2005 as compared to 1998. Strong correlation among the rates in two periods indicate that districts with low/high rates in 1998 alsohave low/high rates in 2005, supported by improvement in all districts.
In terms of literacy attainment, districts in Punjab continue todominate while many districts in Balochistan still have low attainment. However 8 of the fastest growing districts are in Balochistan (5) and NWFP (3), indicating successful targeting of literacy and primary education programs of the provincial/district governments, NGOs and development partners.
Continued on Next Slide
Goal 2Achieve Universal Primary Education
Literacy Rate 10 Years and Above
None of the districts have yet attained the MDG target of 88
percent for 2015, although if one extrapolates business-as-usual
growth of last 7 years, at least ten top districts will reach this
target. In fact many districts would have to attain 100 percent
literacy by 2015, to support a national average of 88 percent by
2015.
Goal 2Achieve Universal Primary Education
Goal 3Promoting Gender Equality and Empowerment
GPI In Net Primary Enrolment
Considerable progress in eliminating gender disparity in primaryeducation in the last 7 years is apparent. The comparative analysis indicates that nine districts have already attained theMDG target of parity ratio of 1.0 and another 4 districts are almost in the neighborhood of the target.
If the past rate of progress is maintained and extrapolated intothe future, another 25 districts will attain the parity ratio. However fast track initiatives in this regard will ensure the attainment of parity in majority of districts by 2015.
Goal 3Promoting Gender Equality and Empowerment
Youth Literacy GPI
The sub-national analyses of Youth Literacy GPI indicate, that intra-national disparity remained unchanged between 1998 and 2005. Inequalities with respect to this indicator widened in Baluchistan during the seven year period. In other 3 provinces, intra-provincial disparities narrowed during the period. Out of 10 fastest growing districts in terms of annual growth rate as wellin absolute change, 4 belonged to Punjab and the remaining 6 are equally shared by 3 provinces. Many districts in Balochistanexperienced regressivity in Youth GPI during the period.
Only 3 districts in Punjab have attained the MDG target of 1.0 for 2015. Extrapolating the business-as-usual scenario of last 7 years, at least another 15 districts are likely to reach this target by 2015.
Goal 4Reduce Child Mortality
Immunization
The intra national, intra Balochistan and intra Sindh disparities widened during the period, although on average there was an improvement of 10 percentage points in the immunization coverage
In absolute coverage districts of Punjab dominated the top 10 ranking with above than 90 percent coverage. Districts in Balochistan with roughly 40 percent coverage were among the bottom ten in the nation. However coverage in many of the districts in Balochistan and NWFP grew rapidly during the period.
In relation to the national MDG target of greater than 90 percent set for 2015, nearly 16 districts have already achieved it, and extrapolating the recent past performance another 50 districts are likely to achieve it around 2015.
Goal 6Combat HIV/AIDS, Malaria and Other Diseases
The updated Situation and Response Analysis 2006 report indicates that the HIV/AIDS is emerging rapidly in intravenous drug users (IDUs) and male sex workers (MSMs) networks in larger cities.
Data collected by the provincial AIDS Control Program from Jan-Aug 2004 show that prevalence has increased from 0.4% to more than 7% in all IDUs tested for HIV in Punjab.
The HIV prevalence in 2005 among IDUs in Karachi reached 23%
Goal 7Ensure Environmental Sustainability
1) Safe Water
The intra national and intra provincial disparities in the coverage of safe water supply narrowed during the period, indicating convergence nationally and provincially
The top ten positions in the coverage was more equally shared among the four provinces in 1998 as well as in 2005. However districts of NWFP and Balochistan shared most of the bottom ten positions in 1998 and 2005. Districts in Balochistan also share the distinction of being the fastest growing during the period, while the opposite is evident for few districts for Punjab.
Under a broader definition of safe water supply adopted in this analysis, nearly 36 districts of the country have achieved the national target (narrowly defined as Pipe/Hand pump) of 93 percent set for 2015
The Clean Water for All program if implemented effectively within the proposed time frame will enable most of the districts to achieve the national target well before 2015
Goal 7Ensure Environmental Sustainability
2) Sanitation Coverage
As per the modified definition of Sanitation coverage adopted in this analysis, intra-national and intra-provincial disparities in Sanitation coverage have reduced significantly during 1998 and 2005. The simple and rank correlations between 2001 and 2005 are low as compared to corresponding statistics for other indicators, indicating considerable changes in absolute numbers and ranks during the period.
In the top ten districts, no province dominates the ranking. However, in the bottom ten ranking, districts in Balochistan substitute in 2005 for districts in NWFP in 1998. Nearly fifty percent of the fastest/slowest growing districts are in the province of NWFP/Balochistan
As per the extended definition of Sanitation coverage, 16 districts have already attained the MDG target of 90 percent coverage set for 2015. Extrapolating the business-as-usual scenario of last seven years, another 30 districts are likely to achieve the target by 2015
Summary of Comparative Analysis
District-wise analysis of 7 MDGs indicator reveal that in 6 indicators, districts in Punjab rank among the top ten districts in the country in 2005. In comparison to 1998, there are fewer districts of Punjab now among the top ten elite group in 3 out of 7 indicators.
Districts in Baluchistan and NWFP dominate the bottom ten ranking. However comparing 1998 with 2005 ranking, many districts of NWFP in GPI Primary Enrolment, Youth Literacy and Sanitation made remarkable improvement and districts in Baluchistan took their place in 2005 by default or slow improvements.
In 4 indicators, Districts of Baluchistan dominate the ranking of fastest growing districts during the period. In remaining 3 indicators, districts of NWFP dominate the ranking of fastest growing districts. Ranking of Districts by absolute improvement in indicator also yield very similar results.