Embed Size (px)
Citation preview
COMPARATIVE STUDY OF PLACENTAL
ABNORMALITIES IN NORMAL AND SPECIFIC
HIGH RISK PREGNANCIES BY USING DOPPLER,
HISTOLOGY AND THEIR FETAL OUTCOME
Dissertation Submitted to
THE TAMILNADU Dr. M.G.R. MEDICAL UNIVERSITY
in partial fulfilment for the award of the Degree of
M.D. OBSTETRICS AND GYNAECOLOGY
BRANCH II
MADRAS MEDICAL COLLEGE
CHENNAI
APRIL – 2011

ACKNOWLEDGEMENT I gratefully acknowledge and sincerely thank Prof
Dr.J.MOHANA SUNDARAM M.D Ph.D, DNB, Dean , Madras Medical
College and Research Institute , Chennai for granting me permission to
utilize the facilities of the institution for my study.
I am extremely grateful to Prof.Dr.MOHANAMBAL M.D D.G.O, Director of Institute of Social Obstetrics and Govt Kasturba Gandhi
Hospital, Triplicane, Chennai for her guidance in all ways right from
concept, work plan, mode of execution academic feeding providing valuable
corrections and encouragement throughout my study.
I am extremely thank full to my guide Prof. Dr.KALAVATHY M.D D.G.O, who has taken personal day to day effort to provide me proper guidance and support throughout my study. I am extremely grateful to Prof.K.Rama M.D., Professor of
Pathology ISO – KGH., but for whom such an endeavour on
histopathological study is not possible.
My sincere thanks to Dr.Dhanraj D.M.R.D., (Radiology) for his guidance throughout the study. I thank all my professors , assistant professors & paramedical staff of this institute. I thank Mr.Boopathy, statistician, who helped me for statistical analysis. I thank all my patients who have readily consented for the study I thank my family & friends for their inspiration & support given to me.

CONTENTS
CHAPTER TITLE PAGE NO
I INTRODUCTION 1
II BACKGROUND OF STUDY 3
III PLACENTA 5
IV REVIEW OF LITERATURE 9
V AIM OF STUDY 26
VI MATERIALS AND METHODS 27
VII RESULTS AND ANALYSIS 34
VIII DISCUSSION 57
IX SUMMARY 73
X CONCLUSION 75
XI BIBLIOGRAPHY
XII APPENDIX
A-PROFORMA
B-MASTER CHART

INTRODUCTION
INTRODUCTION
Placenta is a vital lifeline between mother and fetus through which
nutrients, oxygen, antibodies and hormones pass.
Improper placentation and placental function could be potentially
danger to the health of the mother and the fetus.
High risk pregnancies are a small segment of the obstetric population,
that produces the majority of maternal and infant mortality and
morbidity
Upto 40% of high risk mothers experience placental damage.
Placenta is one of the most remarkable organ in the sense that it has a
very short life and yet very critical for continuation of the pregnancy and
thus life of the baby in utero. For nine months it is effectively the lung, the
gut and the kidney of the fetus.
The term ‘Placenta’ is believed to have been introduced in 1559 by
RAELDUS COLUMBUS who used this Latin work which actually means
‘Circular lake’.
In (1937), NOSEMAN defined Placenta as that portion of the fetal
membranes that was in apposition with (or) fused to the uterine mucosa for
the transfer of oxygen and metabolites between the maternal and fetal blood.
As the Placenta grows and ages, histological changes suggest an
increase in the efficiency of transport to meet the metabolic requirements of
the growing fetus. A variety of changes in the morphology of the placental
villi in normal and abnormal pregnancies have been reported.
The pathological changes in the Placenta are not by large specific to a
particular disorder and therefore a variety of disorders may show similar
changes. Final picture is often very complicated and no particular
complication of pregnancy produces specific morphological changes within
the placenta, which allow one to make a specific morphological diagnosis.
FOX(1964) AND WIGGLESWORTH(1964) have attributed all changes
to diminished uteroplacental blood flow.
In this study, an attempt has been made to correlate various
placental villous changes to the fetal outcome in normal and specific high
risk pregnancies.

BACKGROUND FOR THE STUDY
BACKGROUND FOR THE STUDY
The scientific interest in the Placenta derives not only from its
enormous diversity of form and function, but also from the varied
histopathological changes in different disease entities. Much effort is being
put into understanding the Placental changes and their effects on the fetus.
Placenta is the primary site of pathology responsible for many common
forms of fetal risk in particular the group of disorders which can be broadly
described as ‘intra uterine deprivation’ and which is manifest amongst
other features of fetal growth retardation.
The college of American Pathologists (1991) recommends routine
pathological examination of the Placenta with certain obstetrical and
neonatal conditions. Conversely the American College of Obstetricians and
Gynaecologists (1991) feels that there are insufficient data to support these
recommendations.
BENIRSCHKE (1991) observed that physicians generally are
uncomfortable with the task of examining the Placenta yet it is a task they
should willingly undertake. Submitting this organ to a reasonably
knowledgeable look and touch can provide much insight into prenatal life.
“…apart from this, available data suggests that examination of Placenta may
be very useful in medico legal cases” – CYNTHIA, G. KAPLAN (1996).
Perinatologists have long appreciated the importance of placental findings in
the understanding of perinatal outcome.
INDICATIONS FOR PATHOLOGICAL EXAMINATION OF PLACENTA
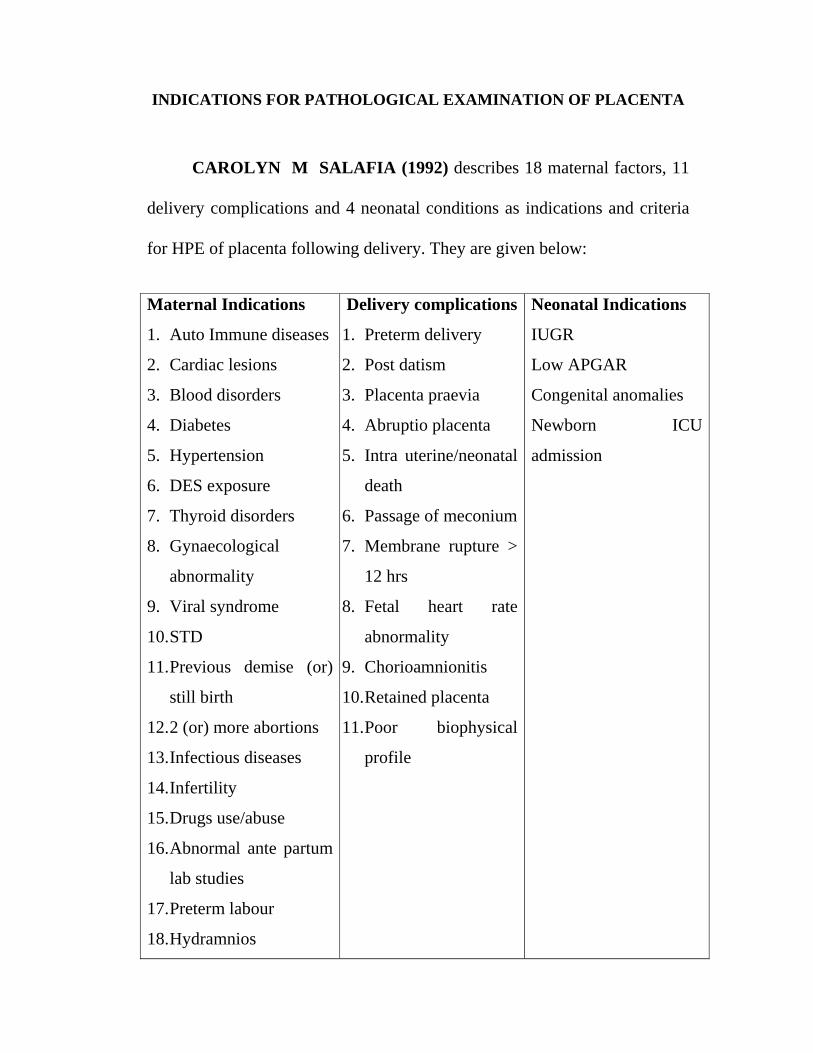
CAROLYN M SALAFIA (1992) describes 18 maternal factors, 11
delivery complications and 4 neonatal conditions as indications and criteria
for HPE of placenta following delivery. They are given below:
Maternal Indications
1. Auto Immune diseases
2. Cardiac lesions
3. Blood disorders
4. Diabetes
5. Hypertension
6. DES exposure
7. Thyroid disorders
8. Gynaecological
abnormality
9. Viral syndrome
10. STD
11. Previous demise (or)
still birth
12. 2 (or) more abortions
13. Infectious diseases
14. Infertility
15. Drugs use/abuse
16. Abnormal ante partum
lab studies
17. Preterm labour
18. Hydramnios
Delivery complications
1. Preterm delivery
2. Post datism
3. Placenta praevia
4. Abruptio placenta
5. Intra uterine/neonatal
death
6. Passage of meconium
7. Membrane rupture >
12 hrs
8. Fetal heart rate
abnormality
9. Chorioamnionitis
10. Retained placenta
11. Poor biophysical
profile
Neonatal Indications
IUGR
Low APGAR
Congenital anomalies
Newborn ICU
admission

PLACENTA
PLACENTA
The placenta is developed from two sources. The principal
component is fetal which develops from chorion frondosum, maternal
component consists of decidua basalis. Development of the placenta
according to RANDL S. KUHLMANN (1996) consists of previllous or
lacunar stage and villous stage.
DEVELOPMENT OF PLACENTA – RANDALL S. KUHLMANN
During the first 2 weeks of Placental development (7-12 days after
fertilization) invasion of the endometrium occurs. Complete endometrial
invasion is believed to be completed by 12-14 days following fertilization.
At this time the inner cytotrophoblast and outer syncytiotrophoblast is
formed. This stage is referred to as the previllous or lacunar stage.
The third week after fertilization is referred to as villous stage. At this
time, the primary villi develop mesodermal cores. Through inductive
process, these primary villi become secondary villi.
Mesoderm undergoes further differentiation giving rise to the
arteriocapillary venous chain, hence forming the “tertiary villi”. This
vascular network is established by 20 days after fertilization.
Further development of this network includes cytotrophoblastic
invasion of the syncytio trophoblastic layers resulting in the formation of the
stem or anchoring villi and the branching villi.
The anchoring villi are specialized stem villi that are connected to the
basal plate. The branching villi are ultimately responsible for maternal-
embryo exchange. Continuous differentiation results in the formation of the
villous fetal circulation.
Normal development of the uteroplacental arteries depends on two
types of extratrophoblastic invasion. Invasion of the decidua and
myometrium by the stromal trophoblast forms the placental bed giant cells.
The second type invasion occurs when the endovascular trophoblast migrates
into the spiral arteries which eventually transforms them into uteroplacental
arteries. The endovascular trophoblastic invasion of the spiral arteries is
thought to occur in two waves.
The ‘first wave’ is believed to be completed by the 10th week of
gestation. The ‘second wave’ begins at about 14-16 weeks and is generally
completed in 4 weeks. Incomplete development of these two waves is
believed to have certain clinical implications. It is postulated that the risk of
fetal growth restriction, preeclampsia and general pregnancy failure are all
increased when these developmental waves are incomplete.
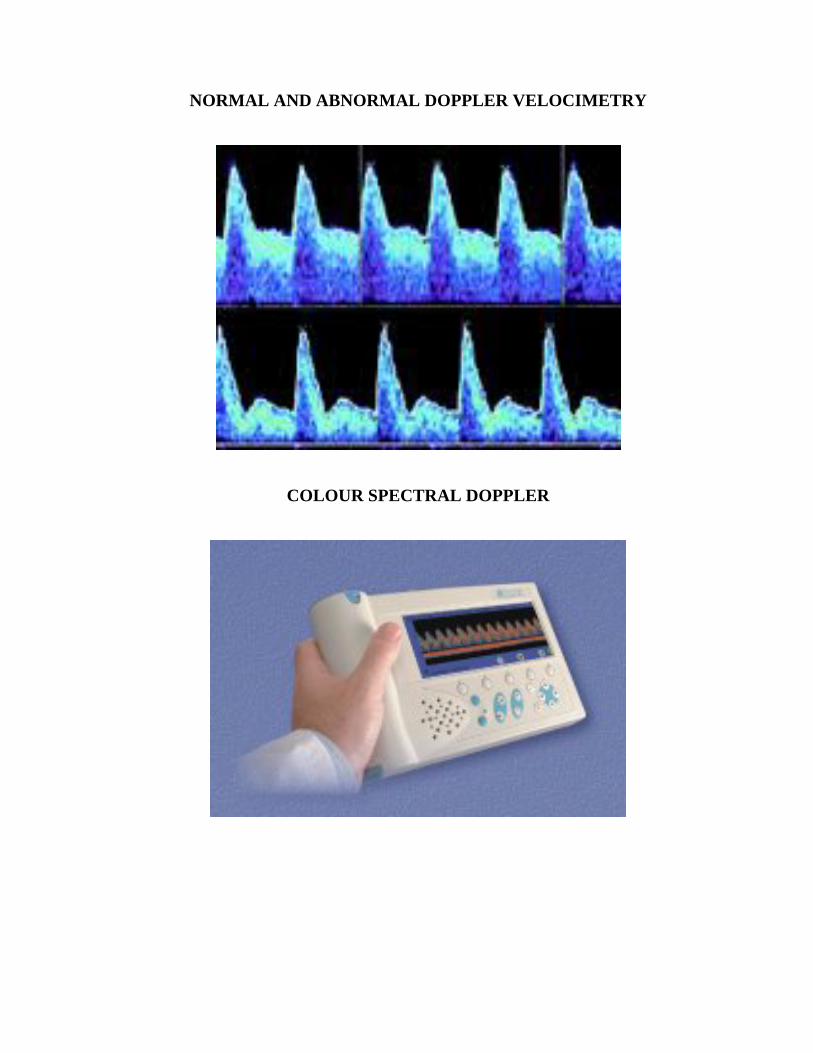
NORMAL AND ABNORMAL DOPPLER VELOCIMETRY
COLOUR SPECTRAL DOPPLER
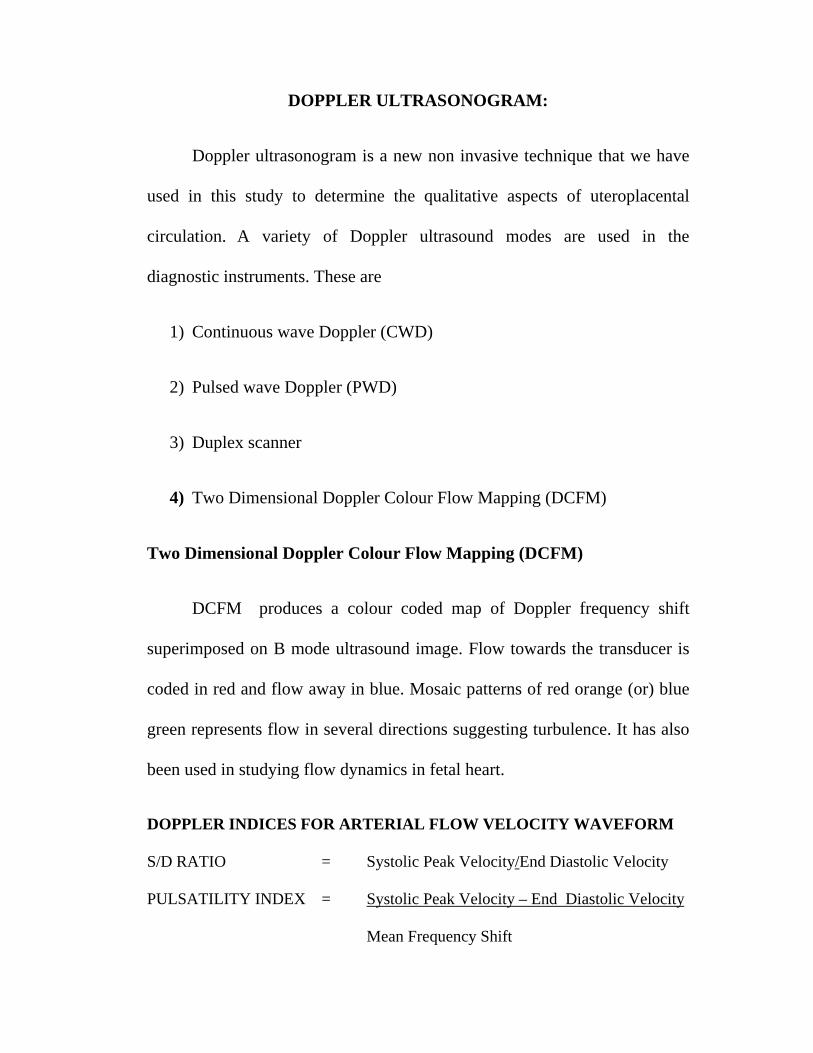
DOPPLER ULTRASONOGRAM:
Doppler ultrasonogram is a new non invasive technique that we have
used in this study to determine the qualitative aspects of uteroplacental
circulation. A variety of Doppler ultrasound modes are used in the
diagnostic instruments. These are
1) Continuous wave Doppler (CWD)
2) Pulsed wave Doppler (PWD)
3) Duplex scanner
4) Two Dimensional Doppler Colour Flow Mapping (DCFM)
Two Dimensional Doppler Colour Flow Mapping (DCFM)
DCFM produces a colour coded map of Doppler frequency shift
superimposed on B mode ultrasound image. Flow towards the transducer is
coded in red and flow away in blue. Mosaic patterns of red orange (or) blue
green represents flow in several directions suggesting turbulence. It has also
been used in studying flow dynamics in fetal heart.
DOPPLER INDICES FOR ARTERIAL FLOW VELOCITY WAVEFORM
S/D RATIO = Systolic Peak Velocity/End Diastolic Velocity
PULSATILITY INDEX = Systolic Peak Velocity – End Diastolic Velocity
Mean Frequency Shift
RESISTANCE INDEX = Systolic Peak Velocity – End Diastolic Velocity
Systolic Peak Velocity
Uterine Artery Flow Velocity waveforms:
Lack of endovascular invasion by trophoblasts into the myometrial
portion of the placental bed spiral arteries is a consistent finding in
preecclampsia.
Early Diastolic Notch:
In non-pregnant state, uterine artery waveforms exhibits high
pulsatility with a rapid rise and fall in frequency shifts during systole and an
early diastolic notch. Pregnancy results in marked changes in uterine
artery waveform from 26th week onwards.
Normally S/D ratio value does not change throughout the remainder
of the pregnancy. Diastolic notch disappears by 20-26 weeks. So the full
evolution of uterine artery waveform is complete only after 26 weeks. So
abnormal uterine artery waveforms are those with
1) S/D Ratio > 2.8 (the average of right and left uterine arteries)
2) Persistence of early diastolic notch.
The mean averaged S/D ratio for each trimester were I trimester – 5.5,
II trimester – 2.9 , III trimester – 2.1.

REVIEW OF LITERATURE
REVIEW OF LITERATURE
Placental study by CAROLYN – M.SALAFFIA
JOSEPH F . YETTER III (1998)
A. GENERAL FEATURES
1. Placental completeness
It is of critical, immediate importance in the delivery room. Retained
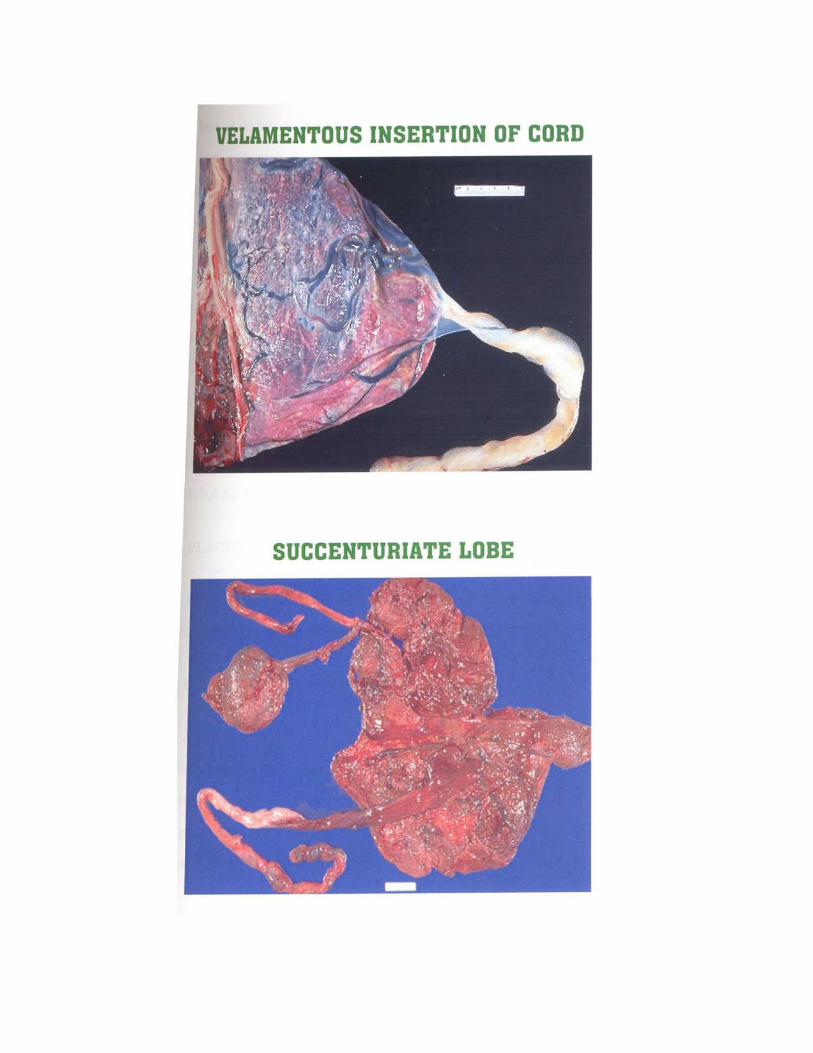
tissue is associated with PPH and infection. Large vessels beyond edges
indicate the possibility that an entire placental lobe (eg. Succenturiate or
accessory lobe) may have been retained in placenta accreta, placenta
increta and placenta percreta.
2.Placental Size
Placentas less than 2 cm thick are associated with intrauterine growth
retardation of fetus. Placentas more than 4 cm thick have an association
with maternal diabetes mellitus, fetal hydrops and intrauterine fetal
infections. An extremely thin placenta may represent placenta
membranacea, which is associated with a very poor fetal outcome.
3. Placental Shape
Extra lobes are important primarily due to retained placental tissue.
Blood may be adherent to the maternal surface of the placenta,
particularly at or near the origin. If it distorts the placenta, it may
represent an abruption. Placenta membranacea – is associated with
hemorrhage and poor fetal outcome.
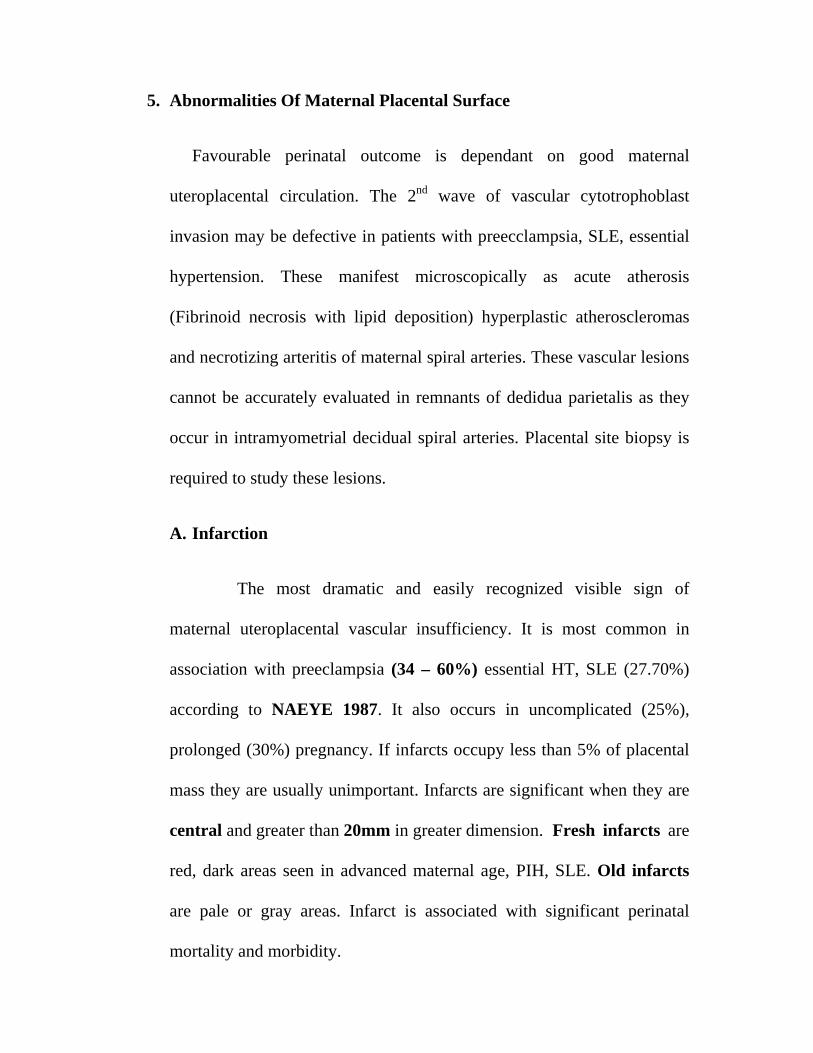
4. Placental Weight Fetoplacental Ratio
A full placental gross evaluation includes weight and
dimensions. Although usual term placenta is 22 cm diameter, 2-2.5 cm
thick and weight about 470g, there is considerable variation. Absolute
weights < 350 gm> 750 gm in complete term placenta, suggest intrinsic
villous pathology that may be revealed only by microscopy.
The use of fetal / placental weight ratios offer another measure to
assess placental size. The ratio outside normal range for that GA warrants
histological examination (CYNTHIA G. KAPLAN 1996). According to
NAEYE 1987 a low placental weight is associated with maternal
uteroplacental vascular insufficiency, congenital anomalies.
An overweight placenta was associated with villous edema,
maternal diabetes mellitus, maternal, fetal anaemia, hydrops, blood clot
with intervillous thrombus or subchorionic bleeding.
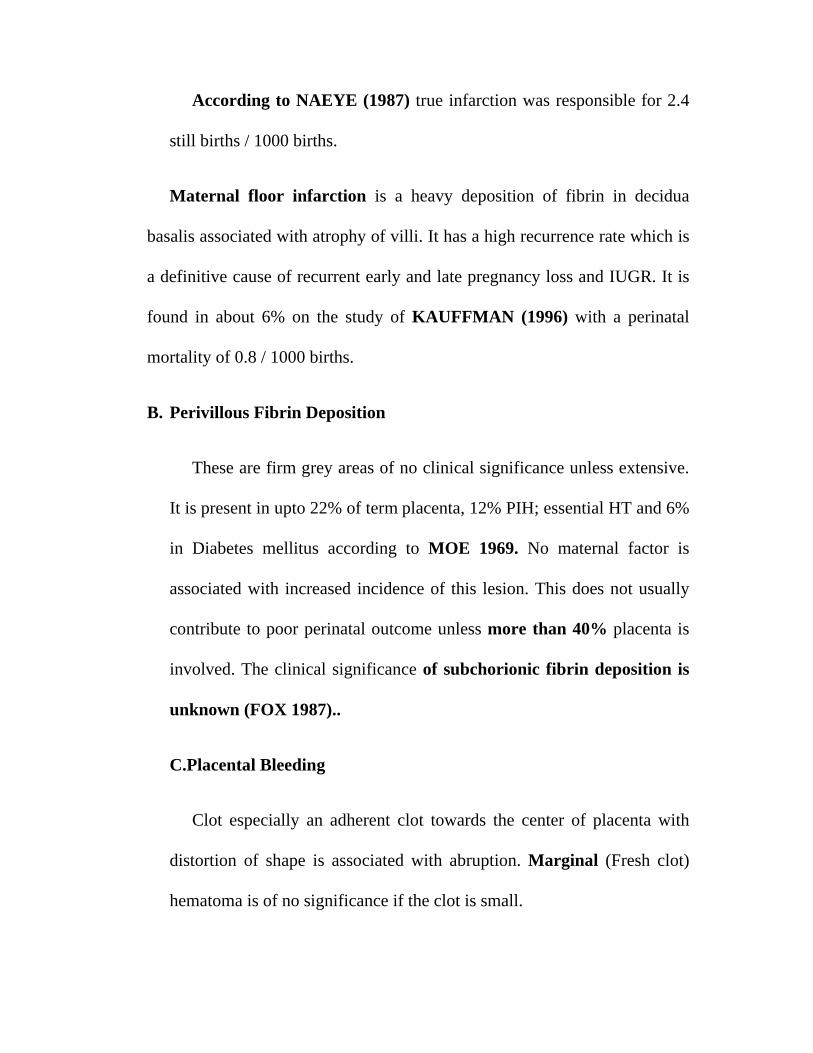
5. Abnormalities Of Maternal Placental Surface
Favourable perinatal outcome is dependant on good maternal
uteroplacental circulation. The 2nd wave of vascular cytotrophoblast
invasion may be defective in patients with preecclampsia, SLE, essential
hypertension. These manifest microscopically as acute atherosis
(Fibrinoid necrosis with lipid deposition) hyperplastic atheroscleromas
and necrotizing arteritis of maternal spiral arteries. These vascular lesions
cannot be accurately evaluated in remnants of dedidua parietalis as they
occur in intramyometrial decidual spiral arteries. Placental site biopsy is
required to study these lesions.
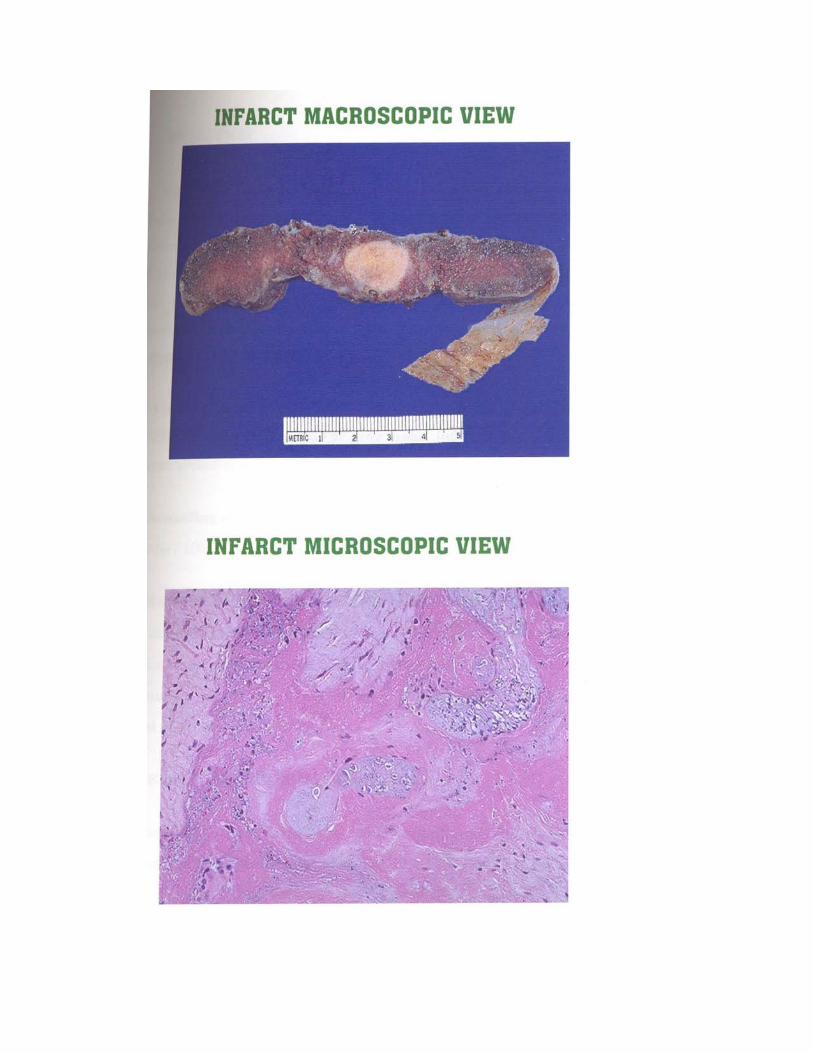
A. Infarction
The most dramatic and easily recognized visible sign of
maternal uteroplacental vascular insufficiency. It is most common in
association with preeclampsia (34 – 60%) essential HT, SLE (27.70%)
according to NAEYE 1987. It also occurs in uncomplicated (25%),
prolonged (30%) pregnancy. If infarcts occupy less than 5% of placental
mass they are usually unimportant. Infarcts are significant when they are
central and greater than 20mm in greater dimension. Fresh infarcts are
red, dark areas seen in advanced maternal age, PIH, SLE. Old infarcts
are pale or gray areas. Infarct is associated with significant perinatal
mortality and morbidity.
According to NAEYE (1987) true infarction was responsible for 2.4
still births / 1000 births.
Maternal floor infarction is a heavy deposition of fibrin in decidua
basalis associated with atrophy of villi. It has a high recurrence rate which is
a definitive cause of recurrent early and late pregnancy loss and IUGR. It is
found in about 6% on the study of KAUFFMAN (1996) with a perinatal
mortality of 0.8 / 1000 births.
B. Perivillous Fibrin Deposition
These are firm grey areas of no clinical significance unless extensive.
It is present in upto 22% of term placenta, 12% PIH; essential HT and 6%
in Diabetes mellitus according to MOE 1969. No maternal factor is
associated with increased incidence of this lesion. This does not usually
contribute to poor perinatal outcome unless more than 40% placenta is
involved. The clinical significance of subchorionic fibrin deposition is
unknown (FOX 1987)..
C.Placental Bleeding
Clot especially an adherent clot towards the center of placenta with
distortion of shape is associated with abruption. Marginal (Fresh clot)
hematoma is of no significance if the clot is small.
D. Placental Calcification and Septal Cyst
Calcification is rarely seen before 36 weeks and is not a factor in poor
perinatal outcome. (TINDALL AND SCOTT 1965, BRUNDT 1973) –
there is no association between fetal hypoxia, low birth weight and
calcification. Incidence of gross placental calcification is 19% (FOX
1964 ).
Septal cyst is seen in 11.20% of full term uncomplicated pregnancies
usually in the subchorionic zone. These are of interest due to gross
appearance on cross sectioning placenta and association with DM ,Rhesus
disease and are of no clinical significance.
E. Choriocarcinoma resembling a fresh infarct, hydatidiform mole are very
rare with a normal gestation.
F. Intervillous thrombosis has been reported with Rhesus disease,
preeclampsia, ABO incompatibility with no clear association with
perinatal outcome.
6. ABNORMALITIES OF FETAL PLACENTAL SURFACE
I. GROSS
i. Fetal anaemia : Pale fetal surface is seen in anaemia in newborn,
hydrops, hemorrhage, requiring transfusion.
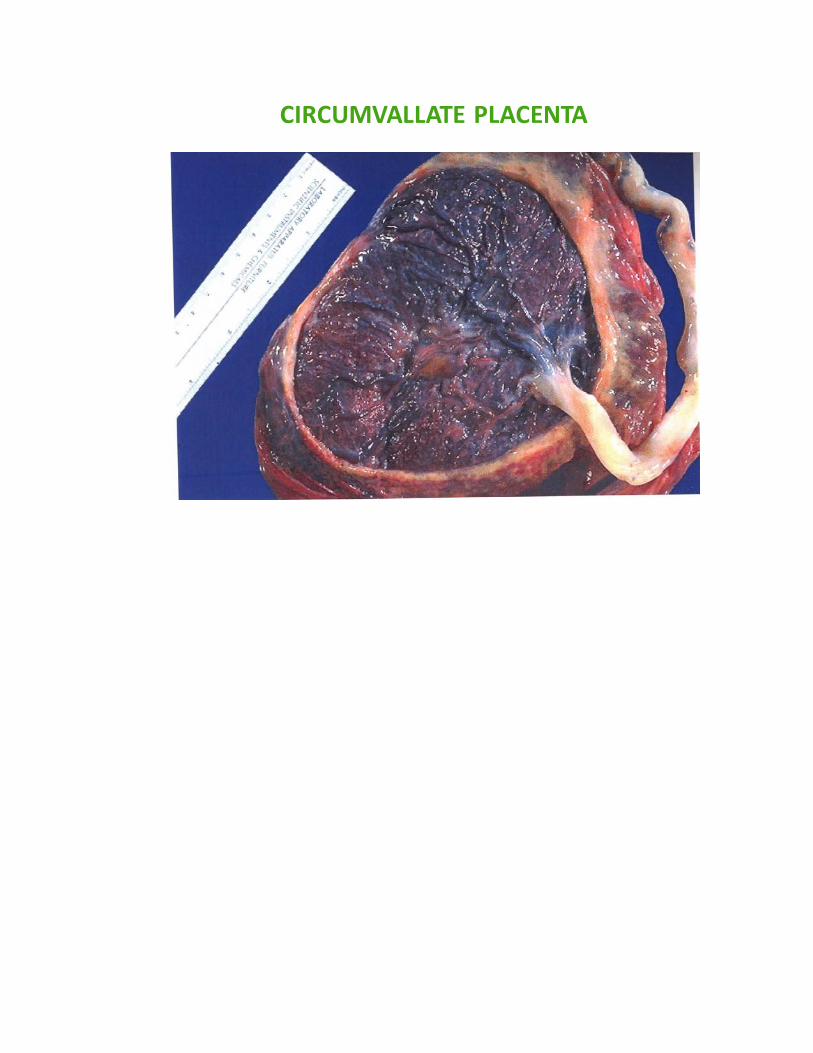
CIRCUMVALLATE PLACENTA
Circumvallate placenta is seen in prematurity, abruption, multiparity,
early fluid loss.
ii. Circummarginate placenta is of no clinical significance but may be
associated with an increase in fetal malformations.
iii. Amnion nodosum multiple, tiny, white, yellow nodules is seen in
Oligohydramnios, Renal agenesis, pulmonary hypoplasia.
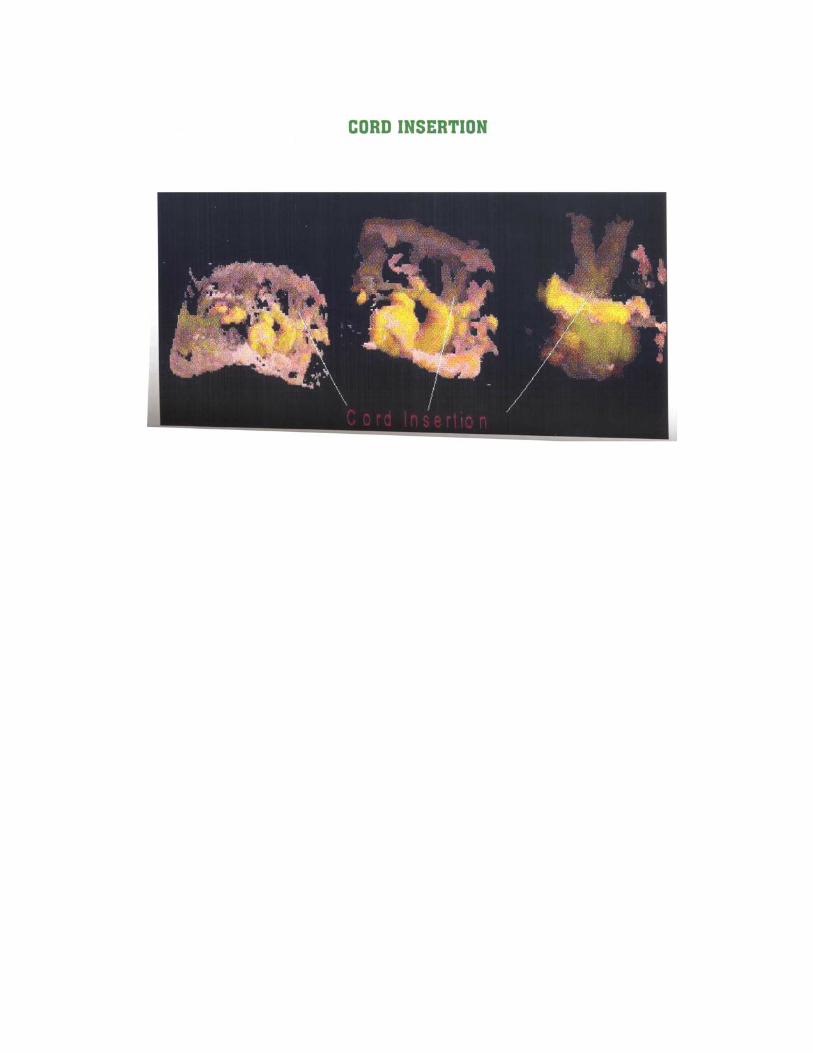
iv. Squamous metaplasia multiple, tiny, white, yellow nodules around cord
insertion is of no significance.
v. Amniotic bands may cause amputation of parts, death.
vi. Fetus papyraceous and compressus with deceased twin.
II. Disorders of Fetoplacental Vasculature
I. Fetal Artery Thrombosis
Fetal artery thrombosis is present in 4.5 – 10 % of term placenta and
increased in diabetes mellitus according to DRISCOLL, 1965. This is
usually seen as thrombosis of large surface chorionic plate vessels causing
distinct well demarcated pale area of placental parenchyma. Associated
histological features include avascular or hypovascular villi devoid of fetal
vessel with villous stromal fibrosis and number of syncytial knot. 50 % or
more of placenta to be involved is proved to be clinically significant.
II. Chorioangiosis (Villous Hypervascularity)
These are fleshy dark red lesions. If large may be associated with fetal
hydrops. It is associated with diabetes mellitus, preeclampsia and RH
incompatibility and probably represents a compensatory hyperplasia of
uncertain cause. The clinical importance of chorioangiosis is that it is seen in
placenta of 5% hospitalized newborns and seen in placenta of normal
pregnancies. 25% of affected neonates die or have congenital anomalies
according to GEOFFREY ALT SHULER SCORT (1996).
III. Villous Hypovascularity
This finding refers to small villi with too few vessels per terminal villi.
It is a feature of delayed villous maturity resulting from obstruction by
thrombus, obliterative endarteritis and post term pregnancy. (FOX, 1987).
IV. Villous AVascularity
Usually focal and may be due to absence of primary villous
vascularisation and thrombosis. At least 50% of villi need to be avascular to
cause adverse perinatal outcome.
V. Obliterative Endarteritis
This is characterized by swelling and proliferation of intimal cells,
thickening, reduplication of subendothelial basement membrane which can
result in luminal occlusion. Maternal uteroplacental vascular insufficiency is
the primary event in causing the change resulting in low birth weight
according to FOX (1987). It is associated with preeclampsia, HT, DM. It is
primarily due to decreased blood flow into intervillous space contributing to
poor perinatal outcome.
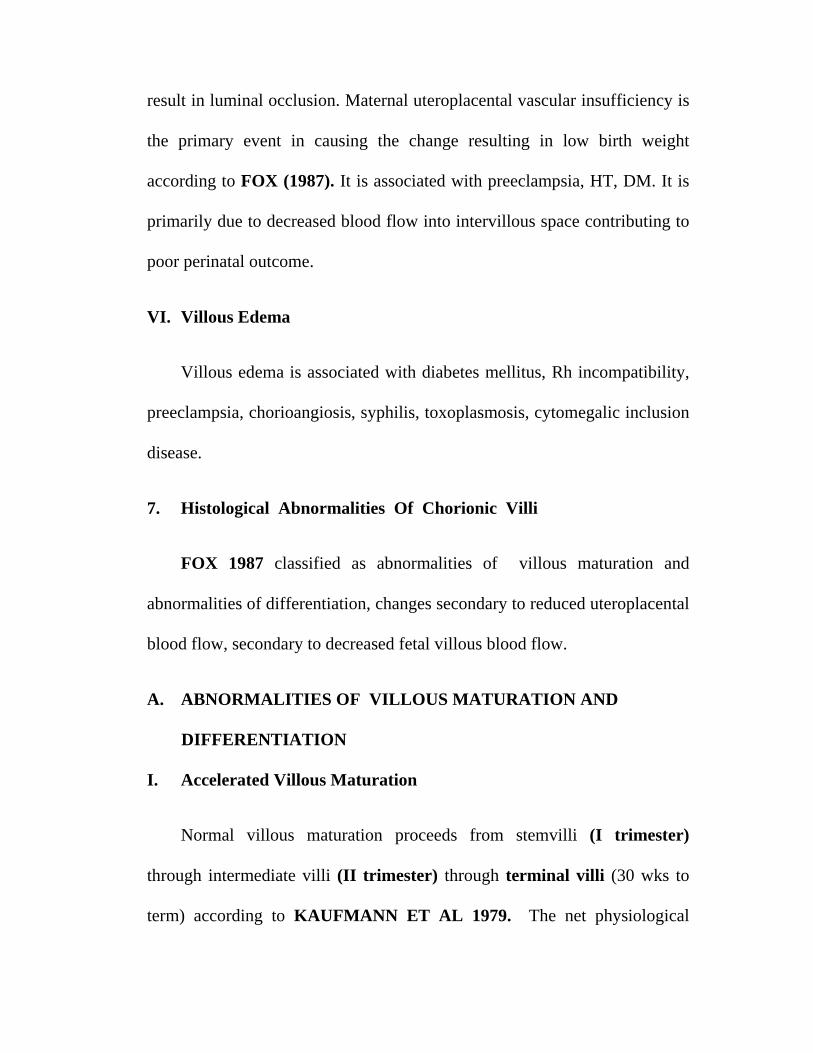
VI. Villous Edema
Villous edema is associated with diabetes mellitus, Rh incompatibility,
preeclampsia, chorioangiosis, syphilis, toxoplasmosis, cytomegalic inclusion
disease.
7. Histological Abnormalities Of Chorionic Villi
FOX 1987 classified as abnormalities of villous maturation and
abnormalities of differentiation, changes secondary to reduced uteroplacental
blood flow, secondary to decreased fetal villous blood flow.
A. ABNORMALITIES OF VILLOUS MATURATION AND
DIFFERENTIATION
I. Accelerated Villous Maturation
Normal villous maturation proceeds from stemvilli (I trimester)
through intermediate villi (II trimester) through terminal villi (30 wks to
term) according to KAUFMANN ET AL 1979. The net physiological
effect is a six fold increase in villous surface area at 20-40 weeks gestation.
Accelerated maturation for GA is recognized by decrease in villous size,
increase in the number of syncytial knot and inappropriate increase in the
number of vasculosyncytial membranes. Such accelaration occurs commonly
with PIH, essential hypertension. Cytotrophoblastic hyperplasia and
basement membrane thickening also occurs. Placental weight is low.
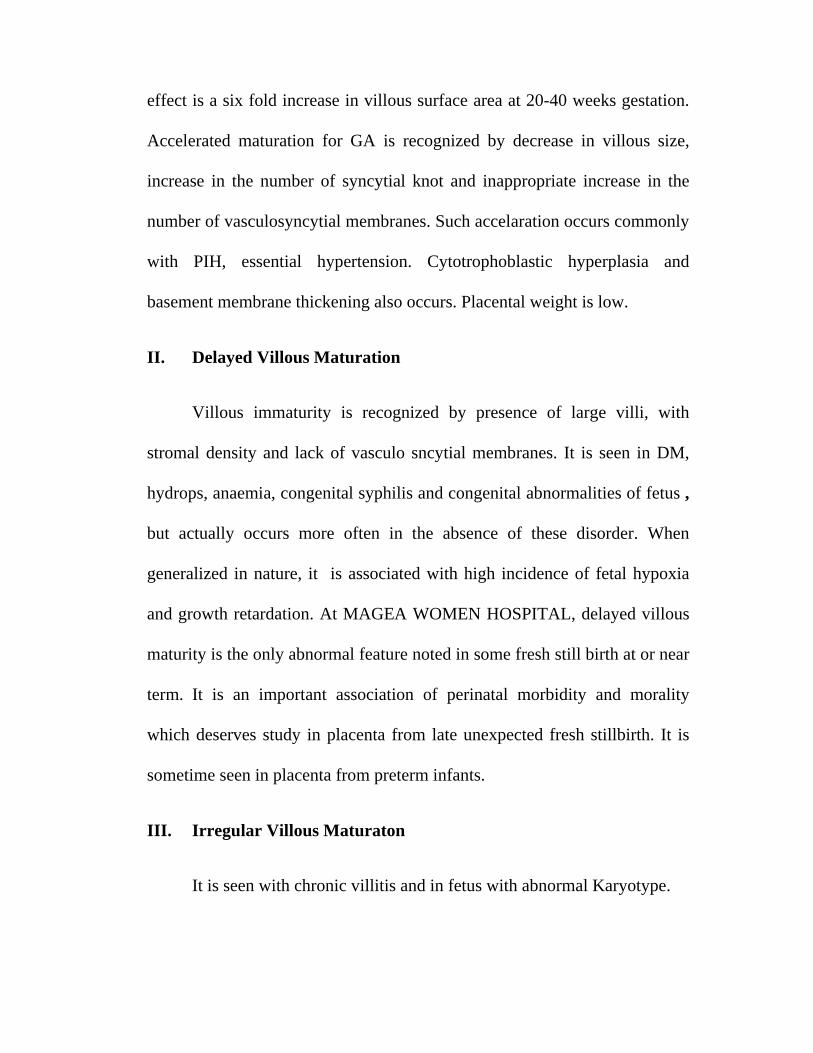
II. Delayed Villous Maturation
Villous immaturity is recognized by presence of large villi, with
stromal density and lack of vasculo sncytial membranes. It is seen in DM,
hydrops, anaemia, congenital syphilis and congenital abnormalities of fetus ,
but actually occurs more often in the absence of these disorder. When
generalized in nature, it is associated with high incidence of fetal hypoxia
and growth retardation. At MAGEA WOMEN HOSPITAL, delayed villous
maturity is the only abnormal feature noted in some fresh still birth at or near
term. It is an important association of perinatal morbidity and morality
which deserves study in placenta from late unexpected fresh stillbirth. It is
sometime seen in placenta from preterm infants.
III. Irregular Villous Maturaton
It is seen with chronic villitis and in fetus with abnormal Karyotype.
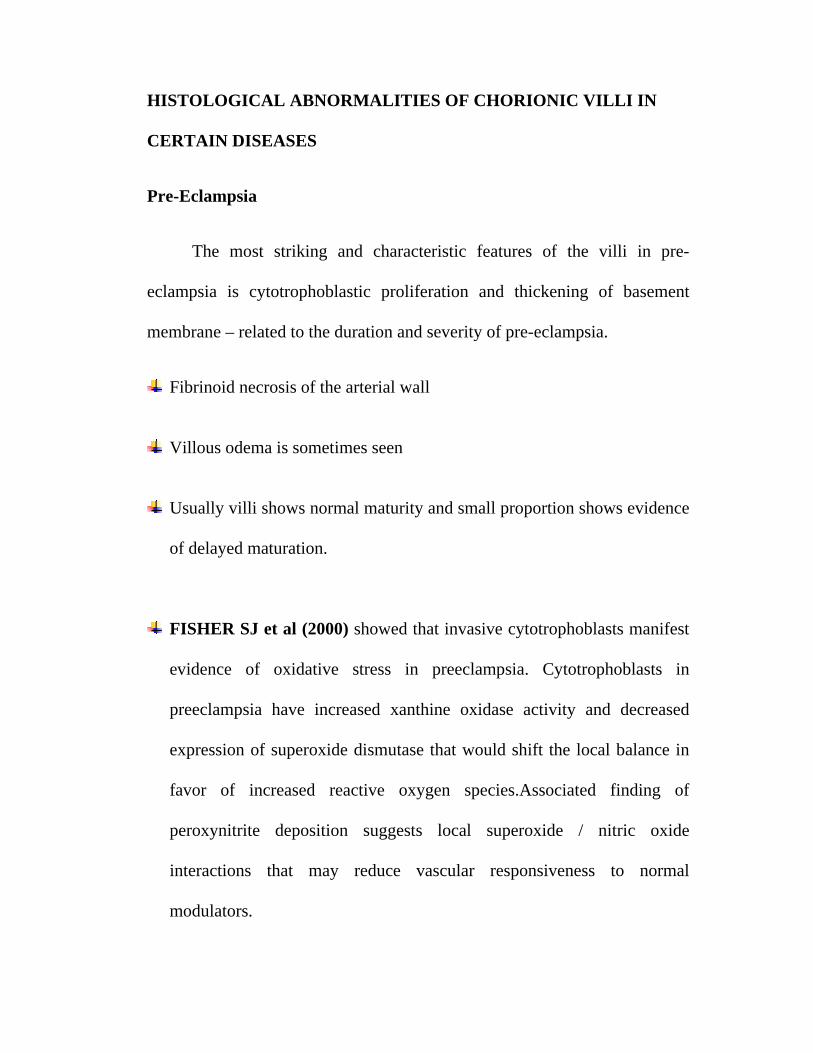
HISTOLOGICAL ABNORMALITIES OF CHORIONIC VILLI IN
CERTAIN DISEASES
Pre-Eclampsia
The most striking and characteristic features of the villi in pre-
eclampsia is cytotrophoblastic proliferation and thickening of basement
membrane – related to the duration and severity of pre-eclampsia.
Fibrinoid necrosis of the arterial wall
Villous odema is sometimes seen
Usually villi shows normal maturity and small proportion shows evidence
of delayed maturation.
FISHER SJ et al (2000) showed that invasive cytotrophoblasts manifest
evidence of oxidative stress in preeclampsia. Cytotrophoblasts in
preeclampsia have increased xanthine oxidase activity and decreased
expression of superoxide dismutase that would shift the local balance in
favor of increased reactive oxygen species.Associated finding of
peroxynitrite deposition suggests local superoxide / nitric oxide
interactions that may reduce vascular responsiveness to normal
modulators.
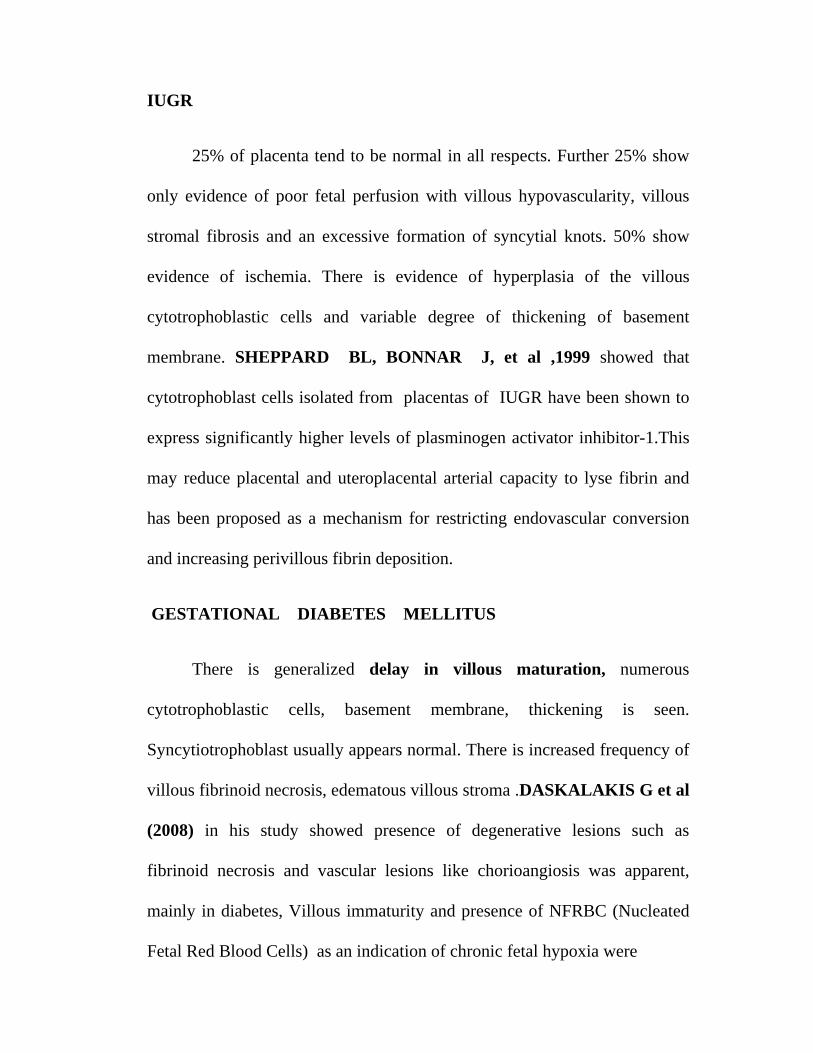
IUGR
25% of placenta tend to be normal in all respects. Further 25% show
only evidence of poor fetal perfusion with villous hypovascularity, villous
stromal fibrosis and an excessive formation of syncytial knots. 50% show
evidence of ischemia. There is evidence of hyperplasia of the villous
cytotrophoblastic cells and variable degree of thickening of basement
membrane. SHEPPARD BL, BONNAR J, et al ,1999 showed that
cytotrophoblast cells isolated from placentas of IUGR have been shown to
express significantly higher levels of plasminogen activator inhibitor-1.This
may reduce placental and uteroplacental arterial capacity to lyse fibrin and
has been proposed as a mechanism for restricting endovascular conversion
and increasing perivillous fibrin deposition.
GESTATIONAL DIABETES MELLITUS
There is generalized delay in villous maturation, numerous
cytotrophoblastic cells, basement membrane, thickening is seen.
Syncytiotrophoblast usually appears normal. There is increased frequency of
villous fibrinoid necrosis, edematous villous stroma .DASKALAKIS G et al
(2008) in his study showed presence of degenerative lesions such as
fibrinoid necrosis and vascular lesions like chorioangiosis was apparent,
mainly in diabetes, Villous immaturity and presence of NFRBC (Nucleated
Fetal Red Blood Cells) as an indication of chronic fetal hypoxia were
significantly increased in the plaentas of diabetic women.Fetal/placental
weight ratio was significantly lower in diabetic women.
8. UMBILICAL CORD ABNORMALITIES
Umbilical cord, the life line of fetus is subject to wide variety of
lesions untoward gestational events,whose origin may be structural,
mechanical, infections (RTEPHENE, A. HEIFETZ 1996). In all the
placenta, the length must be measured in the delivery room. True cord length
at term < 32 cm or > 100cm warrant further study (CYNTHIA G KAPLAN
1996). The typical umbilical cord is long enough to allow the infant to begin
nursing before placental delivery. This provides a release of oxytocin to
facilitate uterine contractions and both the separation and delivery of the
placenta.In part cord length is genetically determined. Cord accidents are
well recognized cause of intrauterine fetal death. These cord problems
contribute to fetal heart abnormalities.
Short cord < 40 cm is associated with a less active fetus, fetal
malformations, myopathic and neuropathic diseases, down syndrome, and
oligohydramnios. According to RAYBURN ET AL 1981., is a cause of
cord rupture or delayed delivery in 2nd stage. It may also lead to
hemorrhage, stricture, malpresentations, abortion, uterine inversion, Werdnig
Hoffmann disease.
Long cord > 100 cm is associated with fetal hyperkinesis, increased
risk of torsion, knots, thrombosis, fetal entanglement, cord prolapse. Thin
cord and decreased amount of whartons jelly is associated with
postmaturity, oligohydramnios, torsion and fetal death.
Edema diffuse edema is associated with prematurity, hemolytic
disease, preeclampsia, diabetes mellitus, transient tachypnoea of new born.
Focal edema is seen with Trisomys, patent urachus, omphalocoele.
Necrotizing funisitis distinctive segmental resemblance to a
barbers pole is seen in syphilis and other acute, subacute and chronic
infections.
Velamentous cord insertion – there is greater risk of fetal
hemorrhage, thrombosis. Associated with advanced maternal age, Diabetes
mellitus, smoking, single umbilical artery, fetal malformations.
Cord hematoma is a rare event, resulting in fetal death from blood
loss or compression of cord vessels, more common in late pregnancy.
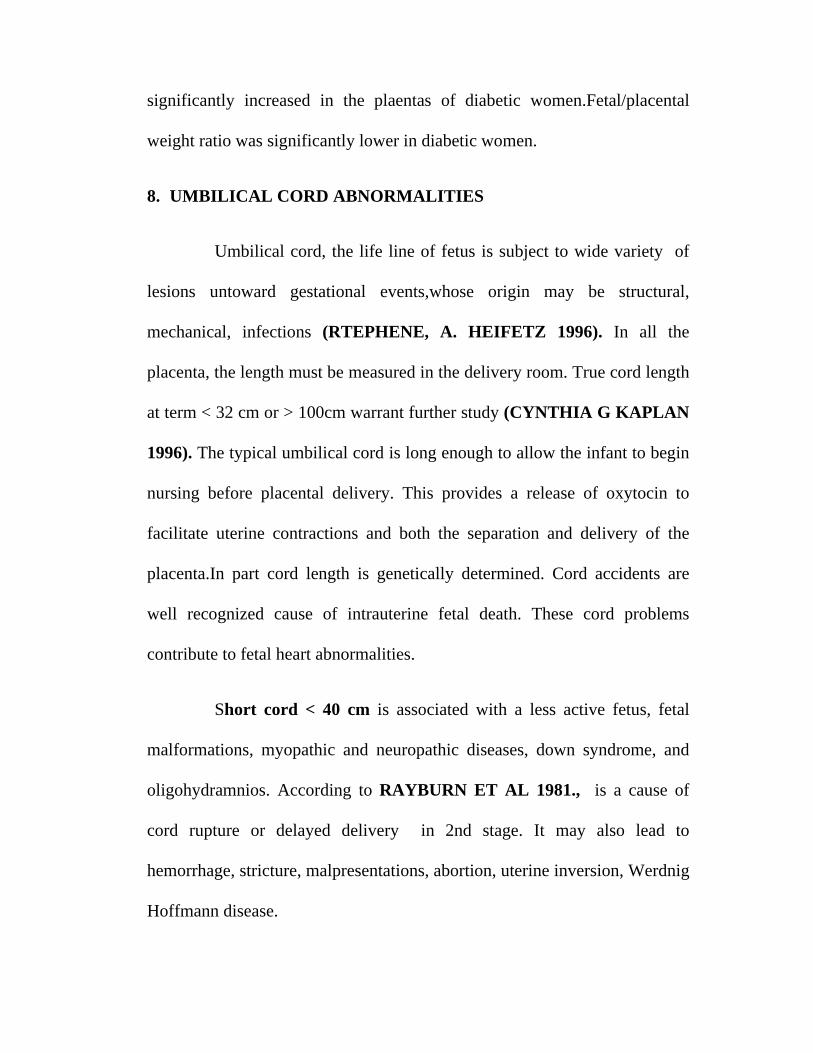
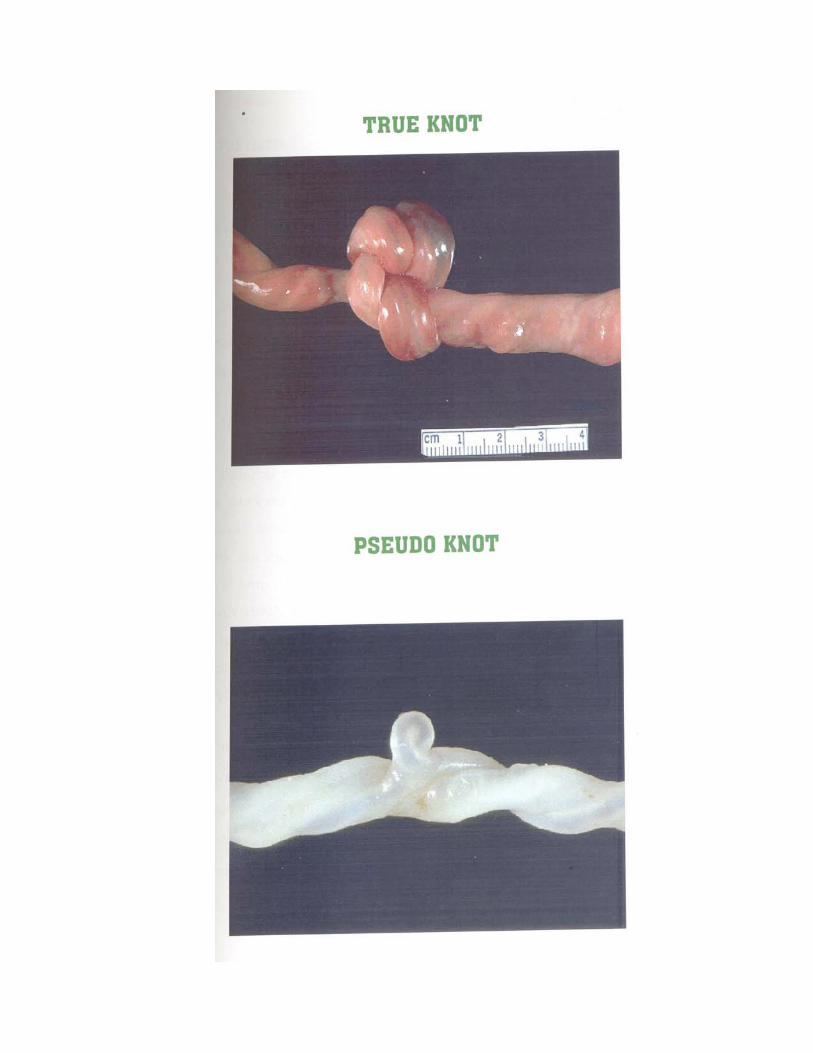
Cord knots occur in less than 1% of placenta and may account for
8-11% perinatal mortality. (NAEYE, 1987, FOX 1978). Cord edema,
thrombosis, grooving are morphological changes that indicate knot tightness
sufficient to cause obstruction to blood flow.
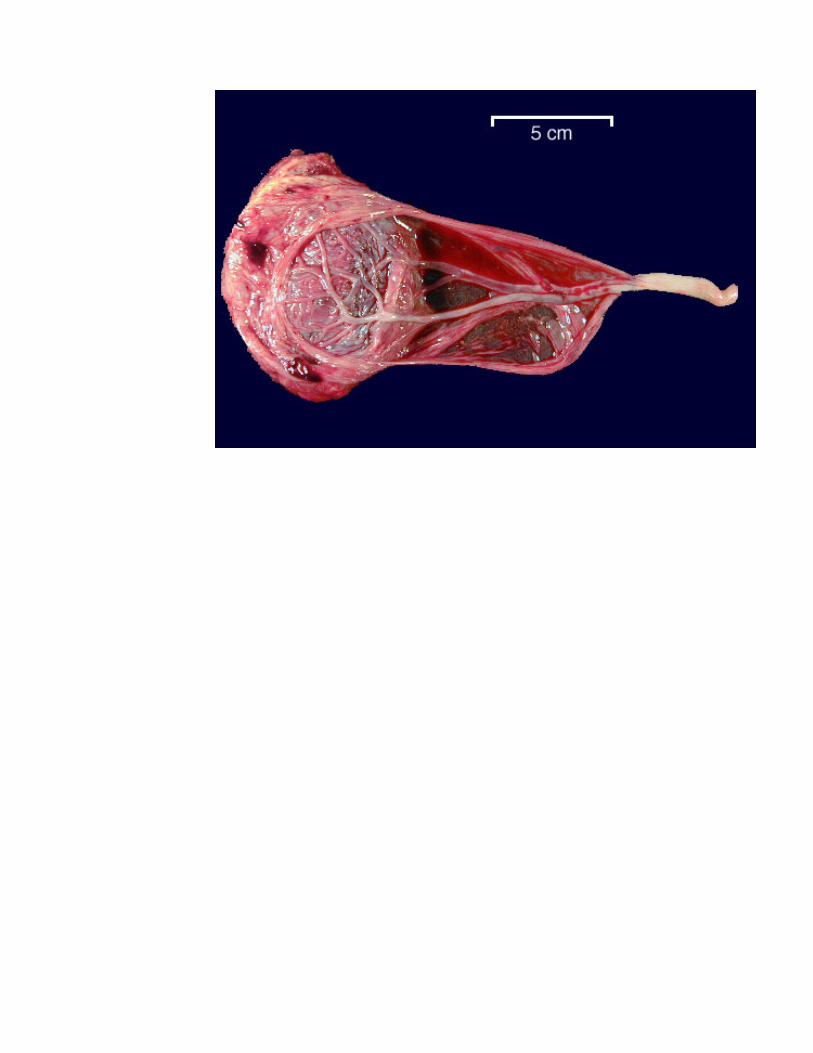
Abnormal number of vessels count the number at more than 5
cm from the placental end of the cord. Single umbilical artery has an
incidence of 50% of fetal anomalies.. Two vessel cord, thrombi, congested
knots, should be sent for pathological examination (CYNTHIA G.
KAPLAN 1996).
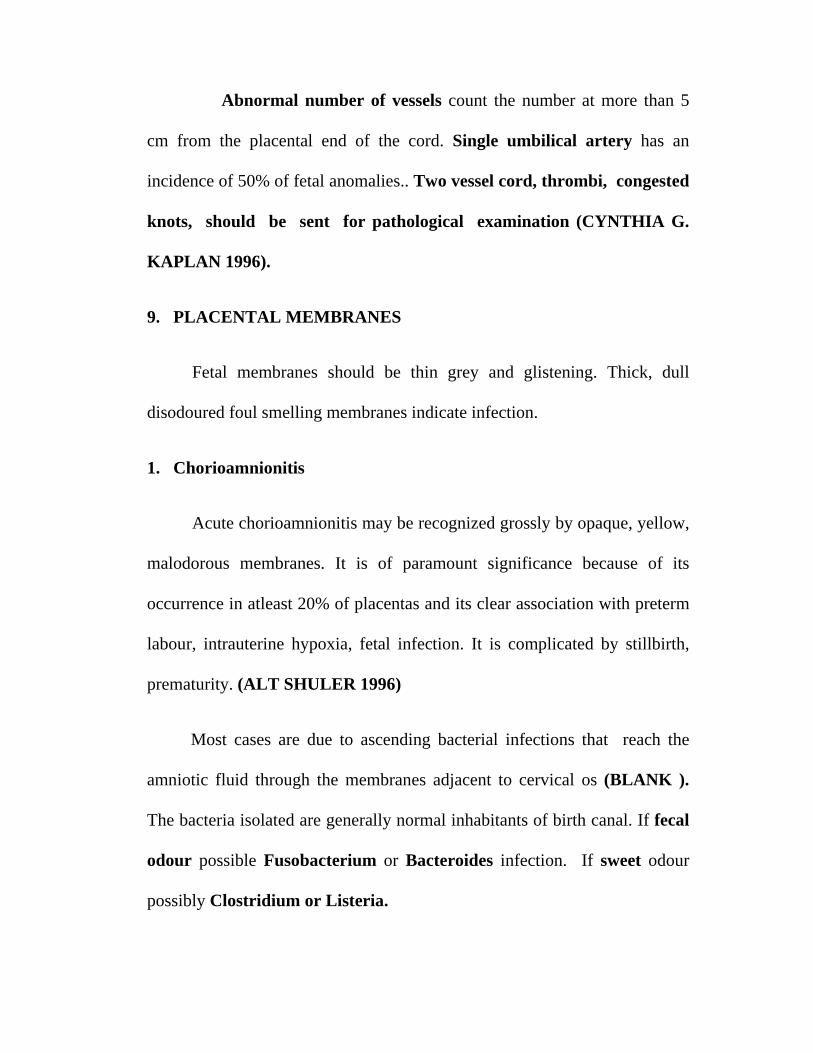
9. PLACENTAL MEMBRANES
Fetal membranes should be thin grey and glistening. Thick, dull
disodoured foul smelling membranes indicate infection.
1. Chorioamnionitis
Acute chorioamnionitis may be recognized grossly by opaque, yellow,
malodorous membranes. It is of paramount significance because of its
occurrence in atleast 20% of placentas and its clear association with preterm
labour, intrauterine hypoxia, fetal infection. It is complicated by stillbirth,
prematurity. (ALT SHULER 1996)
Most cases are due to ascending bacterial infections that reach the
amniotic fluid through the membranes adjacent to cervical os (BLANK ).
The bacteria isolated are generally normal inhabitants of birth canal. If fecal
odour possible Fusobacterium or Bacteroides infection. If sweet odour
possibly Clostridium or Listeria.
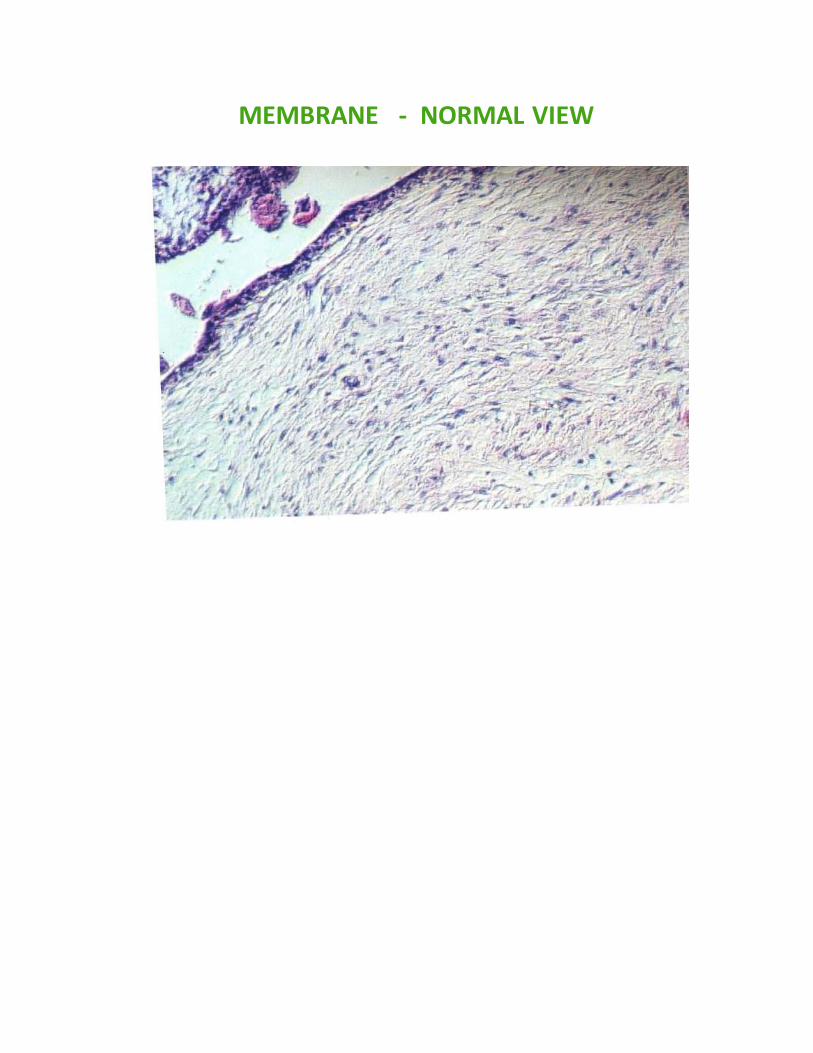
MEMBRANE ‐ NORMAL VIEW
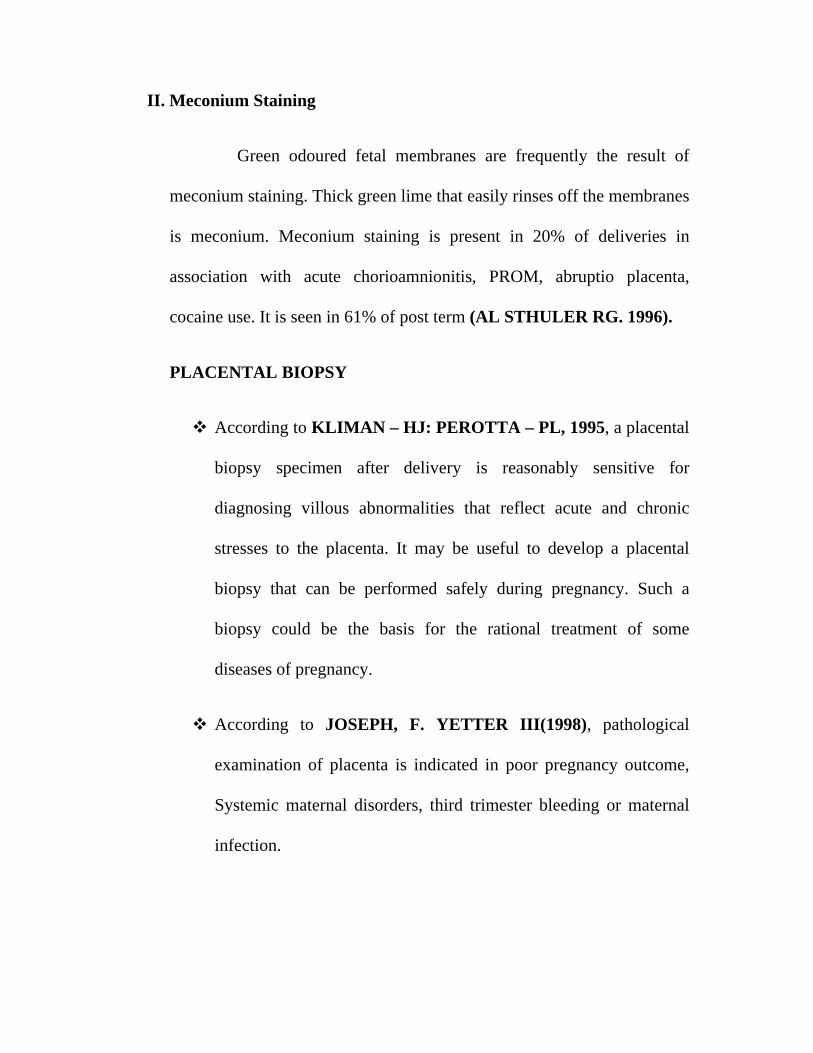
II. Meconium Staining
Green odoured fetal membranes are frequently the result of
meconium staining. Thick green lime that easily rinses off the membranes
is meconium. Meconium staining is present in 20% of deliveries in
association with acute chorioamnionitis, PROM, abruptio placenta,
cocaine use. It is seen in 61% of post term (AL STHULER RG. 1996).
PLACENTAL BIOPSY
According to KLIMAN – HJ: PEROTTA – PL, 1995, a placental
biopsy specimen after delivery is reasonably sensitive for
diagnosing villous abnormalities that reflect acute and chronic
stresses to the placenta. It may be useful to develop a placental
biopsy that can be performed safely during pregnancy. Such a
biopsy could be the basis for the rational treatment of some
diseases of pregnancy.
According to JOSEPH, F. YETTER III(1998), pathological
examination of placenta is indicated in poor pregnancy outcome,
Systemic maternal disorders, third trimester bleeding or maternal
infection.
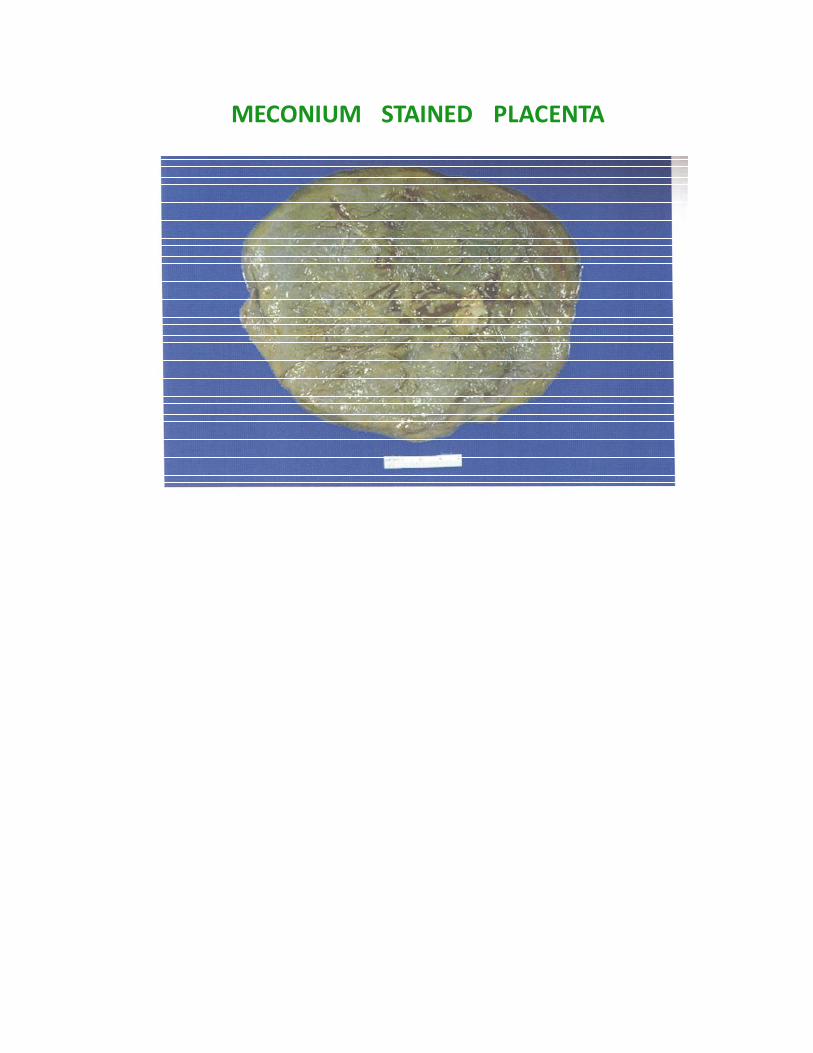
MECONIUM STAINED PLACENTA
DOPPLER VELOCIMETRY IN PREECLAMPSIA:
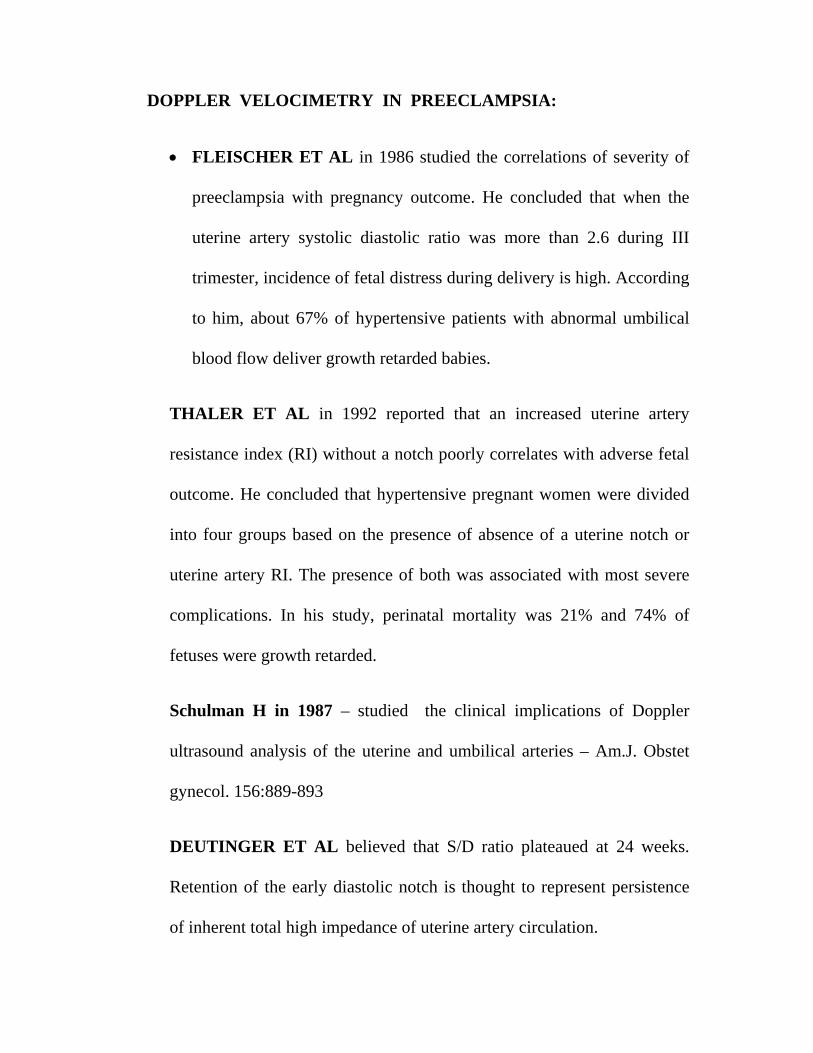
• FLEISCHER ET AL in 1986 studied the correlations of severity of
preeclampsia with pregnancy outcome. He concluded that when the
uterine artery systolic diastolic ratio was more than 2.6 during III
trimester, incidence of fetal distress during delivery is high. According
to him, about 67% of hypertensive patients with abnormal umbilical
blood flow deliver growth retarded babies.
THALER ET AL in 1992 reported that an increased uterine artery
resistance index (RI) without a notch poorly correlates with adverse fetal
outcome. He concluded that hypertensive pregnant women were divided
into four groups based on the presence of absence of a uterine notch or
uterine artery RI. The presence of both was associated with most severe
complications. In his study, perinatal mortality was 21% and 74% of
fetuses were growth retarded.
Schulman H in 1987 – studied the clinical implications of Doppler
ultrasound analysis of the uterine and umbilical arteries – Am.J. Obstet
gynecol. 156:889-893
DEUTINGER ET AL believed that S/D ratio plateaued at 24 weeks.
Retention of the early diastolic notch is thought to represent persistence
of inherent total high impedance of uterine artery circulation.
ARISTIDOU ET AL noted that the uterine artery notch was a good
predictor of poor perinatal outcome.
KOFINAS ET AL found that the perinatal outcome correlated best
with placental uterine artery, the mean index using both uterine arteries next
best, and the non placental uterine artery the poorest predictor.
Persistence of the uterine notch indicates severe hypertensive disease
and its presence in III trimester is associated with increased rate of IUGR,
caesarean delivery for fetal distress and preterm delivery.
The difference in main uterine artery waveform indices between
normal and pathologic pregnancies is probably greater than at other sites of
uterine artery. Measurement of the main uterine artery may be more
reproducible and allows standardized longitudinal follow up, because it is a
reflector of total subplacental resistance, remains the most clinically
important parameter.
The prevalence of the perinatal outcome measured will have the
biggest impact as will the definition of abnormal uterine Doppler
velocimetry. The data suggests that the presence of the notch is the most
important criterion.SAGOL S, OZKINAY E et al (1999) showed that
increased uterine artery resistance parellels histologic evidence of impaired
trophoblastic migration.

AIM OF THE STUDY

AIM OF THE STUDY
i. To compare the placental abnormalities in normal and specific high
risk pregnancies by using Doppler and Histology.
ii. To study the possible, probable correlation with fetal outcome.

MATERIALS AND METHODS
MATERIALS AND METHODS
SETTING
This study was carried out at the Institute of social obstetrics and Govt
Kasturba Gandhi Hospital, Triplicane, Chennai.
STUDY DESIGN
It is a prospective study of morphology and histology of placenta in
randomly selected normal and specific high risk pregnancies and its
correlation with fetal outcome.
PERIOD OF STUDY
From May 2009 – October 2010
MATERIALS AND METHODS
500 pregnant women between 21-35 yrs of age between gestational
age of > 36 wks, coming to antenatal OP at KGH are selected.
Each women is analysed in detail with
1) Age
2) Parity
3) Associated Medical / Obstetric Complication
4) Gestational Age

They are classified into 2 groups.
Group I - Normal cases (270)
Group II - Specific High risk cases (230)
Preeclampsia – 80
Gestational Diabetes Mellitus – 80
IUGR – 70
History, Physical Examination, Obstetrical Examination, Basic
investigations, Hb% , urine analysis, blood grouping typing, pertaining to
individual patients are carried out.
They are offered the following test.
Uterine Artery Doppler Ultrasonogram:
Following are mainly looked
1) Systolic Diastolic Ratio
2) Early Diastolic Notch
3) Pulsatility Index
4) Resistance Index.
They are followed till delivery once in 2 weeks and at the time of
delivery, placenta is studied both grossly and histologically after formalin
fixation. Fetal outcomes in these cases are observed.
INCLUSION CRITERIA
For Normal Pregnancies:
Primigravida between the age of 21-35 yrs, > 36 weeks of
gestation.
With singleton gestation
No associated medical / obstetric complication.
For specific high risk pregnancies
Primigravida between the age of 21-35 years, > 36 weeks of
gestation, with singleton gestation with the following high risk
factors.
Preeclampsia, mild, and severe
Gestational Diabetes Mellitus
Intrauterine growth restriction.
EXCLUSION CRITERIA
1) Pregnant women < 20 yrs, > 35 yrs.
2) Multiple pregnancy
3) Anemia complicating pregnancy
4) Placenta previa, Abruptio placenta.
5) HIV, HBSAg, Tuberculosis, syphilis complicating pregnancy
6) Pregnant women other than primigravida
7) Other known medical / obstetrical complication not mentioned in high
risk Inclusion criteria.
EXAMINATION OF PLACENTA
Each placenta was washed with tap water and drained off its blood.
On initial examination of placenta, any gross abnormality of shape,
morphometric measurements like size, weight, measurement of cord length
and site of cord insertion were noted. For examination of the membranes, a
segment of membrane was cut rolled from the margin and pinned for HPE.
Cut surface of cord was examined and number of vessels recorded. Each
placenta was then trimmed of membranes, weighed and was then examined
for calcification and infarction.
• The placenta was dipped in 10% formalin solution for fixation
for a period of 48 hrs. They were then cut at every 2 cm interval
into vertical strips. 5µ thin sections were cut from each block
and stained with haematoxylin and eosin. Two bits from cord
were taken. Each section from placenta was examined with light
microscope, first low power and then under high power for
villous pathology. Atleast 100 villi are studied.
MORPHOLOGY
• Infarction
• Calcification
• Meconium staining
• Septal cyst
• True knot
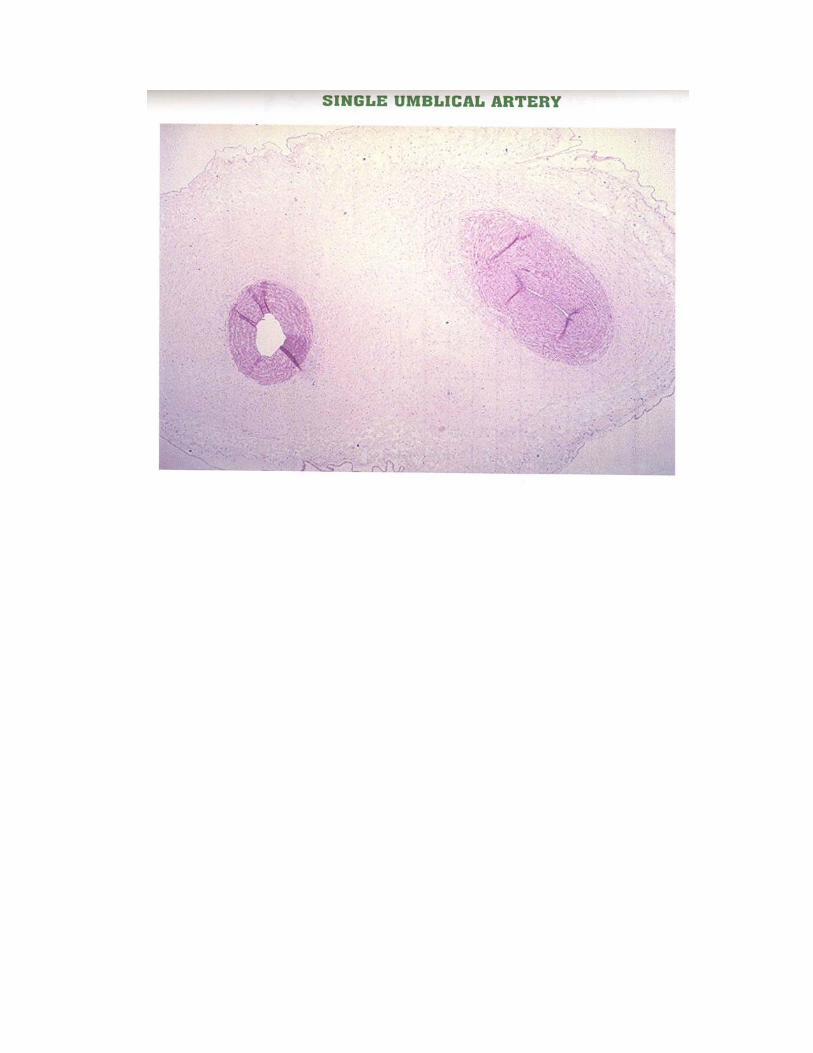
• Single umbilical artery
BASAL PLATE
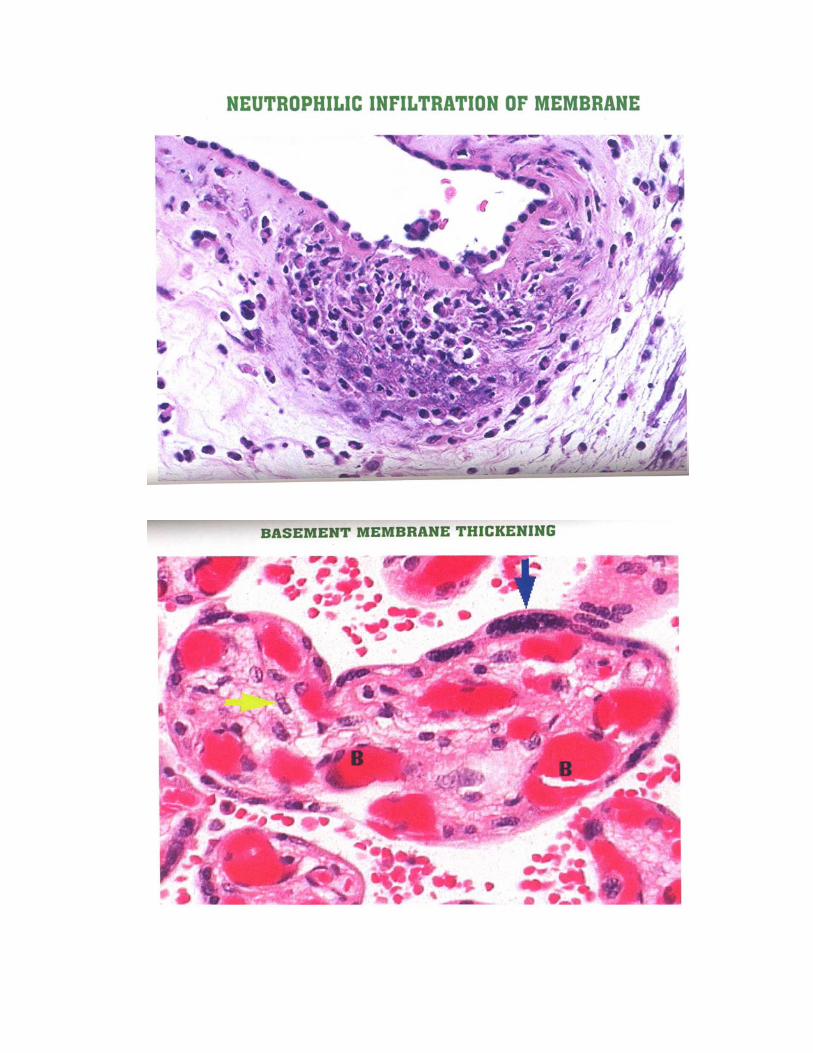
• Neutrophilic Infiltration, Abscess
• Infarction
• Fibrinoid changes in vessels.
VILLOUS PATHOLOGY
• Basement membrane thickening
• Syncytial knot count
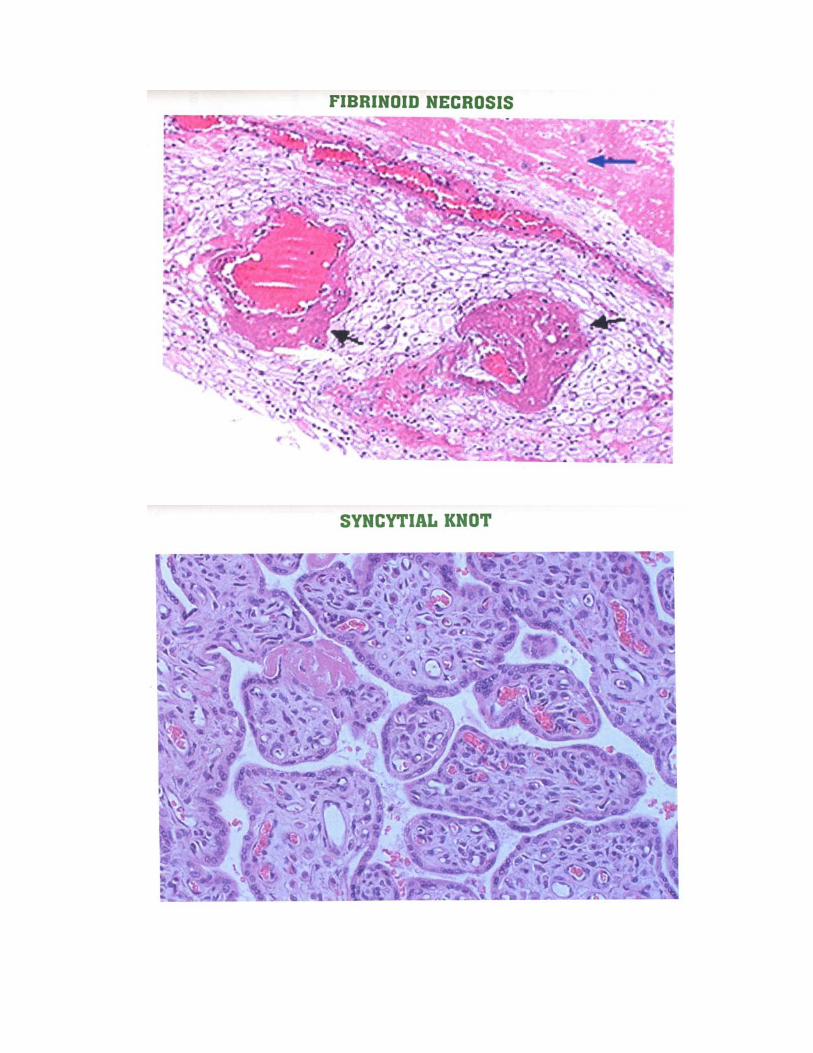
• Fibrinoid necrosis
• Stromal Fibrosis
• Cytotrophoblastic proliferation
• Calcification
• Infarction
CORD / MEMBRANE
Neutrophilic infiltration, Abscess
FETUS
Babies were followed upto discharge in both groups.
Following data are recorded
• Signs of fetal distress
• Birth weight
• APGAR
• NICU Admission
• Neonatal morbidity and mortality
Correlation of fetal outcome with uterine artery Doppler, morphology
and histopathology of placenta was studied using Chi square test, with Yates
correction, Fishers exact test in appropriate places.

RESULTS AND ANALYSIS
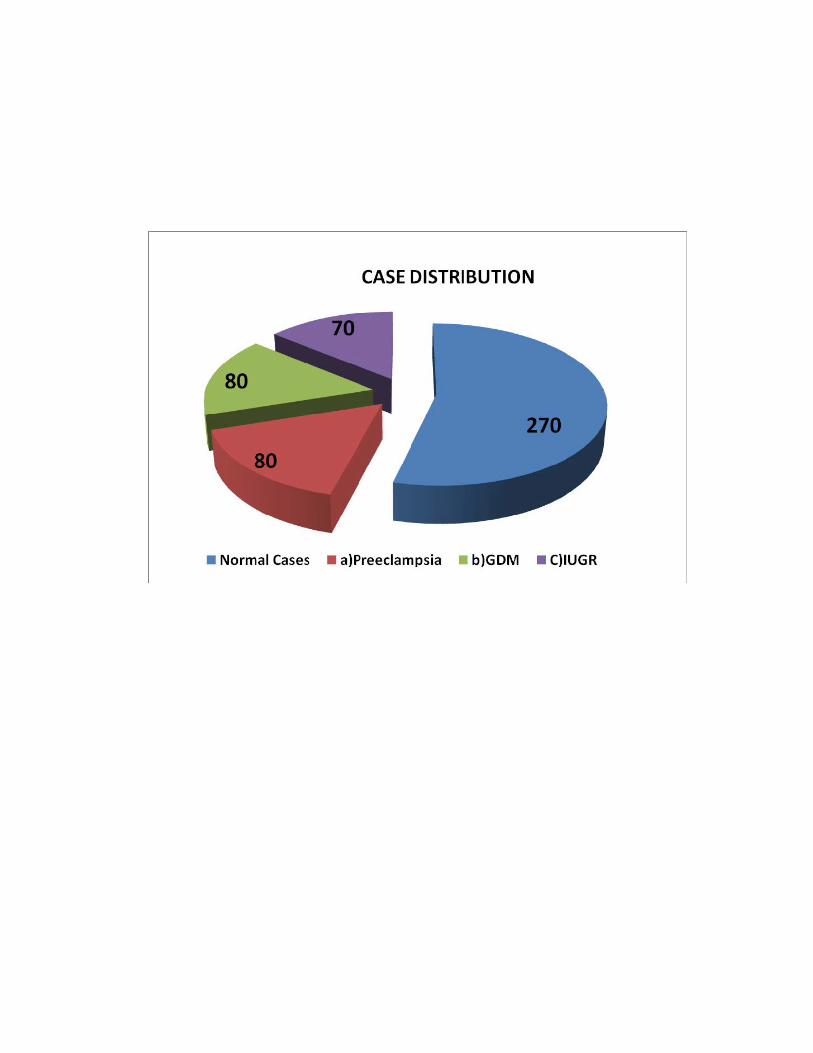
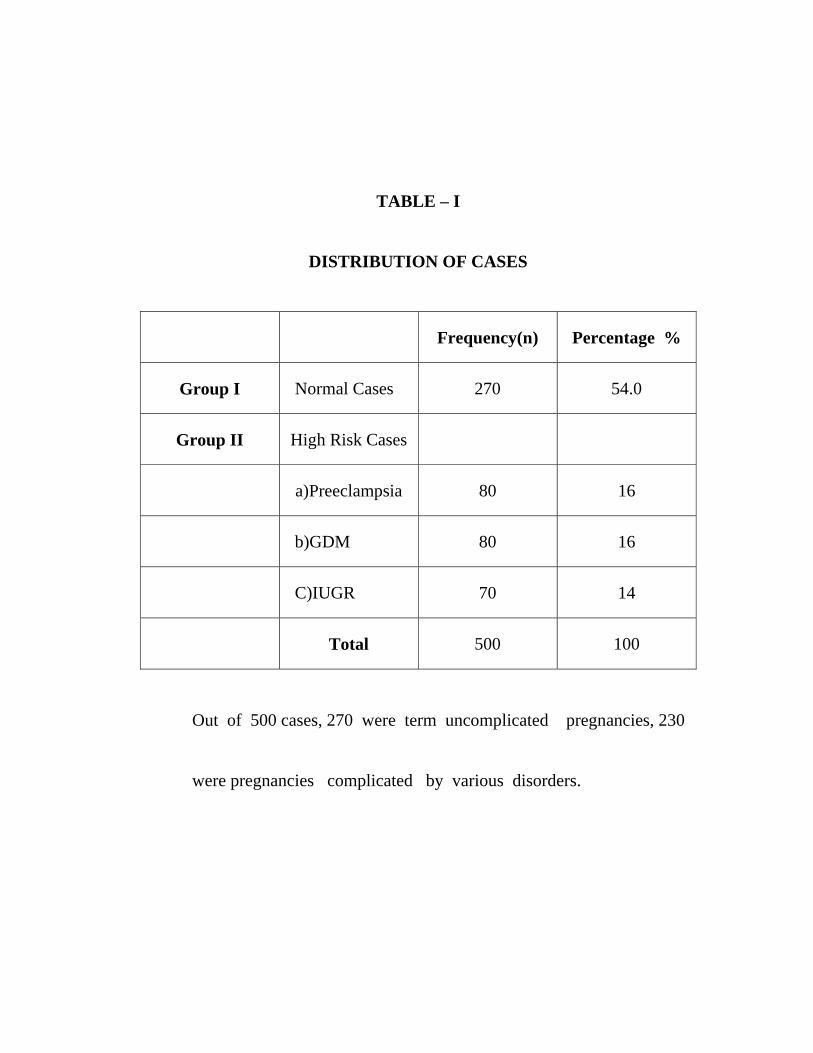
TABLE – I
DISTRIBUTION OF CASES
Frequency(n) Percentage %
Group I Normal Cases 270 54.0
Group II High Risk Cases
a)Preeclampsia 80 16
b)GDM 80 16
C)IUGR 70 14
Total 500 100
Out of 500 cases, 270 were term uncomplicated pregnancies, 230 were pregnancies complicated by various disorders.
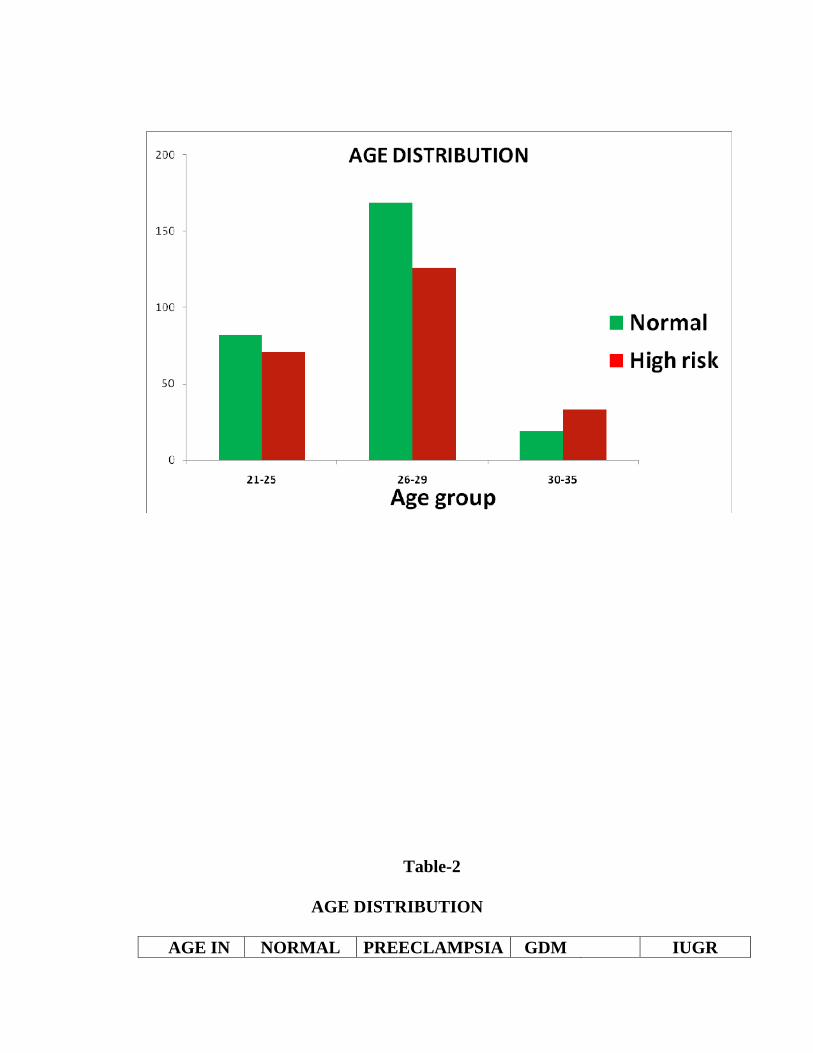
Table-2
AGE DISTRIBUTION
AGE IN NORMAL PREECLAMPSIA GDM IUGR
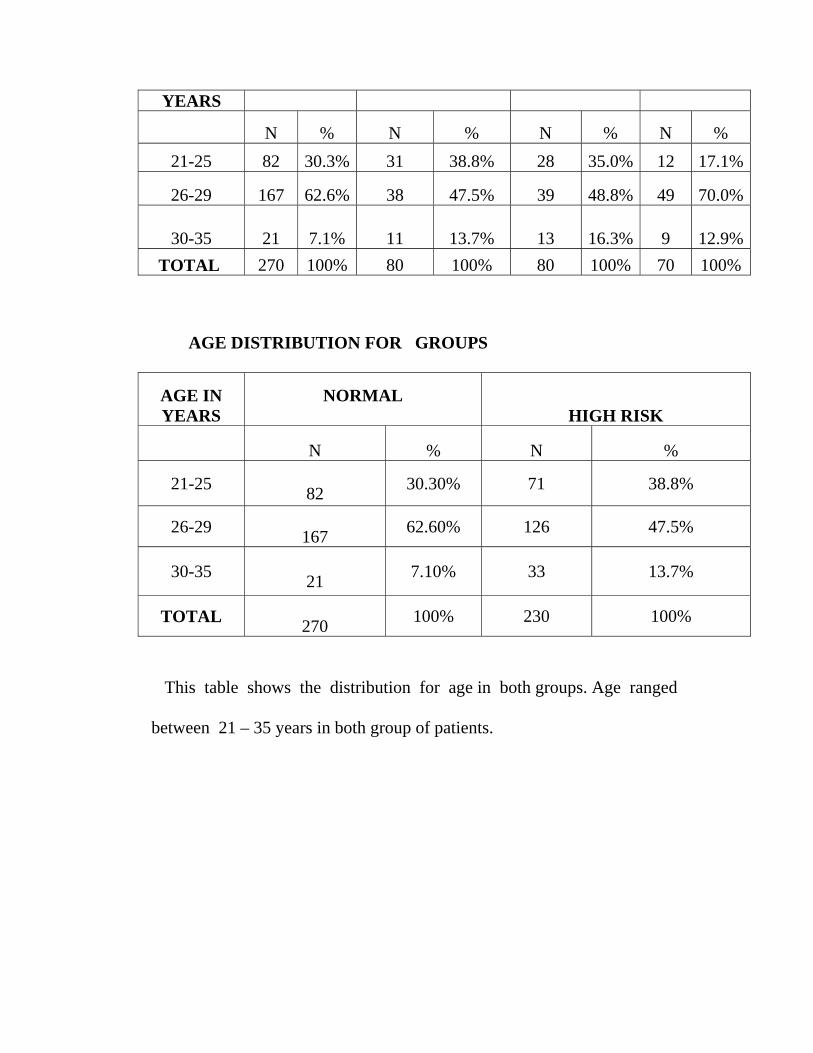
This table shows the distribution for age in both groups. Age ranged between 21 – 35 years in both group of patients.
YEARS
N % N % N % N % 21-25 82 30.3% 31 38.8% 28 35.0% 12 17.1%
26-29 167 62.6% 38 47.5% 39 48.8% 49 70.0%
30-35 21 7.1% 11 13.7% 13 16.3% 9 12.9%TOTAL 270 100% 80 100% 80 100% 70 100%
AGE DISTRIBUTION FOR GROUPS
AGE IN YEARS
NORMAL HIGH RISK
N % N %
21-25 82 30.30% 71 38.8%
26-29 167 62.60% 126 47.5%
30-35 21 7.10% 33 13.7%
TOTAL 270 100% 230 100%
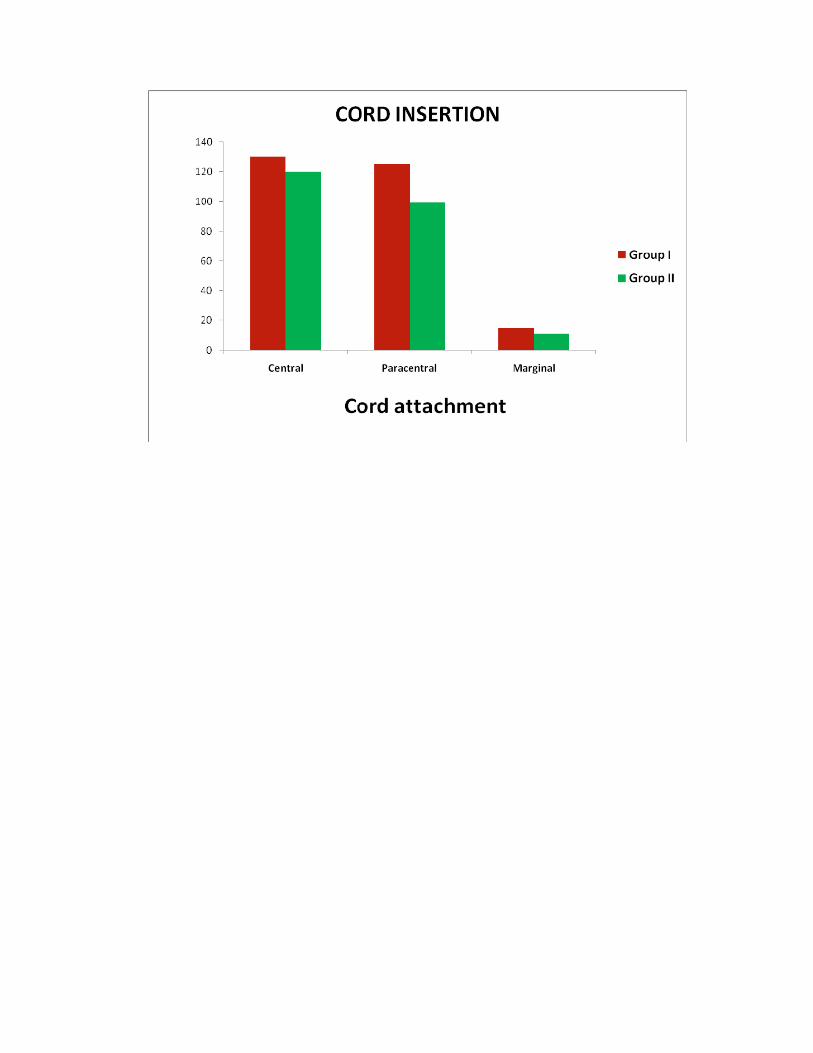
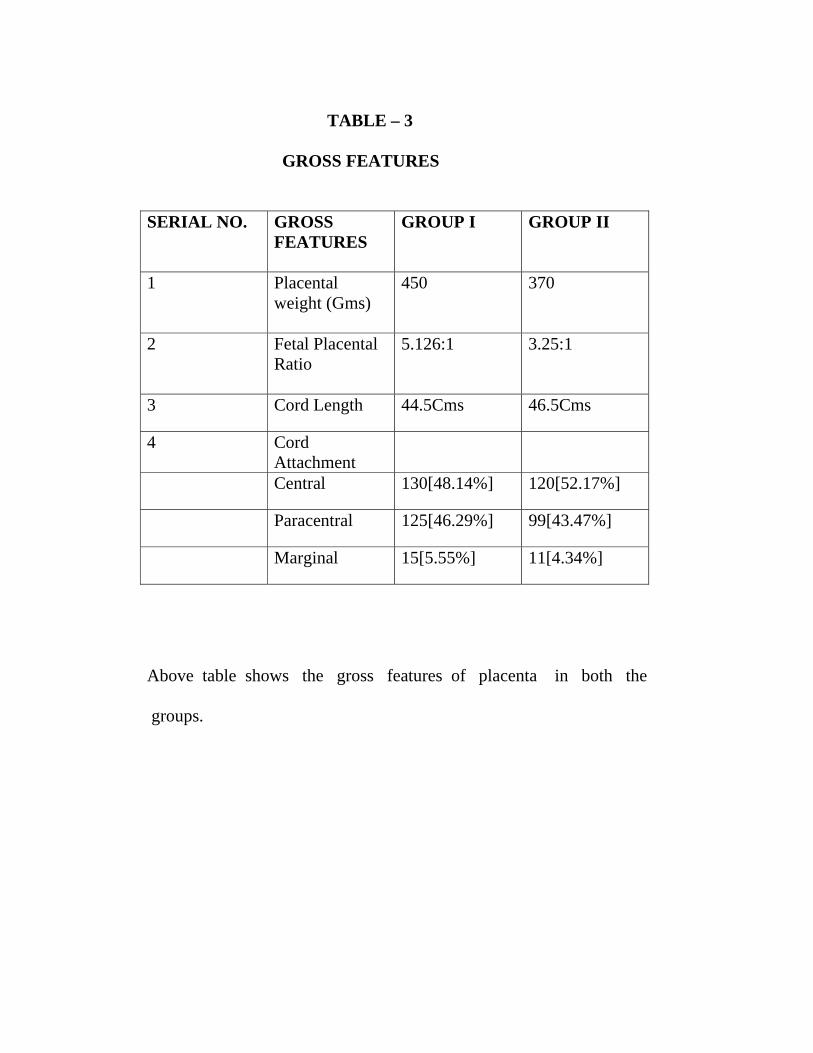
TABLE – 3
GROSS FEATURES
SERIAL NO.
GROSS FEATURES
GROUP I GROUP II
1
Placental weight (Gms)
450 370
2 Fetal Placental Ratio
5.126:1 3.25:1
3 Cord Length 44.5Cms 46.5Cms
4 Cord Attachment
Central 130[48.14%] 120[52.17%]
Paracentral 125[46.29%] 99[43.47%]
Marginal 15[5.55%] 11[4.34%]
Above table shows the gross features of placenta in both the groups.
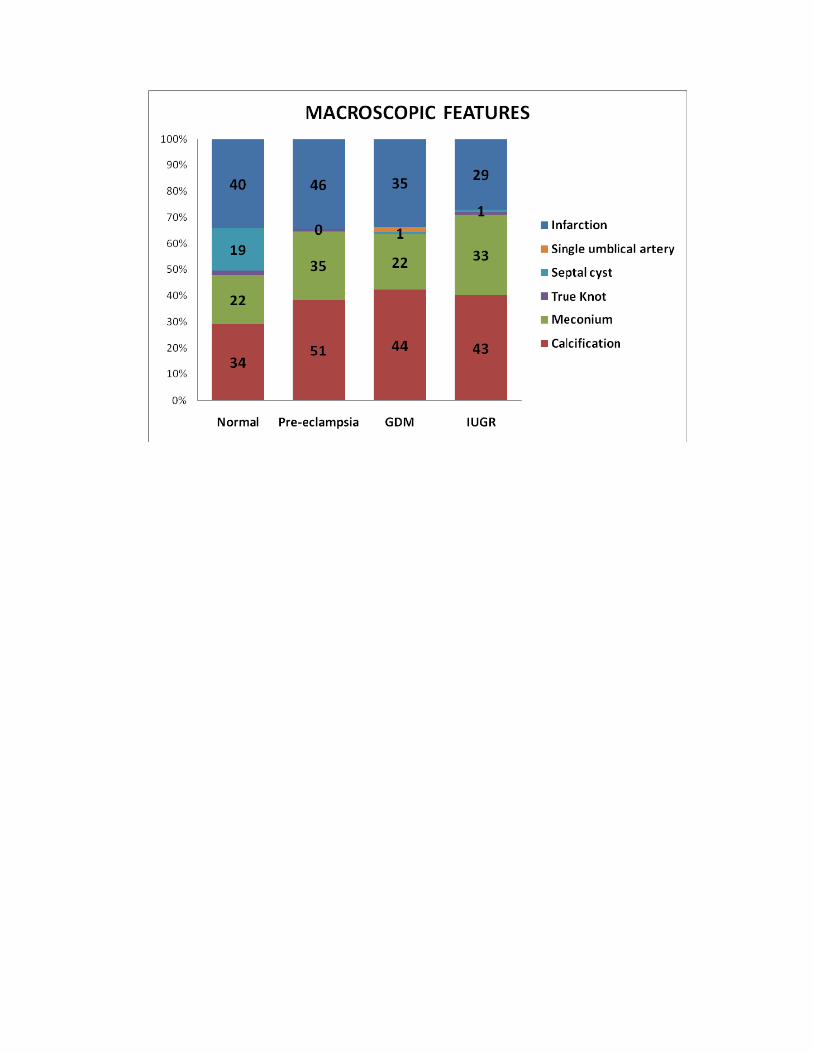
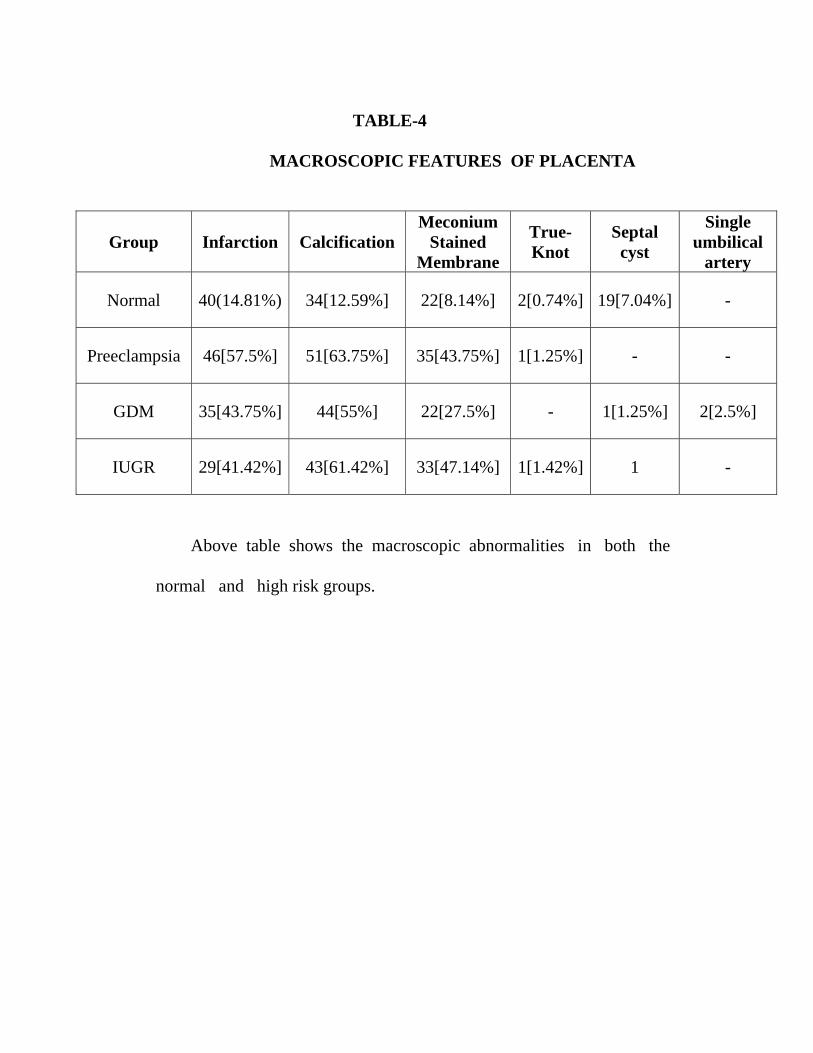
TABLE-4
MACROSCOPIC FEATURES OF PLACENTA
Group Infarction Calcification Meconium
Stained Membrane
True-Knot
Septal cyst
Single umbilical
artery
Normal 40(14.81%) 34[12.59%] 22[8.14%] 2[0.74%] 19[7.04%] -
Preeclampsia 46[57.5%] 51[63.75%] 35[43.75%] 1[1.25%] - -
GDM 35[43.75%] 44[55%] 22[27.5%] - 1[1.25%] 2[2.5%]
IUGR 29[41.42%] 43[61.42%] 33[47.14%] 1[1.42%] 1 -
Above table shows the macroscopic abnormalities in both the normal and high risk groups.
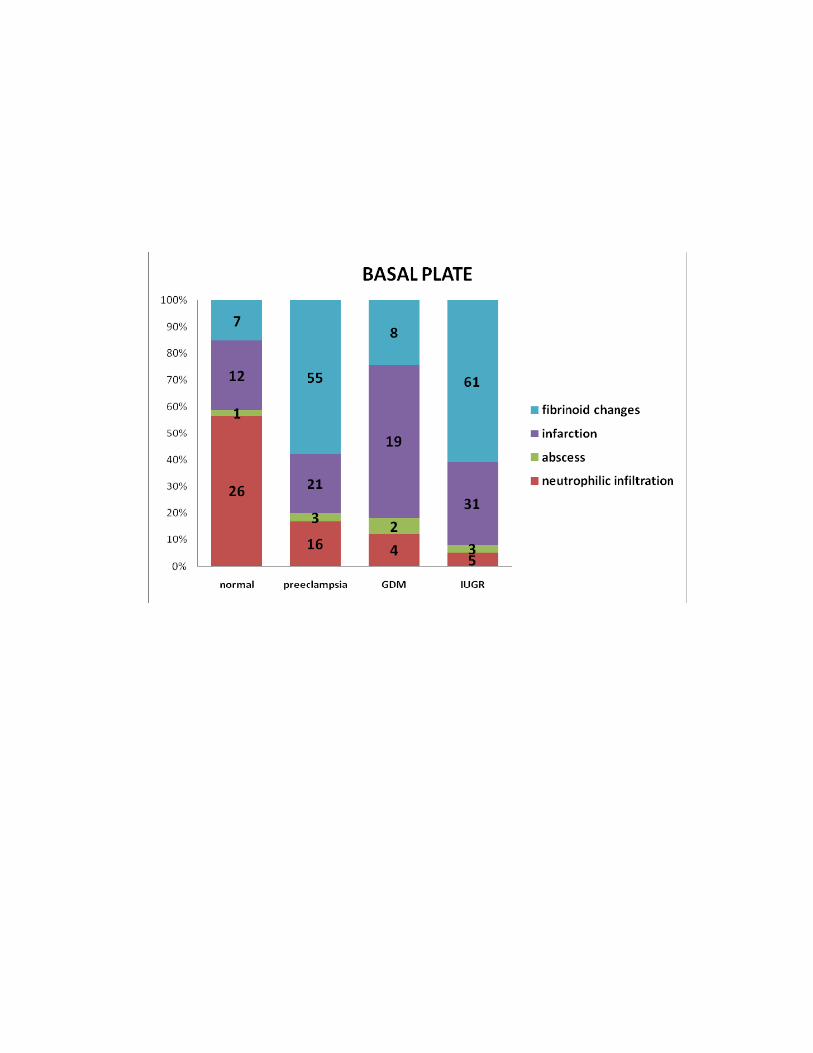
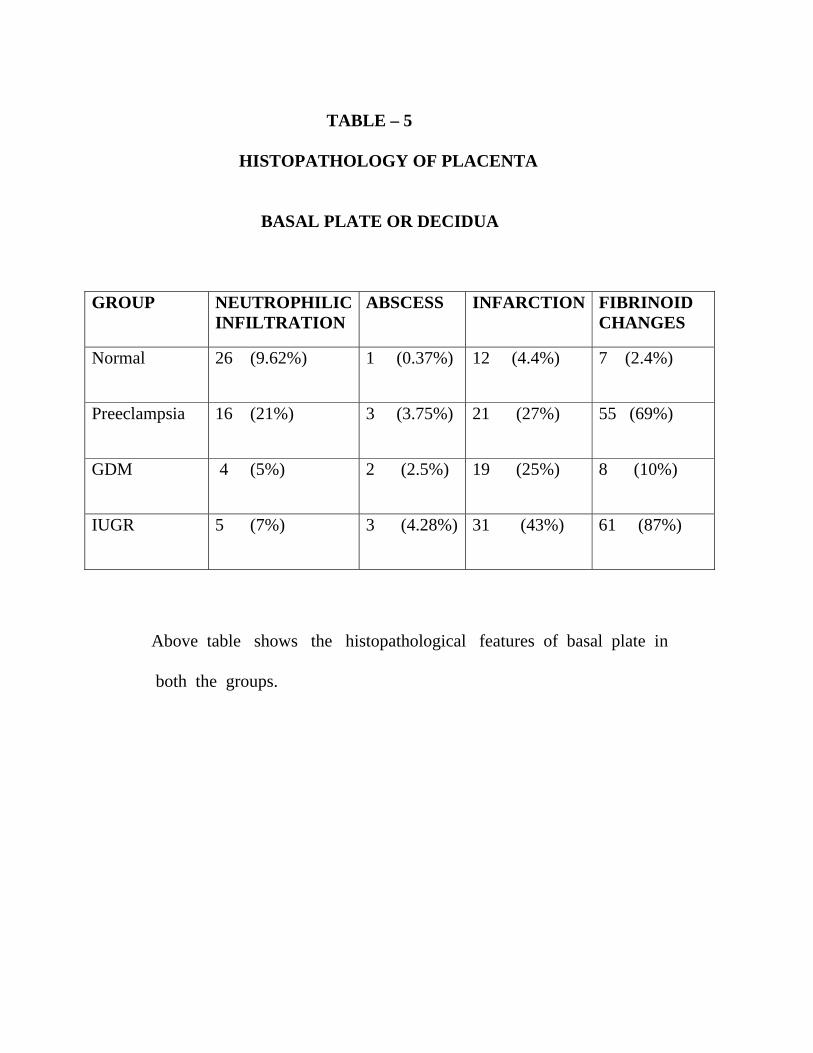
TABLE – 5 HISTOPATHOLOGY OF PLACENTA BASAL PLATE OR DECIDUA
GROUP
NEUTROPHILICINFILTRATION
ABSCESS INFARCTION FIBRINOID CHANGES
Normal 26 (9.62%)
1 (0.37%) 12 (4.4%) 7 (2.4%)
Preeclampsia
16 (21%) 3 (3.75%) 21 (27%) 55 (69%)
GDM 4 (5%)
2 (2.5%) 19 (25%) 8 (10%)
IUGR 5 (7%) 3 (4.28%)
31 (43%) 61 (87%)
Above table shows the histopathological features of basal plate in both the groups.
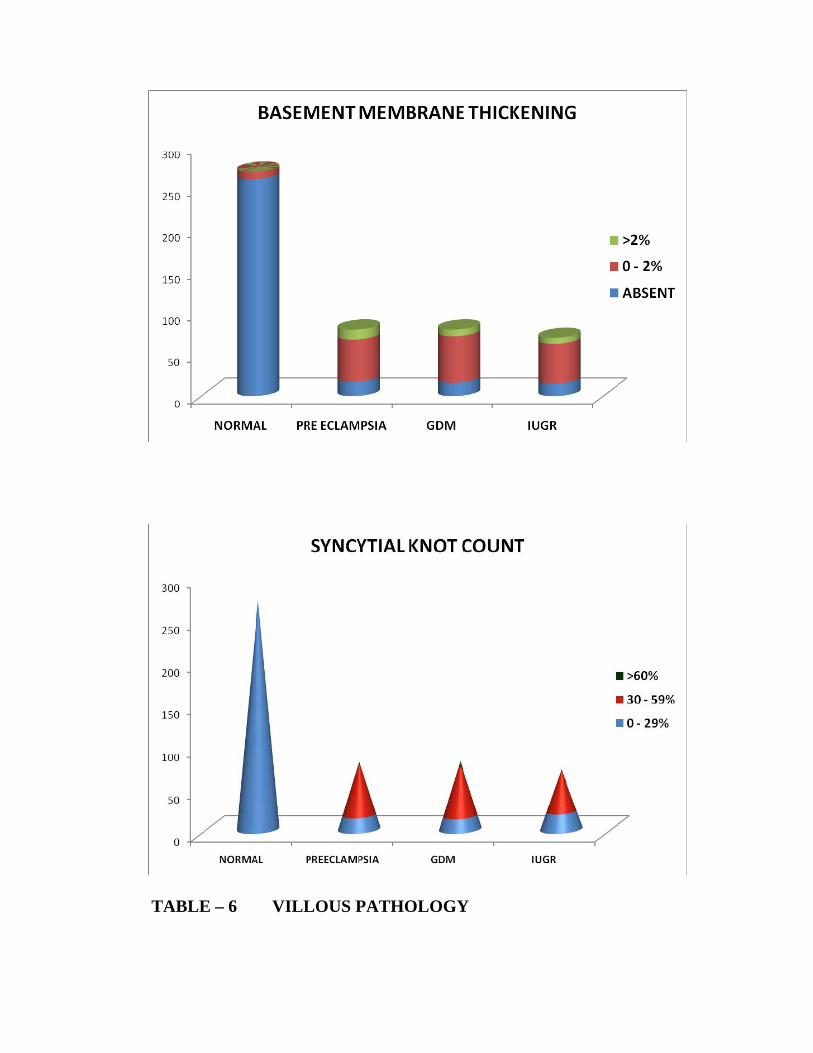
TABLE – 6 VILLOUS PATHOLOGY
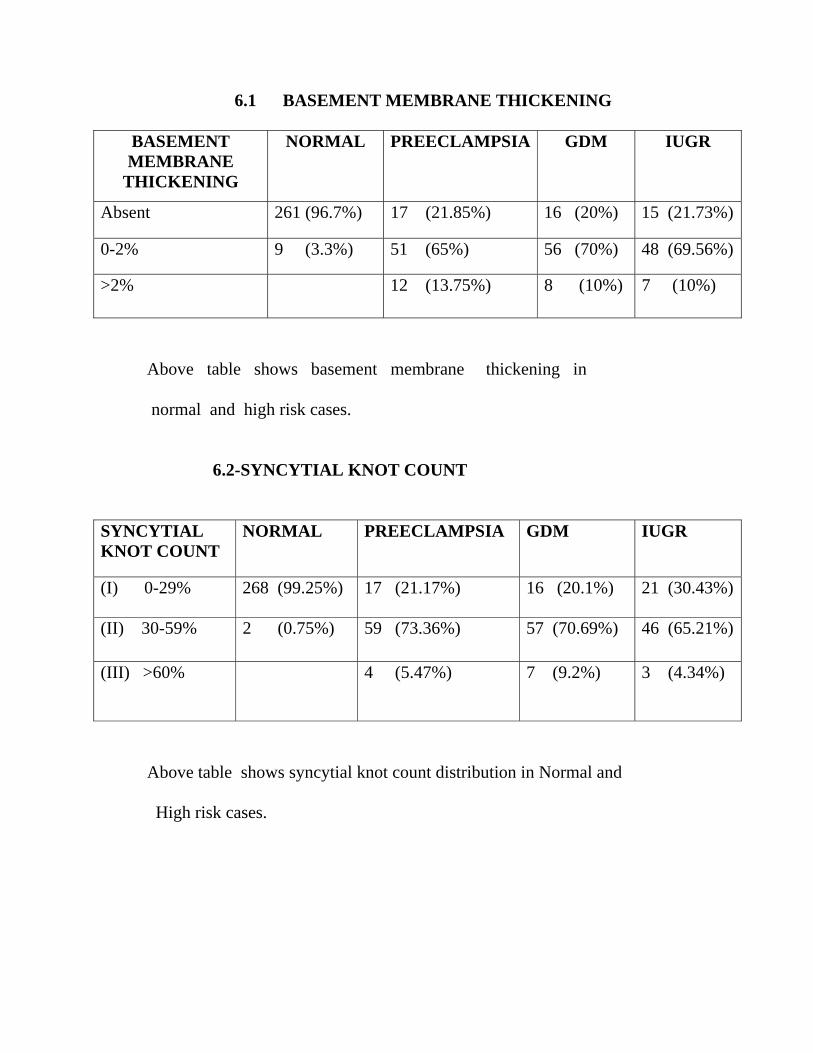
6.1 BASEMENT MEMBRANE THICKENING
BASEMENT MEMBRANE
THICKENING
NORMAL PREECLAMPSIA GDM IUGR
Absent 261 (96.7%) 17 (21.85%) 16 (20%) 15 (21.73%)
0-2% 9 (3.3%) 51 (65%) 56 (70%) 48 (69.56%)
>2% 12 (13.75%) 8 (10%) 7 (10%)
Above table shows basement membrane thickening in normal and high risk cases. 6.2-SYNCYTIAL KNOT COUNT
SYNCYTIAL KNOT COUNT
NORMAL PREECLAMPSIA GDM IUGR
(I) 0-29% 268 (99.25%) 17 (21.17%) 16 (20.1%) 21 (30.43%)
(II) 30-59% 2 (0.75%) 59 (73.36%) 57 (70.69%) 46 (65.21%)
(III) >60%
4 (5.47%) 7 (9.2%) 3 (4.34%)
Above table shows syncytial knot count distribution in Normal and
High risk cases.
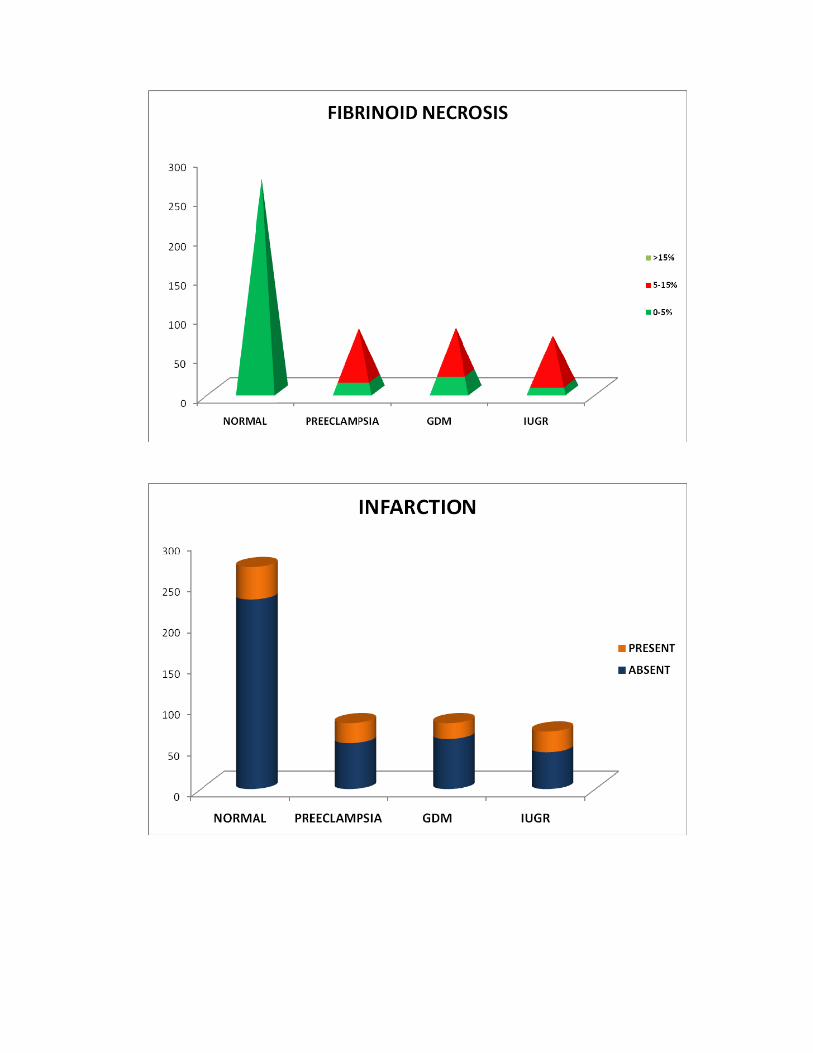
6.3-FIBRINOID NECROSIS
FIBRINOID NECROSIS
NORMAL PREECLAMPSIA GDM IUGR
I) 0-5% 267 (99.2%) 15 (19.73%) 22 (28%) 9 (12.85%)
(II) 5-15% 3 (0.8%) 63 (79.6%) 57 (71%) 60(85.71%)
(III) >15%
2 (065%) 1 (1.2%) 3 (1.4%)
Above table shows fibrinoid necrosis distribution in normal and
high risk cases. 6.4-INFARCTION
INFARCTION
NORMAL PREECLAMPSIA GDM IUGR
Absent 231 (85.6%) 56 (70%) 61 (76.25%) 45 (64.28%)
Present 39 (14.4%) 24 (30%) 19 (23.75%) 25 (35.72%)
Above table shows presence and absence of Infarction in normal
and high risk cases.
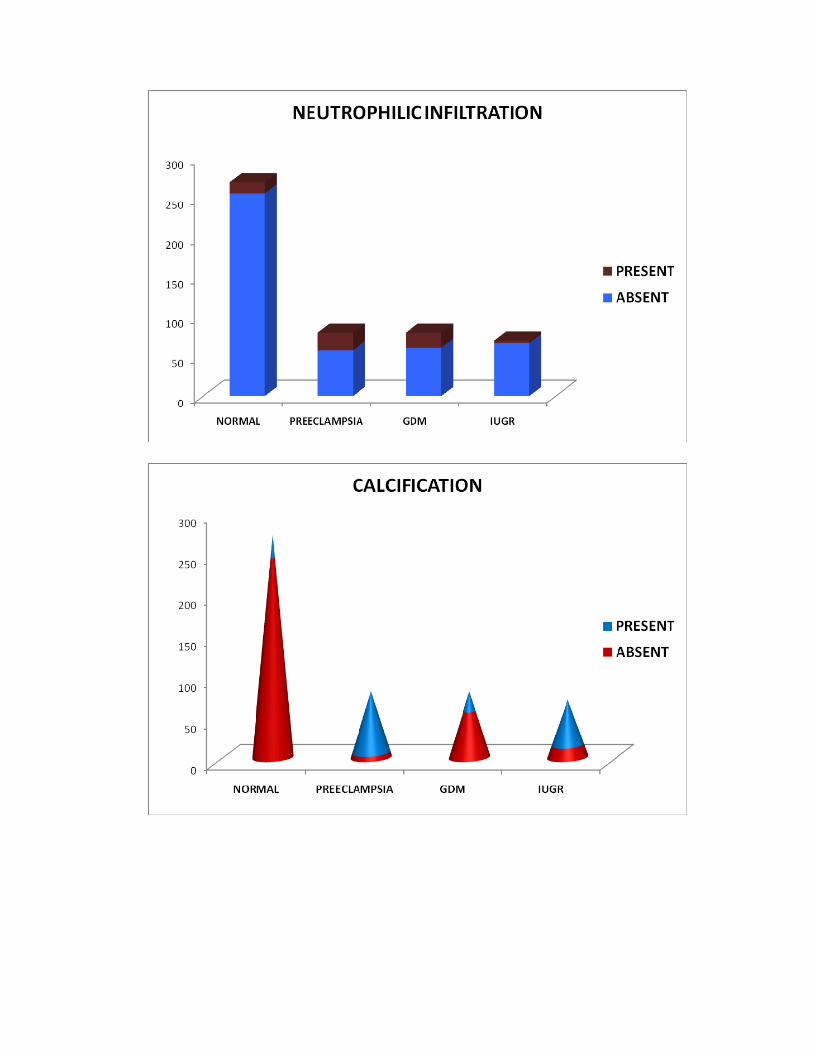
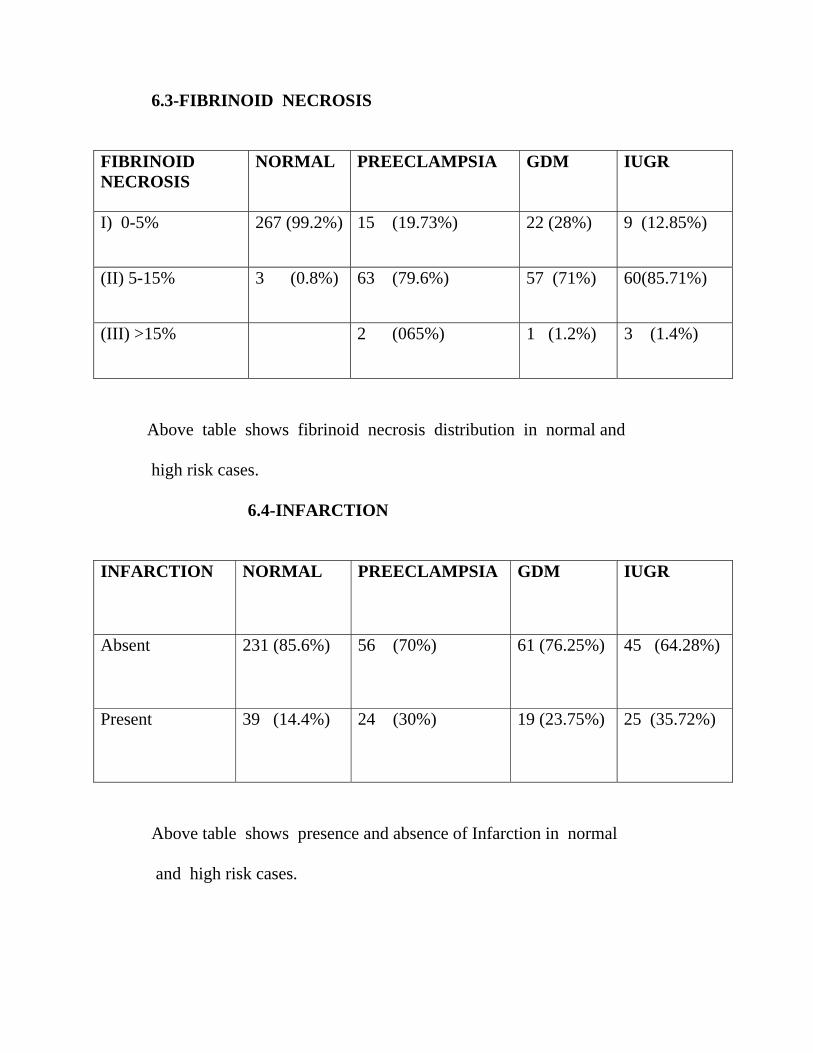
6.5-NEUTROPHILIC INFILTRATION
NEUTROPHILIC INFILTRATION
NORMAL PREECLAMPSIA GDM IUGR
Absent 256 (85.6%) 58 (73.25%) 61 (76.25%) 67 (95.71%)
Present 14 (14.4%) 22 (26.75%) 19 (23.75%) 3 (4.29%)
Above table shows the presence and absence of neutrophilic infiltraton in normal and high risk group. 6.6 -CALCIFICATION
CALCIFICATION
NORMAL PREECLAMPSIA GDM IUGR
Absent 242 (89.8%) 6 (7.23%) 56 (70%) 15 (21.44%)
Present 28 (10.2%) 74 (92.76%) 24 (30%) 55 (78.56%)
Above table shows the presence and absence of calcification in normal and high risk group.
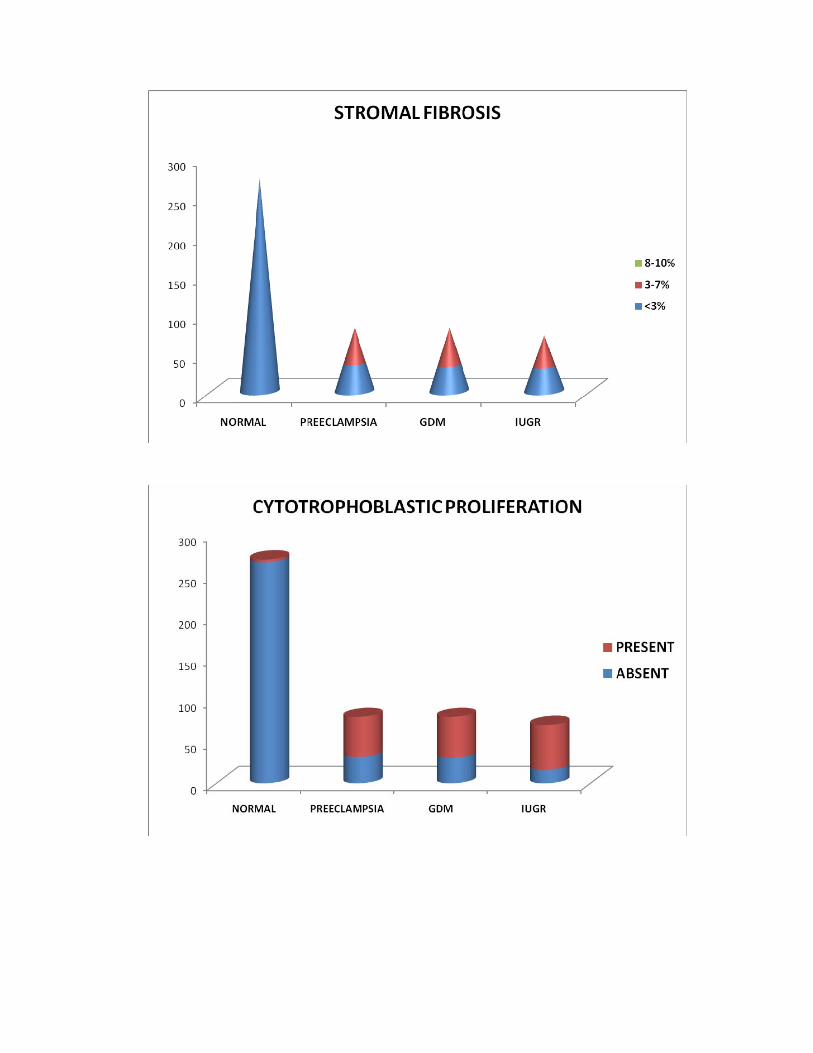
6.7-STROMAL FIBROSIS
STROMAL FIBROSIS
NORMAL PREECLAMPSIA GDM IUGR
I) <3% 268 (99.25%) 35 (43.75%) 33(41.25%) 31 (43.48%)
(II) 3-7% GR I 2 (0.75%) 43 (53.94%) 47(58.75%) 39 (56.52%)
(III) 8-10 GRII
2 (2.5%)
Above table shows stromal fibrosis pattern in normal and
high risk cases. 6.8-CYTOTROPHOBLASTIC PROLIFERATION
CYTOTROPHOBLASTIC PROLIFERATION
NORMAL PREECLAMPSIA GDM IUGR
Absent 267(98.8%) 32 (40.78%) 31(38.75%) 16(21.73%)
Present 3 (1.2%) 48 (59.22%) 49(61.25%) 54(78.26%)
Above table shows presence and absence of cytotrophoblastic proliferation in normal and high risk groups.
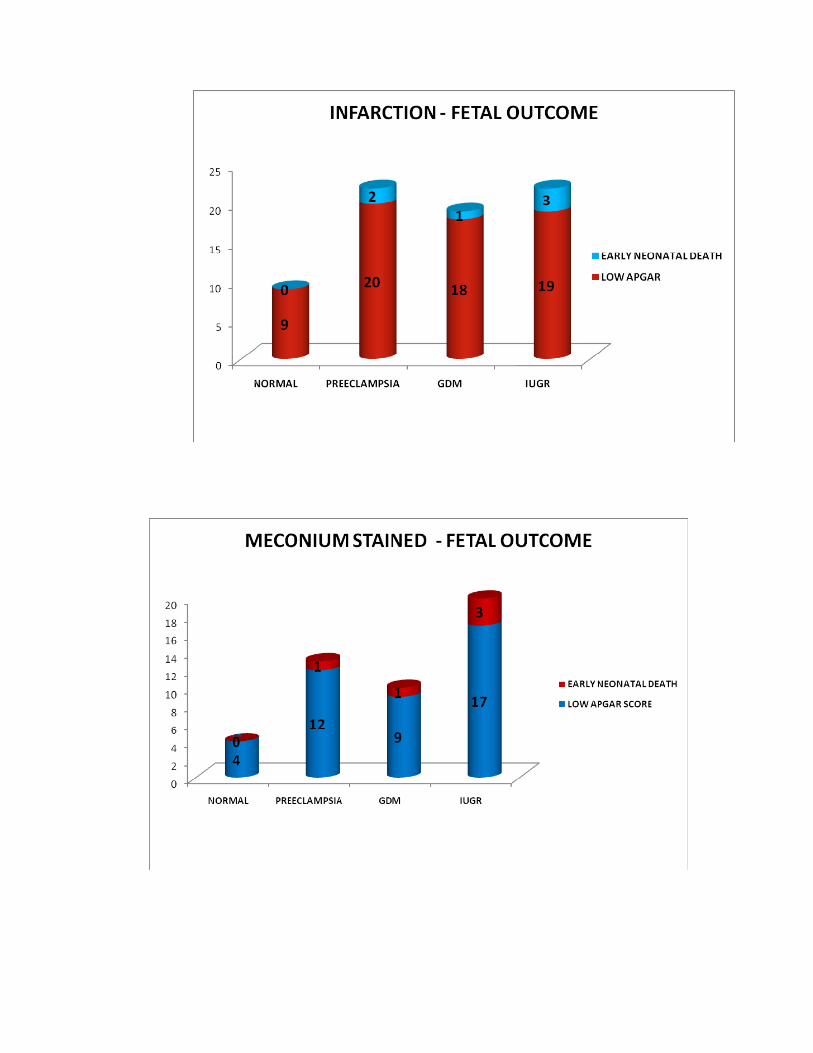
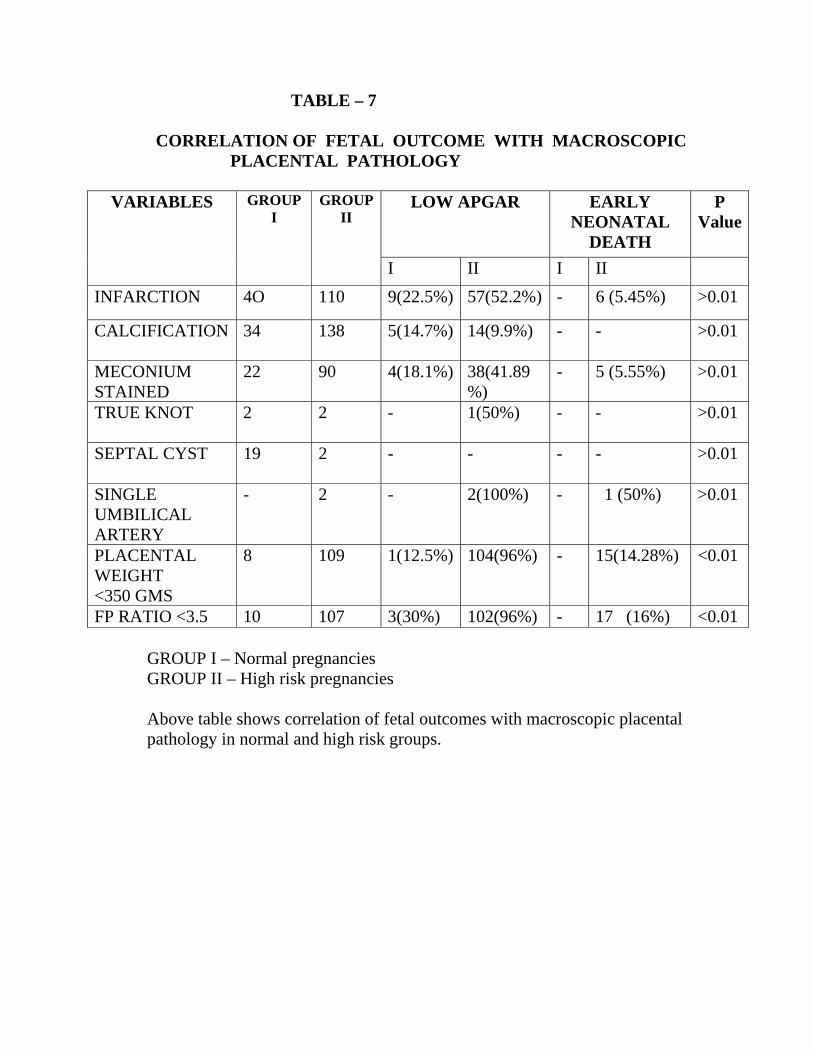
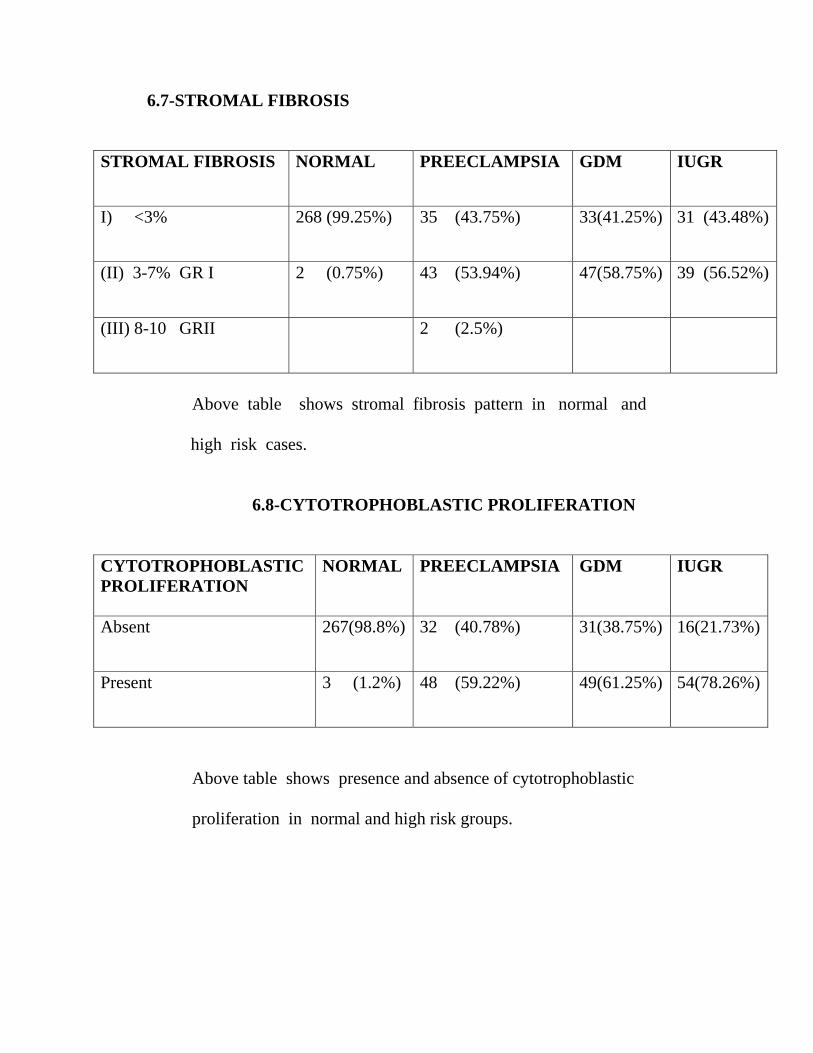
TABLE – 7 CORRELATION OF FETAL OUTCOME WITH MACROSCOPIC PLACENTAL PATHOLOGY
VARIABLES GROUP
I GROUP
II LOW APGAR EARLY
NEONATAL DEATH
P Value
I II I II INFARCTION 4O 110 9(22.5%) 57(52.2%) - 6 (5.45%) >0.01
CALCIFICATION 34 138 5(14.7%) 14(9.9%) - -
>0.01
MECONIUM STAINED
22 90 4(18.1%) 38(41.89%)
- 5 (5.55%)
>0.01
TRUE KNOT 2 2 - 1(50%) - -
>0.01
SEPTAL CYST 19 2 - - - -
>0.01
SINGLE UMBILICAL ARTERY
- 2 - 2(100%) - 1 (50%)
>0.01
PLACENTAL WEIGHT <350 GMS
8 109 1(12.5%) 104(96%) - 15(14.28%) <0.01
FP RATIO <3.5 10 107 3(30%) 102(96%) - 17 (16%) <0.01 GROUP I – Normal pregnancies GROUP II – High risk pregnancies Above table shows correlation of fetal outcomes with macroscopic placental pathology in normal and high risk groups.
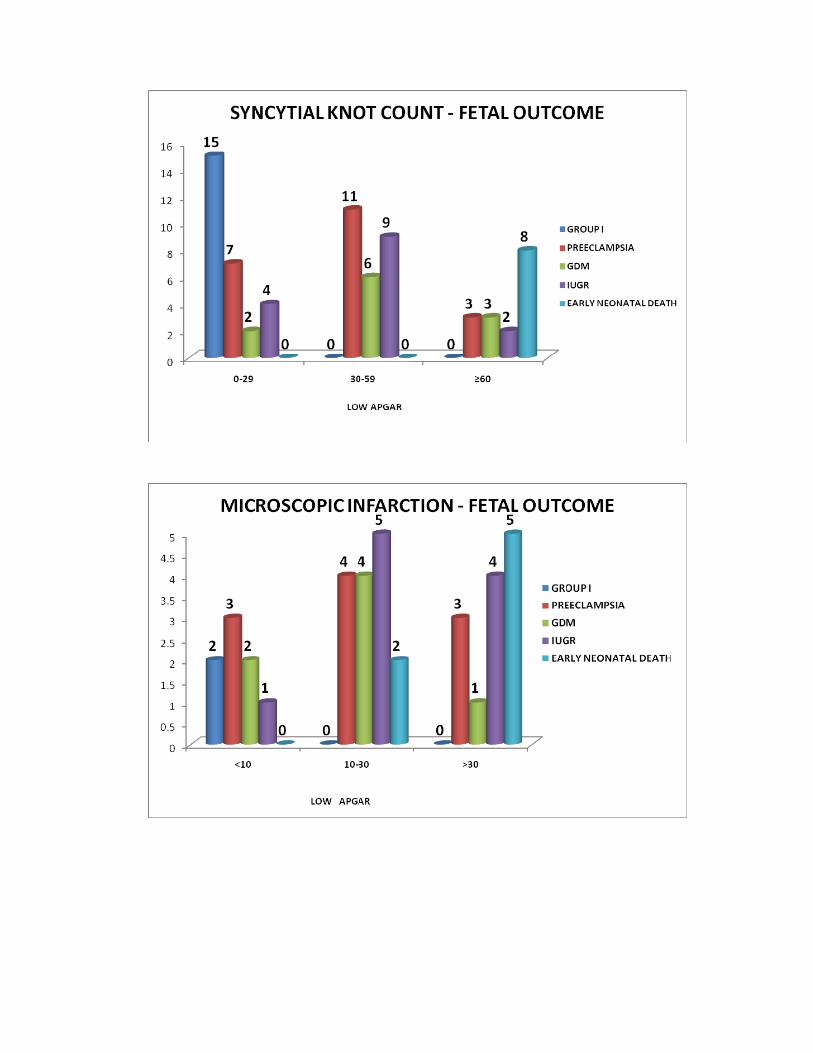
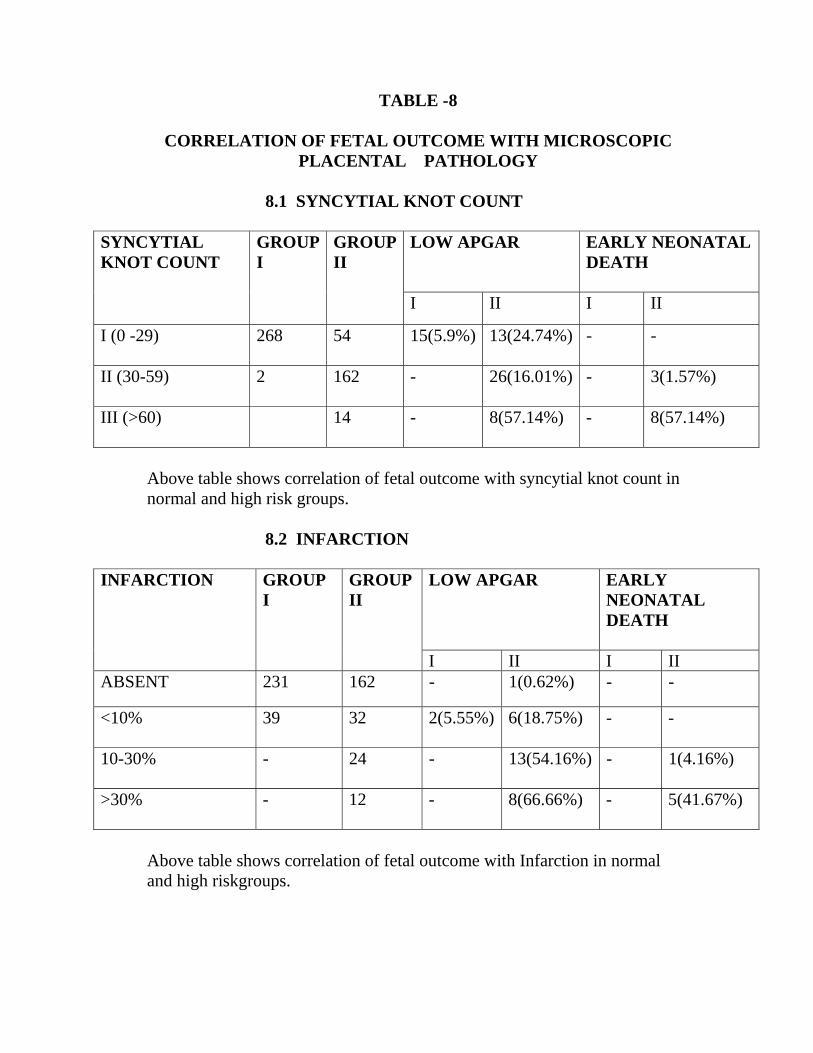
TABLE -8
CORRELATION OF FETAL OUTCOME WITH MICROSCOPIC PLACENTAL PATHOLOGY
8.1 SYNCYTIAL KNOT COUNT
SYNCYTIAL KNOT COUNT
GROUP I
GROUP II
LOW APGAR
EARLY NEONATAL DEATH
I II I II
I (0 -29) 268
54 15(5.9%) 13(24.74%) - -
II (30-59) 2
162 - 26(16.01%) - 3(1.57%)
III (>60)
14 - 8(57.14%) - 8(57.14%)
Above table shows correlation of fetal outcome with syncytial knot count in normal and high risk groups. 8.2 INFARCTION
INFARCTION
GROUP I
GROUP II
LOW APGAR
EARLY NEONATAL DEATH
I II I II ABSENT 231 162 - 1(0.62%) - -
<10% 39 32
2(5.55%) 6(18.75%) - -
10-30% - 24 - 13(54.16%) - 1(4.16%)
>30% - 12
- 8(66.66%) - 5(41.67%)
Above table shows correlation of fetal outcome with Infarction in normal and high riskgroups.
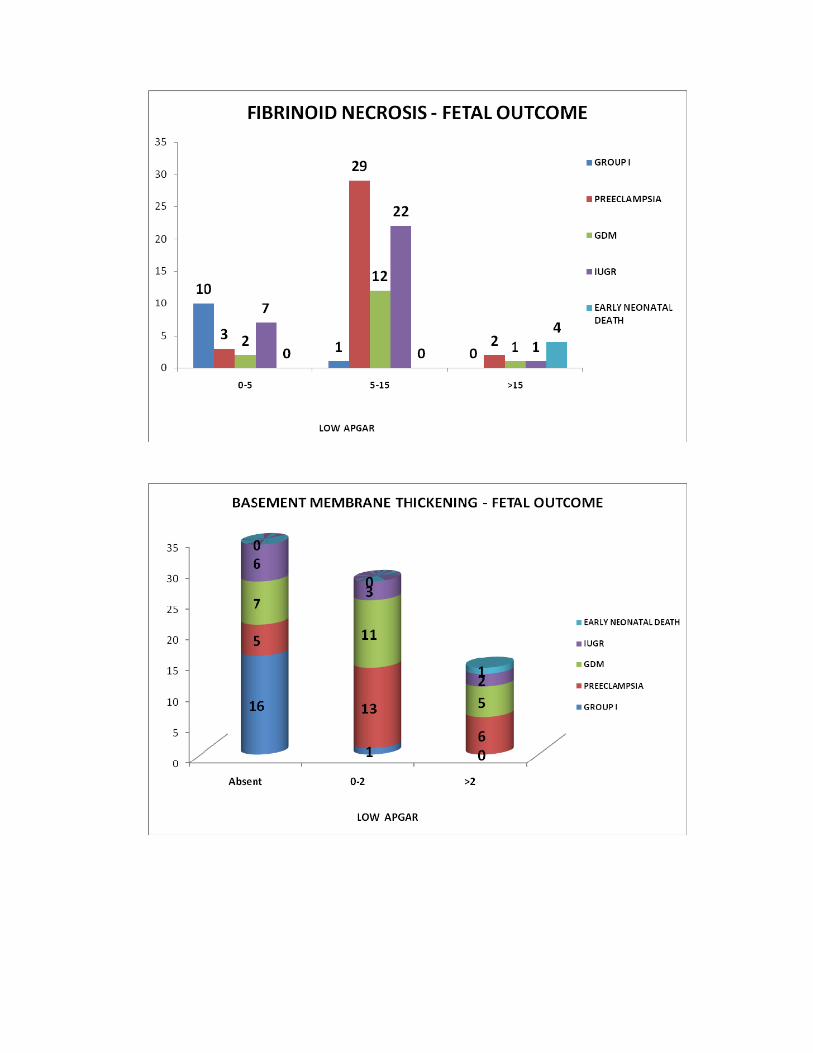
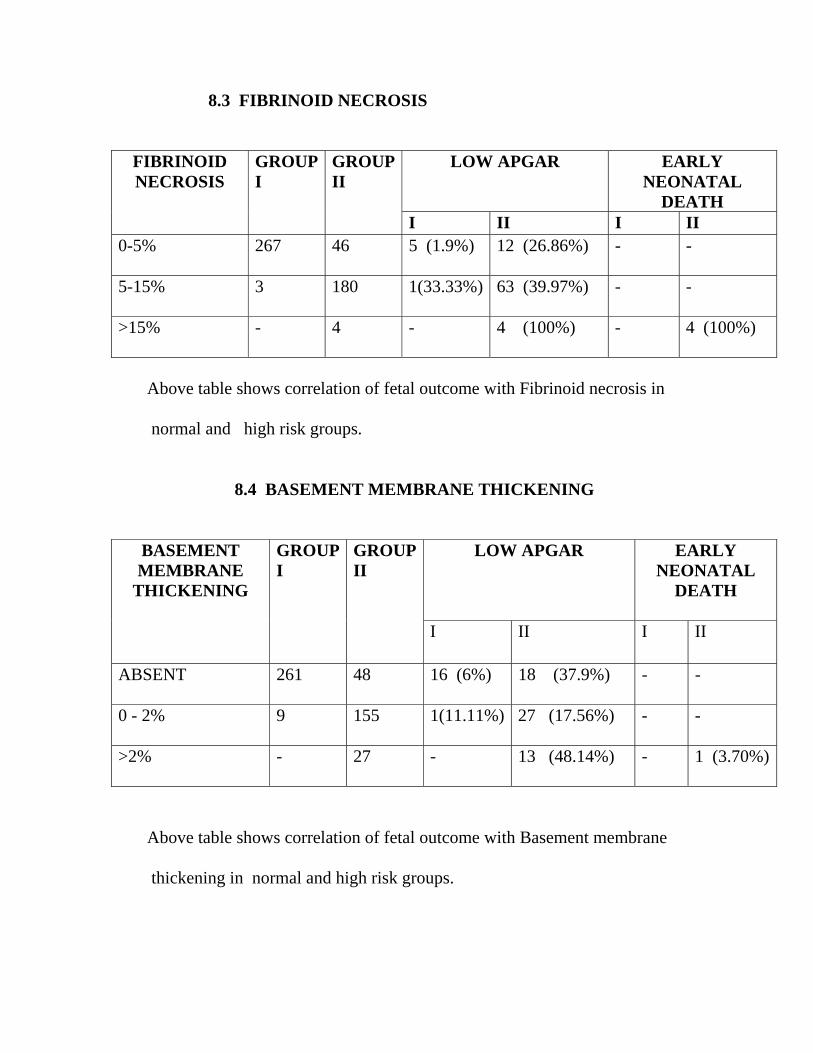
8.3 FIBRINOID NECROSIS
FIBRINOID NECROSIS
GROUP I
GROUP II
LOW APGAR
EARLY NEONATAL
DEATH I II I II
0-5% 267
46 5 (1.9%) 12 (26.86%) - -
5-15% 3
180 1(33.33%) 63 (39.97%) - -
>15% -
4 - 4 (100%) - 4 (100%)
Above table shows correlation of fetal outcome with Fibrinoid necrosis in normal and high risk groups. 8.4 BASEMENT MEMBRANE THICKENING
BASEMENT MEMBRANE
THICKENING
GROUP I
GROUP II
LOW APGAR EARLY NEONATAL
DEATH
I II I II
ABSENT 261
48 16 (6%) 18 (37.9%) - -
0 - 2% 9
155 1(11.11%) 27 (17.56%) - -
>2% -
27 - 13 (48.14%) - 1 (3.70%)
Above table shows correlation of fetal outcome with Basement membrane thickening in normal and high risk groups.
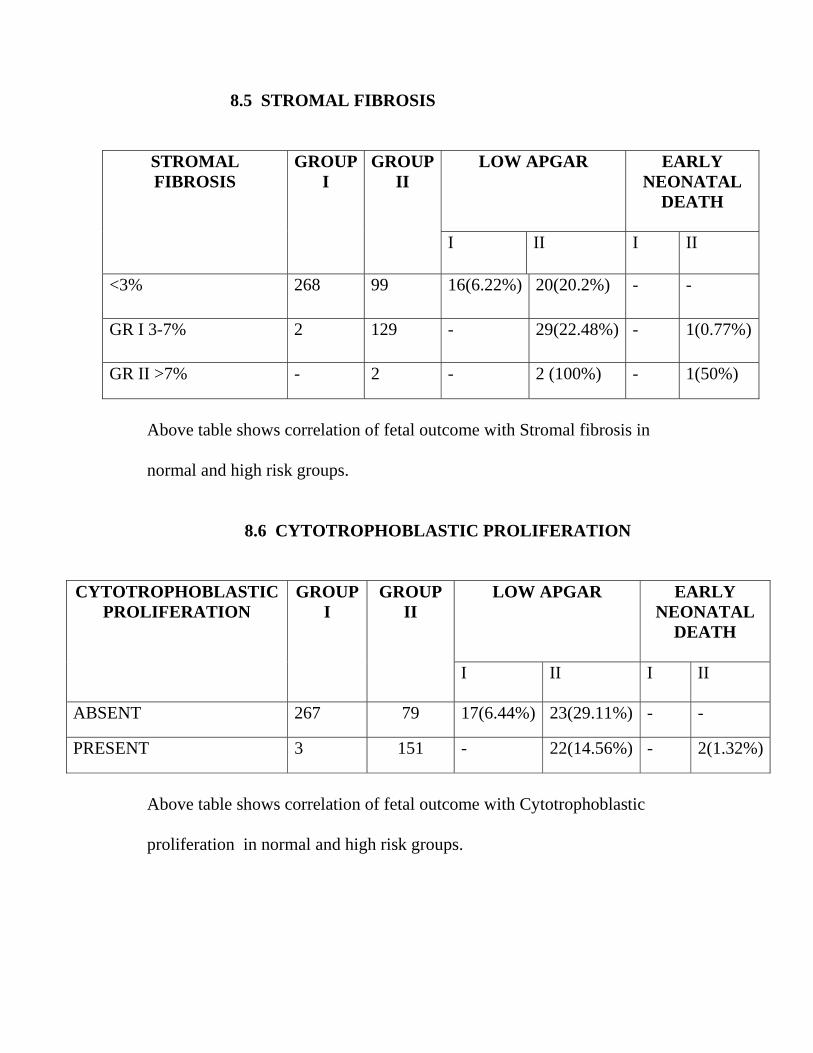
8.5 STROMAL FIBROSIS STROMAL FIBROSIS
GROUP I
GROUP II
LOW APGAR
EARLY NEONATAL
DEATH
I II I II
<3% 268 99 16(6.22%) 20(20.2%) - -
GR I 3-7% 2 129 - 29(22.48%) - 1(0.77%)
GR II >7% - 2 - 2 (100%) - 1(50%)
Above table shows correlation of fetal outcome with Stromal fibrosis in normal and high risk groups. 8.6 CYTOTROPHOBLASTIC PROLIFERATION
CYTOTROPHOBLASTIC PROLIFERATION
GROUP I
GROUP II
LOW APGAR
EARLY NEONATAL
DEATH
I II I II
ABSENT 267 79 17(6.44%) 23(29.11%) - -
PRESENT 3 151 - 22(14.56%) - 2(1.32%)
Above table shows correlation of fetal outcome with Cytotrophoblastic proliferation in normal and high risk groups.
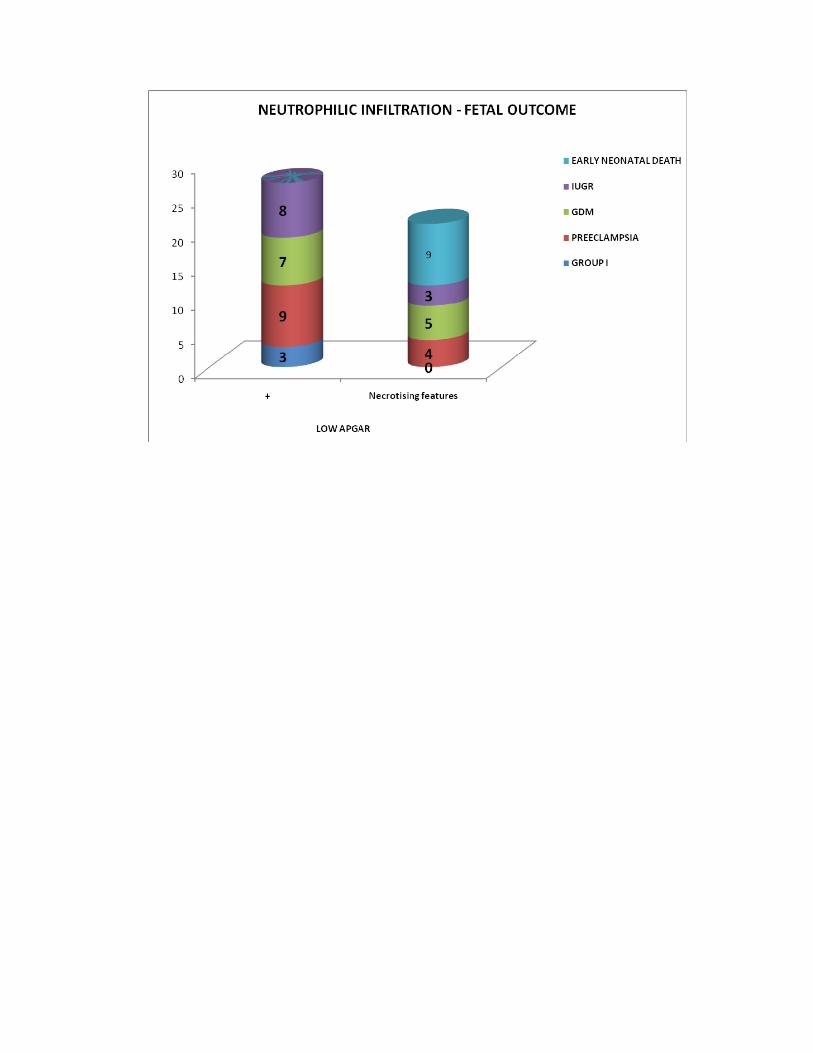
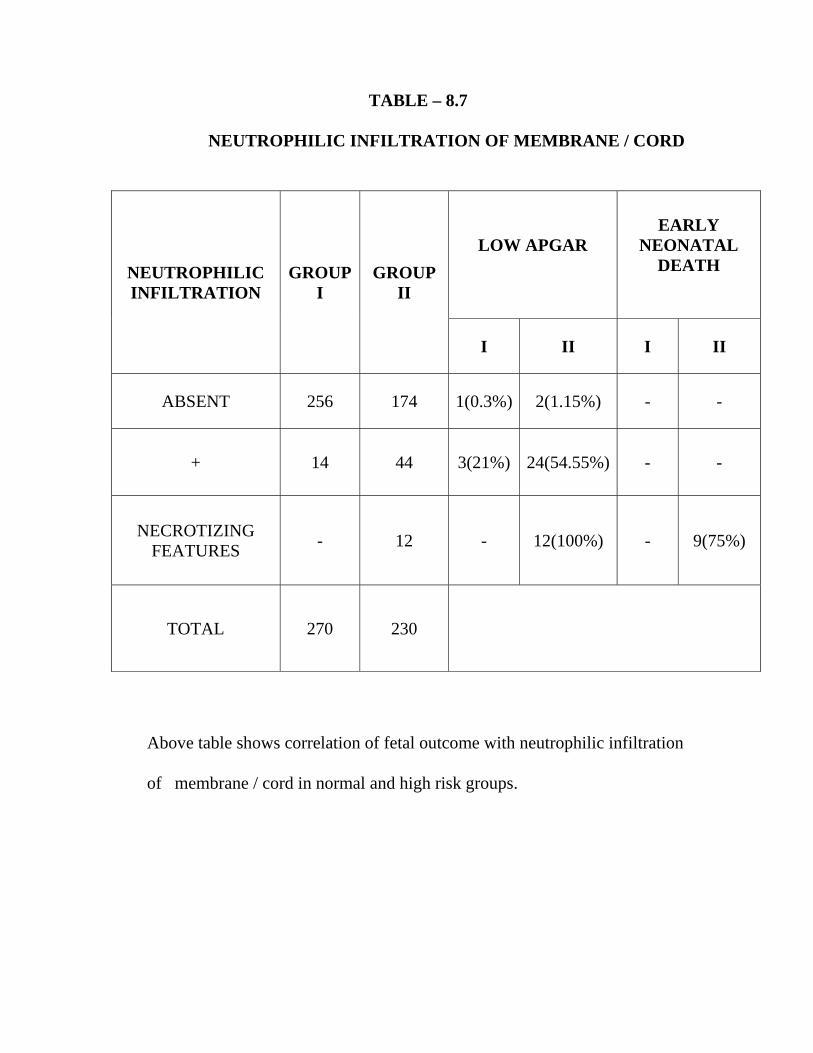
TABLE – 8.7 NEUTROPHILIC INFILTRATION OF MEMBRANE / CORD
NEUTROPHILIC INFILTRATION
GROUP I
GROUP II
LOW APGAR
EARLY NEONATAL
DEATH
I II I II
ABSENT 256 174 1(0.3%) 2(1.15%) - -
+ 14 44 3(21%) 24(54.55%) - -
NECROTIZING FEATURES - 12 - 12(100%) - 9(75%)
TOTAL 270 230
Above table shows correlation of fetal outcome with neutrophilic infiltration
of membrane / cord in normal and high risk groups.
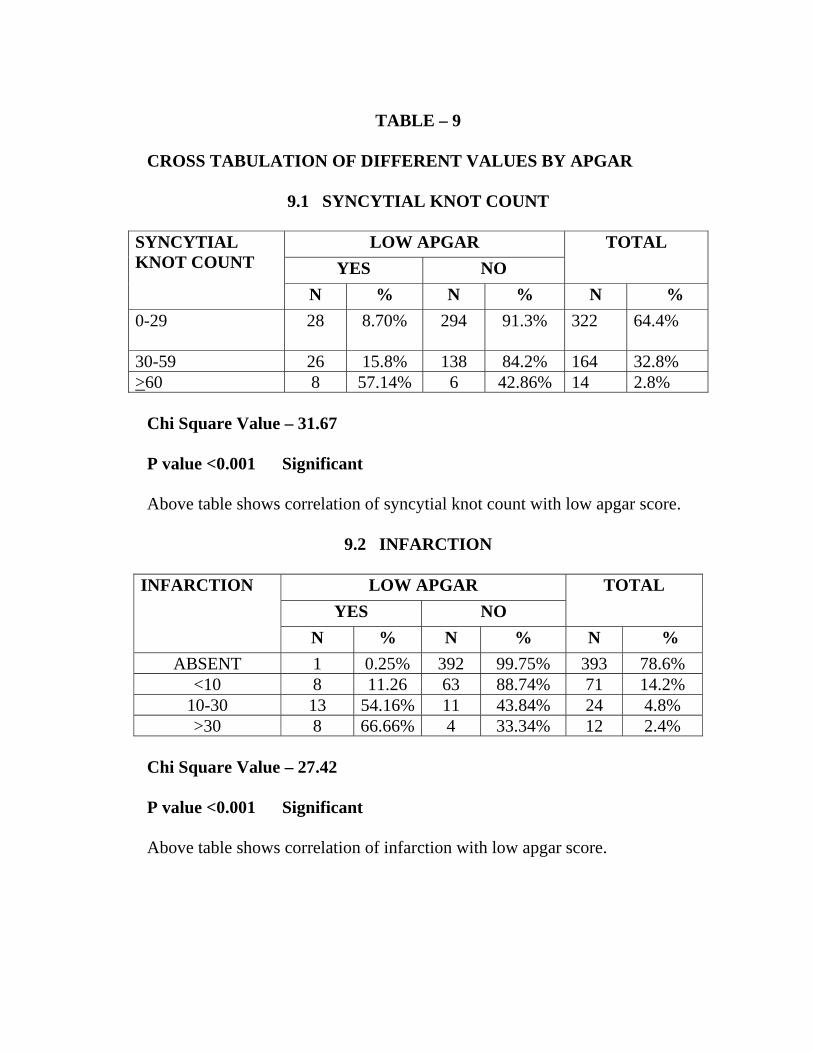
TABLE – 9
CROSS TABULATION OF DIFFERENT VALUES BY APGAR
9.1 SYNCYTIAL KNOT COUNT
SYNCYTIAL KNOT COUNT
LOW APGAR TOTAL YES NO
N % N % N % 0-29
28 8.70% 294 91.3% 322 64.4%
30-59 26 15.8% 138 84.2% 164 32.8% >60 8 57.14% 6 42.86% 14 2.8%
Chi Square Value – 31.67 P value <0.001 Significant Above table shows correlation of syncytial knot count with low apgar score.
9.2 INFARCTION
INFARCTION LOW APGAR TOTAL YES NO
N % N % N % ABSENT 1 0.25% 392 99.75% 393 78.6%
<10 8 11.26 63 88.74% 71 14.2% 10-30 13 54.16% 11 43.84% 24 4.8%>30 8 66.66% 4 33.34% 12 2.4%
Chi Square Value – 27.42
P value <0.001 Significant Above table shows correlation of infarction with low apgar score.
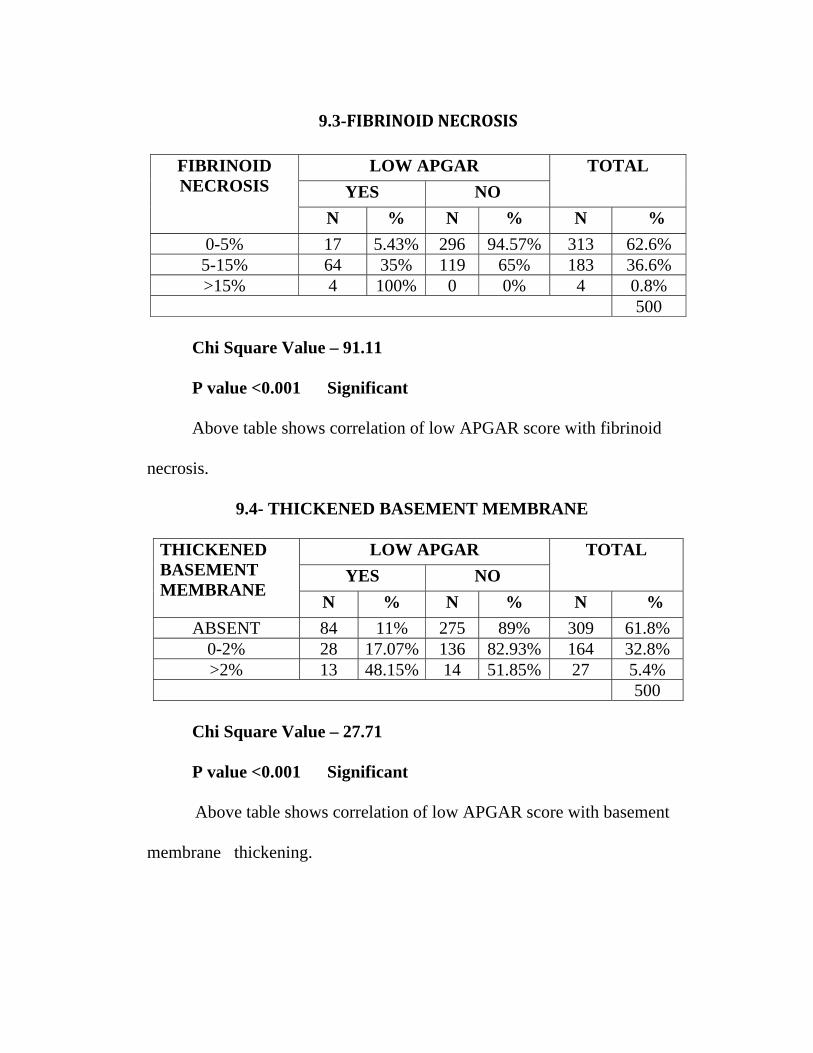
9.3-FIBRINOID NECROSIS
FIBRINOID NECROSIS
LOW APGAR TOTAL YES NO
N % N % N % 0-5% 17 5.43% 296 94.57% 313 62.6% 5-15% 64 35% 119 65% 183 36.6% >15% 4 100% 0 0% 4 0.8%
500 Chi Square Value – 91.11 P value <0.001 Significant
Above table shows correlation of low APGAR score with fibrinoid necrosis.
9.4- THICKENED BASEMENT MEMBRANE
THICKENED BASEMENT MEMBRANE
LOW APGAR TOTAL YES NO
N % N % N % ABSENT 84 11% 275 89% 309 61.8%
0-2% 28 17.07% 136 82.93% 164 32.8% >2% 13 48.15% 14 51.85% 27 5.4%
500 Chi Square Value – 27.71 P value <0.001 Significant
Above table shows correlation of low APGAR score with basement membrane thickening.
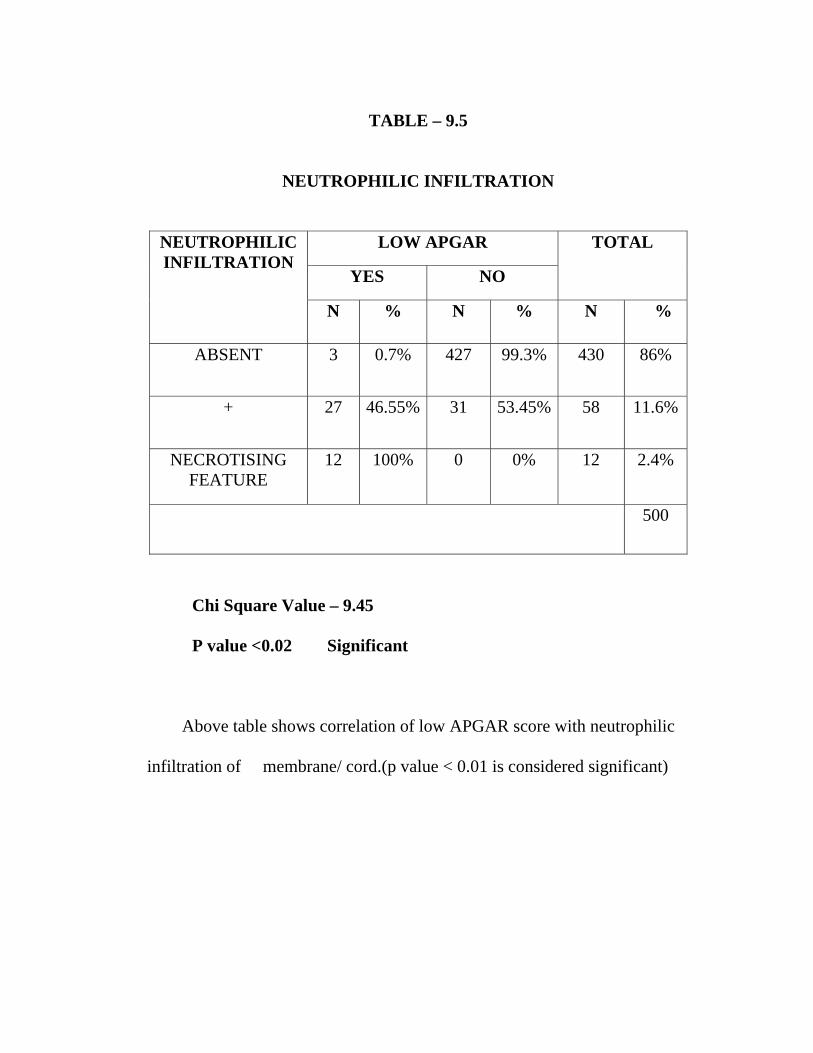
TABLE – 9.5
NEUTROPHILIC INFILTRATION
NEUTROPHILIC INFILTRATION
LOW APGAR TOTAL
YES NO
N % N % N %
ABSENT 3 0.7% 427 99.3% 430 86%
+ 27 46.55% 31 53.45% 58 11.6%
NECROTISING FEATURE
12 100% 0 0% 12 2.4%
500
Chi Square Value – 9.45 P value <0.02 Significant
Above table shows correlation of low APGAR score with neutrophilic infiltration of membrane/ cord.(p value < 0.01 is considered significant)
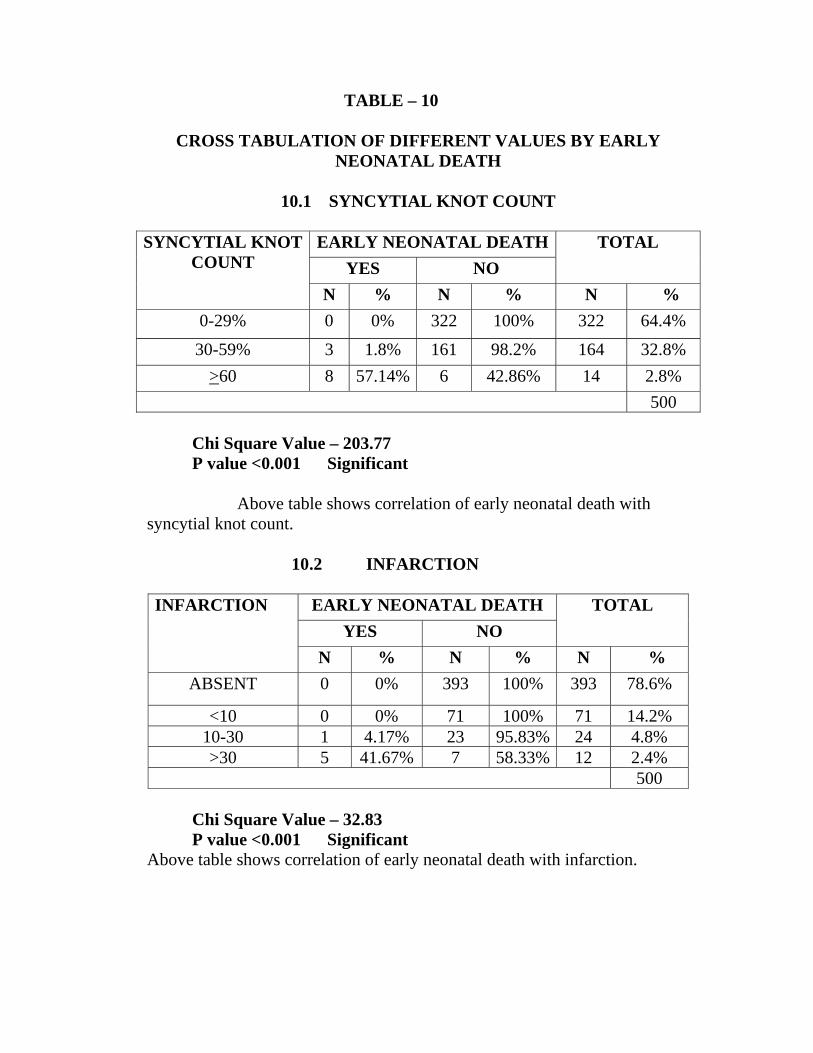
TABLE – 10
CROSS TABULATION OF DIFFERENT VALUES BY EARLY NEONATAL DEATH
10.1 SYNCYTIAL KNOT COUNT
SYNCYTIAL KNOT
COUNT EARLY NEONATAL DEATH TOTAL
YES NO N % N % N %
0-29% 0 0% 322 100% 322 64.4%
30-59% 3 1.8% 161 98.2% 164 32.8% >60 8 57.14% 6 42.86% 14 2.8%
500 Chi Square Value – 203.77 P value <0.001 Significant
Above table shows correlation of early neonatal death with syncytial knot count.
10.2 INFARCTION INFARCTION
EARLY NEONATAL DEATH TOTAL
YES NO N % N % N %
ABSENT 0 0% 393 100% 393 78.6%
<10 0 0% 71 100% 71 14.2% 10-30 1 4.17% 23 95.83% 24 4.8% >30 5 41.67% 7 58.33% 12 2.4%
500
Chi Square Value – 32.83 P value <0.001 Significant
Above table shows correlation of early neonatal death with infarction.
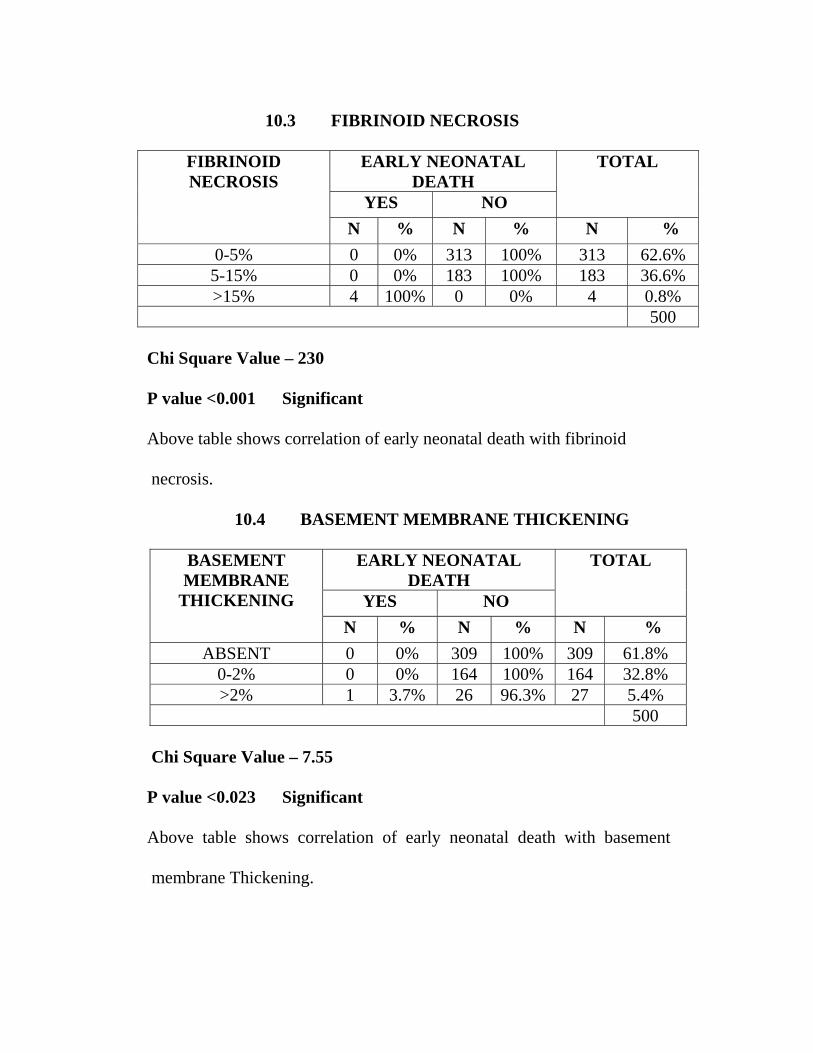
10.3 FIBRINOID NECROSIS
FIBRINOID NECROSIS
EARLY NEONATAL DEATH
TOTAL
YES NO N % N % N %
0-5% 0 0% 313 100% 313 62.6% 5-15% 0 0% 183 100% 183 36.6% >15% 4 100% 0 0% 4 0.8%
500 Chi Square Value – 230
P value <0.001 Significant Above table shows correlation of early neonatal death with fibrinoid necrosis. 10.4 BASEMENT MEMBRANE THICKENING
BASEMENT MEMBRANE
THICKENING
EARLY NEONATAL DEATH
TOTAL
YES NO N % N % N %
ABSENT 0 0% 309 100% 309 61.8% 0-2% 0 0% 164 100% 164 32.8% >2% 1 3.7% 26 96.3% 27 5.4%
500
Chi Square Value – 7.55
P value <0.023 Significant Above table shows correlation of early neonatal death with basement membrane Thickening.
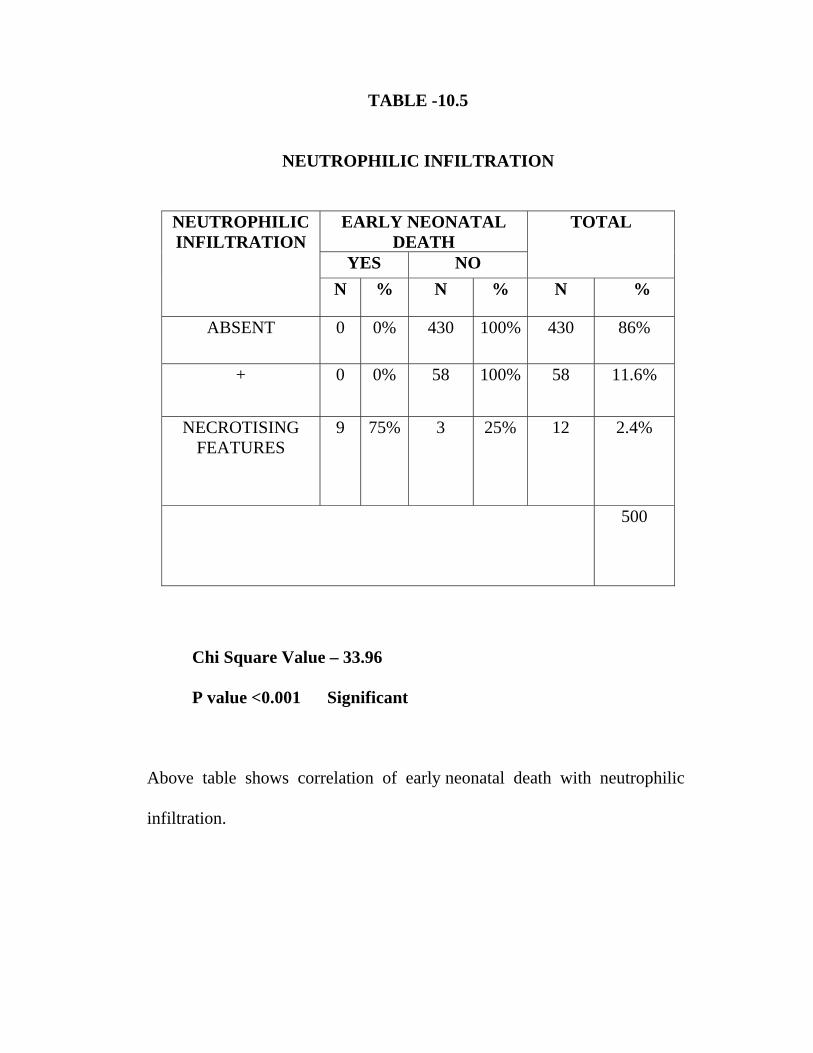
TABLE -10.5
NEUTROPHILIC INFILTRATION
NEUTROPHILIC INFILTRATION
EARLY NEONATAL DEATH
TOTAL
YES NO N % N % N %
ABSENT 0 0% 430 100% 430 86%
+ 0 0% 58 100% 58 11.6%
NECROTISING FEATURES
9 75% 3 25% 12 2.4%
500
Chi Square Value – 33.96 P value <0.001 Significant
Above table shows correlation of early neonatal death with neutrophilic infiltration.
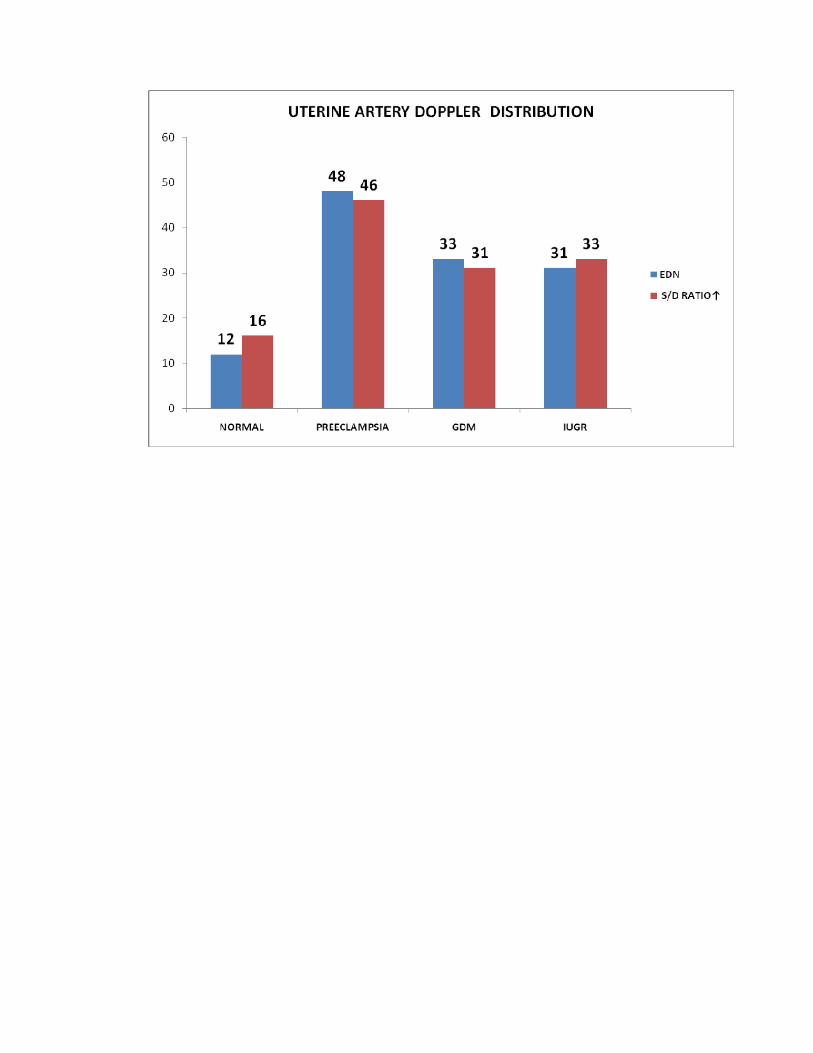
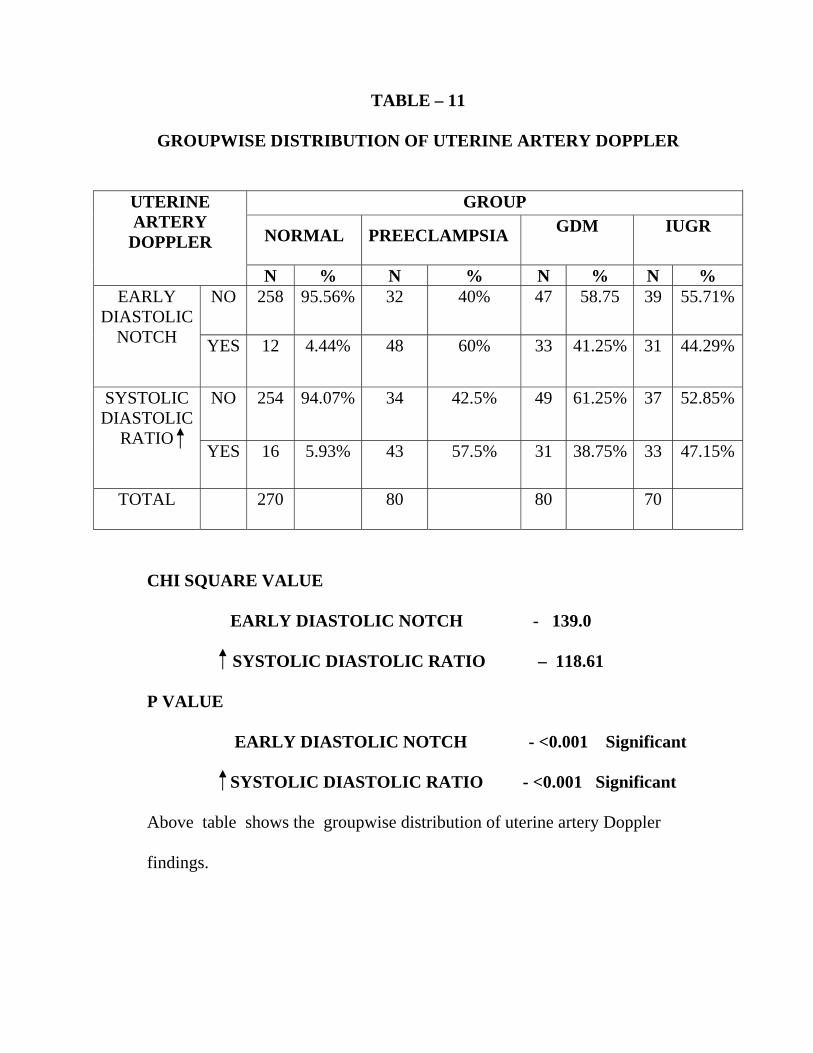
TABLE – 11
GROUPWISE DISTRIBUTION OF UTERINE ARTERY DOPPLER
UTERINE ARTERY
DOPPLER
GROUP
NORMAL PREECLAMPSIA GDM IUGR
N % N % N % N % EARLY
DIASTOLIC NOTCH
NO 258 95.56% 32 40% 47 58.75 39 55.71%
YES 12 4.44% 48 60% 33 41.25% 31 44.29%
SYSTOLIC DIASTOLIC
RATIO
NO 254
94.07% 34 42.5% 49 61.25% 37 52.85%
YES 16 5.93% 43 57.5% 31 38.75% 33 47.15%
TOTAL 270
80 80 70
CHI SQUARE VALUE EARLY DIASTOLIC NOTCH - 139.0
SYSTOLIC DIASTOLIC RATIO – 118.61
P VALUE EARLY DIASTOLIC NOTCH - <0.001 Significant SYSTOLIC DIASTOLIC RATIO - <0.001 Significant Above table shows the groupwise distribution of uterine artery Doppler
findings.
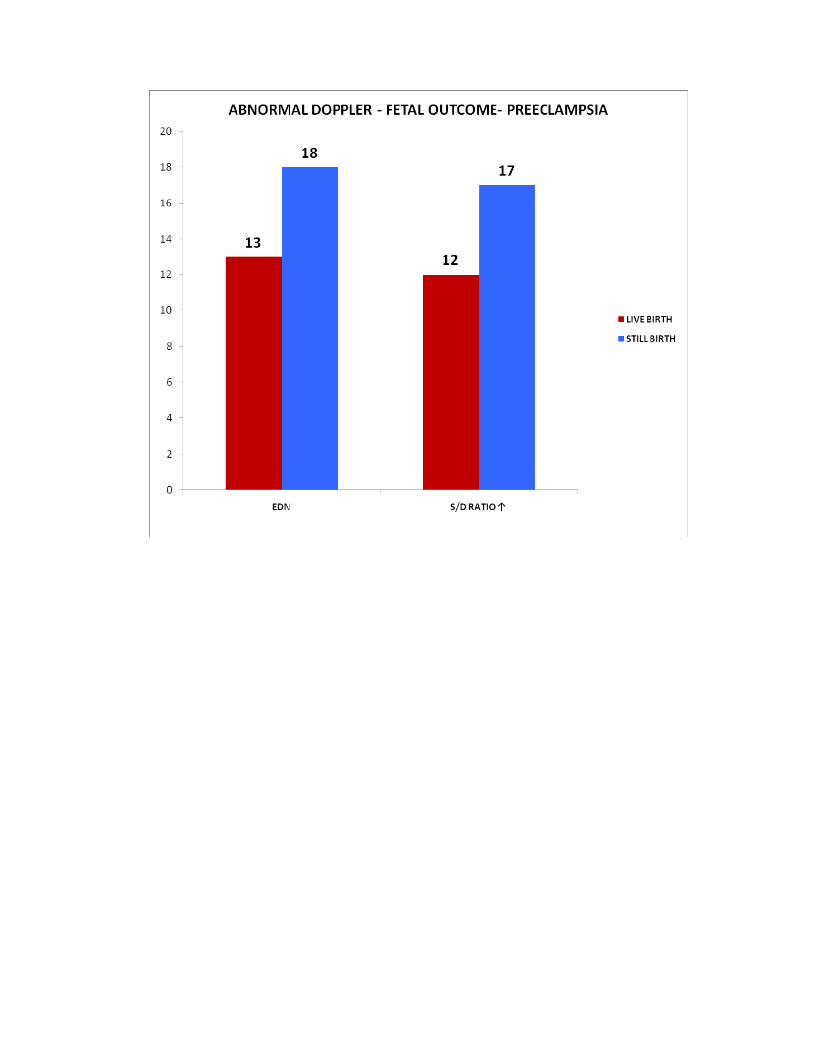
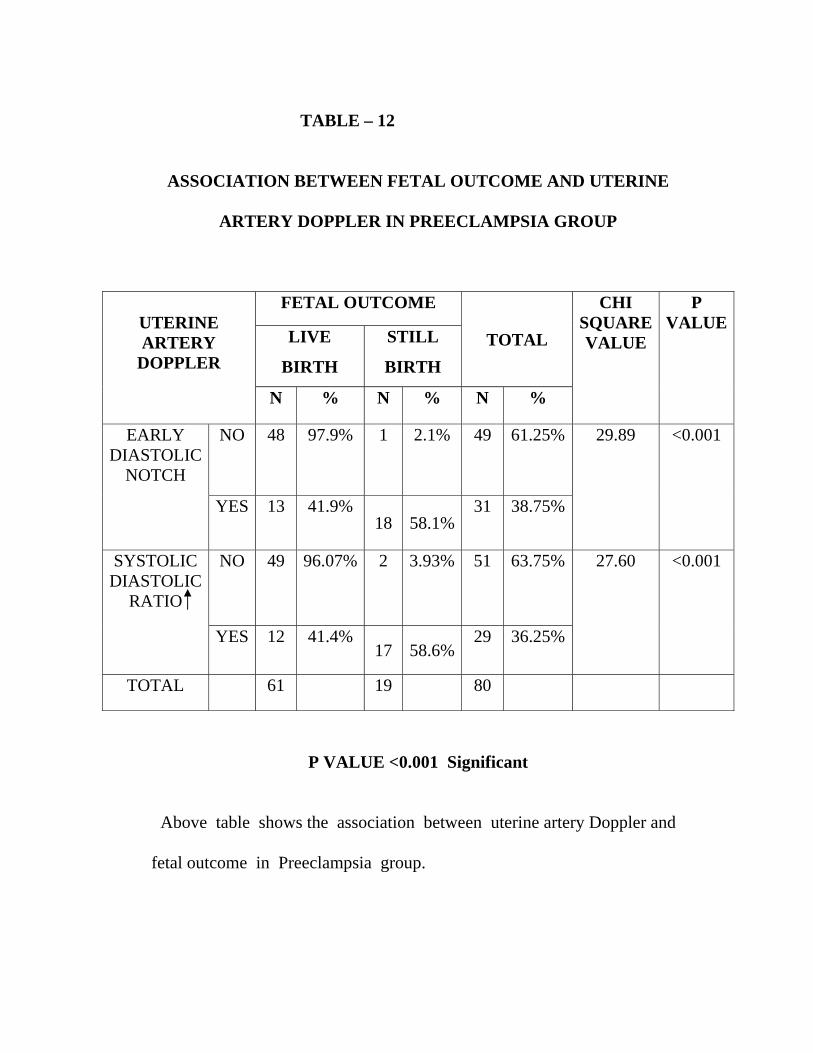
TABLE – 12
ASSOCIATION BETWEEN FETAL OUTCOME AND UTERINE
ARTERY DOPPLER IN PREECLAMPSIA GROUP
UTERINE ARTERY
DOPPLER
FETAL OUTCOME
TOTAL
CHI SQUARE VALUE
P VALUE
LIVE
BIRTH
STILL
BIRTH
N % N % N %
EARLY DIASTOLIC
NOTCH
NO 48 97.9% 1 2.1% 49 61.25% 29.89 <0.001
YES 13 41.9% 18 58.1%
31 38.75%
SYSTOLIC DIASTOLIC
RATIO
NO 49
96.07% 2 3.93% 51 63.75% 27.60 <0.001
YES 12 41.4% 17 58.6%
29 36.25%
TOTAL 61 19 80
P VALUE <0.001 Significant
Above table shows the association between uterine artery Doppler and
fetal outcome in Preeclampsia group.
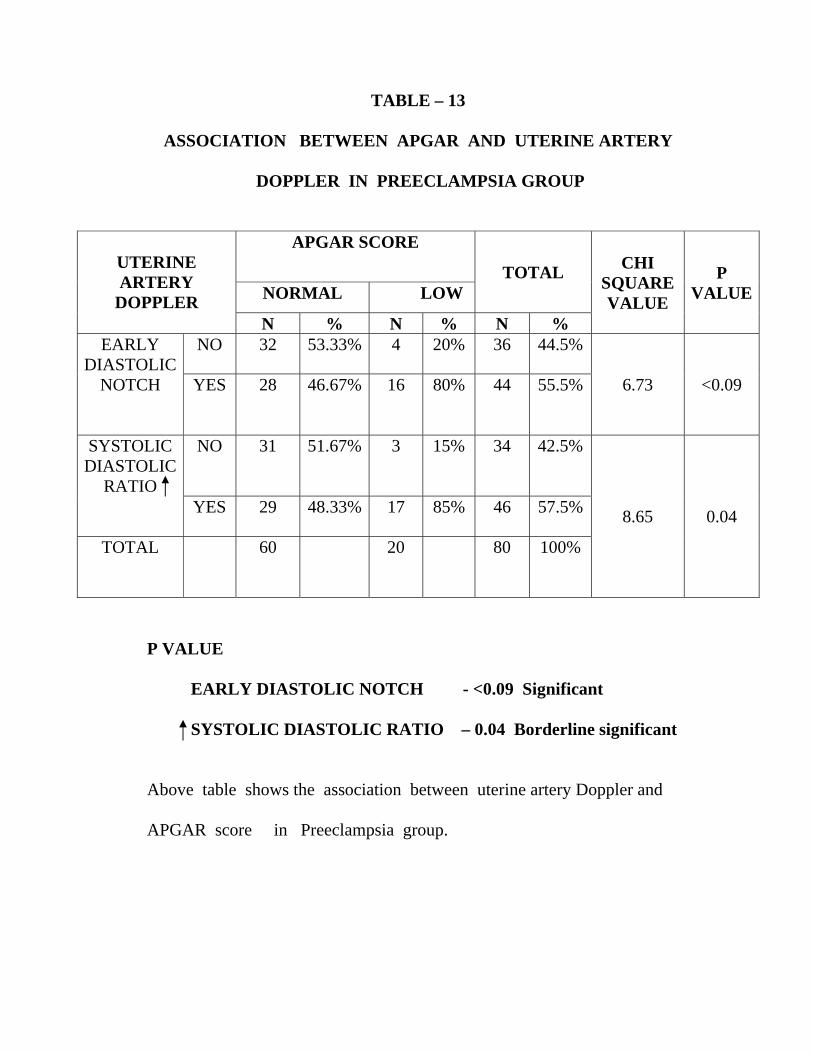
TABLE – 13
ASSOCIATION BETWEEN APGAR AND UTERINE ARTERY
DOPPLER IN PREECLAMPSIA GROUP
UTERINE ARTERY
DOPPLER
APGAR SCORE TOTAL CHI
SQUARE VALUE
P VALUENORMAL LOW
N % N % N % EARLY
DIASTOLIC NOTCH
NO 32 53.33% 4 20% 36 44.5%
6.73 <0.09 YES 28 46.67% 16 80% 44 55.5%
SYSTOLIC DIASTOLIC
RATIO
NO 31
51.67% 3 15% 34 42.5%
8.65 0.04 YES 29 48.33% 17 85% 46 57.5%
TOTAL 60
20 80 100%
P VALUE EARLY DIASTOLIC NOTCH - <0.09 Significant SYSTOLIC DIASTOLIC RATIO – 0.04 Borderline significant Above table shows the association between uterine artery Doppler and APGAR score in Preeclampsia group.

DISCUSSION
DISCUSSION
Obstetric endorsement of the utility of placental histologic
examination is commonly lukewarm, especially from obstetricians who do
not have a placental pathologist as part of their own local clinical care
team.Placental pathologic examinations are pointless if they donot provide
clinically useful data.
One important limitation of placental examination is the inability to
make a one to one link between any one placental or uteroplacental vascular
lesion and a particular maternal or fetal, neonatal problem. This would be an
unrealistic goal, because in no other organs are such relationship the rule.
Neither hepatocellular necrosis nor glomerulosclerosis for example, is
diagnostic of one and only one hepatic or renal disease; in those diseases
individual lesions are considered as part of a greater histopathologic pattern.
Finally the pattern is correlated with a variety of clinical data, laboratory
data, and additional pathologic studies to produce the final clinical
pathologic diagnosis.
Obstetric technologies and therapies are also directed towards general
pathophysiologic process (such as uterine and uteroplacental Doppler
velocimetry, anticoagulant therapy and maternal immunization and
intravenous gamma globulin) rather than specific lesions or tissue diagnoses.
Table-1 shows distribution of cases in our study. Out of 500 cases, 270
cases were term uncomplicated pregnancies. Remaining 230 cases were
pregnancies complicated by various disorders.(80-preeclampsia,80-
GDM,70-IUGR).
Table-2 shows the distribution for age in both groups. Age ranged
between 21-35 yrs in both group of patients. Most of the patients fall
between 26-29yrs. 62.6% in normal group and 54.78% in high risk group.
Table-3 shows gross features of placenta in both groups. The placenta
of group II was associated with low placental weight and low fetal placental
ratios. In the clinicopathological study by NAEYE (1987) low placental
weight was associated with maternal uteroplacental vascular insufficiency.
In our study, five cases of GDM had placental weight of 600gms, and
one case of GDM had placental weight of 700gms, which showed extensive
villous edema on histopathological examination. In our study,
abnormalities of maternal and fetal surface of placenta, and cord insertion is
given below:
Battledore placenta - nine cases
Velamentous insertion of cord - 11 cases
Circumvallate placenta - four cases
Bilobed placenta - three cases
Cord Length
The average cord length was within normal limits in both
groups.
Cord attachment
In normal group, cord attachment was central in 48.14%,
paracentral in 46.29% and marginal in 5.5%. In high risk group the same
being 52.17%,, 43.47%, 4.3% respectively.
In our study, there was no adverse perinatal outcome in fetuses
with marginal cord insertion. Rashmi and Rangekhar (1993) quotes 72%
incidence of paracentral cord attachment in normal singleton fetuses.
Infarction
Table-4, shows the macroscopic abnormalities in both normal and
high risk groups. In our study, placental infarcts are seen in 14.8% of normal
placenta, 57.5% of preeclampsia, 43.75% of GDM, 41.42% of IUGR.
In normal pregnancy,infarct size was <2cm. In high risk cases,
the size was 2.5-3.5cm. The size was >5cm in 13 cases. (five cases of
preeclampsia, three cases of GDM, five cases of IUGR) and were placed
centrally.
25% of term uncomplicated pregnancies were associated with infarcts
in placenta and usually situated in periphery and involve <5% of placental
area. Fox 1979 states that extensive infarction involving 10% or more of
parenchyma is accompanied by a high incidence of fetal hypoxia, growth
retardation and intrauterine death.
Calcification
Seen in 12.6% of normal term pregnancies, 63.75% of preeclampsia
cases, 55% of GDM, 61.42% of IUGR.
There is no association between fetal hypoxia, low birth weight or
IUD and calcification of placenta according to TINDAL SCOTTIS (1966)
in their study of placenta of 3026 singleton pregnancies.
Meconium Stained Membranes
Occurred in 47.14% of IUGR, 43.75% of preeclampsia, 22% of GDM,
and only in 8% of normal pregnancies. Altshuler, G.Scott reported
meconium staining in 27% consecutively related placenta from at risk
singleton newborn.
True knot
Noted only in two cases of normal, one case of preeclampsia, one
case of IUGR. True knots incidence varies 0.4-1% of all deliveries. Knots in
the cord are associated with perinatal mortality of 8-11% according to Fox
(1979).
Single umbilical artery
Was noted in two cases of GDM. One baby had cardiac anomaly –
Transposition of great vessels. Another baby had duodenal atresia.
Septal cyst
In our study septal cyst was noted in 19 cases of normal placenta and
one case of GDM, one case of IUGR. Fox (1978) observed that septal cysts
are seen in 7-11% of term uncomplicated pregnancies.
Table -5 shows the histopathological features of basal plate or
decidua.
Neutrophilic infiltration
Neutrophilic infiltration is seen in 9.62% of normal placenta, 21% of
preeclampsia, 5% of GDM, 7% of IUGR placenta. Microabscess is present
in one case of normal placenta,,two cases of GDM,three cases of
preeclampsia, three cases of IUGR.
Infarction in basal plate
Infarction is seen in 4.4% of normal placenta, whereas it is seen in
27% of preeclampsia, 25% of GDM, 43% of IUGR.
Of these, in four cases of preeclampsia,,five cases of IUGR, two cases
of GDM, infarction was present covering >30% of placental surface,
indicating compromised uteroplacental perfusion.
Fibrinoid change in vessels
Present in 2.4% of normal cases, 69% of preeclampsia, 10% of GDM,
87% of IUGR. According to Fox (1968) it represents degenerative change.
Table -6 shows histopathological features of villi in normal and high
risk groups.
1. Basement Membrane Thickening
As shown in Table – 6.1 In complicated groups, basement membrane
thickening of 0-2% was observed in 65% of cases, whereas in normal group,
thickening is absent in 96.7% of cases. This is a result of ischaemia.
Thickening of basement membrane normally occurs in 3% of villi at term
according to Fox (1978). It is best shown by PAS staining.
2. Syncytical knot count:
According to Benerische (1961) and Fox (1978) syncytial knots are
primary responses to hypoxia, being homeostatic response to hypoxemic
stress. Syncytial knots are present in 10-30% of villi at term in
uncomplicated pregnancies.As shown in Table – 6.2 In our study, in
normal cases – the count was found to range between 0-29% constituting
about 99.25% of normal placenta. Nearly 60-70% of cases of high risk group
showed syncytial knot count in the range of 30-59% (preeclampsia –
73.36%, IUGR – 65.21%, GDM 70.69%). Four cases of preeclampsia, seven
cases of GDM, three cases of IUGR showed syncytial knot count >60%.
3. Fibrinoid Necrosis:
As shown in Table 6.3 the count was between 0-5% in 99.2% of
normal cases. The range was 5-15% in 70-80% of high risk cases indicating
degenerative change (preeclampsia-79.6% GDM-71% IUGR, 85.71%).
4. Infarction
As shows in Table 6.4 it is present in 30% of preeclampsia, 23.75% of
GDM, 35.7% of IUGR. Five cases of preeclampsia, one case of GDM, six
cases of IUGR showed involvement of >30% area.
5. Neutrophilic Infiltration
As shows in Table 6.5, Neutrophilic infiltration is present in
26.75% of preeclampsia, 23.75% of GDM, 5% of normal cases. Necrotising
features are noted in four cases of preeclampsia, five cases of GDM, three
cases of IUGR.
6. Calcification
As shows in Table – 6.6., calcification is present in 10% of normal
placenta. Calcification is a highly obscure association with no serious
abnormality of placenta according to Fox.
7. Stromal fibrosis
As shows in Table -6.7, In our study, grade I lesions were present in
complicated (50%) groups. In normal group, stromal fibrosis was present
only in <3 of villi. Ageing process and reduced uteroplacental blood flow
being the prime factors.
8. Cytotrophoblastic Proliferation
As shows in Table 6.8 it is absent in 98.8% of normal placenta, and
present in high risk pregnancies, in various degrees. 59.22% of preeclampsia,
61% of GDM, 78.26% of IUGR. Degree of cytotrophoblastic proliferation is
related to the extent of syncytial damage.
Blanc scoring system
To grade inflammation severity of extra placental membrane surface.
Grade 1: Polymorphs confined to deep connective tissue above chorionic
plate
Grade 2: Amniotic and chorionic surface
Grade 3: Necrotising choriomnionitis
Umbilical cord funisitis
Grade 1: Focally present
Grade 2: Diffusely present
Grade 3: Necrotizing
As seen in Table-7 there is a significant rise in the low APGAR
percentage in most of the morphological changes of placenta in the high risk
group.
In infarction, low APGAR percentage is 52.2% in high risk group
compared to 22.5% in normal pregnancies. In meconium staining of
placenta, low APGAR percentage in group II is 41.89% compared to 18.1%
in group I. Nearly 96% with placental weight <350gms and fetoplacental
ratio <3.5 in group II had low APGAR.
In calcification, low APGAR percentage is nearly equal in both
groups, with no early neonatal death. Early neonatal death was observed in
six cases with infarction, noted in preeclampsia. Early neonatal death was
observed in five cases of meconium stained membranes. Early neonatal
death was observed in nearly 14.28% (15cases) with placental weight
<350gm, fetoplacental ratio <3.5-17 cases of early neonatal death, all due to
preeclampsia.
As seen in Table -8 there is a significant rise in the low APGAR
percentage in the group of cases with higher grade histological changes of
placenta. This correlation is seen more with high risk pregnancies (Group II).
Syncytial knot count
As seen in Table-8.1, higher grade syncytial knot count (II,III) are
seen mainly in group II pregnancies. 57.14% of fetuses with knot count of
>60, gr.III, had low APGAR and early neonatal death. Among eight cases of
early neonatal death, three cases were due to preeclampsia, two cases due to
IUGR, three cases were due to GDM.
Infarction
As seen in Table 8.2 higher grades of infarction are noted only in
group-II pregnancies. In infarction covering >30% area, low APGAR and
early neonatal death were observed in 66.66% and 41.67% (five cases)
respectively.
Low APGAR was observed in 54% of cases with infarction of 10-30% and
4% had early neonatal death. All the six cases of death were due to
preeclampsia.
Fibrinoid Necrosis
As seen in Table -8.3, fibrinoid necrosis of >15% involvement, seen
in group II nearly 100% (four cases) had low APGAR and 100% (four cases)
had early neonatal death. Nearly 39% of group II pregnancies had low
APGAR with involvement of 5-15% area. Of the four cases of early neonatal
death seen in >15% involvement, three cases were due to preeclampsia, one
case of death was due to IUGR.
Thickened Basement Membrance
As seen in Table -8.4, >2% involvement of basement membrane is
noted only in group II pregnancies which revealed low APGAR in nearly
48% of pregnancies.
Stromal Fibrosis
As shown in Table -8.5, grade II stromal fibrosis noted in group II was
associated with low APGAR in two cases (100%) and early neonatal death
(50%) in one case.Death is due to preeclampsia.
Cytotrophoblastic proliferation
As shown in Table -8.6, cytotrophoblastic proliferation observed
mainly in group II pregnancies, is associated with low APGAR in 15% of
cases and early neonatal death in two cases (1.32%) due to preeclampsia.
Neutrophilic Infiltration
As shown in Table-8.7, presence of neutrophilic infiltration is
associated with low APGAR in 54.55% of cases. Necrotizing features
observed in 12 cases of group II (four cases of preeclampsia, five cases of
GDM, three cases of IUGR) had low APGAR in 100% and early neonatal
death in nearly 75% (nine cases).
As shown in Table -9.1, there is significant correlation with syncytial
knot count and low APGAR by chisquare test P<0.001.
As shown in Table -9.2, there is significant correlation between
infarction and low APGAR by chisquare test P<0.001.
As shown in Table 9.3, there is significant correlation between
fibrinoid necrosis and low APGAR (P<0.001)
As shown in Table -9.4, there is significant correlation between
thickened basement membrane with low APGAR. (P<0.001)
As shown in Table -9.5, there is significant correlation between
necrotizing features with low APGAR. In this chisquare test with Yates
correction is used. (P<0.002).
As shown in Table - 10.1, there is significant correlation with
syncytial knot count with early neonatal death, more in higher grade.
(P<0.001).
As shown in Table - 10.2, there is significant correlation with
infarction with early neonatal death. P value (<0.001) more in higher grades.
As shown in Table - 10.3, there is significant correlation with fibrinoid
necrosis with early neonatal death, more in higher grades. (P<0.001).
As shown in Table - 10.4, there is significant correlation between
thickened basement membrane with early neonatal death, P value <0.001
more in higher grades.
As shown in Table - 10.5, there is significant correlation between
necrotizing features and early neonatal death. P<0.001.
According to Daskalakis G et al,2008,there is significant correlation
between fibrinoid necrosis,(also other vascular lesions) and poor fetal
outcome,in diabetes group.
Aordema M W et al 2001,found “Pathological Changes” in 58% of
complicated pregnancies (Placenta 22: 405,2001)
As shown in Table-11 Abnormal Uterine artery Doppler findings are
seen in 4% of normal group,60% Hypertensive group,40% of GDM
grup,46% IUGR group. There is significant association between abnormal
uterine artery Doppler waveforms and high risk pregnancies.( P<0.001 for
early diastolic notch and increased systolic diastolic ratio).
According to Ambreen Qureshi et al,,Swarnalata Samal et
al,2009,Abnormal uterine artery Doppler findings were reported in
55%.Hypertensive,and 4% normotensive group. Our study also shows
similar results.
According to Oztelein K,Ozdemir N et al,1999,The mean systolic
diastolic ratio,resistance index,and pulsatility index of uterine artery in
women with Preeclampsia and IUGR was significantly higher than women
with normal pregnancies(P<0.01)
Sagol S,Ozkinay E et al 1999 High Uterine artery flow resistance is
related to reduced trophoblast migration in to the myometrium and
inadequate physiological changes in the spiral arteries in women with
Preeclampsia and IUGR.
As shown in Table – 12, stillbirth rate in abnormal uterine artery
Doppler group in Preeclampsia is 58%. (58.1% in early diastolic notch,
58.6% in increased systolic diastolic ratio group). There is significant
association between early diastolic notch and stillbirth in preeclampsia (P <
0.001). There is significant association between increased systolic diastolic
ratio and stillbirth in preeclampsia (P < 0.001).
As shown in Table – 13, in Preeclampsia group, low APGAR is
seen in 85% of those with early diastolic notch and 85% of those with
increased systolic diastolic ratio. There is significant association between
early diastolic notch and low APGAR in Preeclampsia P<0.09 (<0.05 is
considered significant). There is borderline significant association between
low APGAR and increased systolic diastolic ratio P - 0.04.
According to KOFINAS et al 1992, there was significant
association between low APGAR status and abnormal uterine artery Doppler
waveforms.(P<0.001)
According to SL COSTA et al,2008 there was significant
correlation between low APGAR status and abnormal uterine artery
waveforms.(P<0.025)
Out of the 20 deaths observed, one was due to congenital anomalies which
died within 48hours. It has single umbilical artery.
The remaining 19 were observed between 5th and 8th day.
six on 5th day
seven on 6th day
two on 7th day
four on 8th day
nine died due to respiratory distress, in preeclampsia
five died due to meconium aspiration, seen in preeclampsia
six died due to septicemia seen in GDM
All these early neonatal deaths were associated with significant
morphological and histopathological changes in placenta. Hence routine
histomorphological study of placenta will be of immense use in reducing
neonatal morbidity or mortality.

SUMMARY
SUMMARY
This study is important by 3 factors
1. Volume-500 cases of normal and high risk pregnancies
2. Armamentarium – a tertiary hospital with hitech gadgets meeting all
needs
3. Variety – both morphological and histopathological study.
Both positive and negative correlations are brought out.
The positive correlations are for syncytial knot count, neutrophilic,
infiltration, infarction, thickening of basement membrane, fibrinoid necrosis
with fetal outcome.
There is significant correlation between the presence of syncytial knot
count with low APGAR and early neonatal death respectively, when the
syncytial knot count is present in >60% of villi.
There is significant correlation with infarction and low APGAR and
early neonatal death.There is very significant correlation between fibrinoid
necrosis and thickened basement membrane with low APGAR and early
neonatal death
Finally there is significant correlation with neutrophilic infiltration
with necrotizing features with low APGAR. There is significant correlation
between fetal placental ratio and low APGAR and early neonatal death.
p<0.01.
These morphological and histological changes of placenta and its
relation to fetal morbidity and mortality is more pronounced in high risk
pregnancies.
There is significant association between abnormal uterine artery
waveforms and high risk pregnancies .There is significant correlation
between Uterine artery Doppler early diastolic notch and low APGAR in
preeclampsia. There is borderline association between Uterine artery
Doppler, elevated systolic diastolic ratio and low APGAR in preeclampsia.
There is significant association between abnormal uterine artery
Doppler waveforms and stillbirth in preeclampsia.
Gross features – there was no significant correlation with calcification,
other morphological features such as both the type of placenta, septal cyst,
true knot, , with fetal outcome.(P > 0.01) In our study only two cases had
single umbilical artery, among which one died due to cardiac anomaly.
Neonatal mortality was observed on the later part of 1st week of
delivery in cases where we see such histomorphological changes of placenta.
The morbidity and mortality can be reduced by initiating judicial better
neonatal care and better antibiotic coverage once we see those
histomorphological changes, not waiting for the baby to exhibit symptoms or
signs. Hence the present study is important as on application, it can reduce
neonatal morbidity and mortality.

CONCLUSION
CONCLUSION
This study is an endeavour to assess the possible probable link of
morphological and histopathological changes in placenta and the fetal
outcome. Many such studies pile up, days may not be for off when a definite
link can be proved in a very positive way. This will help to save many
babies.
Through examination of the delivered placenta can provide a better
picture of the intrauterine environment of the fetoplacental unit than a
placental bed biopsy. The ability to routinely identify failure of
uteroplacental vascular adaptation, fibrinoid necrosis, atherosis, persistence
of endovascular trophoblasts, thrombosis and chronic vasculitis in the basal
plate can clarify the nature and mechanisms involved in pregnancy
compromise.
Many studies are upcoming for placenta screening for high risk
pregnancies by using a combination of ultrasound and blood tests to screen
high risk pregnant mothers for placental damage. By completing these non
invasive tests, most high risk mothers can be reassured that their placenta is
formed and functioning properly, so they can expect a healthy pregnancy.
This is an important first step in identifying placental abnormalities in early
pregnancy, at a time when a number of interventions can be used to improve
outcomes for those with the highest risk. This study will lead the way for
future research in placenta screening and help us provide quality care for all
mothers.

BIBLIOGRAPHY
BIBLIOGRAPHY
Aardema mw, Oosternof H, Timmer Aet al; Uterine artery Doppler
flow and uteroplacental vascular pathology in normal pregnancies and
pregnancies complicated by pre-eclampsia and small for gestational age
fetuses. Placenta 22:405,2001.
Aladjern, S.Perri and Fanaooff, A. Placental score and neonatal
outcome. Obstet Gynecol. 39 : 591 ; 1982.
Altshuler, G. The role of placenta in perinatal paediatric pathology,
6207 -233 ; 1996.
Altshuler, G. The epidemiology of placental features, association
with gestational age and neonatal outcome. Obstet and Gynaecol. 87 : 771 -
778 ; 1991.
Altshuler, G. Choriangiosis an important placental sign of neonatal
morbidity and mortality, Arch.Pathol.Lab medicine, 108 : 71 - 74 ; 1984.
Autio - Harmainen, H. A morphometric study of placenta in fetal
congenital nephrotic syndrome.
Bain, AD. Newborn after prolonged leakage of liquor amnii. Br. Med.
J. 2 : 598 ; 1968.
Bartman, J. and Driscoll, SG. Amnion nodosum and hypoplastic
cystic kidneys. Obstet. Gynecol, 32 : 700 ; 1968.
Benirschke, K. and Kaufmann, The pathology of maternal floor
infarction. In pathology of human placenta. New York NY - Springier
verlage Inc - 406 : 411 ; 1990.
Benirschke, K. and Kaufmann, P. Pathology of human placenta 3rd
edition. Springier Verlag New York 1995.
Chrolyn and Chandler. Placental pathology in perinatal diagnosis in
Gynecology and Obstetrics. J.B. Lippin cott. company. Philadelphia. E/dy^r
John J. MD.Phd., Vol. 31 Ch : 106 1 - 39 ; 1992.
Caspi Soloman, F. Amnionitis and T strainmycoplasma. Am.J.Obstet
Gynecol. Ill : 1102 ; 1971.
Cynthia, G., Kaplan. Carolyn Salafia - College of American
Pathologists. conference XIX on examination of placenta. Report of working
group on the def of structural changes associated with abnormal functions in
maternal / fetal placental unit in 2nd and 3rd trimester. Arch.Pathol.Lab.
med. 115 : 709 - 716 ; 1991.
Driscoll, SG. Pathology of placenta in intrauterine growth retardation.
Ann. Chir, Gynaecol., 70 : 316 ; 1987.
Daskalakis G, marinapoulas, Krielesiv, PapapanagiotouA,
placental pathology in women with gestational diabetes. Acta Gynecol Scand
2008; 87(4) 403-7.
Ethches, PC. Stewart. The relationship between disorders of
umbilical cord and intrauterine growth retardation. Acta. Obstot, Gynecol
scand. 72 ; 15 ; 1982.
Fox, H. Pathology of placenta, London. WB Souder Ltd., 1978.
Fox, H. Thrombosis of fetal arteries in human placenta, BJOG. 73 :
961 -965 ; 1966.
Fox, H. General pathology of placenta in Fox, H. ed : Obstetrical and
Gynecological pathology New York NY: Churchill Linngstone, Inc Z: 972 :
1000 ; 1987.
Geoffrey Altshuler. Scott - R - clinicopathological implications of
placental pathology clinical obstet and Gynaecol, 29 : 549 - 570 ; 1996.
Gruenwal, P (Ed). The placenta and its maternal supply Line.
Lancaster, medical and technical publishing, 1975.
Hans.G.Kohler Pathology of Umbilical cord and fetal membranes in
Hainee M.Obstetrical and gynecological. Path Vol2.Pages 1079-1116. 1987.
Haust, MD. Maternal Diabetes mellitus - effects on the Fetus and
placenta, Ch.8. In Naeye Kissane, JM (eds). Prenatal disease, Williams or
Wilkins (1981).
Jone, KL. et al. The amniotic band disruption complex. J.Pediatrics. 95 :
554 ; 1981.
Kaufmann, P., Sen, DK. and Sch welkhart, G. Classification of human
placental villi cell tissue. Res : 200 : 409 - 423 ; 1979
Kaplan, C. Placental pathology Pathol Annual. 28 : 15 - 72 ; 1993.
Kliman, HJ. Perotta, PL. The efficacy of placental biopsy. AmJ.OG.
1995, Oct 173 (4) ; 1084 - 8.
Las Heras, J. and Harding, PG. et al. Morphometric studies of fetal
vasculature in hypertensive disease of pregnancy. Lab invest, 38 : 353 ; 1980.
Macpherson, T. The principles of surgical pathology 2nd ed. New York,
NY. Churchill, Linngstore, Inc. 1825 - 1856 ; 1990.
Many A, Hubel CA, Fisher SJ et al: Invasive cytotrophoblasts manifest
evidence of oxidative stress in preeclampsia. AM J. pathol 156: 321, 2000
Mirchandani, JJ., Mallik and Chitra, S. Histopathology of placenta.
J.Obstetrics, Gyne - India. 29 : 40 ; 1989.
Moe, N. Deposits of fibrin and plasma protein in the normal human
placenta : an immunofluorescence study. Acta. Pathol. microbial. Scand. 76 : 74
; 1969.
Naeye, RL. Placental infarction leading to fetal or neonatal death a
prospective study. Obstect Gynecol 50 : 583 - 388 ; 1997.
Naeye, RL. Functionally important disorders of placenta, umbilical
cord and fetal membranes. Hum. Patho. 18 : 680 - 691 : 1987
Naeye, RL. Do placental weight have clinical significance? Human.
Pathol. 18 : 387 - 391 ; 1987.
Ounsted, M. Histopathology of placenta in Intrauterine growth
restriction -Nature, 212 : 995 ; 1966,
Rayburn, WF and Brinknan, DL. Umbilical cord length and
intraposition complications. Obst. Gynecol. 57 : 450 - 452 ; 1981.
Redman CW, Sargent IL: Placental debris, oxidative stress and
preeclampsia. Placenta 21: 597, 2000.
Russel, P. Infections of placental villi. In Fox, H. ed. Obstetrical and
Gynecological pathology, Newyork, NY. Churchill Living stone, Inc. 2 :
1979 - 1116 ; 1987.
Sabharwal, B.D. Malhotra, HPE of placenta in anaemia. Journal of
obstetrics Gynecology, India. 37 : 773.; 1987.
Sagol S, Ozkinay E,: The comparison of Uterine artery Doppler
velocimetry with the histopathology of placental bed. Aust NZJ Obstet
Gynecol. 39:324,1999.
Salafia cin - vintzileos. Gill berman and Banthom, KF. Placental
pathology in idiopathic IUGR at term. Amh. Perinatal, 8 - 179 - 184 ; 1992.
Sheppard BL, Bonnar J: Uteroplacental hemostasis in intrauterine
fetal growth retardation. Semin thromb Hemost 25: 443, 1999.
Shirley, G. and Driscoll, MD. Placental examination in a clinical
setting. Arch. Patho. Lab. Med. Vol. 116, 668 - 671 ; 1991.
S.L.Costa, L Proctor, JM Dodd : Placenta Vol 29, I 12 P 1034-1040,
Dec 2008.
Teasdale, F. Functional significance of the zonal morphologic,
differences in the normal human placenta. Am J. Obstet Gynecol. 130 : 773
; 1978.
Trera Macpherson. Fact Fancy. What can we really tell from
placenta. Arch.Patho. Lab.Med. 115 : 672 - 678 : 1991.
Wiggleswoth, JS. The placenta in perinatal pathology Philadelphia
Pa; WB Saunder, Co. 48 - 3 ; 1984.
William ob • 21 edition. Pathology of placental membranes. (86.106).
Wilkoning, RB. Anderson, S. etal., Placental transfer as a function of
uterine blood flow. Am. J.Physioll ; 242 - 249 ; 1982.
Zeek, PM. and Assali, NS. Vascular changes in the decidua
associated with eclamptogenic toxaemia, of pregnancy. Am.J.Clin. Pathol.
20 : 1099 : 1986.

PROFORMA
PROFORMA
Name :
Age :
IP.No :
Unit :
DOA :
GPLA :
Booked :
Study Group :
Menstrual history :
Marital history :
OBSTETRIC HISTORY
I Trimester :
II Trimester :
III Trimester :
DETAILS OF MEDICAL DISORDER :
Past history :
Family history :
Personal history :
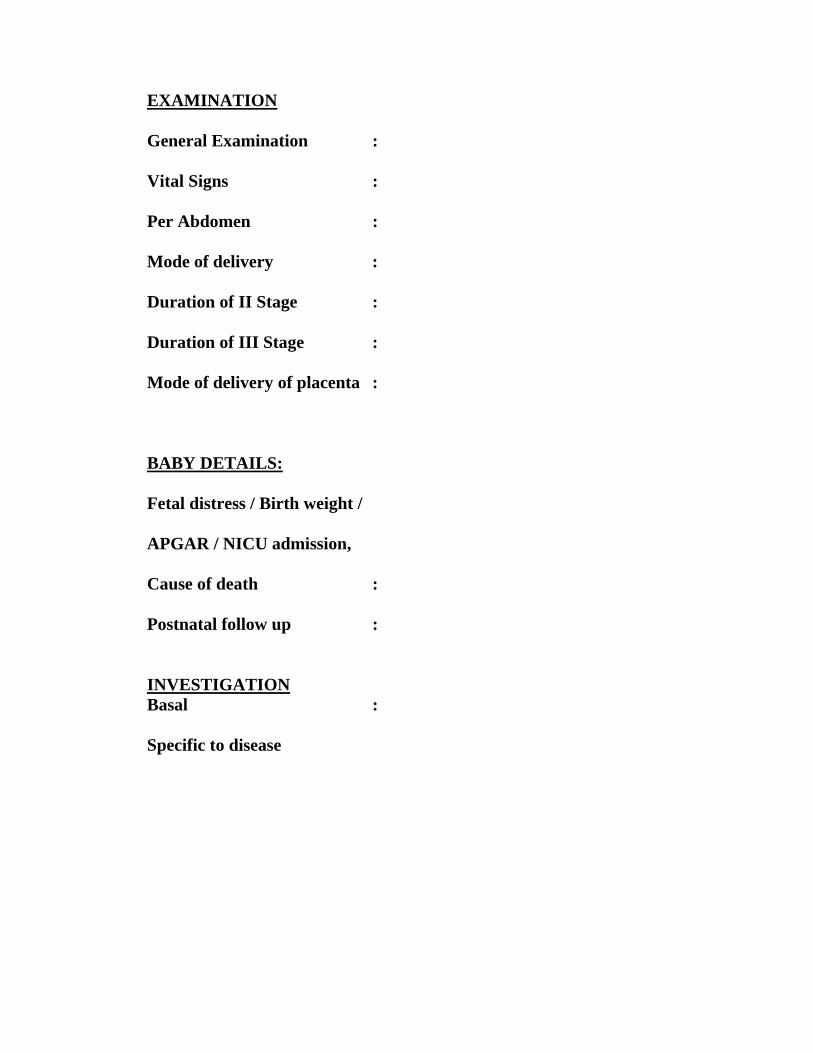
EXAMINATION
General Examination :
Vital Signs :
Per Abdomen :
Mode of delivery :
Duration of II Stage :
Duration of III Stage :
Mode of delivery of placenta :
BABY DETAILS:
Fetal distress / Birth weight /
APGAR / NICU admission,
Cause of death :
Postnatal follow up :
INVESTIGATION Basal :
Specific to disease
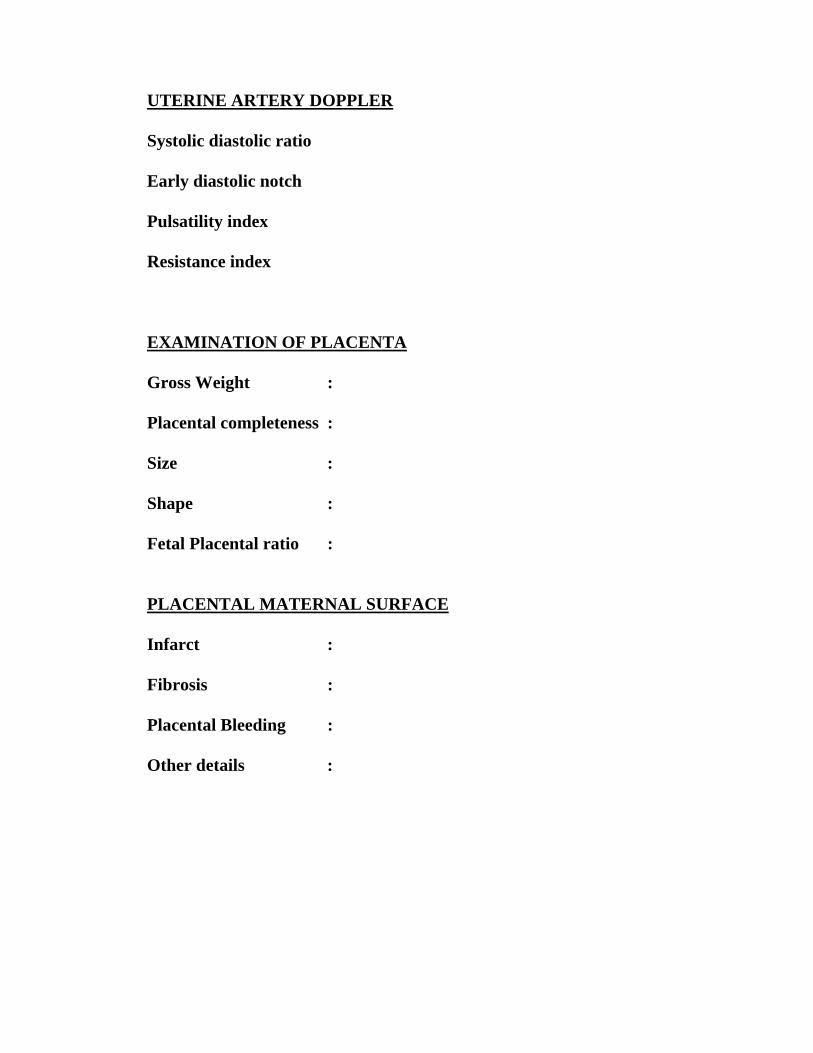
UTERINE ARTERY DOPPLER
Systolic diastolic ratio
Early diastolic notch
Pulsatility index
Resistance index
EXAMINATION OF PLACENTA
Gross Weight :
Placental completeness :
Size :
Shape :
Fetal Placental ratio :
PLACENTAL MATERNAL SURFACE
Infarct :
Fibrosis :
Placental Bleeding :
Other details :

FETAL SURFACE:
Anemia :
Circumvallate :
Circummarginate :
Other details :
CORD
Length :
Edema :
Cord insertion :
Knot : No of Vessels :
Other details :
MEMBRANE
Colour : Foul Smelling :
Other Details :
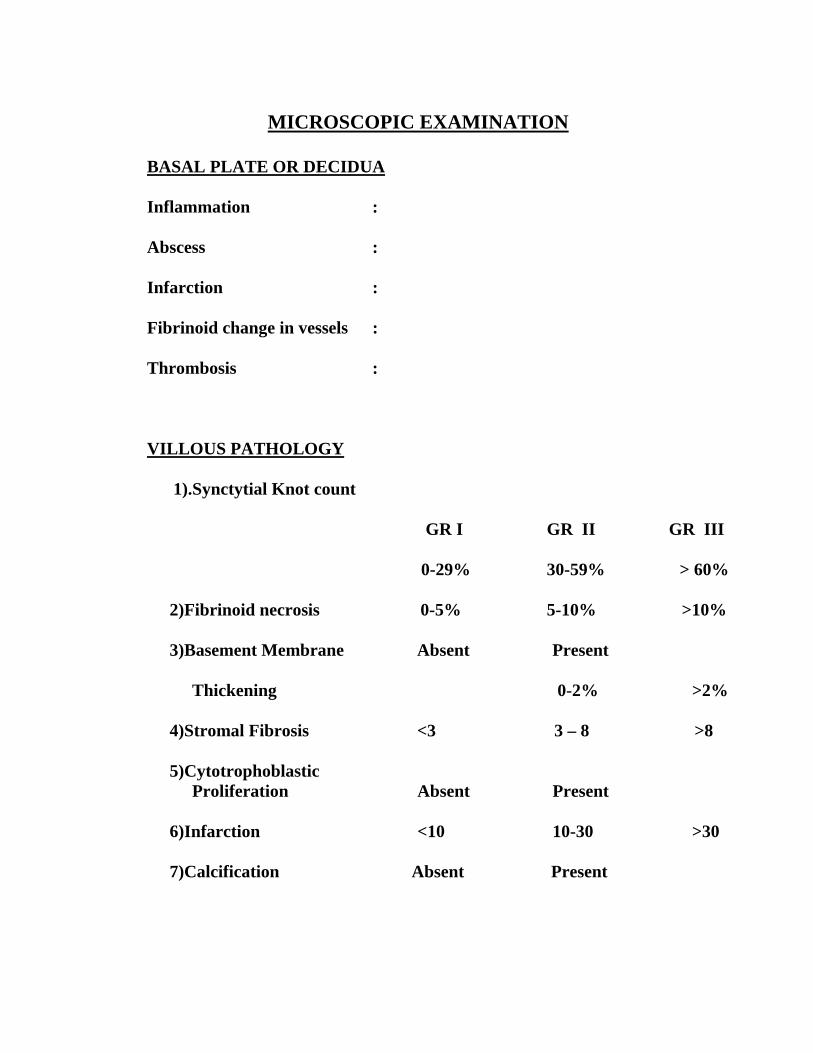
MICROSCOPIC EXAMINATION
BASAL PLATE OR DECIDUA
Inflammation :
Abscess :
Infarction :
Fibrinoid change in vessels :
Thrombosis :
VILLOUS PATHOLOGY
1).Synctytial Knot count
GR I GR II GR III
0-29% 30-59% > 60%
2)Fibrinoid necrosis 0-5% 5-10% >10%
3)Basement Membrane Absent Present
Thickening 0-2% >2%
4)Stromal Fibrosis <3 3 – 8 >8
5)Cytotrophoblastic Proliferation Absent Present
6)Infarction <10 10-30 >30
7)Calcification Absent Present

CORD AND MEMBRANES
Neutrophilic infiltration :
Necrotizing features :
Other details :

MASTER CHART
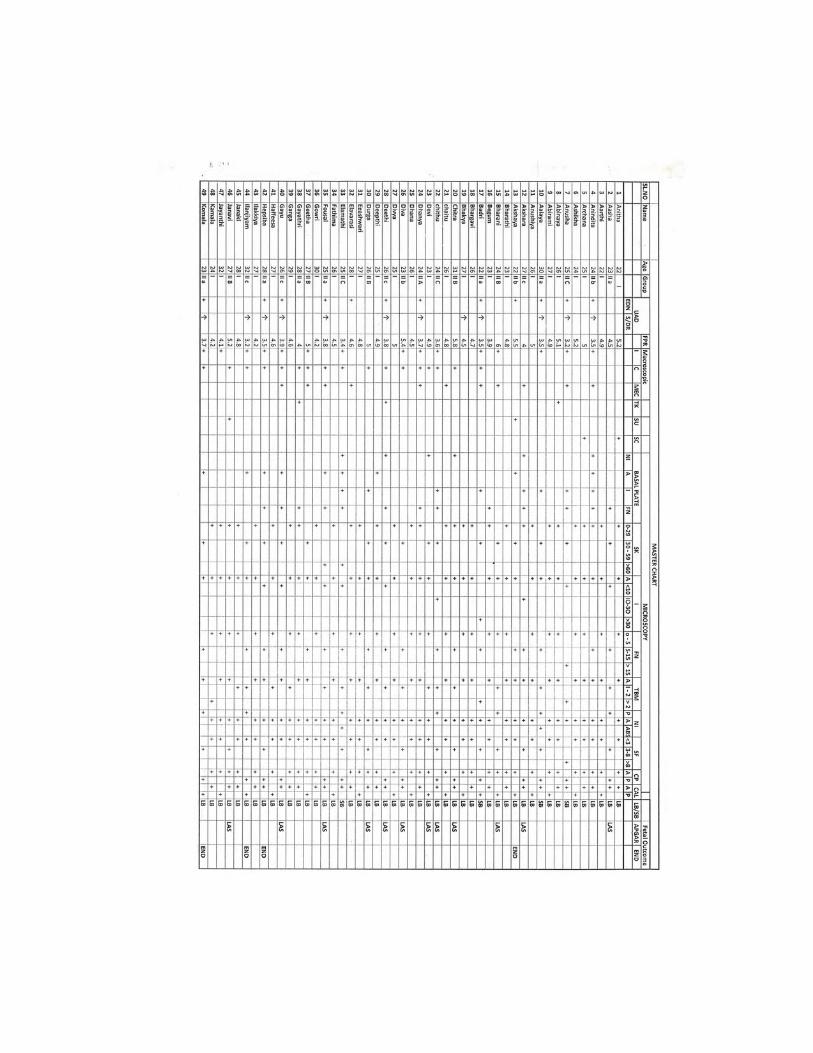
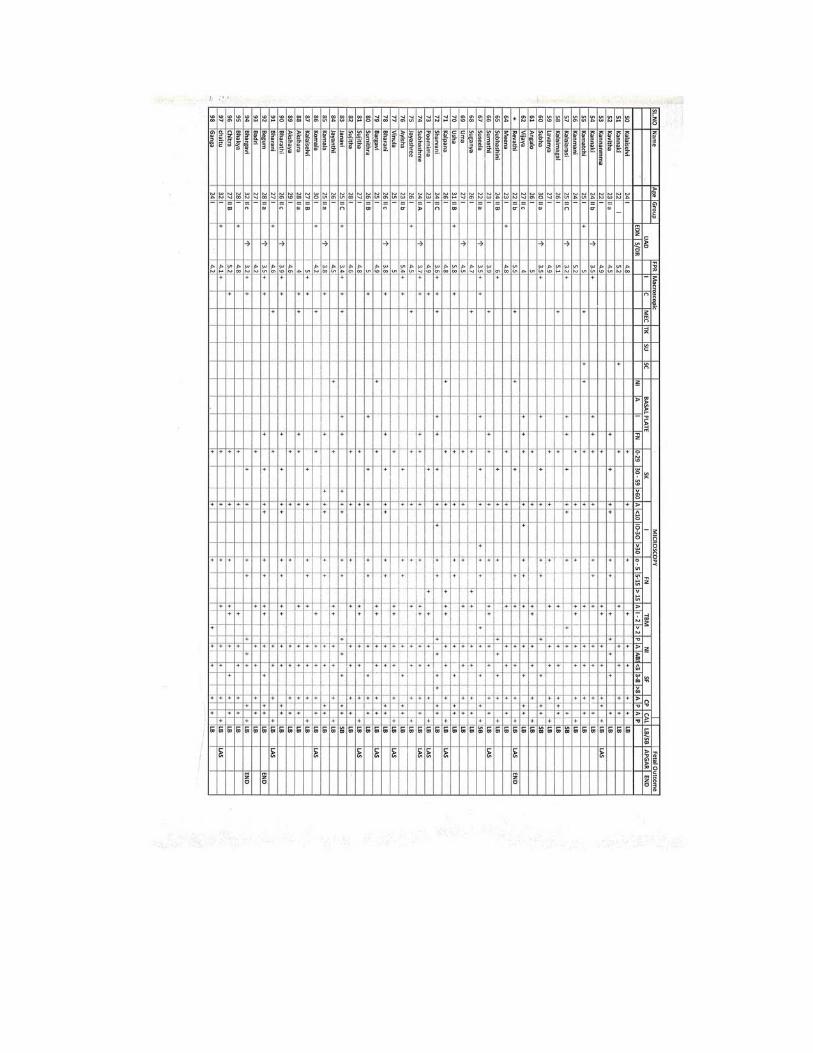
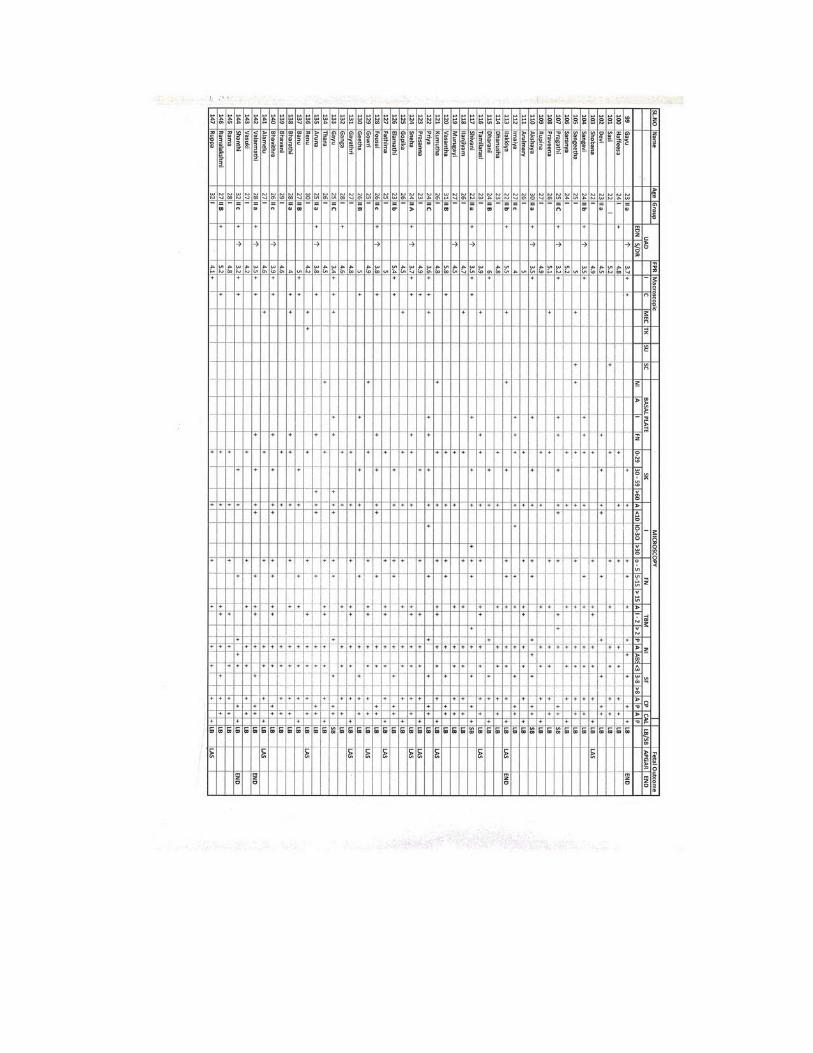
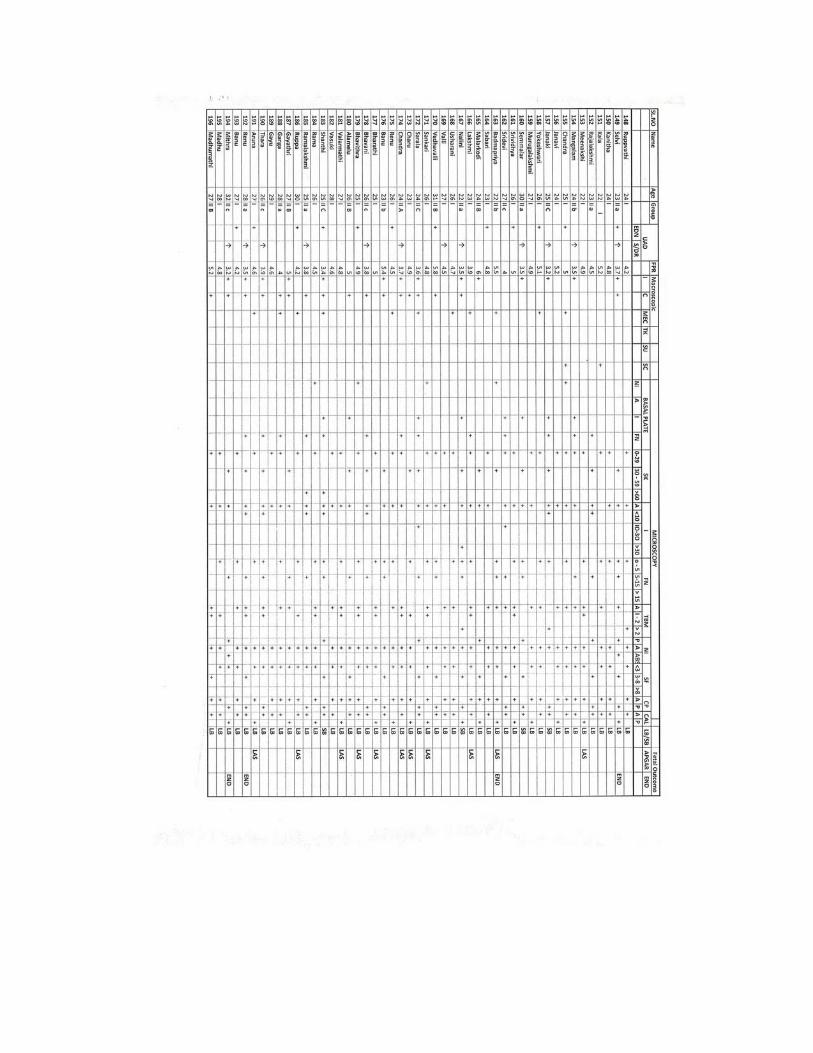
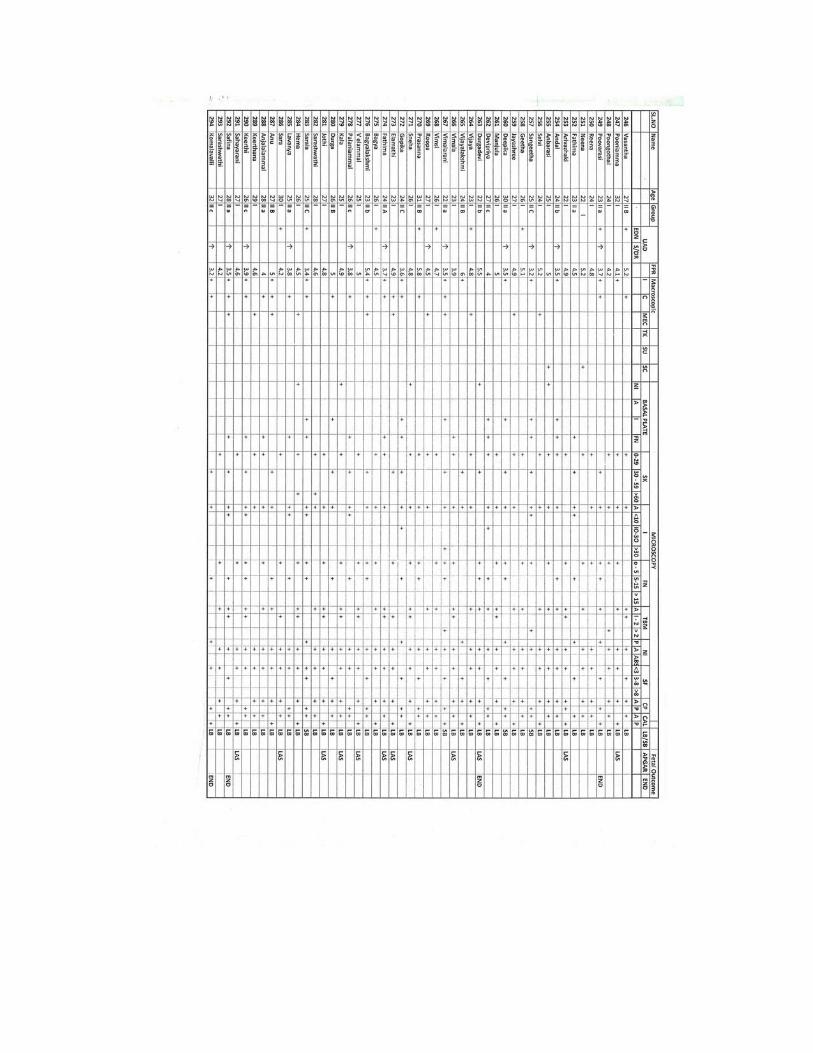

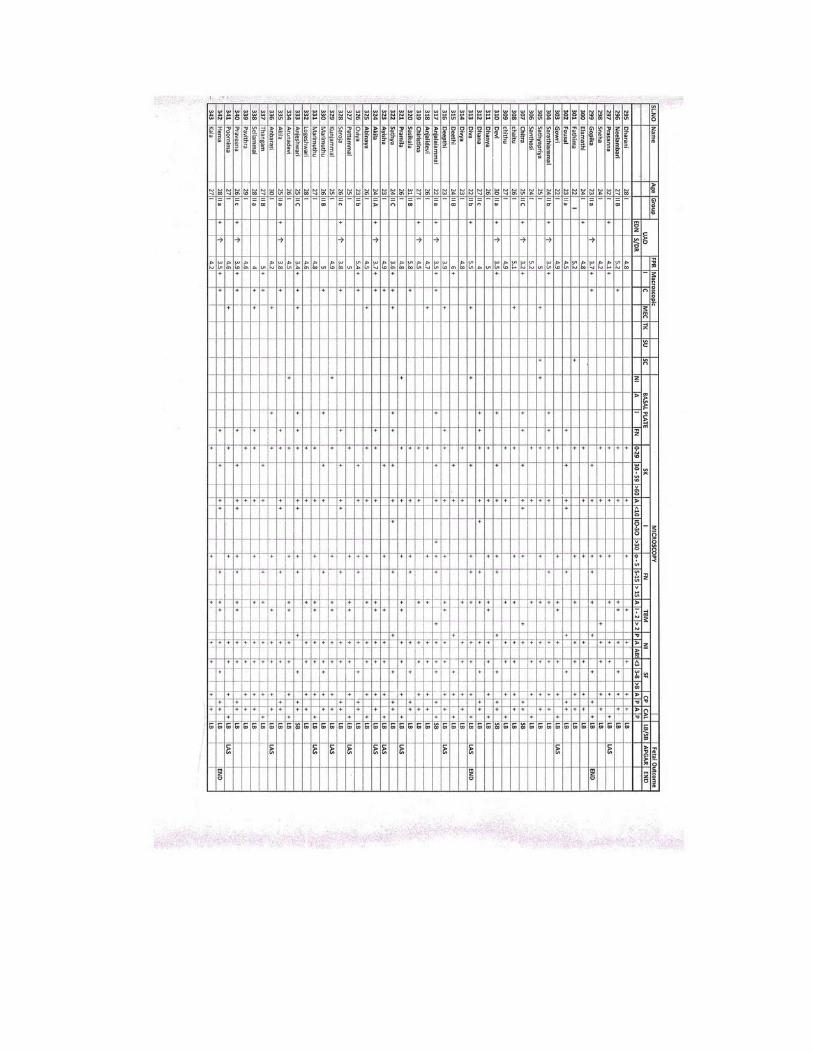
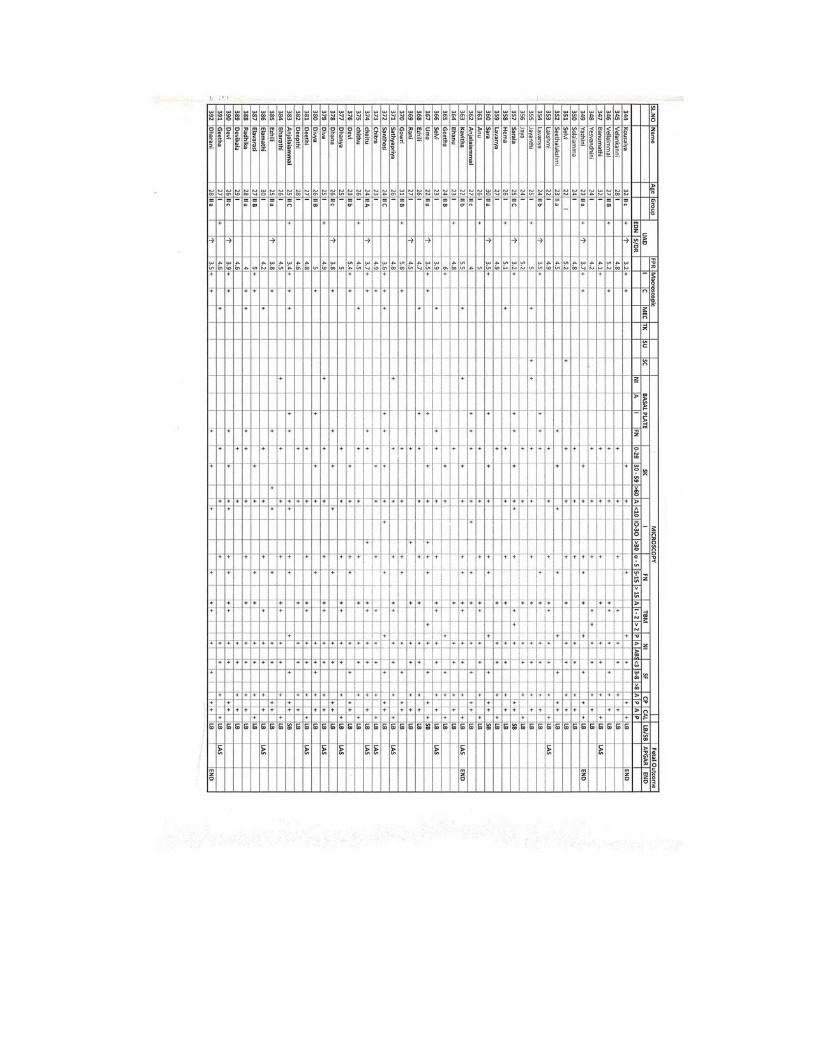
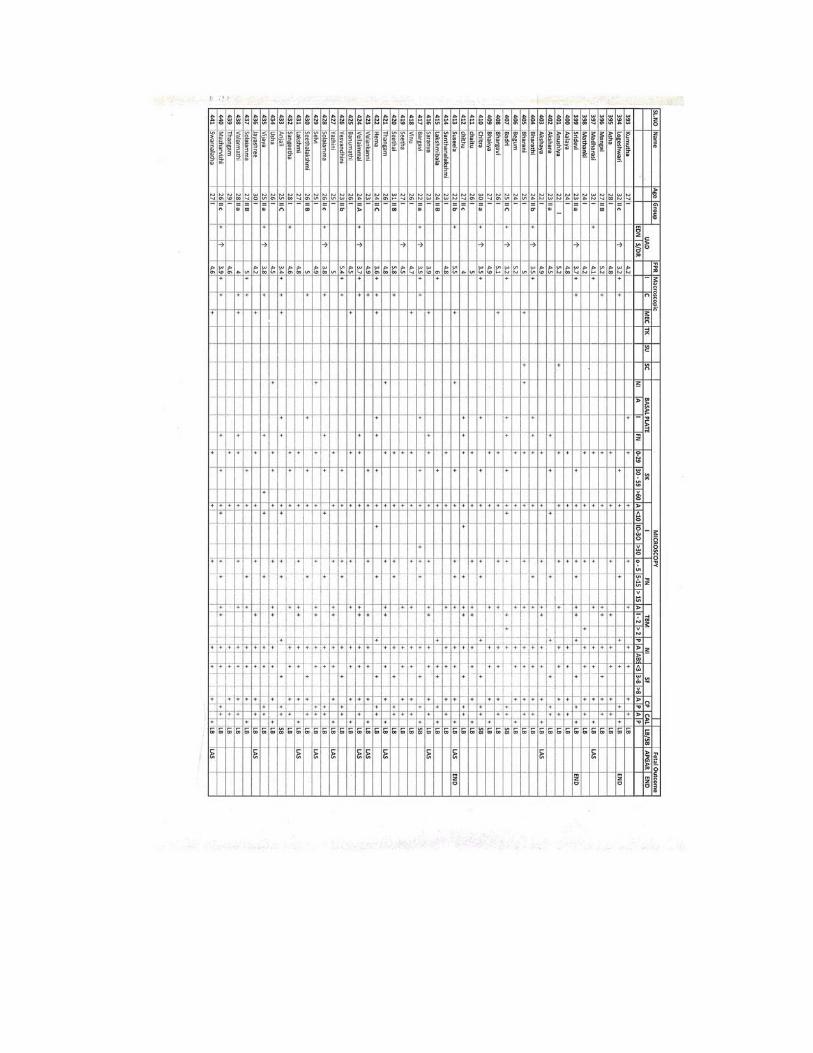
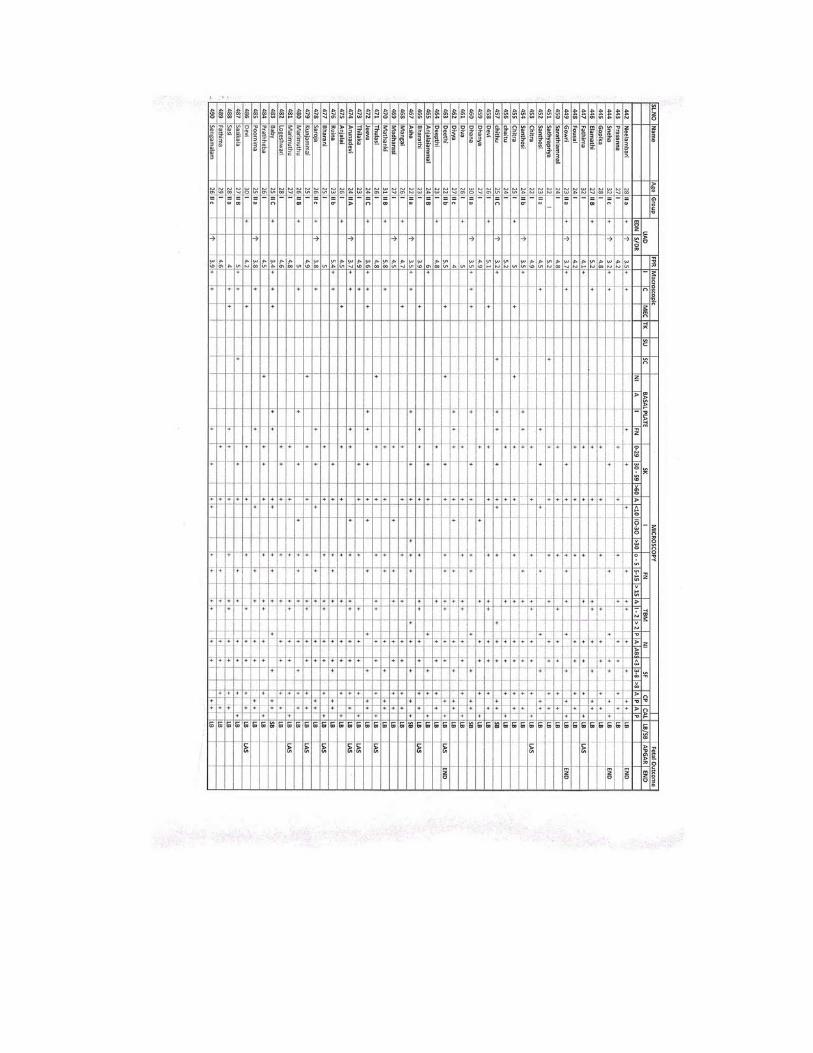
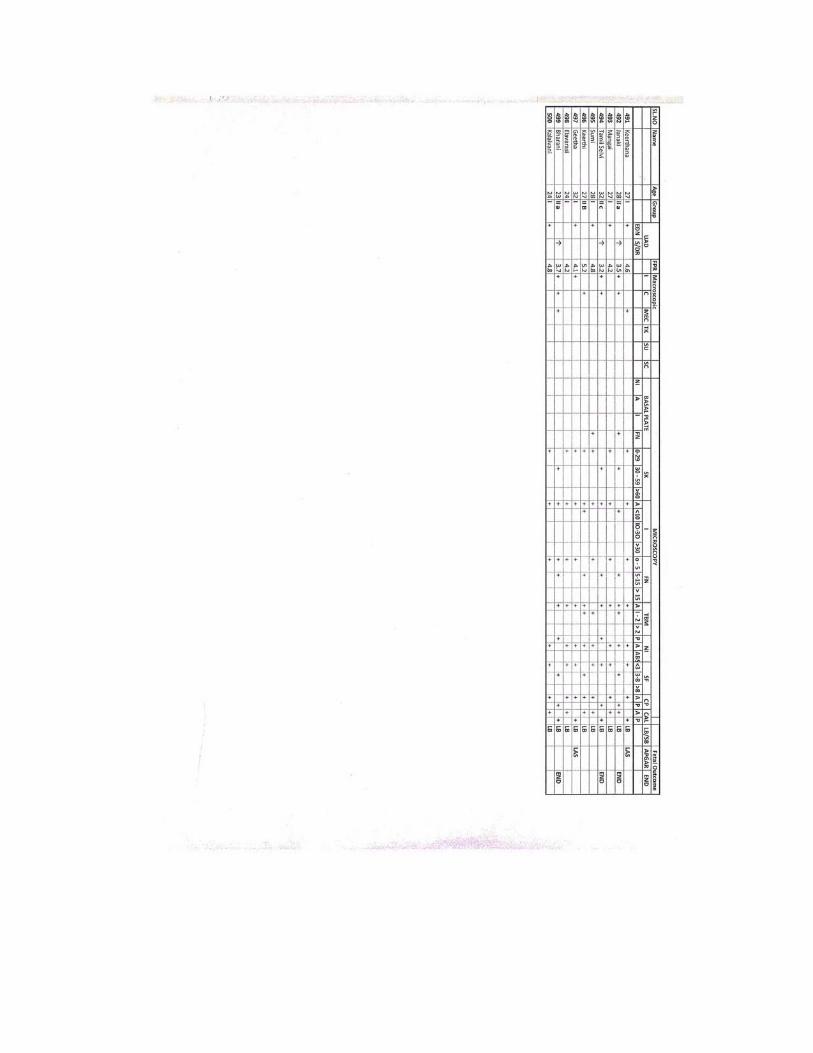
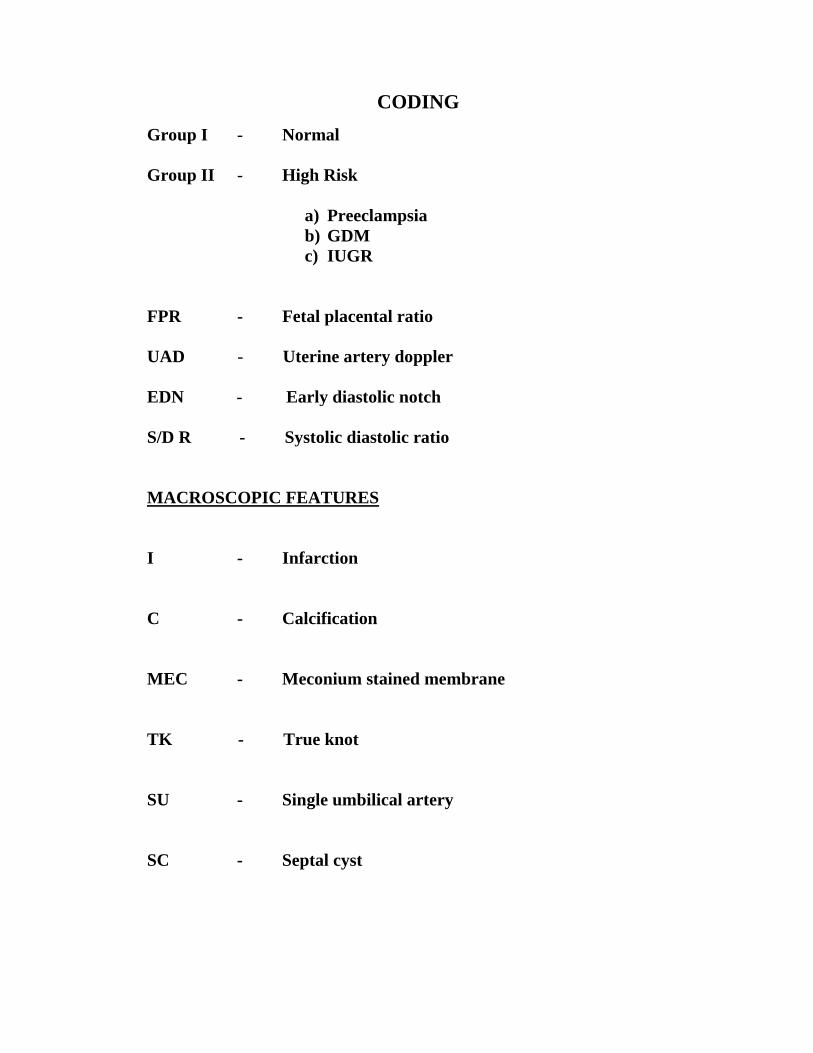
CODING Group I - Normal Group II - High Risk
a) Preeclampsia b) GDM c) IUGR
FPR - Fetal placental ratio UAD - Uterine artery doppler EDN - Early diastolic notch S/D R - Systolic diastolic ratio MACROSCOPIC FEATURES
I - Infarction
C - Calcification
MEC - Meconium stained membrane
TK - True knot
SU - Single umbilical artery
SC - Septal cyst
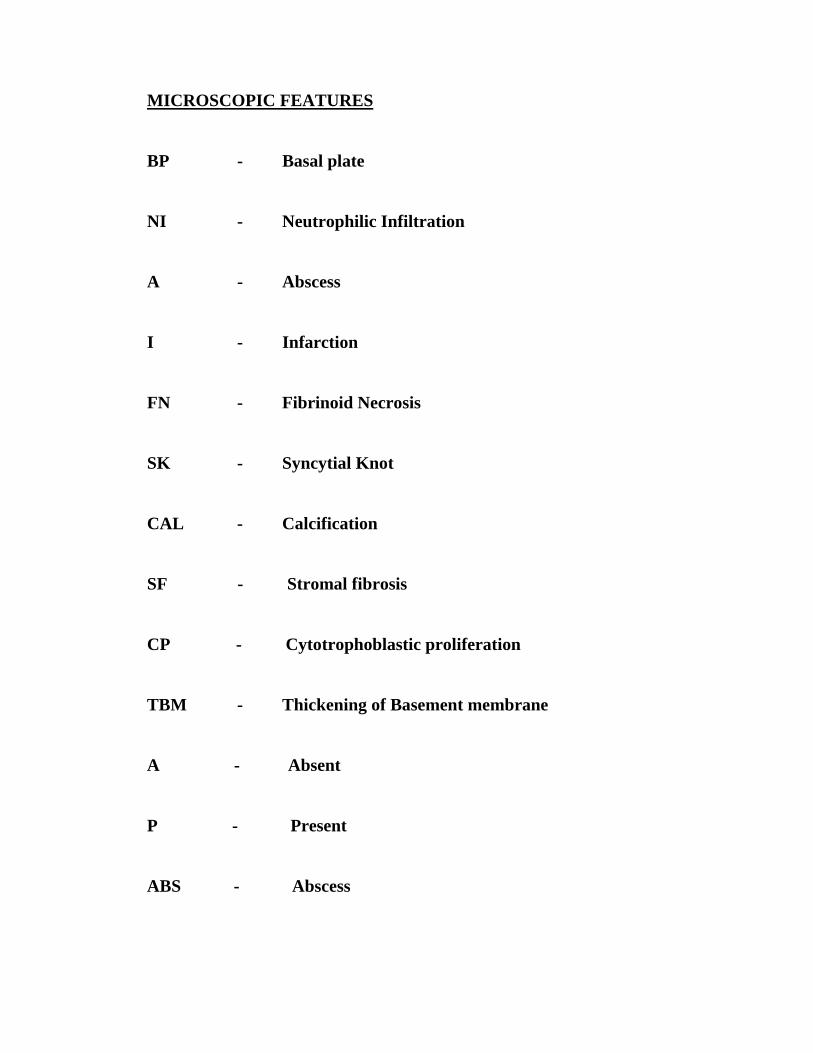
MICROSCOPIC FEATURES
BP - Basal plate
NI - Neutrophilic Infiltration
A - Abscess
I - Infarction
FN - Fibrinoid Necrosis
SK - Syncytial Knot
CAL - Calcification
SF - Stromal fibrosis
CP - Cytotrophoblastic proliferation
TBM - Thickening of Basement membrane
A - Absent
P - Present
ABS - Abscess
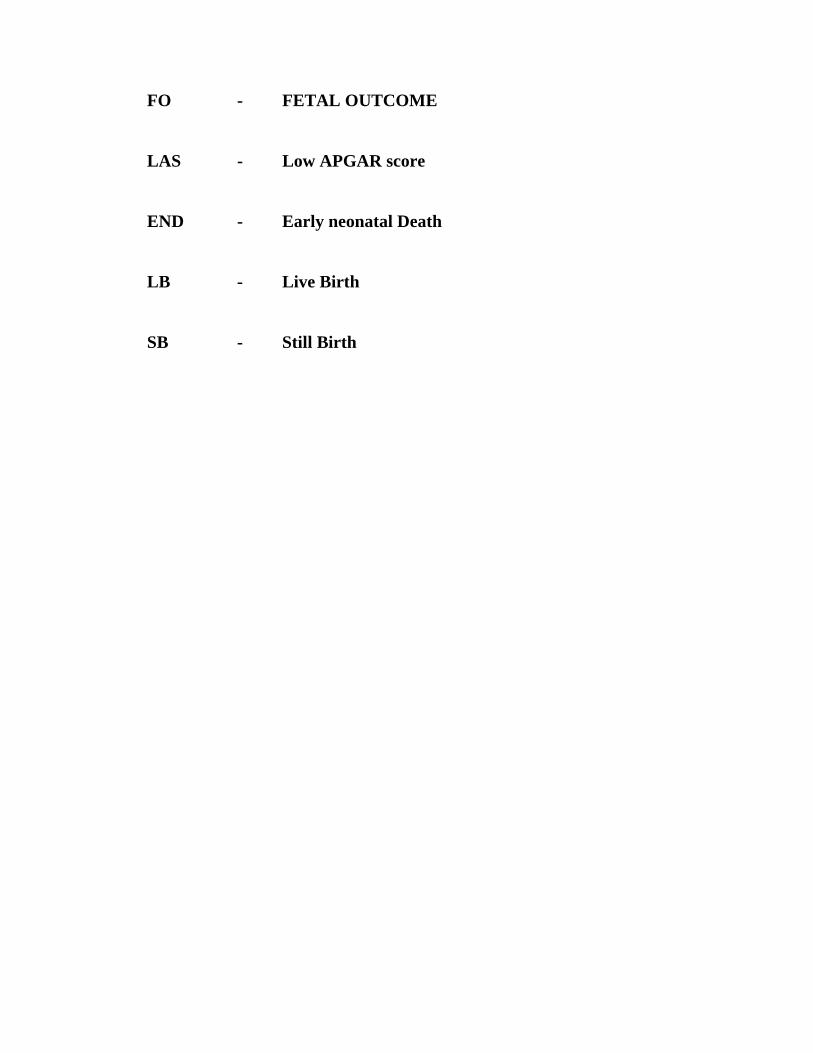
FO - FETAL OUTCOME
LAS - Low APGAR score
END - Early neonatal Death
LB - Live Birth
SB - Still Birth