Embed Size (px)
Citation preview
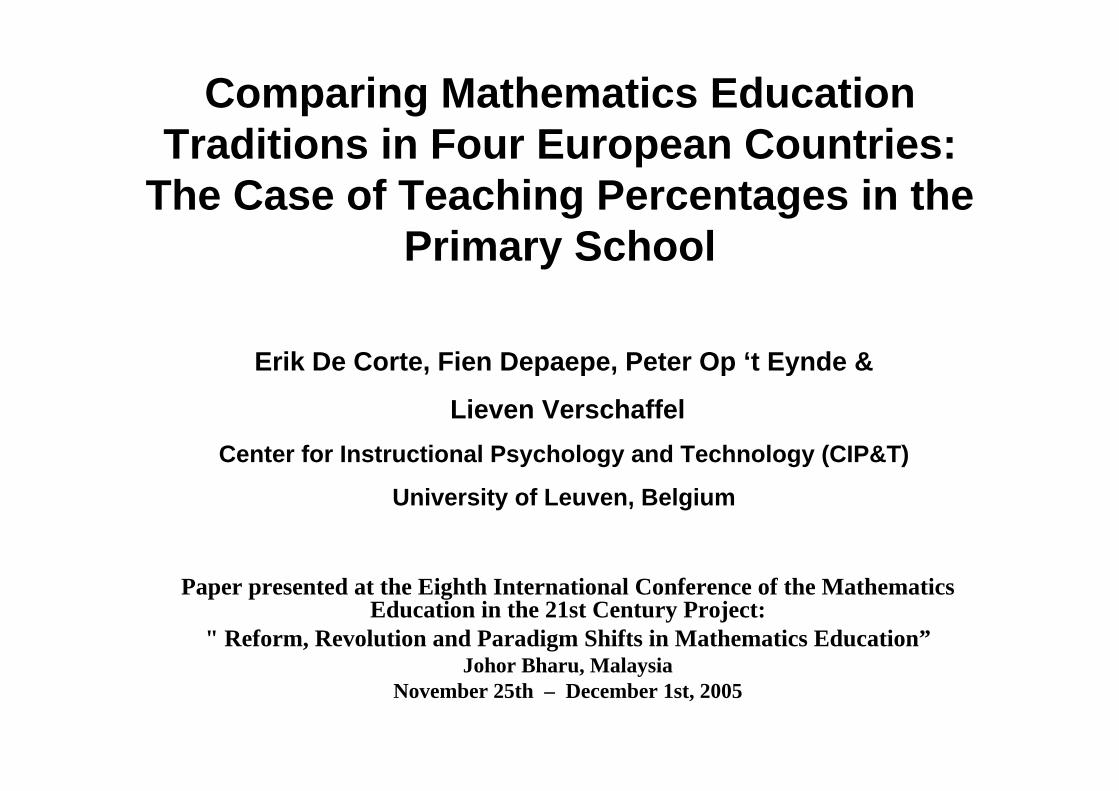
Comparing Mathematics Education Traditions in Four European Countries:
The Case of Teaching Percentages in the Primary School
Paper presented at the Eighth International Conference of the Mathematics Education in the 21st Century Project:
" Reform, Revolution and Paradigm Shifts in Mathematics Education”Johor Bharu, Malaysia
November 25th – December 1st, 2005
Erik De Corte, Fien Depaepe, Peter Op ‘t Eynde &
Lieven VerschaffelCenter for Instructional Psychology and Technology (CIP&T)
University of Leuven, Belgium
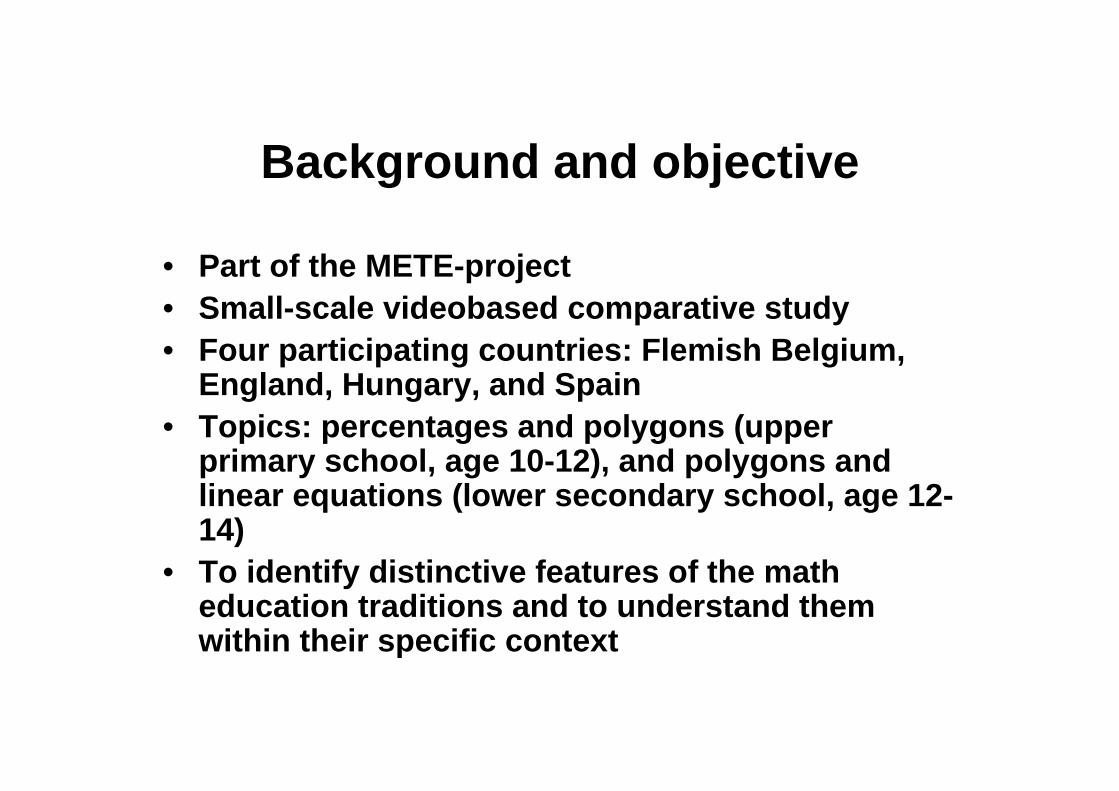
Background and objective
• Part of the METE-project• Small-scale videobased comparative study• Four participating countries: Flemish Belgium,
England, Hungary, and Spain• Topics: percentages and polygons (upper
primary school, age 10-12), and polygons and linear equations (lower secondary school, age 12-14)
• To identify distinctive features of the math education traditions and to understand them within their specific context
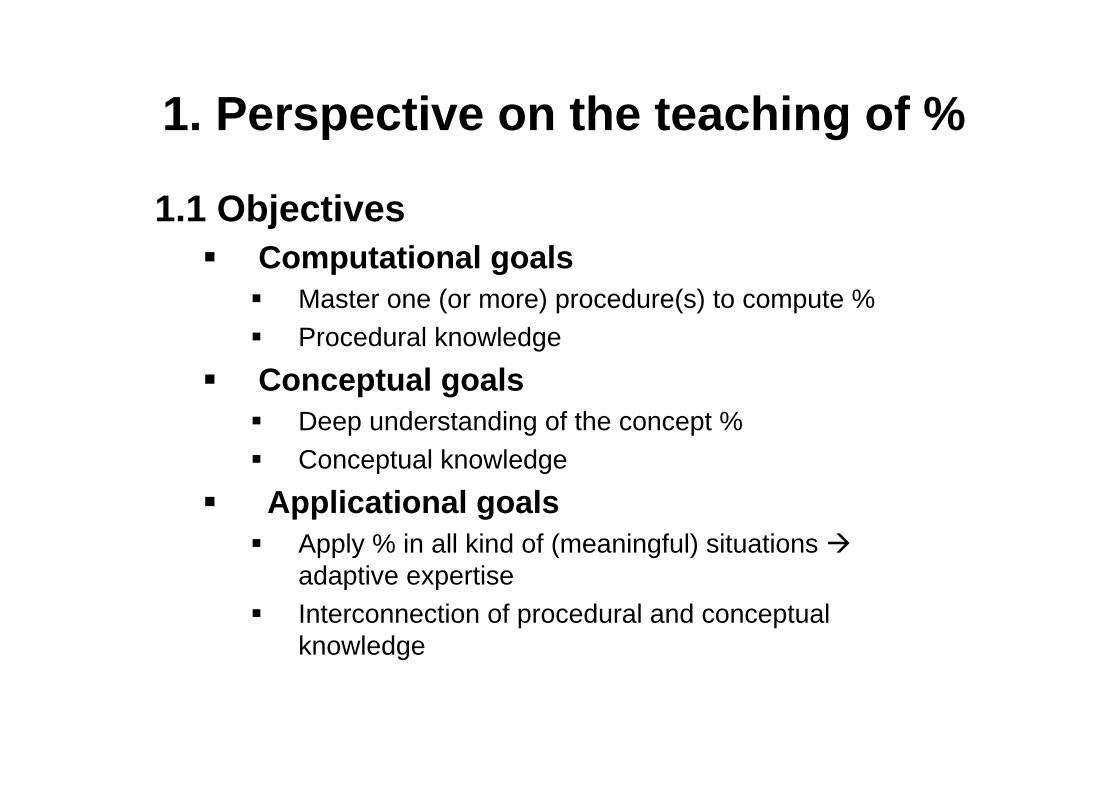
1. Perspective on the teaching of %
1.1 ObjectivesComputational goals
Master one (or more) procedure(s) to compute %Procedural knowledge
Conceptual goalsDeep understanding of the concept %Conceptual knowledge
Applicational goalsApply % in all kind of (meaningful) situations adaptive expertiseInterconnection of procedural and conceptual knowledge
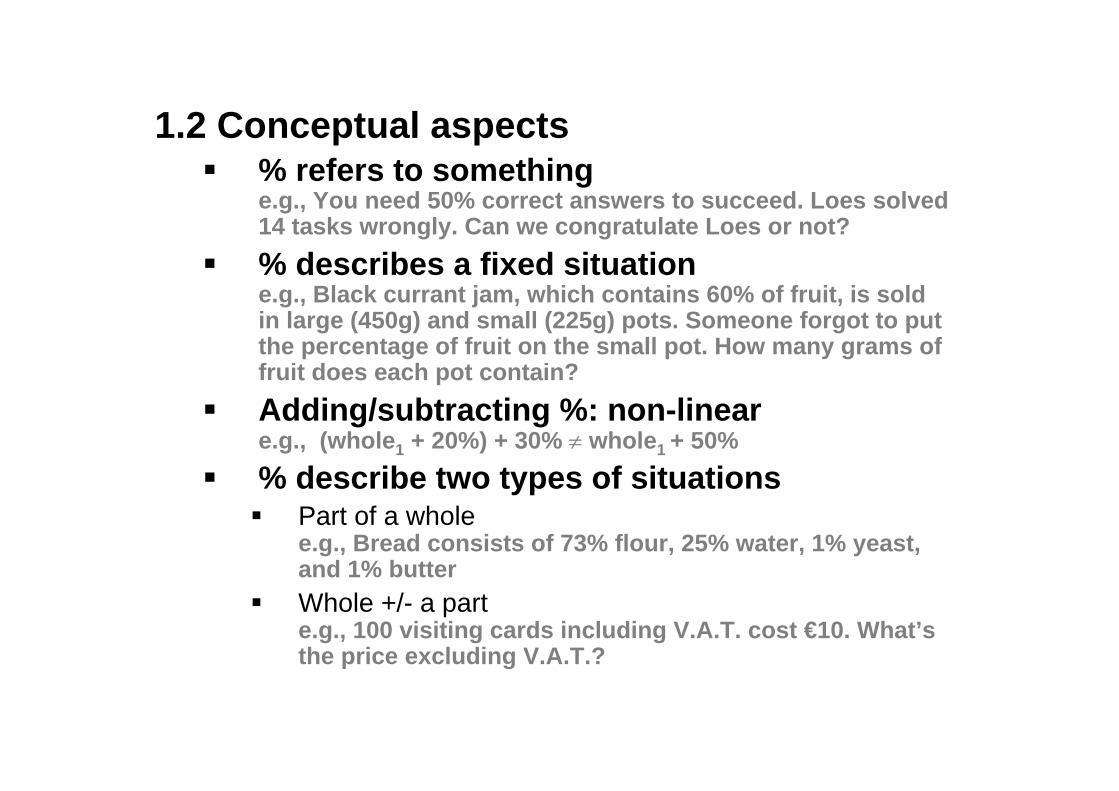
1.2 Conceptual aspects% refers to somethinge.g., You need 50% correct answers to succeed. Loes solved 14 tasks wrongly. Can we congratulate Loes or not?% describes a fixed situatione.g., Black currant jam, which contains 60% of fruit, is sold in large (450g) and small (225g) pots. Someone forgot to put the percentage of fruit on the small pot. How many grams of fruit does each pot contain?Adding/subtracting %: non-lineare.g., (whole1 + 20%) + 30% ≠ whole1 + 50%% describe two types of situations
Part of a wholee.g., Bread consists of 73% flour, 25% water, 1% yeast, and 1% butterWhole +/- a parte.g., 100 visiting cards including V.A.T. cost €10. What’s the price excluding V.A.T.?
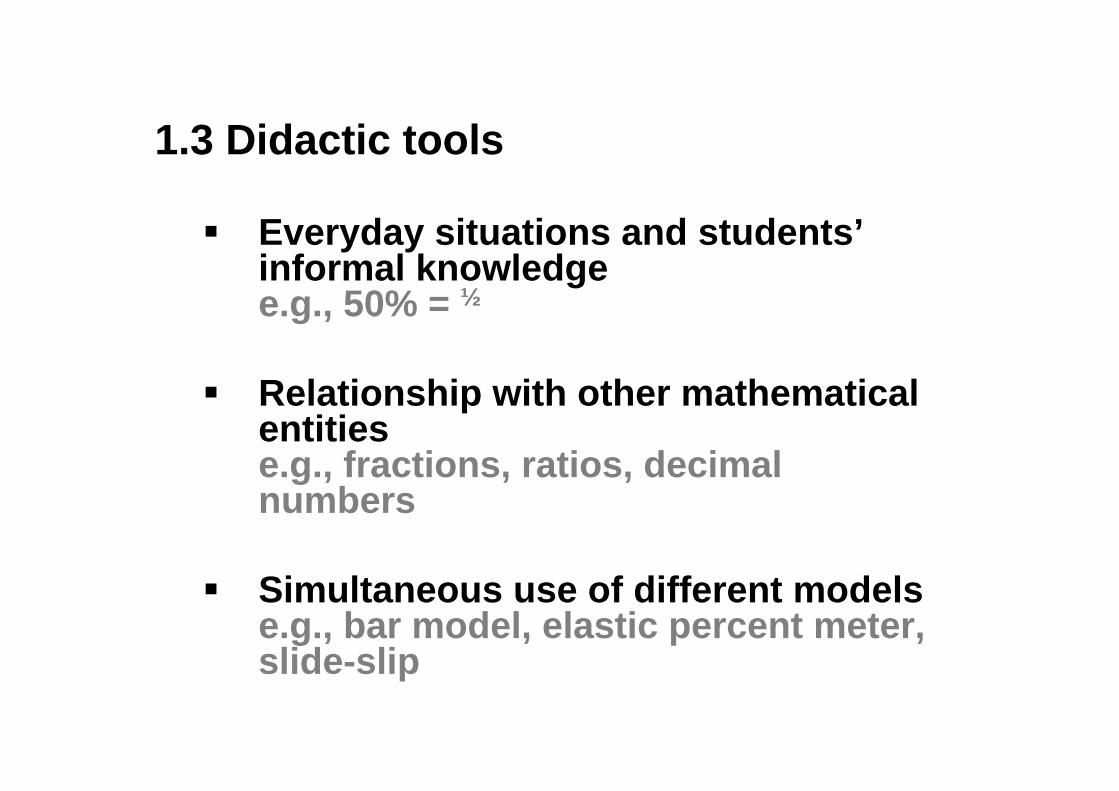
1.3 Didactic tools
Everyday situations and students’informal knowledgee.g., 50% = ½
Relationship with other mathematical entitiese.g., fractions, ratios, decimal numbers
Simultaneous use of different modelse.g., bar model, elastic percent meter, slide-slip
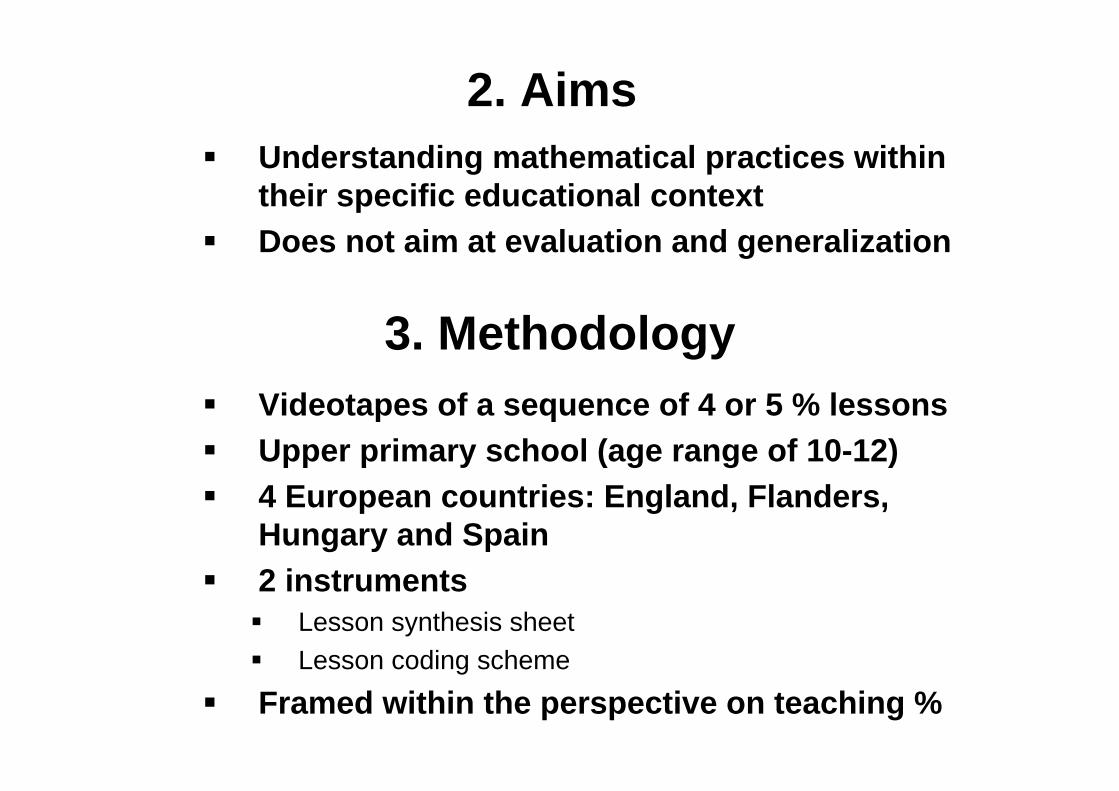
2. AimsUnderstanding mathematical practices within their specific educational contextDoes not aim at evaluation and generalization
3. MethodologyVideotapes of a sequence of 4 or 5 % lessonsUpper primary school (age range of 10-12)4 European countries: England, Flanders, Hungary and Spain2 instruments
Lesson synthesis sheetLesson coding scheme
Framed within the perspective on teaching %

3.1 Methodology• Videotapes of a sequence of 4 or 5 percentage
lessons in each participating country• Teachers were representative of good but not
exceptional teaching practices in their country• Collection of information about the local context• 2 analysing schemes: a lesson coding scheme
and a lesson synthesis sheet:based on live observations spread over one week of a series of lessons by members of the four country teams in each country (including videotaping)
• Results were subjected to a Mann-Whitney U-test: to determine the influence of the approach
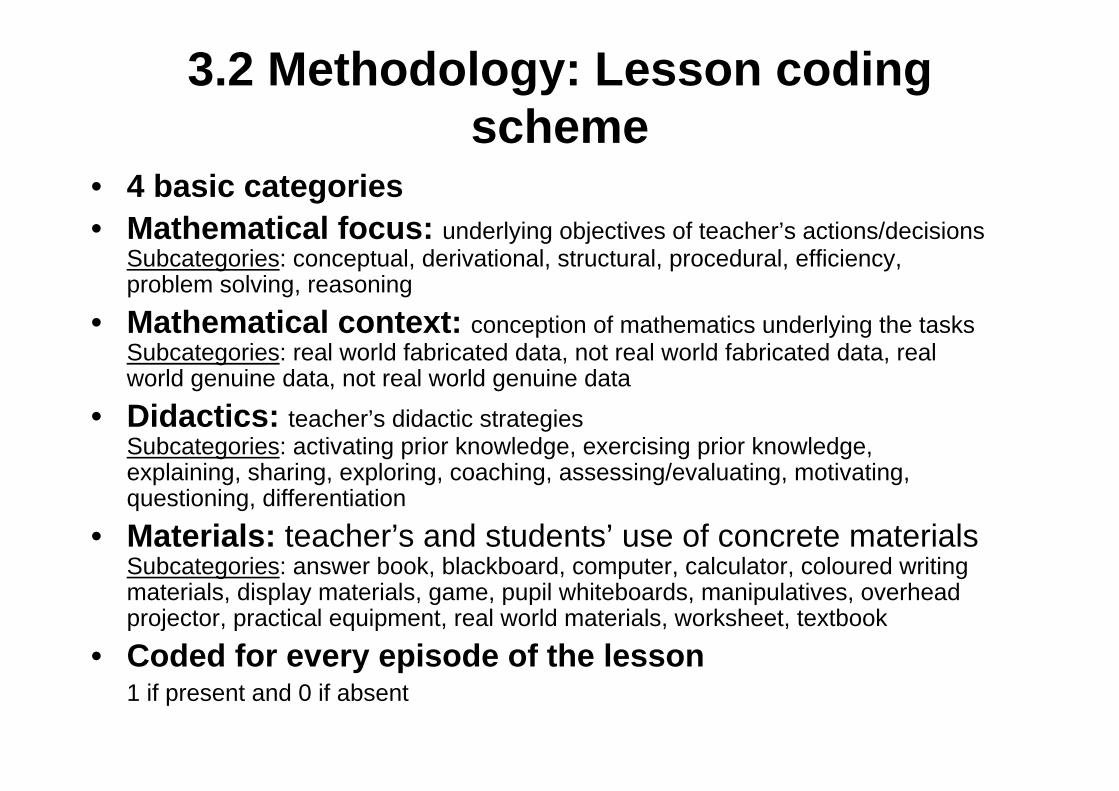
3.2 Methodology: Lesson coding scheme
• 4 basic categories• Mathematical focus: underlying objectives of teacher’s actions/decisions
Subcategories: conceptual, derivational, structural, procedural, efficiency, problem solving, reasoning
• Mathematical context: conception of mathematics underlying the tasksSubcategories: real world fabricated data, not real world fabricated data, real world genuine data, not real world genuine data
• Didactics: teacher’s didactic strategiesSubcategories: activating prior knowledge, exercising prior knowledge, explaining, sharing, exploring, coaching, assessing/evaluating, motivating, questioning, differentiation
• Materials: teacher’s and students’ use of concrete materialsSubcategories: answer book, blackboard, computer, calculator, coloured writing materials, display materials, game, pupil whiteboards, manipulatives, overhead projector, practical equipment, real world materials, worksheet, textbook
• Coded for every episode of the lesson1 if present and 0 if absent
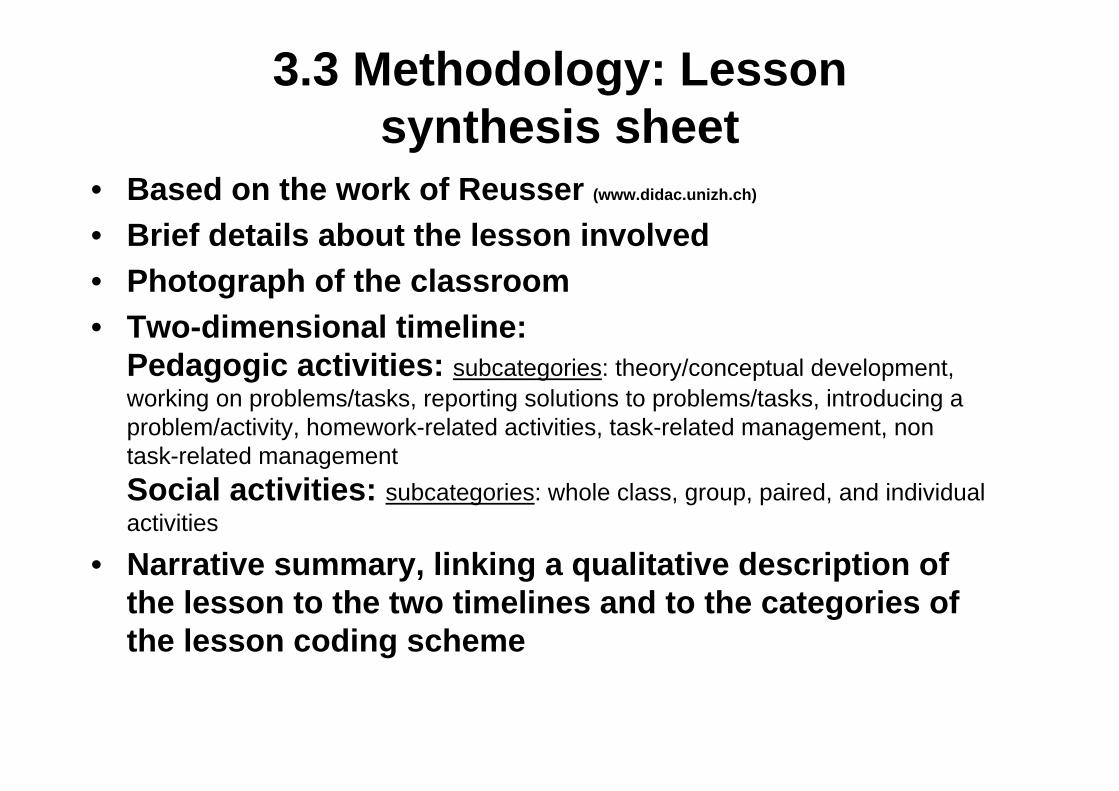
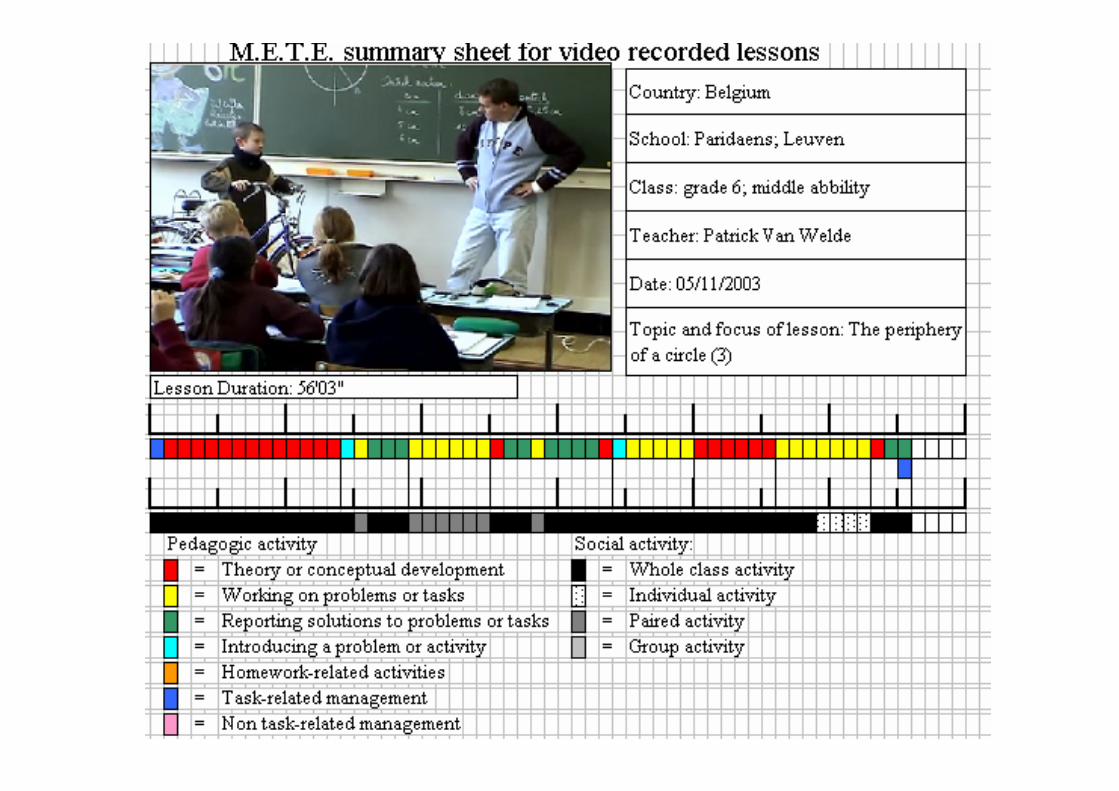
3.3 Methodology: Lesson synthesis sheet
• Based on the work of Reusser (www.didac.unizh.ch)
• Brief details about the lesson involved• Photograph of the classroom• Two-dimensional timeline:
Pedagogic activities: subcategories: theory/conceptual development, working on problems/tasks, reporting solutions to problems/tasks, introducing a problem/activity, homework-related activities, task-related management, non task-related managementSocial activities: subcategories: whole class, group, paired, and individual activities
• Narrative summary, linking a qualitative description of the lesson to the two timelines and to the categories of the lesson coding scheme
4. Results
4.1 Analyses of the lesson coding schemes

Similarities: A lot of time spent on: working on and reporting solutions to problems/tasksLess time spent on: introducing a problem/activity, task-related and non task-related management
Differences: Great difference in theory/conceptual development, homework-related activities
Pedagogic activities
0% 20% 40% 60% 80% 100%
Flanders
England
Hungary
Spain
Theory or conceptualdevelopment
Working on problems or tasks
Reporting solutions to problems ortasks
Introducing a problem or activity
Homew ork-related activities
Task-related management
Non task-related management

Similarities: Whole class activities are dominant; working on individual activities have the second highest frequency
Differences: No paired and group activities in the Hungarian lessons.
Social activities
0% 20% 40% 60% 80% 100%
Flanders
England
Hungary
Spain
Whole class activity
Individual activity
Paired activity
Group activity
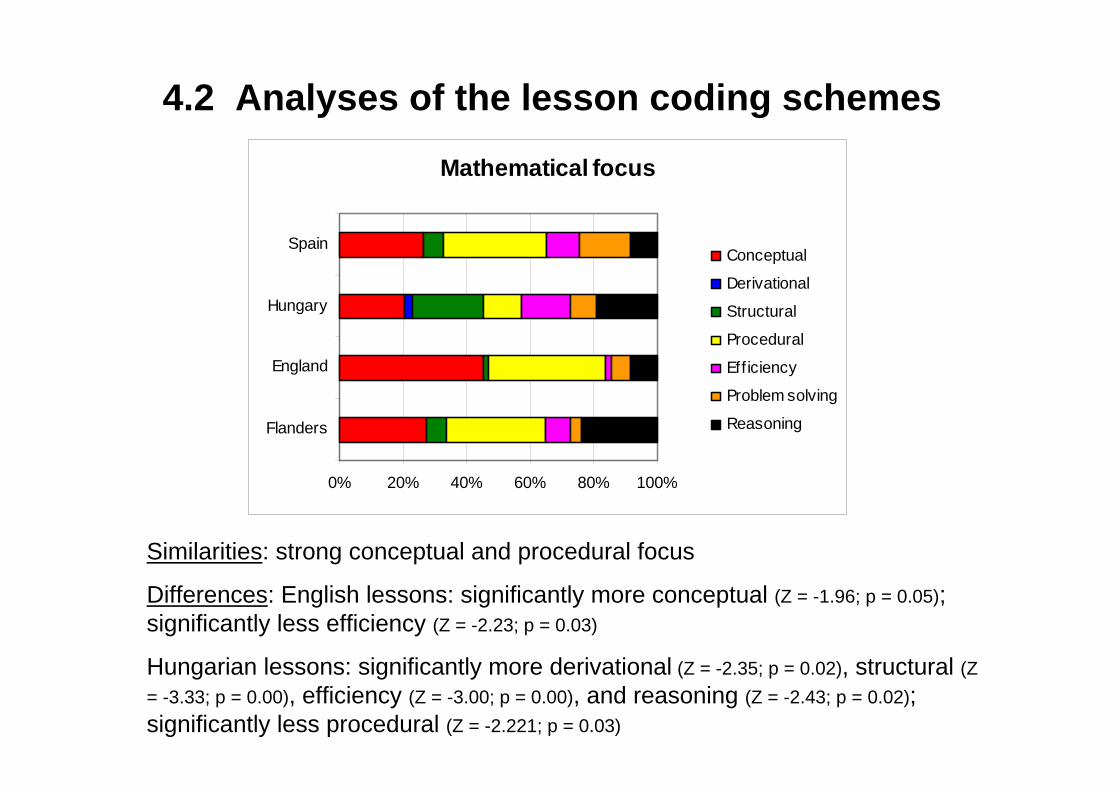
4.2 Analyses of the lesson coding schemes
Mathematical focus
0% 20% 40% 60% 80% 100%
Flanders
England
Hungary
SpainConceptual
Derivational
Structural
Procedural
Eff iciency
Problem solving
Reasoning
Similarities: strong conceptual and procedural focus
Differences: English lessons: significantly more conceptual (Z = -1.96; p = 0.05); significantly less efficiency (Z = -2.23; p = 0.03)
Hungarian lessons: significantly more derivational (Z = -2.35; p = 0.02), structural (Z = -3.33; p = 0.00), efficiency (Z = -3.00; p = 0.00), and reasoning (Z = -2.43; p = 0.02); significantly less procedural (Z = -2.221; p = 0.03)
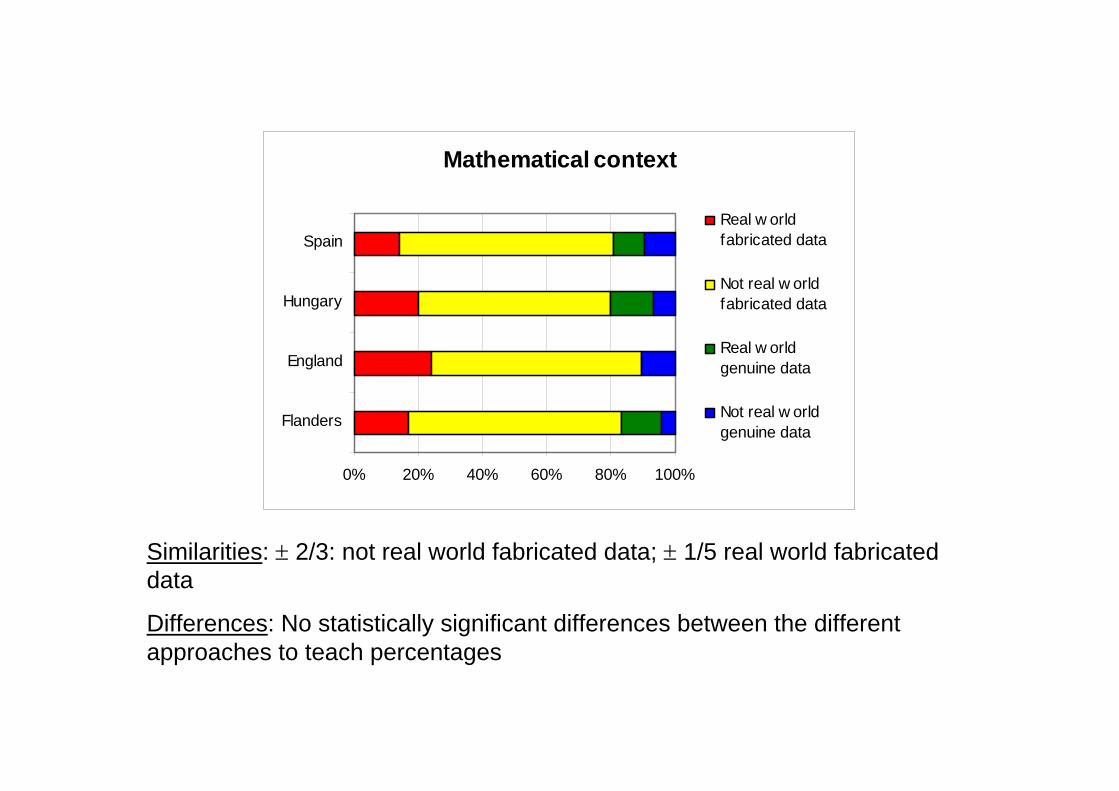
Similarities: ± 2/3: not real world fabricated data; ± 1/5 real world fabricated data
Differences: No statistically significant differences between the differentapproaches to teach percentages
Mathematical context
0% 20% 40% 60% 80% 100%
Flanders
England
Hungary
SpainReal w orldfabricated data
Not real w orldfabricated data
Real w orldgenuine data
Not real w orldgenuine data
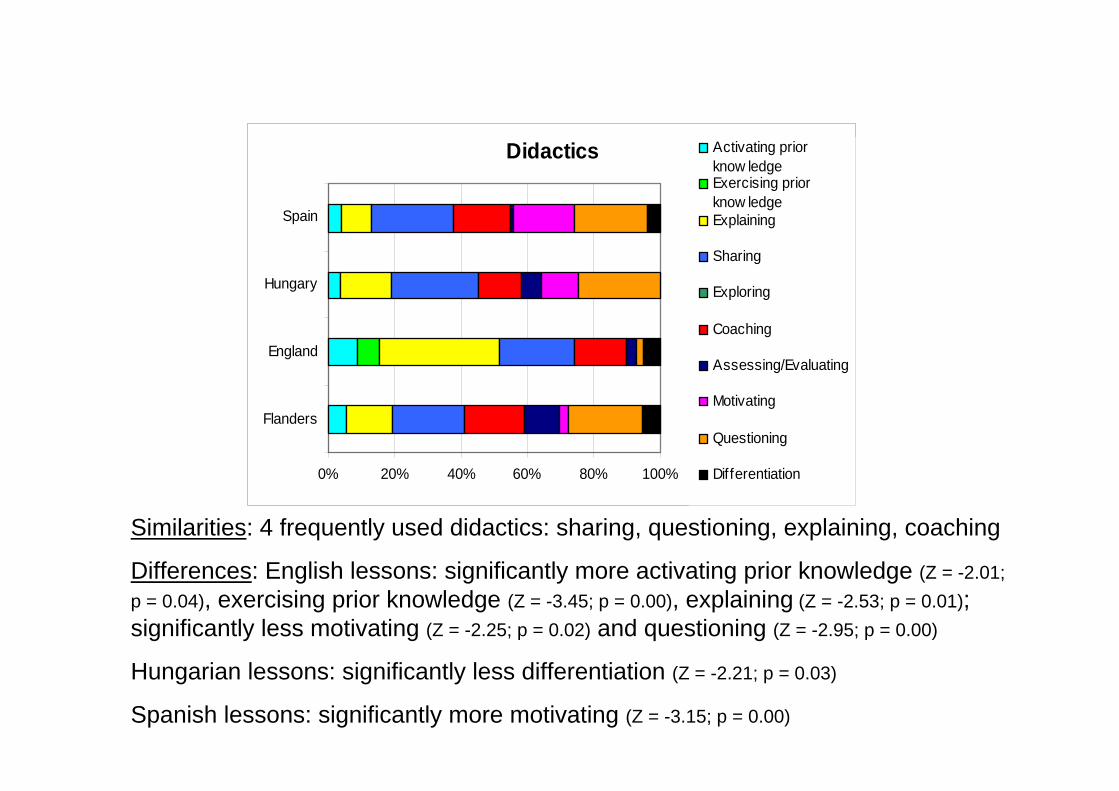
Similarities: 4 frequently used didactics: sharing, questioning, explaining, coaching
Differences: English lessons: significantly more activating prior knowledge (Z = -2.01; p = 0.04), exercising prior knowledge (Z = -3.45; p = 0.00), explaining (Z = -2.53; p = 0.01); significantly less motivating (Z = -2.25; p = 0.02) and questioning (Z = -2.95; p = 0.00)
Hungarian lessons: significantly less differentiation (Z = -2.21; p = 0.03)
Spanish lessons: significantly more motivating (Z = -3.15; p = 0.00)
Didactics
0% 20% 40% 60% 80% 100%
Flanders
England
Hungary
Spain
Activating priorknow ledgeExercising priorknow ledgeExplaining
Sharing
Exploring
Coaching
Assessing/Evaluating
Motivating
Questioning
Differentiation
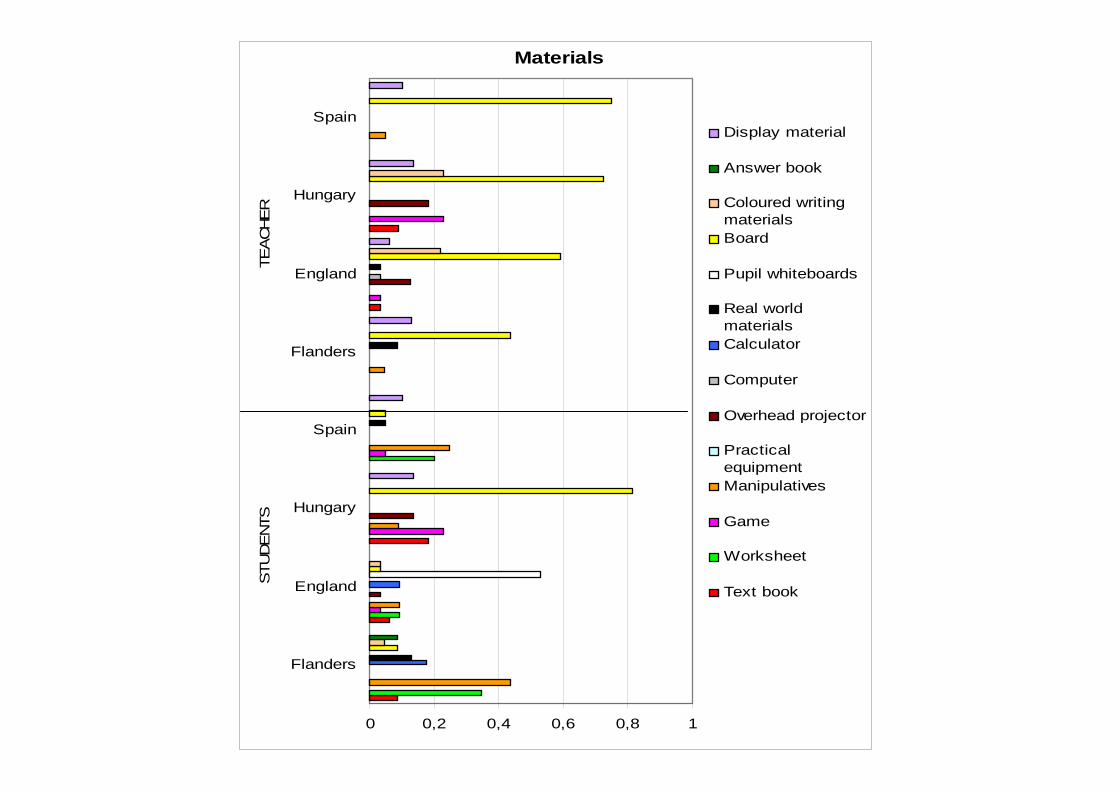
Materials
0 0,2 0,4 0,6 0,8 1
Flanders
England
Hungary
Spain
Flanders
England
Hungary
Spain
STU
DE
NTS
TEA
CH
ER
Display material
Answer book
Coloured writingmaterialsBoard
Pupil whiteboards
Real worldmaterialsCalculator
Computer
Overhead projector
PracticalequipmentManipulatives
Game
Worksheet
Text book
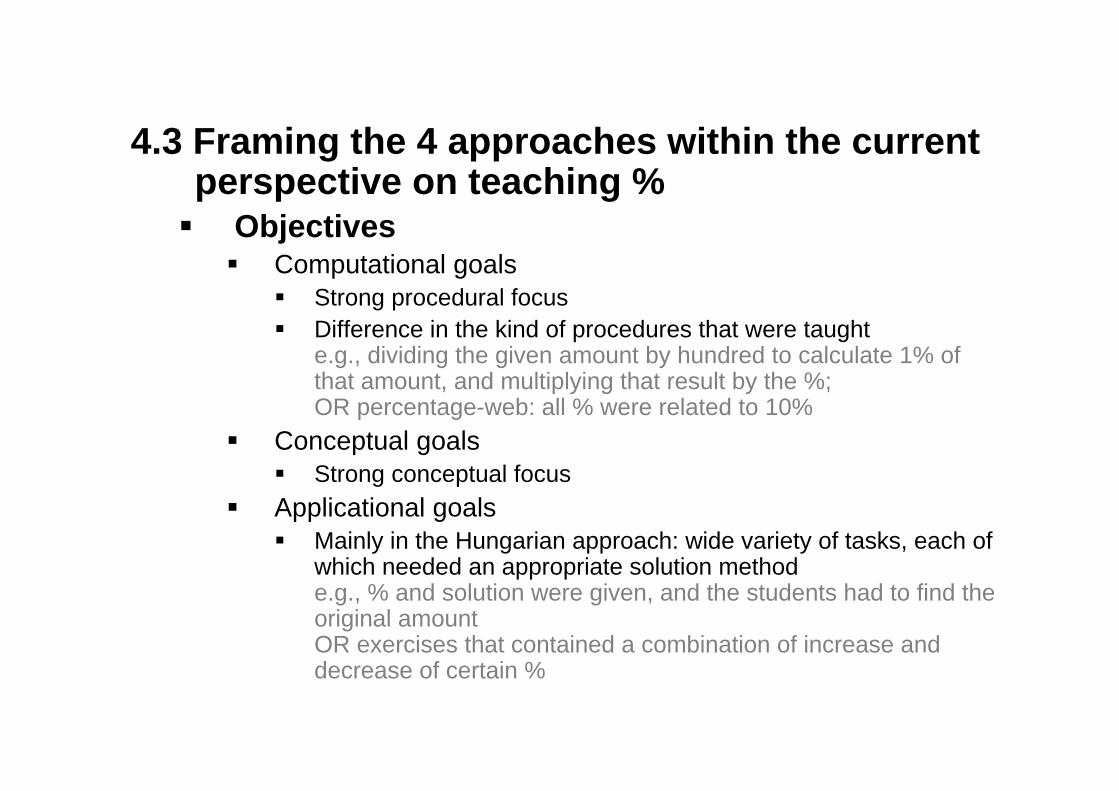
4.3 Framing the 4 approaches within the current perspective on teaching %
ObjectivesComputational goals
Strong procedural focusDifference in the kind of procedures that were taughte.g., dividing the given amount by hundred to calculate 1% of that amount, and multiplying that result by the %;OR percentage-web: all % were related to 10%
Conceptual goalsStrong conceptual focus
Applicational goalsMainly in the Hungarian approach: wide variety of tasks, each ofwhich needed an appropriate solution methode.g., % and solution were given, and the students had to find the original amountOR exercises that contained a combination of increase and decrease of certain %
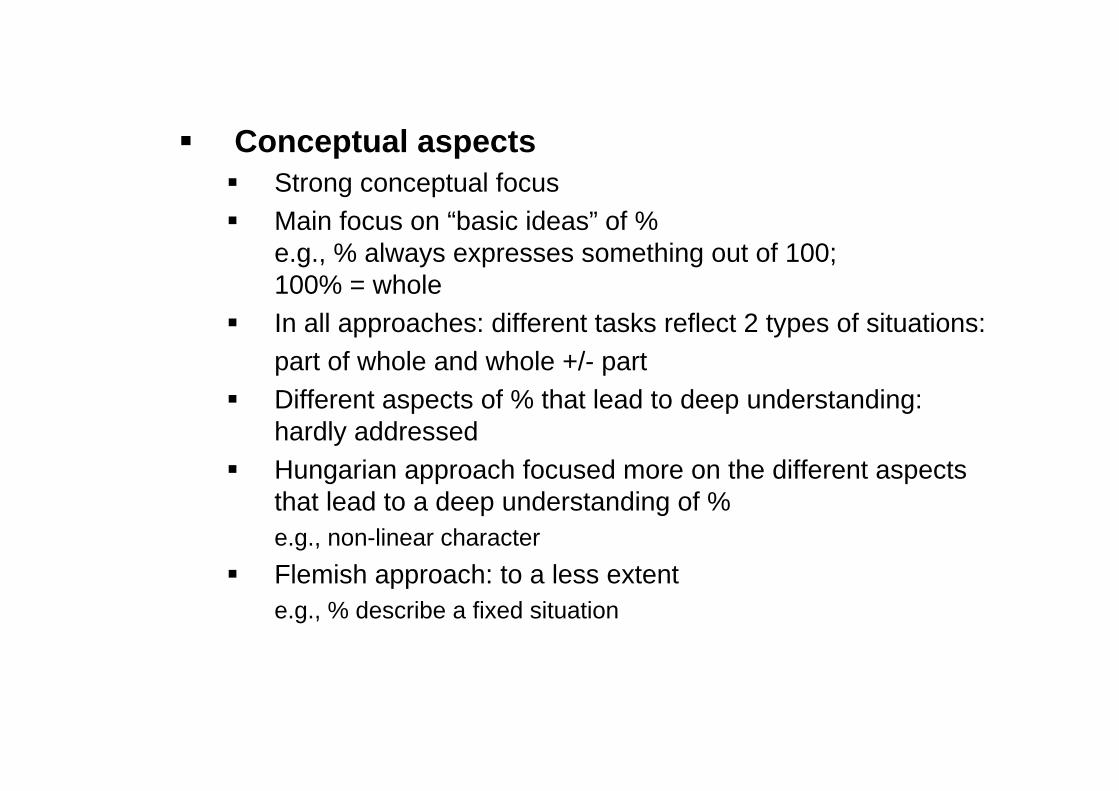
Conceptual aspectsStrong conceptual focusMain focus on “basic ideas” of %e.g., % always expresses something out of 100; 100% = whole In all approaches: different tasks reflect 2 types of situations:part of whole and whole +/- partDifferent aspects of % that lead to deep understanding: hardly addressedHungarian approach focused more on the different aspects that lead to a deep understanding of %e.g., non-linear characterFlemish approach: to a less extente.g., % describe a fixed situation

Didactic toolsEveryday situations and students’ informal knowledge
When introducing the concepte.g., salesOnly to a small extent: real world genuine data and real world materials
Relationship with other mathematical entitiesFractions in all approachesHungarian approach: decimals, degrees of a circlee.g., How many degrees equal 1% of a circle?
ModelsManipulatives in all approachese.g., MAB-material, place-value cardsModels: ten by ten grid (F, H,S); pie chart model (E,H); arrow scheme (F,H)
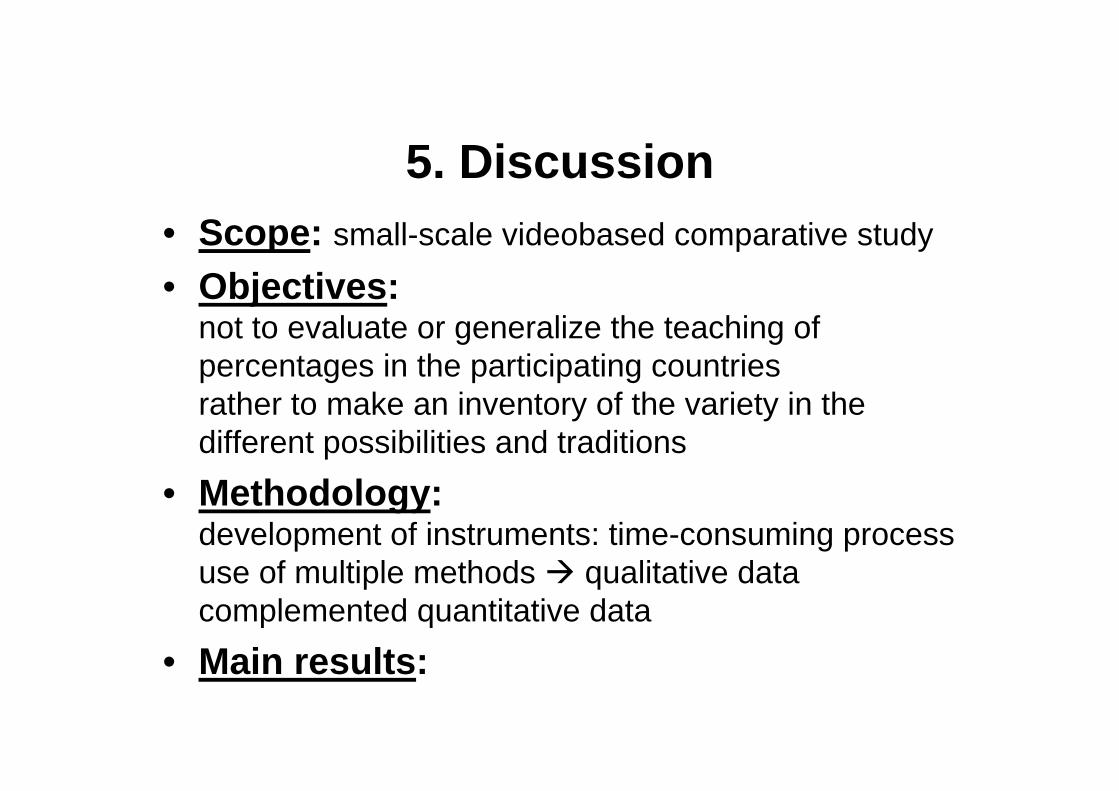
5. Discussion• Scope: small-scale videobased comparative study
• Objectives: not to evaluate or generalize the teaching of percentages in the participating countries rather to make an inventory of the variety in the different possibilities and traditions
• Methodology: development of instruments: time-consuming processuse of multiple methods qualitative data complemented quantitative data
• Main results:

BoardBoardColoured writing materials
BoardGame
BoardMaterials Teacher
Whole class activityIndividual activity
Whole class activityWhole class activityWhole class activitySocial activities
Working on problems/tasksTheory/conceptual developmentReporting solutions
Working on problems/tasksReporting solutions
Working on problems/tasksReporting solutionsHomework related activities
Theory/conceptual developmentWorking on problems/tasks
Pedagogic activities
ManipulativesWorksheet
WhiteboardsBoardGame
ManipulativesWorksheet
MaterialsStudents
SharingQuestioningCoaching
ExplainingSharing
SharingQuestioning
SharingQuestioningMotivatingCoaching
Didactics
Not real world fabricated data
Not real world fabricated data
Not real world fabricated data
Not real world fabricated data
Mathematical context
ProceduralConceptualReasoning
ConceptualProcedural
StructuralConceptualReasoningEfficiency
ProceduralConceptual
Mathematical focus
FLANDERSENGLANDHUNGARYSPAIN