Embed Size (px)
Citation preview

Prepared in cooperation with the Illinois Department of Natural Resources and the U.S. Environmental Protection Agency-Great Lakes National Program Office
Comparison of Benthos and Plankton for Waukegan Harbor Area of Concern, Illinois, and Burns Harbor-Port of Indiana Non-Area of Concern, Indiana, in 2015
Scientific Investigations Report 2017–5039
U.S. Department of the InteriorU.S. Geological Survey

Cover. Waukegan Harbor, Illinois, in February 2015.

Comparison of Benthos and Plankton for Waukegan Harbor Area of Concern, Illinois, and Burns Harbor-Port of Indiana Non-Area of Concern, Indiana, in 2015By Barbara C. Scudder Eikenberry, Hayley A. Templar, Daniel J. Burns, Edward G. Dobrowolski, and Kurt L. Schmude
Prepared in cooperation with the Illinois Department of Natural Resources and the U.S. Environmental Protection Agency-Great Lakes National Program Office
Scientific Investigations Report 2017–5039
U.S. Department of the InteriorU.S. Geological Survey

U.S. Department of the InteriorRYAN K. ZINKE, Secretary
U.S. Geological SurveyWilliam H. Werkheiser, Acting Director
U.S. Geological Survey, Reston, Virginia: 2017
For more information on the USGS—the Federal source for science about the Earth, its natural and living resources, natural hazards, and the environment—visit https://www.usgs.gov or call 1–888–ASK–USGS.
For an overview of USGS information products, including maps, imagery, and publications, visit https://store.usgs.gov.
Any use of trade, firm, or product names is for descriptive purposes only and does not imply endorsement by the U.S. Government.
Although this information product, for the most part, is in the public domain, it also may contain copyrighted materials as noted in the text. Permission to reproduce copyrighted items must be secured from the copyright owner.
Suggested citation:Scudder Eikenberry, B.C., Templar, H.A., Burns, D.J., Dobrowolski, E.G., and Schmude, K.L., 2017, Comparison of benthos and plankton for Waukegan Harbor Area of Concern, Illinois, and Burns Harbor-Port of Indiana non-Area of Concern, Indiana, in 2015: U.S. Geological Survey Scientific Investigations Report 2017–5039, 29 p., https://doi.org/10.3133/sir20175039.
ISSN 2328–0328 (online)

iii
Acknowledgments
This study was done in cooperation with the Illinois Department of Natural Resources (IDNR)—Coastal Management Program and the U.S. Environmental Protection Agency (EPA), with Great Lakes Restoration Initiative funding from the EPA Great Lakes National Program Office. The authors wish to thank many individuals who helped with the project. Scott Cieniawski, our EPA Project Manager, William Bolen and John Perrecone (EPA), and Diane Tecic and Ania Ruszaj of the IDNR assisted with study planning and sampling logistics; Ania Ruszaj also assisted with August sample collection and field processing at Waukegan Harbor. Glenn Warren, Elizabeth Hinchey Malloy, and Megan O’Brien (EPA), as well as Diane Tecic (IDNR), provided comments on an earlier manuscript version. We thank Mr. Douglas Larsen of Larsen Marine for allowing access to the Waukegan north harbor pier for deployment of Hester-Dendy invertebrate sam-plers, and we thank the Waukegan Port District for harbor access and assistance with sampling logistics. We greatly appreciate the Ports of Indiana in granting us access to Burns Harbor, and we thank Nikolas Szymarek, Operations Manager with the Ports of Indiana, for help with logistics and sample collection at Burns Harbor. The Lake Superior Research Institute at the Uni-versity of Wisconsin-Superior identified and enumerated benthos; EnviroScience, Inc. identified and enumerated plankton. The Wisconsin State Laboratory of Hygiene analyzed water samples for chlorophyll-a and total/volatile suspended solids and sediment samples for particle size frac-tions of sand, silt, and clay. Sara Thomas (Illinois Natural History Survey) provided helpful input during study planning and report preparation. The Waukegan Harbor Citizen’s Advisory Group and their chair, Susie Schreiber, provided valuable background to us about Waukegan Harbor.
Several USGS personnel made contributions of particular note. Ryan Adams and Cheryl Silcox assisted with deployments of Hester-Dendy artificial substrate samplers in Illinois and Indiana, respectively; Clint Bailey and Matthew Peterson assisted with sample collection and field processing at Waukegan Harbor in June and August, respectively. Leah Kammel and James Kennedy assisted in initial preparation of figures 1 and 2, respectively. James Larson and Mary Anne Evans provided comments on an earlier manuscript version. Jonas Casey-Williams and Stephanie St. Amand completed the editorial review, and Susan Gentner and Sarah Hubbard completed the figures and layout.


v
Contents
Acknowledgments ........................................................................................................................................iiiAbstract ...........................................................................................................................................................1Introduction.....................................................................................................................................................2Study Areas.....................................................................................................................................................2Methods...........................................................................................................................................................4
Sample Collection and Processing ....................................................................................................4Data Analysis .......................................................................................................................................10
Physical and Chemical Comparisons Between Waukegan and Burns Harbors ...............................10Condition of the Benthos and Plankton Communities ...........................................................................12
Benthos Community Comparisons Between Waukegan and Burns Harbors ..........................12Plankton Community Comparisons Between Waukegan and Burns Harbors ..........................17
Quality Assurance........................................................................................................................................24Comparison to Historical Data ...................................................................................................................24Summary and Conclusions .........................................................................................................................25References Cited..........................................................................................................................................27
Figures
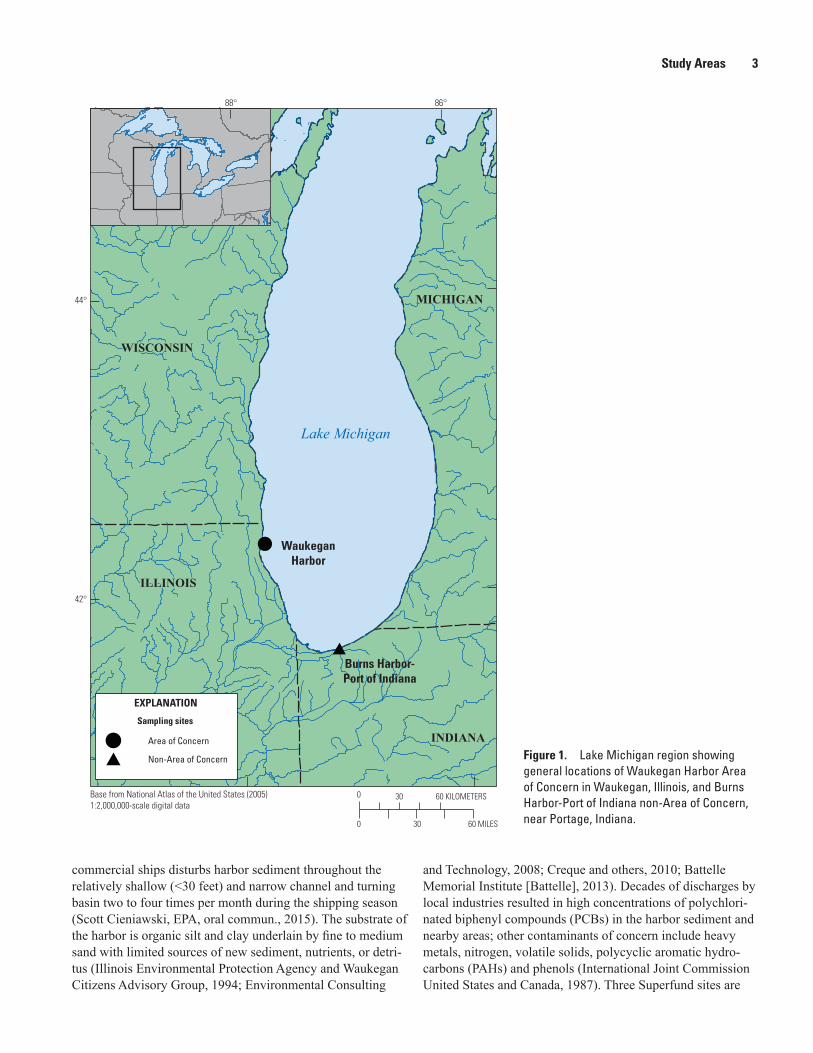
1. Map of Lake Michigan region showing general locations of Waukegan Harbor Area of Concern in Waukegan, Illinois, and Burns Harbor-Port of Indiana non-Area of Concern, near Portage, Indiana ...........................................................................3
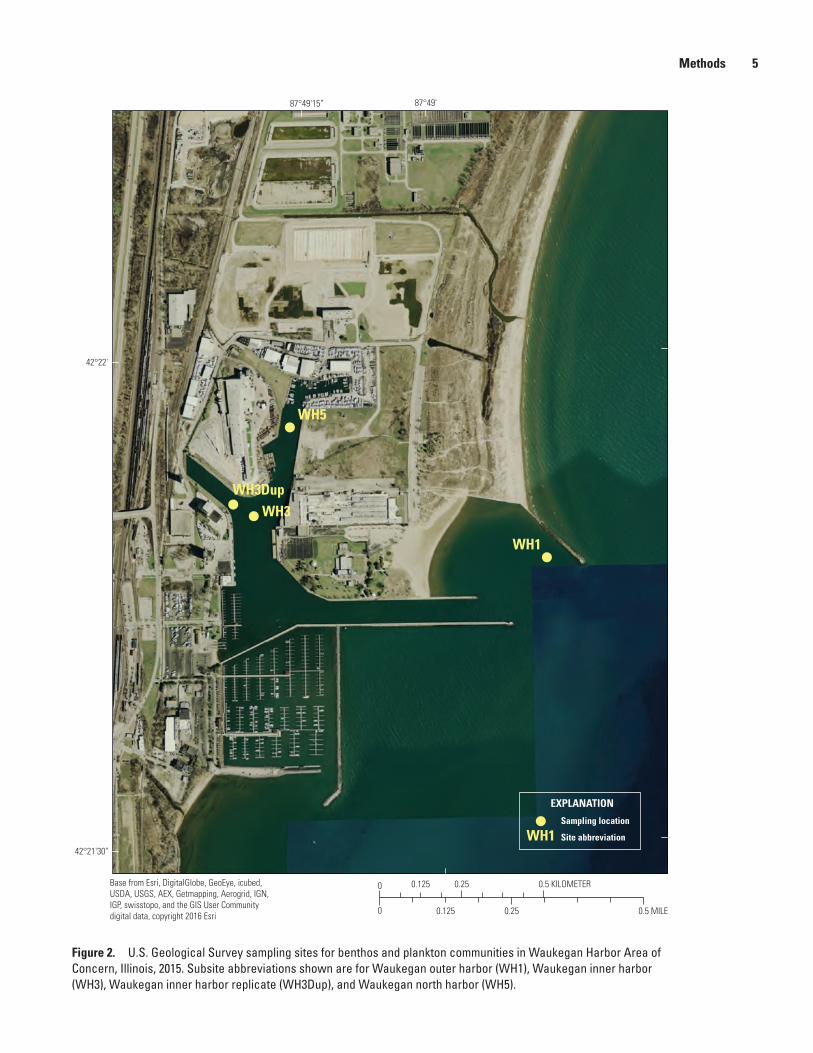
2. Map of U.S. Geological Survey sampling sites for benthos and plankton communities in Waukegan Harbor Area of Concern, Illinois, 2015 ......................................5
3. Map of U.S. Geological Survey sampling sites for benthos and plankton communities in Burns Harbor-Port of Indiana non-Area of Concern, Indiana, 2015 .........6
4. Photograph showing Ponar® dredge sampler containing bottom sediment being emptied and rinsed into a cooler for compositing into a single sample per location with subsequent subsampling for benthos community, particle-size fractionation, and volatile-on-ignition samples .......................................................................7
5. Photograph showing A, Hester-Dendy artificial substrate samplers being removed from a cement block and placed into a plastic bucket for later compositing and processing of attached benthic invertebrates. B, Close-up image of Hester-Dendy samplers after 6 weeks deployment ................................................................7
6. Photograph showing the processing of two types of benthos samples at Waukegan Harbor, Illinois: on the left, invertebrates being removed from plates of Hester-Dendy artificial substrate samplers prior to being sieved; on the right, invertebrates in composited sediment from Ponar® dredge samplers being removed from large rocks and debris during sieving .............................................................8
7. Photograph showing a plankton net being washed to collect a zooplankton community sample ........................................................................................................................9
8. Photograph showing a Kemmerer™ vertical water sampler being deployed in Burns Harbor, Indiana, for sampling at 1-liter intervals, with subsequent compositing and subsampling for phytoplankton community, chlorophyll-a, and suspended solids ..........................................................................................................................9

vi
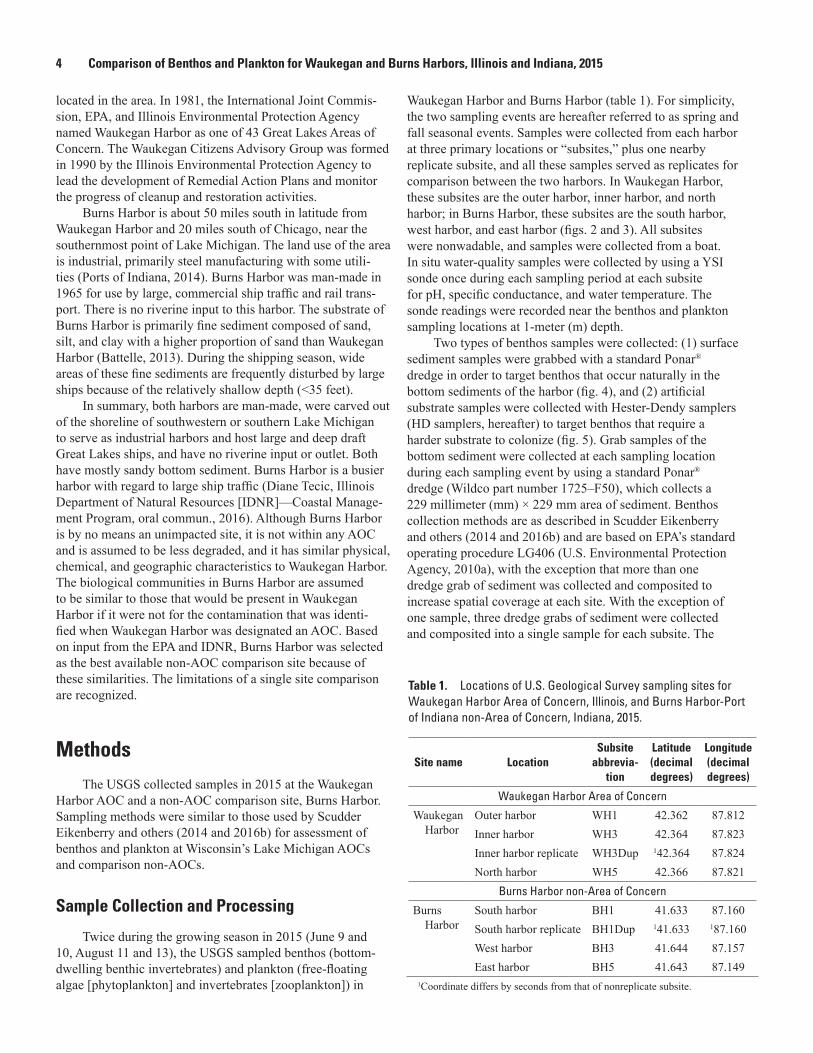
9. Bar plots of richness and diversity metrics for benthos communities for A, dredge samples, B, Hester-Dendy (HD) artificial substrate samples, and C, combined (dredge and HD) samples collected at Waukegan Harbor Area of Concern, Illinois, and Burns Harbor-Port of Indiana non-Area of Concern, Indiana, 2015 ...........................14
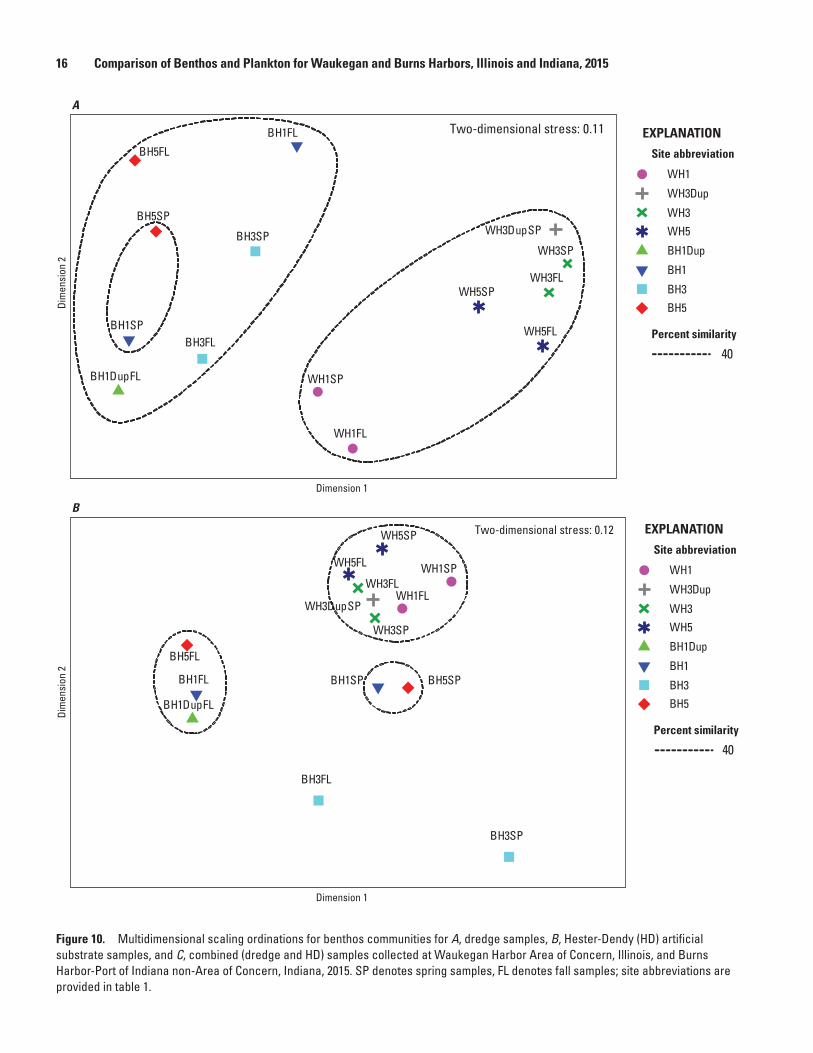
10. Multidimensional scaling ordinations for benthos communities for A, dredge samples, B, Hester-Dendy (HD) artificial substrate samples, and C, combined (dredge and HD) samples collected at Waukegan Harbor Area of Concern, Illinois, and Burns Harbor-Port of Indiana non-Area of Concern, Indiana, 2015 ...........................16
11. Bar plots of richness and diversity metrics for zooplankton communities collected at Waukegan Harbor Area of Concern, Illinois, and Burns Harbor-Port of Indiana non-Area of Concern, Indiana, 2015 .....................................................................19
12. Multidimensional scaling ordinations for zooplankton communities collected at Waukegan Harbor Area of Concern, Illinois, and Burns Harbor-Port of Indiana non-Area of Concern, Indiana, 2015 ..........................................................................20
13. Bar plots of richness and diversity metrics for phytoplankton communities for A, diatoms, B, soft algae, and C, combined (diatoms and soft algae) phytoplankton samples collected at Waukegan Harbor Area of Concern, Illinois, and Burns Harbor-Port of Indiana non-Area of Concern, Indiana, 2015 ...............................................21
14. Multidimensional scaling ordinations for phytoplankton communities for A, diatoms, B, soft algae, and C, combined (diatom and soft algae) phytoplankton samples collected Waukegan Harbor Area of Concern, Illinois, and Burns Harbor-Port of Indiana non-Area of Concern, Indiana, 2015 ...............................................22
Tables
1. Locations of U.S. Geological Survey sampling sites for Waukegan Harbor Area of Concern, Illinois, and Burns Harbor-Port of Indiana non-Area of Concern, Indiana, 2015 ..................................................................................................................................4
2. Mean and standard deviation values for water quality measurements made in situ with a YSI sonde at approximately 1-meter depth in 2015 at Waukegan Harbor Area of Concern, Illinois, and Burns Harbor-Port of Indiana non-Area of Concern, Indiana ..........................................................................................................................................11
3. Mean and standard deviation values for particle size and volatile-on-ignition solids in bottom sediment for Waukegan Harbor Area of Concern, Illinois, and Burns Harbor-Port of Indiana non-Area of Concern, Indiana, 2015 ...................................11
4. Mean and standard deviation values for chlorophyll-a, total suspended solids, and volatile suspended solids for composited water samples from Waukegan Harbor Area of Concern, Illinois, and Burns Harbor-Port of Indiana non-Area of Concern, Indiana, 2015 ...............................................................................................................12
5. Richness, diversity, and Index of Biotic Integrity values for benthos communities collected at Waukegan Harbor Area of Concern, Illinois, and Burns Harbor-Port of Indiana non-Area of Concern, Indiana, 2015 ..........................................................................13
6. Richness and diversity values for plankton communities collected at Waukegan Harbor Area of Concern, Illinois, and Burns Harbor-Port of Indiana non-Area of Concern, Indiana, 2015 ...............................................................................................................18
7. Quality assurance and quality control results for replicate samples of benthos and plankton collected in 2015 at Waukegan Harbor Area of Concern, Illinois, and Burns Harbor-Port of Indiana non-Area of Concern, Indiana, showing similarity for relative abundance of taxa collected within each season ..........................24

vii
Conversion Factors
International System of Units to U.S. customary units
Multiply By To obtain
Length
micrometer (µm) 0.00003937 inch (in)millimeter (mm) 0.03937 inch (in)centimeter (cm) 0.3937 inch (in)meter (m) 3.281 foot (ft) kilometer (km) 0.6214 mile (mi)
Area
square kilometer (km2) 0.3861 square mile (mi2)Volume
liter (L) 1.057 quart (qt)
Temperature in degrees Celsius (°C) may be converted to degrees Fahrenheit (°F) as follows:
°F = (1.8 × °C) + 32.
Datum
Horizontal coordinate information is referenced to the North American Datum of 1983 (NAD 83).
Supplemental Information
Concentrations of chemical constituents in water are given in either milligrams per liter (mg/L) or micrograms per liter (µg/L). Algal densities are given in cubic micrometers per milliliter (µm3/mL).
Specific conductance is given in microsiemens per centimeter at 25 degrees Celsius (µS/cm at 25 °C).
Abbreviations
ANOSIM analysis of similarity
AOC Area of Concern
BUI Beneficial Use Impairment
EPA U.S. Environmental Protection Agency

viii
HD Hester-Dendy [artificial substrate sampler]
IBI Index of Biotic Integrity
IDNR Illinois Department of Natural Resources
LSRI Lake Superior Research Institute, University of Wisconsin-Superior
MDS multidimensional scaling
PCBs polychlorinated biphenyl compounds
QA/QC quality assurance and quality control
SIMPER similarity percentage
TSS total suspended solids
USGS U.S. Geological Survey
VSS volatile suspended solids

Comparison of Benthos and Plankton for Waukegan Harbor Area of Concern, Illinois, and Burns Harbor-Port of Indiana Non-Area of Concern, Indiana, in 2015
By Barbara C. Scudder Eikenberry,1 Hayley A. Templar,1 Daniel J. Burns,1 Edward G. Dobrowolski,1 and Kurt L. Schmude2
AbstractDuring two seasonal sampling events in spring (June) and
fall (August) of 2015, the U.S. Geological Survey collected benthos (benthic invertebrates) and plankton (zooplankton and phytoplankton) at three sites each in the Waukegan Harbor Area of Concern (AOC) in Illinois and in Burns Harbor-Port of Indiana, a non-AOC comparison site in Indiana. The study was done in cooperation with the U.S. Environmental Protec-tion Agency and the Illinois Department of Natural Resources. Samples were collected concurrently for physical and chemi-cal parameters (specific conductance, temperature, pH, dis-solved oxygen, chlorophyll-a, total and volatile suspended solids in water samples; particle size and volatile-on-ignition solids of sediment in dredge samples). The purpose of the study was to assess whether or not aquatic communities at the AOC were degraded in comparison to communities at the non-AOC, which was presumed to be less impaired than the AOC. Benthos were collected by using Hester-Dendy artificial substrate samplers and a Ponar® dredge sampler to collect composited grabs of bottom sediment; zooplankton were collected by using tows from depth to the surface with a 63-micrometer mesh plankton net; phytoplankton were collected by using whole water samples composited from set depth intervals. Aquatic communities at the AOC and the non-AOC were compared by use of univariate statistical analyses with metrics such as taxa richness (number of unique taxa), diversity, and a multimetric Index of Biotic Integrity (IBI, for artificial-substrate samples only) as well as by use of multi-variate statistical analyses of taxa relative abundances.
Although benthos communities at Waukegan Harbor AOC were not rated as degraded in comparison to the non-AOC, metrics for zooplankton and phytoplankton communi-ties did show some impairment for the 2015 sampling. Across seasons, benthos richness and diversity were significantly
higher and rated as less degraded at the AOC compared to the non-AOC; however, benthos IBIs were not significantly differ-ent. Multivariate comparisons revealed that the benthos com-munities in the AOC and non-AOC were significantly differ-ent, but these comparisons do not address current degradation in either harbor. The dominant taxa in dredge samples were oligochaete worms in both harbors, but there were differences in the relative abundances of Dreissena as well as oligochaete and midge taxa. Although zooplankton richness and diversity in the AOC were lower and rated as more degraded in spring, these metrics were rated as less degraded in fall compared to the non-AOC, effectively balancing out so that there was no difference across seasons. Multivariate comparisons also indi-cated that zooplankton communities in the AOC were signifi-cantly different from those in the non-AOC for spring only but not across seasons, possibly because of lower water tempera-tures in spring at Waukegan Harbor than at the non-AOC site. The spring zooplankton community in Waukegan Harbor was dominated in density and biomass by the rotifer Synchaeta. Across seasons, diatom richness was significantly higher and rated as less degraded in the AOC than the non-AOC because of spring values, whereas soft algae richness was significantly lower and rated as more degraded in the AOC because of fall values. Spring richness of combined phytoplankton (soft algae and diatoms) was significantly higher in the AOC than in the non-AOC. Neither diatom diversity nor soft algae diversity differed significantly between the harbors, but combined phytoplankton diversity across seasons, if replicates were included, was significantly lower and rated as more degraded in the AOC than in the non-AOC. Multivariate tests indicated that the combined phytoplankton communities in the harbors were not significantly different across seasons. Significant differences were not found between harbors for chlorophyll-a, suspended solids, algal densities, or biomass.
1U.S. Geological Survey.2University of Wisconsin-Superior.

2 Comparison of Benthos and Plankton for Waukegan and Burns Harbors, Illinois and Indiana, 2015
IntroductionGreat Lakes Areas of Concern (AOCs) were designated
(“listed”) in the late 1980s by the United States and Canada and are among the most contaminated areas in the Great Lakes region, primarily because of sediment contamination. Ongoing efforts at cleaning up these 43 contaminated rivers and harbors around the Great Lakes hold promise for restoring aquatic communities and habitat. Postremediation monitoring after removal of contaminated sediment is needed to establish the effectiveness of such efforts for subsequent removal of Beneficial Use Impairment (BUI) designations. Monitoring is an important step on the path toward delisting each AOC. Recent data for assessing whether these impairments still exist, however, are lacking at many AOCs. The degradation of benthos (benthic macroinvertebrates) and plankton (zooplankton and phytoplankton) populations are 2 of 14 possible BUIs at AOCs, and both BUIs are present at the Waukegan Harbor AOC.
Waukegan Harbor in Illinois (fig. 1) was designated an AOC in 1981 by the International Joint Commission, U.S. Environmental Protection Agency (EPA), and the Illinois Environmental Protection Agency because of severe sedi-ment contamination that resulted from past industrial activity. The only AOC in Illinois, Waukegan Harbor has three BUIs remaining from the original six, including BUIs for degrada-tion of benthos communities and degradation of zooplankton and phytoplankton communities, as stated in the Remedial Action Plan and updates (Illinois Environmental Protec-tion Agency and Waukegan Citizens Advisory Group, 1994; Illinois Environmental Protection Agency, 1999). For each of the Lake Michigan AOCs, removal of contaminated sediment is one of the necessary steps toward removing the impair-ment for degraded benthic and phytoplankton communities. Dredging and removal of contaminated sediment in Waukegan Harbor was completed by July 2013 (Scott Cieniawski, EPA, oral commun., 2015).
Based on recommendations of the U.S. Policy Commit-tee, if a particular aquatic community at an AOC is found not to be statistically different from a community at a reference or less impaired site, then the BUI for that aquatic commu-nity may be considered for removal (U.S. Policy Commit-tee, 2001). Comparison of sites within an AOC with those in unimpacted or less degraded areas is an approach that has been used to delist BUIs in other Great Lakes States, such as Michigan and Ohio (Ohio Environmental Protection Agency, 2005; Michigan Department of Environmental Quality, 2008). Unfortunately, selection of a truly unimpacted harbor in the Great Lakes area with similar environmental characteristics to an impacted AOC poses a challenge. With the possible exception of remote northern sites, there are no rivermouths or harbors in the Great Lakes to be used as unimpacted control or reference sites as stated in the target criteria for AOCs (U.S. Policy Committee, 2001). Lacking an unimpacted reference site for comparison, areas less degraded than the AOC are
selected for comparison and considered as comparison sites. A chosen candidate is termed a “non-AOC site” in this report.
Taxa richness (number of unique taxa), diversity, and relative abundances for benthos and plankton communities in the AOC and non-AOC sites were used to determine whether the communities are significantly different between the two sites. The hypothesis tested is that metrics describing the qual-ity of the benthos or plankton communities in the AOC do not differ from metrics for the comparable non-AOC site, Burns Harbor-Port of Indiana (hereafter, Burns Harbor). If the tested hypothesis is true, then State and Federal agencies could use these results to determine that the BUI for that community may be removed as a step toward delisting the AOC (U.S. Policy Committee, 2001). If the tested hypothesis is false and the metrics for the AOC indicate the benthos or plankton com-munity is more degraded than the community at the non-AOC, it is possible that BUIs are still present at the AOC site and further study may be needed.
The purpose of this report is to provide an assessment and comparison of benthos and plankton communities by using data collected in 2015 by the U.S. Geological Survey (USGS), in cooperation with the Illinois Department of Natural Resources and the U.S. Environmental Protection Agency, in the Waukegan Harbor AOC in Illinois and the non-AOC comparison site, Burns Harbor, in Indiana. The report compares the sites, including physical and chemical data, and explains the selection of Burns Harbor as the comparison site. The report describes methods of collecting and processing two types of benthos and two types of plankton samples, and it describes methods of analyzing community data with computed biological metrics, standard statistics, and multivariate statistics. Results are summarized for taxa richness, diversity, and relative abundance, including comparisons between sites, seasons, and primary and replicate samples. The results are also compared to those of historical studies at the AOC to provide context and evaluate potential progress with regard to remediation. The data can be used as a benchmark community assemblage for future assessments and monitoring.
Study AreasThe harbors are located along the southwestern and
southern Lake Michigan shoreline (fig. 1). Waukegan Har-bor in Waukegan, Illinois, is located about 30 miles north of Chicago, Ill., along the western coastline of Lake Michigan. The watershed of the harbor is small (<1 square mile) with no riverine or other natural input. Land use in the Waukegan area is urban, primarily industrial with some utilities (EPA, 1999). The harbor is man-made, constructed in the late 1800s and developed for manufacturing and transport by rail and lake shipping to Chicago and other areas. The harbor includes a commercial shipping channel, which covers about 50 to 60 percent of the area. Frequent use of this channel by large,
Study Areas 3
0
30 60 KILOMETERS0
30 60 MILES
Base from National Atlas of the United States (2005) 1:2,000,000-scale digital data
INDIANA
WISCONSIN
ILLINOIS
MICHIGAN
INDIANA
WISCONSIN
ILLINOIS
MICHIGAN
Burns Harbor-Port of Indiana
Lake Michigan
Waukegan Harbor
86°88°
44°
42°
Sampling sites
Area of Concern
Non-Area of Concern
EXPLANATION
Figure 1. Lake Michigan region showing general locations of Waukegan Harbor Area of Concern in Waukegan, Illinois, and Burns Harbor-Port of Indiana non-Area of Concern, near Portage, Indiana.
commercial ships disturbs harbor sediment throughout the relatively shallow (<30 feet) and narrow channel and turning basin two to four times per month during the shipping season (Scott Cieniawski, EPA, oral commun., 2015). The substrate of the harbor is organic silt and clay underlain by fine to medium sand with limited sources of new sediment, nutrients, or detri-tus (Illinois Environmental Protection Agency and Waukegan Citizens Advisory Group, 1994; Environmental Consulting
and Technology, 2008; Creque and others, 2010; Battelle Memorial Institute [Battelle], 2013). Decades of discharges by local industries resulted in high concentrations of polychlori-nated biphenyl compounds (PCBs) in the harbor sediment and nearby areas; other contaminants of concern include heavy metals, nitrogen, volatile solids, polycyclic aromatic hydro-carbons (PAHs) and phenols (International Joint Commission United States and Canada, 1987). Three Superfund sites are
4 Comparison of Benthos and Plankton for Waukegan and Burns Harbors, Illinois and Indiana, 2015
located in the area. In 1981, the International Joint Commis-sion, EPA, and Illinois Environmental Protection Agency named Waukegan Harbor as one of 43 Great Lakes Areas of Concern. The Waukegan Citizens Advisory Group was formed in 1990 by the Illinois Environmental Protection Agency to lead the development of Remedial Action Plans and monitor the progress of cleanup and restoration activities.
Burns Harbor is about 50 miles south in latitude from Waukegan Harbor and 20 miles south of Chicago, near the southernmost point of Lake Michigan. The land use of the area is industrial, primarily steel manufacturing with some utili-ties (Ports of Indiana, 2014). Burns Harbor was man-made in 1965 for use by large, commercial ship traffic and rail trans-port. There is no riverine input to this harbor. The substrate of Burns Harbor is primarily fine sediment composed of sand, silt, and clay with a higher proportion of sand than Waukegan Harbor (Battelle, 2013). During the shipping season, wide areas of these fine sediments are frequently disturbed by large ships because of the relatively shallow depth (<35 feet).
In summary, both harbors are man-made, were carved out of the shoreline of southwestern or southern Lake Michigan to serve as industrial harbors and host large and deep draft Great Lakes ships, and have no riverine input or outlet. Both have mostly sandy bottom sediment. Burns Harbor is a busier harbor with regard to large ship traffic (Diane Tecic, Illinois Department of Natural Resources [IDNR]—Coastal Manage-ment Program, oral commun., 2016). Although Burns Harbor is by no means an unimpacted site, it is not within any AOC and is assumed to be less degraded, and it has similar physical, chemical, and geographic characteristics to Waukegan Harbor. The biological communities in Burns Harbor are assumed to be similar to those that would be present in Waukegan Harbor if it were not for the contamination that was identi-fied when Waukegan Harbor was designated an AOC. Based on input from the EPA and IDNR, Burns Harbor was selected as the best available non-AOC comparison site because of these similarities. The limitations of a single site comparison are recognized.
MethodsThe USGS collected samples in 2015 at the Waukegan
Harbor AOC and a non-AOC comparison site, Burns Harbor. Sampling methods were similar to those used by Scudder Eikenberry and others (2014 and 2016b) for assessment of benthos and plankton at Wisconsin’s Lake Michigan AOCs and comparison non-AOCs.
Sample Collection and Processing
Twice during the growing season in 2015 (June 9 and 10, August 11 and 13), the USGS sampled benthos (bottom-dwelling benthic invertebrates) and plankton (free-floating algae [phytoplankton] and invertebrates [zooplankton]) in
Waukegan Harbor and Burns Harbor (table 1). For simplicity, the two sampling events are hereafter referred to as spring and fall seasonal events. Samples were collected from each harbor at three primary locations or “subsites,” plus one nearby replicate subsite, and all these samples served as replicates for comparison between the two harbors. In Waukegan Harbor, these subsites are the outer harbor, inner harbor, and north harbor; in Burns Harbor, these subsites are the south harbor, west harbor, and east harbor (figs. 2 and 3). All subsites were nonwadable, and samples were collected from a boat. In situ water-quality samples were collected by using a YSI sonde once during each sampling period at each subsite for pH, specific conductance, and water temperature. The sonde readings were recorded near the benthos and plankton sampling locations at 1-meter (m) depth.
Two types of benthos samples were collected: (1) surface sediment samples were grabbed with a standard Ponar® dredge in order to target benthos that occur naturally in the bottom sediments of the harbor (fig. 4), and (2) artificial substrate samples were collected with Hester-Dendy samplers (HD samplers, hereafter) to target benthos that require a harder substrate to colonize (fig. 5). Grab samples of the bottom sediment were collected at each sampling location during each sampling event by using a standard Ponar® dredge (Wildco part number 1725–F50), which collects a 229 millimeter (mm) × 229 mm area of sediment. Benthos collection methods are as described in Scudder Eikenberry and others (2014 and 2016b) and are based on EPA’s standard operating procedure LG406 (U.S. Environmental Protection Agency, 2010a), with the exception that more than one dredge grab of sediment was collected and composited to increase spatial coverage at each site. With the exception of one sample, three dredge grabs of sediment were collected and composited into a single sample for each subsite. The
Table 1. Locations of U.S. Geological Survey sampling sites for Waukegan Harbor Area of Concern, Illinois, and Burns Harbor-Port of Indiana non-Area of Concern, Indiana, 2015.
Site name LocationSubsite
abbrevia-tion
Latitude (decimal degrees)
Longitude (decimal degrees)
Waukegan Harbor Area of Concern
Waukegan Harbor
Outer harbor WH1 42.362 87.812Inner harbor WH3 42.364 87.823Inner harbor replicate WH3Dup 142.364 87.824North harbor WH5 42.366 87.821
Burns Harbor non-Area of Concern
Burns Harbor
South harbor BH1 41.633 87.160South harbor replicate BH1Dup 141.633 187.160West harbor BH3 41.644 87.157East harbor BH5 41.643 87.149
1Coordinate differs by seconds from that of nonreplicate subsite.
Methods 5
Sampling location
EXPLANATION
WH1 Site abbreviation
WH1
WH3
WH5
WH3Dup
87°49'
42°22'
42°21'30"
87°49'15”
Base from Esri, DigitalGlobe, GeoEye, icubed,USDA, USGS, AEX, Getmapping, Aerogrid, IGN,IGP, swisstopo, and the GIS User Community digital data, copyright 2016 Esri 0
0.25 0.5 KILOMETER0.1250
0.25 0.5 MILE0.125
Figure 2. U.S. Geological Survey sampling sites for benthos and plankton communities in Waukegan Harbor Area of Concern, Illinois, 2015. Subsite abbreviations shown are for Waukegan outer harbor (WH1), Waukegan inner harbor (WH3), Waukegan inner harbor replicate (WH3Dup), and Waukegan north harbor (WH5).

6 Comparison of Benthos and Plankton for Waukegan and Burns Harbors, Illinois and Indiana, 2015
BH1
BH3 BH5
Base from Esri, DigitalGlobe, GeoEye, icubed,USDA, USGS, AEX, Getmapping, Aerogrid, IGN,IGP, swisstopo, and the GIS User Community digital data, copyright 2016 Esri
BH1Dup
0
0.25 0.5 KILOMETER0.1250
0.25 0.5 MILE0.125
87°09'87°09'30"
41°38'30"
41°38'
Sampling location
EXPLANATION
BH1 Site abbreviation
Figure 3. U.S. Geological Survey sampling sites for benthos and plankton communities in Burns Harbor-Port of Indiana non-Area of Concern, Indiana, 2015. Subsite abbreviations shown are for Burns south harbor (BH1), Burns south harbor replicate (BH1Dup), Burns west harbor (BH3), and Burns east harbor (BH5).

Methods 7
Figure 4. Ponar® dredge sampler containing bottom sediment being emptied and rinsed into a cooler for compositing into a single sample per location with subsequent subsampling for benthos community, particle-size fractionation, and volatile-on-ignition samples.
A B
Figure 5. A, Hester-Dendy artificial substrate samplers being removed from a cement block and placed into a plastic bucket for later compositing and processing of attached benthic invertebrates. B, Close-up image of Hester-Dendy samplers after 6 weeks deployment.

8 Comparison of Benthos and Plankton for Waukegan and Burns Harbors, Illinois and Indiana, 2015
one exception was the fall sample at the Waukegan inner harbor (WH3), where it was difficult to obtain sufficient sample material for analyses because of hard substrate, and four grabs were collected and composited. Count data were based on area sampled and were normalized for the number of grabs. Sediment from each sample was collected, composited, and homogenized by hand to a uniform color and consistency. The composited and homogenized sediment was processed for invertebrate taxon identification and enumeration (counting). Large debris, rocks, coarse sand, and inorganic particles were removed, and the sample was rinsed with native or tap water through 1.0-centimeter and then 500-micrometer (µm) sieves. Processed samples were transferred into a container, stained with rose bengal dye, and preserved in a buffered 10-percent formalin solution before submission to the University of Wisconsin-Superior Lake Superior Research Institute (LSRI) for identification and enumeration based on EPA’s standard operating procedure LG407 (U.S. Environmental Protection Agency, 2010b). A single, separate sediment grab was also collected and homogenized, and subsamples were placed into two plastic bags: one bag for analysis of sediment size fractions for estimating substrate sizes and types and another bag for analysis of volatile-on-ignition solids for estimating the amount of organic matter. Size fraction samples were analyzed by the University of Wisconsin soils and forage lab in Madison, Wisconsin, using the hydrometer method (Bouyoucos, 1962), and volatile-on-ignition samples were analyzed by the USGS using a combustion method (Fishman and Friedman, 1989). The second type of benthos sample was collected by using HD samplers (fig. 5). The HD sampler methods are based on those described for sampling invertebrates in nonwadable rivers (Weigel and Dimick, 2011).
At each subsite, four individual HD samplers were attached to cement blocks that were anchored to a stable or permanent structure by a wire cable. After about six weeks were allowed for colonization, the HD samplers were retrieved, and three of four HD samplers were randomly chosen to represent the subsite. All organisms were scraped off and composited into one sample per season for the subsite. During processing, all benthos samples were rinsed through a sequential series of sieves to remove fine sediment, preserved in buffered 10-percent formalin, and stained with rose bengal dye (fig. 6). Samples were sent to LSRI for identification and enumeration based on EPA’s standard operating procedure LG407 (U.S. Environmental Protection Agency, 2010b).
Two types of plankton samples were collected at each subsite: a tow net sample designed to capture larger zooplank-ton, and a whole water sample for collection of phytoplankton. The methods for zooplankton collection are based on EPA’s standard operating procedure LG402 (U.S. Environmental Protection Agency, 2010e). For each zooplankton sample, a 63-µm-mesh plankton net was lowered to 5-m depth and then raised to the surface (fig. 7). If the water depth was less than 5 m, additional tows were taken and composited so that a total of 5 m of water depth was sampled. Once raised, the net was rinsed down gently from the outside with garden spray-ers filled with tap water in order to wash organisms down into the dolphin bucket. The sample contents in the dolphin bucket were then transferred to a 500-milliliter (mL) sample bottle (fig. 7). One-half of an Alka Seltzer tablet was added per 500-mL sample to increase CO2 to prevent rotifers from contract-ing and thereby hindering identification (Chick and others, 2010). After 30 minutes but within one hour of sample col-lection, the sample was preserved by using sucrose-buffered
Figure 6. The processing of two types of benthos samples at Waukegan Harbor, Illinois: on the left, invertebrates being removed from plates of Hester-Dendy artificial substrate samplers prior to being sieved; on the right, invertebrates in composited sediment from Ponar® dredge samplers being removed from large rocks and debris during sieving.

Methods 9
Figure 7. A plankton net being washed to collect a zooplankton community sample.
formalin to a final solution of 4.2-percent sucrose and 4- to 5-percent formalin (Chick and others, 2010; Haney and Hall, 1973). Samples were sent to EnviroScience in Stow, Ohio, for zooplankton identification and enumeration based on EPA’s standard operating procedure LG403 (U.S. Environmental Protection Agency, 2010f).
A Kemmerer vertical water sampler was used to collect a composited set of five whole water samples at 1-m depth intervals from 1 m below the surface to just above the bottom on EPA’s standard operating procedure LG400 (U.S. Environ-mental Protection Agency, 2010c) (fig. 8). By using a churn splitter, several well-mixed subsamples were taken from this composited sample for separate analyses. Two 500-mL ali-quots were placed in plastic bottles, preserved with 25-percent glutaraldehyde to a 1-percent solution, and sent to EnviroSci-ence for diatom and soft algae phytoplankton identification and enumeration based on EPA’s standard operating procedure LG401 (U.S. Environmental Protection Agency, 2010d). The diatom Urosolenia was enumerated in the soft algae counts because it is fragile and lightly silicified or “soft” and so it
Figure 8. A Kemmerer™ vertical water sampler being deployed in Burns Harbor, Indiana, for sampling at 1-liter intervals, with subsequent compositing and subsampling for phytoplankton community, chlorophyll-a, and suspended solids.
cannot withstand methods used in diatom sample processing. A third 500-mL aliquot was filtered for chlorophyll-a by using a Millipore type SM, 47-mm diameter, 5.0-μm pore size mem-brane filter, placed in an analysis vial, wrapped in aluminum foil, and preserved with dry ice until delivery to the Wisconsin State Laboratory of Hygiene for analysis (modified from EPA method 445.0 as described in Kennedy-Parker, 2011). A final 500- to 1,000-mL aliquot was filtered for ash-free dry mass (total suspended solids [TSS] minus volatile suspended solids [VSS]) as an estimate of organic matter in the water column, by using a standard glass fiber filter (Whatman 47-mm diam-eter, 1.5-μm pore size) that was then wrapped in aluminum foil, placed in a Petri dish, and preserved with dry ice until delivery to the Wisconsin State Laboratory of Hygiene for analysis (Standard Methods 2540D and EPA 160.4/Standard Methods 2540E for total and volatile suspended solids, respec-tively, as described in American Public Health Association, American Water Works Association, and Water Environment Federation, 2005).

10 Comparison of Benthos and Plankton for Waukegan and Burns Harbors, Illinois and Indiana, 2015
Data Analysis
Computed measures or “metrics” were taxa richness (number of unique taxa), the Shannon diversity index (Shan-non, 1948) and, for HD samples, a macroinvertebrate Index of Biotic Integrity (IBI) for large, nonwadable rivers of Wiscon-sin (Weigel and Dimick, 2011). An IBI is a multimetric that combines structural metrics (for example, richness, diversity and relative abundance) with functional metrics that relate to the role or preferences of different organisms (for example environmental tolerances), to arrive at a numeric value that can be rated. The macroinvertebrate IBI values or “scores” range from 0 (worst) to 100 (best) and are rated as follows: very poor (≤19), poor (20–39), fair (40–59), good (60–79), and excellent (≥80). The combination of structural and functional metrics can make IBIs more effective than a single metric for defining differences or change. At present, no zooplankton or phytoplankton IBIs exist for use in rivermouths or harbors.
Metrics were compared between sites by using univari-ate statistics, specifically Mann-Whitney and Kruskal-Wallis nonparametric statistical tests in Data Desk 7 (Data Descrip-tion Inc., 2015). Unless otherwise stated, use of the term “significant” refers to values of p<0.05. Relative abundances of taxa were compared between sites by using multivariate statistics in PRIMER 6 software (Clarke and Gorley, 2006). Several PRIMER routines were used, including the following: (1) DIVERSE—to calculate diversity in loge, (2) similarity percentage (SIMPER)—to assess differences in the relative abundance of taxa between the harbors and differences among primary and replicate samples within each harbor, (3) multi-dimensional scaling (MDS)—to derive benthos and plankton community site scores and create ordination plots of sites and (or) samples, and (4) analysis of similarity (ANOSIM)—to compare communities between the harbors (a procedure analogous to an analysis of variance using similarity matrices). Prior to multivariate testing, taxa relative abundances were determined, and a Bray-Curtis similarity matrix was calculated from a fourth-root transformation of relative abundance data. A fourth-root transformation decreases the effects of common taxa and increases the effects of intermediate and rare taxa such that more taxa have an influence in the final multivariate analyses (Clarke and Warwick, 2001, p. 9–2). These Bray-Curtis similarity matrices then formed the basis of SIMPER, MDS, and ANOSIM comparisons. MDS represents objects, such as samples, in plots of two or three dimensions where dissimilar objects plot far apart and similar objects plot close together. The stress value reported for an MDS ordination refers to how well the multidimensional relationships among the samples are represented in the two-dimensional MDS plot (goodness-of-fit). According to Clarke and Warwick (2001), representation is excellent for stress values <0.05 and good for stress values <0.1. Representation for stress values >0.1 but <0.2 is still useful, but the user should be cautious and not place much reliance on exact plot detail, and stress values >0.3 indicate nearly random positions of points and should not be used. One-way ANOSIM tests, based on site-specific
scores generated with MDS, was used to determine the extent to which relative abundances of taxa in benthos and plankton communities varied across sites by sampling event and across sampling seasons. Site scores based on similarities between communities were used to determine whether the community composition of the AOC was statistically different from the non-AOC. The global R statistic resulting from an ANOSIM test is a measure of the difference between sites, and the value of R can range from -1 to +1 where an R value of approxi-mately zero indicates no statistical difference between sites. For each R value there is also a corresponding significance value (p).
Taxa whose abundances are reported for multiple, related taxonomic ranks (ambiguous taxa) were resolved prior to calculating metrics and prior to multivariate analyses. This was done by distributing counts for the parent (higher level taxonomic rank) to the children (lower taxonomic level rank) that were present within each subsite, taking into account the proportion of counts already assigned to each child, and removing the counts for the parent. This procedure helps ensure that values for richness used in site comparisons are not artificially inflated by ambiguous taxa (Cuffney and others, 2007). Ambiguous taxa were resolved for benthos and phyto-plankton; however, for zooplankton, nauplii and copepodites were kept in the analysis as separate taxa; no other ambiguous taxa were found. Lastly, fixation methods for soft algae can cause the cells of Dinobryon, a Chrysophyte or golden-brown alga, to leave their loricae or “shells” (Pfister and others, 1999). Therefore, empty Dinobryon loricae were excluded from our analyses to avoid any duplication of live Dinobryon, which were counted and included in data analyses.
Physical and Chemical Comparisons Between Waukegan and Burns Harbors
All physical and chemical data are available in Scud-der Eikenberry and others (2017) at https://doi.org/10.5066/F7CN7259. Mean values for water temperature, pH, specific conductance, and dissolved oxygen collected at 1-m depth during sampling were compared by season and across seasons between sites (table 2). In each season, water temperature was significantly lower in Waukegan Harbor than Burns Harbor, likely reflecting Waukegan Harbor’s more northern latitude. Mean spring and fall water temperatures at Wauke-gan Harbor were 12.24 ± 0.40 °C and 20.83 ± 0.29 °C, respectively (mean ± standard deviation of the data), and water temperatures at Burns Harbor were 15.94 ± 1.33 °C and 22.52 ± 0.02 °C, respectively. Values for pH did not differ significantly, with means and standard deviations of 8.29 ± 0.15 and 8.37 ± 0.12 across seasons at Waukegan and Burns Harbors, respectively. Specific conductance was significantly lower in Waukegan Harbor, with an overall

Physical and Chemical Comparisons Between Waukegan and Burns Harbors 11
Table 2. Mean and standard deviation values for water quality measurements made in situ with a YSI sonde at approximately 1-meter depth in 2015 at Waukegan Harbor Area of Concern, Illinois, and Burns Harbor-Port of Indiana non-Area of Concern, Indiana.
[°C, degree Celsius; μS/cm at 25 °C, microsiemens per centimeter at 25 °C; mg/L, milligram per liter]
SeasonWater
temperature (°C)
pH
Specific conductance
(µS/cm at 25 °C)
Dissolved oxygen (mg/L)
Waukegan Harbor Area of Concern
Spring 12.24 ± 0.40 8.18 ± 0.06 290.2 ± 3.8 10.58 ± 0.35Fall 20.83 ± 0.29 8.41 ± 0.09 290.8 ± 3.6 9.29 ± 0.19Total 16.53 ± 4.50 8.29 ± 0.15 290.5 ± 3.9 9.94 ± 0.73
Burns Harbor non-Area of Concern
Spring 15.94 ± 1.33 8.25 ± 0.04 303.3 ± 0.8 9.50 ± 0.23Fall 22.52 ± 0.02 8.48 ± 0.02 300.3 ± 2.1 9.02 ± 0.14Total 19.23 ± 3.57 8.37 ± 0.12 301.8 ± 2.3 9.26 ± 0.32
mean and standard deviation of 290.5 ± 3.9 microsiemens per centimeter at 25 degrees Celsius (µS/cm at 25 °C), than in Burns Harbor, with an overall mean and standard deviation of 301.8 ± 2.3 µS/cm. Dissolved oxygen was significantly higher in Waukegan Harbor than Burns Harbor in spring and fall because more oxygen can be dissolved in colder water. Values for spring and fall dissolved oxygen at Waukegan Harbor were 10.58 ± 0.35 milligrams per liter (mg/L) and 9.29 ± 0.19 mg/L, respectively, and spring and fall values at Burns Harbor were 9.50 ± 0.23 mg/L and 9.02 ± 0.14 mg/L, respectively.
The mean sampling depth for bottom sediment grabs in Waukegan Harbor was 6.4 ± 0.8 m, whereas the mean sam-pling depth in Burns Harbor was 9.7 ± 0.5 m. Burns Harbor is dredged on a regular basis to maintain adequate depths for ship passage. In 2015, it was dredged in the shipping approach channel but not in the “arms” inside the harbor where aquatic communities were sampled. The percentages (mean ± stan-dard deviation) of sand, silt, and clay in bottom sediment from Waukegan Harbor were 43.3 ± 19.3, 42.2 ± 14.6, and 15.0± 6.4, respectively, and in bottom sediment from Burns Harbor the percentages were 45.3 ± 26.1, 26.8 ± 13.1, and 28.3 ± 20.3, respectively (table 3). No significant differences were found in the percentages of particle sizes between the two harbors; however, percentages varied between subsites in each harbor. Sand was dominant in Waukegan outer harbor (WH1) with a mean of 60.0 ± 21.2 percent. Silt was dominant in Waukegan inner harbor (WH3) and north harbor (WH5) and on average made up about 50 percent of the particles in the sediment. Sand was also dominant in Burns south har-bor (BH1) and west harbor (BH3). Except for Burns east harbor (BH5), where the dominant substrate was clay at a
mean of 54.0 ± 5.7 percent, all other subsites in Waukegan and Burns Harbors averaged less than 18 percent clay. Mean volatile-on-ignition solids (estimates of organic carbon) were not significantly different between harbors, and ranged from 0.93 ± 0.26 percent (WH1) to over 6.08 ± 0.34 percent (WH3) in Waukegan Harbor and from 1.28 ± 0.03 percent (BH5) to 3.16 ± 0.58 percent (BH3) in Burns Harbor. These percentages are low to average in comparison with a median value of 4.26 found at sites sampled across the United States by Scudder and others (2009).
From the depth-integrated water samples that were subsampled for phytoplankton and ancillary chemical analy-ses, mean chlorophyll-a concentrations for Waukegan and Burns Harbors were 1.91 ± 0.73 micrograms per liter (µg/L) and 2.04 ± 0.50 µg/L, respectively (table 4). When compared across sites, the highest mean chlorophyll-a concentration was found in Waukegan north harbor (WH5) at 2.39 µg/L, while the lowest mean concentration was in Waukegan outer harbor (WH1) at 1.6 µg/L. Results of a Mann-Whitney test indicated that Waukegan and Burns Harbors chlorophyll-a concentrations were not significantly different when com-pared across seasons. In addition, no significant differences in chlorophyll-a concentration were found among subsites at Burns and Waukegan Harbors. These results for chloro-phyll-a complement our finding of no significant differences between the two harbors for total density or biomass of soft algae, diatoms, and combined phytoplankton (soft algae and diatoms). Water samples were analyzed for total suspended solids (TSS) and volatile suspended solids (VSS) in water as a measure of ash-free dry mass (ash-free dry mass is equal to TSS minus VSS). TSS concentrations at Waukegan and Burns Harbors were not significantly different from one another,
Table 3. Mean and standard deviation values for particle size and volatile-on-ignition solids in bottom sediment for Waukegan Harbor Area of Concern, Illinois, and Burns Harbor-Port of Indiana non-Area of Concern, Indiana, 2015.
[Refer to table 1 for the complete subsite names]
Subsite abbre-viation
Sand (percent)
Silt (percent)
Clay (percent)
Volatile-on-ignition
(percent)
Waukegan Harbor Area of Concern
WH1 60.0 ± 21.2 26.5 ± 12.0 14.0 ± 8.5 0.93 ± 0.26WH3 34.0 ± 24.0 50.5 ± 13.4 16.0 ± 11.3 6.08 ± 0.34WH5 36.0 ± 1.4 49.5 ± 0.7 15.0 ± 1.4 5.11 ± 0.56Total 43.3 ± 19.3 42.2 ± 14.6 15.0 ± 6.4 4.04 ± 2.47
Burns Harbor non-Area of Concern
BH1 56.0 ± 18.4 30.5 ± 17.7 14.0 ± 0.0 1.38 ± 0.86BH3 61.5 ± 29.0 22.5 ± 21.9 17.0 ± 7.1 3.16 ± 0.58BH5 18.5 ± 6.4 27.5 ± 0.7 54.0 ± 5.7 1.28 ± 0.03Total 45.3 ± 26.1 26.8 ± 13.1 28.3 ± 20.3 1.94 ± 1.05

12 Comparison of Benthos and Plankton for Waukegan and Burns Harbors, Illinois and Indiana, 2015
Table 4. Mean and standard deviation values for chlorophyll-a, total suspended solids, and volatile suspended solids for composited water samples from Waukegan Harbor Area of Concern, Illinois, and Burns Harbor-Port of Indiana non-Area of Concern, Indiana, 2015.
[Limit of detection for suspended solids was 2 milligrams per liter (mg/L). Means shown as a range of values were computed by substituting zero and the limit of detection to provide lower and upper boundaries. µg/L, microgram per liter]
SeasonChlorophyll-a
(µg/L)
Total suspended solids
(mg/L)
Volatile suspended solids
(mg/L)
Ash-free dry mass1 (mg/L)
Waukegan Harbor Area of Concern
Spring 1.80 ± 0.80 2.9 ± 2.6 to 3.6 ± 1.4 <2.0 1.6 ± 1.4 to 2.9 ± 2.6Fall 2.02 ± 0.80 3.1 ± 0.8 <2.0 1.1 ± 0.8 to 3.1 ± 0.8Total 1.91 ± 0.73 3.0 ± 1.7 to 3.3 ± 1.1 <2.0 1.3 ± 1.1 to 3.0 ± 1.7
Burns Harbor non-Area of Concern
Spring 1.98 ± 0.40 1.7 ± 2.9 to 3.0 ± 1.7 <2.0 1.0 ± 1.7 to 1.7 ± 2.9Fall2 2.09 ± 0.68 6.4 ± 4.8 0.9 ± 1.6, 2.3 ± 0.5 4.1 ± 4.3 to 5.5 ± 3.3Total2 2.04 ± 0.50 2.5 ± 2.6 to 3.3 ± 1.7 <2.0 1.3 ± 1.7 to 2.5 ± 2.6
1Ash-free dry mass is equal to total minus volatile suspended solids.2Means and standard deviations for Burns Harbor omit the outlier value for total suspended solids of 11.6 at BH3 in fall.
despite including an outlier of 11.6 mg/L for the fall sample at Burns west harbor (BH3). Nondetections for TSS occurred in spring at WH1, BH3, and Burns east harbor (BH5). If nonde-tections were replaced with either zero or the detection limit of 2.0 mg/L, then estimated mean TSS concentrations across seasons ranged between 3.0 and 3.3 mg/L for Waukegan Har-bor and 2.5 and 3.3 mg/L for Burns Harbor if the BH3 outlier was excluded from the test. With the exception of two values above detection limits, including a single value of 2.6 mg/L for spring in Waukegan Harbor and a single value of 2.8 mg/L for fall in Burns Harbor, all values for VSS were nondetec-tions (<2.0 mg/L). These two detected values were for the same samples where the highest TSS values were found. The VSS nondetections were despite the use of 500 to 1,000 mL per sample for filtration. If nondetections were replaced with either zero or the detection limit of 2.0 mg/L, then the result-ing estimated ash-free dry mass mean values across seasons were 1.3 to 3.0 mg/L at Waukegan Harbor and 1.3 to 2.5 mg/L at Burns Harbor, as shown in table 4. Results indicate that chlorophyll-a and ash-free dry mass were relatively low in both harbors.
Condition of the Benthos and Plankton Communities
Differences in benthos and plankton communities were evaluated by use of univariate statistics with multiple biologi-cal metrics and by use of multivariate statistics with relative abundances of taxa. The use of structural measures that relate to the relative numbers of different organisms (richness,
diversity and relative abundance), functional measures that relate to the role or preferences of different organisms (for example environmental tolerances), and a multimetric such as the IBI that combines structural and functional measures, pro-vided an effective means of assessing and comparing benthos and plankton communities at Waukegan Harbor and Burns Harbor. All biological community data are available in Scud-der Eikenberry and others (2017) at https://doi.org/10.5066/F7CN7259).
When the benthos or plankton community at an AOC is rated as more impaired than a non-AOC comparison site, whether or not the non-AOC has some impairment itself, it emphasizes the finding of impairment at the AOC. If no sta-tistical difference is found between a community or sample at an AOC community and a non-AOC, it does not mean that the benthos or plankton community at an AOC is unimpaired but that the AOC is not impaired in comparison to the non-AOC. A finding of no statistical difference could mean that the AOC and non-AOC are equivalently impaired.
Benthos Community Comparisons Between Waukegan and Burns Harbors
Taxa richness or simply “richness,” the number of unique taxa, was generally less in dredge samples than in HD samples from both Waukegan and Burns Harbors (table 5, figs. 9A–C). The soft and often disturbed natural substrate collected in dredge samples may have been less suitable for some invertebrates than the hard and potentially more stable substrate of HD samplers. HD samplers provide a means for comparing benthos at each harbor (especially the potential colonizing pool of taxa) while keeping the substrate consistent

Condition of the Benthos and Plankton Communities 13
Table 5. Richness, diversity, and Index of Biotic Integrity values for benthos communities collected at Waukegan Harbor Area of Concern, Illinois, and Burns Harbor-Port of Indiana non-Area of Concern, Indiana, 2015.
[Refer to table 1 for the complete subsite names]
Subsite abbreviation
SeasonDredge Hester-Dendy Combined benthos
Richness1 Diversity2 Richness Diversity IBI3 Richness Diversity
Waukegan Harbor Area of Concern
WH1 Spring 19 1.35 24 2.28 30 40 1.63Fall 19 0.69 23 1.68 20 37 1.47
WH3 Spring 26 1.87 26 2.03 25 42 2.30Fall 17 1.40 25 2.19 20 39 2.33
WH5 Spring 22 1.23 23 2.05 20 38 1.86Fall 19 1.69 28 2.66 20 42 2.05
Burns Harbor non-Area of Concern
BH1 Spring 6 0.97 24 2.47 15 28 1.34Fall 7 1.36 19 0.63 15 23 1.26
BH3 Spring 12 0.86 8 1.03 30 19 1.03Fall 14 1.16 14 1.77 20 26 1.39
BH5 Spring 7 1.61 22 2.54 20 26 2.74Fall 6 1.41 20 0.16 20 26 0.38
1Richness computed as the number of unique taxa in the sample.2Shannon diversity, calculated as loge (Shannon, 1948).3The Index of Biotic Integrity ranges from 0 (worst) to 100 (best) and includes the following categories: very poor (≤19), poor (20–39), fair (40–59), good
(60–79), and excellent (≥80).
across harbors. Across the seasons and subsites, mean richness was 20.3 ± 3.2 in Waukegan Harbor and 8.7 ± 3.4 in Burns Harbor for dredge samples, and mean richness was 24.8 ± 1.9 in Waukegan Harbor and 17.8 ± 5.9 in Burns Harbor for HD samples. Mean richness in combined benthos samples across seasons and subsites reflected the small overlap in taxa between the two types of benthos samples with 39.7 ± 2.1 in Waukegan Harbor and 24.7 ± 3.2 in Burns Harbor. Richness for dredge, HD, and combined (dredge and HD) benthos samples across seasons, subsites, and with or without field replicates (n = 7 and 6, respectively), was significantly greater in Waukegan Harbor compared to Burns Harbor. Spring and fall richness for dredge and combined benthos samples were higher at Waukegan Harbor compared to Burns Harbor; richness for HD samples was higher at Waukegan Harbor in fall only.
Similar to results for benthos richness, diversity was generally lower in dredge samples than in HD samples for both Waukegan and Burns Harbors. Mean diversity across seasons and subsites was 1.37 ± 0.41 in Waukegan Harbor and 1.23 ± 0.28 in Burns Harbor in dredge samples, and diversity was 2.15 ± 0.32 at Waukegan Harbor and 1.43 ± 0.98 at Burns Harbor in HD samples. Mean diversity in combined benthos samples was 1.94 ± 0.35 in Waukegan Harbor and 1.36 ± 0.77 in Burns Harbor. Diversity by season or across seasons was
not significantly different between Waukegan and Burns Harbors for dredge or HD samples, nor was it significantly different for combined benthos diversity when seasons were examined separately. However, for the combined benthos across both seasons, with or without field replicates, diversity was significantly higher at Waukegan Harbor compared to Burns Harbor.
Mean IBI values for HD samples were 22.5 ± 4.1 at Waukegan Harbor and 20.0 ± 5.5 at Burns Harbor, and there was no significant difference between the two harbors for IBI values across all seasons or by season across subsites, with or without field replicates. Similar values for IBIs were found in 2014 for another non-AOC, the Root River and harbor in Racine, Wisconsin, by Scudder Eikenberry and others (2016a). IBI values within these ranges would be rated as poor for a large river system; however, a large river IBI may not be able to accurately rate them (poor rating ranges from 20 to 39, per Weigel and Dimick, 2011). A benthos IBI for rivermouths and harbors may be more valuable with the addition of functional and tolerance information for oligochaetes regarding their importance in these ecosystems and the range in environmen-tal preferences. The large river IBI used in our study includes oligochaetes, because they contribute to the proportion of noninsects, but not with regard to tolerance or functional roles.

14 Comparison of Benthos and Plankton for Waukegan and Burns Harbors, Illinois and Indiana, 2015
Rang
e
Stan
dard
dev
iatio
n (S
D)
Mean (M)
EXPLANATION
Samples
0
10
20
30
40
50
Com
bine
d be
ntho
s di
vers
ityCo
mbi
ned
bent
hos
richn
ess
Spring Fall
0.0
0.5
1.0
1.5
2.0
2.5
Rang
e
SD
SDM
0
10
20
30
40
HD s
ampl
er ri
chne
ss
Spring Fall
0
0.5
1
1.5
2
2.5
3
HD s
ampl
er d
iver
sity
0
5
10
15
20
25
30
HD s
ampl
er IB
I
Rang
e
SD
SDM
WaukeganHarbor
BurnsHarbor
WaukeganHarbor
BurnsHarbor
WaukeganHarbor
BurnsHarbor
WaukeganHarbor
BurnsHarbor
0
5
10
15
20
25
30
Spring Fall
0.0
0.5
1.0
1.5
2.0
WaukeganHarbor
BurnsHarbor
WaukeganHarbor
BurnsHarbor
Rang
e
SD
SDM
Dred
ge s
ampl
er d
iver
sity
Dred
ge s
ampl
er ri
chne
ss
Waukegan outer harbor (WH1)
Burns south harbor (BH1)
Waukegan inner harbor (WH3)
Burns west harbor (BH3)
Waukegan north harbor (WH5)
Burns east harbor (BH5)
A
B C
Figure 9. Richness and diversity metrics for benthos communities for A, dredge samples, B, Hester-Dendy (HD) artificial substrate samples, and C, combined (dredge and HD) samples collected at Waukegan Harbor Area of Concern, Illinois, and Burns Harbor-Port of Indiana non-Area of Concern, Indiana, 2015. Index of Biotic Integrity (IBI) for HD samples only.

Condition of the Benthos and Plankton Communities 15
To help interpret richness, diversity, and IBI results, it is important to examine which taxa are dominant in the dredge and HD samples at the harbors. For dredge samples, the dominant taxon at Waukegan Harbor was immature oligo-chaetes. At WH1, this was followed by the pollution-tolerant midge larvae Polypedilum scalaenum group in spring and Chironomus in fall, and then by oligochaetes Limnodrilus cervix in spring and fall and, lastly, Limnodrilus hoffmeisteri in fall only. At WH3, the next taxa dominant after immature oligochaetes were adult oligochaetes Vejdovskyella intermedia and Aulodrilus pigueti and midge Procladius in spring and Limnodrilus udekemianus, midge Chironomus, and Limnodri-lus hoffmeisteri in fall. Midges were in the top five dominant taxa at WH1 and WH3 only but were also common at WH5. The dominant taxa at WH5 after immature oligochaetes were adult oligochaetes Quistradrilus multisetosus, Vejdovskyella intermedia, and Limnodrilus udekemianus in spring; Limno-drilus hoffmeisteri, Quistradrilus multisetosus, and Dero were next in dominance in fall. Immature forms of oligochaetes are by far more common than adult forms in most habitats (Erséus and Diaz, 1989). In general, pollution tolerances in the literature are listed for adult invertebrates including oligo-chaetes, however, Bode and others (2002) also indicate a most tolerant score of 10 for immature oligochaetes. The tubificid oligochaete Limnodrilus hoffmeisteri has a worldwide distri-bution; it can be locally abundant and dominant because of its adaptable nature and high tolerance to pollution, salinity, and highly eutrophic conditions; the other listed oligochaete taxa dominant in Waukegan Harbor also have high tolerance to degraded conditions (Bode and others, 2002). In general, the dominant taxa in dredge samples from Burns Harbor were also immature oligochaetes. However, Dreissena (the genus for zebra and (or) quagga mussels) was second in dominance at BH1 in spring and the dominant taxon at the Burns south harbor replicate site (BH1Dup) and it was the dominant taxon at BH3 in fall. Although present at all Waukegan subsites, Dreissena was generally not abundant except at WH5 in spring. Midge larvae such as Chironomus, Cryptochironomus, Polypedilum halterale or scalaenum group, and Procladius were also among the dominant taxa in Burns Harbor along with adult oligochaetes Limnodrilus hoffmeisteri, Limnodrilus claparedeianus, and Potamothrix vejdovskyi. Another differ-ence between dominant taxa in dredge samples from the two harbors were water mites (Trombidiformes), which ranked second in dominance at BH5 in spring but never dominated in Waukegan Harbor samples.
For HD samples, with one exception, the dominant taxa at Waukegan Harbor were species of Nais oligochaetes that were not dominant in dredge samples. The one exception was at WH1 in fall, where Dreissena was the dominant taxon, and Dreissena was among the top five dominant taxa at WH3 and WH5 in fall and spring, respectively. Midges Dicrotendipes and Cricotopus/Orthocladius were also among the dominant taxa at WH1 in spring and at all Waukegan harbor subsites in fall. Amphipods Echinogammarus and Gammarus were third in dominance in spring at WH1 and WH3, respectively.
At Burns Harbor, Dreissena was the top taxon in fall at BH1, BH1Dup, and BH5. The snail Physa ranked second and third in dominance with Dreissena at BH1Dup and BH1 in fall, but densities for Physa were one to two orders of magnitude lower than for Dreissena. The amphipod Echinogammarus ranked as the top taxon in spring at BH3 and third in dominance at BH5 in fall. Water mites ranked second in dominance in spring at BH5 only. Midges Cricotopus/Orthocladius, Micropsectra, Parakiefferiella, Ablabesmyia, and Chironomus were among the top five dominant taxa at Burns Harbor.
Separate multivariate ordination plots of taxa relative abundances were created for dredge, HD, and combined benthos samples to gain an understanding of the similarities and differences between communities on each substrate (figs. 10A–C). However, these comparisons do not address degradation in either harbor. In general, benthos samples showed less variability (grouped more closely together in the MDS plot) between subsites and seasons at Waukegan Harbor than Burns Harbor. Benthos communities in dredge samples were similar between WH3 and WH5 and generally grouped tightly together on the MDS plot (fig. 10A). Benthos communities in both seasons from WH1 were distinct from communities at WH3 and WH5; however, communities in WH1 samples were more similar to communities in the other Waukegan samples than to communities in Burns Harbor. A one-way ANOSIM test indicated that benthos in dredge samples from Waukegan Harbor were significantly different from benthos in Burns Harbor (R=0.77, p=0.002). A one-way SIMPER test found the AOC and non-AOC communities to be on average 65-percent dissimilar, with Dreissena, oligochaetes Potamothrix vejdovskyi and Quistradrilus multisetosus, and midge Polypedilum scalaenum group contributing about 20 percent to the dissimilarity between groups. Dreissena was found in either dredge or HD samples at all subsites in both harbors; however, this taxon was seldom identified to species in our samples. Quagga mussels (Dreissena bugensis) were identified only in spring HD samples at WH5.
Benthos communities in HD samples from Waukegan Harbor were similar to each other and grouped tightly together in the MDS plot, yet apart from most Burns Harbor samples (fig. 10B). Spring samples collected from BH1 and BH5 plot-ted near Waukegan Harbor communities in the MDS and apart from the same locations in fall. The spring sample at BH3 was most distant to all other subsites in the MDS. Despite the variability among the Burns Harbor samples, a one-way ANOSIM test indicated that benthos communities in HD samples were significantly different between Waukegan and Burns Harbors (R=0.42, p=0.002). The AOC and non-AOC communities were found to be 73-percent dissimilar based on a SIMPER test, which also identified Dreissena, oligochaetes Nais barbata and Nais communis, and midge Dicrotendipes to be responsible for approximately 15 percent of dissimilarity between the AOC and non-AOC.
MDS and ANOSIM results for combined benthos (dredge and HD) were similar to results for HD and dredge samples, and WH1 spring and fall samples plotted away from a tight
16 Comparison of Benthos and Plankton for Waukegan and Burns Harbors, Illinois and Indiana, 2015
A
Site abbreviation
BH1Dup
BH1
BH3
BH5
WH1
WH3Dup
WH3
WH5
Percent similarity
40
BH1DupFL
BH1FL
BH1SPBH3FL
BH3SP
BH5FL
BH5SP
WH1FL
WH1SP
WH3DupSP
WH3FL
WH3SP
WH5FL
WH5SP
Two-dimensional stress: 0.11 EXPLANATION
Dimension 1
Dim
ensi
on 2
B
BH1DupFL
BH1FL BH1SP
BH3FL
BH3SP
BH5FL
BH5SP
WH1FL
WH1SP
WH3DupSP
WH3FL
WH3SP
WH5FL
WH5SP Two-dimensional stress: 0.12
Site abbreviation
BH1Dup
BH1
BH3
BH5
WH1
WH3Dup
WH3
WH5
Percent similarity
40
EXPLANATION
Dim
ensi
on 2
Dimension 1
Figure 10. Multidimensional scaling ordinations for benthos communities for A, dredge samples, B, Hester-Dendy (HD) artificial substrate samples, and C, combined (dredge and HD) samples collected at Waukegan Harbor Area of Concern, Illinois, and Burns Harbor-Port of Indiana non-Area of Concern, Indiana, 2015. SP denotes spring samples, FL denotes fall samples; site abbreviations are provided in table 1.

Condition of the Benthos and Plankton Communities 17
C
BH1DupFLBH1FL
BH1SPBH3FL
BH3SP
BH5FL
BH5SP
WH1FL
WH1SP
WH3DupSP
WH3FL
WH3SP
WH5FL
WH5SP
Two-dimensional stress: 0.13Site abbreviation
BH1Dup
BH1
BH3
BH5
WH1
WH3Dup
WH3
WH5
Percent similarity
40
EXPLANATION
Dimension 1
Dim
ensi
on 2
Figure 10. Multidimensional scaling ordinations for benthos communities for A, dredge samples, B, Hester-Dendy (HD) artificial substrate samples, and C, combined (dredge and HD) samples collected at Waukegan Harbor Area of Concern, Illinois, and Burns Harbor-Port of Indiana non-Area of Concern, Indiana, 2015. SP denotes spring samples, FL denotes fall samples; site abbreviations are provided in table 1.—Continued
grouping of other Waukegan Harbor samples but still closer to these samples than to Burns Harbor samples (fig. 10C). A one-way ANOSIM test indicated that combined benthos commu-nities across both seasons and all subsites were significantly different between Waukegan and Burns Harbors (R=0.68, p=0.002). A SIMPER test found the AOC and non-AOC to be 63-percent dissimilar, with Dreissena and oligochaetes Potamothrix vejdovskyi, Nais communis, Nais barbata, and Quistradrilus multisetosus responsible for nearly 15 percent of the dissimilarity the groups.
Plankton Community Comparisons Between Waukegan and Burns Harbors
On average, zooplankton taxa richness was higher in Burns Harbor than Waukegan Harbor (table 6, fig. 11). Mean richness was 14.8 ± 6.4 in Waukegan Harbor and 16.7 ± 3.1 in Burns Harbor. Mean diversity was 1.26 ± 0.80 in Waukegan Harbor and 1.30 ± 0.37 in Burns Harbor. Taxa richness and diversity were not significantly different between Waukegan and Burns Harbors across both seasons and including field
replicates. However, within seasons and without the field replicate samples, taxa richness and diversity at Waukegan Harbor were significantly lower and rated as more degraded than at Burns Harbor in spring samples but were significantly higher and rated as less degraded than at Burns Harbor in fall samples. These seasonal differences effectively balanced each other out when zooplankton richness was compared across both seasons, and these opposing seasonal differences pre-cluded a finding of significance across seasons.
The dominant zooplankton taxa in freshwater environments are rotifers, microcrustaceans such as cladocerans and copepods, and protozoans. Differences in spring zooplankton richness between the harbors in spring could have been due in part to the difference in surface-water temperature between the harbors. Rotifers can respond quickly to warming temperatures in spring with short development times and high population growth rates (Wallace and Snell, 1991). The spring zooplankton community in Waukegan Harbor was dominated (>68 percent) by the rotifer Synchaeta in all samples except the fall sample from WH5, where it ranked second to the cladoceran Bosmina longirostris. Synchaeta was also dominant with regard to biomass at

18 Comparison of Benthos and Plankton for Waukegan and Burns Harbors, Illinois and Indiana, 2015
Table 6. Richness and diversity values for plankton communities collected at Waukegan Harbor Area of Concern, Illinois, and Burns Harbor-Port of Indiana non-Area of Concern, Indiana, 2015.
[Refer to table 1 for the complete subsite names]
Subsite abbreviation
SeasonZooplankton Diatoms Soft algae Combined Phytoplankton3
Richness1 Diversity2 Richness Diversity Richness Diversity Richness Diversity
Waukegan Harbor Area of Concern
WH1 Spring 13 0.79 60 3.00 9 0.78 69 1.66Fall 20 2.22 60 3.15 6 0.54 66 1.55
WH3 Spring 3 0.09 62 3.26 7 0.53 69 1.34Fall 20 1.75 46 2.48 8 1.55 54 2.76
WH5 Spring 15 0.89 65 3.39 5 0.61 70 2.19Fall 18 1.82 62 2.92 9 0.67 71 1.47
Burns Harbor non-Area of Concern
BH1 Spring 19 1.35 48 3.18 8 0.68 56 2.74Fall 15 1.11 46 2.13 12 1.40 58 2.13
BH3 Spring 20 1.74 46 3.15 9 0.77 55 2.62Fall 12 0.67 53 2.75 13 2.01 66 3.06
BH5 Spring 19 1.52 54 3.21 7 0.61 61 2.12Fall 15 1.41 48 2.49 13 1.51 61 2.66
1Richness computed as the number of unique taxa in the sample.2Shannon diversity, calculated as loge (Shannon, 1948).3Phytoplankton richness and diversity comparisons in this table were calculated for combined soft algae and diatoms.
WH1 and WH3 in spring samples, and it ranked second in dominance to dreissenid veligers or Keratella crassa, another rotifer, in all Burns Harbor samples. Synchaeta is also common in the Great Lakes, tolerant to pollution (Stemberger, 1979), and it was abundant in Milwaukee Harbor in spring and summer 2012 (Scudder Eikenberry and others, 2014). A common or cosmopolitan taxon with a worldwide distribution, Bosmina longirostris prefers cool and well-oxygenated water, and it can be one of the most abundant crustaceans in the Great Lakes in summer (Balcer and others, 1984). In 2015, Polyarthra vulgaris was one of the top five dominant taxa in all samples from Waukegan Harbor and all samples from Burns Harbor except BH3 in spring, where it was still common, and it is pollution tolerant (Gannon and Stemberger, 1978). Rotifers Ploesoma truncatum and Collotheca were less abundant but still among the dominant taxa in one or more samples from Burns Harbor. Dreissenid veligers ranked second to Synchaeta in density dominance at WH1 and WH5 in spring and were among the top five dominant taxa at WH5 in fall, but they were not among the dominant taxa at WH3 in either season. Calanoid and cyclopoid nauplii were among the dominant taxa with regard to densities at Waukegan Harbor and ranked first or second with regard to biomass in all samples from the harbor. Calanoid and Cyclopoid copepod nauplii were not as prevalent in Burns Harbor and were among the top five dominant taxa only at BH3 and BH5 in spring;
however, copepod nauplii dominated biomass from all Burns Harbor subsites in spring.
In the MDS ordination plot for zooplankton, communi-ties for both harbors formed distinct groups for each season (fig. 12). Zooplankton communities in Waukegan Harbor had greater variability in spring compared to fall when compared to Burns Harbor samples, which all clearly grouped together in the ordination plot. Spring samples for WH3 and WH3Dup plotted away from other Waukegan samples and Burns Harbor samples. Burns Harbor spring and fall samples formed dis-tinctly separate groups. According to a one-way ANOSIM test, the communities in Waukegan Harbor across all seasons were not significantly different from Burns Harbor, whether or not dreissenid veligers were included in the analyses. A one-way SIMPER test found that the AOC and non-AOC were on aver-age 45-percent dissimilar, with the rotifer Keratella crassa, Dreissena veligers, Calanoid copepod nauplii, and cladoceran Bosmina longirostris contributing to approximately 30 percent to the dissimilarity between groups. However, when AOC and non-AOC samples were compared by use of ANOSIM on a seasonal basis, differences (p=0.10) were found between the AOC and non-AOC for spring and fall samples. On the other hand, one-way SIMPER tests on a per season basis showed average dissimilarities between the AOC and non-AOC to be nearly the same as the dissimilarity found when all AOC and non-AOC samples were compared.

Condition of the Benthos and Plankton Communities 19
EXPLANATION
Samples
Rang
e
Stan
dard
dev
iatio
n (S
D)
Mean (M)
Waukegan outer harbor (WH1)
Burns south harbor (BH1)
Waukegan inner harbor (WH3)
Burns west harbor (BH3)
Waukegan north harbor (WH5)
Burns east harbor (BH5)
Spring Fall
WaukeganHarbor
BurnsHarbor
WaukeganHarbor
BurnsHarbor
Rang
e
SD
SD
M
25
20
15
10
5
0
2.5
2.0
1.5
1.0
0.5
0.0
Zoop
lank
ton
rich
ness
Zoop
lank
ton
dive
rsity
Figure 11. Richness and diversity metrics for zooplankton communities collected at Waukegan Harbor Area of Concern, Illinois, and Burns Harbor-Port of Indiana non-Area of Concern, Indiana, 2015.
Phytoplankton community metrics were compared for Waukegan and Burns Harbors by comparing diatom and soft algae communities individually and as combined phy-toplankton communities (diatom and soft algae communi-ties combined; figs. 13A–C; table 6). Mean diatom richness was 59.1 ± 6.7 in Waukegan Harbor and 49.2 ± 3.5 in Burns Harbor. Diatom richness across subsites and seasons (with or without replicates) was significantly higher and rated as less degraded in Waukegan Harbor than Burns Harbor because of higher richness in spring but not in fall. Conversely, soft algae richness across subsites and seasons (with replicates) was significantly higher in Burns Harbor than Waukegan Harbor with higher richness in fall in Burns Harbor but not in spring. Mean soft algae richness was 7.3 ± 1.6 in Waukegan Harbor and 10.3 ± 2.7 in Burns Harbor. Across all seasons, mean combined phytoplankton richness was 66.5 ± 6.4 in Waukegan Harbor and 59.5 ± 4.0 in Burns Harbor and was not signifi-cantly different between the two harbors. However, within sea-sons and without replicates, richness was significantly higher in Waukegan than in Burns Harbor in the spring season only.
Diversity of diatom communities was slightly higher in Waukegan Harbor samples (3.0 ± 0.3 in Waukegan Harbor and 2.8 ± 0.4 in Burns Harbor), while mean diversity for soft algae was slightly higher in Burns Harbor (0.8 ± 0.4 in Waukegan Harbor and 1.2 ± 0.6 in Burns Harbor). However, across sub-sites and seasons, and within seasons, neither diatom diversity nor soft algae diversity differed significantly between the har-bors. Across seasons and with replicates included, combined phytoplankton diversity was significantly lower and therefore rated as more degraded in Waukegan Harbor than in Burns Harbor (1.83 ± 0.54 in Waukegan Harbor and 2.56 ± 0.37 in Burns Harbor). However, the difference in diversity was not significant without replicates because of the influence of a high fall diversity value at WH3.
The dominant soft algal taxon with regard to density was an unknown cryptophyte found in all Waukegan samples except the fall sample at WH3, where the green alga Scenedes-mus ecornis was dominant. Scenedesmus ecornis is tolerant of high concentrations of nutrients (eutrophic), specifically nitrogen and phosphorus (Porter, 2008). An unknown crypto-phyte was also dominant in all Burns Harbor samples except in fall at BH3, where an unknown coccoid green alga domi-nated, and at BH5, where an unknown filamentous blue-green alga dominated. The unknown cryptophyte also dominated most samples with regard to biomass; however, a Euglena sp. dominated biomass in spring samples at WH1 only and this taxon is tolerant of eutrophic conditions (Porter, 2008). A spe-cies of Dinobryon, a colonial and free-swimming Chrysophyte that can fix nitrogen (Porter, 2008), and an unknown coccoid green alga were usually secondary in density in both harbors. Another tolerant Scenedesmus taxon, Scenedesmus quadri-cauda, was among the top five dominant taxa with regard to density in spring samples at WH1, WH3, and all Burns Harbor samples, and with regard to biomass in many Burns Harbor samples. Scenedesmus acuminatus and Scenedesmus ecor-nis were subdominant in some samples from Burns Harbor.

20 Comparison of Benthos and Plankton for Waukegan and Burns Harbors, Illinois and Indiana, 2015
40
60
BH1DupFL
BH1FL
BH1SP
BH3FL
BH3SP
BH5FL
BH5SPWH1FL
WH1SP
WH3DupSP
WH3FL
WH3SP
WH5FL
WH5SP
Two-dimensional stress: 0.05
Site abbreviation
BH1Dup
BH1
BH3
BH5
WH1
WH3Dup
WH3
WH5
Percent similarity
EXPLANATION
Dimension 1
Dim
ensi
on 2
Figure 12. Multidimensional scaling ordinations for zooplankton communities collected at Waukegan Harbor Area of Concern, Illinois, and Burns Harbor-Port of Indiana non-Area of Concern, Indiana, 2015. SP denotes spring samples, FL denotes fall samples; site abbreviations are provided in table 1.
Dinoflagellates were important with regard to biomass, rank-ing second or third in all Waukegan Harbor samples and most Burns Harbor samples, even first at BH3 in spring. Nodularia, a blue-green alga tolerant of eutrophic conditions and capable of producing toxins, was found in low densities (9.3 cells/mL) at WH5 in fall, and this was the only toxin-producing alga found at either site during the study.
For diatoms, both pennate and centric diatoms ranked among the top five dominant taxa. In spring, the pennate Diatoma tenuis or centric Thalassiosira pseudonana were primary or secondary in dominance by density and biomass at all Waukegan Harbor subsites except WH3, where Fragilaria mesolepta dominated. Diatoma tenuis and Thalassiosira pseudonana are indicators of eutrophic and hypereutrophic conditions, respectively (Porter, 2008). Either the pennates Diatoma tenuis or Diploneis marginestriata (nutrient sensitive) or the centrics Cyclotella comensis or Thalassiosira pseudonana had the highest or second highest densities in all Burns Harbor subsites in spring, but Diatoma tenuis had the highest biomass. In fall, Urosolenia and Ulnaria delicatissima var. angustissima (synonym Fragilaria delicatissima var. angustissima) dominated diatom densities in all samples from both harbors. Additional diatoms among the top five dominant taxa for density at Waukegan Harbor were Achnanthidium minutissimum, Cyclotella comensis,
Cyclostephanos invisitatus, several species of Nitzschia, Fragilaria capucina and Fragilaria tenera, and several other taxa with densities of about 10 cells per milliliter or less. In Burns Harbor, additional subdominant diatoms with regard to density included Achnanthidium minutissimum, Cyclotella comensis, Discostella pseudostelligera, Fragilaria capucina and Fragilaria tenera, and several species of Nitzschia.
In Waukegan Harbor, soft algae dominated diatoms with regard to density except at WH3 in fall (56 percent diatoms to 44 percent soft algae), and the proportion of soft algae ranged from 66 to 85 percent in the remaining samples. In Burns Harbor, soft algae dominated diatoms in 3 of 7 samples by over 65 percent; however, soft algae were in lower proportion to diatoms in the spring BH1 sample (55 percent diatoms to 45 percent soft algae), and the percentages of soft algae and diatoms were similar in BH3 samples and in spring at BH5. Diatoms usually dominate phytoplankton communities in large rivers and lakes, and the percentage of diatoms tends to decrease with pollution. Changes in the phytoplankton community from a dominance by diatoms to a dominance by green or blue-green algae can have an adverse and cascading effect on primary and secondary consumers (Flotemersch and others, 2006). For this reason, a dominance of soft algae over diatoms is generally considered an indication of degraded water quality.

Condition of the Benthos and Plankton Communities 21
0
20
40
60
80
Diat
om ri
chne
ss
Spring Fall
0.0
1.0
2.0
3.0
Diat
om d
iver
sity
70
50
30
10
3.5
2.5
1.5
0.5
Rang
e
SD
SDM
0
2
4
6
8
10
12
14
Soft
alga
e ric
hnes
s
Spring Fall
0.0
0.5
1.0
1.5
2.0
Soft
alga
e di
vers
ity
Rang
e
SD
SD
M
0
10
20
30
40
50
60
70
Com
bine
d ph
ytop
lank
ton
richn
ess
Spring Fall
0.0
0.5
1.0
1.5
2.0
2.5
3.0
Com
bine
d ph
ytop
lank
ton
dive
rsity
Rang
e
SD
SD
M
A
B C
Rang
e
Stan
dard
dev
iatio
n (S
D)
Mean (M)
EXPLANATION
Samples
Waukegan outer harbor (WH1)
Burns south harbor (BH1)
Waukegan inner harbor (WH3)
Burns west harbor (BH3)
Waukegan north harbor (WH5)
Burns east harbor (BH5)
WaukeganHarbor
BurnsHarbor
WaukeganHarbor
BurnsHarbor
WaukeganHarbor
BurnsHarbor
WaukeganHarbor
BurnsHarbor
WaukeganHarbor
BurnsHarbor
WaukeganHarbor
BurnsHarbor
Figure 13. Richness and diversity metrics for phytoplankton communities for A, diatoms, B, soft algae, and C, combined (diatoms and soft algae) phytoplankton samples collected at Waukegan Harbor Area of Concern, Illinois, and Burns Harbor-Port of Indiana non-Area of Concern, Indiana, 2015.

22 Comparison of Benthos and Plankton for Waukegan and Burns Harbors, Illinois and Indiana, 2015
In MDS plots, diatom and soft algae communities appeared to have much less distinct groupings than the ben-thos and zooplankton communities (figs. 14A–C). In general, for diatom and soft algae communities, samples from Wauke-gan Harbor grouped to one side of the MDS plot, and samples from Burns Harbor grouped to the opposite side; however, there was high variability among samples. Diatom samples collected in the same season at each of the subsites generally grouped nearest to one another (fig. 14A). Diatom communi-ties in Waukegan Harbor were nearly significantly different from communities in Burns Harbor, according to a one-way ANOSIM test (R=0.26, p=0.058), yet more data would be use-ful to confirm. A one-way SIMPER test found that the AOC and non-AOC were on average 53-percent dissimilar, and the test identified the diatom taxa Urosolenia, Diploneis margin-estriata, Discostella pseudostelligera, Fragilaria mesolepta, Fragilaria tenera, and Diatoma ehrenbergii to be contributing to approximately 10 percent of the dissimilarity between sites. Across seasons, diatom communities at the two harbors were not significantly different at p<0.05; however, differences were found in spring and fall at p=0.10 (mean dissimilarities were 51 and 48 percent for spring and fall, respectively). In spring samples, diatom taxa Fragilaria mesolepta and Fragilaria tenera, Cyclotella atomus, and Discostella pseudostelligera,
and in fall samples, Discostella pseudostelligera, Diploneis marginestriata, Aulacoseira ambigua, Diatoma ehrenbergii, and Staurosirella pinnata accounted for about 10 percent of the dissimilarity between the AOC and the non-AOC.
Season was important for distinguishing soft algae samples in MDS plots and appeared to be more important than differences between harbors. Samples collected in the spring from Waukegan and Burns Harbors grouped most closely together and away from fall samples; however, WH1 was more similar to Burns Harbor spring samples than to Waukegan spring samples (fig. 14B). Most fall samples grouped together except for WH1, which plotted in between the two season groupings. According to a one-way ANOSIM test, there was a difference at p=0.10 between soft algae communities in Waukegan Harbor and Burns Harbor. A one-way SIMPER test found that the communities at each site were on average 44-percent dissimilar, and an unknown blue-green filament and the green algae Scenedesmus ecornis and Scenedesmus quadricauda accounted for almost 30 percent of the dissimilarity between groups. Significant differences were also found at p=0.10 between the AOC and the non-AOC soft algae communities when the spring (R=0.37, mean dissimilarity=32 percent) and fall (R=1.0, mean dissimilarity=43 percent) were compared independently.
A
BH1DupFL
BH1FL
BH1SP
BH3FL
BH3SP
BH5FL
BH5SP
WH1FLWH1SP
WH3DupSP
WH3FL
WH3SP WH5FL
WH5SP
Two-dimensional stress: 0.12
50
Site abbreviation
BH1Dup
BH1
BH3
BH5
WH1
WH3Dup
WH3
WH5
Percent similarity
EXPLANATION
Dimension 1
Dim
ensi
on 2
Figure 14. Multidimensional scaling ordinations for phytoplankton communities for A, diatoms, B, soft algae, and C, combined (diatom and soft algae) phytoplankton samples collected Waukegan Harbor Area of Concern, Illinois, and Burns Harbor-Port of Indiana non-Area of Concern, Indiana, 2015. SP denotes spring samples, FL denotes fall samples; site abbreviations are provided in table 1.

Condition of the Benthos and Plankton Communities 23
B
BH1DupFL
BH1FL
BH1SP
BH3FL
BH3SP
BH5FL
BH5SP
WH1FL
WH1SP
WH3DupSP
WH3FL
WH3SP
WH5FL
WH5SP
Two-dimensional stress: 0.1
50
Site abbreviation
BH1Dup
BH1
BH3
BH5
WH1
WH3Dup
WH3
WH5
Percent similarity
EXPLANATION
Dimension 1
Dim
ensi
on 2
C
BH1DupFL
BH1FL
BH1SP
BH3FL
BH3SP
BH5FL
BH5SP
WH1FLWH1SP
WH3DupSP
WH3FLWH3SP
WH5FL
WH5SP
Two-dimensional stress: 0.1
50
Site abbreviation
BH1Dup
BH1
BH3
BH5
WH1
WH3Dup
WH3
WH5
Percent similarity
EXPLANATION
Dimension 1
Dim
ensi
on 2
Figure 14. Multidimensional scaling ordinations for phytoplankton communities for A, diatoms, B, soft algae, and C, combined (diatom and soft algae) phytoplankton samples collected Waukegan Harbor Area of Concern, Illinois, and Burns Harbor-Port of Indiana non-Area of Concern, Indiana, 2015. SP denotes spring samples, FL denotes fall samples; site abbreviations are provided in table 1.—Continued

24 Comparison of Benthos and Plankton for Waukegan and Burns Harbors, Illinois and Indiana, 2015
In spring samples, green algae Scenedesmus acuminatus, Scenedesmus quadricauda, and Ankistrodesmus accounted for about 35 percent of the dissimilarity and, in the fall, an unknown Cyanophyte filament and green algae Scenedesmus ecornis and Didymocystis accounted for almost 40 percent of the dissimilarity between groups.
In the combined phytoplankton MDS plot (fig. 14C), seasonal and site groupings among Waukegan and Burns har-bor phytoplankton communities were distinct, and a one-way ANOSIM showed that the combined phytoplankton com-munities at Waukegan Harbor and Burns Harbor were nearly but not quite significantly different across seasons (p=0.054). A one-way SIMPER test found that the communities at each site were on average 52-percent dissimilar, and an unknown Cyanophyte (blue-green) filament, green algae Scenedesmus ecornis and Scenedesmus quadricauda, and diatoms Uroso-lenia, Discostella pseudostelligera, and Diploneis margin-estriata accounted for about 10 percent of the dissimilarity between groups. Differences at p=0.10 were found between the combined phytoplankton communities in the AOC and non-AOC in the spring (R=0.85, mean dissimilarity=49 per-cent) and fall (R=0.59, mean dissimilarity=47 percent). In the spring, diatoms Fragilaria mesolepta, Fragilaria tenera, Cyclotella atomus, Discostella pseudostelligera, and Frag-ilaria capucina var. gracilis accounted for about 10 percent of the dissimilarity, and in the fall, an unknown Cyanophyte fila-ment together with green algae Scenedesmus ecornis, Didymo-cystis sp., and Micractinium sp. accounted for about another 10 percent of dissimilarity between the groups.
Quality AssuranceQuality assurance and quality control (QA/QC) samples
were collected during each sampling period in order to evalu-ate field variability of taxonomic results. Primary and replicate samples were collected at Waukegan Harbor in spring and at Burns Harbor in fall. Similarities between primary and rep-licate samples were compared by using the SIMPER routine in PRIMER software to compare similarity matrixes of the taxonomic data (Clarke and Gorley, 2006). Similarities greater than 60 percent between replicates are considered acceptable for QA/QC purposes in community analyses (Kelly, 2001). For each season, primary and replicate samples within each site had similarities greater than 60 percent except for benthos dredge samples and diatom samples at Burns Harbor (table 7). By use of relative abundances for combined benthos and combined phytoplankton samples in comparisons between the AOC and non-AOC, the effects of the dredge and diatom taxa differences on the benthos and phytoplankton comparisons were lessened. It is often difficult to characterize biological communities precisely because of patchy distributions and low abundances. Overall, QA/QC results indicated minimal variability among field replicates within each season for most taxonomic groups.
Table 7. Quality assurance and quality control (QA/QC) results for replicate samples of benthos and plankton collected in 2015 at Waukegan Harbor Area of Concern, Illinois, and Burns Harbor-Port of Indiana non-Area of Concern, Indiana, showing similarity for relative abundance of taxa collected within each season.
[Similarities greater than 60 percent, indicating QA/QC results within acceptable limits, are in gray. HD, Hester-Dendy artificial substrate sampler]
Season Taxonomic group Percent similarity
Waukegan Harbor Area of Concern
Spring Benthos (HD) 71.3Benthos (dredge) 72.6Benthos (combined) 77.1Zooplankton 84.0Diatoms 66.1Soft algae 88.3Algae (combined) 68.7
Burns Harbor non-Area of Concern
Fall Benthos (HD) 62.2Benthos (dredge) 40.1Benthos (combined) 65.6Zooplankton 86.3Diatoms 53.2Soft algae 75.0Algae (combined) 60.5
Comparison to Historical DataThe Illinois Environmental Protection Agency sampled
the benthos of Waukegan Harbor AOC in 1972 and 1996 and found primarily pollution-tolerant oligochaetes in both years (Illinois Environmental Protection Agency and Waukegan Citi-zens Advisory Group, 1994; Illinois Environmental Protection Agency, 1999). In 1996, oligochaetes made up 88 percent of the benthos, which was rated as “very poor” based on values for a biotic index; however, some degradation was attributed to suspended sediment from commercial vessels. Oligochaetes dominated the benthos of Waukegan Harbor in 2015 based on our study results and, although most of the oligochaetes were immature forms, the adults identified to species are known to be pollution tolerant (Bode and others, 2002).
Benthos and plankton were previously sampled in Waukegan and Burns Harbors in July and August 2012 prior to completion of sediment dredging for remediation (Battelle, 2013). Weather during the spring and summer of 2012 was uncharacteristic, with an early spring and record-breaking high temperatures and drought conditions in summer. How-ever, water temperature data were not collected in 2012. To increase comparability between the present study and previous sampling, the locations selected for 2015 sampling in each harbor were those same sites where both benthos and plankton

Summary and Conclusions 25
sampling occurred in 2012. Locations of subsites WH1, WH3, WH3Dup, and WH5 in Waukegan Harbor and subsites BH1, BH1Dup, BH3, and BH5 were the same in both stud-ies. Notable differences in the 2012 field collection methods (Battelle, 2013) were that HD samplers were not deployed in Burns Harbor and that the Waukegan HD sampler was lost, so benthos data for HD samplers from the 2012 study cannot be compared to data from our study. The 2012 study used a Van Veen dredge, which is similar to a Ponar® dredge, to collect three composited subsamples of sediment at each subsite. Sediment for benthos community samples was processed through the same mesh size (500 µm) screen as for the current study. Identifications for benthos may differ between labora-tories despite the use of the same analytical methods. Primary large-cell zooplankton samples were collected with a 63-µm mesh net from 0.5 m above the harbor bottom to the surface, whereas our study sampled to 5-m depth but generally not as deep as 0.5 m above the bottom. The 2012 study did not use Alka-Seltzer and sucrose formalin for zooplankton preserva-tion, and this could affect quantitative comparisons between the studies. Lastly, in the previous study, whole water samples for phytoplankton were collected with a Van Dorn sampler, which is similar to the Kemmerer sampler used in our study. Battelle (2013) also collected a separate depth-integrated sample of whole water and then passed it through a filter with 20-µm pore size to trap small-cell rotifers, and these data were not comparable with the current study. With these exceptions, Battelle used the same SOPs for benthos and plankton and the same laboratory for plankton identification and enumeration as were used in the current study.
As was found in this study for data collected in 2015, Battelle (2013) found that richness in 2012 dredge samples was significantly higher at Waukegan Harbor than Burns Harbor for dredge samples across subsites and seasons and for seasons separately. Mean benthos richness in 2012 dredge samples was 14.6 ± 4.6 and 7.6 ± 4.0 in Waukegan and Burns Harbors, respectively. Mean richness for dredge samples was slightly but not significantly lower in 2012 than in 2015 (compare to 20.3 ± 3.2 and 8.7 ± 3.4 in Waukegan and Burns Harbors for 2015) when overlapping subsites were com-pared. Diversity values for dredge samples in 2012 were not significantly different from 2015 for both harbors and, as in our study, no significant differences were found between the harbors in 2012. Mean diversity in 2012 was 1.54 ± 0.37 and 1.30 ± 0.38 for Waukegan and Burns Harbors, respectively (compare to 1.37 ± 0.41 and 1.23 ± 0.28 in Waukegan and Burns Harbors for 2015). Oligochaetes and midges were the dominant taxa in dredge samples collected in 2012 as well as 2015 in both harbors.
For large-cell (>63-µm) zooplankton tow data across subsites, mean richness in 2012 was significantly lower at Waukegan Harbor than Burns Harbor in August but not in July. Mean zooplankton tow richness in 2012 was 12.2 ± 1.5 and 13.8 ± 3.0 in Waukegan and Burns Harbors, respectively (compare to 14.8 ± 6.4 and 16.7 ± 3.1 in Waukegan and Burns Harbors for 2015). Neither richness nor diversity for
zooplankton tows differed significantly between 2012 and 2015, nor did richness or diversity across sampling events dif-fer between harbors in either year. Zooplankton tow diversity in 2012 was significantly higher at Waukegan Harbor than Burns Harbor in July but significantly higher at Burns Harbor in August. A reversal between seasons but in the opposite direction was seen in 2015 for richness and diversity. Mean diversity in 2012 was 0.92 ± 0.55 and 0.86 ± 0.67 for Wauke-gan and Burns Harbors, respectively (compare to 1.26 ± 0.80 and 1.30 ± 0.37 in Waukegan and Burns Harbors for 2015).
Phytoplankton richness across subsites in 2012 was significantly higher at Waukegan Harbor than Burns Harbor in July but not in August with mean values of 71.5 ± 9.4 and 50.8 ± 12.3 in Waukegan and Burns Harbors, respectively. Diversity was significantly higher at Waukegan Harbor than Burns Harbor in July and August 2012 (Battelle, 2013). Mean diversity in 2012 was 2.93 ± 0.35 at Waukegan Harbor, compared to 1.74 ± 0.36 in Burns Harbor. Richness was not significantly different between 2012 and 2015 for either harbor; however, diversity in 2015 was significantly lower at Waukegan Harbor and higher at Burns Harbor in comparison to 2012 (compare to 1.83 ± 0.54 and 2.56 ± 0.37 in Waukegan and Burns Harbors for 2015).
Comparison of the results from 2012 and 2015 for two sampling events each year demonstrate the importance of sam-pling across multiple seasons and years because of the variable and patchy nature of aquatic communities. Although results in 2012 and 2015 were similar for benthos and zooplankton rich-ness and diversity and for phytoplankton richness at Wauke-gan Harbor, phytoplankton diversity was lower at Waukegan Harbor in 2015 even though the 2012 sampling was prere-mediation and the 2015 sampling was postremediation. The possible causes of the difference in phytoplankton diversity results may relate to sampling timing (July and August in 2012 compared to June and August in 2015) or biological, chemical, or physical differences between sampling years.
Summary and ConclusionsThis report describes study areas and field sampling
methods and provides data collected during two seasonal sampling events in June and August of 2015 at Waukegan Harbor Area of Concern (AOC) in Waukegan, Illinois, and a non-AOC comparison harbor, Burns Harbor-Port of Indiana, near Portage, Indiana, for characterization of benthos (benthic invertebrates) and plankton (zooplankton and phytoplankton) communities. The U.S. Geological Survey completed the study in cooperation with the Illinois Department of Natural Resources and the U.S. Environmental Protection Agency. Samples were collected from each harbor at three primary locations or “subsites,” plus one nearby replicate subsite, and all these samples served as replicates for comparison between the two sites. In addition to data on abundance and distribution of benthos and plankton taxa at these sites, ancillary data are

26 Comparison of Benthos and Plankton for Waukegan and Burns Harbors, Illinois and Indiana, 2015
included for sediment characterization (volatile-on-ignition solids and percentages of sand, silt, and clay), algal density and biomass (chlorophyll-a, total and volatile suspended solids), and water quality (water temperature, pH, specific conductance, and dissolved oxygen). The data collection described and subsequent interpretations in this report are part of a study designed to assess the status of the benthos and plankton communities in Waukegan Harbor AOC in com-parison to those at the non-AOC for evaluation of the related Beneficial Use Impairments at the AOC. If the communities of benthos and (or) plankton in the AOC are not significantly degraded in comparison to the communities at a presumptively less impaired non-AOC of similar environmental character-istics, then the U.S. Environmental Protection Agency and Illinois Department of Natural Resources may decide that the Beneficial Use Impairment(s) can be removed as a step toward delisting the AOC. The 2015 sampling by the U.S. Geological Survey characterized the communities postremediation/dredg-ing, whereas the 2012 sampling by Battelle characterized the communities preremediation/dredging. Results in 2012 and 2015 were similar for benthos and zooplankton richness and diversity at both harbors. Although results for phytoplankton richness were similar in 2012 and 2015, phytoplankton diver-sity in 2015 was significantly lower at Waukegan Harbor in comparison to Burns Harbor.
The non-AOC selected as a comparison site for this study was the best available with regard to being presumptively less impaired, having similar physical characteristics to the AOC, hosting large Great Lakes shipping industries, and being located in Lake Michigan. The selection of a comparison site meant finding at least one nearby man-made harbor with no riverine input. The limitations of a single site comparison are recognized. When the benthos or plankton community at an AOC is rated as more impaired than a non-AOC compari-son site, whether or not the non-AOC has some impairment itself, it emphasizes the finding of impairment at the AOC. Conversely, a finding of no statistical difference between a community or sample at an AOC and selected non-AOC does not mean that the benthos or plankton community at an AOC is unimpaired, just that the AOC is not impaired in comparison to the non-AOC. A finding of no statistical difference could mean that the AOC and non-AOC are equally impaired.
It is critical to consider a variety of measures when comparing communities at an AOC with communities at one or more less-impaired sites because some measures address only a single aspect of the community. Use of both structural measures that relate to the relative numbers of different organ-isms (for example, richness, diversity, and relative abundance) and functional measures that relate to the role or preferences of different organisms (for example, environmental tolerances) are important in any complete assessment of ecological status. An aquatic community can change in many ways without a significant change in richness or structural diversity, such as when more tolerant replace less tolerant taxa or when green or blue-green algae replace diatoms. Multivariate statisti-cal analyses such as multidimensional scaling and analysis
of similarity may be more sensitive at detecting community change than diversity or richness metrics because multivariate methods test differences on the basis of the specific taxa pres-ent at each site. An Index of Biotic Integrity is a multimetric that combines structural and functional measures and may therefore be a more effective assessment tool than a single measure for defining differences or change.
Whether or not the communities were significantly differ-ent from another, metrics such as richness, diversity, or Index of Biotic Integrity should be similar or higher at the AOC if it is not degraded or impaired in relation to the non-AOC. Benthos richness and diversity were significantly higher and rated as less degraded at Waukegan Harbor AOC than Burns Harbor non-AOC, and benthos Index of Biotic Integrity values for Hester Dendy samples were not significantly different between the two harbors. Dominant taxa in dredge samples from Waukegan Harbor were immature oligochaetes, pollu-tion-tolerant midge larvae, and adult oligochaetes. Immature oligochaetes or Dreissena mussels were the most dominant taxa at Burns Harbor, followed by pollution-tolerant midge larvae and adult oligochaetes. Dreissena were more abun-dant at Burns Harbor. Immature oligochaetes are by far more abundant than adult oligochaetes in most benthic habitats. Results for plankton were mixed with regard to impairment at Waukegan Harbor. Although zooplankton richness and diversity were significantly lower and rated as more degraded in spring at Waukegan Harbor than Burns Harbor, these two metrics were significantly higher in fall at the AOC than the non-AOC. Multivariate tests confirmed that zooplankton com-munities at the AOC were significantly different from those at the non-AOC in spring but not in fall or across both seasons. The differences in spring could have been due in part to the difference in surface-water temperature between the two har-bors, with cooler spring temperatures at the AOC than the non-AOC. Copepod nauplii dominated biomass in Burns Harbor in spring. The common and tolerant rotifer Synchaeta was domi-nant in Waukegan Harbor, except for one fall sample in which it was codominant with the cladoceran Bosmina longirostris, another taxon common during summer in the Great Lakes. For phytoplankton, diatom richness was significantly higher across both seasons and was rated as less degraded in Wauke-gan Harbor than in the non-AOC. The reverse was true for soft algae richness; combined phytoplankton (diatoms and soft algae combined) richness was significantly different between the harbors in spring only. Although neither diatom nor soft algae diversity differed significantly between the harbors, combined phytoplankton diversity across seasons was signifi-cantly lower when replicates were included. Multivariate tests indicated that the combined phytoplankton communities in the AOC were not significantly different from those at the non-AOC. Neither chlorophyll-a concentrations, suspended solids, nor the density and biomass of combined phytoplankton were significantly different between the two harbors. Soft algae den-sities were higher than diatom densities in all but one sample from the AOC but not from the non-AOC. The dominance of
References Cited 27
soft algae over diatoms is generally considered an indication of degraded water quality.
A combination of standard statistics and computed biological metrics, as well as multivariate ordinations with community data, provided a means to evaluate whether or not the aquatic community at Waukegan Harbor AOC was signifi-cantly different from a comparison site presumed to be less impaired. A comparison of metrics between Waukegan Harbor and the non-AOC Burns Harbor indicated that although the benthos community in the AOC rated as less degraded than in the non-AOC, one or more AOC metrics for zooplankton and phytoplankton communities were rated as degraded, depend-ing on season. This suggests that the plankton Beneficial Use Impairments at the AOC site were still present in 2015, more than a year after sediment remediation was completed. This information can be used as input to management deci-sions regarding whether or not removal of the Beneficial Use Impairments is appropriate for degradation of benthos and for degradation of zooplankton and phytoplankton communities. Results can also be used as baseline information for future restoration work at Waukegan Harbor.
References Cited
American Public Health Association, American Water Works Association, and Water Environment Federation, 2005, Fixed and volatile solids ignited at 550°C, part 2540D and 2540 E. of Eaton, A.D., Rice, E.W., and Baird, R.B., eds., Standard methods for the examination of water and waste-water (21st ed.): Washington, D.C., American Public Health Association, p. 2-55–2-61.
Balcer, M.D., Korda, N.L., and Dodson, S.I., 1984, Zooplank-ton of the Great Lakes—A guide to the identification and ecology of the common crustacean species: Madison, Wis., The University of Wisconsin Press, 174 p.
Battelle Memorial Institute [Battelle], 2013, Final summary report for benthos and plankton within Waukegan Area of Concern—Potential for further local restoration: U.S. Environmental Protection Agency EP–R5–11–07, 32 p. plus appendixes. [Also available at http://waukeganharbor-cag.com/ReportsandStudies/Waukegan%20AOC%20%20Final%20Report.pdf.]
Bode, R.W., Novak, M.A., Abele, L.E., Heitzman, D.L., and Smith, A.J., 2002, Quality assurance workplan for biologi-cal stream monitoring in New York State: Albany, N.Y., New York State Department of Environmental Conserva-tion, p. 76–102.
Bouyoucos, G.J., 1962, Hydrometer method improved for making particle size analysis of soils: Agronomy Journal, v. 54, no. 5, p. 464–465.
Chick, J.H., Levchuk, A.P., Medley, K.A., and Havel, J.H., 2010, Underestimation of rotifer abundance a much greater problem than previously appreciated: Limnology and Oceanography Methods, v. 8, no. 3, p. 79–87.
Clarke, K.R., and Gorley, R.N., 2006, PRIMER v6: User’s manual/tutorial: Plymouth, United Kingdom, Primer-E Ltd., 192 p.
Clarke, K.R., and Warwick, R.M., 2001, Change in marine communities—an approach to statistical analysis and inter-pretation (2d ed.): Plymouth, United Kingdom, Primer-E Ltd., variously paged.
Creque, S.M., Stainbrook, K.M., Glover, D.C., Czesny, S.J., and Dettmers, J.M., 2010, Mapping bottom substrate in Illinois waters of Lake Michigan—Linking substrate and biology: Journal of Great Lakes Research, v. 36, no. 4, p. 780–789.
Cuffney, T.F., Bilger, M.D., and Haigler, A.M., 2007, Ambigu-ous taxa—Effects on the characterization and interpretation of invertebrate assemblages: Journal of the North American Benthological Society, v. 26, no. 2, p. 286–307.
Data Description, Inc., 2015, Data Desk 7: Santa Barbara, Calif., Data Description, Inc, software release. [Also avail-able at http:/www.datadesk.com.]
Environmental Consulting and Technology, Inc., 2008, Delist-ing targets for the Waukegan Harbor Area of Concern—Final report submitted to the Illinois Environmental Protec-tion Agency: Ann Arbor, Mass, Environmental Consulting & Technology, Inc., 43 p.
Erséus, Christer, and Diaz, R.J., 1989, Population dynamics of Tubificoides amplivasatus (Oligochaeta, Tubificidae) in the Oresund, Denmark: Hydrobiologia, v. 180, p. 167–176.
Fishman, M.J., and Friedman, L.C., 1989, Solids, volatile-on-ignition, total-in-bottom-material, gravimetric, in Fishman, M.J., and Friedman, L.C., eds., Methods for determina-tion of inorganic substances in water and fluvial sediments (3d ed.): U.S. Geological Survey Techniques of Water-Resources Investigations, book 5, chap. A1, p. 451.
Flotemersch, J.E., Stribling, J.B., and Paul, M.J., 2006, Con-cepts and approaches for the bioassessment of non-wadable streams and rivers: Cincinnati, Ohio, U.S. Environmental Protection Agency, variously paged.
Gannon, J.E., and Stemberger, R.S., 1978, Zooplankton (especially crustaceans and rotifers) as indicators of water quality: Transactions of the American Microscopy Society, v. 97, p. 16–35.
Haney, J.F., and Hall, D.J., 1973, Sugar-coated Daphnia—A preservation technique for Cladocera: Limnology and Oceanography, v. 18, no. 2, p. 331–333.

28 Comparison of Benthos and Plankton for Waukegan and Burns Harbors, Illinois and Indiana, 2015
Illinois Environmental Protection Agency, 1999, Final stage III report—Waukegan Harbor Remedial Action Plan: Springfield, Ill., Illinois Environmental Protection Agency, 98 p. plus appendixes.
Illinois Environmental Protection Agency and Waukegan Citizens Advisory Group, 1994, Stage 1 & II final report—Waukegan Harbor Remedial Action Plan: Springfield, Ill., Illinois Environmental Protection Agency and Waukegan Citizens Advisory Group, 244 p. plus appendixes.
International Joint Commission United States and Canada, 1987, Revised Great Lakes Water Quality Agreement of 1978: Ottawa, Ontario, International Joint Commission, United States and Canada, 64 p., accessed March 24, 2017, at http://www.ijc.org/files/tinymce/uploaded/GLWQA_e.pdf.
Kelly, M.G., 2001, Use of similarity measures for quality control of benthic diatom samples: Water Research, v. 35, no. 11, p. 2784–2788.
Kennedy-Parker, D., 2011, ESS INO METHOD 151.1 (EPA 445.0, rev. 1.2, Sept. 1997 and Welschmeyer, 1994): Chlo-rophyll a, Fluorescence: Madison, Wis., Wisconsin State Laboratory of Hygiene, 15 p.
Michigan Department of Environmental Quality, 2008, Guidance for delisting Michigan’s Great Lakes Areas of Concern: Lansing, Mich., Michigan Department of Environ-mental Quality, 65 p.
Ohio Environmental Protection Agency, 2005, Delisting targets for Ohio Areas of Concern: Columbus, Ohio, Ohio Environmental Protection Agency, 85 p.
Pfister, Gerald; Sonntag, Bettina; and Posch, Thomas, 1999, Comparison of a direct live count and an improved quan-titative protargol stain (QPS) in determining abundance and cell volumes of pelagic freshwater protozoa: Aquatic Microbial Ecology, v. 18, p. 95–103.
Porter, S.D., 2008, Algal attributes: An autecological classifi-cation of algal taxa collected by the National Water-Quality Assessment Program: U.S. Geological Survey Data Series 329, 18 p., accessed March 24, 2017, at http://pubs.usgs.gov/ds/ds329/.
Ports of Indiana, 2014, Ports of Indiana-Burns Harbor, port overview: Ports of Indiana web page, accessed March 24, 2017, at http://www.portsofindiana.com/poi/burnsharbor/port_overview.cfm.
Scudder, B.C., Chasar, L.C., Wentz, D.A., Bauch, N.J., Brigham, M.E., Moran, P.W., and Krabbenhoft, D.P., 2009, Mercury in fish, bed sediment, and water from streams across the United States, 1998–2005: U.S. Geological Sur-vey Scientific Investigations Report 2009–5109, 74 p.
Scudder Eikenberry, B.C., Bell, A.H., Burns, D.J., and Tem-plar, H.A., 2014, Benthos and plankton community data for selected rivers and harbors along Wisconsin’s Lake Michi-gan shoreline, 2012: U.S. Geological Survey Data Series 824, 30 p. plus 8 appendixes, accessed September 19, 2014, at http://dx.doi.org/10.3133/ds824.
Scudder Eikenberry, B.C., Bell, A.H., Templar, H.A., and Burns, D.J., 2016a, Comparison of benthos and plankton for selected Areas of Concern and non-Areas of Concern in Western Lake Michigan Rivers and Harbors in 2012: U.S. Geological Survey Scientific Investigations Report 2016–5090, 28 p., accessed July 25, 2016, at http://dx.doi.org/10.3133/sir20165090.
Scudder Eikenberry, B.C., Burns, D.J., Templar, H.A., Bell, A.H., and Mapel, K.T., 2016b, Benthos and plankton com-munity data for selected rivers and harbors along the west-ern Lake Michigan shoreline, 2014: U.S. Geological Survey Data Series 1000, 29 p. plus 8 appendixes, accessed June 15, 2016, at http://dx.doi.org/10.3133/ds1000.
Scudder Eikenberry, B.C., Templar, H.A., Burns, D.J., Dobro-wolski, E.G., and Schmude, K.L., 2017, Benthos and plank-ton data for Waukegan Harbor Area of Concern, Illinois, and Burns Harbor-Port of Indiana Non-Area of Concern, Indiana, in 2015: U.S. Geological Survey data release, accessed May 2017 at https://doi.org/10.5066/F7CN7259.
Shannon, C.E., 1948, A mathematical theory of communica-tion: The Bell System Technical Journal, v. 27, p. 379–423.
Stemberger, R.S., 1979, A guide to rotifers of the Laurentian Great Lakes: U.S. Environmental Protection Agency Report EPA–600/4–79–021, 186 p.
U.S. Environmental Protection Agency [EPA], 1999, Evalu-ation of toxicity and bioaccumulation of contaminants in sediments samples from Waukegan Harbor: Chicago, Illinois: U.S. Environmentmental Protection Agency report EPA– 905–R–99–009, 31 p.
U.S. Environmental Protection Agency [EPA], 2010a, Stan-dard operating procedure for benthic invertebrate field sampling (LG406), in Sampling and analytical procedures for GLNPO’s Open Lake Water Quality Survey of the Great Lakes: Chicago, U.S. Environmental Protection Agency report EPA 905–R–05–001, 9 p., accessed March 24, 2017, at https://www.epa.gov/sites/production/files/2017-01/documents/sop-for-benthic-invertebrate-field-sampling-201603-8pp.pdf.

References Cited 29
U.S. Environmental Protection Agency [EPA], 2010b, Stan-dard operating procedure for benthic invertebrate laboratory analysis (LG407), in Sampling and analytical procedures for GLNPO’s Open Lake Water Quality Survey of the Great Lakes: Chicago, U.S. Environmental Protection Agency report EPA 905–R–001, 12 p., accessed March 24, 2017, at https://www.epa.gov/sites/production/files/2017-01/documents/sop-for-benthic-invertebrate-lab-analysis-201504-13pp.pdf.
U.S. Environmental Protection Agency [EPA], 2010c, Stan-dard operating procedure for phytoplankton sample collec-tion and preservation field procedures (LG400), in Sampling and analytical procedures for GLNPO’s Open Lake Water Quality Survey of the Great Lakes: U.S. Environmental Protection Agency report EPA 905–R–001, 7 p.
U.S. Environmental Protection Agency [EPA], 2010d, Standard operating procedure for phytoplankton analy-sis (LG401), in Sampling and analytical procedures for GLNPO’s Open Lake Water Quality Survey of the Great Lakes: U.S. Environmental Protection Agency report EPA 905–R–001, 44 p.
U.S. Environmental Protection Agency [EPA], 2010e, Stan-dard operating procedure for zooplankton sample collec-tion and preservation and Secchi depth measurement field procedures (LG402), in Sampling and analytical Procedures for GLNPO’s Open Lake Water Quality Survey of the Great Lakes: U.S. Environmental Protection Agency report EPA 905–R–001, 9 p., accessed March 24, 2017, at https://www.epa.gov/sites/production/files/2017-01/documents/sop-for-zooplankton-sample-collection-preservation-and-secchi-depth-measurement-field-procedures-201303-7pp.pdf.
U.S. Environmental Protection Agency [EPA], 2010f, Stan-dard operating procedure for zooplankton analysis (LG403), in Sampling and analytical procedures for GLNPO’s Open Lake Water Quality Survey of the Great Lakes: U.S. Envi-ronmental Protection Agency report EPA 905–R–001, 20 p., accessed March 24, 2017, at https://www.epa.gov/sites/production/files/2017-01/documents/sop-for-zooplankton-analysis-201607-22pp.pdf.
U.S. Policy Committee, 2001, Restoring United States Great Lakes Areas of Concern—Delisting principles and guide-lines: Ann Arbor, Mich., Great Lakes Commission, 27 p. [Also available at https://www.epa.gov/sites/production/files/2015-08/documents/aoc-delisting-principles-guide-lines-20011206.pdf.]
Wallace, R.L., and Snell, T.W., 1991, Rotifera, in Thorp, J.H., and Covich., A.P., eds., Ecology and classification of North American freshwater invertebrates: New York, Academic Press, p. 187–248.
Weigel, B.M., and Dimick, J.J., 2011, Development, valida-tion, and application of a macroinvertebrate-based Index of Biotic Integrity for nonwadeable rivers of Wisconsin: Journal of the North American Benthological Society, v. 30, no. 3, p. 665–679.


For more information, contact:Director, Wisconsin Water Science CenterU.S. Geological Survey8505 Research WayMiddleton, WI 53562http://wi.water.usgs.gov
Publishing support provided by the Pembroke Publishing Service Center

Scudder Eikenberry and others—Com
parison of Benthos and Plankton for Waukegan and Burns Harbors, Illinois and Indiana, 2015—
Scientific Investigations Report 2017–5039
ISSN 2328–0328 (online)https://doi.org/10.3133/sir20175039