Embed Size (px)
Citation preview
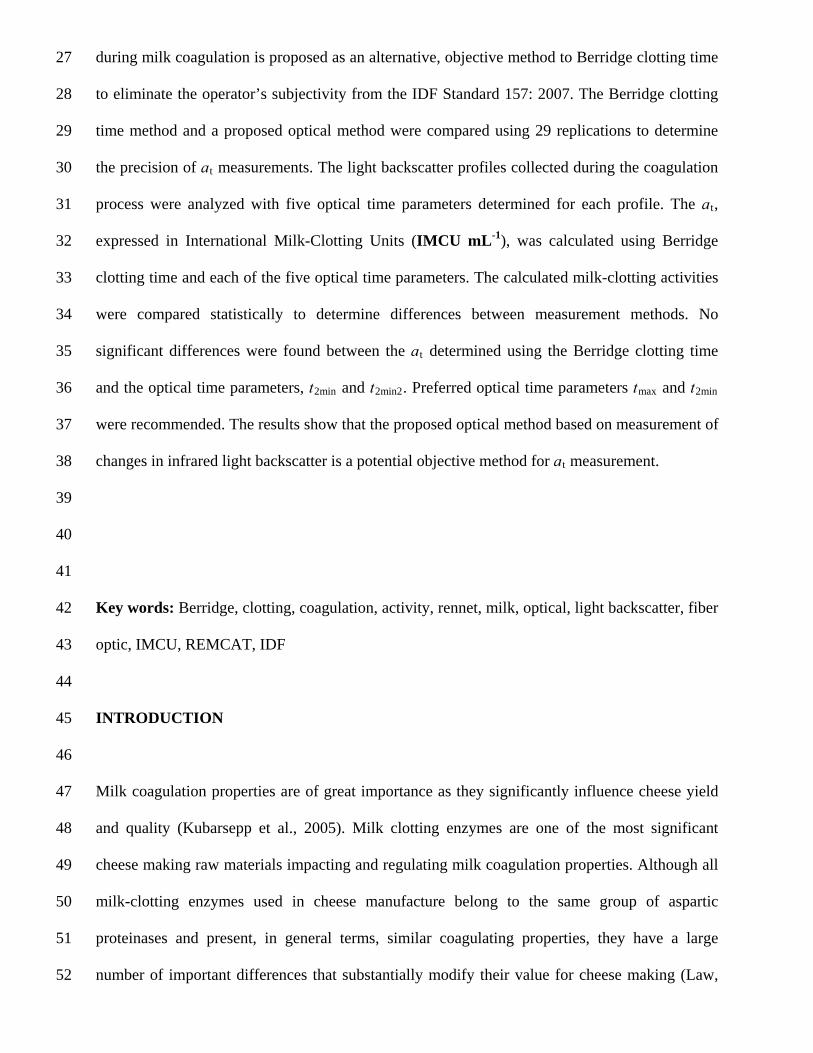
Comparison of total milk-clotting activity measurement precision using the Berridge
clotting time method and a proposed optical method
1
2
3
4
5
6
7
8
9
10
11
12
13
N. Tabayehnejad*, M. Castillo1, *,†, and F. A. Payne*
*Department of Biosystems and Agricultural Engineering, University of Kentucky, 128 C.E.
Barnhart Building, Lexington, KY 40546-0276, USA
†Department of Animal and Food Sciences, Universitat Autònoma de Barcelona, Edifici V,
Campus de la UAB, 08193, Bellaterra, (Cerdanyola del Vallès), Barcelona, Spain
1Corresponding author. Department of Animal and Food Sciences, Universitat Autònoma de
Barcelona, Edifici V, Campus de la UAB, 08193, Bellaterra, (Cerdanyola del Vallès),
Barcelona, Spain. Phone: +34 93 851 1123; e-mail: [email protected] 14
15
16
17
18
19
20
21
22
23
24
25
26
ABSTRACT
An objective measurement technique is needed to simplify the determination of total milk-
clotting activity (at) of rennets and other milk coagulating enzymes. IDF Standard 157:
2007/ISO 11815 is the current standard method for bovine rennets and measures milk-clotting
activity by visually determining the Berridge clotting time (i.e., time of appearance of flocks of
renneted standard milk substrate on the wall of a rotating test tube). The IDF Standard 157: 2007
method is somewhat subjective because it depends on an operator’s skill to consistently identify
milk flocculation. An optical method based on changes in infrared light backscatter at 880 nm
during milk coagulation is proposed as an alternative, objective method to Berridge clotting time
to eliminate the operator’s subjectivity from the IDF Standard 157: 2007. The Berridge clotting
time method and a proposed optical method were compared using 29 replications to determine
the precision of a
27
28
29
30
31
32
33
34
35
36
37
38
39
40
41
42
43
44
45
46
47
48
49
50
51
52
t measurements. The light backscatter profiles collected during the coagulation
process were analyzed with five optical time parameters determined for each profile. The at,
expressed in International Milk-Clotting Units (IMCU mL-1), was calculated using Berridge
clotting time and each of the five optical time parameters. The calculated milk-clotting activities
were compared statistically to determine differences between measurement methods. No
significant differences were found between the at determined using the Berridge clotting time
and the optical time parameters, t2min and t2min2. Preferred optical time parameters tmax and t2min
were recommended. The results show that the proposed optical method based on measurement of
changes in infrared light backscatter is a potential objective method for at measurement.
Key words: Berridge, clotting, coagulation, activity, rennet, milk, optical, light backscatter, fiber
optic, IMCU, REMCAT, IDF
INTRODUCTION
Milk coagulation properties are of great importance as they significantly influence cheese yield
and quality (Kubarsepp et al., 2005). Milk clotting enzymes are one of the most significant
cheese making raw materials impacting and regulating milk coagulation properties. Although all
milk-clotting enzymes used in cheese manufacture belong to the same group of aspartic
proteinases and present, in general terms, similar coagulating properties, they have a large
number of important differences that substantially modify their value for cheese making (Law,
1999). Thus, for both economic and processing reasons, it is essential to know the total milk-
clotting activity (a
53
54
55
56
57
58
59
60
61
62
63
64
65
66
67
68
69
70
71
72
73
74
75
76
77
78
t) of a certain rennet type, which allows the cheese maker to select the
adequate enzyme for each type of cheese and adjust the enzyme proportion to control milk
coagulation and thus optimize cheese yield and quality. Cheese plants often have to rely on the
total milk-clotting activity from the printed label, but enzyme activity might decrease with time
leading to inadequate use of the enzyme. On the other hand, the number of rennets and other
milk coagulants in the market has steadily risen for the last three decades, which has increased
the need for analyzing the different products commercially available.
A number of methods have been proposed and used with that purpose. In the past, Soxhlet’s
units (SU), which is the volume of milk that can be clotted by one unit volume of a rennet within
40 min at 35ºC, was widely used to characterize the strength of a rennet solution. While SU is
easily understandable by the cheese maker, the measured strength depends substantially on both
milk quality and pH. Further, no milk-clotting enzyme reference standards are used and SU
should be considered as an indicative measurement of milk-clotting activity. Subsequently,
Rennin Units (RU) or Berridge units have also been used in the past by the British Standard
Institution (BSI) but it is no longer used. RU is described as the activity which is able to clot 10
mL of standardized milk in 100 s at 30ºC (Law, 1999). Similarly to the SU units, RU units also
have some major drawbacks to it. During cheese making, the pH is usually around 6.5-6.7, while
the standardized substrate has a pH of 6.3. The pH plays an essential role in the analysis since
each enzyme has its own pH-dependency. Not only does the pH cause misleading information,
but also the calcium content is abnormally high in standardized milk. This has a major influence
on the analysis and may result in measurement errors. In 1997 the International Dairy Federation
(IDF) developed a standard known as the “relative milk-clotting activity test” or REMCAT (IDF
Standard 157A: 1997) for determination of at of bovine rennets and fermentation produced
chymosin. This standard, which has been recently revised (IDF Standard 157: 2007/ISO 11815)
accounts for variations in test conditions which affect the enzyme. Similar methods have been
developed by the IDF for microbial enzymes (IDF Standard 176: 2002) and other coagulants –
ovine and caprine rennets – (e.g., IDF Standard 199: 2006).
79
80
81
82
83
84
85
86
87
88
89
90
91
92
93
94
95
96
97
98
99
100
101
102
103
104
The Berridge clotting time method is used as the indicator of milk flocculation in all the IDF
Standards for at determination. The Berridge clotting time is determined as the time of visual
appearance of flocks of renneted standard milk on the wall of a rotating test tube. The Berridge
clotting time method is somewhat subjective because it relies on “human eye identification” of
flocculation, which greatly impacts the precision of this observation. The IDF 157: 2007
standard recommends that the repeatability of independent analytical results performed on
identical test material and in a short interval of time by the same operator will in not more than
5% of cases be greater than 1.8% relative to the arithmetic mean of the test results. If two
determinations are obtained under these conditions an absolute difference of 4.9% relative to the
arithmetic mean of the test results should not be exceeded. Recommended absolute difference
between the results of two single measurements performed on identical test material by two
different operators working in different laboratories is doubled to 9.8%.
Several continuous and nondestructive methods based on the measurement of optical properties
such as reflection, absorbance, scatter, and refraction of light have been proposed for monitoring
milk coagulation and determining gelation/clotting time. Korolczuk et al. (1986) found a strong
correlation between the time of inflection point of refractometric curves and the gelation time.
McMahon and Brown (1990) measured changes in light scattering at 600 nm in coagulating milk
and found a correlation between gelation time and the inflection point of turbidity plots. Saputra
(1992) reported a correlation between the first order enzymatic reaction rate constant for κ-casein
hydrolysis and the inflection point of infrared light backscatter profiles (tmax). Payne et al. (1993)
reported a relationship between the infrared light backscatter time parameter tmax and curd
cutting time. A number of researchers have also investigated the relationship between clotting
time and optical time parameters (Castillo et al., 2000). These authors reported a strong linear
correlation between tmax derived from infrared light backscatter and the Berridge clotting time.
Lopez et al. (1997) claimed that there were no significant difference between the optical time
parameter, which quantifies the time to the point of maximum increase in the near infrared
reflectance curve and Berridge clotting time.
105
106
107
108
109
110
111
112
113
114
115
116
117
118
119
120
121
122
123
124
125
126
127
128
129
130
These correlations between optically determined parameters and milk clotting time suggest the
possibility of developing an optical method for measuring at. An optical method for measuring
infrared light backscatter has been used in research and commercially since 1990 for monitoring
milk coagulation (Payne et al., 1993; Castillo et al., 2003).
The objective of this study was to compare the Berridge clotting time method (IDF Standard
157: 2007) with an optical method for precision of at measurement.
MATERIALS AND METHODS
Development of a coagulation measurement apparatus
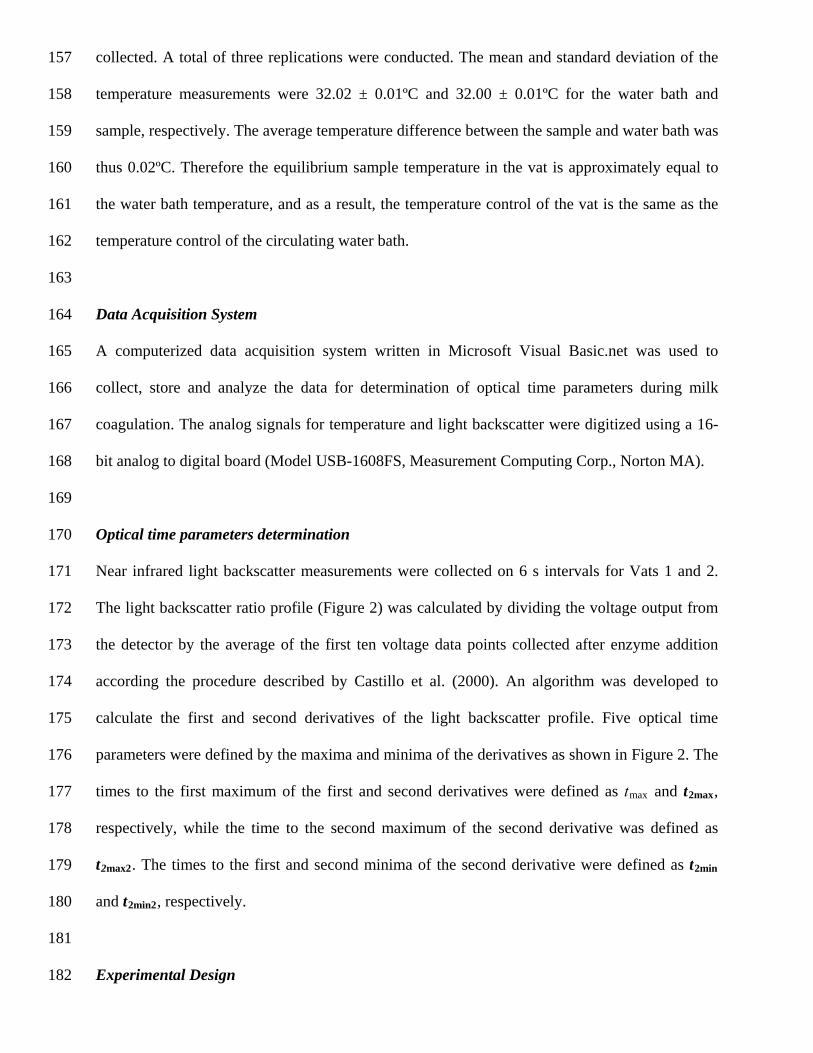
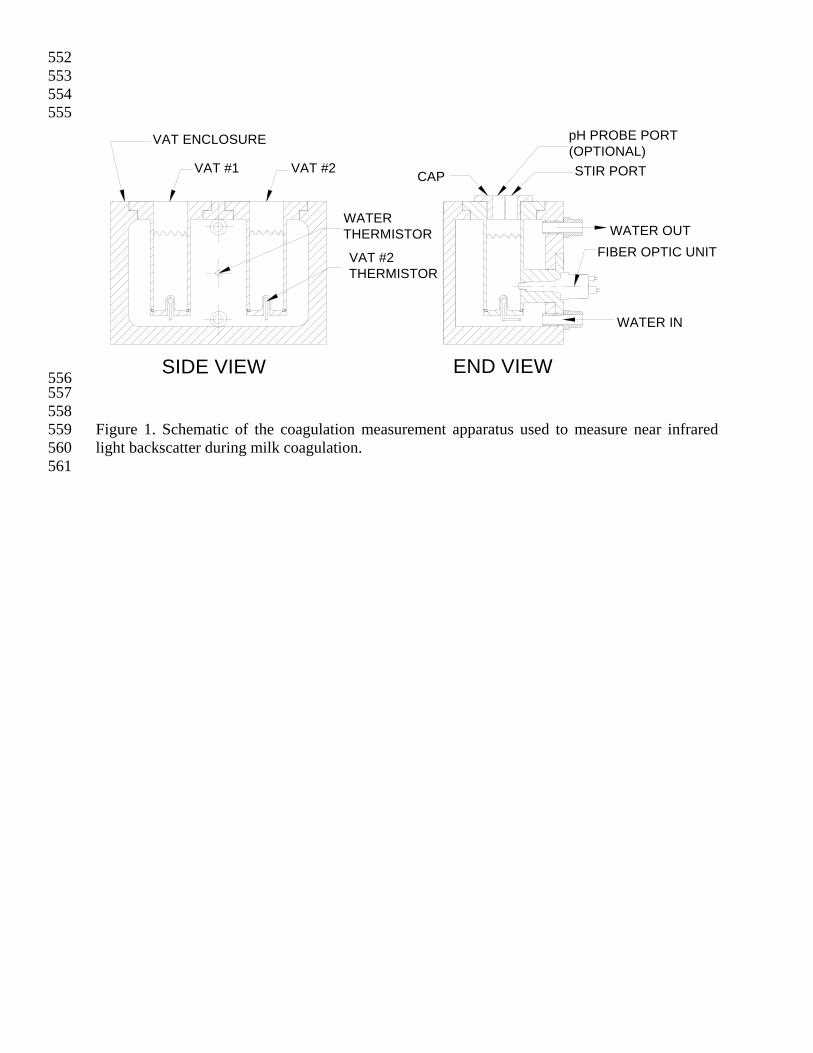
A coagulation measurement apparatus (Figure 1) was designed and developed to measure near
infrared light backscatter during milk coagulation. Two vats were designed into the apparatus to
make precise comparisons feasible. Each vat was instrumented to measure near infrared light
backscatter, temperature and pH (not used in this study) during coagulation. The sample vats had
an inside diameter of 36 mm, height of 115 mm and contained a maximum sample volume of 98
mL. The sample vats were fabricated of stainless steel with the interior surfaces polished for easy
cleaning. A plastic cap was used to cover each vat during testing to prevent evaporative cooling.
The cap provided access to the vats for mixing the enzyme, inspecting the sample visually, and
inserting a pH electrode. The coagulation measurement apparatus had an inlet/outlet connection
to a water bath as shown in Figure 1. Linear thermistors (Model OL-710-PP, Omega
Engineering, Stamford, CT) were used to measure the temperatures of the milk samples (sample
vats #1 and #2) and circulating water bath. A fiber optic unit (Model 5, Reflectronics, Inc.,
Lexington, KY) was used to measure near infrared light backscatter at 880 nm. The fiber optic
unit was installed horizontally in each vat as shown in Figure 1. The fiber optic units directed
near infrared light from a LED (Model L2791, Hamamatsu Corp., Bridgewater, NJ) into the milk
sample and returned the backscattered light to a detector (Model TSL250, TAOS, Plano, TX).
131
132
133
134
135
136
137
138
139
140
141
142
143
144
145
146
147
148
149
150
151
152
153
154
155
156
Temperature control
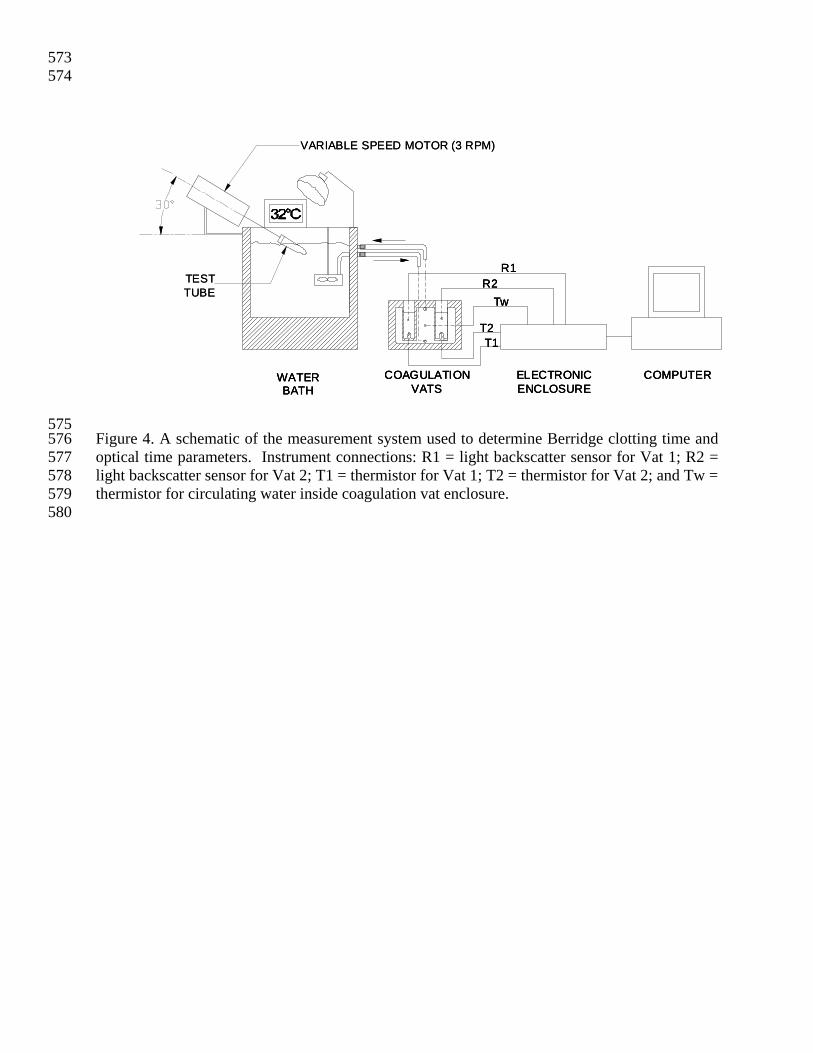
Precise temperature control is essential for accurate comparison of simultaneous enzymatic
reactions. The coagulation measurement apparatus was designed to provide identical
temperatures in the two milk sample vats by circulating one stream of water from a water bath
around both vats. The temperature difference between the water bath and the milk in the vats was
minimized by using a plastic vat enclosure (Figure 1) and other plastic parts to minimize heat
transfer losses. Plastic hoses (inside diameter of 12.7 mm; length 1 m) connected the vat
enclosure to the circulating water bath. A circulating water bath (Lauda RM 220, Brinkman
Instruments, Inc., Westbury, NY) having a reported temperature control of ± 0.04ºC was used to
circulate water through the vat enclosure at the maximum flow setting provided by the
manufacturer and measured to be 10.2 L min-1. Since the internal water volume of the vat
enclosure was measured to be 1.6 L, the design provided for a water volume exchange rate of >6
per min.
Precise temperature control was confirmed for the coagulation measurement apparatus. The
water bath was filled with water, set to a control temperature of 32.0ºC and allowed to stabilize
for 8 h with the laboratory environment at 24.2ºC. The temperature difference between the milk
sample in a vat and water in the water bath were accurately measured using a precision
thermistor (model 5831 A, Omega Engineering, Stanford, CT, resolution ± 0.01ºC, accuracy ±
0.2ºC). The thermistor was inserted in the milk sample, allowed to equilibrate for 1 minute, and
100 temperature measurements were collected on 6 s intervals over a 10 min period. Then, the
thermistor was inserted in the water bath and the temperature measurements were likewise
collected. A total of three replications were conducted. The mean and standard deviation of the
temperature measurements were 32.02 ± 0.01ºC and 32.00 ± 0.01ºC for the water bath and
sample, respectively. The average temperature difference between the sample and water bath was
thus 0.02ºC. Therefore the equilibrium sample temperature in the vat is approximately equal to
the water bath temperature, and as a result, the temperature control of the vat is the same as the
temperature control of the circulating water bath.
157
158
159
160
161
162
163
164
165
166
167
168
169
170
171
172
173
174
175
176
177
178
179
180
181
182
Data Acquisition System
A computerized data acquisition system written in Microsoft Visual Basic.net was used to
collect, store and analyze the data for determination of optical time parameters during milk
coagulation. The analog signals for temperature and light backscatter were digitized using a 16-
bit analog to digital board (Model USB-1608FS, Measurement Computing Corp., Norton MA).
Optical time parameters determination
Near infrared light backscatter measurements were collected on 6 s intervals for Vats 1 and 2.
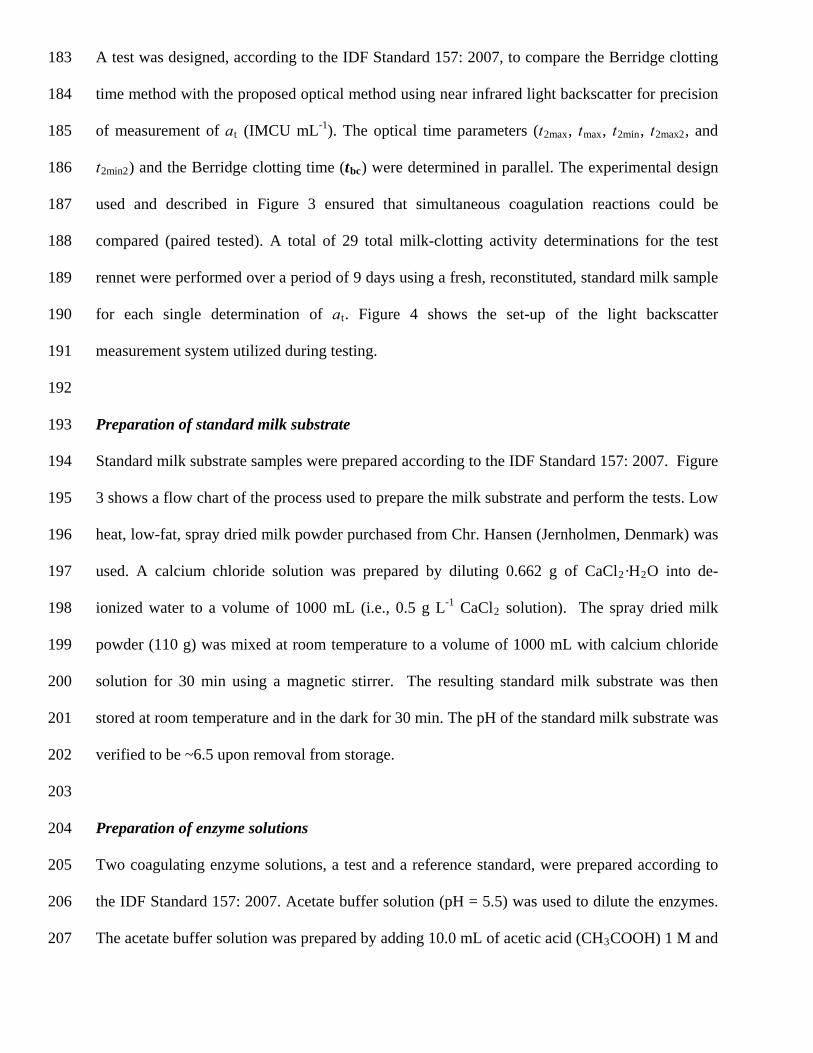
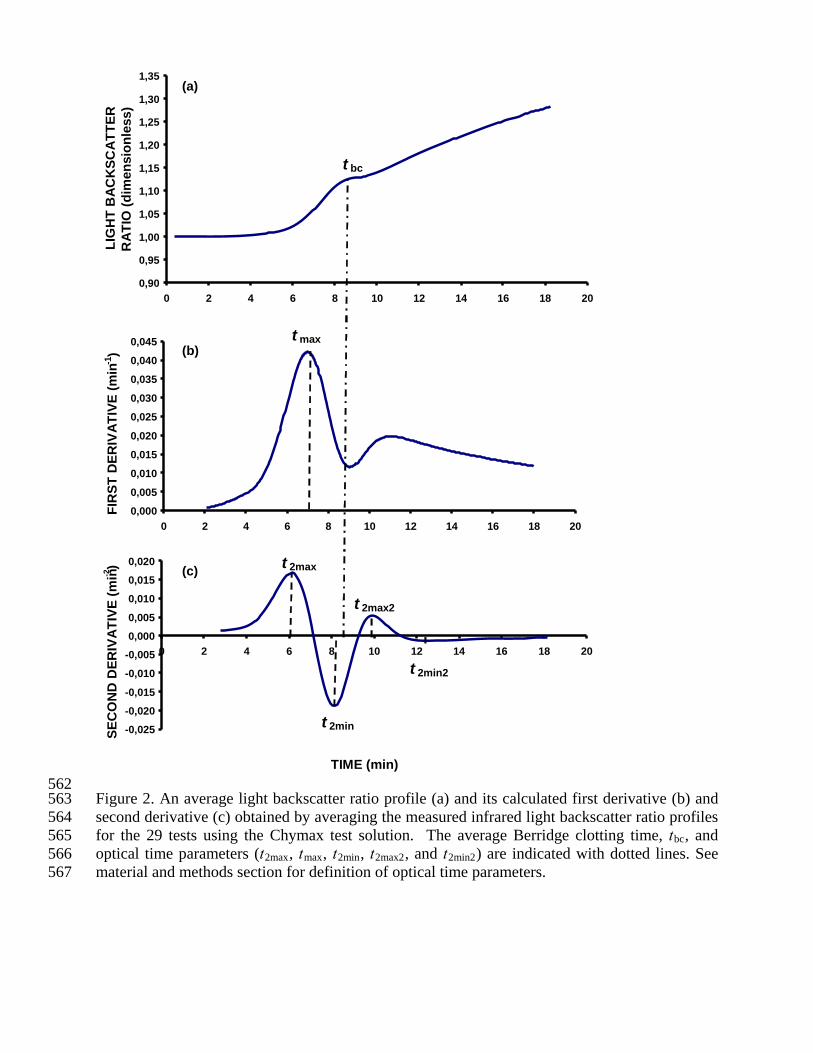
The light backscatter ratio profile (Figure 2) was calculated by dividing the voltage output from
the detector by the average of the first ten voltage data points collected after enzyme addition
according the procedure described by Castillo et al. (2000). An algorithm was developed to
calculate the first and second derivatives of the light backscatter profile. Five optical time
parameters were defined by the maxima and minima of the derivatives as shown in Figure 2. The
times to the first maximum of the first and second derivatives were defined as tmax and t2max,
respectively, while the time to the second maximum of the second derivative was defined as
t2max2. The times to the first and second minima of the second derivative were defined as t2min
and t2min2, respectively.
Experimental Design
A test was designed, according to the IDF Standard 157: 2007, to compare the Berridge clotting
time method with the proposed optical method using near infrared light backscatter for precision
of measurement of a
183
184
185
186
187
188
189
190
191
192
193
194
195
196
197
198
199
200
201
202
203
204
205
206
207
t (IMCU mL-1). The optical time parameters (t2max, tmax, t2min, t2max2, and
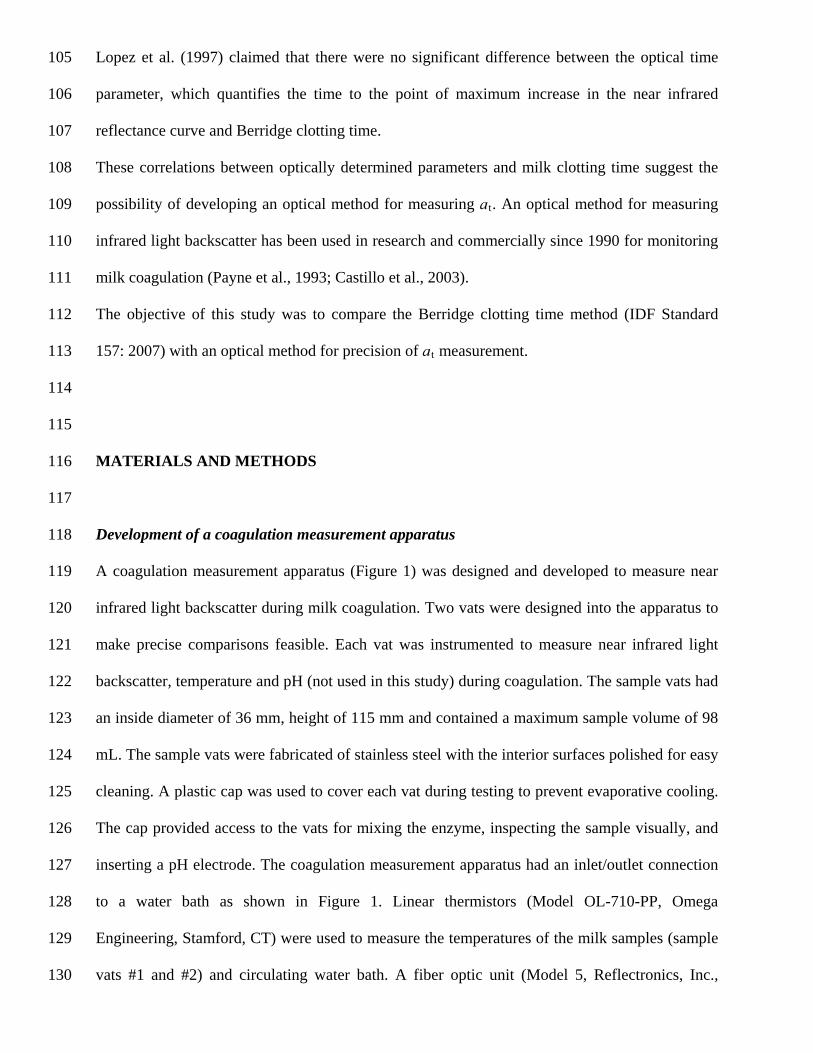
t2min2) and the Berridge clotting time (tbc) were determined in parallel. The experimental design
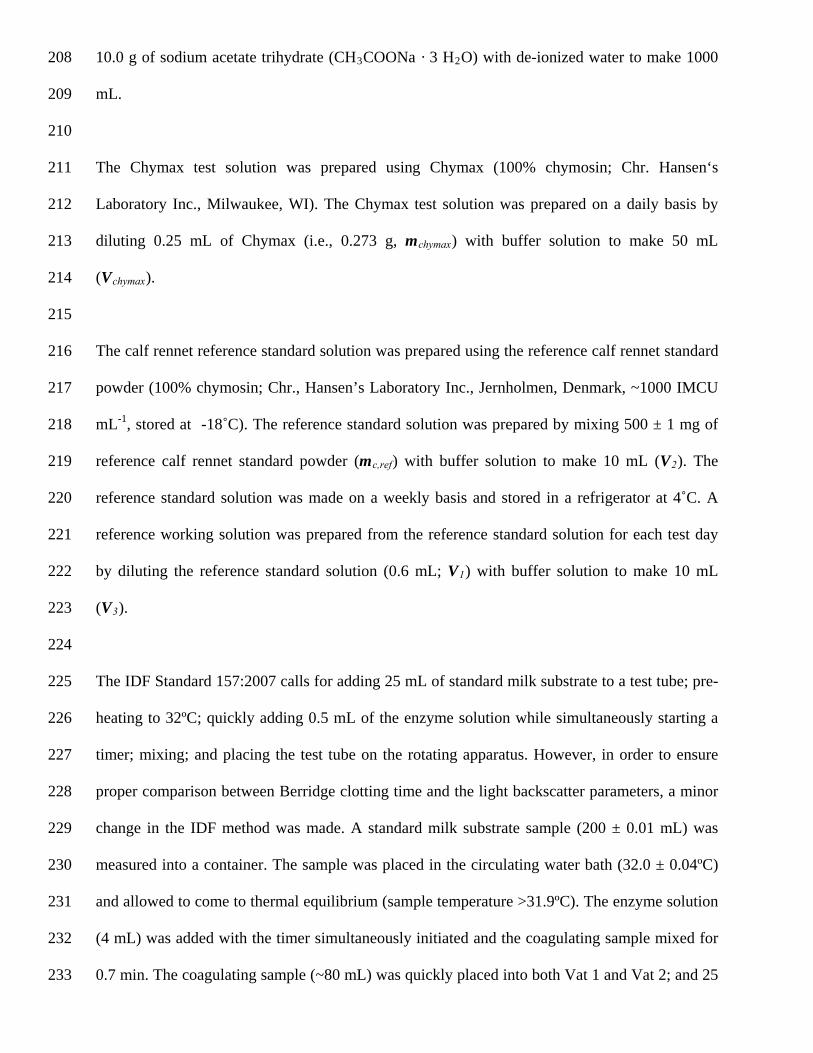
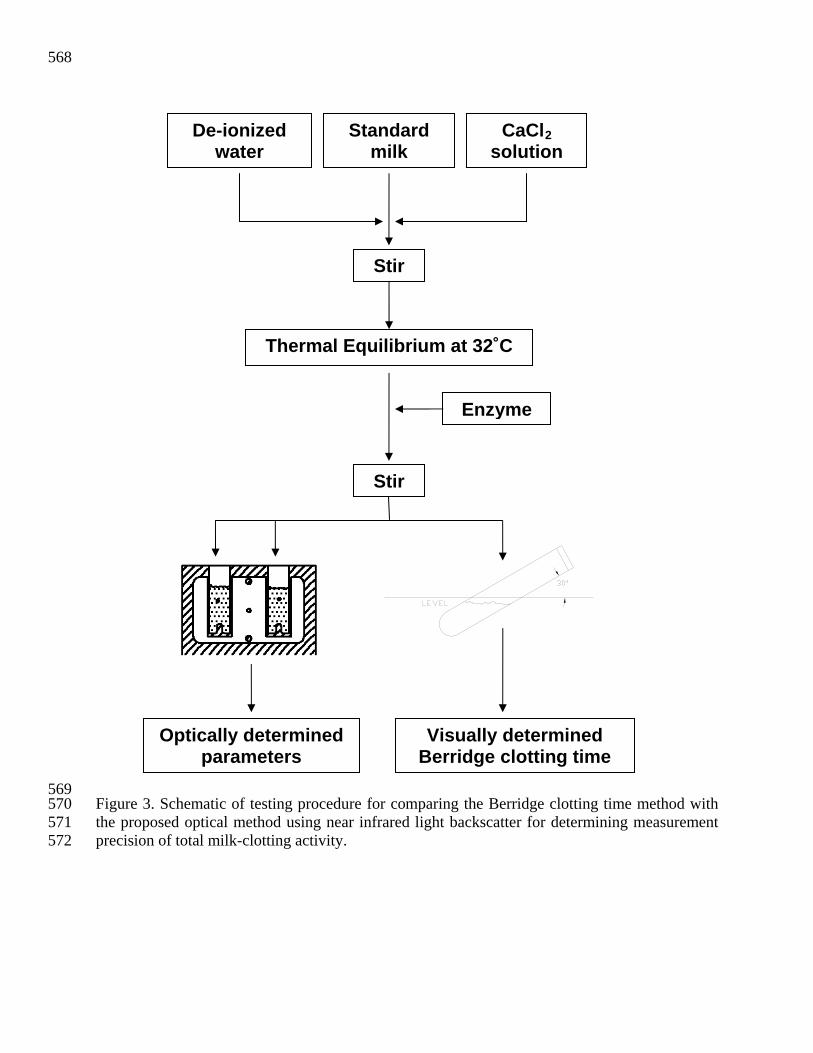
used and described in Figure 3 ensured that simultaneous coagulation reactions could be
compared (paired tested). A total of 29 total milk-clotting activity determinations for the test
rennet were performed over a period of 9 days using a fresh, reconstituted, standard milk sample
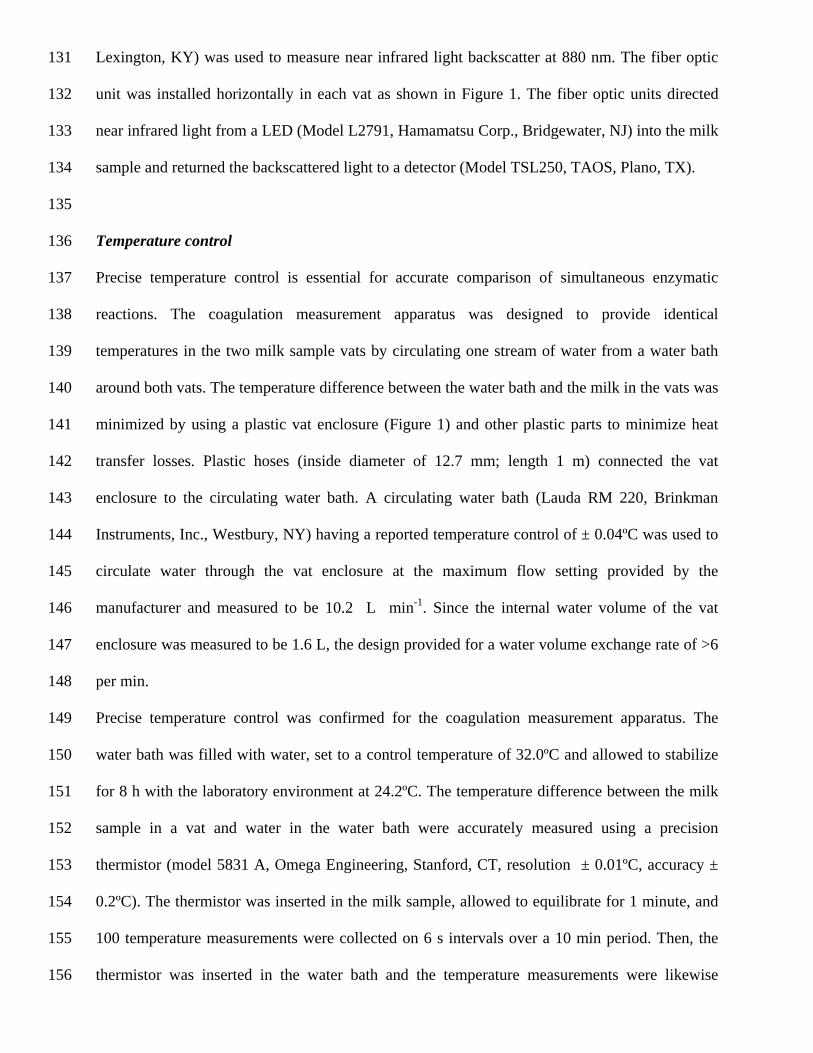
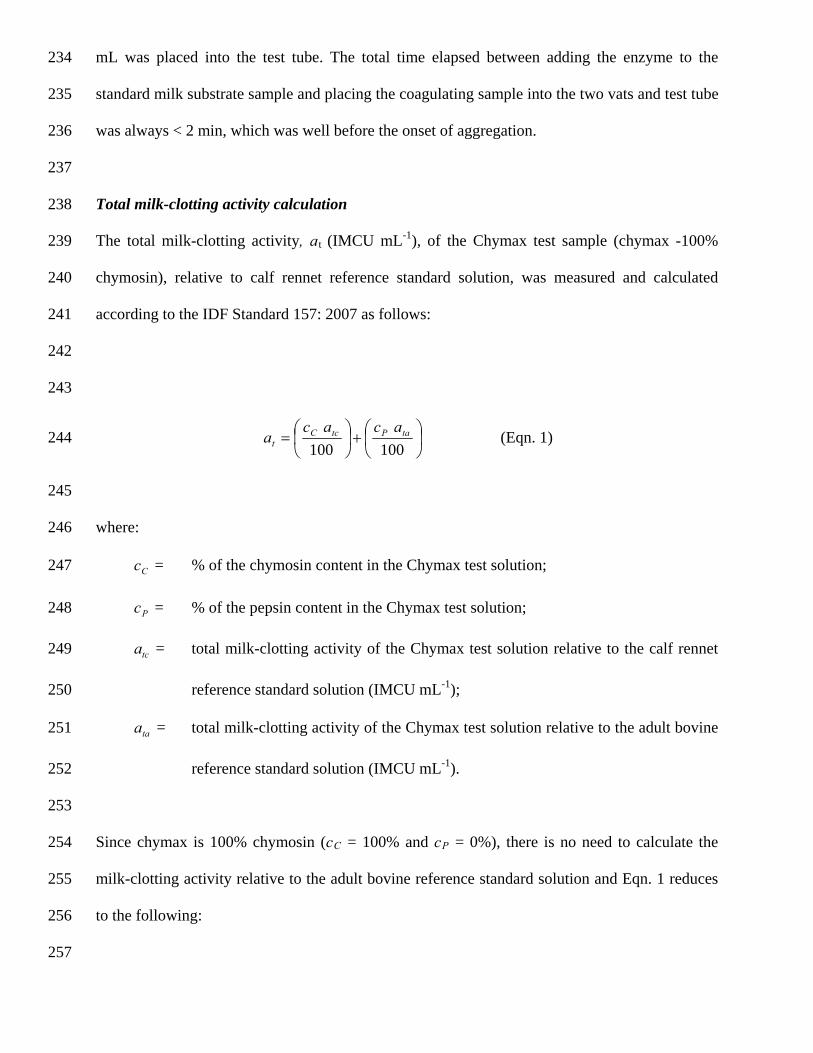
for each single determination of at. Figure 4 shows the set-up of the light backscatter
measurement system utilized during testing.
Preparation of standard milk substrate
Standard milk substrate samples were prepared according to the IDF Standard 157: 2007. Figure
3 shows a flow chart of the process used to prepare the milk substrate and perform the tests. Low
heat, low-fat, spray dried milk powder purchased from Chr. Hansen (Jernholmen, Denmark) was
used. A calcium chloride solution was prepared by diluting 0.662 g of CaCl2·H2O into de-
ionized water to a volume of 1000 mL (i.e., 0.5 g L-1 CaCl2 solution). The spray dried milk
powder (110 g) was mixed at room temperature to a volume of 1000 mL with calcium chloride
solution for 30 min using a magnetic stirrer. The resulting standard milk substrate was then
stored at room temperature and in the dark for 30 min. The pH of the standard milk substrate was
verified to be ~6.5 upon removal from storage.
Preparation of enzyme solutions
Two coagulating enzyme solutions, a test and a reference standard, were prepared according to
the IDF Standard 157: 2007. Acetate buffer solution (pH = 5.5) was used to dilute the enzymes.
The acetate buffer solution was prepared by adding 10.0 mL of acetic acid (CH3COOH) 1 M and
10.0 g of sodium acetate trihydrate (CH3COONa · 3 H2O) with de-ionized water to make 1000
mL.
208
209
210
211
212
213
214
215
216
217
218
219
220
221
222
223
224
225
226
227
228
229
230
231
232
233
The Chymax test solution was prepared using Chymax (100% chymosin; Chr. Hansen‘s
Laboratory Inc., Milwaukee, WI). The Chymax test solution was prepared on a daily basis by
diluting 0.25 mL of Chymax (i.e., 0.273 g, mchymax) with buffer solution to make 50 mL
(Vchymax).
The calf rennet reference standard solution was prepared using the reference calf rennet standard
powder (100% chymosin; Chr., Hansen’s Laboratory Inc., Jernholmen, Denmark, ~1000 IMCU
mL-1, stored at -18˚C). The reference standard solution was prepared by mixing 500 ± 1 mg of
reference calf rennet standard powder (mc,ref) with buffer solution to make 10 mL (V2). The
reference standard solution was made on a weekly basis and stored in a refrigerator at 4˚C. A
reference working solution was prepared from the reference standard solution for each test day
by diluting the reference standard solution (0.6 mL; V1) with buffer solution to make 10 mL
(V3).
The IDF Standard 157:2007 calls for adding 25 mL of standard milk substrate to a test tube; pre-
heating to 32ºC; quickly adding 0.5 mL of the enzyme solution while simultaneously starting a
timer; mixing; and placing the test tube on the rotating apparatus. However, in order to ensure
proper comparison between Berridge clotting time and the light backscatter parameters, a minor
change in the IDF method was made. A standard milk substrate sample (200 ± 0.01 mL) was
measured into a container. The sample was placed in the circulating water bath (32.0 ± 0.04ºC)
and allowed to come to thermal equilibrium (sample temperature >31.9ºC). The enzyme solution
(4 mL) was added with the timer simultaneously initiated and the coagulating sample mixed for
0.7 min. The coagulating sample (~80 mL) was quickly placed into both Vat 1 and Vat 2; and 25
234
235
236
237
238
239
240
241
242
243
mL was placed into the test tube. The total time elapsed between adding the enzyme to the
standard milk substrate sample and placing the coagulating sample into the two vats and test tube
was always < 2 min, which was well before the onset of aggregation.
Total milk-clotting activity calculation
The total milk-clotting activity, at (IMCU mL-1), of the Chymax test sample (chymax -100%
chymosin), relative to calf rennet reference standard solution, was measured and calculated
according to the IDF Standard 157: 2007 as follows:
100100
taPtcCta244
245
246
247
248
tca249
250
taa251
252
253
254
255
256
257
acac (Eqn. 1)
where:
Cc = % of the chymosin content in the Chymax test solution;
Pc = % of the pepsin content in the Chymax test solution;
= total milk-clotting activity of the Chymax test solution relative to the calf rennet
reference standard solution (IMCU mL-1);
= total milk-clotting activity of the Chymax test solution relative to the adult bovine
reference standard solution (IMCU mL-1).
Since chymax is 100% chymosin (cC = 100% and cP = 0%), there is no need to calculate the
milk-clotting activity relative to the adult bovine reference standard solution and Eqn. 1 reduces
to the following:
tct aa258
259
260
261
262
. (Eqn. 2)
The total milk-clotting activity of the Chymax test sample relative to the calf rennet reference
standard solution is determined by the following:
32
,1,,
VVtaa
t
refcrefcrefctct 263
264
265
266
refca ,267
268
ref269
270
271
ref272
273
274
3V275
276
277
278
279
adVmt (Eqn. 3)
where:
= total milk-clotting activity of the calf rennet reference standard solution (IMCU
mL-1);
= clotting time for the calf rennet reference standard solution (min); ct ,
tt = clotting time obtained with the Chymax test solution (min);
= dilution factor of the Chymax test solution (mL g-1); d
= mass of the calf rennet reference standard solution (g); cm ,
1V = volume taken from the first calf rennet reference standard solution (mL);
2V = final volume of the first calf rennet reference standard solution (mL);
= final volume of the second calf rennet reference standard solution (mL).
The total dilution factor for the Chymax test solution, d, was determined by dividing the final
volume of the Chymax test solution by the weight of chymax used as follows:
chymax
chymax
md 280
V (Eqn. 4)
281
282
283
chymaxm284
285
286
287
288
289
where:
= final volume of the Chymax test solution (mL); chymaxV
= mass of the chymax (g).
The dilution factor for the second calf rennet reference standard solution was determined as
follows:
1,
32
Vmd
refccalf 290
291
292
293
VV. (Eqn. 5)
Substituting Eqns. 4 and 5 into Eqn. 3 reduces the equation to the following:
refccalft
tct adt
aa ,
294
295
296
297
298
refc dt , (Eqn. 6)
The dilution factors using Eqn. 4 and 5 and using the target mass and volume values specified for
the above test design gives the following:
1183273.0
gmLg
d299
300
0.50 mL;
1333)60.0)(500.0(
gmLmLg
dcalf301
302
)0.10)(0.10( mLmL.
303
304
305
306
The total milk-clotting activity calculation for the Chymax test sample using Eqn. 6, the dilution
factors calculated above and the average Berridge clotting time of 9 and 8.4 min for calf rennet
standard solution and Chymax test solution (presented later), gives the following calculation:
)1000()333)(40.8(
)183)(00.9( 11
1
mLIMCUgmLmin
gmLminaa tct , 307
308
309
310
311
312
313
314
315
316
317
318
319
320
321
322
323
324
325
326
327
which reduces to
1589 mLIMCUaa tct .
Statistical Analysis
An analysis of variance (ANOVA) was conducted using the general linear model (GLM)
procedure of SAS (Statistical Analysis System, SAS®, 2003) to identify the sources of variation
of the collected data for all time parameters and total milk-clotting activities. The actual milk
pH, and actual coagulation temperature (T) were added as covariates to the statistical model to
account for differences between replicates. Enzyme type and Day (since a new calf rennet
working solution was prepared for each day) were added as class variables. Student pair wise t-
test model procedure of SAS (TTEST) was used to determine differences between the optical
time parameters and tbc and also the differences between the optically determined and the
visually determined total milk-clotting activities. Least squared differences (LSD) were also
conducted using the GLM procedure to determine the differences between the visually
determined and optically determined total milk clotting activities.
The total milk-clotting activities calculated using the optical time parameters and the visually
determined parameter, tbc, were tested for repeatability with Day as an effect. The Repeatability
Relative Standard Deviation (RSDr), Within-Laboratory Reproducibility Relative Standard
Deviation (RSD
328
329
330
331
332
333
R), Relative Repeatability Value (rrel) and Relative Within-Laboratory
Reproducibility Value (Rrel) were determined using the International standard ISO 5725-2: 1994
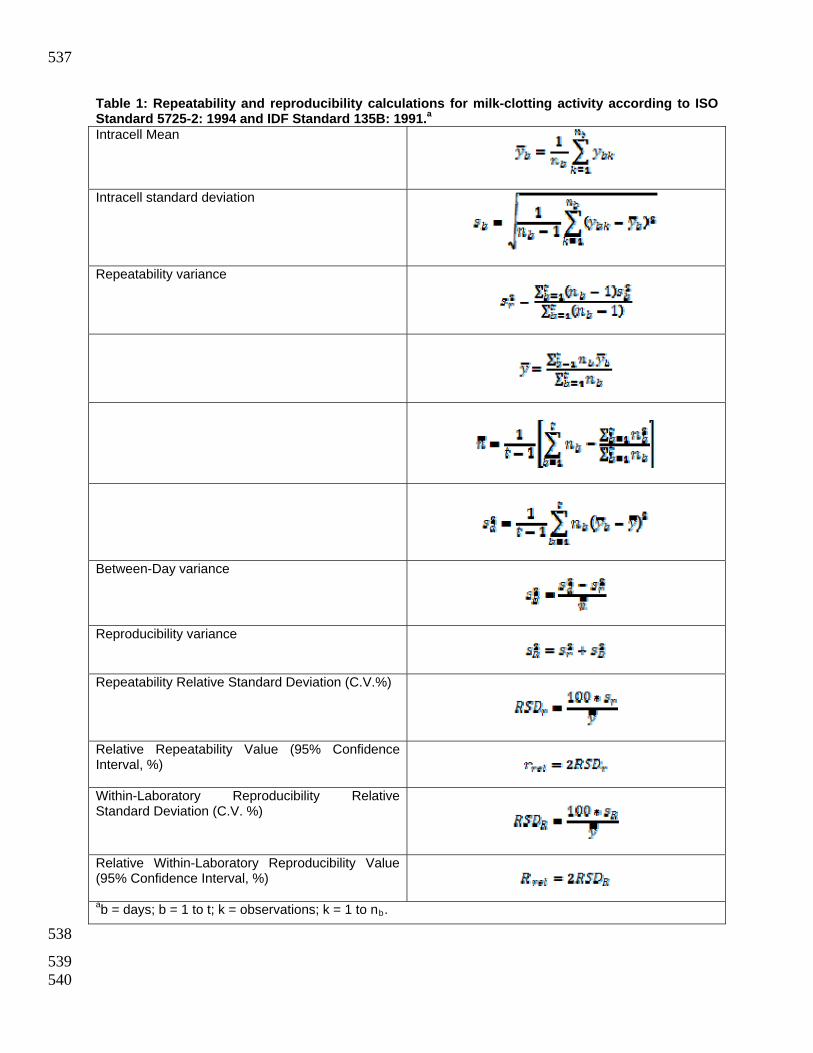
calculation procedure as described in Table 1. The calculation procedure is in compliance with
the IDF standard 135B:1991. For this test, the Intracell Standard Deviation was calculated by
taking the difference between each of the single measurements conducted each day, ybk, and their
daily average, by (Table 1). The coefficient of variation of reproducibility, which in our study
expresses the variability of independent analytical results of different Days was also calculated in
compliance with the above mentioned standards.
334
335
336
337
338
339
340
341
342
343
344
345
346
347
348
349
350
351
352
Two identical and optically monitored coagulation tests were conducted during each coagulation
measurement using Vat 1 and Vat 2 of the coagulation measurement apparatus. The instrument
precision for the optical time parameters obtained was determined by calculating the RSDr and
the rrel as described in Table 1. In this case the measurements for Vat 1 (ybk1) and Vat 2 (ybk2)
were considered to be two single measurements and the repeatability based on their difference,
(ybk1 – ybk2).
RESULTS AND DISCUSSION
Light backscatter parameters as milk-clotting indicators
Light backscatter time parameters obtained and evaluated in this study were selected as potential
milk-clotting indicators as they have been previously reported to be correlated to different
chemical reactions taking place during milk coagulation (Saputra, 1992; Castillo et al., 2003;
Castillo et al., 2006).
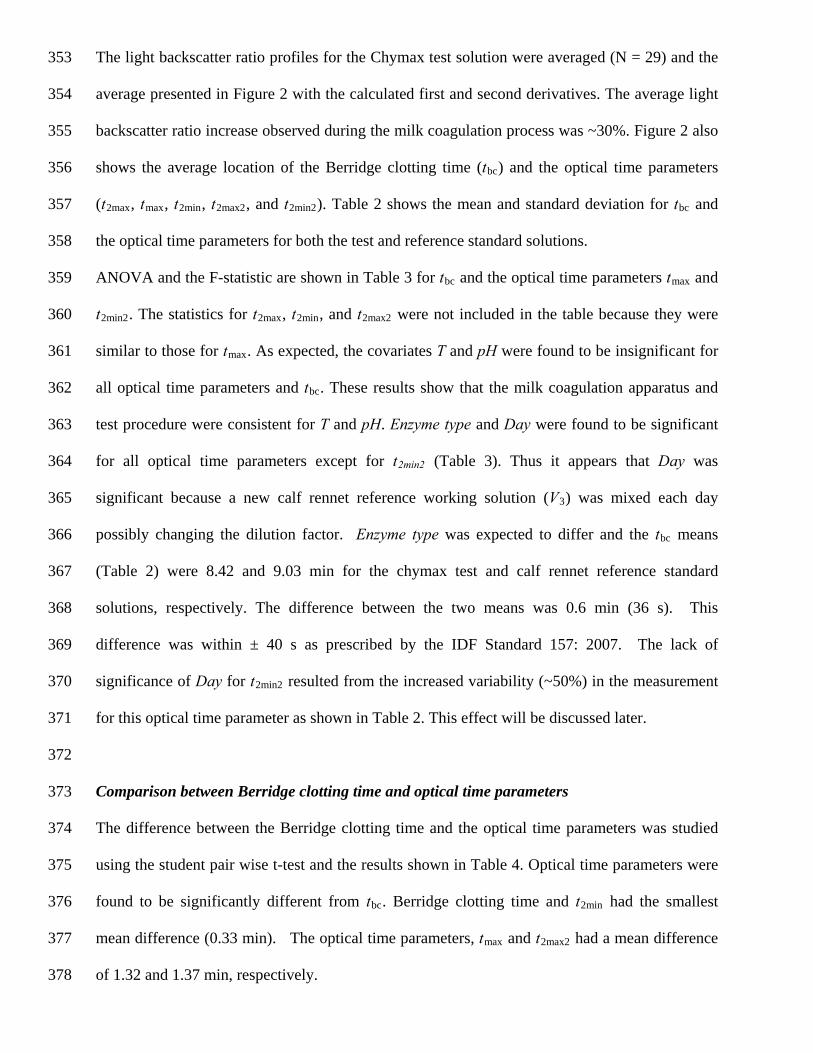
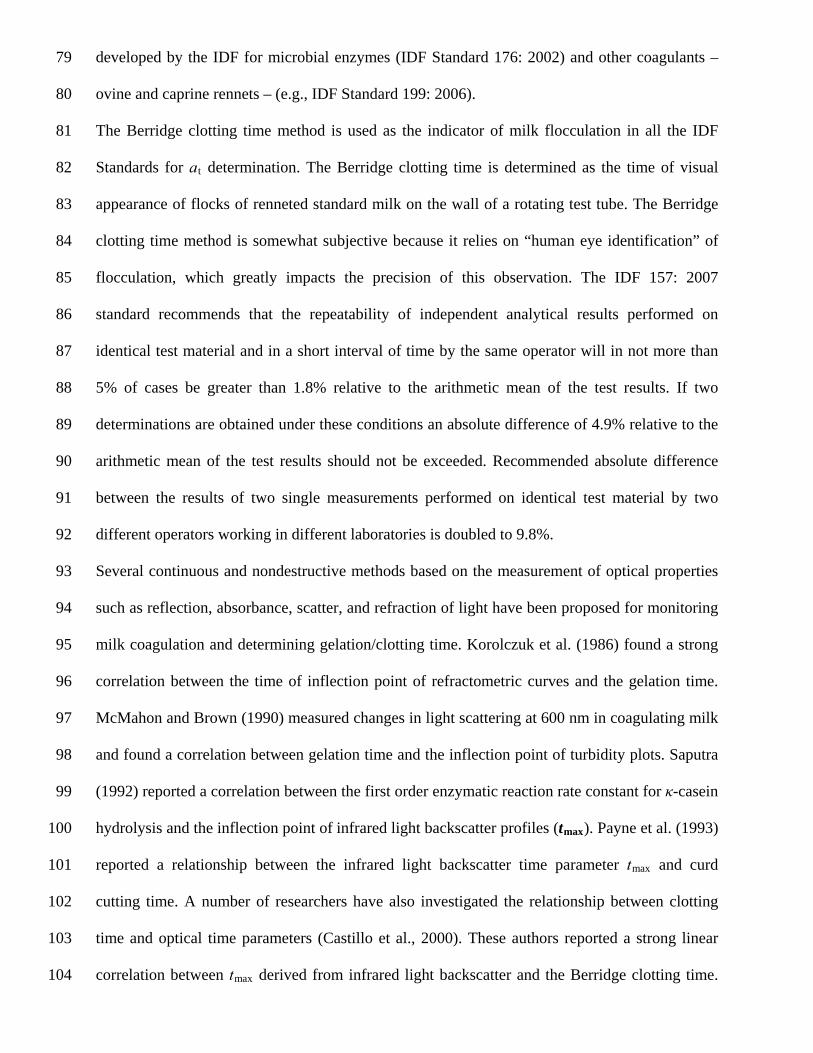
The light backscatter ratio profiles for the Chymax test solution were averaged (N = 29) and the
average presented in Figure 2 with the calculated first and second derivatives. The average light
backscatter ratio increase observed during the milk coagulation process was ~30%. Figure 2 also
shows the average location of the Berridge clotting time (t
353
354
355
356
357
358
359
360
361
362
363
364
365
366
367
368
369
370
371
372
373
374
375
376
377
378
bc) and the optical time parameters
(t2max, tmax, t2min, t2max2, and t2min2). Table 2 shows the mean and standard deviation for tbc and
the optical time parameters for both the test and reference standard solutions.
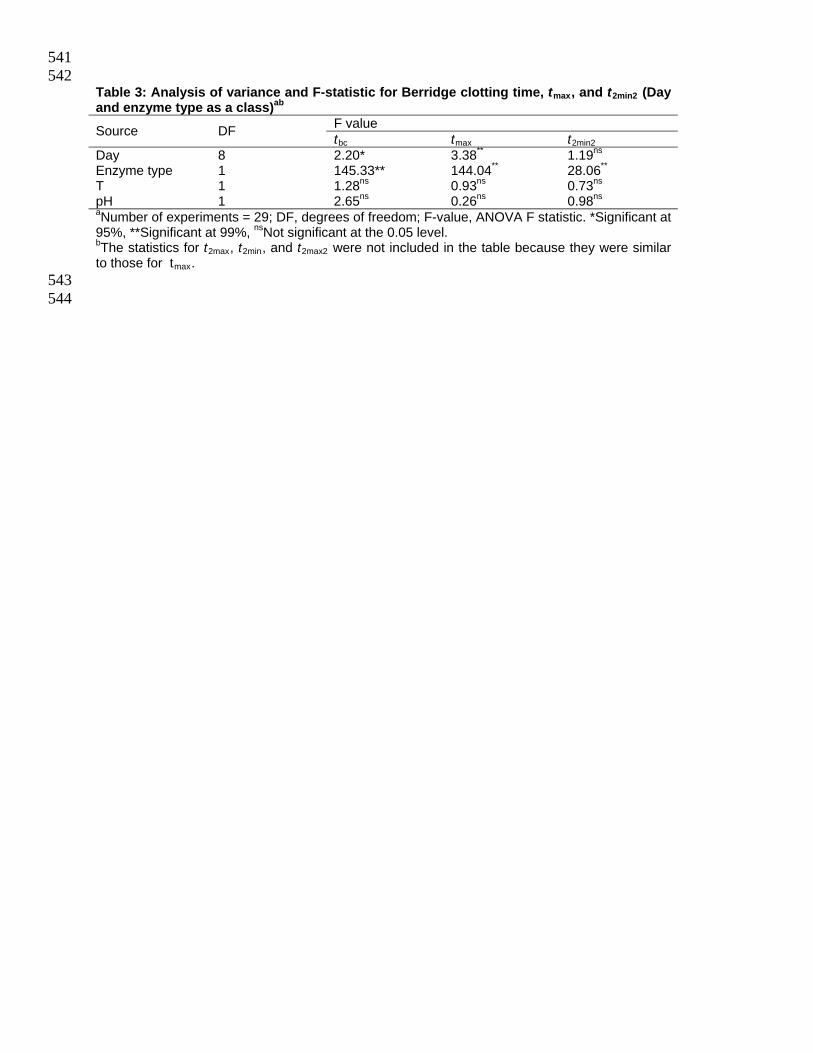
ANOVA and the F-statistic are shown in Table 3 for tbc and the optical time parameters tmax and
t2min2. The statistics for t2max, t2min, and t2max2 were not included in the table because they were
similar to those for tmax. As expected, the covariates T and pH were found to be insignificant for
all optical time parameters and tbc. These results show that the milk coagulation apparatus and
test procedure were consistent for T and pH. Enzyme type and Day were found to be significant
for all optical time parameters except for t2min2 (Table 3). Thus it appears that Day was
significant because a new calf rennet reference working solution (V3) was mixed each day
possibly changing the dilution factor. Enzyme type was expected to differ and the tbc means
(Table 2) were 8.42 and 9.03 min for the chymax test and calf rennet reference standard
solutions, respectively. The difference between the two means was 0.6 min (36 s). This
difference was within ± 40 s as prescribed by the IDF Standard 157: 2007. The lack of
significance of Day for t2min2 resulted from the increased variability (~50%) in the measurement
for this optical time parameter as shown in Table 2. This effect will be discussed later.
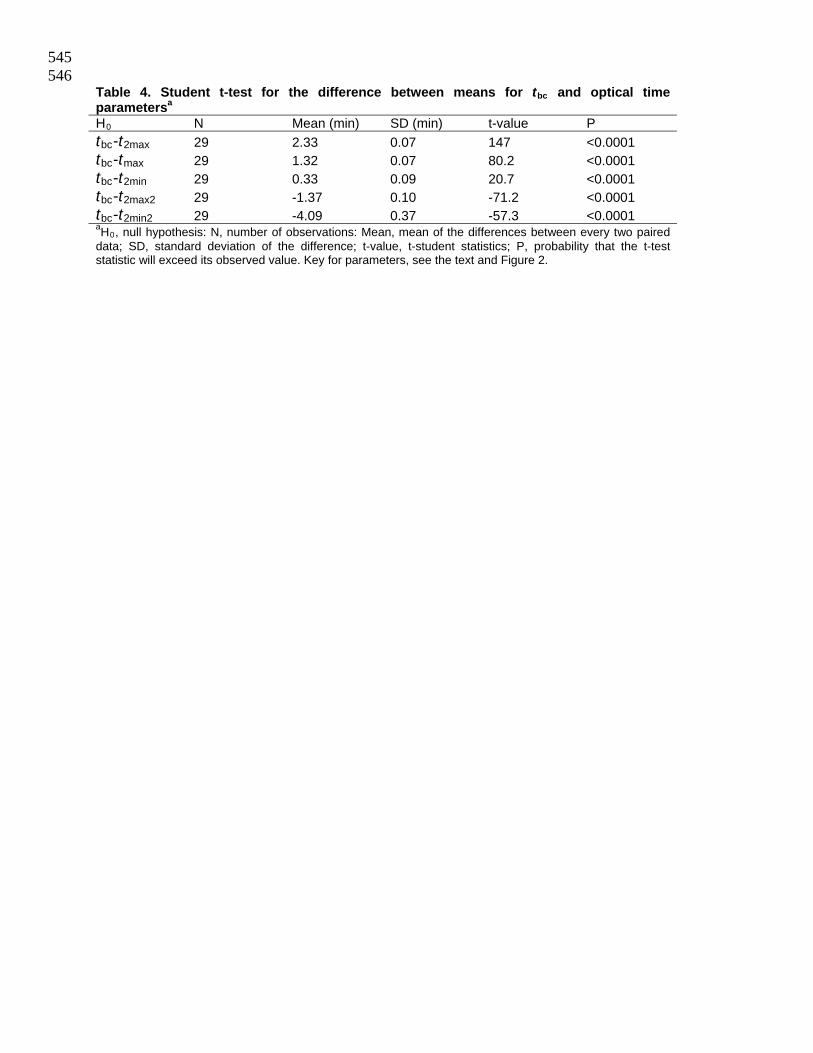
Comparison between Berridge clotting time and optical time parameters
The difference between the Berridge clotting time and the optical time parameters was studied
using the student pair wise t-test and the results shown in Table 4. Optical time parameters were
found to be significantly different from tbc. Berridge clotting time and t2min had the smallest
mean difference (0.33 min). The optical time parameters, tmax and t2max2 had a mean difference
of 1.32 and 1.37 min, respectively.
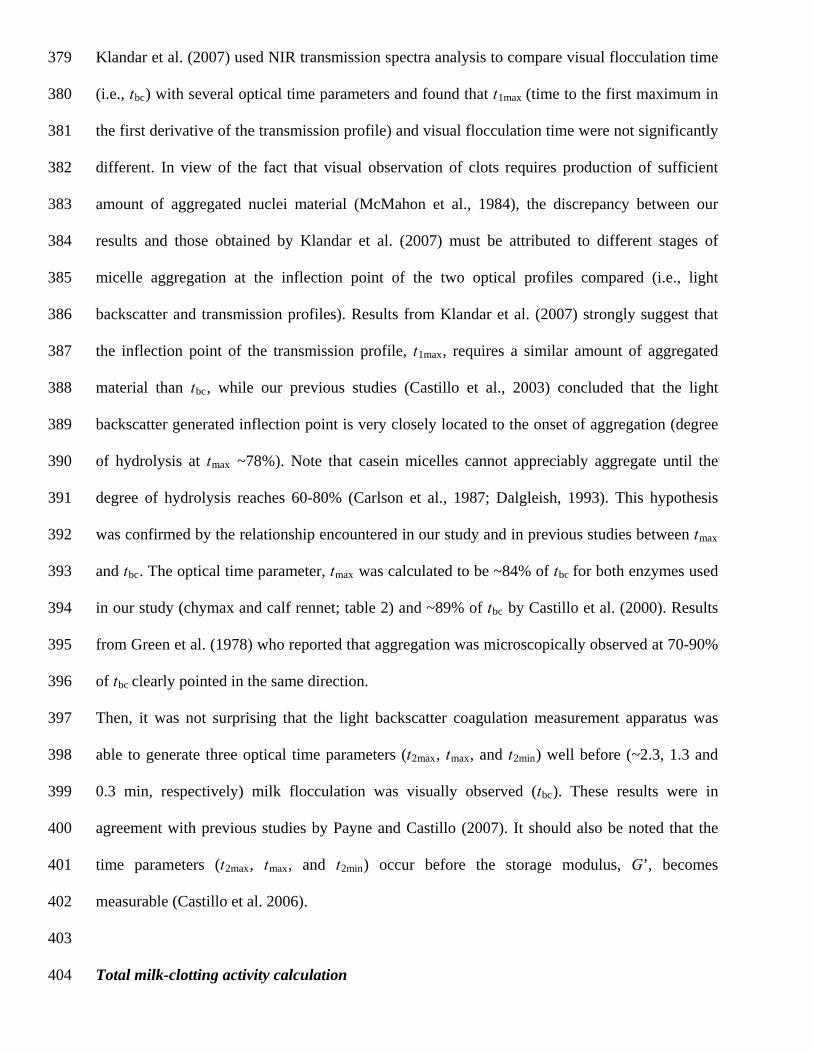
Klandar et al. (2007) used NIR transmission spectra analysis to compare visual flocculation time
(i.e., t
379
380
381
382
383
384
385
386
387
388
389
390
391
392
393
394
395
396
397
398
399
400
401
402
403
404
bc) with several optical time parameters and found that t1max (time to the first maximum in
the first derivative of the transmission profile) and visual flocculation time were not significantly
different. In view of the fact that visual observation of clots requires production of sufficient
amount of aggregated nuclei material (McMahon et al., 1984), the discrepancy between our
results and those obtained by Klandar et al. (2007) must be attributed to different stages of
micelle aggregation at the inflection point of the two optical profiles compared (i.e., light
backscatter and transmission profiles). Results from Klandar et al. (2007) strongly suggest that
the inflection point of the transmission profile, t1max, requires a similar amount of aggregated
material than tbc, while our previous studies (Castillo et al., 2003) concluded that the light
backscatter generated inflection point is very closely located to the onset of aggregation (degree
of hydrolysis at tmax ~78%). Note that casein micelles cannot appreciably aggregate until the
degree of hydrolysis reaches 60-80% (Carlson et al., 1987; Dalgleish, 1993). This hypothesis
was confirmed by the relationship encountered in our study and in previous studies between tmax
and tbc. The optical time parameter, tmax was calculated to be ~84% of tbc for both enzymes used
in our study (chymax and calf rennet; table 2) and ~89% of tbc by Castillo et al. (2000). Results
from Green et al. (1978) who reported that aggregation was microscopically observed at 70-90%
of tbc clearly pointed in the same direction.
Then, it was not surprising that the light backscatter coagulation measurement apparatus was
able to generate three optical time parameters (t2max, tmax, and t2min) well before (~2.3, 1.3 and
0.3 min, respectively) milk flocculation was visually observed (tbc). These results were in
agreement with previous studies by Payne and Castillo (2007). It should also be noted that the
time parameters (t2max, tmax, and t2min) occur before the storage modulus, G’, becomes
measurable (Castillo et al. 2006).
Total milk-clotting activity calculation
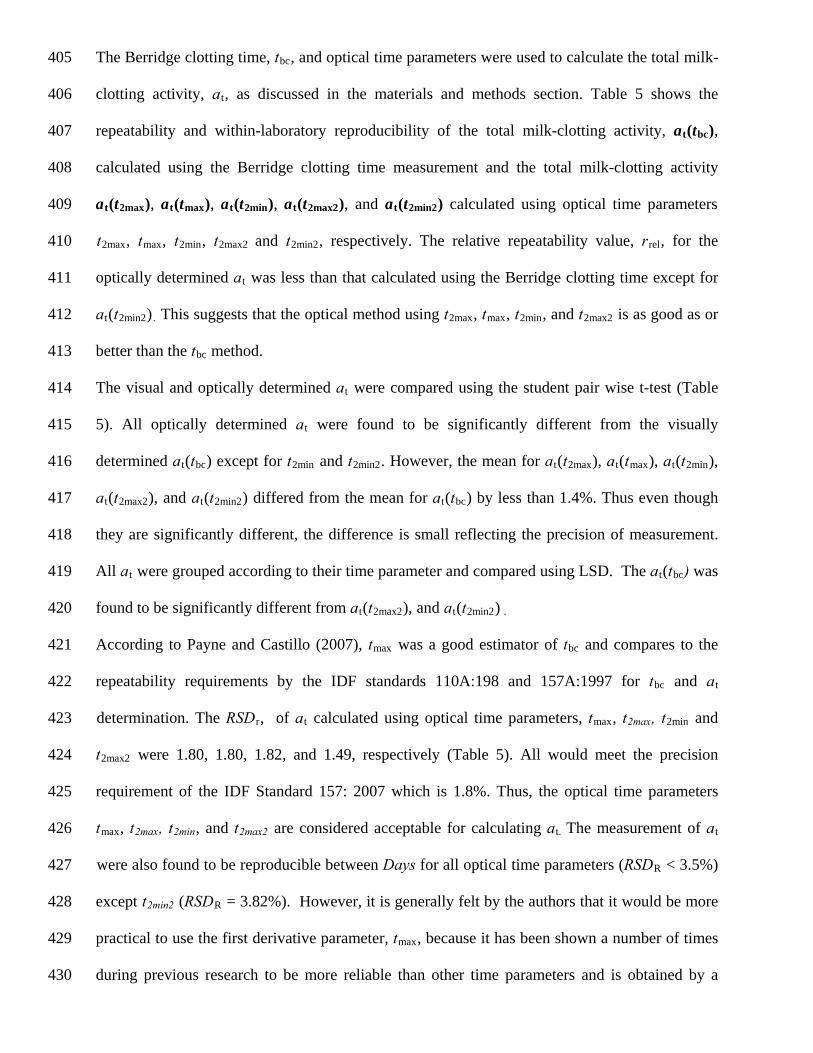
The Berridge clotting time, tbc, and optical time parameters were used to calculate the total milk-
clotting activity, a
405
406
407
408
409
410
411
412
413
414
415
416
417
418
419
420
421
422
423
424
425
426
427
428
429
430
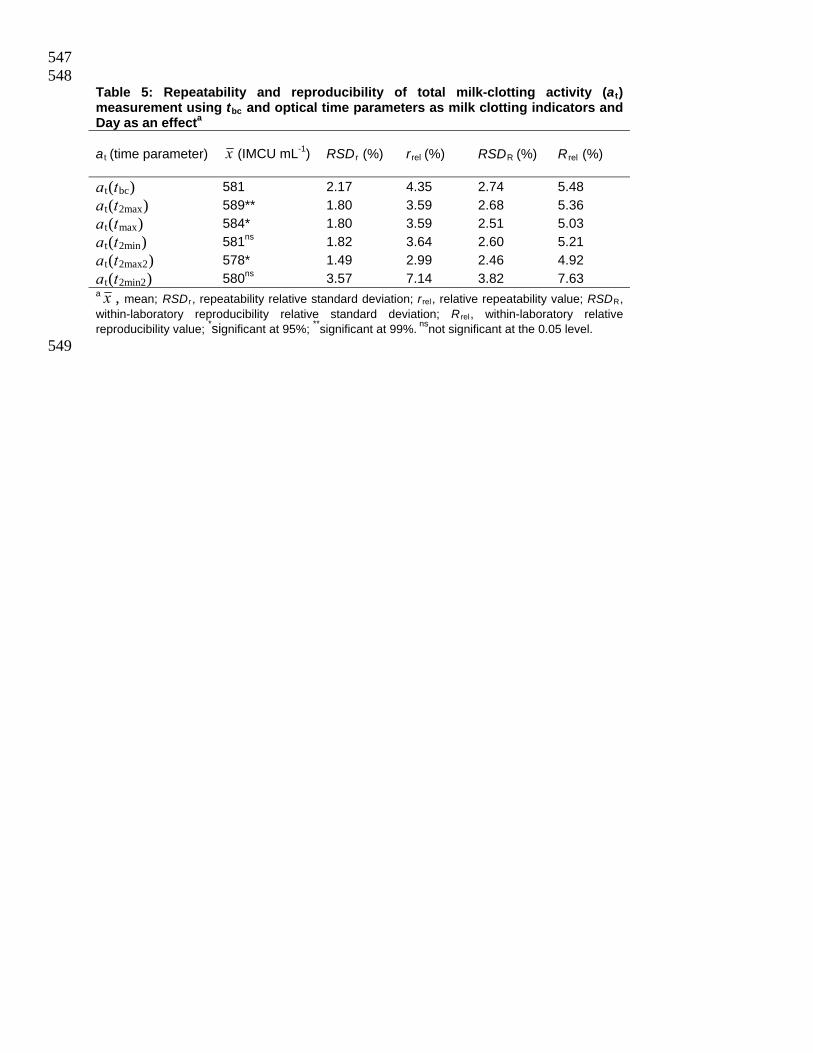
t, as discussed in the materials and methods section. Table 5 shows the
repeatability and within-laboratory reproducibility of the total milk-clotting activity, at(tbc),
calculated using the Berridge clotting time measurement and the total milk-clotting activity
at(t2max), at(tmax), at(t2min), at(t2max2), and at(t2min2) calculated using optical time parameters
t2max, tmax, t2min, t2max2 and t2min2, respectively. The relative repeatability value, rrel, for the
optically determined at was less than that calculated using the Berridge clotting time except for
at(t2min2). This suggests that the optical method using t2max, tmax, t2min, and t2max2 is as good as or
better than the tbc method.
The visual and optically determined at were compared using the student pair wise t-test (Table
5). All optically determined at were found to be significantly different from the visually
determined at(tbc) except for t2min and t2min2. However, the mean for at(t2max), at(tmax), at(t2min),
at(t2max2), and at(t2min2) differed from the mean for at(tbc) by less than 1.4%. Thus even though
they are significantly different, the difference is small reflecting the precision of measurement.
All at were grouped according to their time parameter and compared using LSD. The at(tbc) was
found to be significantly different from at(t2max2), and at(t2min2) .
According to Payne and Castillo (2007), tmax was a good estimator of tbc and compares to the
repeatability requirements by the IDF standards 110A:198 and 157A:1997 for tbc and at
determination. The RSDr, of at calculated using optical time parameters, tmax, t2max, t2min and
t2max2 were 1.80, 1.80, 1.82, and 1.49, respectively (Table 5). All would meet the precision
requirement of the IDF Standard 157: 2007 which is 1.8%. Thus, the optical time parameters
tmax, t2max, t2min, and t2max2 are considered acceptable for calculating at. The measurement of at
were also found to be reproducible between Days for all optical time parameters (RSDR < 3.5%)
except t2min2 (RSDR = 3.82%). However, it is generally felt by the authors that it would be more
practical to use the first derivative parameter, tmax, because it has been shown a number of times
during previous research to be more reliable than other time parameters and is obtained by a
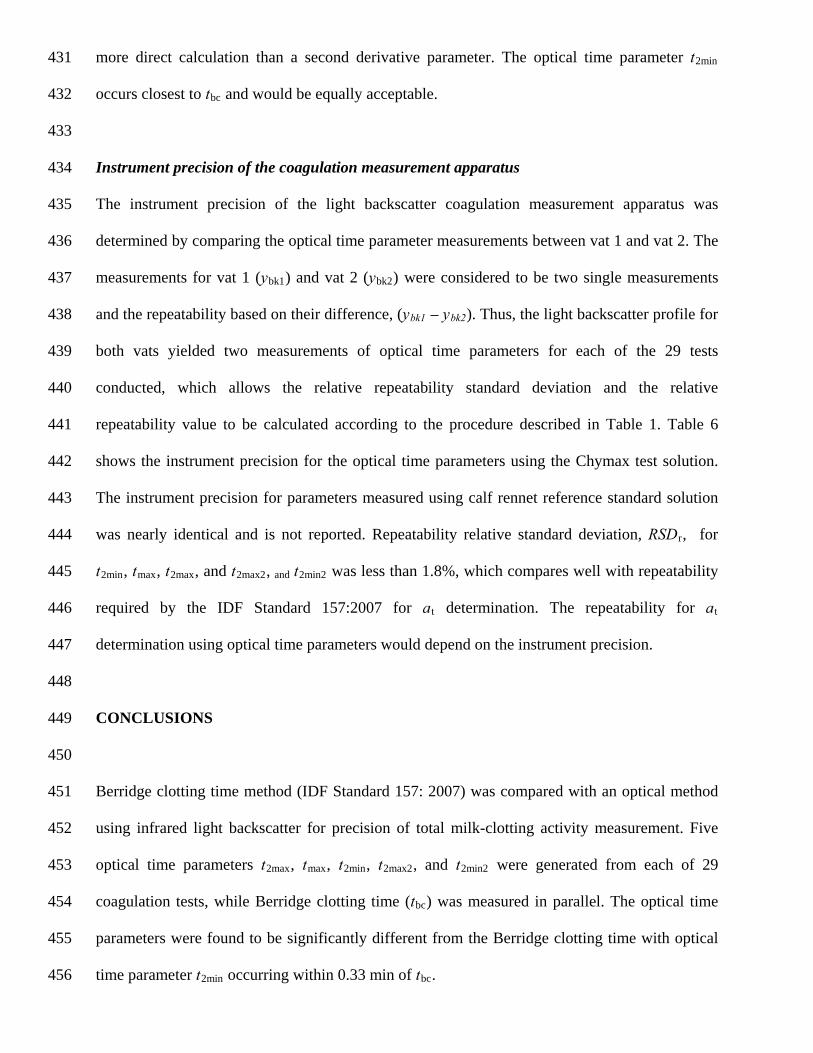
more direct calculation than a second derivative parameter. The optical time parameter t2min
occurs closest to t
431
432
433
434
435
436
437
438
439
440
441
442
443
444
445
446
447
448
449
450
451
452
453
454
455
456
bc and would be equally acceptable.
Instrument precision of the coagulation measurement apparatus
The instrument precision of the light backscatter coagulation measurement apparatus was
determined by comparing the optical time parameter measurements between vat 1 and vat 2. The
measurements for vat 1 (ybk1) and vat 2 (ybk2) were considered to be two single measurements
and the repeatability based on their difference, (ybk1 – ybk2). Thus, the light backscatter profile for
both vats yielded two measurements of optical time parameters for each of the 29 tests
conducted, which allows the relative repeatability standard deviation and the relative
repeatability value to be calculated according to the procedure described in Table 1. Table 6
shows the instrument precision for the optical time parameters using the Chymax test solution.
The instrument precision for parameters measured using calf rennet reference standard solution
was nearly identical and is not reported. Repeatability relative standard deviation, RSDr, for
t2min, tmax, t2max, and t2max2, and t2min2 was less than 1.8%, which compares well with repeatability
required by the IDF Standard 157:2007 for at determination. The repeatability for at
determination using optical time parameters would depend on the instrument precision.
CONCLUSIONS
Berridge clotting time method (IDF Standard 157: 2007) was compared with an optical method
using infrared light backscatter for precision of total milk-clotting activity measurement. Five
optical time parameters t2max, tmax, t2min, t2max2, and t2min2 were generated from each of 29
coagulation tests, while Berridge clotting time (tbc) was measured in parallel. The optical time
parameters were found to be significantly different from the Berridge clotting time with optical
time parameter t2min occurring within 0.33 min of tbc.
The optical time parameters and the Berridge clotting time were used to calculate the total milk-
clotting activity and the mean difference was determined to be less than 1.4%. The repeatability
relative standard deviation for the optically determined total milk-clotting activities suggests that
the optical method using t
457
458
459
460
461
462
463
464
465
466
467
468
469
470
471
472
473
474
475
476
477
478
479
480
481
482
2max, tmax, t2min, and t2max2 is as good or better than the Berridge clotting
time method. The instrument precision of the light backscatter coagulation measurement
apparatus was less than or equal to 1.8%, which compares well with repeatability required by the
IDF Standard 157:2007 for total milk-clotting activity determination. These results show that the
optical time parameters could be used as an objective indicator of clotting time for determining
the total milk-clotting activity. The first derivative parameter, tmax, is recommended as the
preferred optical parameter for calculating total milk-clotting activity however, a second
derivative calculation t2min that occurs closest to tbc, would be equally acceptable. It is concluded
that the infrared light backscatter method represents a viable, repeatable and alternative method
for measuring total milk-clotting activity of rennets and milk coagulating enzymes.
ACKNOWLEDGEMENTS
The authors wish to thank the University of Kentucky Biosystems and Agricultural Engineering
Department. In addition, we are grateful to the Department of Food Technology, University of
Murcia for providing the IDF standard materials required for the experiments. We acknowledge
the assistance during testing of research assistants, Joe Redwine and Donnie Stamper. This
research was supported by research project “NRI-USDA 2005-35503-15390” and USDA
Regional Project NC-1023.
REFERENCES
Carlson, A., Hill, C. G. y Olson, N. F. (1987). Kinetics of milk coagulation: I. The kinetics of
kappa casein hydrolysis in the presence of enzyme deactivation. Biotechnology and
Bioengineering 29: 582-589.
Castillo, M., Payne, F.A., Hicks, C.L., and Lopez, M.B. 2000. Predicting cutting and clotting
time of coagulating goat’s milk using diffuse reflectance: effect of pH, temperature and
enzyme concentration. Int. Dairy J., 10:551-562.
483
484
485
486
487
488
489
490
491
492
493
494
495
496
497
498
499
500
501
502
503
504
505
506
507
Castillo, M., Lucey, J.A., and Payne, F.A. 2006. The effect of temperature and inoculum
concentration on rheological and light scatter properties of milk coagulated by a
combination of bacterial fermentation and chymosin. Cottage cheese-type gels. Int. Dairy
J., 16:131-146.
Castillo, M.; Payne, F.A.; Hicks, C.L.; Laencina, J.S.; Lopez, M.B. 2003. Modeling casein
aggregation and curd firming in goats’ milk from backscatter of infrared light. J. Dairy
Res., 70, 335–348.
Dalgleish, D. G. 1993. The enzymatic coagulation of milk. In cheese: Chemistry, Physics and
Microbiology, 1, 69-100. (Ed. Pf Fox). London: Chapman and Hall.
Green, M. L., Hobbs, D.G., Morant, S.Y., and Hill, V.A. 1978. Intermicellar relationships in
rennet-treated separated milk II. Process of gel assembly. J. Dairy Res., 45, 413-422.
IDF 1991. Precision characteristics of analytical methods – outline of collaborative study
procedure. Brussels, Belgium: International IDF Standard 135B.
ISO 1994. Accuracy (trueness and precision) of measurement methods and results. Part 2: Basic
method for the determination of repeatability and reproducibility of a standard
measurement method. Switzerland: International Standard, ISO 5725-2.
IDF 1997. Determination of Total Milk Clotting Activity. Brussels, Belgium: International IDF
Standard 157A.
IDF 2002. Milk and milk products. Microbial coagulants. Determination of total milk-clotting
activity. Geneva, Switzerland: IDF International Standard 176.
IDF 2006. Milk and milk products – Ovine and caprine rennets – Determination of total
milk clotting activity. Brussels, Belgium: International IDF Standard 199.
IDF 2007. Determination of the total milk clotting activity of bovine rennets. Brussels,
Belgium: International IDF Standard 157.
508
509
510
511
512
513
514
515
516
517
518
519
520
521
522
523
524
525
526
527
528
529
530
531
532
533
Klandar, A.H., Lagaude, A., and Chevelier-Lucia, D. 2007. Assessment of the rennet coagulation
of skim milk: A comparison of methods. International Dairy Journal, 17:1151-1160.
Korolczuk, J., Maubois, J.-L. and Loheac, J. 1986. Suivi de la coagulation-présure du lait à l'aide
d'un nouveau capteur réfractométrique. Le Lait, 66: 327-339.
Kubarsepp, I., Henno, M., Kart, O., and Tupasela, T. 2005. A comparison of the methods for
determination of the rennet coagulation properties of milk. Acta Agriculturae Scand
Section A, 55:145-148.
Law, Barry A., 1999. Technology in Cheesemaking. Brooktondale, N.Y.: F.V. Kosikowski and
Associates.
Lopez, M.B., Jordan, M.J., Luna, A., Banon, S., Garrido, M.D., and Laencina, J. 1997. Diffuse
reflectance profiles of goat’s milk during coagulation by various enzymes. Food Science
and Technology International, 3:299-301.
McMahon, D.J., Richardson, G.H., and Brown, R.J. 1984. Enzymic milk coagulation: Role of
equations involving coagulation time and curd firmness in describing coagulation.
Journal of Dairy Science, 67:1185-1193.
McMahon, D.J., and Brown, R.J. 1990. Development of surface functionality of casein particles
as the controlling parameter of enzymic milk coagulation. Colloids and Surfaces, 44:263-
279.
Payne, F.A., Hicks, C.L., Shen, and Pao-Sheng 1993. Predicting optimal cutting time of
coagulating milk using diffuse reflectance. J. Dairy Science, 76:48-61.
Payne, F.A. and Castillo, M. 2007. Light backscatter sensor applications in milk coagulation.
Encyclopedia of Agriculture, Food, and Biological Engineering, 1:1, 1-5.
Saputra, D. 1992. Analysis of enzymatic hydrolysis of milk using diffuse reflectance of near
infrared radiation. PhD diss. Lexington, KY.: University of Kentucky, USA.

SAS® User’s Guide: Statistics, Version 9.1 Edition. 2003. SAS Inst., Inc., Cary, NC. 534
535
536
537
538
539 540
Table 1: Repeatability and reproducibility calculations for milk-clotting activity according to ISO Standard 5725-2: 1994 and IDF Standard 135B: 1991.a
Intracell Mean
Intracell standard deviation
Repeatability variance
Between-Day variance
Reproducibility variance
Repeatability Relative Standard Deviation (C.V.%)
Relative Repeatability Value (95% Confidence Interval, %)
Within-Laboratory Reproducibility Relative Standard Deviation (C.V. %)
Relative Within-Laboratory Reproducibility Value (95% Confidence Interval, %)
ab = days; b = 1 to t; k = observations; k = 1 to nb.
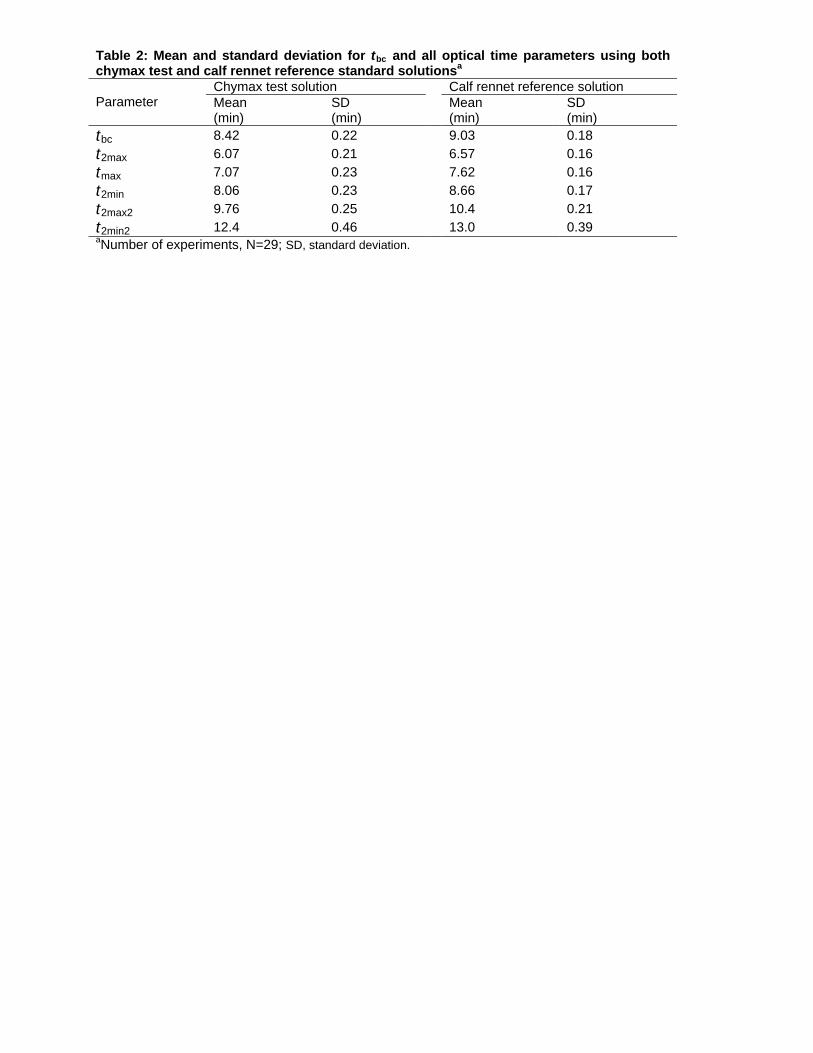
Table 2: Mean and standard deviation for tbc and all optical time parameters using both chymax test and calf rennet reference standard solutionsa
Chymax test solution Calf rennet reference solution Parameter Mean
(min) SD (min)
Mean (min)
SD (min)
tbc 8.42 0.22 9.03 0.18
t2max 6.07 0.21 6.57 0.16
tmax 7.07 0.23 7.62 0.16
t2min 8.06 0.23 8.66 0.17
t2max2 9.76 0.25 10.4 0.21
t2min2 12.4 0.46 13.0 0.39 aNumber of experiments, N=29; SD, standard deviation.
541 542
Table 3: Analysis of variance and F-statistic for Berridge clotting time, tmax, and t2min2 (Day and enzyme type as a class)ab
F value Source DF
tbc tmax t2min2 Day 8 2.20* 3.38** 1.19ns Enzyme type 1 145.33** 144.04** 28.06** T 1 1.28ns 0.93ns 0.73ns pH 1 2.65ns 0.26ns 0.98ns aNumber of experiments = 29; DF, degrees of freedom; F-value, ANOVA F statistic. *Significant at 95%, **Significant at 99%, nsNot significant at the 0.05 level. bThe statistics for t2max, t2min, and t2max2 were not included in the table because they were similar to those for tmax. 543
544
545 546
Table 4. Student t-test for the difference between means for tbc and optical time parametersa H0 N Mean (min) SD (min) t-value P tbc-t2max 29 2.33 0.07 147 <0.0001 tbc-tmax 29 1.32 0.07 80.2 <0.0001 tbc-t2min 29 0.33 0.09 20.7 <0.0001 tbc-t2max2 29 -1.37 0.10 -71.2 <0.0001 tbc-t2min2 29 -4.09 0.37 -57.3 <0.0001 aH0, null hypothesis: N, number of observations: Mean, mean of the differences between every two paired data; SD, standard deviation of the difference; t-value, t-student statistics; P, probability that the t-test statistic will exceed its observed value. Key for parameters, see the text and Figure 2.
547 548
Table 5: Repeatability and reproducibility of total milk-clotting activity (at) measurement using tbc and optical time parameters as milk clotting indicators and Day as an effecta
a t (time parameter) x (IMCU mL-1) RSDr (%) rrel (%) RSDR (%)
Rrel (%)
at(tbc) 581 2.17 4.35 2.74 5.48
at(t2max) 589** 1.80 3.59 2.68 5.36
at(tmax) 584* 1.80 3.59 2.51 5.03
at(t2min) 581ns 1.82 3.64 2.60 5.21
at(t2max2) 578* 1.49 2.99 2.46 4.92
at(t2min2) 580ns 3.57 7.14 3.82 7.63 a x , mean; RSDr, repeatability relative standard deviation; r rel, relative repeatability value; RSDR, within-laboratory reproducibility relative standard deviation; R rel, within-laboratory relative reproducibility value; *significant at 95%; **significant at 99%. nsnot significant at the 0.05 level.
549

550 551
Table 6: Instrument precision between the milk coagulation apparatus vats for measurement of optical time parameters using chymaxa Optical time Parameter x (min) sr (min) RSDr (%) rrel (%)
t2max 6.58 0.03 0.44 0.89
tmax 7.62 0.02 0.32 0.64
t2min 8.64 0.03 0.31 0.62
t2max2 10.39 0.02 0.16 0.33
t2min2 13.04 0.17 1.31 2.62 a x , mean; s r, repeatability standard deviation; RSDr, repeatability relative standard deviation; r rel, relative repeatability value.
552 553 554 555
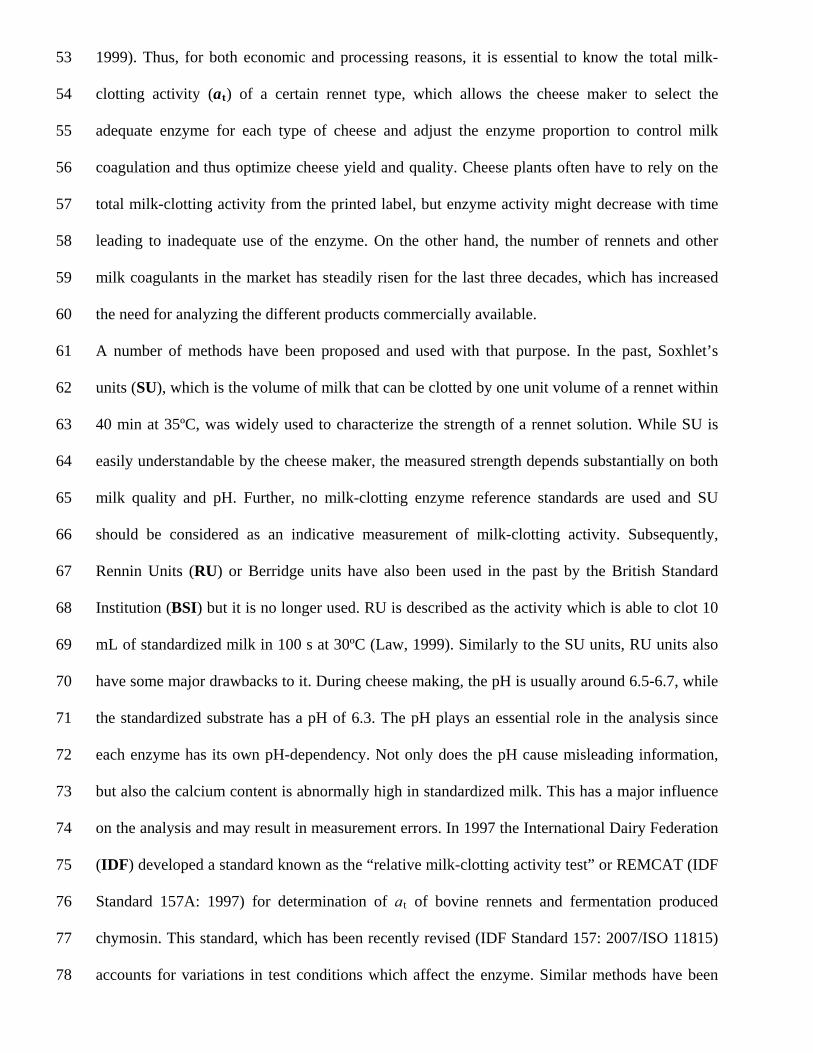
VAT #2THERMISTOR
VAT #1 VAT #2
VAT ENCLOSURE pH PROBE PORT(OPTIONAL)
STIR PORTCAP
FIBER OPTIC UNIT
WATER IN
WATER OUT
END VIEW
WATERTHERMISTOR
SIDE VIEW 556
557 558 559 560 561
Figure 1. Schematic of the coagulation measurement apparatus used to measure near infrared light backscatter during milk coagulation.
-0,025
-0,020
-0,015
-0,010
-0,005
0,000
0,005
0,010
0,015
0,020
0 2 4 6 8 10 12 14 16 18 20
TIME (min)
SE
CO
ND
DE
RIV
AT
IVE
(m
in-2)
0,90
0,95
1,00
1,05
1,10
1,15
1,20
1,25
1,30
1,35
0 2 4 6 8 10 12 14 16 18 20
LIG
HT
BA
CK
SC
AT
TE
R
RA
TIO
(d
imen
sio
nle
ss)
0,000
0,005
0,010
0,015
0,020
0,025
0,030
0,035
0,040
0,045
0 2 4 6 8 10 12 14 16 18 20
FIR
ST
DE
RIV
AT
IVE
(m
in-1
)
t max
t bc
t 2min
t 2max
t 2max2
t 2min2
(a)
(b)
(c)
562 563 564 565 566 567
Figure 2. An average light backscatter ratio profile (a) and its calculated first derivative (b) and second derivative (c) obtained by averaging the measured infrared light backscatter ratio profiles for the 29 tests using the Chymax test solution. The average Berridge clotting time, tbc, and optical time parameters (t2max, tmax, t2min, t2max2, and t2min2) are indicated with dotted lines. See material and methods section for definition of optical time parameters.
568
569 570 571 572
Stir
Thermal Equilibrium at 32˚C
Enzyme
Stir
Optically determined parameters
Visually determined Berridge clotting time
CaCl2
solution Standard
milk De-ionized
water
Figure 3. Schematic of testing procedure for comparing the Berridge clotting time method with the proposed optical method using near infrared light backscatter for determining measurement precision of total milk-clotting activity.
573 574
R1R2
T1T2
Tw
WATERBATH
COAGULATIONVATS
ELECTRONICENCLOSURE
COMPUTER
TESTTUBE
VARIABLE SPEED MOTOR (3 RPM)
R1R2
T1T2
Tw
WATERBATH
COAGULATIONVATS
ELECTRONICENCLOSURE
COMPUTER
R1R2
T1T2
Tw
WATERBATH
COAGULATIONVATS
ELECTRONICENCLOSURE
COMPUTER
TESTTUBE
VARIABLE SPEED MOTOR (3 RPM)
575 576 577 578 579 580
Figure 4. A schematic of the measurement system used to determine Berridge clotting time and optical time parameters. Instrument connections: R1 = light backscatter sensor for Vat 1; R2 = light backscatter sensor for Vat 2; T1 = thermistor for Vat 1; T2 = thermistor for Vat 2; and Tw = thermistor for circulating water inside coagulation vat enclosure.