Embed Size (px)
Citation preview
Resource
Comprehensive Analysis of SilencingMutants Reveals Complex Regulationof the ArabidopsisMethylomeHume Stroud,1 Maxim V.C. Greenberg,1,4 Suhua Feng,1,2,3,4 Yana V. Bernatavichute,1 and Steven E. Jacobsen1,2,3,*1Department of Molecular, Cell and Developmental Biology2Eli and Edythe Broad Center of Regenerative Medicine and Stem Cell Research3Howard Hughes Medical Institute
University of California, Los Angeles, Los Angeles, CA 90095, USA4These authors contributed equally to this work
*Correspondence: [email protected]
http://dx.doi.org/10.1016/j.cell.2012.10.054
SUMMARY
Cytosine methylation is involved in various biologicalprocesses such as silencing of transposable ele-ments (TEs) and imprinting. Multiple pathways regu-late DNA methylation in different sequence contexts,but the factors that regulate DNA methylation ata given site in the genome largely remain unknown.Here we have surveyed the methylomes of a com-prehensive list of 86 Arabidopsis gene silencingmutants by generating single-nucleotide resolutionmaps of DNA methylation. We find that DNA methyl-ation is site specifically regulated by different factors.Furthermore, we have identified additional regulatorsof DNA methylation. These data and analyses willserve as a comprehensive community resource forfurther understanding the control of DNAmethylationpatterning.
INTRODUCTION
The Arabidopsis genome is methylated in CG, CHG, and
CHH (where H = A, T, or C) sequence contexts (Law and
Jacobsen, 2010). It is understood that distinct pathways regulate
methylation in each of the three sequence contexts. CG
methylation is maintained by METHYLTRANSFERASE 1
(MET1), the plant homolog of mammalian DNA (cytosine-5)-
methyltransferase 1 (DNMT1), and CHG methylation is main-
tained by CHROMOMETHYLASE 3 (CMT3). KRYPTONITE
(KYP/SUVH4), SUVH5, and SUVH6 are the primary H3K9 meth-
yltransferases and are required for CMT3 activity (Ebbs and
Bender, 2006; Jackson et al., 2002; Lindroth et al., 2001).
DOMAINS REARRANGED METHYLTRANSFERASES 1 (DRM1)
and 2 (DRM2), plant homologs of mammalian DNMT3, are
responsible for CHH methylation through the RNA-directed
DNA methylation (RdDM) pathway, which involves two plant
specific RNA polymerases, RNA Pol IV and Pol V, as well as 24
nucleotide (24 nt) small interfering RNAs (siRNAs). Although
352 Cell 152, 352–364, January 17, 2013 ª2013 Elsevier Inc.
these three main DNA methylation pathways exist, it is
notable that the chromatin remodeler DECREASE IN DNA
METHYLATION 1 (DDM1) is required for the maintenance of
CG and non-CG methylation (Jeddeloh et al., 1999; Vongs
et al., 1993). Some interplay between DNAmethylation pathways
has been reported; however, the extent is largely unknown due
to the lack of genome-wide analyses. Studies thus far on DNA
methylation have usually been restricted to a few selected loci
or insensitive methods such as immunostaining.
Whole-genome bisulfite sequencing (BS-seq) enables deter-
mination of methylation levels at single-nucleotide resolution
(Cokus et al., 2008; Lister et al., 2008). Here, we have generated
high-coverage genome-wide maps of the Arabidopsis methyl-
ome in 86 mutants in the same genetic background and tissue
type. Along with the current view that distinct pathways control
CG, CHG, and CHH methylation, we also found that DNA
methylation is regulated in a site-specific manner involving inter-
plays between different pathways. Our results provide a compre-
hensive view of the regulation of DNA methylation patterning in
theArabidopsis genome. In addition, our results revealed several
unexpected features. Close examination of RNAi mutants sug-
gested that specific sites in the genome might be regulated by
RNAi factors not involved in the DRM1/2 pathway. Mutation in
the chromatin assembly factor 1 (CAF-1) complex, which was
thought not to regulate DNA methylation, induced CHG hyper-
methylation. We also found that RNA Pol II is required for DNA
methylation largely independent of Pol IV and Pol V, suggesting
an additional pathway for heterochromatin formation in plants.
Finally, we found that one of the Su(var)3-9 related genes,
SUVR2, is involved in RdDM, revealing a new component in
the pathway. Our results open new areas of future research,
and our data set allows one to determine the factor(s) involved
in controlling DNAmethylation at a given cytosine in the genome,
and thus will serve as a platform for further studies.
RESULTS AND DISCUSSION
Single-Nucleotide Resolution Maps of DNA MethylationWe performed whole-genome BS-seq on 86 mutants utilizing
tissue of the same developmental stage (3-week-old leaves)
CG
1
0
CG
Methylatio
n levels
WT
met1
met1
+/+
vim
1/2/3
ddm
1
WT met1 met1 +/+ vim1/2/3 ddm1
CG
met
hyla
tio
n
CG
met
hyla
tio
n
1
-1 0
1
-1 0
B
C
WT met1 met1 +/- met1 +/- met1 +/+
CG
met
hyla
tio
n
Genes TEs
vim1/2/3 ddm1
0.3
0 0
1
g
enes
met1
+/-
A
TEs
CG
WT
met1
met1
+/+
vim
1/2/3
ddm
1
met1
+/-
TSS TTS TSS TTS
17305 17310 17315 17320 (kb)
17450 17460 17470 (kb)
Figure 1. CG Methylation
(A) Average distribution of CG methylation over
protein-coding genes (left) and TEs (right). Flank-
ing regions are the same length as the gene or TE
body (middle region). TSS = transcription start
site. TTS = transcription termination site.
(B) Heatmap of CG methylation levels (black, 1;
white, 0) within all genes and TEs in chromo-
some 1. Columns represent data for each indi-
cated genotype, and rows represent the genes/
TEs. The rows were sorted by complete linkage
hierarchical clustering with Euclidean distance as
a distance measure.
(C) Genome browser views of CG methylation in
chromosome 1. Genes (black bars) and TEs (gray
bars) are shown below.
See also Figure S1 and Table S1.
and in a single ecotype (Columbia) so that we could carefully
detect methylation differences due to genotype. By deeply
sequencing each mutant, we obtained an average coverage of
43-fold (Table S1). The methylation data are displayed in a modi-
fied UCSC genome browser (http://genomes.mcdb.ucla.edu/
AthBSseq/). Differentially methylated regions (DMRs) were
determined by comparing methylation levels in each mutant to
three independent wild-type replicates in 100 base pair tiles
throughout the genome (see Experimental Procedures).
Regulation of CG MethylationCG methylation is the most abundant type of DNA methylation.
CG methylation is present over heterochromatic regions en-
riched with transposable elements (TEs) and repeats, as well
as genic regions (Cokus et al., 2008; Lister et al., 2008). This is
in contrast to CHG and CHH methylation, which are almost
exclusively present in heterochromatin (Cokus et al., 2008; Lister
et al., 2008). Mutation of the CGmethyltransferase MET1 results
in elimination of CGmethylation throughout the genome (Figures
1A and 1B; Figures S1A and S1B available online) (Cokus et al.,
2008; Lister et al., 2008). VARIANT IN METHYLATION 1 (VIM1),
VIM2, and VIM3 are orthologous to mammalian UBIQUITIN-
LIKE, CONTAINING PHD AND RING FINGER DOMAINS 1
(UHRF1) and have been shown to regulate CG methylation
(Feng et al., 2010; Woo et al., 2008). In vim1 vim2 vim3 (vim1/
2/3), CG methylation was strongly reduced resembling met1
(Figures 1A and 1B; Figures S1A and S1B). Notably, vim1,
vim2, and vim3 individually did not affect CG methylation, indi-
cating complete functional redundancy in regulating CG methyl-
ation (Figure S1C). Either met1 +/+ or +/� progeny of met1 +/�heterozygous plants havemorphological defects, which led us to
investigate their methylomes.We found that although TEs largely
hadwild-typemethylation levels, genicmethylation was severely
Cell 152, 352–364,
impaired (Figures 1A–1C). Hence, our
results suggest that genic methylation
cannot be restored once lost and is
consistent with previous studies suggest-
ing that siRNAs (which are exclusively
associated with heterochromatin) are
required for restoration of DNA methyla-
tion in mutants of chromatin remodeler DDM1 (Teixeira et al.,
2009). In ddm1, some heterochromatic DNA methylation has
been shown to be reduced (Lippman et al., 2004), and DNA
methylation is lost progressively upon inbreeding (Kakutani
et al., 1996). We tested 7th generation homozygous ddm1 and
found that heterochromatic DNA methylation is severely lost in
ddm1; however, genic methylation remained largely intact
(Figures 1A–1C; Figure S1A). Hence, DDM1 controls DNA meth-
ylation specifically at heterochromatin (Lippman et al., 2004).
Regulation of CHG MethylationCMT3 is the main CHG methyltransferase in Arabidopsis (Law
and Jacobsen, 2010). Indeed, we observed a strong depletion
of CHG methylation in cmt3 (Figure 2A). H3K9 methyltrans-
ferases KYP, SUVH5, and SUVH6 have been shown to be
required for CMT3-dependent CHG methylation (Ebbs and
Bender, 2006). Loss of CHG methylation in kyp suvh5 suvh6
(kyp suvh5/6) closely mimicked the loss of CHG methylation in
cmt3 (Figure 2B; Figure S2A). Hence, KYP SUVH5/6 regulate
CHG methylation through CMT3 genome-wide. We further
tested redundancies between KYP, SUVH5, and SUVH6. We
found that KYP was solely responsible for certain CHG methyla-
tion sites in the genome, whereas mutations in SUVH5 or SUVH6
alone did not show any detectable alterations in CHG methyla-
tion (Figure 2B).
Although a strong depletion of CHG methylation was ob-
served in cmt3, there were patches of DNA methylation in the
genome that were not affected (Figure 2B). We found that CHG
methylation at these sites often depended on DRM1/2 (Fig-
ure 2B). Although DRM1/2 are suggested to be CHH methyl-
transferases, our results confirm that they also regulate CHG
methylation (Cao and Jacobsen, 2002a). DRM1/2 regulate
CHG methylation at specific sites in the genome, 60.4% of
January 17, 2013 ª2013 Elsevier Inc. 353
met
1 cm
t3 C
HG
hyp
o D
MR
met
1 cm
t3 C
HH
hyp
o D
MR
DM
R g
eno
me
cove
rag
e (M
b)
WT
met
1 cm
t3
met
1 cm
t3
kyp su
vh5/
6 ky
p su
vh5
suvh
6 drm
1/2
drm1/
2 cm
t3
ddm1
met
1 cm
t3
met
1 cm
t3
kyp su
vh5/
6 ky
p su
vh5
suvh
6 drm
1/2
drm1/
2 cm
t3
ddm1
CHG CHH
kyp suvh5/6 drm1/2 cmt3 kyp suvh5/6 drm1/2 cmt3
57977
1350 5426
25149 6411 8281
CHG hypo DMR CHH hypo DMR
CHH methylation
WT
met1 cmt3
met1
cmt3
kyp suvh5/6
kyp
drm1/2
drm1/2 cmt3
ddm1
1 0 -1
A B
C
D
1
0
CH
G M
ethylatio
n levels
0.8
0
CH
H M
ethylatio
n levels
6070 6075 17875 10695 10700 11300 11305 11310 17520 17525 17530 17535 (kb)
9
0
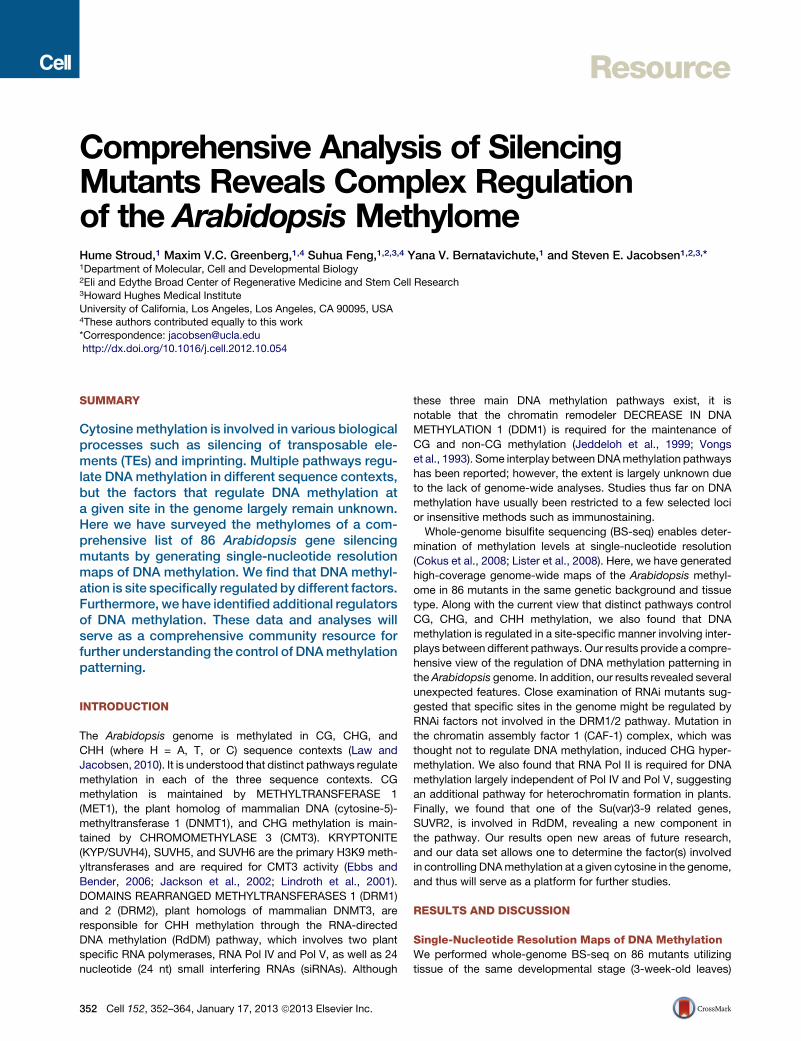
Figure 2. Non-CG Methylation
(A) Genome coverage of defined CHG and CHH
hypomethylation DMRs.
(B) Heatmap of methylation levels within 17,437
met1 cmt3 CHG (top) and 13,776 CHH (bottom)
hypomethylation DMRs.
(C) Overlap between kyp suvh5/6 and drm1/2
cmt3 hypomethylation DMRs.
(D) Genome browser views of CHH methylation in
chromosome 1. Genes (black bars) are shown
below.
See also Figure S2 and Table S1.
which sites are nonoverlapping with sites regulated by CMT3
(Figure S2A). To test the degree of redundancy between CMT3
and DRM1/2, we profiled drm1/2 cmt3 triple mutants. We
did not observe many additional losses of CHG methylation
in drm1/2 cmt3 (Figure S2B), suggesting that CMT3 and
DRM1/2 regulate CHG methylation in a mostly nonredundant
fashion.
Regulation of CHH MethylationCHG methylation and CHH methylation highly colocalize in the
wild-type genome (Cokus et al., 2008; Lister et al., 2008). Hence,
we tested whether loss of CHG methylation is associated with
loss of CHH methylation. In cmt3, loss of CHG methylation is
only partially associatedwith loss of CHHmethylation (Figure 2B;
Figure S2M). Hence, although CMT3 is required for the majority
of CHG methylation in the genome, it is required for a relatively
small proportion of CHH methylation. In contrast, in drm1/2,
loss of CHG methylation was always associated with loss of
CHH methylation (Figure S2N). Loss of CHH methylation,
however, was not always coupled with loss of CHG methylation
(Figure S2N). Thus, CHH methylation maintenance appears
more reliant on CHG methylation than CHG methylation is on
CHH methylation.
354 Cell 152, 352–364, January 17, 2013 ª2013 Elsevier Inc.
Interestingly, whereas kyp and cmt3
showed very similar losses in CHH meth-
ylation, kyp suvh5/6 showed much
stronger losses of CHH methylation
compared to cmt3 (Figures 2A–2C;
Figure S2C). KYP SUVH5/6-dependent
clusters of CHH methylation were gener-
ally nonoverlapping with DRM1/2-depen-
dent CHH methylation (Figures 2B–2D;
Figure S2C). Hence, although KYP
SUVH5/6 control CHG methylation
through CMT3, our results suggest that
KYP SUVH5/6 strongly regulate CHH
methylation through a different pathway.
Notably, mutations in factors responsible
for siRNA biogenesis such as RNA-
dependent RNA polymerase 2 (RDR2)
and DICER-LIKE 2, 3 and 4 (DCL2/3/4)
(discussed more in detail below) did not
disrupt CHH methylation at most KYP
SUVH5/6-regulated sites (Figure S2O).
Thus, KYP SUVH5/6 regulate CHH methylation in a siRNA-inde-
pendent manner.
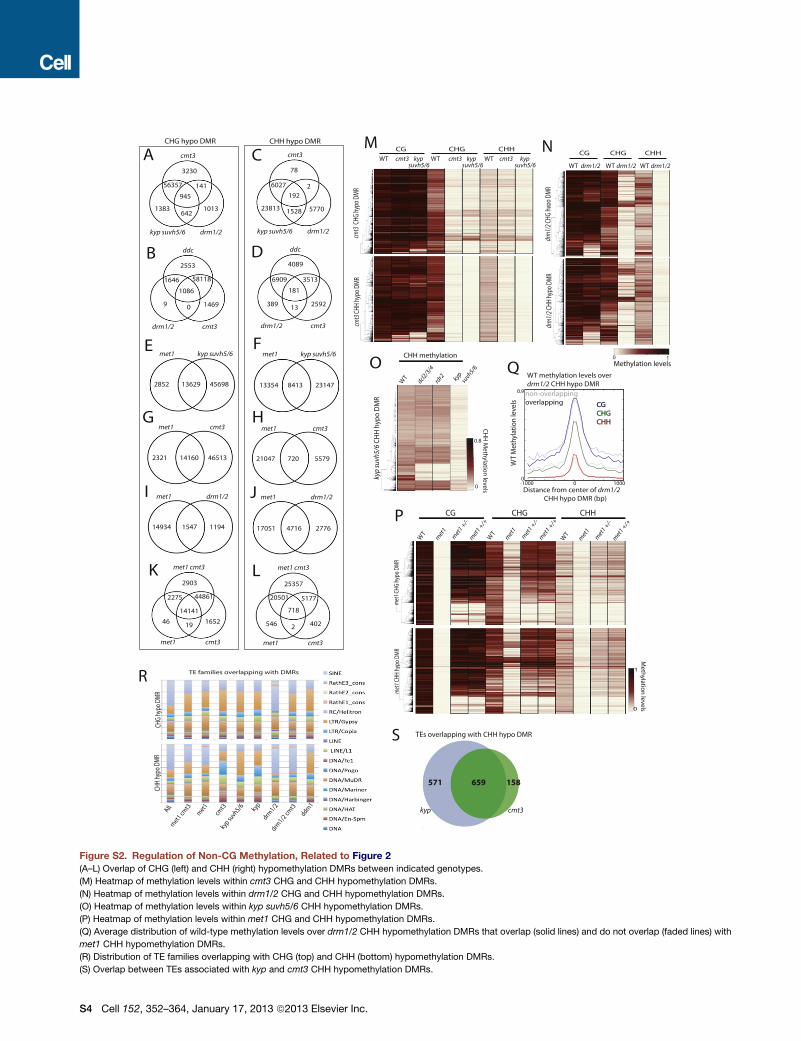
Different methylation pathways appeared to target different
classes of TEs (Figure S2R). One insight was that both cmt3
and kyp CHH DMRs were overrepresented by LTR/Copia type
TEs. The overlap between cmt3 and kyp was high; 71.0% of
cmt3 CHH TE DMRs overlapped with kyp CHH TE DMRs
(Figure S2S).
Interdependence of CG and Non-CG MethylationPrevious studies based on immunostaining and single-loci ChIP
analyses have suggested that mutation in MET1 causes loss of
H3K9m2 at certain sites (Soppe et al., 2002; Tariq et al., 2003).
Consistent with these findings, we found loss of CHG methyla-
tion at certain sites in met1 (Figure 2B). Comparing met1 and
vim1/2/3, we found 85.1% overlap between sites that lose
CHG methylation, suggesting that CG methylation is required
for proper CHG methylation at those sites (Figure S1B). Loss of
CHG methylation was observed at a subset of sites in met1 +/+
and met1 +/� progenies of met1 +/� (Figure S2P). These sites
corresponded to the subset of heterochromatic sites that did
not restore CG methylation (Figure S2P), further supporting the
notion that CG methylation is required for maintaining CHG
methylation. Loss of CHG methylation in met1 largely occurred
at certain KYP SUVH5/6 and CMT3-dependent CHG sites (Fig-
ure 2B; Figures S2E and S2G). However, loss of CHH methyla-
tion in met1 largely did not overlap with KYP SUVH5/6 and
CMT3-dependent CHH sites (Figures S2F and S2H). Hence,
although MET1 regulates CHG methylation through KYP
SUVH5/6 and CMT3, it regulates CHH methylation mostly
through a different pathway.
Although met1 CHH DMRs were much more abundant
compared to drm1/2 CHH DMRs, 63.0% of drm1/2 CHH
DMRs overlapped with met1 CHH DMRs (Figure 2B; Figures
S2I and S2J). This overlap was significantly higher than observed
for CMT3 and KYP SUVH5/6-dependent sites (11.4% and
26.7%, respectively). This and the fact that drm1/2 has minimal
disruption of CG methylation (Figure S2N) suggest a strong
tendency for DRM1/2 targeted methylation to depend on CG
methylation. Wild-type CG methylation levels at CG-methyla-
tion-dependent and -independent DRM1/2 target sites were
similar (Figure S2Q). Therefore, the features that determine
whether a DRM1/2 site is dependent on CG methylation or not
is unclear.
An additional insight was thatmet1 cmt3 caused strong reduc-
tion in both CHG and CHH methylation. In fact, met1 cmt3 most
severely affected CHH methylation of all the mutants we tested
(Figure 2A). met1 cmt3 reduced CHH methylation at many addi-
tional sites compared to met1 or cmt3 alone (Figures S2K and
S2L), suggesting that MET1 and CMT3 cooperatively regulate
the bulk of CHH methylation in the genome. Our results indicate
a strong genome-wide dependence of asymmetric CHHmethyl-
ation on symmetrical CG and CHG methylation.
Mutation in DDM1 also disrupted CHG and CHH methylation,
where loss of DNA methylation generally occurred at sites regu-
lated by KYP SUVH5/6 rather than sites regulated by DRM1/2
(Figure 2B). Only 27.3% of drm1/2 CHG DMRs and 23.1% of
drm1/2 CHH DMRs overlapped with corresponding ddm1
DMRs. Hence, unlike MET1, DDM1 is largely not required for
DRM1/2-dependent methylation.
We also found that CG methylation is dependent on non-CG
methylation at certain sites. Loss of CG methylation was associ-
ated with loss of non-CG methylation at a subset of sites in kyp
suvh5/6, cmt3, and drm1/2 (Figures S2M andS2N). For example,
although loss of methylation in drm1/2 mostly occurred in CHH
and CHG contexts, 18.5% of drm1/2 CHH DMRs were associ-
ated with loss in CGmethylation. Among sites where CHHmeth-
ylation was lost in both drm1/2 and kyp suvh5/6, sites that lost
CG methylation in drm1/2 and kyp suvh5/6 were largely overlap-
ping (77.8% of those in drm1/2 overlapped with kyp suvh5/6).
This confirms that it is likely that the loss of non-CG methylation
causes the loss of CG methylation; 71.8% of DRM1/2 CHH
DMRs that also lost CG methylation were sites where CG meth-
ylation was required for CHH methylation. These sites are inter-
esting as CG methylation and non-CG methylation become
interdependent.
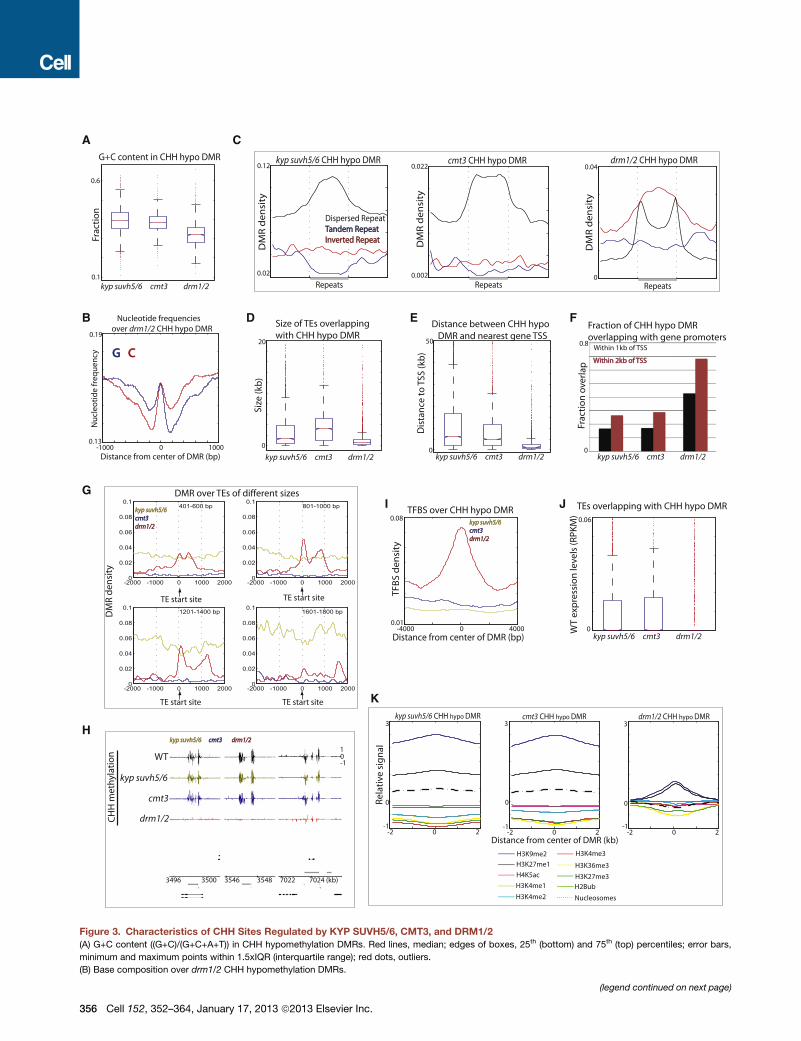
Comparison of Regions Methylated by KYP SUVH5/6,CMT3, and DRM1/2We further examined the characteristics of sites affected in kyp
suvh5/6, cmt3, and drm1/2. DRM1/2 target sites were associ-
ated with relatively lower G+C sequence composition (Figure 3A;
Figure S3A) and showed a tendency of GC skewing (Figure 3B;
Figure S3B). Association with inverted repeats was also a unique
feature of drm1/2 DMRs (Figure 3C; Figure S3C). Although
siRNAs are produced throughout most heterochromatic sites
in the genome, it is unclear howDRM1/2 are specifically targeted
to a subset of these sites. Our results suggest that sequence
composition may be one of the factors that determines which
methylation pathway is targeted at a given site in the genome.
We found that DRM1/2 targets small TEs, whereas KYP
SUVH5/6 and CMT3 target large TEs (Figure 3D; Figure S3D)
(Tran et al., 2005). TEs regulated by DRM1/2 were proximal to
promoters of genes, where around �70% of drm1/2 DMRs fell
within 2 kb of transcription start sites of protein-coding genes
(Figures 3E and 3F, Figures S3E, F) (Zhong et al., 2012). These
proximal genes were not significantly associated with particular
biological processes (data not shown). Another distinction was
that DRM1/2 specifically methylated the boundaries of TEs
(Figures 3G and 3H; Figures S3G and S3H). We next examined
the levels of enrichment of transcription factor binding sites
(TFBS) at DMRs. We found enrichment of TFBS over drm1/2
DMRs but not over kyp suvh5/6 and cmt3 DMRs (Figure 3I;
Figures S3I and S3L). Hence, DRM1/2 target sites tend to be
regulatory sites.We thensought tomeasure theexpression levels
of TEs inwild-typebyperformingRNAsequencing.We found that
DRM1/2 targeted TEs are more silent compared to CMT3-
targeted TEs (Figure 3J; Figure S3J), presumably because they
are closer to genes and thus potentially harmful if expressed.
Finally, we examined the distribution of nucleosomes and
known histone modifications over DMRs. Consistent with the
notion that CMT3 is dependent on H3K9 methylation, kyp
suvh5/6 and cmt3 DMRs were associated with higher levels of
H3K9me2 compared to drm1/2 DMRs (Figure 3K; Figure S3K).
kyp suvh5/6 and cmt3 DMRs were also associated with higher
levels of nucleosome occupancy compared to levels in drm1/2
DMRs (Figure 3K; Figure S3K). Hence, different methylation
pathways regulate sites with distinct genomic and epigenomic
characteristics.
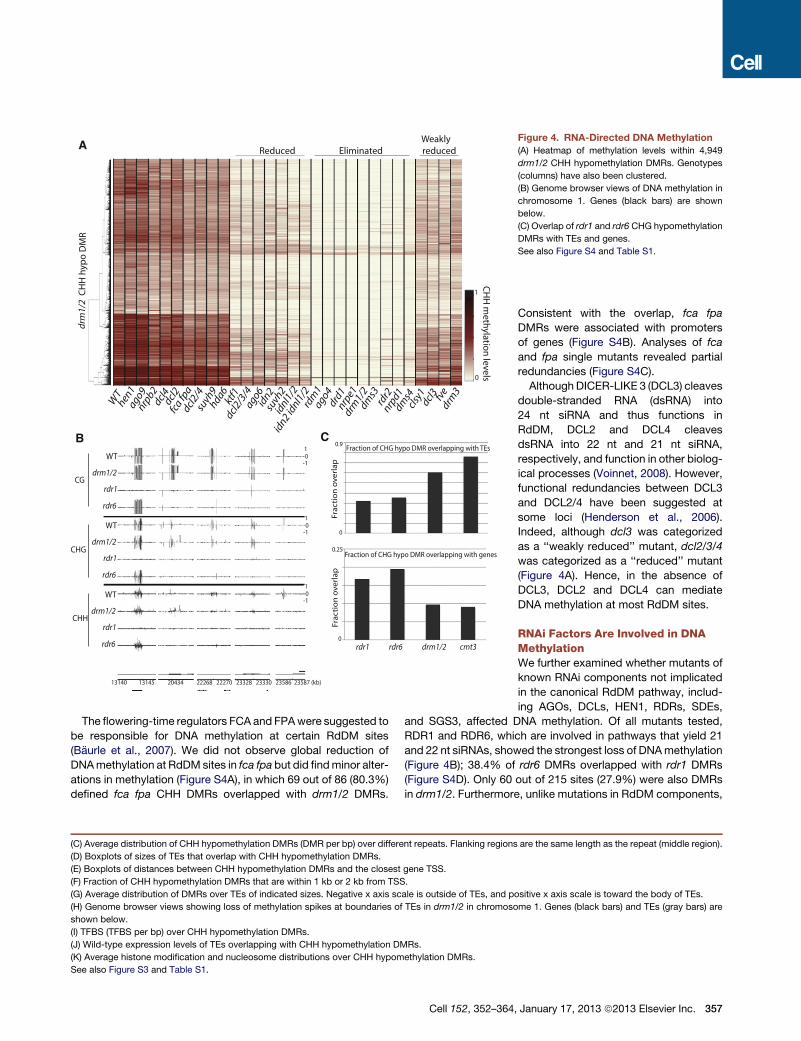
RNA-Directed DNA MethylationThe RdDM pathway involves many accessory factors that guide
DNA methylation by DRM2 (Law and Jacobsen, 2010). We
sought to examine whether disruption of components of the
pathway result in similar DNA methylation defects. We tested
29 mutants previously suggested to affect RdDM (Gu et al.,
2011; He et al., 2009; Henderson et al., 2006; Law and Jacobsen,
2010; Zheng et al., 2009). By examining methylation levels
at DRM1/2-dependent CHH sites, we found that there are differ-
ential effects when disrupting components of the RdDM
pathway (Figure 4A). Broadly, there are four classes of RdDM
components: those where mutation in the gene eliminates
DRM1/2-dependent methylation, those where mutation reduces
methylation, those where mutation weakly reduces methylation,
and those that only affect a very small proportion of sites (some
of which we describe below) (Figure 4A). Importantly, AGO4 and
AGO6 were suggested to be partially redundant (Zheng et al.,
2007). However, our results suggest that mutation in AGO4 alone
is sufficient to eliminate DRM1/2-dependent methylation.
Cell 152, 352–364, January 17, 2013 ª2013 Elsevier Inc. 355
-2000 -1000 0 1000 20000
0.02
0.04
0.06
0.08
0.1401-600 bp
-2000 -1000 0 1000 20000
0.02
0.04
0.06
0.08
0.1801-1000 bp
-2000 -1000 0 1000 20000
0.02
0.04
0.06
0.08
0.11201-1400 bp
-2000 -1000 0 1000 20000
0.02
0.04
0.06
0.08
0.11601-1800 bp
kyp suvh5/6 kyp suvh5/6 cmt3 cmt3 drm1/2 drm1/2
TE start site TE start site
TE start site TE start site
DM
R d
ensi
ty
DMR over TEs of different sizes
Distance from center of DMR (bp)
kyp suvh5/6 kyp suvh5/6 cmt3 cmt3 drm1/2 drm1/2
kyp suvh5/6 CHH hypo DMR cmt3 CHH hypo DMR
Dispersed Repeat Tandem Repeat Tandem Repeat Inverted Repeat Inverted Repeat
Repeats Repeats Repeats
drm1/2 CHH hypo DMR G+C content in CHH hypo DMR
kyp suvh5/6 cmt3 drm1/2
Size of TEs overlapping with CHH hypo DMR
kyp suvh5/6 cmt3 drm1/2
Dis
tan
ce t
o T
SS (k
b)
Distance between CHH hypo DMR and nearest gene TSS
kyp suvh5/6 cmt3 drm1/2
Fraction of CHH hypo DMR overlapping with gene promoters
Within 1kb of TSS
Within 2kb of TSS Within 2kb of TSS
kyp suvh5/6 cmt3 drm1/2
TEs overlapping with CHH hypo DMR
WT
exp
ress
ion
leve
ls (R
PKM
)
kyp suvh5/6 cmt3 drm1/2
A C
D E F
G I J
0.1
Frac
tio
n
0.6
0.02
0.12
DM
R d
en
sity
0.002
0.022
DM
R d
en
sity
0.04
0
DM
R d
en
sity
Size
(kb
)
0
20 50
0 0
0.8
Frac
tio
n o
verl
ap
0.01
0.08
TFB
S d
ensi
ty
-4000 0 4000
TFBS over CHH hypo DMR 0.06
0
GG C C
0.19
0.13 -1000 0 1000
Distance from center of DMR (bp)
Nu
cleo
tid
e fr
equ
ency
Nucleotide frequencies over drm1/2 CHH hypo DMR
B
WT
kyp suvh5/6
cmt3
drm1/2
1 0 -1
kyp suvh5/6 kyp suvh5/6 cmt3 cmt3 drm1/2 drm1/2
CH
H m
eth
ylat
ion
H
3496 3500 3546 3548 7022 7024 (kb)
kyp suvh5/6 CHH hypo DMR cmt3 CHH hypo DMR drm1/2 CHH hypo DMR
Distance from center of DMR (kb)
K
3
0
-1
3
0
-1
3
0
-1 -2 0 2 -2 0 2 -2 0 2
H3K9me2
H3K27me1
H4K5ac
H3K4me1
H3K4me2
H3K4me3
H3K36me3
H3K27me3
H2Bub
Nucleosomes
Rel
ativ
e si
gn
al
Figure 3. Characteristics of CHH Sites Regulated by KYP SUVH5/6, CMT3, and DRM1/2
(A) G+C content ((G+C)/(G+C+A+T)) in CHH hypomethylation DMRs. Red lines, median; edges of boxes, 25th (bottom) and 75th (top) percentiles; error bars,
minimum and maximum points within 1.5xIQR (interquartile range); red dots, outliers.
(B) Base composition over drm1/2 CHH hypomethylation DMRs.
(legend continued on next page)
356 Cell 152, 352–364, January 17, 2013 ª2013 Elsevier Inc.
drm
1/2
CH
H h
ypo
DM
R
dms4
nrpd1
rdr2
dms3
nrpe1
drm
1/2
drd1
ago4
rdm
1
idn2 id
nl1/2
idnl1
/2
suvh
2
idn2
ago6
dcl2/3
/4
ktf1
drm3
fve
dcl3
clsy1
WT
suvh
9
fca fp
a dcl2
/4
hen1
ago9 nrp
b2 dcl4
dcl2
hda6
Weakly Reduced Eliminated reduced
0
1
WT
rdr1
rdr6
drm1/2
WT
rdr1
rdr6
drm1/2
WT
rdr1
rdr6
drm1/2
CG
CHG
CHH
1 0
-1
1 0
-1
1 0
-1
CH
H m
ethylatio
n levels
A
B 0.9
0
0.25
0 rdr1 rdr6 drm1/2 cmt3
Fraction of CHG hypo DMR overlapping with TEs
Fraction of CHG hypo DMR overlapping with genes
Frac
tio
n o
verl
ap
Frac
tio
n o
verl
ap
C
13140 13145 20434 22268 22270 23328 23330 23586 23587 (kb)
Figure 4. RNA-Directed DNA Methylation
(A) Heatmap of methylation levels within 4,949
drm1/2 CHH hypomethylation DMRs. Genotypes
(columns) have also been clustered.
(B) Genome browser views of DNA methylation in
chromosome 1. Genes (black bars) are shown
below.
(C) Overlap of rdr1 and rdr6 CHG hypomethylation
DMRs with TEs and genes.
See also Figure S4 and Table S1.
The flowering-time regulators FCA and FPAwere suggested to
be responsible for DNA methylation at certain RdDM sites
(Baurle et al., 2007). We did not observe global reduction of
DNAmethylation at RdDM sites in fca fpa but did findminor alter-
ations in methylation (Figure S4A), in which 69 out of 86 (80.3%)
defined fca fpa CHH DMRs overlapped with drm1/2 DMRs.
(C) Average distribution of CHH hypomethylation DMRs (DMR per bp) over different repeats. Flanking regions
(D) Boxplots of sizes of TEs that overlap with CHH hypomethylation DMRs.
(E) Boxplots of distances between CHH hypomethylation DMRs and the closest gene TSS.
(F) Fraction of CHH hypomethylation DMRs that are within 1 kb or 2 kb from TSS.
(G) Average distribution of DMRs over TEs of indicated sizes. Negative x axis scale is outside of TEs, and po
(H) Genome browser views showing loss of methylation spikes at boundaries of TEs in drm1/2 in chromoso
shown below.
(I) TFBS (TFBS per bp) over CHH hypomethylation DMRs.
(J) Wild-type expression levels of TEs overlapping with CHH hypomethylation DMRs.
(K) Average histone modification and nucleosome distributions over CHH hypomethylation DMRs.
See also Figure S3 and Table S1.
Cell 152, 352–364,
Consistent with the overlap, fca fpa
DMRs were associated with promoters
of genes (Figure S4B). Analyses of fca
and fpa single mutants revealed partial
redundancies (Figure S4C).
Although DICER-LIKE 3 (DCL3) cleaves
double-stranded RNA (dsRNA) into
24 nt siRNA and thus functions in
RdDM, DCL2 and DCL4 cleaves
dsRNA into 22 nt and 21 nt siRNA,
respectively, and function in other biolog-
ical processes (Voinnet, 2008). However,
functional redundancies between DCL3
and DCL2/4 have been suggested at
some loci (Henderson et al., 2006).
Indeed, although dcl3 was categorized
as a ‘‘weakly reduced’’ mutant, dcl2/3/4
was categorized as a ‘‘reduced’’ mutant
(Figure 4A). Hence, in the absence of
DCL3, DCL2 and DCL4 can mediate
DNA methylation at most RdDM sites.
RNAi Factors Are Involved in DNAMethylationWe further examined whether mutants of
known RNAi components not implicated
in the canonical RdDM pathway, includ-
ing AGOs, DCLs, HEN1, RDRs, SDEs,
and SGS3, affected DNA methylation. Of all mutants tested,
RDR1 and RDR6, which are involved in pathways that yield 21
and 22 nt siRNAs, showed the strongest loss of DNAmethylation
(Figure 4B); 38.4% of rdr6 DMRs overlapped with rdr1 DMRs
(Figure S4D). Only 60 out of 215 sites (27.9%) were also DMRs
in drm1/2. Furthermore, unlike mutations in RdDM components,
are the same length as the repeat (middle region).
sitive x axis scale is toward the body of TEs.
me 1. Genes (black bars) and TEs (gray bars) are
January 17, 2013 ª2013 Elsevier Inc. 357
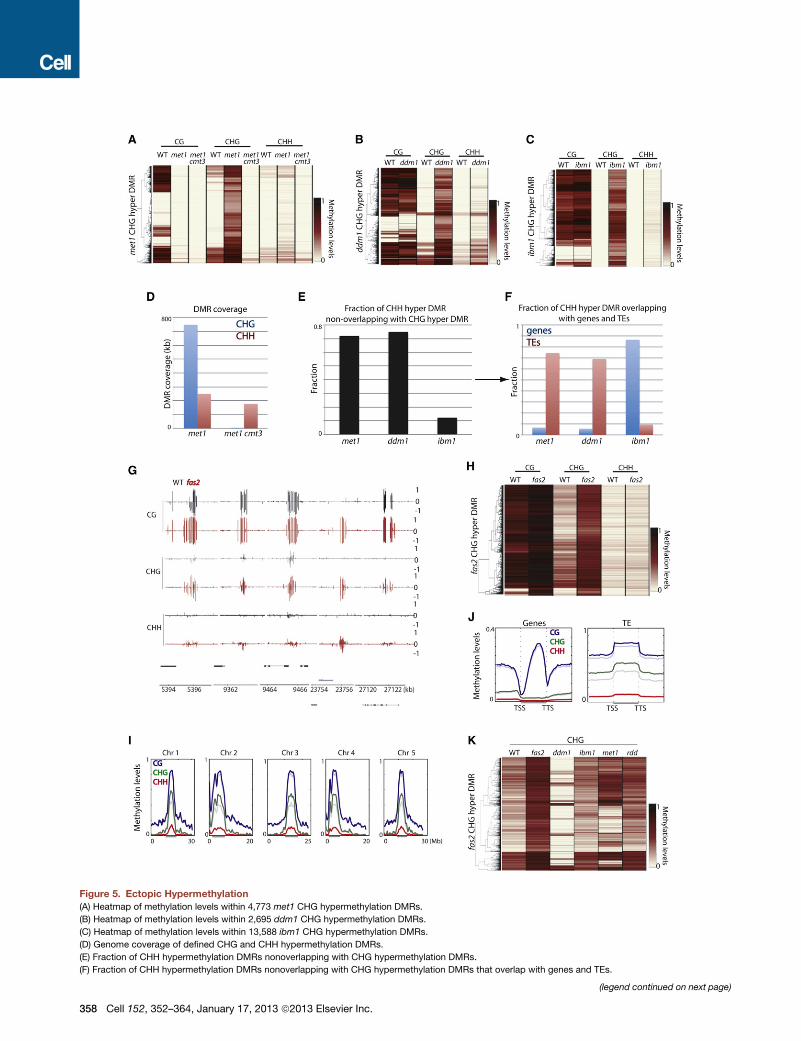
Figure 5. Ectopic Hypermethylation
(A) Heatmap of methylation levels within 4,773 met1 CHG hypermethylation DMRs.
(B) Heatmap of methylation levels within 2,695 ddm1 CHG hypermethylation DMRs.
(C) Heatmap of methylation levels within 13,588 ibm1 CHG hypermethylation DMRs.
(D) Genome coverage of defined CHG and CHH hypermethylation DMRs.
(E) Fraction of CHH hypermethylation DMRs nonoverlapping with CHG hypermethylation DMRs.
(F) Fraction of CHH hypermethylation DMRs nonoverlapping with CHG hypermethylation DMRs that overlap with genes and TEs.
(legend continued on next page)
358 Cell 152, 352–364, January 17, 2013 ª2013 Elsevier Inc.
where DNAmethylation was largely affected in non-CG contexts
(Figure S2N), DNA methylation was lost in all three cytosine
contexts in rdr1 and rdr6 (Figures S4E and S4F). One character-
istic of these sites was that they were more likely to be associ-
ated with genes compared to DRM1/2 sites (Figure 4C). Another
characteristic of these sites was that 21 and 22 nt siRNA levels in
wild-type, measured by small RNA sequencing (Lee et al., 2012),
were somewhat enriched compared to levels of 24 nt siRNAs
(Figure S4G). Hence, RDR1 and RDR6 may be involved in DNA
methylation independent of the DRM1/2 pathway.
Ectopic Gain of CHG MethylationGain of DNA methylation has been reported in several mutants,
including DNA and histone demethylases as well as DNA meth-
yltransferases. In the DNA demethylase mutant, ros1 dml2 dml3
(rdd), we found that hypermethylation occurred in all three cyto-
sine contexts; however, ros3, which has been suggested to act
in the same genetic pathway, showed only very limited hyperme-
thylation (Figure S5A). In contrast, other tested mutants ex-
hibited hypermethylation mostly in CHG contexts and to a lesser
extent in the CHH contexts (Figures 5A–5C; Figure S5B). Hence,
ectopic hypermethylation in these mutants occurs through
a different mechanism (Figure S5C). Importantly, CHG hyperme-
thylated sites in met1 were not necessarily hypermethylated in
vim1/2/3 (Figure S5D) and vice versa, suggesting that the hyper-
methylation phenotype may not be explained directly by loss of
CG methylation. This is in contrast to CHG hypomethylation,
where met1 and vim1/2/3 caused loss of CHG methylation at
very similar sites (Figure S1B). One interpretation for this result
may be that CHG hypermethylation occurs stochastically (Ma-
thieu et al., 2007), whereas CHG hypomethylation is a direct
consequence of loss of CG methylation. It is worth noting that
met1 +/+ and met1 +/� progeny from met1 +/� showed limited
CHG hypermethylation and this did not occur at sites that lost
CG methylation (Figure S5E). Collectively, our results suggest
that CHG hypermethylation in met1 is not likely a phenomenon
that compensates for the loss of CG methylation as previously
proposed (Cokus et al., 2008; Lister et al., 2008). In met1 cmt3,
the CHG hypermethylation is eliminated, indicating that the
CHG hypermethylation phenotype in met1 is dependent on
CMT3 (Figure 5A).
CHG hypermethylation in ddm1 occurred at distinct sites
compared to met1 (Figure S5F). CHG hypermethylation in
met1 and vim1/2/3 predominantly occurred in normally unme-
thylated regions (Figure 5A; Figure S5B); however, CHG hyper-
methylation in ddm1 occurred predominantly at regions only
CGmethylated (Figure 5B). This suggests that CHGhypermethy-
lation in ddm1 is not likely due to loss of CG methylation and
likely occurs through a different mechanism. Because ddm1
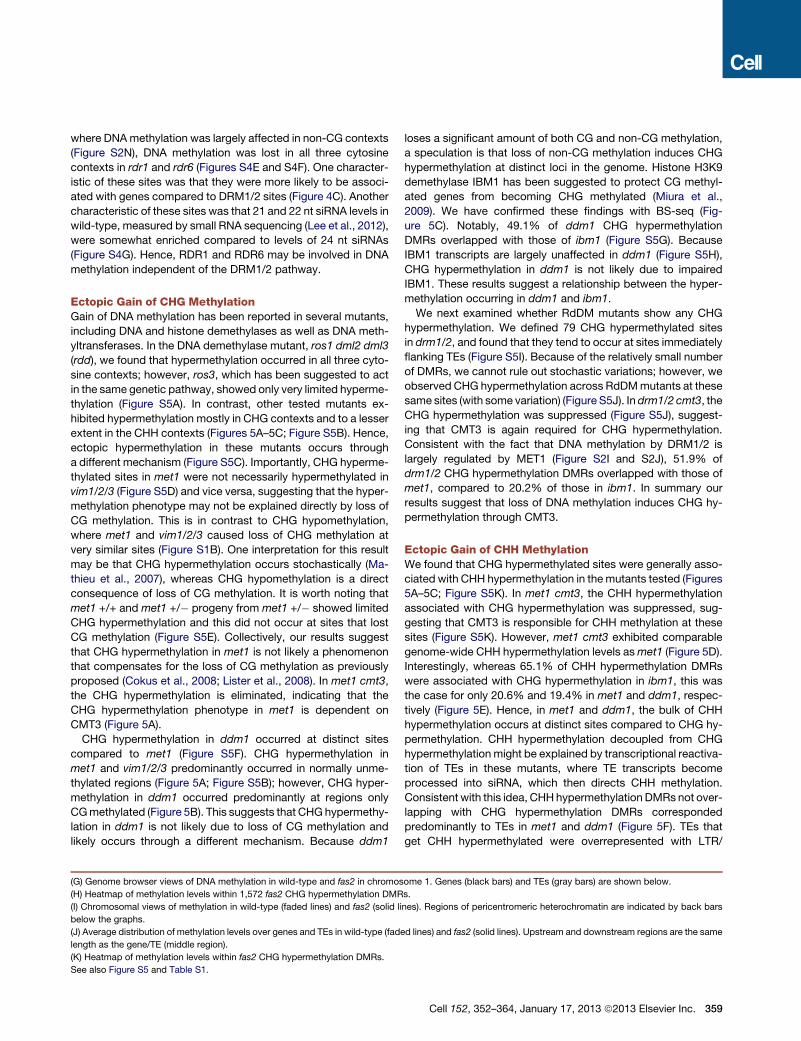
(G) Genome browser views of DNA methylation in wild-type and fas2 in chromos
(H) Heatmap of methylation levels within 1,572 fas2 CHG hypermethylation DMR
(I) Chromosomal views of methylation in wild-type (faded lines) and fas2 (solid li
below the graphs.
(J) Average distribution of methylation levels over genes and TEs in wild-type (fade
length as the gene/TE (middle region).
(K) Heatmap of methylation levels within fas2 CHG hypermethylation DMRs.
See also Figure S5 and Table S1.
loses a significant amount of both CG and non-CG methylation,
a speculation is that loss of non-CG methylation induces CHG
hypermethylation at distinct loci in the genome. Histone H3K9
demethylase IBM1 has been suggested to protect CG methyl-
ated genes from becoming CHG methylated (Miura et al.,
2009). We have confirmed these findings with BS-seq (Fig-
ure 5C). Notably, 49.1% of ddm1 CHG hypermethylation
DMRs overlapped with those of ibm1 (Figure S5G). Because
IBM1 transcripts are largely unaffected in ddm1 (Figure S5H),
CHG hypermethylation in ddm1 is not likely due to impaired
IBM1. These results suggest a relationship between the hyper-
methylation occurring in ddm1 and ibm1.
We next examined whether RdDM mutants show any CHG
hypermethylation. We defined 79 CHG hypermethylated sites
in drm1/2, and found that they tend to occur at sites immediately
flanking TEs (Figure S5I). Because of the relatively small number
of DMRs, we cannot rule out stochastic variations; however, we
observed CHG hypermethylation across RdDMmutants at these
same sites (with some variation) (Figure S5J). In drm1/2 cmt3, the
CHG hypermethylation was suppressed (Figure S5J), suggest-
ing that CMT3 is again required for CHG hypermethylation.
Consistent with the fact that DNA methylation by DRM1/2 is
largely regulated by MET1 (Figure S2I and S2J), 51.9% of
drm1/2 CHG hypermethylation DMRs overlapped with those of
met1, compared to 20.2% of those in ibm1. In summary our
results suggest that loss of DNA methylation induces CHG hy-
permethylation through CMT3.
Ectopic Gain of CHH MethylationWe found that CHG hypermethylated sites were generally asso-
ciated with CHH hypermethylation in themutants tested (Figures
5A–5C; Figure S5K). In met1 cmt3, the CHH hypermethylation
associated with CHG hypermethylation was suppressed, sug-
gesting that CMT3 is responsible for CHH methylation at these
sites (Figure S5K). However, met1 cmt3 exhibited comparable
genome-wide CHH hypermethylation levels asmet1 (Figure 5D).
Interestingly, whereas 65.1% of CHH hypermethylation DMRs
were associated with CHG hypermethylation in ibm1, this was
the case for only 20.6% and 19.4% in met1 and ddm1, respec-
tively (Figure 5E). Hence, in met1 and ddm1, the bulk of CHH
hypermethylation occurs at distinct sites compared to CHG hy-
permethylation. CHH hypermethylation decoupled from CHG
hypermethylation might be explained by transcriptional reactiva-
tion of TEs in these mutants, where TE transcripts become
processed into siRNA, which then directs CHH methylation.
Consistent with this idea, CHHhypermethylation DMRs not over-
lapping with CHG hypermethylation DMRs corresponded
predominantly to TEs in met1 and ddm1 (Figure 5F). TEs that
get CHH hypermethylated were overrepresented with LTR/
ome 1. Genes (black bars) and TEs (gray bars) are shown below.
s.
nes). Regions of pericentromeric heterochromatin are indicated by back bars
d lines) and fas2 (solid lines). Upstream and downstream regions are the same
Cell 152, 352–364, January 17, 2013 ª2013 Elsevier Inc. 359
nrp
b2 C
HG
hyp
o D
MR
nrp
b2 C
HG
hyp
o D
MR
WT nrpb2 WT nrpb2 WT nrpb2
CG CHG CHH
WT nrpb2 nrpd1 nrpe1 drm1/2 cmt3
4060 4062 10145 28515 18648 23238 (kb)
WT nrpb2 1
0 -1 1 0
-1 1 0
-1 1 0
-1 1 0
-1 1 0
-1
CG
CHG
CHH
Fraction of CHG hypo DMR overlapping with TEs
0.9
0
0.2
0 Fr
acti
on
ove
rlap
Fr
acti
on
ove
rlap
CHG
A B
C D
0
1
CH
G M
ethylatio
n
levels 0
1
Meth
ylation
levels
met
1 cm
t3
met
1 cm
t3
kyp
suvh
5/6
drm
1/2
drm
1/2
cmt3
dd
m1
nrpb2
Fraction of CHG hypo DMR overlapping with genes
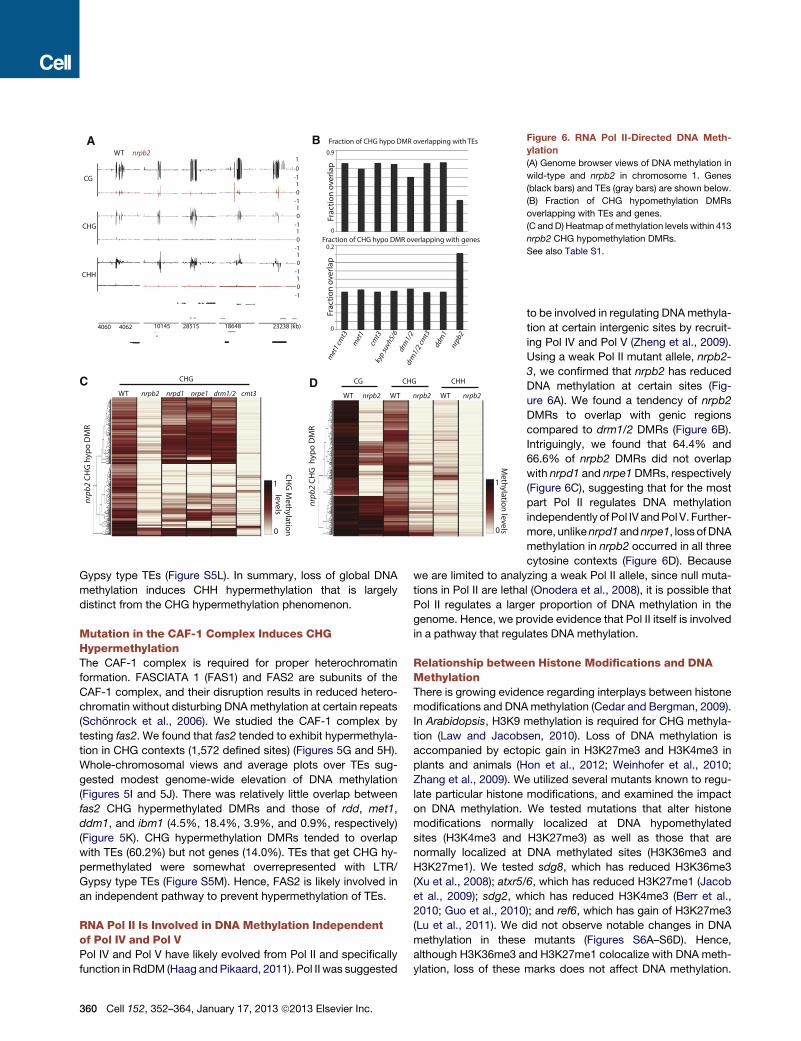
Figure 6. RNA Pol II-Directed DNA Meth-
ylation
(A) Genome browser views of DNA methylation in
wild-type and nrpb2 in chromosome 1. Genes
(black bars) and TEs (gray bars) are shown below.
(B) Fraction of CHG hypomethylation DMRs
overlapping with TEs and genes.
(C and D) Heatmap ofmethylation levels within 413
nrpb2 CHG hypomethylation DMRs.
See also Table S1.
Gypsy type TEs (Figure S5L). In summary, loss of global DNA
methylation induces CHH hypermethylation that is largely
distinct from the CHG hypermethylation phenomenon.
Mutation in the CAF-1 Complex Induces CHGHypermethylationThe CAF-1 complex is required for proper heterochromatin
formation. FASCIATA 1 (FAS1) and FAS2 are subunits of the
CAF-1 complex, and their disruption results in reduced hetero-
chromatin without disturbing DNAmethylation at certain repeats
(Schonrock et al., 2006). We studied the CAF-1 complex by
testing fas2. We found that fas2 tended to exhibit hypermethyla-
tion in CHG contexts (1,572 defined sites) (Figures 5G and 5H).
Whole-chromosomal views and average plots over TEs sug-
gested modest genome-wide elevation of DNA methylation
(Figures 5I and 5J). There was relatively little overlap between
fas2 CHG hypermethylated DMRs and those of rdd, met1,
ddm1, and ibm1 (4.5%, 18.4%, 3.9%, and 0.9%, respectively)
(Figure 5K). CHG hypermethylation DMRs tended to overlap
with TEs (60.2%) but not genes (14.0%). TEs that get CHG hy-
permethylated were somewhat overrepresented with LTR/
Gypsy type TEs (Figure S5M). Hence, FAS2 is likely involved in
an independent pathway to prevent hypermethylation of TEs.
RNA Pol II Is Involved in DNA Methylation Independentof Pol IV and Pol VPol IV and Pol V have likely evolved from Pol II and specifically
function in RdDM (Haag andPikaard, 2011). Pol II was suggested
360 Cell 152, 352–364, January 17, 2013 ª2013 Elsevier Inc.
to be involved in regulating DNAmethyla-
tion at certain intergenic sites by recruit-
ing Pol IV and Pol V (Zheng et al., 2009).
Using a weak Pol II mutant allele, nrpb2-
3, we confirmed that nrpb2 has reduced
DNA methylation at certain sites (Fig-
ure 6A). We found a tendency of nrpb2
DMRs to overlap with genic regions
compared to drm1/2 DMRs (Figure 6B).
Intriguingly, we found that 64.4% and
66.6% of nrpb2 DMRs did not overlap
with nrpd1 and nrpe1 DMRs, respectively
(Figure 6C), suggesting that for the most
part Pol II regulates DNA methylation
independently of Pol IV andPol V. Further-
more, unlikenrpd1andnrpe1, loss ofDNA
methylation in nrpb2 occurred in all three
cytosine contexts (Figure 6D). Because
we are limited to analyzing a weak Pol II allele, since null muta-
tions in Pol II are lethal (Onodera et al., 2008), it is possible that
Pol II regulates a larger proportion of DNA methylation in the
genome. Hence, we provide evidence that Pol II itself is involved
in a pathway that regulates DNA methylation.
Relationship between Histone Modifications and DNAMethylationThere is growing evidence regarding interplays between histone
modifications and DNAmethylation (Cedar and Bergman, 2009).
In Arabidopsis, H3K9 methylation is required for CHG methyla-
tion (Law and Jacobsen, 2010). Loss of DNA methylation is
accompanied by ectopic gain in H3K27me3 and H3K4me3 in
plants and animals (Hon et al., 2012; Weinhofer et al., 2010;
Zhang et al., 2009). We utilized several mutants known to regu-
late particular histone modifications, and examined the impact
on DNA methylation. We tested mutations that alter histone
modifications normally localized at DNA hypomethylated
sites (H3K4me3 and H3K27me3) as well as those that are
normally localized at DNA methylated sites (H3K36me3 and
H3K27me1). We tested sdg8, which has reduced H3K36me3
(Xu et al., 2008); atxr5/6, which has reduced H3K27me1 (Jacob
et al., 2009); sdg2, which has reduced H3K4me3 (Berr et al.,
2010; Guo et al., 2010); and ref6, which has gain of H3K27me3
(Lu et al., 2011). We did not observe notable changes in DNA
methylation in these mutants (Figures S6A–S6D). Hence,
although H3K36me3 and H3K27me1 colocalize with DNA meth-
ylation, loss of these marks does not affect DNA methylation.
A
E F G
H
I J
B
DC
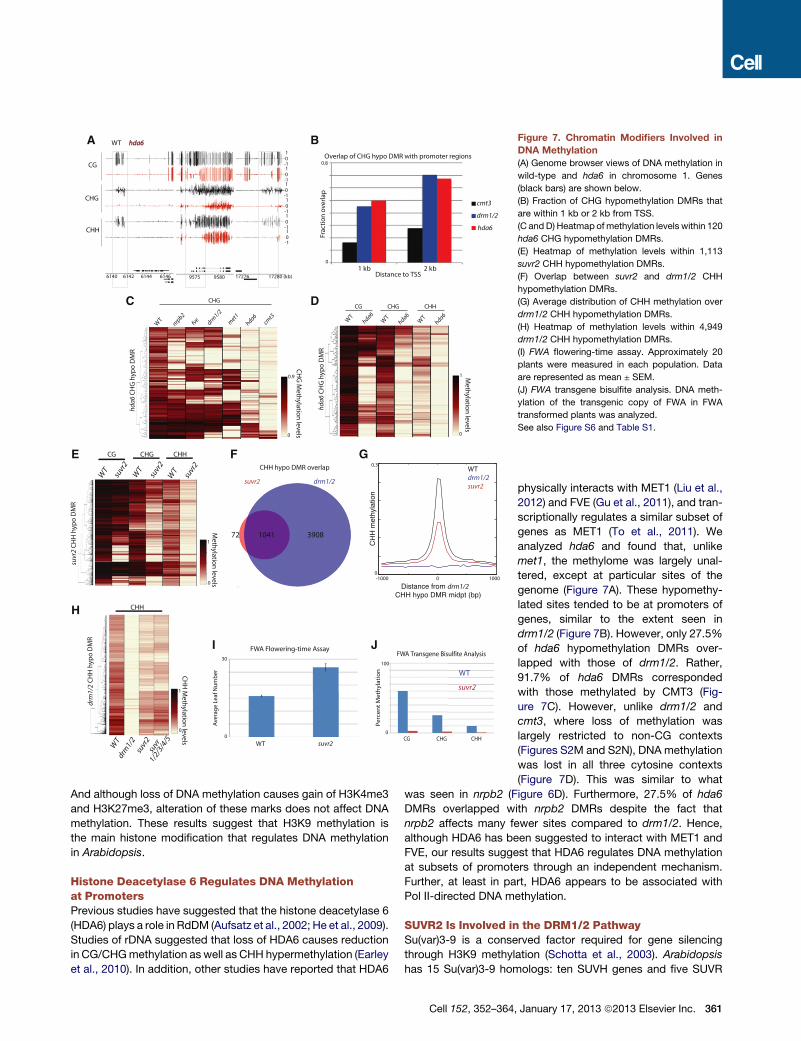
Figure 7. Chromatin Modifiers Involved in
DNA Methylation
(A) Genome browser views of DNA methylation in
wild-type and hda6 in chromosome 1. Genes
(black bars) are shown below.
(B) Fraction of CHG hypomethylation DMRs that
are within 1 kb or 2 kb from TSS.
(C and D) Heatmap of methylation levels within 120
hda6 CHG hypomethylation DMRs.
(E) Heatmap of methylation levels within 1,113
suvr2 CHH hypomethylation DMRs.
(F) Overlap between suvr2 and drm1/2 CHH
hypomethylation DMRs.
(G) Average distribution of CHH methylation over
drm1/2 CHH hypomethylation DMRs.
(H) Heatmap of methylation levels within 4,949
drm1/2 CHH hypomethylation DMRs.
(I) FWA flowering-time assay. Approximately 20
plants were measured in each population. Data
are represented as mean ± SEM.
(J) FWA transgene bisulfite analysis. DNA meth-
ylation of the transgenic copy of FWA in FWA
transformed plants was analyzed.
See also Figure S6 and Table S1.
And although loss of DNA methylation causes gain of H3K4me3
and H3K27me3, alteration of these marks does not affect DNA
methylation. These results suggest that H3K9 methylation is
the main histone modification that regulates DNA methylation
in Arabidopsis.
Histone Deacetylase 6 Regulates DNA Methylationat PromotersPrevious studies have suggested that the histone deacetylase 6
(HDA6) plays a role in RdDM (Aufsatz et al., 2002; He et al., 2009).
Studies of rDNA suggested that loss of HDA6 causes reduction
in CG/CHGmethylation as well as CHH hypermethylation (Earley
et al., 2010). In addition, other studies have reported that HDA6
Cell 152, 352–364
physically interacts with MET1 (Liu et al.,
2012) and FVE (Gu et al., 2011), and tran-
scriptionally regulates a similar subset of
genes as MET1 (To et al., 2011). We
analyzed hda6 and found that, unlike
met1, the methylome was largely unal-
tered, except at particular sites of the
genome (Figure 7A). These hypomethy-
lated sites tended to be at promoters of
genes, similar to the extent seen in
drm1/2 (Figure 7B). However, only 27.5%
of hda6 hypomethylation DMRs over-
lapped with those of drm1/2. Rather,
91.7% of hda6 DMRs corresponded
with those methylated by CMT3 (Fig-
ure 7C). However, unlike drm1/2 and
cmt3, where loss of methylation was
largely restricted to non-CG contexts
(Figures S2M and S2N), DNA methylation
was lost in all three cytosine contexts
(Figure 7D). This was similar to what
was seen in nrpb2 (Figure 6D). Furthermore, 27.5% of hda6
DMRs overlapped with nrpb2 DMRs despite the fact that
nrpb2 affects many fewer sites compared to drm1/2. Hence,
although HDA6 has been suggested to interact with MET1 and
FVE, our results suggest that HDA6 regulates DNA methylation
at subsets of promoters through an independent mechanism.
Further, at least in part, HDA6 appears to be associated with
Pol II-directed DNA methylation.
SUVR2 Is Involved in the DRM1/2 PathwaySu(var)3-9 is a conserved factor required for gene silencing
through H3K9 methylation (Schotta et al., 2003). Arabidopsis
has 15 Su(var)3-9 homologs: ten SUVH genes and five SUVR
, January 17, 2013 ª2013 Elsevier Inc. 361
genes (Baumbusch et al., 2001; Pontvianne et al., 2010). We per-
formed BS-seq on each mutant except for suvr4 (due to lack of
a knockout allele in a Col background). Interestingly, we found
large losses of methylation in the suvr2 mutant, especially at
CHH sites. We found 1,113 sites that CHH hypomethylated in
suvr2, which, as in drm1/2 (Figure S2N), were often associated
with loss of CHG and to a small extent loss in CG (Figure 7E).
A total of 1,041 (93.5%) of suvr2 CHH DMRs overlapped with
those in drm1/2 (Figure 7F). Comparison of methylation levels
between suvr2 and drm1/2 suggested that suvr2 is a weak
RdDM mutant (Figure 7G), with suvr2 falling into the ‘‘weakly
reduced’’ (Figure 4A) class of RdDM mutants (data not shown).
We also tested methylation levels in a suvr1/2/3/4/5 quintuple
mutant (into which a Nossen ecotype allele of suvr4 had been in-
trogressed) and did not observe additional methylation loss
compared with suvr2 alone (Figure 7H), ruling out functional
redundancies with other SUVR genes. Methylation analysis by
Southern blot at the known RdDM target,MEDEA-INTERGENIC
SUBTELOMERIC REPEATS (MEA-ISR), supported observations
seen at the genome-wide level (Figure S6E).
In addition to their role in DNA methylation maintenance,
RdDM pathway components also carry out DNA methylation
establishment—or de novo methylation (Cao and Jacobsen,
2002b;Chan et al., 2004;Greenberg et al., 2011). Given its poten-
tial role as an effector of RdDM, we wanted to test whether
SUVR2 also is required for de novomethylation. In order to do so,
we utilized the FLOWERING WAGINENGEN (FWA) transgenic
system. In the vegetative tissue of wild-type plants, FWA expres-
sion is repressed in a DNA methylation-dependent manner at
tandem repeats in its 50 UTR (Soppe et al., 2002). When FWA
transgenes are introduced into wild-type plants, the repeats are
targeted for de novo DNA methylation and silenced. However,
in RdDM mutants, the transgene fails to be methylated, causing
ectopic expression that leads to a late-flowering phenotype (Au-
sin et al., 2009; Chan et al., 2004; Greenberg et al., 2011). When
we transformed suvr2with the FWA transgene, themutant plants
flowered significantly later than wild-type controls (Figure 7I).
Consistently, bisulfite analysis of the FWA transgene showed
that DNA methylation was virtually absent in all three cytosine
contexts (Figure 7J). Taken together, these results strongly indi-
cate that SUVR2 is a canonical RdDM factor that is required for
both DRM2 establishment and maintenance methylation.
In order to further place SUVR2 in the RdDM pathway, we per-
formed small RNA northern blots (Figure S6F). RdDM proteins
that act downstream of 24 nt siRNA biogenesis—such as
NRPE1—only affect siRNA accumulation at a subset of targets,
known as type I loci, but not type II loci (Zheng et al., 2009). We
found that suvr2 behaved similarly to nrpe1, indicating that
SUVR2 is not required for generation of siRNAs. Consistent
with the methylation analysis, higher-order suvr mutants did
not impact siRNA levels any more than suvr2 alone. In summary,
our results indicate that SUVR2 is a new regulator of the DRM2
pathway that acts downstream of siRNA biogenesis.
CONCLUSION
In summary, by generating single-nucleotide resolution maps of
the Arabidopsis methylome for a comprehensive list of mutants,
362 Cell 152, 352–364, January 17, 2013 ª2013 Elsevier Inc.
we found interplays between different pathways and found addi-
tional regulators of DNA methylation. All DNA methylation data
generated in this study can be viewed at our genome browser
along with various epigenomic data. These genome-wide data
sets and tools should serve as a community resource for further
understanding DNA methylation patterning in Arabidopsis.
EXPERIMENTAL PROCEDURES
Detailed experimental and analysis methods can be found in the Extended
Experimental Procedures.
Plant Material
All mutant lines used in this study were in the Columbia background. Excep-
tions are the ros1 dml2 dml3 line where each allele was introgressed into
Col (Penterman et al., 2007), and suvr1/2/3/4/5, where suvr4 allele was in Nos-
sen. First generation homozygous plants of met1, 2nd generation plants of
ibm1 and vim1/2/3, and 7th generation ddm1 plants were used. Plants were
grown under continuous light, and three-week-old leaves were used for all
experiments.
Whole-Genome Bisulfite Sequencing
A total of 0.5�1 mg of genomic DNA was used to generate BS-seq libraries.
Libraries were generated with premethylated adapters as previously
described (Feng et al., 2011). Libraries were single-end sequenced on a HiSeq
2000 generating 50mer reads. Sequenced reads were base-called with the
standard Illumina software. BS-seq reads were mapped to the TAIR10
genomewith BS-seeker (Chen et al., 2010) allowing twomismatches. Identical
reads were collapsed into one read. Methylation levels were calculated by the
ratio of #C/(#C+#T). DMRs for each mutant were defined by comparing their
methylation levels in each cytosine contexts with those of three independent
wild-type data.
RNA Sequencing
Libraries were generated and sequenced following manufacturer instructions
(Illumina).
Histone Modification Data
Previously published histone ChIP data (Bernatavichute et al., 2008; Roudier
et al., 2011; Zhang et al., 2009) were used for analyses. Nucleosome posi-
tioning data were mapped by Micrococcal nuclease sequencing.
Southern Blot, FWA Transgene Assay, and Small RNA Northern Blot
Southern blot, FWA transgene assay, and small RNA northern blot were per-
formed as previously described (Greenberg et al., 2011).
ACCESSION NUMBER
The GEO accession numbers for the bisulfite sequencing data reported in this
paper are GSE39901 and GSE38286.
SUPPLEMENTAL INFORMATION
Supplemental Information includes Extended Experimental Procedures, six
figures, and one table and can be found with this article online at http://dx.
doi.org/10.1016/j.cell.2012.10.054.
ACKNOWLEDGMENTS
We thank M. Akhavan for Illumina sequencing; S. Cokus, W. Yan, and M. Pel-
legrini for help with the UCSC browser; X. Zhang for MNase protocols; and H.
Vaucheret, X. Chen, C. Dean, M. Matzke, R. Amasino, X. Zhong, and L. John-
son for seeds. Sequencing was performed at the UCLA BSCRC Bio-
Sequencing Core Facility. This work was supported by NIH grant GM60398
and NSF grants 0701745 and 1121245. H.S. was supported by a Fred Eiserling
and Judith Lengyel Graduate Doctorate Fellowship. M.V.C.G. was supported
by US Public Health Service National Research Service Award GM07104 and
a UCLA Dissertation Year Fellowship. S.F. is a Special Fellow of the Leukemia
and Lymphoma Society. S.E.J. is an investigator of the Howard Hughes
Medical Institute.
Received: July 22, 2012
Revised: September 5, 2012
Accepted: October 26, 2012
Published: January 10, 2013
REFERENCES
Aufsatz, W., Mette, M.F., van der Winden, J., Matzke, M., and Matzke, A.J.
(2002). HDA6, a putative histone deacetylase needed to enhance DNA meth-
ylation induced by double-stranded RNA. EMBO J. 21, 6832–6841.
Ausin, I., Mockler, T.C., Chory, J., and Jacobsen, S.E. (2009). IDN1 and IDN2
are required for de novo DNA methylation in Arabidopsis thaliana. Nat. Struct.
Mol. Biol. 16, 1325–1327.
Baumbusch, L.O., Thorstensen, T., Krauss, V., Fischer, A., Naumann, K.,
Assalkhou, R., Schulz, I., Reuter, G., and Aalen, R.B. (2001). The Arabidopsis
thaliana genome contains at least 29 active genes encoding SET domain
proteins that can be assigned to four evolutionarily conserved classes. Nucleic
Acids Res. 29, 4319–4333.
Baurle, I., Smith, L., Baulcombe, D.C., and Dean, C. (2007). Widespread role
for the flowering-time regulators FCA and FPA in RNA-mediated chromatin
silencing. Science 318, 109–112.
Bernatavichute, Y.V., Zhang, X., Cokus, S., Pellegrini, M., and Jacobsen, S.E.
(2008). Genome-wide association of histone H3 lysine nine methylation with
CHG DNA methylation in Arabidopsis thaliana. PLoS ONE 3, e3156.
Berr, A., McCallum, E.J., Menard, R., Meyer, D., Fuchs, J., Dong, A., and Shen,
W.H. (2010). Arabidopsis SET DOMAIN GROUP2 is required for H3K4 trime-
thylation and is crucial for both sporophyte and gametophyte development.
Plant Cell 22, 3232–3248.
Cao, X., and Jacobsen, S.E. (2002a). Locus-specific control of asymmetric and
CpNpG methylation by the DRM and CMT3 methyltransferase genes. Proc.
Natl. Acad. Sci. USA 99(Suppl 4), 16491–16498.
Cao, X., and Jacobsen, S.E. (2002b). Role of the arabidopsis DRM methyl-
transferases in de novo DNA methylation and gene silencing. Curr. Biol. 12,
1138–1144.
Cedar, H., and Bergman, Y. (2009). Linking DNA methylation and histone
modification: patterns and paradigms. Nat. Rev. Genet. 10, 295–304.
Chan, S.W., Zilberman, D., Xie, Z., Johansen, L.K., Carrington, J.C., and
Jacobsen, S.E. (2004). RNA silencing genes control de novo DNAmethylation.
Science 303, 1336.
Chen, P.Y., Cokus, S.J., and Pellegrini, M. (2010). BS Seeker: precise mapping
for bisulfite sequencing. BMC Bioinformatics 11, 203.
Cokus, S.J., Feng, S., Zhang, X., Chen, Z., Merriman, B., Haudenschild, C.D.,
Pradhan, S., Nelson, S.F., Pellegrini, M., and Jacobsen, S.E. (2008). Shotgun
bisulphite sequencing of the Arabidopsis genome reveals DNA methylation
patterning. Nature 452, 215–219.
Earley, K.W., Pontvianne, F., Wierzbicki, A.T., Blevins, T., Tucker, S., Costa-
Nunes, P., Pontes, O., and Pikaard, C.S. (2010). Mechanisms of HDA6-medi-
ated rRNA gene silencing: suppression of intergenic Pol II transcription and
differential effects on maintenance versus siRNA-directed cytosine methyla-
tion. Genes Dev. 24, 1119–1132.
Ebbs, M.L., and Bender, J. (2006). Locus-specific control of DNA methylation
by the Arabidopsis SUVH5 histone methyltransferase. Plant Cell 18, 1166–
1176.
Feng, S., Cokus, S.J., Zhang, X., Chen, P.Y., Bostick, M., Goll, M.G., Hetzel, J.,
Jain, J., Strauss, S.H., Halpern, M.E., et al. (2010). Conservation and diver-
gence of methylation patterning in plants and animals. Proc. Natl. Acad. Sci.
USA 107, 8689–8694.
Feng, S., Rubbi, L., Jacobsen, S.E., and Pellegrini, M. (2011). Determining DNA
methylation profiles using sequencing. Methods Mol. Biol. 733, 223–238.
Greenberg, M.V., Ausin, I., Chan, S.W., Cokus, S.J., Cuperus, J.T., Feng, S.,
Law, J.A., Chu, C., Pellegrini, M., Carrington, J.C., and Jacobsen, S.E.
(2011). Identification of genes required for de novo DNA methylation in Arabi-
dopsis. Epigenetics 6, 344–354.
Gu, X., Jiang, D., Yang, W., Jacob, Y., Michaels, S.D., and He, Y. (2011). Ara-
bidopsis homologs of retinoblastoma-associated protein 46/48 associate with
a histone deacetylase to act redundantly in chromatin silencing. PLoS Genet.
7, e1002366.
Guo, L., Yu, Y., Law, J.A., and Zhang, X. (2010). SET DOMAIN GROUP2 is the
major histone H3 lysine [corrected] 4 trimethyltransferase in Arabidopsis. Proc.
Natl. Acad. Sci. USA 107, 18557–18562.
Haag, J.R., and Pikaard, C.S. (2011). Multisubunit RNA polymerases IV and V:
purveyors of non-coding RNA for plant gene silencing. Nat. Rev. Mol. Cell Biol.
12, 483–492.
He, X.J., Hsu, Y.F., Pontes, O., Zhu, J., Lu, J., Bressan, R.A., Pikaard, C.,
Wang, C.S., and Zhu, J.K. (2009). NRPD4, a protein related to the RPB4
subunit of RNA polymerase II, is a component of RNA polymerases IV and V
and is required for RNA-directed DNA methylation. Genes Dev. 23, 318–330.
Henderson, I.R., Zhang, X., Lu, C., Johnson, L., Meyers, B.C., Green, P.J., and
Jacobsen, S.E. (2006). Dissecting Arabidopsis thaliana DICER function in
small RNA processing, gene silencing and DNA methylation patterning. Nat.
Genet. 38, 721–725.
Hon, G.C., Hawkins, R.D., Caballero, O.L., Lo, C., Lister, R., Pelizzola, M.,
Valsesia, A., Ye, Z., Kuan, S., Edsall, L.E., et al. (2012). Global DNA hypome-
thylation coupled to repressive chromatin domain formation and gene
silencing in breast cancer. Genome Res. 22, 246–258.
Jackson, J.P., Lindroth, A.M., Cao, X., and Jacobsen, S.E. (2002). Control of
CpNpG DNA methylation by the KRYPTONITE histone H3 methyltransferase.
Nature 416, 556–560.
Jacob, Y., Feng, S., LeBlanc, C.A., Bernatavichute, Y.V., Stroud, H., Cokus, S.,
Johnson, L.M., Pellegrini, M., Jacobsen, S.E., and Michaels, S.D. (2009).
ATXR5 and ATXR6 are H3K27monomethyltransferases required for chromatin
structure and gene silencing. Nat. Struct. Mol. Biol. 16, 763–768.
Jeddeloh, J.A., Stokes, T.L., and Richards, E.J. (1999). Maintenance
of genomic methylation requires a SWI2/SNF2-like protein. Nat. Genet. 22,
94–97.
Kakutani, T., Jeddeloh, J.A., Flowers, S.K., Munakata, K., and Richards, E.J.
(1996). Developmental abnormalities and epimutations associated with DNA
hypomethylation mutations. Proc. Natl. Acad. Sci. USA 93, 12406–12411.
Law, J.A., and Jacobsen, S.E. (2010). Establishing, maintaining and modifying
DNAmethylation patterns in plants and animals. Nat. Rev. Genet. 11, 204–220.
Lee, T.F., Gurazada, S.G., Zhai, J., Li, S., Simon, S.A., Matzke, M.A., Chen, X.,
and Meyers, B.C. (2012). RNA polymerase V-dependent small RNAs in Arabi-
dopsis originate from small, intergenic loci including most SINE repeats.
Epigenetics 7, 781–795.
Lindroth, A.M., Cao, X., Jackson, J.P., Zilberman, D., McCallum, C.M., Henik-
off, S., and Jacobsen, S.E. (2001). Requirement of CHROMOMETHYLASE3 for
maintenance of CpXpG methylation. Science 292, 2077–2080.
Lippman, Z., Gendrel, A.V., Black, M., Vaughn, M.W., Dedhia, N., McCombie,
W.R., Lavine, K., Mittal, V., May, B., Kasschau, K.D., et al. (2004). Role of
transposable elements in heterochromatin and epigenetic control. Nature
430, 471–476.
Lister, R., O’Malley, R.C., Tonti-Filippini, J., Gregory, B.D., Berry, C.C., Millar,
A.H., and Ecker, J.R. (2008). Highly integrated single-base resolution maps of
the epigenome in Arabidopsis. Cell 133, 523–536.
Liu, X., Yu, C.W., Duan, J., Luo, M., Wang, K., Tian, G., Cui, Y., and Wu, K.
(2012). HDA6 directly interacts with DNA methyltransferase MET1 and
maintains transposable element silencing in Arabidopsis. Plant Physiol. 158,
119–129.
Lu, F., Cui, X., Zhang, S., Jenuwein, T., and Cao, X. (2011). Arabidopsis REF6 is
a histone H3 lysine 27 demethylase. Nat. Genet. 43, 715–719.
Cell 152, 352–364, January 17, 2013 ª2013 Elsevier Inc. 363
Mathieu, O., Reinders, J., Caikovski, M., Smathajitt, C., and Paszkowski, J.
(2007). Transgenerational stability of the Arabidopsis epigenome is coordi-
nated by CG methylation. Cell 130, 851–862.
Miura, A., Nakamura, M., Inagaki, S., Kobayashi, A., Saze, H., and Kakutani, T.
(2009). An Arabidopsis jmjC domain protein protects transcribed genes from
DNA methylation at CHG sites. EMBO J. 28, 1078–1086.
Onodera, Y., Nakagawa, K., Haag, J.R., Pikaard, D., Mikami, T., Ream, T., Ito,
Y., and Pikaard, C.S. (2008). Sex-biased lethality or transmission of defective
transcription machinery in Arabidopsis. Genetics 180, 207–218.
Penterman, J., Zilberman, D., Huh, J.H., Ballinger, T., Henikoff, S., and Fischer,
R.L. (2007). DNA demethylation in the Arabidopsis genome. Proc. Natl. Acad.
Sci. USA 104, 6752–6757.
Pontvianne, F., Blevins, T., and Pikaard, C.S. (2010). Arabidopsis Histone
Lysine Methyltransferases. Adv. Bot. Res. 53, 1–22.
Roudier, F., Ahmed, I., Berard, C., Sarazin, A., Mary-Huard, T., Cortijo, S.,
Bouyer, D., Caillieux, E., Duvernois-Berthet, E., Al-Shikhley, L., et al. (2011).
Integrative epigenomic mapping defines four main chromatin states in Arabi-
dopsis. EMBO J. 30, 1928–1938.
Schonrock, N., Exner, V., Probst, A., Gruissem, W., and Hennig, L. (2006).
Functional genomic analysis of CAF-1 mutants in Arabidopsis thaliana. J.
Biol. Chem. 281, 9560–9568.
Schotta, G., Ebert, A., and Reuter, G. (2003). SU(VAR)3-9 is a conserved key
function in heterochromatic gene silencing. Genetica 117, 149–158.
Soppe, W.J., Jasencakova, Z., Houben, A., Kakutani, T., Meister, A., Huang,
M.S., Jacobsen, S.E., Schubert, I., and Fransz, P.F. (2002). DNA methylation
controls histone H3 lysine 9methylation and heterochromatin assembly in Ara-
bidopsis. EMBO J. 21, 6549–6559.
Tariq, M., Saze, H., Probst, A.V., Lichota, J., Habu, Y., and Paszkowski, J.
(2003). Erasure of CpG methylation in Arabidopsis alters patterns of histone
H3 methylation in heterochromatin. Proc. Natl. Acad. Sci. USA 100, 8823–
8827.
Teixeira, F.K., Heredia, F., Sarazin, A., Roudier, F., Boccara, M., Ciaudo, C.,
Cruaud, C., Poulain, J., Berdasco, M., Fraga, M.F., et al. (2009). A role for
RNAi in the selective correction of DNA methylation defects. Science 323,
1600–1604.
To, T.K., Kim, J.M., Matsui, A., Kurihara, Y., Morosawa, T., Ishida, J., Tanaka,
M., Endo, T., Kakutani, T., Toyoda, T., et al. (2011). Arabidopsis HDA6 regu-
364 Cell 152, 352–364, January 17, 2013 ª2013 Elsevier Inc.
lates locus-directed heterochromatin silencing in cooperation with MET1.
PLoS Genet. 7, e1002055.
Tran, R.K., Zilberman, D., de Bustos, C., Ditt, R.F., Henikoff, J.G., Lindroth,
A.M., Delrow, J., Boyle, T., Kwong, S., Bryson, T.D., et al. (2005). Chromatin
and siRNA pathways cooperate to maintain DNA methylation of small trans-
posable elements in Arabidopsis. Genome Biol. 6, R90.
Voinnet, O. (2008). Use, tolerance and avoidance of amplified RNA silencing by
plants. Trends Plant Sci. 13, 317–328.
Vongs, A., Kakutani, T., Martienssen, R.A., and Richards, E.J. (1993). Arabi-
dopsis thaliana DNA methylation mutants. Science 260, 1926–1928.
Weinhofer, I., Hehenberger, E., Roszak, P., Hennig, L., and Kohler, C. (2010).
H3K27me3 profiling of the endosperm implies exclusion of polycomb group
protein targeting by DNA methylation. PLoS Genet. 6, e1001152.
Woo, H.R., Dittmer, T.A., and Richards, E.J. (2008). Three SRA-domain meth-
ylcytosine-binding proteins cooperate tomaintain global CpGmethylation and
epigenetic silencing in Arabidopsis. PLoS Genet. 4, e1000156.
Xu, L., Zhao, Z., Dong, A., Soubigou-Taconnat, L., Renou, J.P., Steinmetz, A.,
and Shen, W.H. (2008). Di- and tri- but not monomethylation on histone H3
lysine 36 marks active transcription of genes involved in flowering time regula-
tion and other processes in Arabidopsis thaliana. Mol. Cell. Biol. 28, 1348–
1360.
Zhang, X., Bernatavichute, Y.V., Cokus, S., Pellegrini, M., and Jacobsen, S.E.
(2009). Genome-wide analysis of mono-, di- and trimethylation of histone H3
lysine 4 in Arabidopsis thaliana. Genome Biol. 10, R62.
Zheng, X., Zhu, J., Kapoor, A., and Zhu, J.K. (2007). Role of Arabidopsis AGO6
in siRNA accumulation, DNA methylation and transcriptional gene silencing.
EMBO J. 26, 1691–1701.
Zheng, B., Wang, Z., Li, S., Yu, B., Liu, J.Y., and Chen, X. (2009). Intergenic
transcription by RNA polymerase II coordinates Pol IV and Pol V in siRNA-
directed transcriptional gene silencing in Arabidopsis. Genes Dev. 23, 2850–
2860.
Zhong, X., Hale, C.J., Law, J.A., Johnson, L.M., Feng, S., Tu, A., and
Jacobsen, S.E. (2012). DDR complex facilitates global association of RNA
polymerase V to promoters and evolutionarily young transposons. Nat. Struct.
Mol. Biol. 19, 870–875.
Supplemental Information
EXTENDED EXPERIMENTAL PROCEDURES
Genome AnnotationsTAIR10 gene and TE models were obtained from The Arabidopsis Information Resource (www.arabidopsis.org), and transcription
factor binding sites were obtained from AGRIS (http://arabidopsis.med.ohio-state.edu).
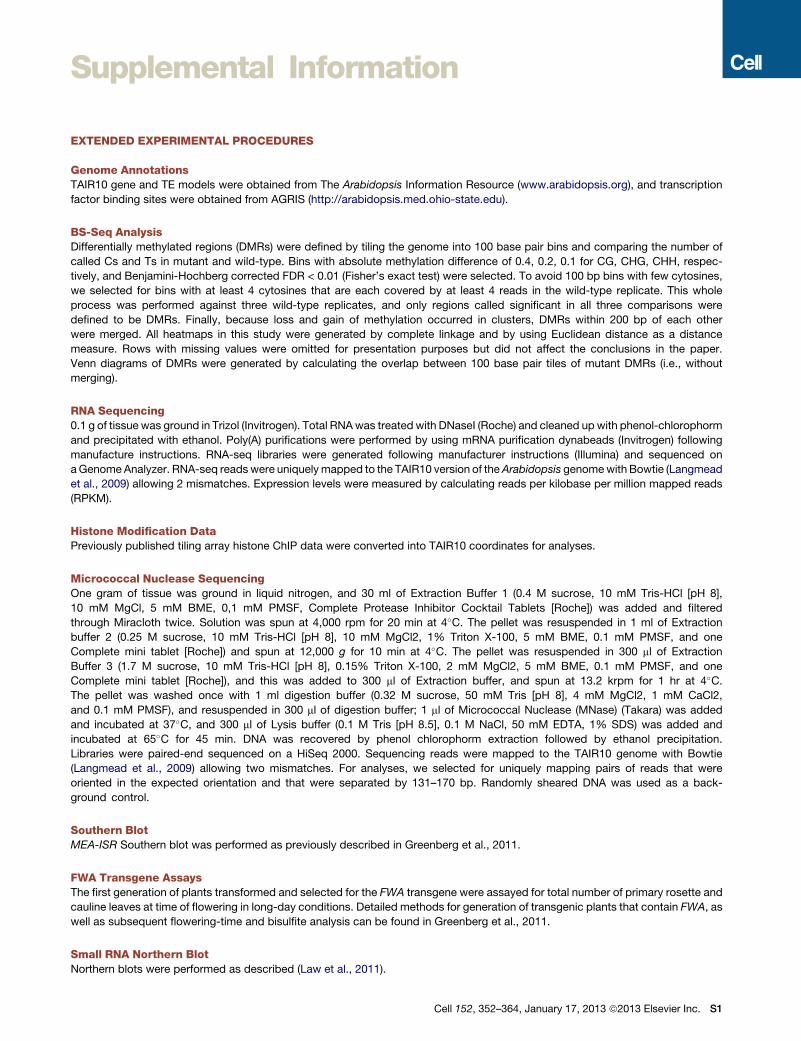
BS-Seq AnalysisDifferentially methylated regions (DMRs) were defined by tiling the genome into 100 base pair bins and comparing the number of
called Cs and Ts in mutant and wild-type. Bins with absolute methylation difference of 0.4, 0.2, 0.1 for CG, CHG, CHH, respec-
tively, and Benjamini-Hochberg corrected FDR < 0.01 (Fisher’s exact test) were selected. To avoid 100 bp bins with few cytosines,
we selected for bins with at least 4 cytosines that are each covered by at least 4 reads in the wild-type replicate. This whole
process was performed against three wild-type replicates, and only regions called significant in all three comparisons were
defined to be DMRs. Finally, because loss and gain of methylation occurred in clusters, DMRs within 200 bp of each other
were merged. All heatmaps in this study were generated by complete linkage and by using Euclidean distance as a distance
measure. Rows with missing values were omitted for presentation purposes but did not affect the conclusions in the paper.
Venn diagrams of DMRs were generated by calculating the overlap between 100 base pair tiles of mutant DMRs (i.e., without
merging).
RNA Sequencing0.1 g of tissue was ground in Trizol (Invitrogen). Total RNAwas treated with DNaseI (Roche) and cleaned up with phenol-chlorophorm
and precipitated with ethanol. Poly(A) purifications were performed by using mRNA purification dynabeads (Invitrogen) following
manufacture instructions. RNA-seq libraries were generated following manufacturer instructions (Illumina) and sequenced on
aGenomeAnalyzer. RNA-seq readswere uniquelymapped to the TAIR10 version of theArabidopsis genomewith Bowtie (Langmead
et al., 2009) allowing 2 mismatches. Expression levels were measured by calculating reads per kilobase per million mapped reads
(RPKM).
Histone Modification DataPreviously published tiling array histone ChIP data were converted into TAIR10 coordinates for analyses.
Micrococcal Nuclease SequencingOne gram of tissue was ground in liquid nitrogen, and 30 ml of Extraction Buffer 1 (0.4 M sucrose, 10 mM Tris-HCl [pH 8],
10 mM MgCl, 5 mM BME, 0,1 mM PMSF, Complete Protease Inhibitor Cocktail Tablets [Roche]) was added and filtered
through Miracloth twice. Solution was spun at 4,000 rpm for 20 min at 4�C. The pellet was resuspended in 1 ml of Extraction
buffer 2 (0.25 M sucrose, 10 mM Tris-HCl [pH 8], 10 mM MgCl2, 1% Triton X-100, 5 mM BME, 0.1 mM PMSF, and one
Complete mini tablet [Roche]) and spun at 12,000 g for 10 min at 4�C. The pellet was resuspended in 300 ml of Extraction
Buffer 3 (1.7 M sucrose, 10 mM Tris-HCl [pH 8], 0.15% Triton X-100, 2 mM MgCl2, 5 mM BME, 0.1 mM PMSF, and one
Complete mini tablet [Roche]), and this was added to 300 ml of Extraction buffer, and spun at 13.2 krpm for 1 hr at 4�C.The pellet was washed once with 1 ml digestion buffer (0.32 M sucrose, 50 mM Tris [pH 8], 4 mM MgCl2, 1 mM CaCl2,
and 0.1 mM PMSF), and resuspended in 300 ml of digestion buffer; 1 ml of Micrococcal Nuclease (MNase) (Takara) was added
and incubated at 37�C, and 300 ml of Lysis buffer (0.1 M Tris [pH 8.5], 0.1 M NaCl, 50 mM EDTA, 1% SDS) was added and
incubated at 65�C for 45 min. DNA was recovered by phenol chlorophorm extraction followed by ethanol precipitation.
Libraries were paired-end sequenced on a HiSeq 2000. Sequencing reads were mapped to the TAIR10 genome with Bowtie
(Langmead et al., 2009) allowing two mismatches. For analyses, we selected for uniquely mapping pairs of reads that were
oriented in the expected orientation and that were separated by 131–170 bp. Randomly sheared DNA was used as a back-
ground control.
Southern BlotMEA-ISR Southern blot was performed as previously described in Greenberg et al., 2011.
FWA Transgene AssaysThe first generation of plants transformed and selected for the FWA transgene were assayed for total number of primary rosette and
cauline leaves at time of flowering in long-day conditions. Detailed methods for generation of transgenic plants that contain FWA, as
well as subsequent flowering-time and bisulfite analysis can be found in Greenberg et al., 2011.
Small RNA Northern BlotNorthern blots were performed as described (Law et al., 2011).
Cell 152, 352–364, January 17, 2013 ª2013 Elsevier Inc. S1

SUPPLEMENTAL REFERENCES
Langmead, B., Trapnell, C., Pop,M., and Salzberg, S.L. (2009). Ultrafast andmemory-efficient alignment of short DNA sequences to the human genome. Genome
Biol. 10, R25.
Law, J.A., Vashisht, A.A., Wohlschlegel, J.A., and Jacobsen, S.E. (2011). SHH1, a homeodomain protein required for DNA methylation, as well as RDR2, RDM4,
and chromatin remodeling factors, associate with RNA polymerase IV. PLoS Genet. 7, e1002195.
Stroud, H., Hale, C.J., Feng, S., Caro, E., Jacob, Y., Michaels, S.D., and Jacobsen, S.E. (2012). DNA methyltransferases are required to induce heterochromatic
re-replication in Arabidopsis. PLoS Genet. 8, e1002808.
S2 Cell 152, 352–364, January 17, 2013 ª2013 Elsevier Inc.
met
1 C
G h
ypo
DM
R
CG CHG CHH CG CHG CHH CG CHG CHH CG CHG CHH CG CHG CHH
Chr 1 Chr 2 Chr 3 Chr 4 Chr 5
1 2 3 4 1 2 3 4 1 2 3 4 1 2 3 4 1 2 3 4 1 2 3 4 1 2 3 4 1 2 3 4 1 2 3 4 1 2 3 4 1 2 3 4 1 2 3 4 1 2 3 4 1 2 3 4 1 2 3 4
vim
1/2/
3 C
G h
ypo
DM
R
CG CHG CHH CG CHG CHH CG CHG CHH CG CHG CHH CG CHG CHH 1 2 3 4 5 1 2 3 4 5 1 2 3 4 5 1 2 3 4 5 1 2 3 4 5 1 2 3 4 5 1 2 3 4 5 1 2 3 4 5 1 2 3 4 5 1 2 3 4 5 1 2 3 4 5 1 2 3 4 5 1 2 3 4 5 1 2 3 4 5 1 2 3 4 5
1. WT 2. met1 3. vim1/2/3 4. ddm1
1. WT 2. vim1 3. vim2 4. vim3 5. vim1/2/3
A
C
B
WT met1 met1 +/-met1 +/- met1 +/+met1 +/+ vim1/2/3 ddm1
Chr 1 Chr 2 Chr 3 Chr 4 Chr 5
0 2000
1
0 100 2000
1
0 100 2000
1
0 100 2000
1
0 100 200 3000
1
0 100 200 3000
0.2
0.4
0.6
0.8
1
0 100 2000
0.2
0.4
0.6
0.8
1
0 100 2000
0.2
0.4
0.6
0.8
1
0 100 2000
0.2
0.4
0.6
0.8
1
0 100 200 3000
0.2
0.4
0.6
0.8
1
1 0
Methylation level
1 0
Methylation level
1
0
0
1
0 30 0 20 0 20 0 20 0 30 (Mb)
CG
met
hyl
atio
n
TE d
ensi
ty
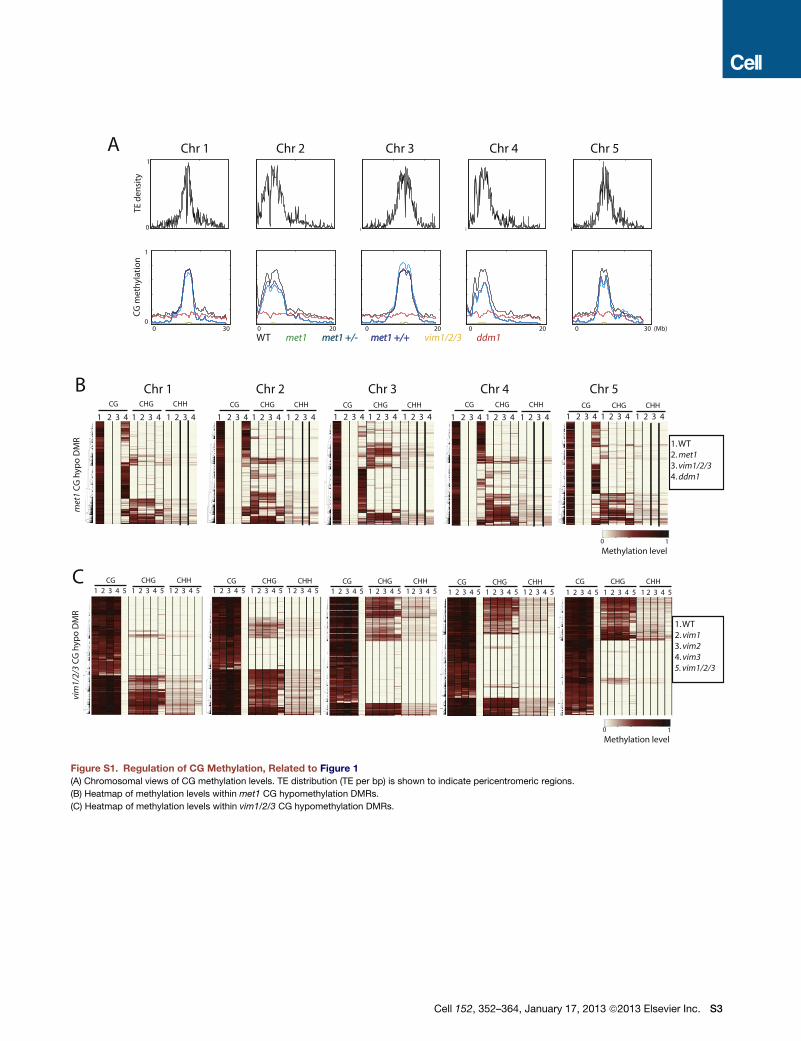
Figure S1. Regulation of CG Methylation, Related to Figure 1(A) Chromosomal views of CG methylation levels. TE distribution (TE per bp) is shown to indicate pericentromeric regions.
(B) Heatmap of methylation levels within met1 CG hypomethylation DMRs.
(C) Heatmap of methylation levels within vim1/2/3 CG hypomethylation DMRs.
Cell 152, 352–364, January 17, 2013 ª2013 Elsevier Inc. S3
cmt3
kyp suvh5/6 drm1/2
CHG hypo DMR CHH hypo DMR
cmt3
kyp suvh5/6 drm1/2
ddc
drm1/2 cmt3
ddc
drm1/2 cmt3
met1 cmt3
met1 cmt3 met1 cmt3
met1 cmt3
met1 kyp suvh5/6 met1 kyp suvh5/6
met1 cmt3 met1 cmt3
met1 drm1/2 met1 drm1/2
3230
1383 1013
56357
945
141
642
78
6027 2 192
1528 23813 5770
2553
1646
1086
58118
0 9 1469
4089
6909 3513
181
13 389 2592
2903
2275
1652 46
14141
44861
19
25357
20501 5177
718
2 546 402
2852 13629 45698
2321 14160 46513
14934 1547 1194
13354 8413 23147
21047 720 5579
17051 4716 2776
WT drm1/2 WT drm1/2 WT drm1/2
CG CHG CHH
drm
1/2 C
HG h
ypo
DMR
drm
1/2 C
HH h
ypo
DMR
ypy
WT cmt3 kyp WT cmt3 kyp WT cmt3 kyp suvh5/6 suvh5/6 suvh5/6
CG CHG CHH
cmt3
CHG
hyp
o DM
R cm
t3 C
HH h
ypo
DMR
A
B
C
D
K L
E F
G H
I J
M N
O
-1000 -800 -600 -400 -200 0 200 400 600 800 10000
0.1
0.2
0.3
0.4
0.5
0.6
0.7
0.8
0.9
WT
Met
hyla
tion
leve
ls
Distance from center of drm1/2 CHH hypo DMR (bp)
CG CG CHG CHG CHH CHH
WT methylation levels over drm1/2 CHH hypo DMR
non-overlapping overlapping
P
kyp
suvh
5/6
CH
H h
ypo
DM
R
WT
dcl2/3
/4
rdr2
kyp s
uvh5/6
CHH methylation
0.8
0
WT
met1
m
et1 +
/- m
et1 +
/+
WT
met1
m
et1 +
/- m
et1 +
/+
WT
met1
m
et1 +
/- m
et1 +
/+
CG CHG CHH
met
1 CHG
hyp
o DM
R m
et1 C
HH h
ypo
DMR
1
0
Q
met1
cmt3
m
et1
cmt3
kyp su
vh5/6
kyp drm
1/2
drm1/2
cmt3
ddm
1
All
TE families overlapping with DMRs
571 659 158
kyp cmt3
TEs overlapping with CHH hypo DMR S
R
CHG
hypo
DM
R CH
H hy
po D
MR
CH
H M
ethylatio
n levels
Meth
ylation
levels
1 0 Methylation levels
0.9
0 -1000 0 1000
Figure S2. Regulation of Non-CG Methylation, Related to Figure 2
(A–L) Overlap of CHG (left) and CHH (right) hypomethylation DMRs between indicated genotypes.
(M) Heatmap of methylation levels within cmt3 CHG and CHH hypomethylation DMRs.
(N) Heatmap of methylation levels within drm1/2 CHG and CHH hypomethylation DMRs.
(O) Heatmap of methylation levels within kyp suvh5/6 CHH hypomethylation DMRs.
(P) Heatmap of methylation levels within met1 CHG and CHH hypomethylation DMRs.
(Q) Average distribution of wild-type methylation levels over drm1/2 CHH hypomethylation DMRs that overlap (solid lines) and do not overlap (faded lines) with
met1 CHH hypomethylation DMRs.
(R) Distribution of TE families overlapping with CHG (top) and CHH (bottom) hypomethylation DMRs.
(S) Overlap between TEs associated with kyp and cmt3 CHH hypomethylation DMRs.
S4 Cell 152, 352–364, January 17, 2013 ª2013 Elsevier Inc.
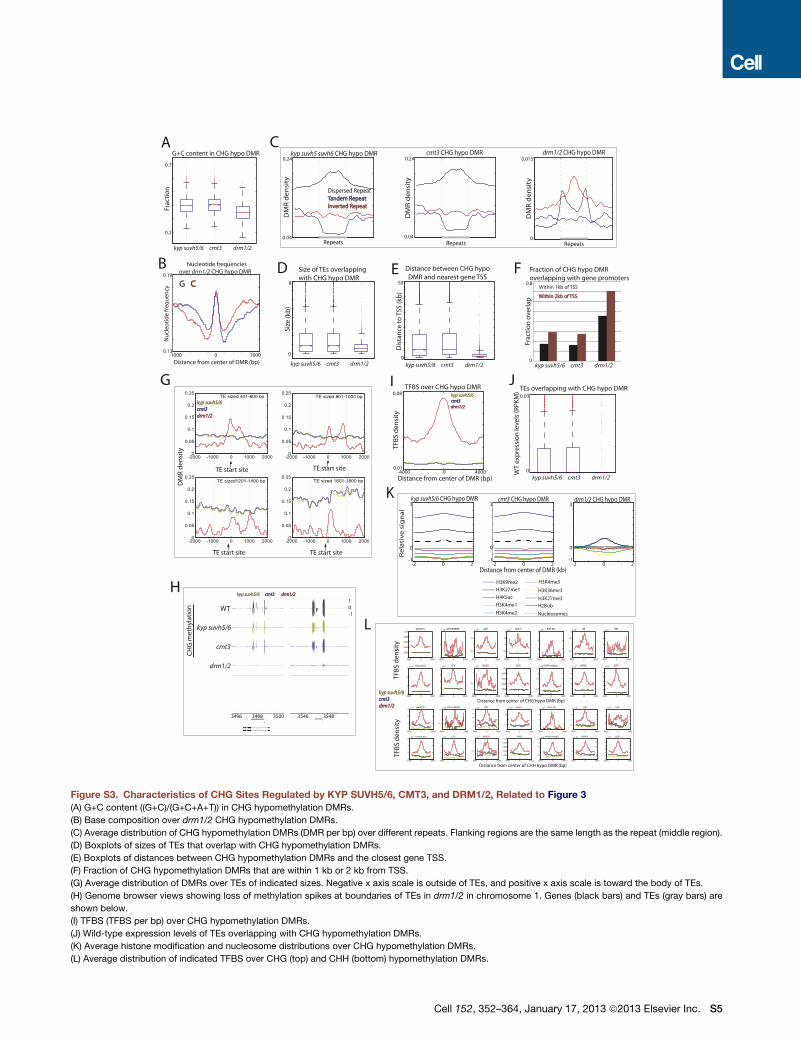
0.2
0.3
0.4
0.5
0.6
0.7C
+G/(A
+T+C
+G)
-4000 -2000 0 2000 40000.01
0.02
0.03
0.04
0.05
0.06
0.07
0.08
0.04
0.08
0.12
0.16
0.2
0.24
0.04
0.08
0.12
0.16
0.2
0.24
0
0.005
0.01
0.015
Distance from center of DMR (bp)
kyp suvh5 suvh6 CHG hypo DMR cmt3 CHG hypo DMR drm1/2 CHG hypo DMR
Repeats Repeats Repeats
Dispersed Repeat Tandem Repeat Tandem Repeat Inverted Repeat Inverted Repeat
kyp suvh5/6 kyp suvh5/6 cmt3 cmt3 drm1/2 drm1/2
G+C content in CHG hypo DMR
0
1
2
3
4
5
6
7
8
Size of TEs overlapping with CHG hypo DMR
0
5
10
15
20
25
30
35
40
45
50
Distance between CHG hypo DMR and nearest gene TSS
Fraction of CHG hypo DMR overlapping with gene promoters
Within 1kb of TSS
Within 2kb of TSS Within 2kb of TSS
0
0.01
0.02
0.030.03
TEs overlapping with CHG hypo DMR
WT
exp
ress
ion
leve
ls (R
PKM
)
kyp suvh5/6 cmt3 drm1/2
kyp suvh5/6 cmt3 drm1/2 kyp suvh5/6 cmt3 drm1/2 kyp suvh5/6 cmt3 drm1/2
kyp suvh5/6 cmt3 drm1/2
kyp suvh5/6 kyp suvh5/6 cmt3 cmt3 drm1/2 drm1/2
WT
kyp suvh5/6
cmt3
drm1/2
CH
G m
eth
ylat
ion
1 0 -1
A C
D E F
H
I J
-5000 0 50000
0.002
0.004
0.006
0.008
0.01ABI3VP1
-5000 0 50000
1
x 10-4 AP2-EREBP
-5000 0 50000
0.5
1
1.5
2x 10⁻³ ARF
-5000 0 50000
0.5
1
1.5
2x 10⁻³ BHLH
-5000 0 50000
2
4
6x 10⁻⁴ E2F-DP
-5000 0 50000
0.5
1
1.5
2x 10⁻³ HB
-5000 0 50000
2
4
6
8x 10⁻⁴ HSF
-5000 0 50000
2
4
6x 10⁻³ Homeobox
-5000 0 50000
1
2
3
4x 10⁻³ LFY
-5000 0 50000
0.5
1
x 10-3 MADS
-5000 0 50000
0.002
0.004
0.006
0.008
0.01MYB
-5000 0 50000
0.5
1
1.5
2
2.5x 10⁻³ MYB-related
-5000 0 50000
1
2
3
4
5x 10⁻³ WRKY
-5000 0 50001
2
3
4
5
6
7x 10⁻³ bZIP
-5000 0 50002
4
6
8x 10⁻³ ABI3VP1
-5000 0 50000
0.5
1
1.5x 10⁻⁴ AP2-EREBP
-5000 0 50004
6
8
10
12
14x 10-4 ARF
-5000 0 50000
0.5
1
1.5
2x 10⁻³ BHLH
-5000 0 50000
2
4
6
8x 10⁻⁴ E2F-DP
-5000 0 50000
0.5
1
1.5
2x 10⁻³ HB
-5000 0 50000
2
4
6x 10⁻⁴ HSF
-5000 0 50000
2
4
6x 10⁻³ Homeobox
-5000 0 50001
2
3
4x 10⁻³ LFY
-5000 0 50000
0.5
1
x 10-3 MADS
-5000 0 50000
0.002
0.004
0.006
0.008
0.01MYB
-5000 0 50000
0.5
1
1.5
2
2.5x 10⁻³ MYB-related
-5000 0 50000
1
2
3
4
5x 10⁻³ WRKY
-5000 0 50001
2
3
4
5
6
7x 10⁻³ bZIP
kyp suvh5/6 kyp suvh5/6 cmt3 cmt3 drm1/2 drm1/2
TFB
S d
ensi
ty
TFB
S d
ensi
ty
L
Distance from center of CHG hypo DMR (bp)
Distance from center of CHH hypo DMR (bp)
0.2
0.7 Fr
acti
on
0.24
0.04
DM
R d
en
sity
0.04
0.24
DM
R d
en
sity
0.015
0
DM
R d
en
sity
0
8 Si
ze (k
b)
0
50
Dis
tan
ce t
o T
SS (k
b)
0
0.8
Frac
tio
n o
verl
ap
TFBS over CHG hypo DMR
0.01
0.08 TF
BS
den
sity
-4000 0 4000
0.03
0
3496 3498 3500 3546 3548
-1000 -800 -600 -400 -200 0 200 400 600 800 10000.13
0.14
0.15
0.16
0.17
0.18
0.19
G C C 0.19
0.13
Nu
cleo
tid
e fr
equ
ency
Distance from center of DMR (bp) -1000 0 1000
Nucleotide frequencies over drm1/2 CHG hypo DMR
B
-2000 -1000 0 1000 2000-1
-0.5
0
0.5
1
1.5
2
2.5
3
-2000 -1000 0 1000 2000-1
-0.5
0
0.5
1
1.5
2
2.5
3
-2000 -1000 0 1000 2000-1
-0.5
0
0.5
1
1.5
2
2.5
3
-2000 -1000 0 1000 20000
0.05
0.1
0.15
0.2
0.25TE sized 401-600 bp
-2000 -1000 0 1000 20000
0.05
0.1
0.15
0.2
0.25TE sized 801-1000 bp
-2000 -1000 0 1000 20000
0.05
0.1
0.15
0.2
0.25TE sized1201-1400 bp
-2000 -1000 0 1000 20000
0.05
0.1
0.15
0.2
0.25TE sized 1601-1800 bp D
MR
den
sity
TE start site TE start site
TE start site TE start site
kyp suvh5/6 kyp suvh5/6 cmt3 cmt3 drm1/2 drm1/2
G
kyp suvh5/6 CHG hypo DMR cmt3 CHG hypo DMR drm1/2 CHG hypo DMR K
Re
lati
ve
sig
na
l
Distance from center of DMR (kb) -2 0 2 -2 0 2 -2 0 2
H3K9me2
H3K27me1
H4K5ac
H3K4me1
H3K4me2
H3K4me3
H3K36me3
H3K27me3
H2Bub
Nucleosomes
3
0
-1 -1
0
3
0
3
-1
Figure S3. Characteristics of CHG Sites Regulated by KYP SUVH5/6, CMT3, and DRM1/2, Related to Figure 3
(A) G+C content ((G+C)/(G+C+A+T)) in CHG hypomethylation DMRs.
(B) Base composition over drm1/2 CHG hypomethylation DMRs.
(C) Average distribution of CHG hypomethylation DMRs (DMR per bp) over different repeats. Flanking regions are the same length as the repeat (middle region).
(D) Boxplots of sizes of TEs that overlap with CHG hypomethylation DMRs.
(E) Boxplots of distances between CHG hypomethylation DMRs and the closest gene TSS.
(F) Fraction of CHG hypomethylation DMRs that are within 1 kb or 2 kb from TSS.
(G) Average distribution of DMRs over TEs of indicated sizes. Negative x axis scale is outside of TEs, and positive x axis scale is toward the body of TEs.
(H) Genome browser views showing loss of methylation spikes at boundaries of TEs in drm1/2 in chromosome 1. Genes (black bars) and TEs (gray bars) are
shown below.
(I) TFBS (TFBS per bp) over CHG hypomethylation DMRs.
(J) Wild-type expression levels of TEs overlapping with CHG hypomethylation DMRs.
(K) Average histone modification and nucleosome distributions over CHG hypomethylation DMRs.
(L) Average distribution of indicated TFBS over CHG (top) and CHH (bottom) hypomethylation DMRs.
Cell 152, 352–364, January 17, 2013 ª2013 Elsevier Inc. S5
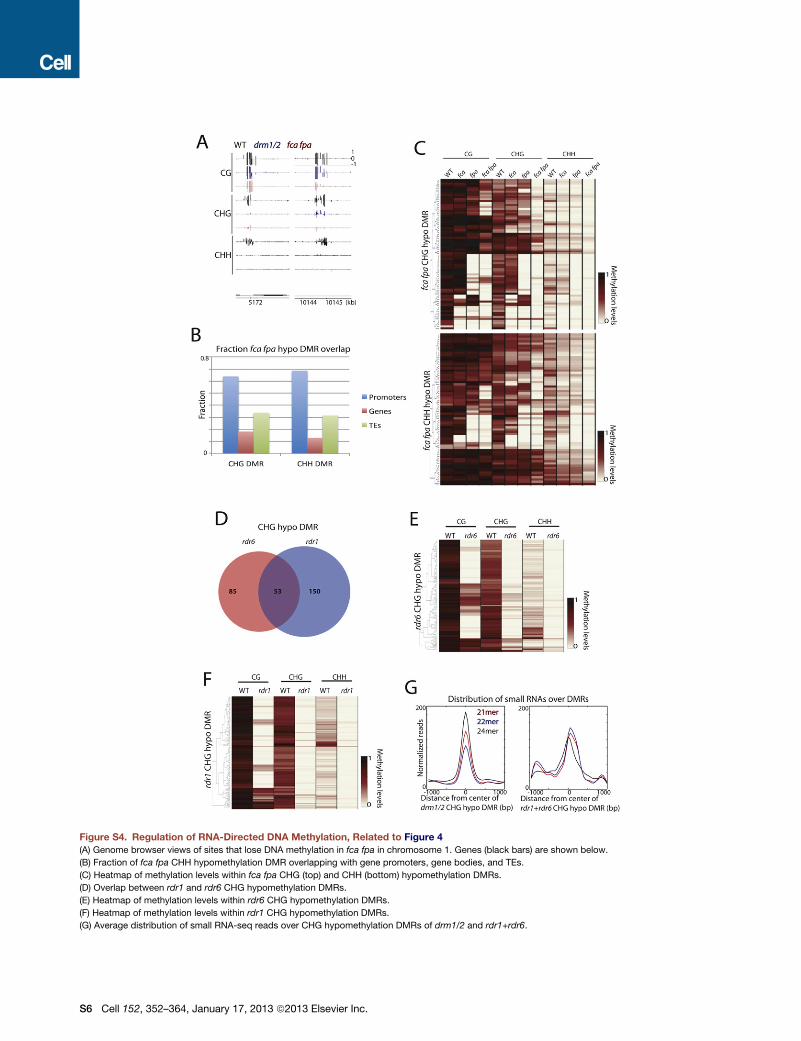
Figure S4. Regulation of RNA-Directed DNA Methylation, Related to Figure 4
(A) Genome browser views of sites that lose DNA methylation in fca fpa in chromosome 1. Genes (black bars) are shown below.
(B) Fraction of fca fpa CHH hypomethylation DMR overlapping with gene promoters, gene bodies, and TEs.
(C) Heatmap of methylation levels within fca fpa CHG (top) and CHH (bottom) hypomethylation DMRs.
(D) Overlap between rdr1 and rdr6 CHG hypomethylation DMRs.
(E) Heatmap of methylation levels within rdr6 CHG hypomethylation DMRs.
(F) Heatmap of methylation levels within rdr1 CHG hypomethylation DMRs.
(G) Average distribution of small RNA-seq reads over CHG hypomethylation DMRs of drm1/2 and rdr1+rdr6.
S6 Cell 152, 352–364, January 17, 2013 ª2013 Elsevier Inc.
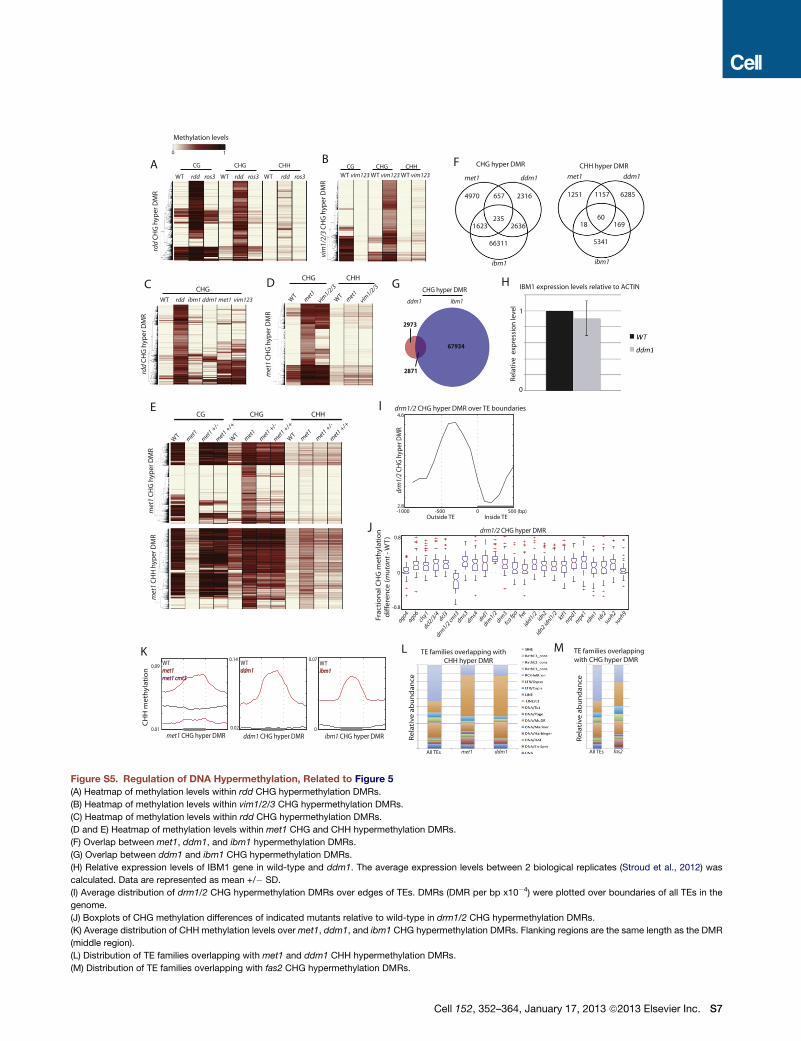
rdd
CH
G h
yper
DM
R
WT rdd ibm1 ddm1 met1 vim123
rdd
CH
G h
yper
DM
R
WT rdd ros3 WT rdd ros3 WT rdd ros3
CG CHG CHH
IBM1 expression levels relative to ACTIN
WT vim123 WT vim123 WT vim123 CG CHG CHH
vim
1/2/
3 C
HG
hyp
er D
MR
CHG
met1 ddm1
ibm1
4970 657 2316
1623 2636 235
66311
met1 ddm1
ibm1
1251 1157 6285
18 169 60
5341
CHG hyper DMR CHH hyper DMR
0 20 40 600.01
0.03
0.05
0.07
0.09
0 20 40 600.02
0.04
0.06
0.08
0.1
0.12
0.14
0 20 40 600
0.01
0.02
0.03
0.04
0.05
0.06
0.07
WT met1 met1 met1 cmt3 met1 cmt3
WT ddm1 ddm1
WT ibm1 ibm1
CH
H m
eth
ylat
ion
0.09
0.01
0.14
0.02
0.07
0 met1 CHG hyper DMR ddm1 CHG hyper DMR ibm1 CHG hyper DMR
met
1 C
HG
hyp
er D
MR
WT
met1
vim
1/2/3
W
T m
et1
vim1/2
/3
CHG CHH
1 0
Methylation levels
67934
2973
2871
ddm1 ibm1
CHG hyper DMR
A
C
B
D G H
K
met
1 C
HG
hyp
er D
MR
met
1 C
HH
hyp
er D
MR
WT
met1
m
et1 +
/- m
et1 +
/+
WT
met1
m
et1 +
/- m
et1 +
/+
WT
met1
m
et1 +
/- m
et1 +
/+
CG CHG CHH E
F
-1000 -500 0 5002.8
3
3.2
3.4
3.6
3.8
4
4.2
4.4
4.6x 10⁻⁴
-1000 -500 0 500 (bp) 2.8
4.6
drm
1/2
CHG
hyp
er D
MR
Outside TE Inside TE
I drm1/2 CHG hyper DMR over TE boundaries
0
1
Rela
tive
exp
ress
ion
leve
l
TE families overlapping with CHH hyper DMR
All TEs met1 ddm1 All TEs fas2
TE families overlapping with CHG hyper DMR
L M
Re
lati
ve a
bu
nd
ance
Re
lati
ve a
bu
nd
ance
-0.8
0
0.8
1 2 3 4 5 6 7 8 9 10 11 12 13 14 15 16 17 18 19 20 21 22 23
0.8
-0.8
0
ago4 ago6 cls
y1 dcl2
/3/4
dcl3
drm1/2
cmt3
dm
s3
dms4
drd
1 drm
1/2
drm3
fca fp
a fv
e id
nl1/2
id
n2
idn2 id
nl1/2
ktf1
nrp
d1 nrp
e1 rd
m1
rdr2
su
vh2 su
vh9
Frac
tio
nal
CH
G m
eth
ylat
ion
d
iffe
ren
ce (
mu
tan
t - W
T)
J drm1/2 CHG hyper DMR
Figure S5. Regulation of DNA Hypermethylation, Related to Figure 5
(A) Heatmap of methylation levels within rdd CHG hypermethylation DMRs.
(B) Heatmap of methylation levels within vim1/2/3 CHG hypermethylation DMRs.
(C) Heatmap of methylation levels within rdd CHG hypermethylation DMRs.
(D and E) Heatmap of methylation levels within met1 CHG and CHH hypermethylation DMRs.
(F) Overlap between met1, ddm1, and ibm1 hypermethylation DMRs.
(G) Overlap between ddm1 and ibm1 CHG hypermethylation DMRs.
(H) Relative expression levels of IBM1 gene in wild-type and ddm1. The average expression levels between 2 biological replicates (Stroud et al., 2012) was
calculated. Data are represented as mean +/� SD.
(I) Average distribution of drm1/2 CHG hypermethylation DMRs over edges of TEs. DMRs (DMR per bp x10�4) were plotted over boundaries of all TEs in the
genome.
(J) Boxplots of CHG methylation differences of indicated mutants relative to wild-type in drm1/2 CHG hypermethylation DMRs.
(K) Average distribution of CHH methylation levels overmet1, ddm1, and ibm1 CHG hypermethylation DMRs. Flanking regions are the same length as the DMR
(middle region).
(L) Distribution of TE families overlapping with met1 and ddm1 CHH hypermethylation DMRs.
(M) Distribution of TE families overlapping with fas2 CHG hypermethylation DMRs.
Cell 152, 352–364, January 17, 2013 ª2013 Elsevier Inc. S7
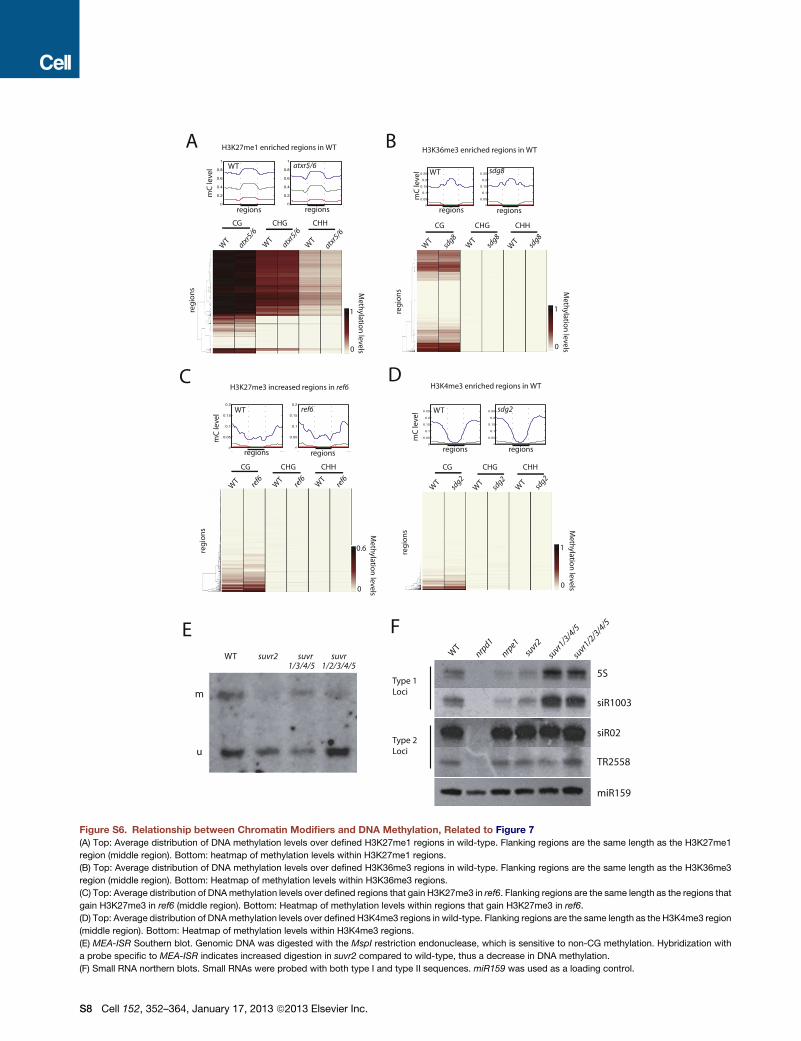
Figure S6. Relationship between Chromatin Modifiers and DNA Methylation, Related to Figure 7
(A) Top: Average distribution of DNA methylation levels over defined H3K27me1 regions in wild-type. Flanking regions are the same length as the H3K27me1
region (middle region). Bottom: heatmap of methylation levels within H3K27me1 regions.
(B) Top: Average distribution of DNA methylation levels over defined H3K36me3 regions in wild-type. Flanking regions are the same length as the H3K36me3
region (middle region). Bottom: Heatmap of methylation levels within H3K36me3 regions.
(C) Top: Average distribution of DNAmethylation levels over defined regions that gain H3K27me3 in ref6. Flanking regions are the same length as the regions that
gain H3K27me3 in ref6 (middle region). Bottom: Heatmap of methylation levels within regions that gain H3K27me3 in ref6.
(D) Top: Average distribution of DNAmethylation levels over defined H3K4me3 regions in wild-type. Flanking regions are the same length as the H3K4me3 region
(middle region). Bottom: Heatmap of methylation levels within H3K4me3 regions.
(E) MEA-ISR Southern blot. Genomic DNA was digested with the MspI restriction endonuclease, which is sensitive to non-CG methylation. Hybridization with
a probe specific to MEA-ISR indicates increased digestion in suvr2 compared to wild-type, thus a decrease in DNA methylation.
(F) Small RNA northern blots. Small RNAs were probed with both type I and type II sequences. miR159 was used as a loading control.
S8 Cell 152, 352–364, January 17, 2013 ª2013 Elsevier Inc.