Embed Size (px)
Citation preview
Journal of Research in Engineering and Applied Sciences
JREAS, Vol. 04, Issue 01, Jan 201920
COMPREHENSIVE ANALYSIS OF VOLTAGE SAG &ITS MITIGATION USING MULTILEVEL
DYNAMIC VOLTAGE RESTORER
Abstract
Voltage sag is the one of the power quality problems in the distribution system & it is characterized by its magnitude, duration & phase angle jump which gets affected by the variations in the distribution system parameters. In the literature various VSI topologies are used to mitigate voltage sag. In this paper the comprehensive analysis of voltage sag has been done & the effect of various power system parameters like length of line, conductor cross-sectional area, fault impedance, source impedance etc. has been observed. Further using H-Bridge VSItopology based Dynamic Voltage Restorer (DVR) is implemented for sag compensationand by increased number of level of cascaded multilevel inverter based DVR the harmonic contribution has been reduced.
Key Words : Power Quality; Voltage sag; Voltage source inverter; Pulse width modulation;Dynamic Voltage Restorer; Sag Detector and Sag corrector
1. Introduction
ower Quality is an issue that is becoming increasingly important to electricity consumers at all levels. Voltage magnitude, waveform, and frequency are the major factors that dictate the quality of a power supply[1]. Use of extensive non-linear power electronic loads is one of the major region of deteriorating the quality of power supply. Faults at either the transmission or distribution level may also cause transient voltage sag or swell in the entire system or a large part of it[2]-[3]. Also, under heavy load condition, a significant voltage drop may occur in the system. Such voltage variation are not desirable for sensitive loads.
Voltage dips are unavoidable brief reductions in the voltage from momentary disturbances on the power system. Voltage sag is characterized according to magnitude and duration. The various parameters on which level of voltage sag depends are fault impedance, source impedance, cross-sectional area of line conductor length of the feeder etc.
Dynamic Voltage Restorer (DVR) also known as SSSC is presently the most cost-effective and through solution to mitigate voltage dips by establishing the proper quality voltage level for utility customers[4]. The basic idea of the DVR is to inject a voltage in series with the supply voltage during voltage dips and compensate for difference between nominal and dipped voltages. It has been shown that the DVR can be operated in such a fashion hat it does not supply or absorb any average real power in the steady state[5]. For the detection of sag a sag detector is used at the time of sag initiation and a sag
1 1 2 2 2S. P. Gawande, B. S. Sudame, R. N. Nagpure, Jawed A. Sheikh and B. Y. Bagde
ISSN (Print) : 2456-6411, ISSN (Online) : 2456-6403
corrector which in accordance with the supply line voltage helps the DVR to inject requisite amount of voltage [6].Usually a voltage source inverter (VSI) realizes a DVR. The output of the VSI is connected in series with a distribution feeder through a series transformer. This device employs IGBT/diode that are operated in pulse width modulated (PWM) fashion.With this, the DVR can regulate the load voltage at any given magnitude and also phase angle[7]-[9]. This can be accomplished through real power exchange between the dc source and the ac system through the inverter. Different topologies like cascaded H-bridge, Diode clamped and Flying Capacitor are available for the multilevel inverter. It is observed that H-bridge topology gives better result in case of DVR[10]. Further three-level, five-level inverter has been implemented in the DVR for voltage sag mitigation. It has also been observed that with the increase in the level of inverter harmonic contribution in the injected voltage can be reduced.
2. Analysis of Voltage Sag
vs
Fault
SENSITIVE LOAD
RsLs+
Vt
i1
i2B1 B3
B2LOAD
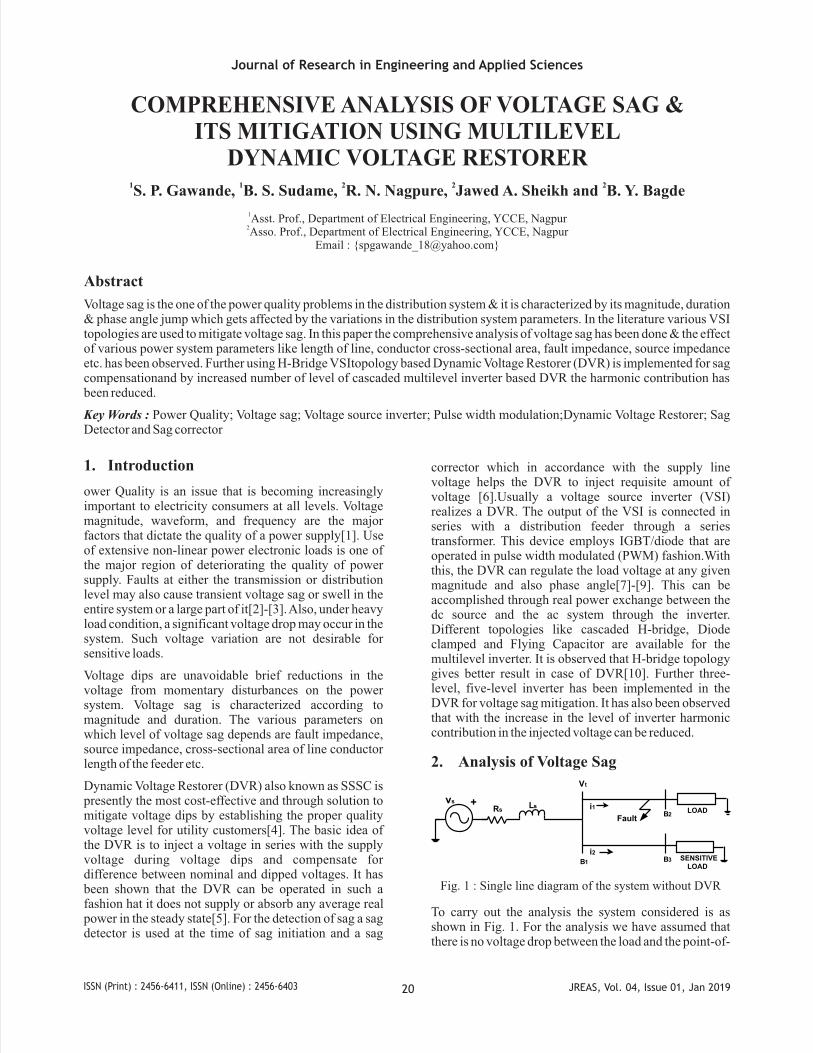
Fig. 1 : Single line diagram of the system without DVR
To carry out the analysis the system considered is as shown in Fig. 1. For the analysis we have assumed that there is no voltage drop between the load and the point-of-
1Asst. Prof., Department of Electrical Engineering, YCCE, Nagpur2Asso. Prof., Department of Electrical Engineering, YCCE, Nagpur
Email : {[email protected]}
JREAS, Vol. 04, Issue 01, Jan 201921ISSN (Print) : 2456-6411, ISSN (Online) : 2456-6403
common coupling (pcc). Assume that pre-event voltage is exactly 1 p.u., thus E=1p.u.. The voltage at the pcc, and thus the voltage at the terminals can be found from equation (1)
1puE,
FZSZ
FZ
SAGVE,
FZSZ
FZSAGV =
+=
+= (1)
The various parameters on which the sag analysis has been carried out are described below as shown in Table. I.
Table 1 Variation Of Sag Magnitude With Different System Parameter
Fault Impedance
(Ω)
Vsag (pu)
Source Impedance
(Ω)
Vsag (pu)
Feeder Length (km)
Vsag (Pu)
Cross-section (mm2)
Vsag
(pu)
1
0.3452
0.1
0.5375
1
0.519
50
0.5190
1.5
0.4430
0.3
0.5302
3
0.554
150 0.5185
2
0.5175
0.5
0.5271
5
0.609
300 0.5180
3
0.6210
0.7
0.5210
7
0.671
5
0.7350
1.0
0.5150
10
0.759
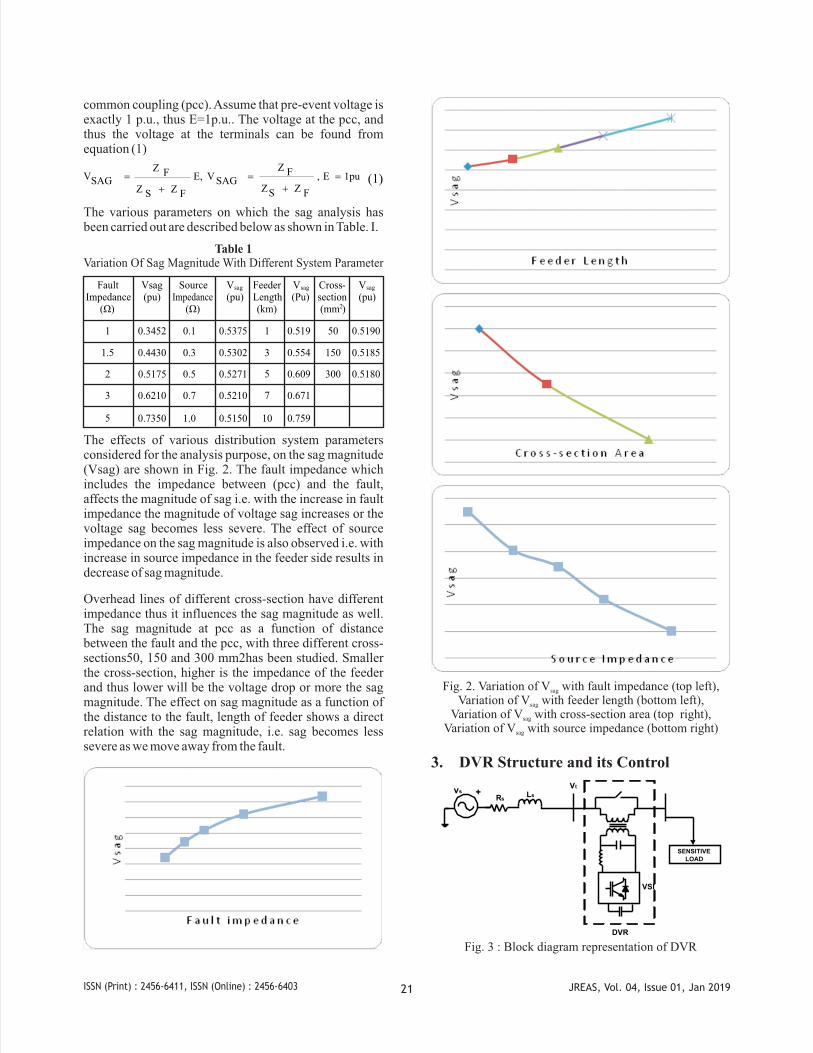
The effects of various distribution system parameters considered for the analysis purpose, on the sag magnitude (Vsag) are shown in Fig. 2. The fault impedance which includes the impedance between (pcc) and the fault, affects the magnitude of sag i.e. with the increase in fault impedance the magnitude of voltage sag increases or the voltage sag becomes less severe. The effect of source impedance on the sag magnitude is also observed i.e. with increase in source impedance in the feeder side results in decrease of sag magnitude.
Overhead lines of different cross-section have different impedance thus it influences the sag magnitude as well. The sag magnitude at pcc as a function of distance between the fault and the pcc, with three different cross-sections50, 150 and 300 mm2has been studied. Smaller the cross-section, higher is the impedance of the feeder and thus lower will be the voltage drop or more the sag magnitude. The effect on sag magnitude as a function of the distance to the fault, length of feeder shows a direct relation with the sag magnitude, i.e. sag becomes less severe as we move away from the fault.
Fig. 2. Variation of V with fault impedance (top left),sag
Variation of V with feeder length (bottom left),sag
Variation of V with cross-section area (top right),sag
Variation of V with source impedance (bottom right)sag
3. DVR Structure and its Control
vs
RsLs+
VSI
Vt
DVR
SENSITIVE LOAD
Fig. 3 : Block diagram representation of DVR
JREAS, Vol. 04, Issue 01, Jan 201922ISSN (Print) : 2456-6411, ISSN (Online) : 2456-6403
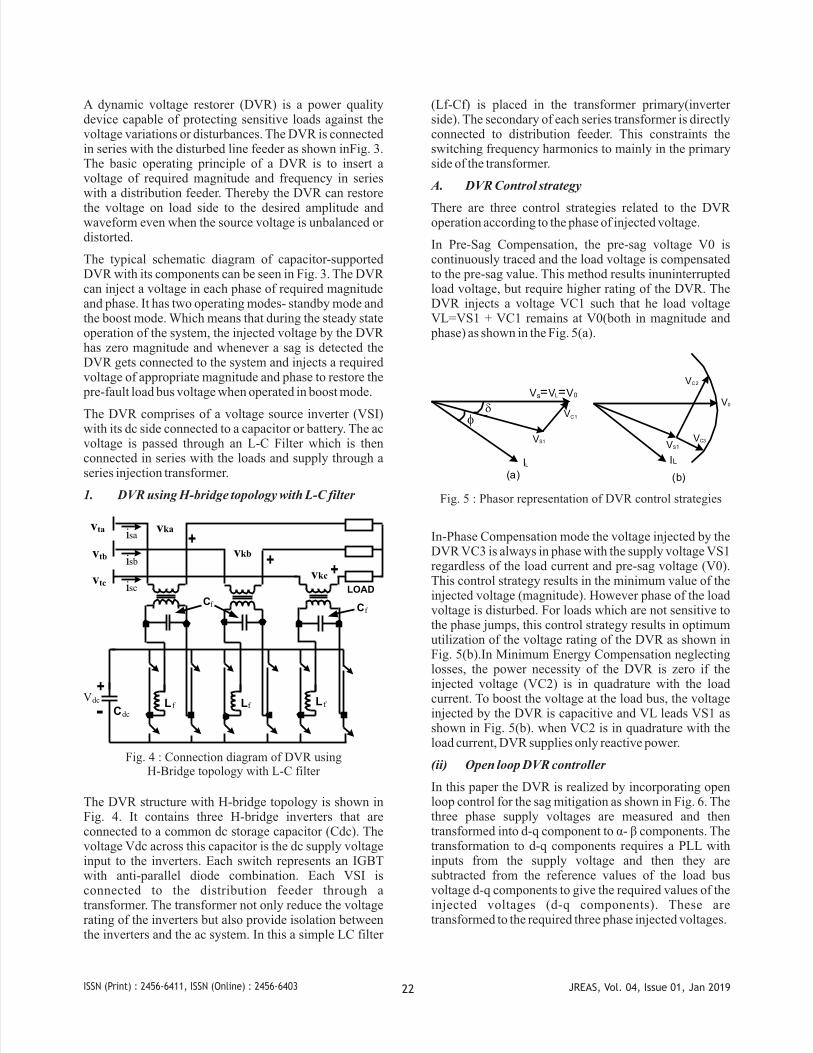
A dynamic voltage restorer (DVR) is a power quality device capable of protecting sensitive loads against the voltage variations or disturbances. The DVR is connected in series with the disturbed line feeder as shown inFig. 3. The basic operating principle of a DVR is to insert a voltage of required magnitude and frequency in series with a distribution feeder. Thereby the DVR can restore the voltage on load side to the desired amplitude and waveform even when the source voltage is unbalanced or distorted.
The typical schematic diagram of capacitor-supported DVR with its components can be seen in Fig. 3. The DVR can inject a voltage in each phase of required magnitude and phase. It has two operating modes- standby mode and the boost mode. Which means that during the steady state operation of the system, the injected voltage by the DVR has zero magnitude and whenever a sag is detected the DVR gets connected to the system and injects a required voltage of appropriate magnitude and phase to restore the pre-fault load bus voltage when operated in boost mode.
The DVR comprises of a voltage source inverter (VSI) with its dc side connected to a capacitor or battery. The ac voltage is passed through an L-C Filter which is then connected in series with the loads and supply through a series injection transformer.
1. DVR using H-bridge topology with L-C filter
LOAD
Vdc
-+
Cdc
vta
vtb
vtc
isa
isb
isc
vka
vkc
vkb+
+
+
L fLfL f
CfCf
Fig. 4 : Connection diagram of DVR usingH-Bridge topology with L-C filter
The DVR structure with H-bridge topology is shown in Fig. 4. It contains three H-bridge inverters that are connected to a common dc storage capacitor (Cdc). The voltage Vdc across this capacitor is the dc supply voltage input to the inverters. Each switch represents an IGBT with anti-parallel diode combination. Each VSI is connected to the distribution feeder through a transformer. The transformer not only reduce the voltage rating of the inverters but also provide isolation between the inverters and the ac system. In this a simple LC filter
(Lf-Cf) is placed in the transformer primary(inverter side). The secondary of each series transformer is directly connected to distribution feeder. This constraints the switching frequency harmonics to mainly in the primary side of the transformer.
A. DVR Control strategy
There are three control strategies related to the DVR operation according to the phase of injected voltage.
In Pre-Sag Compensation, the pre-sag voltage V0 is continuously traced and the load voltage is compensated to the pre-sag value. This method results inuninterrupted load voltage, but require higher rating of the DVR. The DVR injects a voltage VC1 such that he load voltage VL=VS1 + VC1 remains at V0(both in magnitude and phase) as shown in the Fig. 5(a).
VC1
Vs=VL=V0
df
VC3
VC2
VS1
V0
IL
(a) (b)
VS1
IL
Fig. 5 : Phasor representation of DVR control strategies
In-Phase Compensation mode the voltage injected by the DVR VC3 is always in phase with the supply voltage VS1 regardless of the load current and pre-sag voltage (V0). This control strategy results in the minimum value of the injected voltage (magnitude). However phase of the load voltage is disturbed. For loads which are not sensitive to the phase jumps, this control strategy results in optimum utilization of the voltage rating of the DVR as shown in Fig. 5(b).In Minimum Energy Compensation neglecting losses, the power necessity of the DVR is zero if the injected voltage (VC2) is in quadrature with the load current. To boost the voltage at the load bus, the voltage injected by the DVR is capacitive and VL leads VS1 as shown in Fig. 5(b). when VC2 is in quadrature with the load current, DVR supplies only reactive power.
(ii) Open loop DVR controller
In this paper the DVR is realized by incorporating open loop control for the sag mitigation as shown in Fig. 6. The three phase supply voltages are measured and then transformed into d-q component to α- β components. The transformation to d-q components requires a PLL with inputs from the supply voltage and then they are subtracted from the reference values of the load bus voltage d-q components to give the required values of the injected voltages (d-q components). These are transformed to the required three phase injected voltages.
JREAS, Vol. 04, Issue 01, Jan 201923ISSN (Print) : 2456-6411, ISSN (Online) : 2456-6403
aß
aß
aß
aßabc
abcdq
dq
PLL
Vd ref = Vo Vq ref = 0
VSa
VSc
VSb
VCc
VCb
VCa
?
?
?
VS
+
-+
-
Fig. 6 : Block diagram of open loop controller for DVR
4. System Description with DVR
vs
Fault
SENSITIVE LOAD
RsLs+
Vt
i1
i2B1 B3
B2LOAD
DVR
Fig. 7 : Single line diagram of system with DVR.
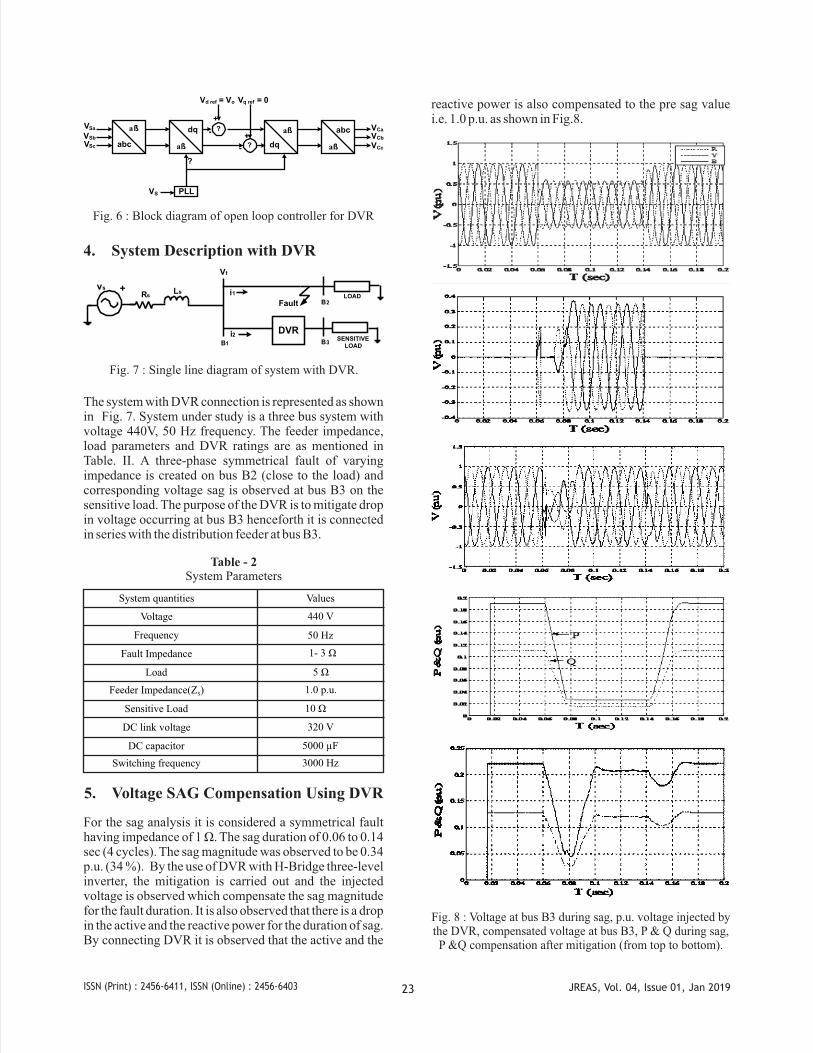
The system with DVR connection is represented as shown in Fig. 7. System under study is a three bus system with voltage 440V, 50 Hz frequency. The feeder impedance, load parameters and DVR ratings are as mentioned in Table. II. A three-phase symmetrical fault of varying impedance is created on bus B2 (close to the load) and corresponding voltage sag is observed at bus B3 on the sensitive load. The purpose of the DVR is to mitigate drop in voltage occurring at bus B3 henceforth it is connected in series with the distribution feeder at bus B3.
Table - 2System Parameters
System quantities
Values
Voltage
440 V
Frequency 50 Hz
Fault Impedance 1- 3 Ω
Load
5 Ω
Feeder Impedance(Z )S
1.0 p.u.
Sensitive Load
10 Ω
DC link voltage
320 V
DC capacitor 5000 µF
Switching frequency
3000 Hz
5. Voltage SAG Compensation Using DVR
For the sag analysis it is considered a symmetrical fault having impedance of 1 Ω. The sag duration of 0.06 to 0.14 sec (4 cycles). The sag magnitude was observed to be 0.34 p.u. (34 %). By the use of DVR with H-Bridge three-level inverter, the mitigation is carried out and the injected voltage is observed which compensate the sag magnitude for the fault duration. It is also observed that there is a drop in the active and the reactive power for the duration of sag. By connecting DVR it is observed that the active and the
reactive power is also compensated to the pre sag value i.e. 1.0 p.u. as shown in Fig.8.
Fig. 8 : Voltage at bus B3 during sag, p.u. voltage injected bythe DVR, compensated voltage at bus B3, P & Q during sag,P &Q compensation after mitigation (from top to bottom).
JREAS, Vol. 04, Issue 01, Jan 201924ISSN (Print) : 2456-6411, ISSN (Online) : 2456-6403
Table - 3Results of Sag Analysis and Injected Voltage
voltage sag (%)
Sag magnitude
(p.u.)
Injected voltage(Vc)
Reactive power compensation by DVR (p.u.)
70 0.3 0.36 -6
80 0.2 0.37 -0.16
90 0.1 0.39 -0.05
For the proper calibration of DVR it is tested for the different voltage sag values & its satisfactory performance is observed as shown in Table-III
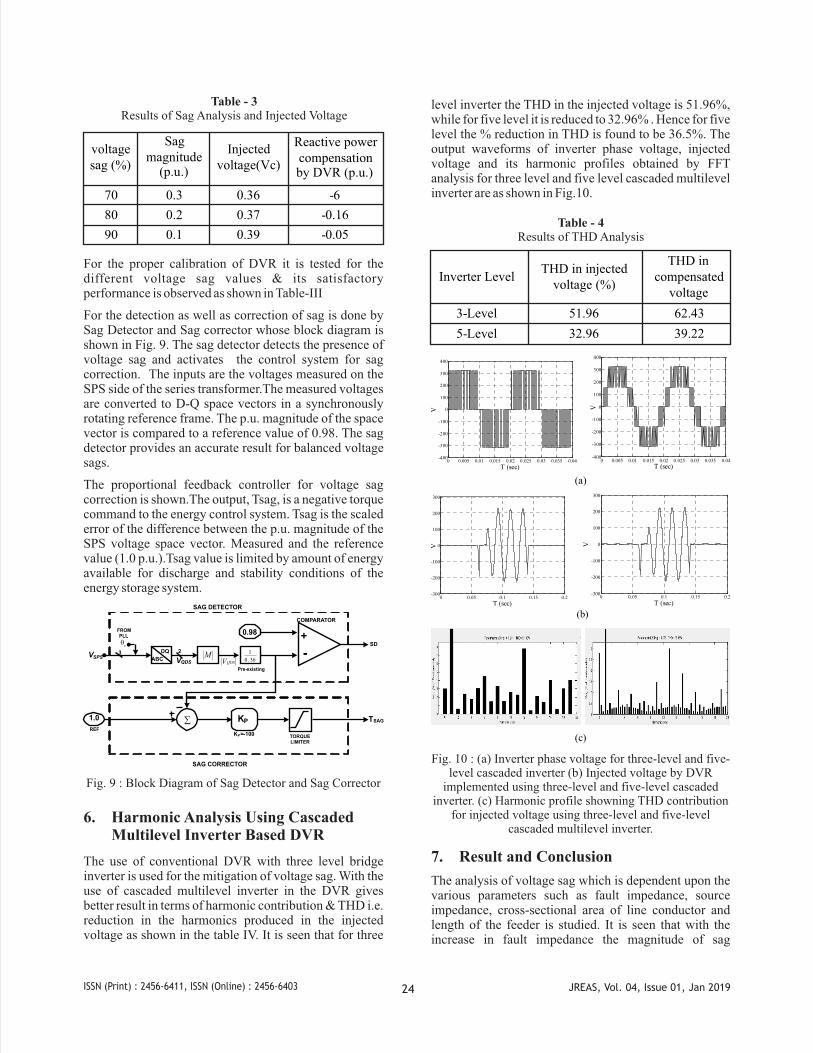
For the detection as well as correction of sag is done by Sag Detector and Sag corrector whose block diagram is shown in Fig. 9. The sag detector detects the presence of voltage sag and activates the control system for sag correction. The inputs are the voltages measured on the SPS side of the series transformer.The measured voltages are converted to D-Q space vectors in a synchronously rotating reference frame. The p.u. magnitude of the space vector is compared to a reference value of 0.98. The sag detector provides an accurate result for balanced voltage sags.
The proportional feedback controller for voltage sag correction is shown.The output, Tsag, is a negative torque command to the energy control system. Tsag is the scaled error of the difference between the p.u. magnitude of the SPS voltage space vector. Measured and the reference value (1.0 p.u.).Tsag value is limited by amount of energy available for discharge and stability conditions of the energy storage system.
+
-
0.98
36.0
1MDQ
ABCQDSVVQDS
FROMPLL
VSPS23
SD
KP1.0 å
TORQUELIMITER
KP=-100REF
SAG CORRECTOR
SAG DETECTOR
TSAG
COMPARATOR
Pre-existing
eq
Fig. 9 : Block Diagram of Sag Detector and Sag Corrector
6. Harmonic Analysis Using Cascaded Multilevel Inverter Based DVR
The use of conventional DVR with three level bridge inverter is used for the mitigation of voltage sag. With the use of cascaded multilevel inverter in the DVR gives better result in terms of harmonic contribution & THD i.e. reduction in the harmonics produced in the injected voltage as shown in the table IV. It is seen that for three
level inverter the THD in the injected voltage is 51.96%, while for five level it is reduced to 32.96% . Hence for five level the % reduction in THD is found to be 36.5%. The output waveforms of inverter phase voltage, injected voltage and its harmonic profiles obtained by FFT analysis for three level and five level cascaded multilevel inverter are as shown in Fig.10.
Table - 4Results of THD Analysis
Inverter Level THD in injected
voltage (%)
THD in compensated
voltage
3-Level 51.96 62.43 5-Level 32.96 39.22
Fig. 10 : (a) Inverter phase voltage for three-level and five-level cascaded inverter (b) Injected voltage by DVR
implemented using three-level and five-level cascaded inverter. (c) Harmonic profile showning THD contribution
for injected voltage using three-level and five-level cascaded multilevel inverter.
7. Result and Conclusion
The analysis of voltage sag which is dependent upon the various parameters such as fault impedance, source impedance, cross-sectional area of line conductor and length of the feeder is studied. It is seen that with the increase in fault impedance the magnitude of sag
JREAS, Vol. 04, Issue 01, Jan 201925ISSN (Print) : 2456-6411, ISSN (Online) : 2456-6403
increases i.e. when Zf =1Ω, sag magnitude is 0.345p.u. (34.5%); Zf = 2Ω, sag magnitude is 0.443p.u.(44.3%); Zf = 5Ω, sag magnitude is 0.735p.u. (73.5%). Also with increase in the source impedance from 0.1Ω to 1Ω, The sag magnitude decreases from 0.5175p.u. (51.75%) to 0.515p.u. (51.5%), thus there is an inverse relation between the source impedance and sag magnitude. Further the effect of feeder length has been carried out, in this case we see that as we move away from the fault the sag becomes less severe i.e. with feeder length = 1km, sag magnitude is 0.519p.u.; feeder length of 5km, sag magnitude is 0.609p.u. and with feeder length of10km, sag magnitude is 0.759p.u. The cross-sectional area of the feeder also affects the severity of sag, for our analysis we considered three cross-sectional areas of 50mm2, 150mm2 and 300mm2. We see that with the increase in cross-sectional area the sag magnitude decreases from 0.519p.u. to 0.518p.u.
In this paper, a simple, fast and cost effective Dynamic Voltage Restorer (DVR) is proposed for mitigating the problem of voltage sag at distribution level. The modeling and simulation of proposed DVR is carried out. Detection and quantization of sags was done using the open loop control with the help of sag detector and sag corrector circuit. Initially the compensation is carried out by using conventional DVR comprising of bridge inverter. Further the cascaded H-bridge multilevel inverter is used in the DVR and the harmonic profile of the injected voltage is analyzed , the THD analysis shows that with five level inverter the harmonic content in the injected voltage is lesser than conventional bridge inverter based DVR.
References
[1] Ray Arnold, “Solutions to Power Quality Problems”, Power engineering journal 2001 pages: 65-73.
[2] M. H. Haque, “Voltage Sag correction by dynamic voltage Restorer with minimum Power Injection”, IEEE Power Engineering Review, May 2001.
[3] M. H. J. Bollen, “Understanding Power quality Problems: Voltage Sag &Interruption”, John Willey Publication, New York,2000.
[4] H. Hingorani, “Introducing custom Power”, IEEE Spectrum, vol.32,no.6,pp.41-48, june 1995.
[5] S. S. Choi, B.H. Li, and D. M. Vilathgamuwa, “Dynamic Voltage Restoration with Minimum Energy Injection”, IEEE Transaction on Power system, vol.15,no.1, February 2000.
[6] Brian K. Johnson, “Modeling and Analysis of a Flywheel Energy Storage System for Voltage Sag Correction”, Major in Electrical Engineering in the College of Graduate Studies University of Idaho.
[7] Amit Kumar Jindal, Arindam Ghosh, Avinash Joshi, “Critical load bus voltage control using D V Runder system frequency variation”, Electric Power Systems Research 78 (2008) 255–263.
[8] S. P. Gawande, M. R. Ramteke,“Camparative Evaluation of Performance Improvement in Capacitor-supported Dynamic Voltage Restorer for Linear & Non-linear Loads”, ICECT-2012, wiil be accepted for publishingin IEEE Explore.
[9] A. Ghosh, A. K. Jindal & A. Joshi, “Design of Capacitor supported Dynamic Voltage Restorer (DVR) for unbalanced and distorted Loads”, IEEE Trans. Power Delivery, vol.19, pp.405 - 413, January 2004.
[10] B.Wu, “High Power converters and AC Drives”, Wiley & IEEE Press 2006.