Embed Size (px)
Citation preview
COMPREHENSIVE ANNUAL FINANCIAL REPORT
West Virginia Parkways Authority (A Component Unit of the State of West Virginia)
Fiscal Years Ended June 30, 2016 and 2015
WEST VIRGINIA PARKWAYS AUTHORITY (a Component Unit of the State of West Virginia)
Comprehensive Annual Financial Report
Fiscal Years Ended June 30, 2016 and 2015
Prepared by: Director of Finance, West Virginia Parkways Authority
West Virginia Parkways Authority
Comprehensive Annual Financial Report
Fiscal Years Ended June 30, 2016 and 2015
Table of Contents INTRODUCTORY SECTION List of Authority Members, Administrative Staff, and Professional Consultants .....................1 Organization Chart .....................................................................................................................2 Letter of Transmittal to General Manager and Authority Members ..........................................3 Certificate of Achievement for Excellence in Financial Reporting .........................................15 FINANCIAL SECTION Independent Auditor’s Report ..................................................................................................17 Management’s Discussion and Analysis .................................................................................19 Statements of Net Position .......................................................................................................25 Statements of Revenues, Expenses, and Changes in Net Position ..........................................26 Statements of Cash Flows ........................................................................................................27 Notes to the Financial Statements, an Integral Part of the Basic Financial Statements ...........28 Required Supplementary Information Schedule of Proportionate Share of the Net Pension Liability ..........................................53 Schedule of Pension Contributions ....................................................................................54 Note to Required Supplementary Information ...................................................................55 STATISTICAL SECTION Condensed Schedules of Net Position .....................................................................................58 Condensed Schedules of Revenues, Expenses, and Changes in Net Position .........................59 Financial Ratios .......................................................................................................................60 Revenue Bond Coverage ..........................................................................................................61 Traffic Statistics .......................................................................................................................62 Number of Employees/Traffic Accident and Policing Statistics .............................................63 Population Demographics ........................................................................................................64 Significant Dates ......................................................................................................................65 Miscellaneous Data and Statistics ............................................................................................68 Toll Rates and Vehicle Classifications ....................................................................................69 Map of West Virginia Turnpike ...............................................................................................70
Introductory Section
West Virginia Parkways Authority
West Virginia Parkways Authority
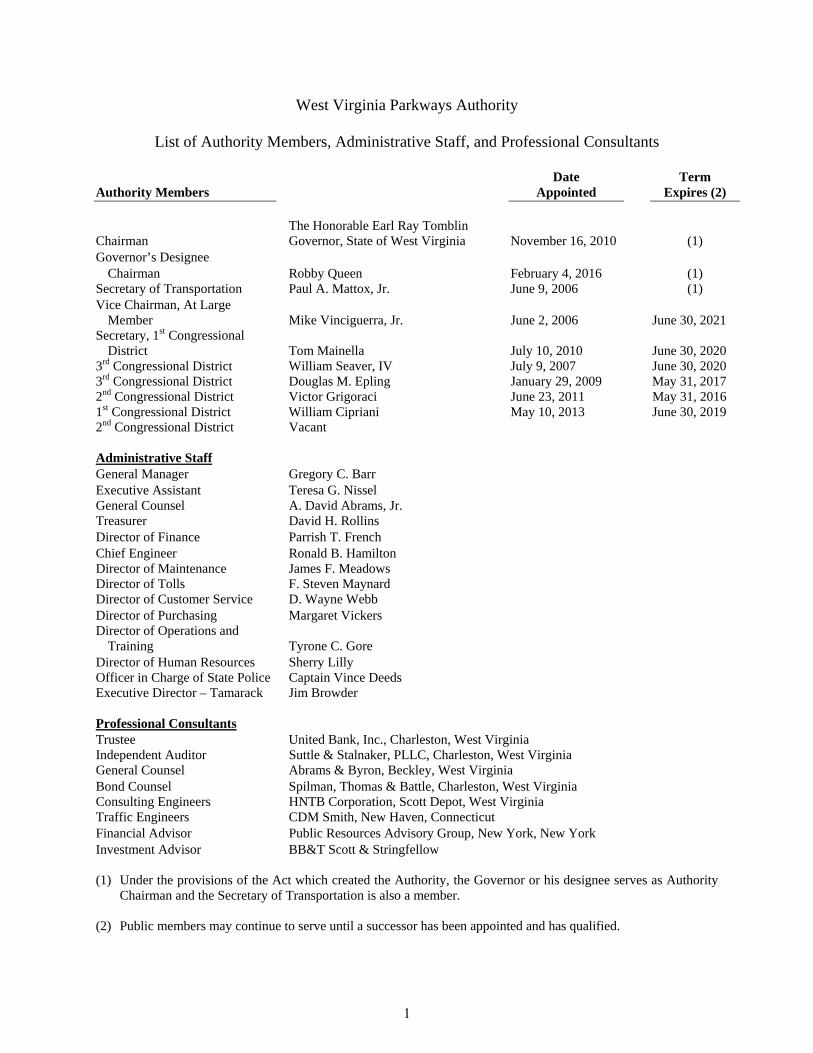
List of Authority Members, Administrative Staff, and Professional Consultants
Authority Members Date
Appointed Term
Expires (2)
Chairman The Honorable Earl Ray Tomblin Governor, State of West Virginia November 16, 2010 (1)
Governor’s Designee Chairman Robby Queen February 4, 2016 (1) Secretary of Transportation Paul A. Mattox, Jr. June 9, 2006 (1) Vice Chairman, At Large
Member Mike Vinciguerra, Jr. June 2, 2006 June 30, 2021 Secretary, 1st Congressional
District Tom Mainella July 10, 2010 June 30, 2020 3rd Congressional District William Seaver, IV July 9, 2007 June 30, 2020 3rd Congressional District Douglas M. Epling January 29, 2009 May 31, 2017 2nd Congressional District Victor Grigoraci June 23, 2011 May 31, 2016 1st Congressional District William Cipriani May 10, 2013 June 30, 2019 2nd Congressional District Vacant Administrative Staff General Manager Gregory C. Barr Executive Assistant Teresa G. Nissel General Counsel A. David Abrams, Jr. Treasurer David H. Rollins Director of Finance Parrish T. French Chief Engineer Ronald B. Hamilton Director of Maintenance James F. Meadows Director of Tolls F. Steven Maynard Director of Customer Service D. Wayne Webb Director of Purchasing Margaret Vickers Director of Operations and
Training Tyrone C. Gore Director of Human Resources Sherry Lilly Officer in Charge of State Police Captain Vince Deeds Executive Director – Tamarack Jim Browder Professional Consultants Trustee United Bank, Inc., Charleston, West Virginia Independent Auditor Suttle & Stalnaker, PLLC, Charleston, West Virginia General Counsel Abrams & Byron, Beckley, West Virginia Bond Counsel Spilman, Thomas & Battle, Charleston, West Virginia Consulting Engineers HNTB Corporation, Scott Depot, West Virginia Traffic Engineers CDM Smith, New Haven, Connecticut Financial Advisor Public Resources Advisory Group, New York, New York Investment Advisor BB&T Scott & Stringfellow (1) Under the provisions of the Act which created the Authority, the Governor or his designee serves as Authority
Chairman and the Secretary of Transportation is also a member. (2) Public members may continue to serve until a successor has been appointed and has qualified.
1
2
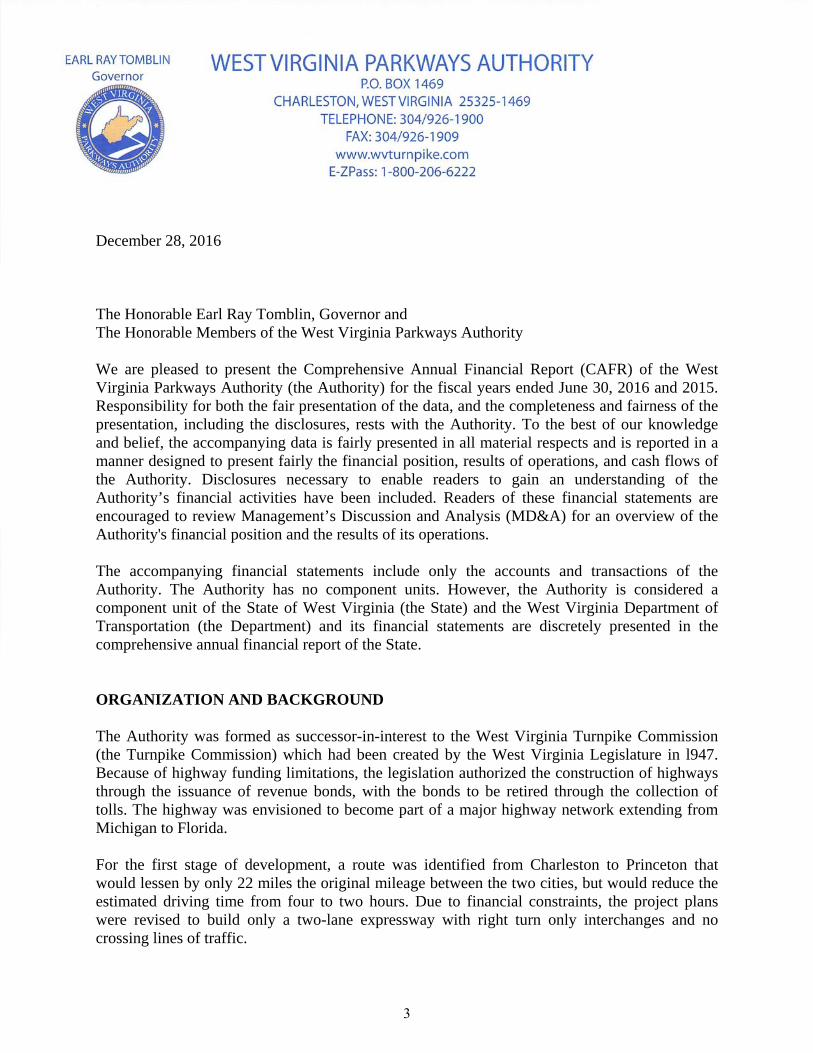
December 28, 2016 The Honorable Earl Ray Tomblin, Governor and The Honorable Members of the West Virginia Parkways Authority We are pleased to present the Comprehensive Annual Financial Report (CAFR) of the West Virginia Parkways Authority (the Authority) for the fiscal years ended June 30, 2016 and 2015. Responsibility for both the fair presentation of the data, and the completeness and fairness of the presentation, including the disclosures, rests with the Authority. To the best of our knowledge and belief, the accompanying data is fairly presented in all material respects and is reported in a manner designed to present fairly the financial position, results of operations, and cash flows of the Authority. Disclosures necessary to enable readers to gain an understanding of the Authority’s financial activities have been included. Readers of these financial statements are encouraged to review Management’s Discussion and Analysis (MD&A) for an overview of the Authority's financial position and the results of its operations. The accompanying financial statements include only the accounts and transactions of the Authority. The Authority has no component units. However, the Authority is considered a component unit of the State of West Virginia (the State) and the West Virginia Department of Transportation (the Department) and its financial statements are discretely presented in the comprehensive annual financial report of the State. ORGANIZATION AND BACKGROUND The Authority was formed as successor-in-interest to the West Virginia Turnpike Commission (the Turnpike Commission) which had been created by the West Virginia Legislature in l947. Because of highway funding limitations, the legislation authorized the construction of highways through the issuance of revenue bonds, with the bonds to be retired through the collection of tolls. The highway was envisioned to become part of a major highway network extending from Michigan to Florida. For the first stage of development, a route was identified from Charleston to Princeton that would lessen by only 22 miles the original mileage between the two cities, but would reduce the estimated driving time from four to two hours. Due to financial constraints, the project plans were revised to build only a two-lane expressway with right turn only interchanges and no crossing lines of traffic.
3
The West Virginia Turnpike (Turnpike) opened in 1954, and in 1958 it was incorporated into the nationwide Interstate and Defense Highway System. The Federal Highway Act of 1968 included a provision permitting interstate funding to be used for the reconstruction of the Turnpike. Beginning in 1970 and concluding September 2, 1987, the Turnpike was upgraded to meet four-lane interstate design standards. Financing was accomplished through the use of Federal highway funds on a 90% Federal/10% state-matching basis. The Authority repaid the Department for the matching funds with the last payment made in June, 1994. These repaid funds were used by the Department for highway projects located within 75 miles of the Turnpike. The Turnpike System The West Virginia Turnpike consists of 88 miles of limited access highway, which are an integral part of the U.S. Interstate Highway System. It carries the designations of Interstate 77 (I-77) for its entire length and Interstate 64 (I-64) from Charleston to Beckley. I-77 is a north-south interstate route connecting Cleveland, Ohio to Columbia, South Carolina. I-64 is an east-west route connecting St. Louis, Missouri to Virginia Beach, Virginia. From its beginning, the Turnpike has been an important route for commercial truck traffic serving the northeast and upper Midwest industrial areas to industrial areas and population centers of the South. Today, heavy truck traffic accounts for over 20% of total transactions and approximately 50% of toll revenues. The Turnpike is also important to summer and holiday travelers. Average daily passenger car traffic increases by approximately 28% during the summer travel months of June, July and August. Studies have indicated approximately 76% of toll revenues are collected from out-of-state vehicles. Turnpike operations are financed almost entirely by Turnpike toll revenues. Toll revenues must pay for operating and routine maintenance expenses, debt service, renewal and replacement requirements and deferred maintenance and capital needs. It is important to note that the Turnpike does not receive any State or Federal funds to assist with its maintenance or operations. The Turnpike uses a toll barrier system with three mainline toll plazas strategically located between Charleston and Princeton. There are 18 entrance-exit ramps from the Turnpike serving local traffic. All ramps are toll-free except for the U.S. Rte. 19 interchange north of Beckley where there is also a toll barrier facility. The Authority is an associate member of the E-ZPass® Group which develops guidelines for and facilitates the electronic collection of tolls among 27 toll agencies from 16 states in the Eastern and Midwest portions of the U.S. The E-ZPass program is the largest, most successful interoperable toll collection program anywhere in the world, servicing more than 18 million accounts, 30 million tags and the collection of over $8 billion dollars in electronic toll revenues. The West Virginia Turnpike processes 37.2% of toll transactions and collects 43.6% of toll revenue with the E-ZPass® system.
4
Reorganization In 2010, the Authority’s enabling legislation was amended to rename and reorganize the organization as the West Virginia Parkways Authority. The intent of this legislation is to facilitate exploring the possibility of utilizing the Authority's institutional knowledge and experience in toll collection at potential new tolling projects within the State. The structure of the Authority's governance board was expanded to nine members and will transition to eventually include two members from each of the State's three congressional districts, one at-large member, the Secretary of Transportation and the Governor or his designee, as Chairman. Newly appointed members will be appointed to a term of five years, rather than the traditional eight year terms. The Legislation clarified the Authority's working relationship with the Department and allows the Authority to issue revenue bonds for any projects that might be identified as feasible. The legislation established specific procedures relating to the final approval of any such project including the establishment of local advisory committees to counsel the applicable County Commissions who must approve the concept of tolling for projects located in their counties. Continuing resolution in support of tolls remaining on the WV turnpike after bonds are paid in 2019
At the December 8, 2016 meeting of the West Virginia Parkways Authority, the governing Board passed a second resolution in support of the continuation of tolls on the West Virginia Turnpike once existing bonds are paid in full. Final payment on these bonds is currently scheduled for May 15, 2019. The first Resolution was passed on January 7, 2016 to urge the West Virginia Legislature to amend the existing legislation requiring the cessation of tolls after the bonds are paid. The Board concluded that the State of West Virginia has had significant difficulty balancing its budget over the last few years due in part to declining revenue. Tolls on the Turnpike continue to pay for the toll road’s operation, maintenance and capital improvements and continue to provide the State with 360 full and part-time jobs with benefits. The Resolutions also concluded the following:
The elimination of tolls would result in the loss of approximately $90 million of yearly revenue that could have been collected from the use of the West Virginia Turnpike. Since 76% of all toll revenues come from out-of-state passenger and commercial vehicles, there would be a loss of $68 million annually to pay for the cost to operate the 88-mile Turnpike which has 426 lane miles and 116 bridges. Without the toll revenue, the entire cost of operating the West Virginia Turnpike would shift directly or indirectly to the taxpayers of West Virginia. Over a 30 year period, West Virginia would lose approximately $2.7 billion in revenue from tolls, $2 billion of which comes from out-of-state users of the West Virginia Turnpike.
5
The Parkways Authority, through its customer service center, continues to offer generous
discounts to E-ZPass customers to lessen the costs to both personal and commercial users of the Turnpike. In addition, a special West Virginia individual tax deduction is permitted for tolls paid with WV E-ZPass.
In May 2015, the West Virginia Blue Ribbon Commission on Highways issued their report that concluded West Virginia needs an additional $750 million a year simply to preserve and improve its roads and bridges. Another $380 million a year is needed to provide for expansion of the existing highway system. The annual shortfall for West Virginia transportation needs is expected to exceed $1.13 billion. Tolling helps fund transportation infrastructure as the current gas tax revenues that support the State Road Fund are stagnant and in danger of dwindling even further as people drive more fuel-efficient vehicles.
The Parkways Authority receives no funding whatsoever from the State of West Virginia or from the Federal Government for any maintenance, operation or capital repairs needed for the Turnpike.
West Virginia Legislative Auditor Report In December 2013, the West Virginia Legislative Auditor’s Performance Evaluation & Research Division presented the Authority with their performance review report. Current legislation provides that when all bonds and interest are paid in full, the Turnpike will be turned over to the WV Division of Highways (WVDOH) free of tolls if the Secretary of Transportation deems the road to be in good condition. The objectives of the performance review were to determine the cost implication to the State if the West Virginia Turnpike is transferred to the WVDOH as required under current law, and if the Authority is making long-term operational decisions that could make the transfer more costly or problematic. The report recommended the Legislature should consider making a final decision on the future of the Turnpike as soon as possible in order to facilitate planning of the transfer and minimize the costs to the State if the transfer occurs. Findings in the report included an estimated $9 million local economic impact of the loss of up to 231 jobs, the impact of the loss of funding for State Police Troop 7, an estimated $23 million cost of dismantling the toll plazas and highway reconstruction, lack of funding for courtesy patrols, and loss of funding for Tamarack. Also, the report noted that some of the office facilities currently in use are worn and aged and alternatives must be found. A number of other recommendations pertaining to improving current Turnpike operations were also presented and are being considered and studied by the Authority. The report concluded there would be an annual $30.4 million cost to maintain the Turnpike free of tolls for the WVDOH. The Authority’s response included a detailed estimate of maintenance cost of $59 million per year based upon an engineering analysis reflective of a proactive and needs-based maintenance plan to maximize the life cycle of highway and bridge assets, rather than the current available funds approach from the report. The current available funds approach used for the report was calculated using information from the Division of Highways on the current funding available for other West Virginia Interstates.
6
Highway and Bridge Rehabilitation Projects Effective August 1, 2009 the Authority adopted a new toll rate schedule, its first rate increase in over 28 years. As a result, the Authority has substantially increased the breadth and scope of its rehabilitation and repair projects on the Turnpike including full depth concrete repairs and undersealing, asphalt pavement overlay, bridge deck overlay, bridge and facilities retrofit work, guardrails, median barriers, retaining walls, buildings, toll plazas, culverts and drainage pipes, and signs and pavement markings. In accordance with a 10-year capital plan developed with the consulting engineer, the increased toll revenues will be used to alleviate an estimated $335 million in essential deferred maintenance and capital needs backlog, including $242 million for paving. Beginning in 2010, improvements in pavement ride quality on some sections of the Turnpike became apparent. While approximately 40% of pavements were condition assessed as good or very good in 2010, by May, 2016 78% of pavements were condition assessed as good or very good. Major construction projects in 2016 included asphalt overlay and paving on the northern portion of the Turnpike. Work commenced in October, 2016 on an additional $24.5 million paving project also at the Turnpike’s north end. Following Memorial Day, most work is performed at night, Monday through Thursday from 6:00 p.m. to 6:00 a.m., in order to keep traffic delays at a minimum. Bridge deck replacement using accelerated bridge construction (ABC) method In 2015, the Parkways Authority awarded a contract for the Turnpike’s first bridge deck replacement on the Turnpike. It was the first use of the Accelerated Bridge Construction (ABC) method of replacing bridge decks in the State of West Virginia and it had a minimal impact on traffic. The contractor was given 129 hours to complete the project from the time of the first lane closure until all lanes were open to traffic. This is in contrast to a 6-8 month construction period for a traditional method of bridge deck replacement. The project replaced the 220 foot, two-lane bridge deck on northbound I-77 over Route 48 in Ghent, Mercer County, West Virginia and the project was completed in May 2016. Accelerated Bridge Construction is a method in which the decks are brought in as pre-cast units and provides better quality control as the units are made in a casting plant. Once the casts are brought in, the old deck is replaced and the new deck is put into place with a crane and locked in place within a week’s time. There are 116 bridges on the West Virginia Turnpike and this was the first bridge deck replacement since the Turnpike’s upgrade was completed in 1987. The Authority began a program to route and seal deck cracks in the late 1980’s with a two-part epoxy which continues to this day. Starting in 2006, 36 bridge decks have been overlaid with a thin epoxy/aggregate combination for water sealing benefits and traction improvement. Since 2010, water based sealers have been applied to approximately 40 decks. Up to nine tons of salt are applied to some bridges each year. Over the next 30 years, at least 80% of bridge decks will need to be replaced at an estimated annual cost of $22 million.
7
Routine Maintenance In addition to snow removal and ice control, road and bridge maintenance crews perform activities associated with all aspects of highway maintenance including: pavements, drainage, signage and other traffic control devices, bridge repairs, bench cleaning, vegetation control and litter pickup. Utilizing the Maintenance Management System (MMS) the Maintenance Division prepares periodic condition ratings on maintenance performance areas. Actual conditions are compared to established performance targets to assess the effectiveness of the maintenance program. The Division found that asphalt pavement conditions continued to exceed targets due to the pavement rehabilitation and preservation program as a result of the toll rate increase and the Division’s aggressive crack sealing program. The Authority continued its focus on preventive bridge maintenance including protective deck overlays which provide skid resistant surfaces and help seal the bridge deck from salt intrusion and sizable spot painting contracts which help to preserve the steel structures. An improvement in vegetation control was noted and can be attributed to the purchase of a boom mower with brush cutting heads and a high reach tree trimmer attachment. Maintenance Management System In April 2011, the Authority Maintenance Division completed the last phase of its Maintenance Management System (MMS) implementation. The MMS had been under development since 2005; however, due to budget constraints the system had been only partially implemented. In late 2009, the Division received funding to complete the full MMS implementation. Through a competitive proposal process, the Division selected Agile Assets to provide software for the final MMS phase. Dye Management Group of Seattle, Washington assisted with software configuration and customization. The Division now has a state-of-the-art asset management system that provides management decision support in the areas of:
Needs assessment Planning, programming and budgeting Resource management Work program tracking and execution Asset performance monitoring Facilities management
As a result of full MMS implementation, the Authority now has a modern management approach to improve efficiency and reduce overall asset life cycle cost.
8
Incident Management Plan In response to the major historic snowstorm that occurred on December 18-19, 2009, the Authority met with the Federal Highway Administration’s Emergency Response Review Team to evaluate the Authority’s incident management program. The Federal recommendations were in the following categories:
Preparation and Planning; Public Safety; Communication – Internal; Communication – External; and Incident Management.
As a result of this review, when there is a prediction of a snow storm of 6”+ snow or a severe ice storm, the Authority prepares as follows: reallocation of available 4-wheel drive pickups to the snow fighting efforts; allowing critical maintenance managers to drive their trucks home during the snow season; prepositioning extra crews and equipment from Facilities, Heavy Equipment and Mechanic Shops to support road crews when severe weather is forecasted; establishing a maintenance command center at the central Beckley maintenance facility when severe weather is forecasted; purchasing extra supplies and equipment to assist during the actual snow event such as tire chains, tow straps, etc.; prepositioning a small supply of meals ready to eat and water for distribution by maintenance personnel (any large scale distribution will be handled by emergency agencies during extreme events); prepositioning four (4) heavy equipment tandem dump trucks to assist with snow plowing during periods of heavy snow fall; prepositioning a motor grader to assist with snow removal and freeing stranded vehicles; participating in pre-storm conference calls with the National Weather Service, WVDOH, Department of Homeland Security and Emergency Management and others to assess resources and validate the situation. In addition, four (4) emergency access gates were installed on the north end of the Turnpike. They are located along a section of the Turnpike that has a median concrete barrier wall that prevents motorists from detouring during emergencies. An Incident Management Plan has been established to include procedures to open the gates and designate detour routes during an emergency. The WVDOH used Federal Highway stimulus funds to install nineteen (19) new dynamic message signs and twenty-three (23) closed circuit TV cameras on the Turnpike and its feeder roads. The cameras are able to transmit data not only to the Turnpike Operations Center, but also to the West Virginia Division of Highways’ Traffic Management Center (TMC). The Authority’s radio system has been integrated into the TMC’s radio system and the system is being integrated with the 911 centers that service the Turnpike’s area. This robust system provides immediate notification if a 911 center is aware of an incident and, conversely, 911 centers have real time information on WVDOH and Authority incidents. In total, approximately $5.3 million in Federal Highway stimulus funds were provided to the Authority from the Department for the emergency gates, dynamic message signs, closed circuit television cameras, and the upgrades to the Authority’s traffic management center.
9
In April 2012, the Board approved the final Incident Management Plan which includes provisions for various detours in the event the Turnpike needs to be closed for any reason. When a detour is put into place, motorists will be assisted onto the detour via the use of overhead and portable message signs, traffic control, flaggers, police officers, media reports and the toll plaza personnel. As they are traveling on the detour route to reach their destination, the permanent detour signs will assure them that they are traveling in the right direction. These detour routes have to be able to accommodate tractor trailers and have amenities, such as food, gas and lodging. Traffic Management and Safety The Turnpike is patrolled by an up to 31 member group designated as Troop 7 of the West Virginia State Police who are responsible for traffic safety management and drug interdiction. With its 24-hour patrol, the State Police are dedicated to making the road safer by monitoring compliance with posted speed limits, assisting disabled motorists, detecting impaired drivers, and apprehending drug traffickers. Troop 7's efforts are strengthened by two Public Service Commission (PSC) officers whose focus is inspection and enforcement of commercial vehicle safety and operating regulations. The Authority also provides a "Courtesy Patrol" to assist Turnpike travelers with disabled vehicles. In winter, snow and ice removal is a top priority and major concern of the Maintenance Department. The Authority's annual operating budget includes funds necessary to adequately maintain safe highways during the winter storm season. Speed monitoring awareness radar trailers are employed to remind motorists of their speed. Rumble strips and eight inch edge lines are utilized to enhance the travel lane for the safety of motorists. In March 2012, the Board approved funds to design a new 2,200 square foot State Police detachment in Charleston located at MacCorkle Avenue Exit 95, Kanawha City. The existing building was constructed in the 1950’s and it was impractical and cost prohibitive to rehabilitate. This building was demolished in August 2012. This new building will be used by the State Police Troop 7 Parkways Division that serves the traveling public on the Turnpike. On August 8, 2013, Governor Earl Ray Tomblin chaired a meeting at the Administration Building in Charleston. Governor Tomblin presented a plaque of appreciation to the family of C. Cameron “Cam” Lewis, II for his years of distinguished service as Vice Chairman and for his outstanding and meritorious and unselfish service to the State of West Virginia. Mr. Lewis served on the Parkways Board from August 16, 2006 until his untimely death on March 18, 2013. A ceremony was held to dedicate the new State Police Troop 7 building to the memory of Cam Lewis. Mr. Lewis achieved a well-deserved reputation as a staunch supporter of West Virginia State Police Troop 7 and its commitment to law enforcement and safety on the West Virginia Turnpike. During 2015, a contract was awarded to build a new Beckley Maintenance and State Police facility. During 2016, Turnpike maintenance personnel were relocated and the old facilities were deconstructed. Construction was completed in the fall of 2016 and includes the State Police offices, three truck bays, fuel canopies, maintenance office space and training facilities, and a storage building. The location also includes a new salt storage building.
10
Upgraded Electronic Toll Collection System An upgraded toll collection system went online in December, 2011. The former system was over ten years old and in critical need of replacement. The toll system integrator, TransCore, was responsible for designing, installing, testing and maintaining the 5 plaza, 42-lane toll collection system. A notice to proceed was issued to TransCore, on October 8, 2010. The upgraded toll collection system replaced the lane software and lane equipment. In addition, all plaza, host and back office management software was replaced, and additional functionality such as on-line statements and renewals was added. Vehicles traveling the West Virginia Parkways continue to use the same toll rate schedule and vehicle classification based upon the number of axles and height of the vehicle. Customers using a West Virginia E-ZPass transponder will continue paying 13% less tolls than a Non West Virginia E-ZPass Customer and 20 to 35% lower tolls than cash-paying customers. The new system provided upgrades to the toll plaza signage and “stop and go” lights, but the customers did not see any major changes at the plazas. Customers have seen the most changes in their ability to access and manage their accounts on-line via the internet and with the added feature of electronic notifications. The new system has also added the software capability to track toll violations through the use of optical character recognition of license plates and automatically generate reports to assist in the collection of tolls. Rural Cell Towers Historically, due to the rural route of the Turnpike, there have been a number of cell phone “dead” zones which have been troubling to travelers. In 2014, Verizon constructed the first of seven proposed cell towers on the West Virginia Turnpike near the Chelyan Toll Plaza, Kanawha County, near milepost 82. These towers will eventually aid in providing continuous cell phone service along the Turnpike between Charleston and Beckley. Two more towers were completed in 2016 near the Morton Travel Plaza, Kanawha County, near milepost 72 and at exit 74 near Standard, WV Kanawha County. Required lease agreements for the remaining cell tower sites have been completed and their construction dates have not yet been finalized. Updated Website In May 2014, the Parkways Authority launched a new updated website at wvturnpike.com. This new site has many features that are helpful to patrons. The Parkways website is optimized for any device (such as a tablet or a smart phone). Staff has the ability to post alerts on the homepage. Travel Plazas and Tourist Information Centers The Authority has contracted with two private companies to operate restaurants and service stations at three travel plazas on the Turnpike. The facilities provide convenient service to Turnpike travelers and also serve as tourist information centers. On May 31, 2013, a trucker’s shower facility opened at the Beckley Travel Plaza. Tickets for the showers are being sold at the shower facility and by Petroleum Marketers, Inc., the fuel service provider. Attendants provide towels and other amenities to customers, and are available every day from 6:00 A.M. to 10:00 P.M.
11
Two other rest areas are accessible to southbound motorists. The rest area at mile 69 provides restrooms, snacks and sandwiches, and vending machines while the rest area at mile 18 has no facilities, but provides a scenic view. A new facility at the rest area at mile marker 69 is presently under construction with a completion date of May 2017. The structure was in dire need of replacement. The new facility will offer turnpike customers a modern, state of the art rest area with additional car parking and an upgraded snack shop. The Authority also operates the West Virginia Welcome Center, located near milepost 9, Princeton, WV, which contains restrooms, vending machines and tourist information. Retail shops featuring The Best of West Virginia handmade crafts, art and specialty foods are also located at the travel plazas and the Welcome Center. Long-Range Financial Planning The Authority is required by its Trust Indenture to prepare an annual budget prior to the start of each fiscal year. The adopted budget is used for control of operating and renewal and replacement expenditures and for financial planning. The budget is approved by the Authority, but does not require the approval of the State legislature. Additionally, the consulting engineer assists and presents the Authority each year with an updated needs assessment and five year plan. Economic Development and Tourism In 1989, the Authority became responsible for the promotion and enhancement of the State tourism industry and to assist in economic and tourism development opportunities. The Authority designated revenues from restaurants and service stations to be used for this new responsibility. No toll revenues were used for economic development and tourism projects. During the April 12, 2007 Authority board meeting, a resolution was passed to refocus the Authority's core and principal mission to operating and maintaining the Turnpike as a modern, efficient and safe roadway. All economic development and tourism projects, except Tamarack-the Best of West Virginia, have been eliminated. Legislation approved in 2010 further restricted the Authority from future involvement in any other economic development projects. Accounting Policies and Internal Controls The Authority's accounting policies are briefly described in Note 2 of the financial statements. Management of the Authority is responsible for establishing and maintaining internal controls designed to ensure that the assets of the Authority are protected from loss, theft, or misuse and to ensure that adequate accounting data are compiled to allow for the preparation of financial statements in conformity with accounting principles generally accepted in the United States of America. Internal controls are designed to provide reasonable, but not absolute, assurance that these objectives are met. The concept of reasonable assurance recognizes that: (1) the cost of a control should not exceed the benefits likely to be derived; and (2) the valuation of costs and benefits requires estimates and judgments by management.
12
In June 2012, the Authority voted to participate in the State of West Virginia’s Enterprise Resource Planning (ERP) project as an agency of the Department of Transportation. In 2014, the Authority began the transition to the State’s new ERP System. The State calls this project wvOASIS and it is a comprehensive suite of commercially available integrated modules that provide end-to-end support for statewide administrative functions. ERP includes personnel, payroll, procurement, accounts payable, accounting and project management. The Authority began using the new system on July 8, 2014 for financial and procurement purposes. Also, the new wvOASIS system is designed to provide for integration of Purchasing Card (“P-Card”) use to enhance the efficiencies of purchasing and reduce the number of disbursements as well as on-line reconciliation of monthly usage by P-Card holders. All purchasing policies, including bidding and approvals for different levels of purchasing authority, will still apply. The Authority participated in “Wave 2” implementation of the human resources and payroll modules which occurred in 2016. Tri-Party Agreement of 1988 and Trust Indentures In 1971, the Turnpike Commission, the Federal Highway Administration (FHWA), and the Department, adopted an agreement necessary for the Department to participate in the reconstruction of the Turnpike. This document charged the Turnpike Commission with the responsibility for all maintenance of the improved facility utilizing toll revenues. The 1971 agreement was superseded and replaced in 1988. The 1988 agreement specifies (a) that tolls collected be used only on the Turnpike for construction and reconstruction costs, and for costs necessary for operations, maintenance, payment and refinancing of debt service including resurfacing, reconstruction, rehabilitation and restoration; (b) that any bonds issued or any costs incurred will not cause tolls to be increased to an unreasonable amount, and that prior to issuing any bonds the Authority will notify the Department and FHWA of the total amount to be issued and the specific amounts and purposes for which proceeds of such bonds are to be used; and (c) that all records are subject to audit by the Department and/or FHWA. Operations of the Authority are also controlled by the provisions of a Trust Indenture, dated February 15, 1993, as supplemented. The indenture requires, among other things, the establishment and maintenance of various accounts, which are restricted to use for construction, renewal and replacement, operations and debt service. The Authority's Trustee works closely with staff to ensure the Authority is in compliance with the terms and covenants of the Bond Indenture and that all financial and operational decisions are made in the best interest of the Authority's bondholders. AWARDS AND ACKNOWLEDGEMENTS Independent Audit The trust indentures also require an annual audit by independent certified public accountants. The accounting firm of Suttle & Stalnaker, PLLC was engaged by the Authority to perform the audit for the fiscal years ended June 30, 2016 and 2015.
13
Awards The Government Finance Officers Association of the United States and Canada (GFOA) awarded a Certificate of Achievement for Excellence in Financial Reporting to the Authority for its comprehensive annual financial report for each of the 26 years through the period ended June 30, 2015, including the first year of operations of the Authority. In order to be awarded a Certificate of Achievement, a governmental unit must publish an easily readable and efficiently organized comprehensive annual financial report, the contents of which conform to program standards. Such reports must satisfy both generally accepted accounting principles and applicable legal requirements. A Certificate of Achievement is valid for a period of one year only. We believe that our current report continues to meet the Certificate of Achievement Program's requirements and we are submitting it to the GFOA to determine its eligibility for another certificate. Acknowledgements The preparation of this comprehensive annual financial report on a timely basis was made possible with the assistance of the Authority's administrative and accounting staff, the consulting engineers, the independent auditor, and the leadership and support of the Members of the West Virginia Parkways Authority. We express our sincere appreciation for the professional contributions made by these individuals in the preparation of this report.
Respectfully submitted, Gregory C. Barr, General Manager Parrish T. French, Director of Finance
14
15
Financial Section
West Virginia Parkways Authority
16
The Virginia Center 1411 Virginia Street, East Suite 100 Charleston, WV 25301 Phone (304) 343-4126 or 1(800) 788-3844 Fax (304) 343-8008
Towne Square 201 Third Street PO Box 149 Parkersburg, WV 26102 Phone (304) 485-6584 Fax (304) 485-0971
www.suttlecpas.com E-mail: [email protected] A Professional Limited Liability Company
INDEPENDENT AUDITOR’S REPORT To the Members of the West Virginia Parkways Authority Charleston, West Virginia Report on the Financial Statements We have audited the accompanying financial statements of the West Virginia Parkways Authority (the Authority), a component unit of the State of West Virginia, as of and for the years ended June 30, 2016 and 2015, and the related notes to the financial statements, which collectively comprise the Authority’s basic financial statements as listed in the table of contents. Management’s Responsibility for the Financial Statements Management is responsible for the preparation and fair presentation of these financial statements in accordance with accounting principles generally accepted in the United States of America; this includes the design, implementation, and maintenance of internal control relevant to the preparation and fair presentation of financial statements that are free from material misstatement, whether due to fraud or error. Auditor’s Responsibility Our responsibility is to express opinions on these financial statements based on our audits. We conducted our audits in accordance with auditing standards generally accepted in the United States of America. Those standards require that we plan and perform the audits to obtain reasonable assurance about whether the financial statements are free from material misstatement. An audit involves performing procedures to obtain audit evidence about the amounts and disclosures in the financial statements. The procedures selected depend on the auditor’s judgment, including the assessment of the risks of material misstatement of the financial statements, whether due to fraud or error. In making those risk assessments, the auditor considers internal control relevant to the entity’s preparation and fair presentation of the financial statements in order to design audit procedures that are appropriate in the circumstances, but not for the purpose of expressing an opinion on the effectiveness of the entity’s internal control. Accordingly, we express no such opinion. An audit also includes evaluating the appropriateness of accounting policies used and the reasonableness of significant accounting estimates made by management, as well as evaluating the overall presentation of the financial statements. We believe that the audit evidence we have obtained is sufficient and appropriate to provide a basis for our audit opinions.
17
Opinions In our opinion, the financial statements referred to above present fairly, in all material respects, the financial position of the Authority as of June 30, 2016 and 2015, and the respective changes in financial position and cash flows thereof for the years then ended in conformity with accounting principles generally accepted in the United States of America. Other Matters Required Supplementary Information Accounting principles generally accepted in the United States of America require that the management’s discussion and analysis on pages 19 through 24, the schedule of proportionate share of the net pension liability, and schedule of pension contributions, and related note on pages 53 through 55 be presented to supplement the basic financial statements. Such information, although not a part of the basic financial statements, is required by the Governmental Accounting Standards Board, who considers it to be an essential part of financial reporting for placing the basic financial statements in an appropriate operational, economic, or historical context. We have applied certain limited procedures to the required supplementary information in accordance with auditing standards generally accepted in the United States of America, which consisted of inquiries of management about the methods of preparing the information and comparing the information for consistency with management’s responses to our inquiries, the basic financial statements, and other knowledge we obtained during our audit of the basic financial statements. We do not express an opinion or provide any assurance on the information because the limited procedures do not provide us with sufficient evidence to express an opinion or provide any assurance. Other Information Our audit was conducted for the purpose of forming an opinion on the financial statements that collectively comprise the Authority’s basic financial statements. The introductory section and statistical section are presented for purposes of additional analysis and is not a required part of the basic financial statements. The introductory section and statistical section have not been subjected to the auditing procedures applied in the audit of the basic financial statements and, accordingly, we do not express an opinion or provide any assurance on them.
Charleston, West Virginia November 2, 2016
18
WEST VIRGINIA PARKWAYS AUTHORITY (A Component Unit of the State of West Virginia)
Management’s Discussion and Analysis (Unaudited) Years Ended June 30, 2016 and 2015
The management of the West Virginia Parkways Authority (hereinafter referred to as the Authority) offers this narrative overview and analysis of the Authority’s financial activities for the year ended June 30, 2016 which should be read in conjunction with the Authority’s basic financial statements. FINANCIAL HIGHLIGHTS The total number of transactions on the West Virginia Turnpike during fiscal year 2016 increased
3.0% from fiscal year 2015. The increase in transactions along with increased toll enforcement collections resulted in an increase in toll revenue of approximately $4.9 million or 5.5%.
In conjunction with the adoption of the new toll rate schedule in August 2009, the Authority
implemented a ten-year program to address the then approximately $335 million backlog of essential deferred maintenance and capital needs identified with the Authority’s consulting engineers. In addition to the increased activity of the Authority’s own maintenance staff, the Authority has utilized over $215.1 million of capital towards roadway reconstruction, rehabilitation and repair and other capital expenditures since the rate increase. At June 30, 2016, the Authority had contractual commitments totaling approximately $26.9 million for various Turnpike System improvement projects.
Excluding depreciation, operating expenses increased $1.0 million or 2.1% from 2015. Increases in
expenditures related to salt, damage claims and recoveries, guardrail replacement, and other maintenance expenses.
Basic Financial Statements The Authority accounts for its operations and financial transactions in a manner similar to that used by private business enterprises: the accrual basis of accounting. In these statements, revenue is recognized in the period in which it is earned, and an expense is recognized in the period in which it is incurred, regardless of the timing of its related cash flow. Overview of the Financial Statements This discussion and analysis are intended to serve as an introduction to the Authority’s basic financial statements. For each fiscal year, the Authority’s basic financial statements are comprised of the following:
Statements of Net Position
Statements of Revenues, Expenses and Changes in Net Position
Statements of Cash Flows
Notes to Financial Statements The Statements of Net Position present information on all of the Authority’s assets, deferred outflows of resources, liabilities, and deferred inflows of resources with the difference between the four reported as net position. Increases or decreases in net position, over time, may serve as a useful indicator of whether the financial position of the Authority is improving or deteriorating.
19
WEST VIRGINIA PARKWAYS AUTHORITY (A Component Unit of the State of West Virginia)
Management’s Discussion and Analysis (Unaudited) Years Ended June 30, 2016 and 2015
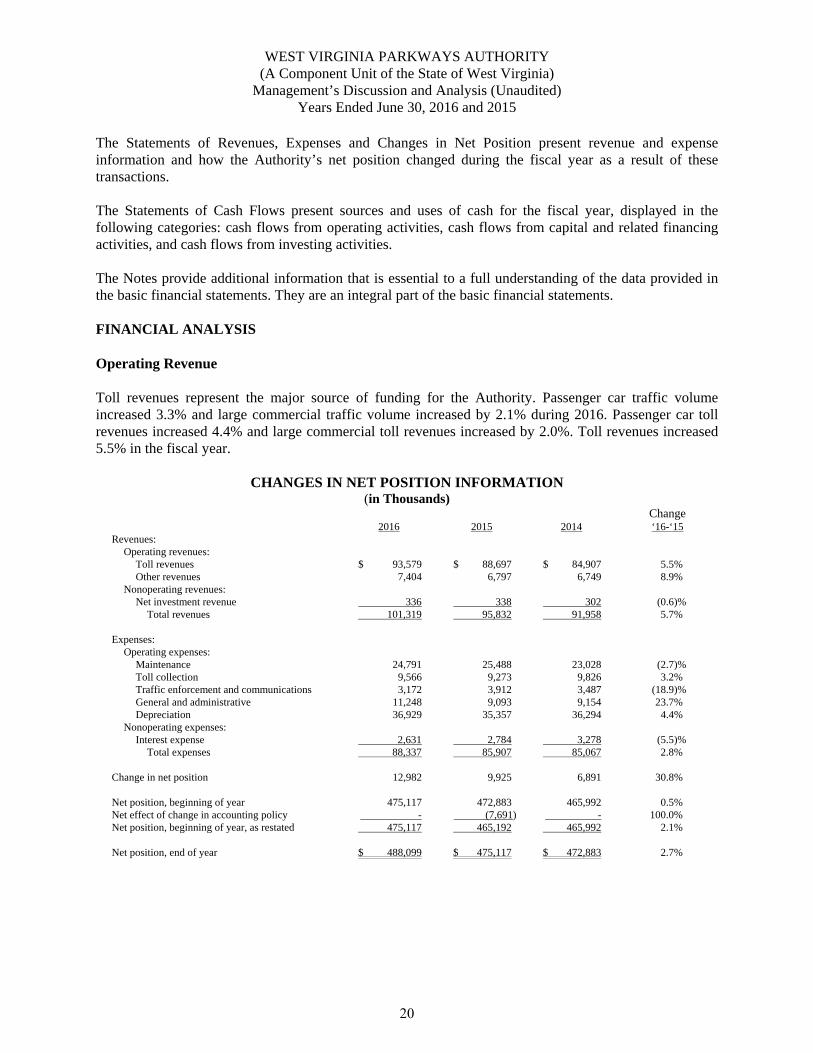
The Statements of Revenues, Expenses and Changes in Net Position present revenue and expense information and how the Authority’s net position changed during the fiscal year as a result of these transactions. The Statements of Cash Flows present sources and uses of cash for the fiscal year, displayed in the following categories: cash flows from operating activities, cash flows from capital and related financing activities, and cash flows from investing activities. The Notes provide additional information that is essential to a full understanding of the data provided in the basic financial statements. They are an integral part of the basic financial statements. FINANCIAL ANALYSIS Operating Revenue Toll revenues represent the major source of funding for the Authority. Passenger car traffic volume increased 3.3% and large commercial traffic volume increased by 2.1% during 2016. Passenger car toll revenues increased 4.4% and large commercial toll revenues increased by 2.0%. Toll revenues increased 5.5% in the fiscal year.
CHANGES IN NET POSITION INFORMATION (in Thousands)
Change 2016 2015 2014 ‘16-‘15
Revenues: Operating revenues: Toll revenues $ 93,579 $ 88,697 $ 84,907 5.5% Other revenues 7,404 6,797 6,749 8.9% Nonoperating revenues: Net investment revenue 336 338 302 (0.6)% Total revenues 101,319 95,832 91,958 5.7% Expenses: Operating expenses: Maintenance 24,791 25,488 23,028 (2.7)% Toll collection 9,566 9,273 9,826 3.2% Traffic enforcement and communications 3,172 3,912 3,487 (18.9)% General and administrative 11,248 9,093 9,154 23.7% Depreciation 36,929 35,357 36,294 4.4% Nonoperating expenses: Interest expense 2,631 2,784 3,278 (5.5)% Total expenses 88,337 85,907 85,067 2.8% Change in net position 12,982 9,925 6,891 30.8% Net position, beginning of year 475,117 472,883 465,992 0.5% Net effect of change in accounting policy - (7,691) - 100.0% Net position, beginning of year, as restated 475,117 465,192 465,992 2.1% Net position, end of year $ 488,099 $ 475,117 $ 472,883 2.7%
20
WEST VIRGINIA PARKWAYS AUTHORITY (A Component Unit of the State of West Virginia)
Management’s Discussion and Analysis (Unaudited) Years Ended June 30, 2016 and 2015
In early 2009, the Authority engaged its consulting engineer, HNTB Corporation, to make a recommendation based on its study of the Turnpike’s needs for estimated operating expenses, renewal and replacement requirements and essential deferred maintenance and capital needs. Factors prompting this decision included a combination of increasing costs and declining traffic and toll revenues exacerbated by the global economic recession, a growing backlog of essential deferred maintenance and capital needs and the potential for a technical default on the Turnpike Bonds. The technical default could have occurred if the Authority had adopted a fiscal year 2010 budget based on the old toll rate schedule and the debt service coverage requirement under its bond indentures had not been met. In April 2009, the consulting engineers recommended the Authority implement a ten-year program to address the backlog of essential deferred maintenance and capital needs estimated to cost $335 million. It was estimated that the Authority would need just over $20 million of additional revenue for fiscal year 2010 increasing each future fiscal year by approximately 4% per year for inflation and escalation. The additional toll revenue is anticipated to fully fund this program without the issuance of additional debt by the Authority. Concurrently, the Authority engaged its traffic engineer to study and report on recent transaction and revenue trends and to develop traffic and revenue forecasts under the previous toll rate schedule as well as under various levels of toll rates, and to make a recommendation as to the least increase in toll rates, combined with the largest discount for electronic toll customers, that is estimated to produce enough annual toll revenue to meet the ten year program as outlined by the consulting engineer. On July 1, 2009, the Authority adopted a new toll and discount rate schedule that became effective August 1, 2009. Cash toll rates were increased by approximately 60% from $1.25 to $2.00 per barrier for passenger cars and from $4.25 to $6.75 per barrier for 5-axle tractor-trailers. All other classes were increased proportionately. As required by State Code, discounts for all classes of vehicles paying by electronic transponders issued by the Parkways Authority were also adopted. For passenger cars, the discount for paying with an Authority issued E-ZPass® transponder is 35%. For commercial trucks, the discount for using any E-ZPass® is 13%, and for using an Authority issued E-ZPass® is 20%. Beginning in the fiscal year ended June 30, 2010, toll revenues exceeded projections allowing the Authority to proceed with the plan ahead of schedule. The Authority has utilized over $215.1 million of capital towards roadway reconstruction, rehabilitation and repair and other capital expenditures since the rate increase. Operating Expenses For the year ended June 30, 2016, total operating expenses increased 3.1% or $2.6 million. Depreciation expense increased $1.6 million due to the increasing amount of infrastructure projects being placed in service. Increases in other expenditures related to salt, damage claims and recoveries, guardrail replacement, and other maintenance expenses. For the year ended June 30, 2015, total operating expenses increased 1.6% or $1.3 million. Depreciation expense decreased due to infrastructure projects becoming fully depreciated. Other increases in expenditures related to snow and ice control expenses, damage claims and recoveries, guardrail replacement, and other maintenance expenses.
21
WEST VIRGINIA PARKWAYS AUTHORITY (A Component Unit of the State of West Virginia)
Management’s Discussion and Analysis (Unaudited) Years Ended June 30, 2016 and 2015
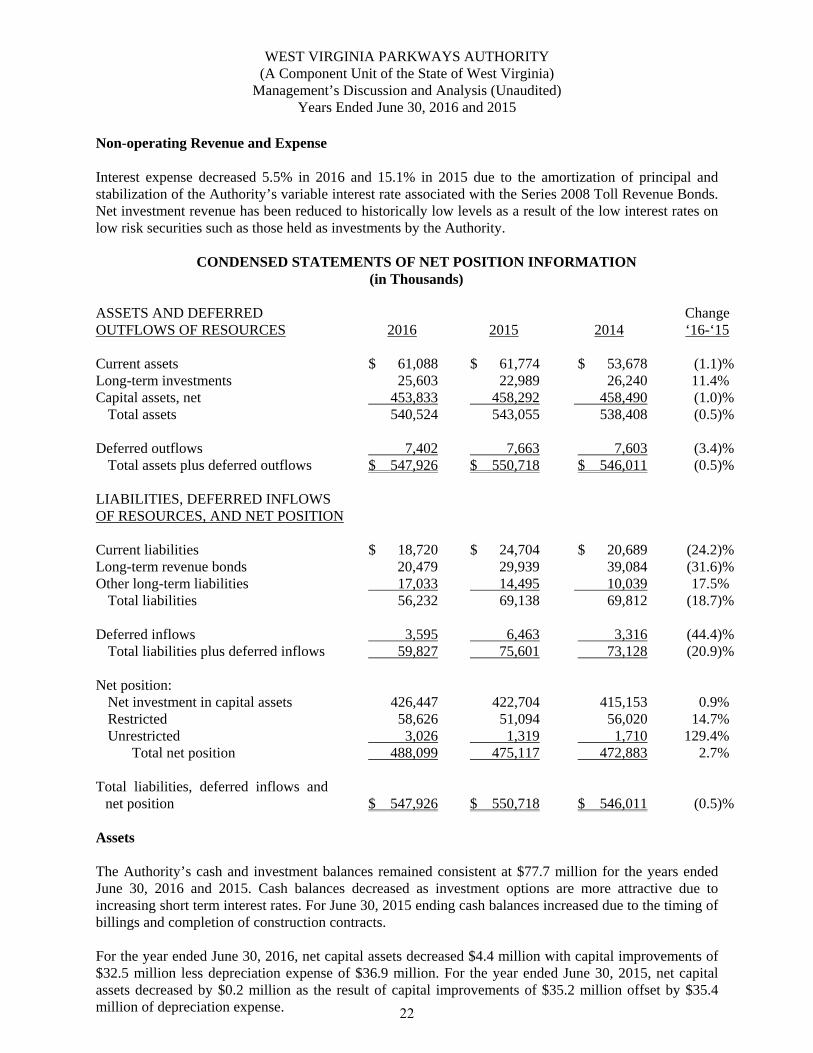
Non-operating Revenue and Expense Interest expense decreased 5.5% in 2016 and 15.1% in 2015 due to the amortization of principal and stabilization of the Authority’s variable interest rate associated with the Series 2008 Toll Revenue Bonds. Net investment revenue has been reduced to historically low levels as a result of the low interest rates on low risk securities such as those held as investments by the Authority.
CONDENSED STATEMENTS OF NET POSITION INFORMATION (in Thousands)
ASSETS AND DEFERRED OUTFLOWS OF RESOURCES 2016 2015 2014
Change ‘16-‘15
Current assets $ 61,088 $ 61,774 $ 53,678 (1.1)% Long-term investments 25,603 22,989 26,240 11.4% Capital assets, net 453,833 458,292 458,490 (1.0)% Total assets 540,524 543,055 538,408 (0.5)% Deferred outflows 7,402 7,663 7,603 (3.4)% Total assets plus deferred outflows $ 547,926 $ 550,718 $ 546,011 (0.5)% LIABILITIES, DEFERRED INFLOWS OF RESOURCES, AND NET POSITION Current liabilities $ 18,720 $ 24,704 $ 20,689 (24.2)% Long-term revenue bonds 20,479 29,939 39,084 (31.6)% Other long-term liabilities 17,033 14,495 10,039 17.5% Total liabilities 56,232 69,138 69,812 (18.7)% Deferred inflows 3,595 6,463 3,316 (44.4)% Total liabilities plus deferred inflows 59,827 75,601 73,128 (20.9)% Net position: Net investment in capital assets 426,447 422,704 415,153 0.9% Restricted 58,626 51,094 56,020 14.7% Unrestricted 3,026 1,319 1,710 129.4% Total net position 488,099 475,117 472,883 2.7% Total liabilities, deferred inflows and
net position $ 547,926 $ 550,718 $ 546,011 (0.5)% Assets The Authority’s cash and investment balances remained consistent at $77.7 million for the years ended June 30, 2016 and 2015. Cash balances decreased as investment options are more attractive due to increasing short term interest rates. For June 30, 2015 ending cash balances increased due to the timing of billings and completion of construction contracts. For the year ended June 30, 2016, net capital assets decreased $4.4 million with capital improvements of $32.5 million less depreciation expense of $36.9 million. For the year ended June 30, 2015, net capital assets decreased by $0.2 million as the result of capital improvements of $35.2 million offset by $35.4 million of depreciation expense. 22
WEST VIRGINIA PARKWAYS AUTHORITY (A Component Unit of the State of West Virginia)
Management’s Discussion and Analysis (Unaudited) Years Ended June 30, 2016 and 2015
Liabilities For the year ended June 30, 2016, total liabilities and deferred inflows of resources decreased $14.0 million. Current liabilities decreased due to the timing of invoices related to infrastructure projects in progress. Regularly scheduled principal maturities contributed to the decrease in long-term debt. Other long-term liabilities increased due to an increase in the net pension liability. The Authority’s credit ratings are among the best for similar facilities worldwide. The current agency ratings are as follows:
Agency Rating Standard & Poor’s AA- Moody’s Investors Service Aa3
CAPITAL ASSETS The Authority’s capital assets consist of land, buildings, equipment and infrastructure. Infrastructure assets are typically items that are immovable such as highways and bridges. The Authority’s investment in capital assets at June 30, 2016 amounted to approximately $1.179 billion of gross asset value with accumulated depreciation of approximately $725 million, leaving a net book value of approximately $454 million. Capital assets represented 82.6% of the Authority’s total assets and deferred outflows of resources at June 30, 2016. Additional information on the Authority’s capital assets can be found in the Note 5 to the financial statements. LONG-TERM DEBT In 2002, the Authority issued $44.2 million in Revenue Refunding Bonds which are due in varying installments through May 2019. These Bonds were issued for the express purpose of defeasing $36.0 million of the Authority’s Series 1993 Bonds. In 2008, the Authority issued $59.1 million of Variable Rate Demand Revenue Refunding Bonds which are due in varying installments through May 2019. These Bonds were issued for the express purpose of refunding $59.1 million of the Authority’s Series 2003 Bonds. Additional information on the Authority’s long-term liabilities activity can be found in Notes 6, 7, and 8 to the financial statements. FACTORS IMPACTING FUTURE OPERATIONS In August, 2012, the Governor established The West Virginia Blue Ribbon Highway Commission to study the condition and needs of the State’s transportation system and to develop a long-term strategic plan of action. The report was issued May 2015 and includes descriptions of potential funding options for the maintenance, construction and expansion of the State’s roadway system. Specific recommendations were made related to tolls on the West Virginia Turnpike and the long-term sustainability of the Authority.
23
WEST VIRGINIA PARKWAYS AUTHORITY (A Component Unit of the State of West Virginia)
Management’s Discussion and Analysis (Unaudited) Years Ended June 30, 2016 and 2015
CONTACTING THE AUTHORITY’S FINANCIAL MANAGEMENT This financial report is designed to provide our bondholders, patrons, and other interested parties with a general overview of the Authority’s finances and to demonstrate the Authority’s accountability for the money it receives. If you have questions about this report or need additional financial information, contact the West Virginia Parkways Authority, Director of Finance, P. O. Box 1469, Charleston, West Virginia 25325-1469.
24
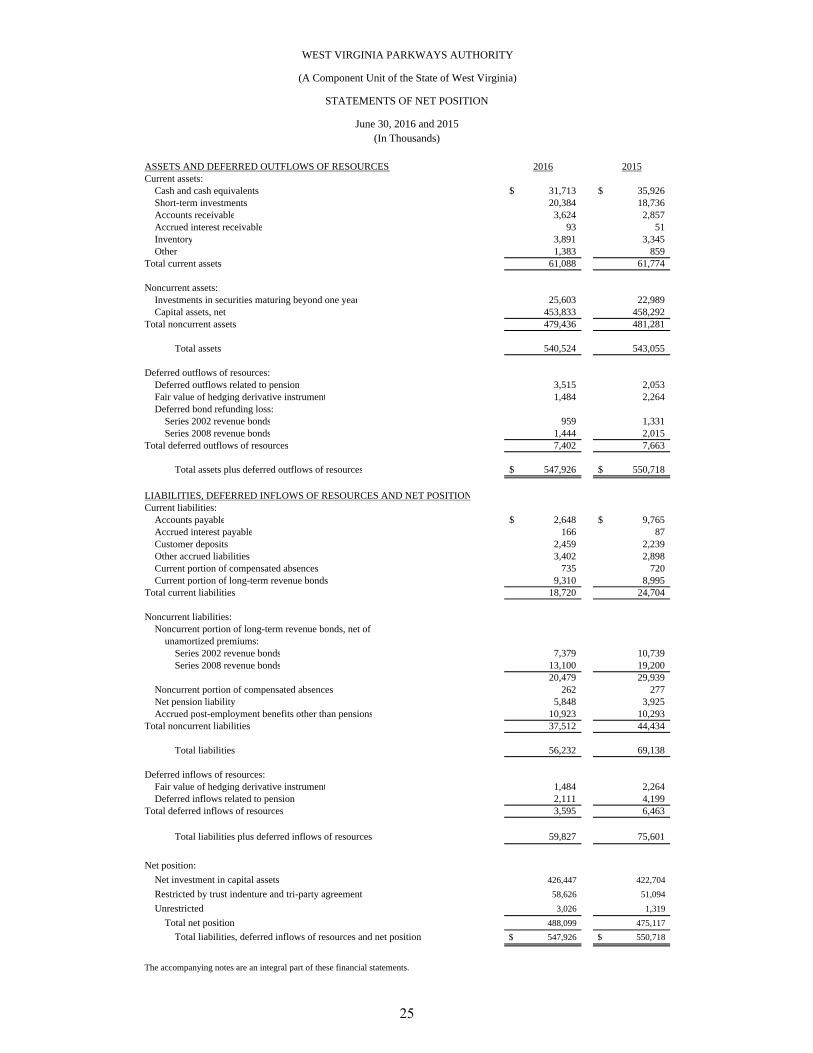
ASSETS AND DEFERRED OUTFLOWS OF RESOURCES 2016 2015Current assets:
Cash and cash equivalents 31,713$ 35,926$ Short-term investments 20,384 18,736 Accounts receivable 3,624 2,857 Accrued interest receivable 93 51 Inventory 3,891 3,345 Other 1,383 859
Total current assets 61,088 61,774
Noncurrent assets:Investments in securities maturing beyond one year 25,603 22,989 Capital assets, net 453,833 458,292
Total noncurrent assets 479,436 481,281
Total assets 540,524 543,055
Deferred outflows of resources:Deferred outflows related to pension 3,515 2,053 Fair value of hedging derivative instrument 1,484 2,264 Deferred bond refunding loss:
Series 2002 revenue bonds 959 1,331 Series 2008 revenue bonds 1,444 2,015
Total deferred outflows of resources 7,402 7,663
Total assets plus deferred outflows of resources 547,926$ 550,718$
LIABILITIES, DEFERRED INFLOWS OF RESOURCES AND NET POSITIONCurrent liabilities:
Accounts payable 2,648$ 9,765$ Accrued interest payable 166 87 Customer deposits 2,459 2,239 Other accrued liabilities 3,402 2,898 Current portion of compensated absences 735 720 Current portion of long-term revenue bonds 9,310 8,995
Total current liabilities 18,720 24,704
Noncurrent liabilities:Noncurrent portion of long-term revenue bonds, net of
unamortized premiums:Series 2002 revenue bonds 7,379 10,739 Series 2008 revenue bonds 13,100 19,200
20,479 29,939 Noncurrent portion of compensated absences 262 277 Net pension liability 5,848 3,925 Accrued post-employment benefits other than pensions 10,923 10,293
Total noncurrent liabilities 37,512 44,434
Total liabilities 56,232 69,138
Deferred inflows of resources:Fair value of hedging derivative instrument 1,484 2,264 Deferred inflows related to pension 2,111 4,199
Total deferred inflows of resources 3,595 6,463
Total liabilities plus deferred inflows of resources 59,827 75,601
Net position:Net investment in capital assets 426,447 422,704 Restricted by trust indenture and tri-party agreement 58,626 51,094 Unrestricted 3,026 1,319
Total net position 488,099 475,117 Total liabilities, deferred inflows of resources and net position 547,926$ 550,718$
The accompanying notes are an integral part of these financial statements.
(A Component Unit of the State of West Virginia)
WEST VIRGINIA PARKWAYS AUTHORITY
(In Thousands)June 30, 2016 and 2015
STATEMENTS OF NET POSITION
25
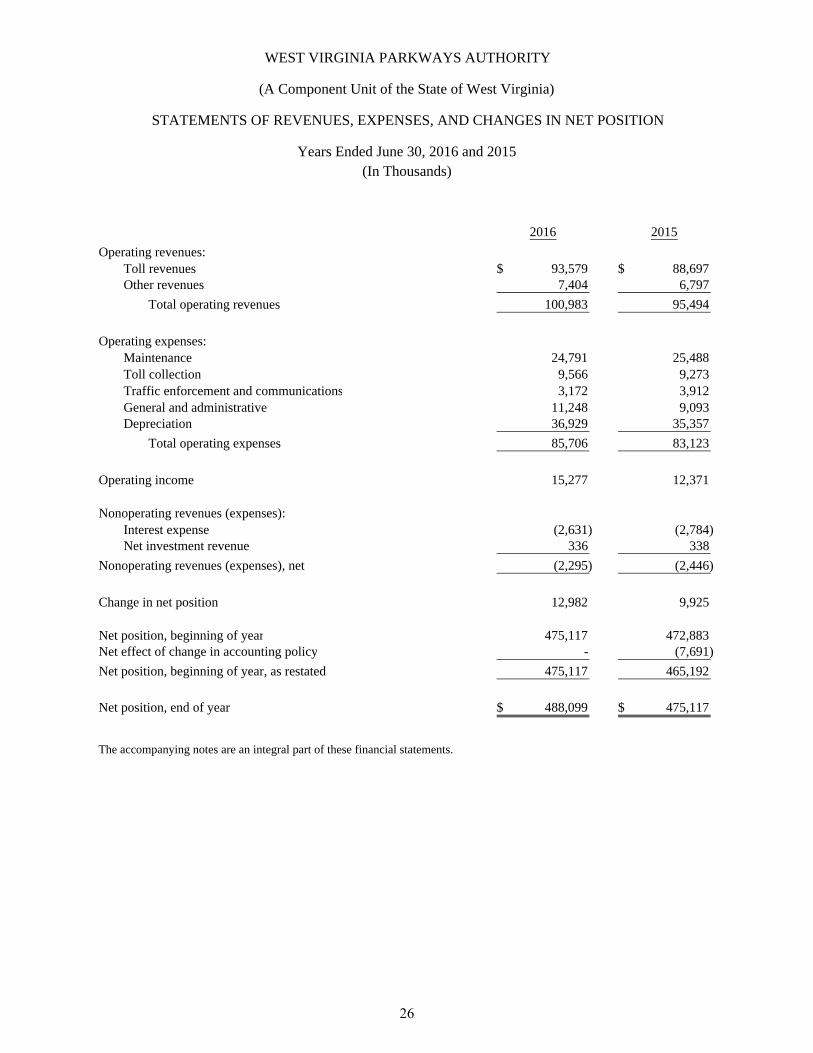
2016 2015Operating revenues:
Toll revenues 93,579$ 88,697$ Other revenues 7,404 6,797
Total operating revenues 100,983 95,494
Operating expenses:Maintenance 24,791 25,488 Toll collection 9,566 9,273 Traffic enforcement and communications 3,172 3,912 General and administrative 11,248 9,093 Depreciation 36,929 35,357
Total operating expenses 85,706 83,123
Operating income 15,277 12,371
Nonoperating revenues (expenses):Interest expense (2,631) (2,784) Net investment revenue 336 338
Nonoperating revenues (expenses), net (2,295) (2,446)
Change in net position 12,982 9,925
Net position, beginning of year 475,117 472,883 Net effect of change in accounting policy - (7,691) Net position, beginning of year, as restated 475,117 465,192
Net position, end of year 488,099$ 475,117$
The accompanying notes are an integral part of these financial statements.
WEST VIRGINIA PARKWAYS AUTHORITY
(In Thousands)Years Ended June 30, 2016 and 2015
STATEMENTS OF REVENUES, EXPENSES, AND CHANGES IN NET POSITION
(A Component Unit of the State of West Virginia)
26
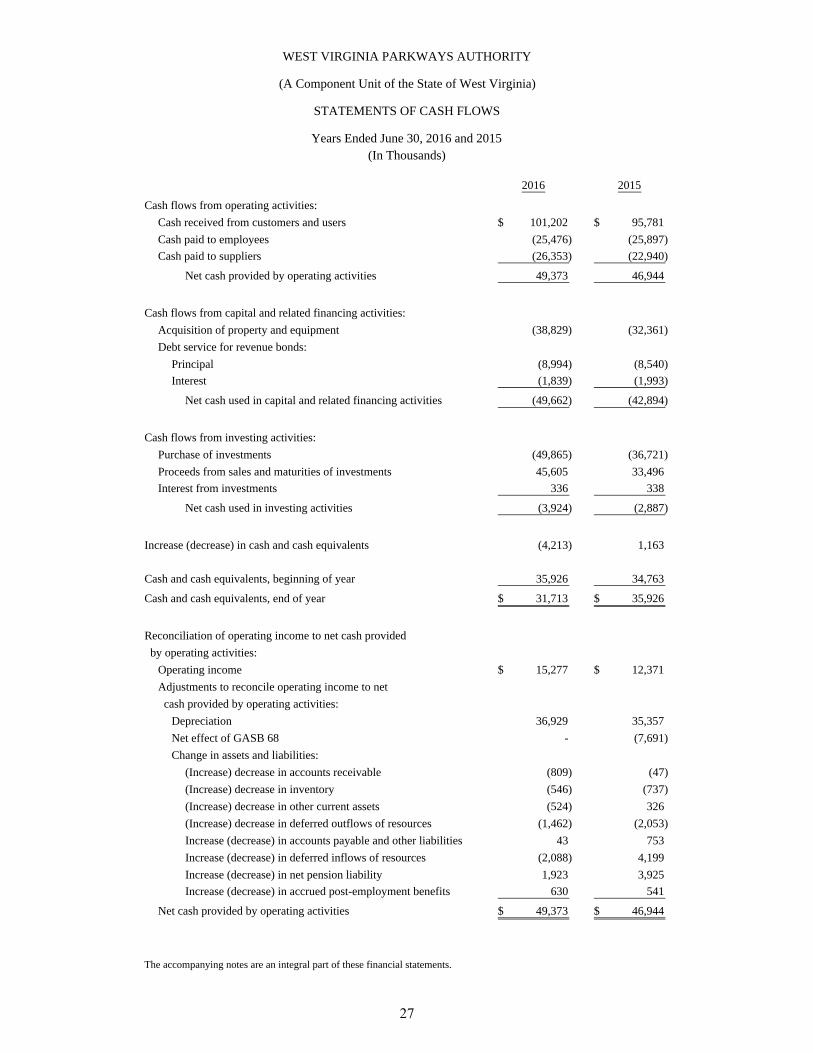
2016 2015
Cash flows from operating activities:Cash received from customers and users 101,202$ 95,781$ Cash paid to employees (25,476) (25,897) Cash paid to suppliers (26,353) (22,940)
Net cash provided by operating activities 49,373 46,944
Cash flows from capital and related financing activities:Acquisition of property and equipment (38,829) (32,361) Debt service for revenue bonds:
Principal (8,994) (8,540) Interest (1,839) (1,993)
Net cash used in capital and related financing activities (49,662) (42,894)
Cash flows from investing activities:Purchase of investments (49,865) (36,721) Proceeds from sales and maturities of investments 45,605 33,496 Interest from investments 336 338
Net cash used in investing activities (3,924) (2,887)
Increase (decrease) in cash and cash equivalents (4,213) 1,163
Cash and cash equivalents, beginning of year 35,926 34,763
Cash and cash equivalents, end of year 31,713$ 35,926$
Reconciliation of operating income to net cash provided by operating activities:
Operating income 15,277$ 12,371$ Adjustments to reconcile operating income to net cash provided by operating activities:
Depreciation 36,929 35,357 Net effect of GASB 68 - (7,691) Change in assets and liabilities:
(Increase) decrease in accounts receivable (809) (47) (Increase) decrease in inventory (546) (737) (Increase) decrease in other current assets (524) 326 (Increase) decrease in deferred outflows of resources (1,462) (2,053) Increase (decrease) in accounts payable and other liabilities 43 753 Increase (decrease) in deferred inflows of resources (2,088) 4,199 Increase (decrease) in net pension liability 1,923 3,925 Increase (decrease) in accrued post-employment benefits 630 541
Net cash provided by operating activities 49,373$ 46,944$
The accompanying notes are an integral part of these financial statements.
WEST VIRGINIA PARKWAYS AUTHORITY
(In Thousands)Years Ended June 30, 2016 and 2015
STATEMENTS OF CASH FLOWS
(A Component Unit of the State of West Virginia)
27
WEST VIRGINIA PARKWAYS AUTHORITY (A Component Unit of the State of West Virginia)
NOTES TO FINANCIAL STATEMENTS Years Ended June 30, 2016 and 2015
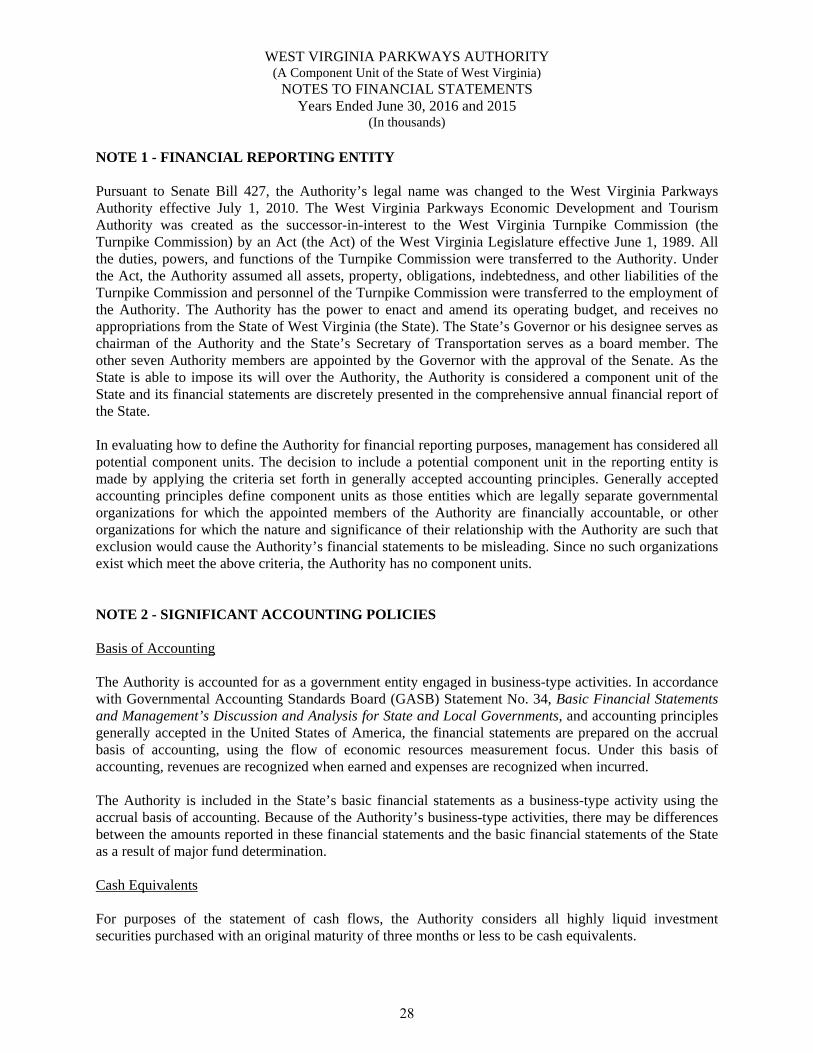
(In thousands) NOTE 1 - FINANCIAL REPORTING ENTITY Pursuant to Senate Bill 427, the Authority’s legal name was changed to the West Virginia Parkways Authority effective July 1, 2010. The West Virginia Parkways Economic Development and Tourism Authority was created as the successor-in-interest to the West Virginia Turnpike Commission (the Turnpike Commission) by an Act (the Act) of the West Virginia Legislature effective June 1, 1989. All the duties, powers, and functions of the Turnpike Commission were transferred to the Authority. Under the Act, the Authority assumed all assets, property, obligations, indebtedness, and other liabilities of the Turnpike Commission and personnel of the Turnpike Commission were transferred to the employment of the Authority. The Authority has the power to enact and amend its operating budget, and receives no appropriations from the State of West Virginia (the State). The State’s Governor or his designee serves as chairman of the Authority and the State’s Secretary of Transportation serves as a board member. The other seven Authority members are appointed by the Governor with the approval of the Senate. As the State is able to impose its will over the Authority, the Authority is considered a component unit of the State and its financial statements are discretely presented in the comprehensive annual financial report of the State. In evaluating how to define the Authority for financial reporting purposes, management has considered all potential component units. The decision to include a potential component unit in the reporting entity is made by applying the criteria set forth in generally accepted accounting principles. Generally accepted accounting principles define component units as those entities which are legally separate governmental organizations for which the appointed members of the Authority are financially accountable, or other organizations for which the nature and significance of their relationship with the Authority are such that exclusion would cause the Authority’s financial statements to be misleading. Since no such organizations exist which meet the above criteria, the Authority has no component units. NOTE 2 - SIGNIFICANT ACCOUNTING POLICIES Basis of Accounting The Authority is accounted for as a government entity engaged in business-type activities. In accordance with Governmental Accounting Standards Board (GASB) Statement No. 34, Basic Financial Statements and Management’s Discussion and Analysis for State and Local Governments, and accounting principles generally accepted in the United States of America, the financial statements are prepared on the accrual basis of accounting, using the flow of economic resources measurement focus. Under this basis of accounting, revenues are recognized when earned and expenses are recognized when incurred. The Authority is included in the State’s basic financial statements as a business-type activity using the accrual basis of accounting. Because of the Authority’s business-type activities, there may be differences between the amounts reported in these financial statements and the basic financial statements of the State as a result of major fund determination. Cash Equivalents For purposes of the statement of cash flows, the Authority considers all highly liquid investment securities purchased with an original maturity of three months or less to be cash equivalents.
28
WEST VIRGINIA PARKWAYS AUTHORITY (A Component Unit of the State of West Virginia)
NOTES TO FINANCIAL STATEMENTS Years Ended June 30, 2016 and 2015
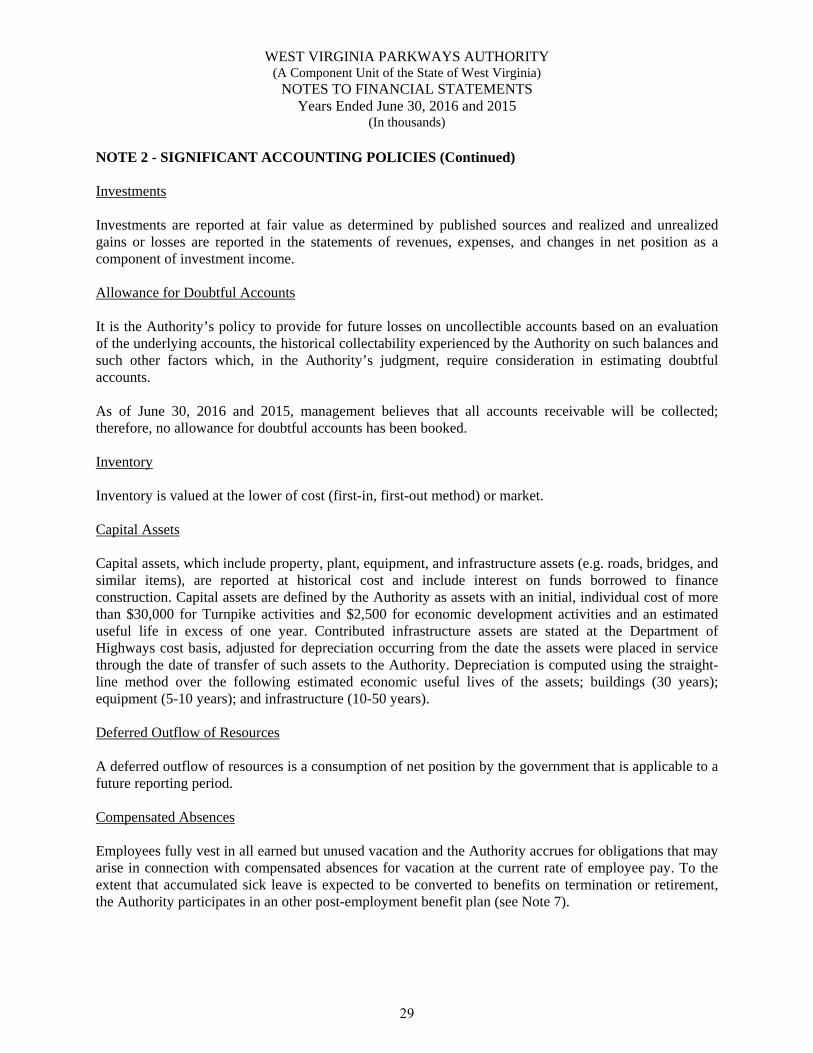
(In thousands) NOTE 2 - SIGNIFICANT ACCOUNTING POLICIES (Continued) Investments Investments are reported at fair value as determined by published sources and realized and unrealized gains or losses are reported in the statements of revenues, expenses, and changes in net position as a component of investment income. Allowance for Doubtful Accounts It is the Authority’s policy to provide for future losses on uncollectible accounts based on an evaluation of the underlying accounts, the historical collectability experienced by the Authority on such balances and such other factors which, in the Authority’s judgment, require consideration in estimating doubtful accounts. As of June 30, 2016 and 2015, management believes that all accounts receivable will be collected; therefore, no allowance for doubtful accounts has been booked. Inventory Inventory is valued at the lower of cost (first-in, first-out method) or market. Capital Assets Capital assets, which include property, plant, equipment, and infrastructure assets (e.g. roads, bridges, and similar items), are reported at historical cost and include interest on funds borrowed to finance construction. Capital assets are defined by the Authority as assets with an initial, individual cost of more than $30,000 for Turnpike activities and $2,500 for economic development activities and an estimated useful life in excess of one year. Contributed infrastructure assets are stated at the Department of Highways cost basis, adjusted for depreciation occurring from the date the assets were placed in service through the date of transfer of such assets to the Authority. Depreciation is computed using the straight-line method over the following estimated economic useful lives of the assets; buildings (30 years); equipment (5-10 years); and infrastructure (10-50 years). Deferred Outflow of Resources A deferred outflow of resources is a consumption of net position by the government that is applicable to a future reporting period. Compensated Absences Employees fully vest in all earned but unused vacation and the Authority accrues for obligations that may arise in connection with compensated absences for vacation at the current rate of employee pay. To the extent that accumulated sick leave is expected to be converted to benefits on termination or retirement, the Authority participates in an other post-employment benefit plan (see Note 7).
29
WEST VIRGINIA PARKWAYS AUTHORITY (A Component Unit of the State of West Virginia)
NOTES TO FINANCIAL STATEMENTS Years Ended June 30, 2016 and 2015
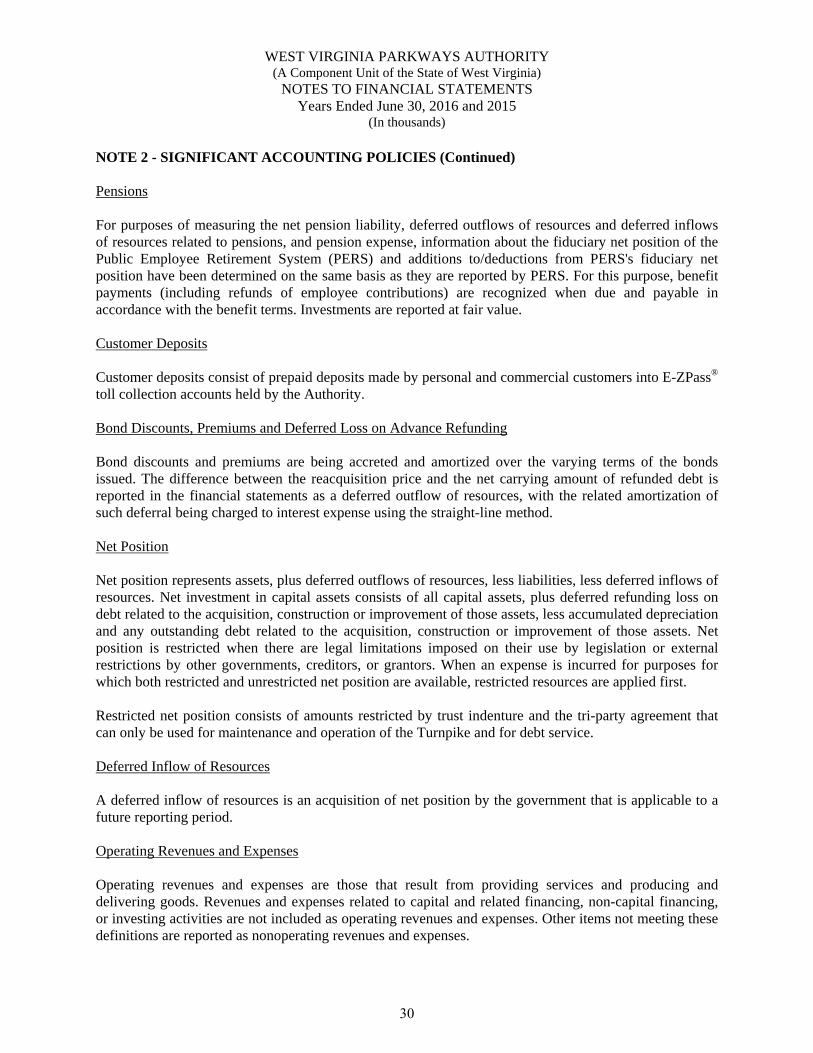
(In thousands) NOTE 2 - SIGNIFICANT ACCOUNTING POLICIES (Continued) Pensions For purposes of measuring the net pension liability, deferred outflows of resources and deferred inflows of resources related to pensions, and pension expense, information about the fiduciary net position of the Public Employee Retirement System (PERS) and additions to/deductions from PERS's fiduciary net position have been determined on the same basis as they are reported by PERS. For this purpose, benefit payments (including refunds of employee contributions) are recognized when due and payable in accordance with the benefit terms. Investments are reported at fair value. Customer Deposits Customer deposits consist of prepaid deposits made by personal and commercial customers into E-ZPass® toll collection accounts held by the Authority. Bond Discounts, Premiums and Deferred Loss on Advance Refunding Bond discounts and premiums are being accreted and amortized over the varying terms of the bonds issued. The difference between the reacquisition price and the net carrying amount of refunded debt is reported in the financial statements as a deferred outflow of resources, with the related amortization of such deferral being charged to interest expense using the straight-line method. Net Position Net position represents assets, plus deferred outflows of resources, less liabilities, less deferred inflows of resources. Net investment in capital assets consists of all capital assets, plus deferred refunding loss on debt related to the acquisition, construction or improvement of those assets, less accumulated depreciation and any outstanding debt related to the acquisition, construction or improvement of those assets. Net position is restricted when there are legal limitations imposed on their use by legislation or external restrictions by other governments, creditors, or grantors. When an expense is incurred for purposes for which both restricted and unrestricted net position are available, restricted resources are applied first. Restricted net position consists of amounts restricted by trust indenture and the tri-party agreement that can only be used for maintenance and operation of the Turnpike and for debt service. Deferred Inflow of Resources A deferred inflow of resources is an acquisition of net position by the government that is applicable to a future reporting period. Operating Revenues and Expenses Operating revenues and expenses are those that result from providing services and producing and delivering goods. Revenues and expenses related to capital and related financing, non-capital financing, or investing activities are not included as operating revenues and expenses. Other items not meeting these definitions are reported as nonoperating revenues and expenses.
30
WEST VIRGINIA PARKWAYS AUTHORITY (A Component Unit of the State of West Virginia)
NOTES TO FINANCIAL STATEMENTS Years Ended June 30, 2016 and 2015
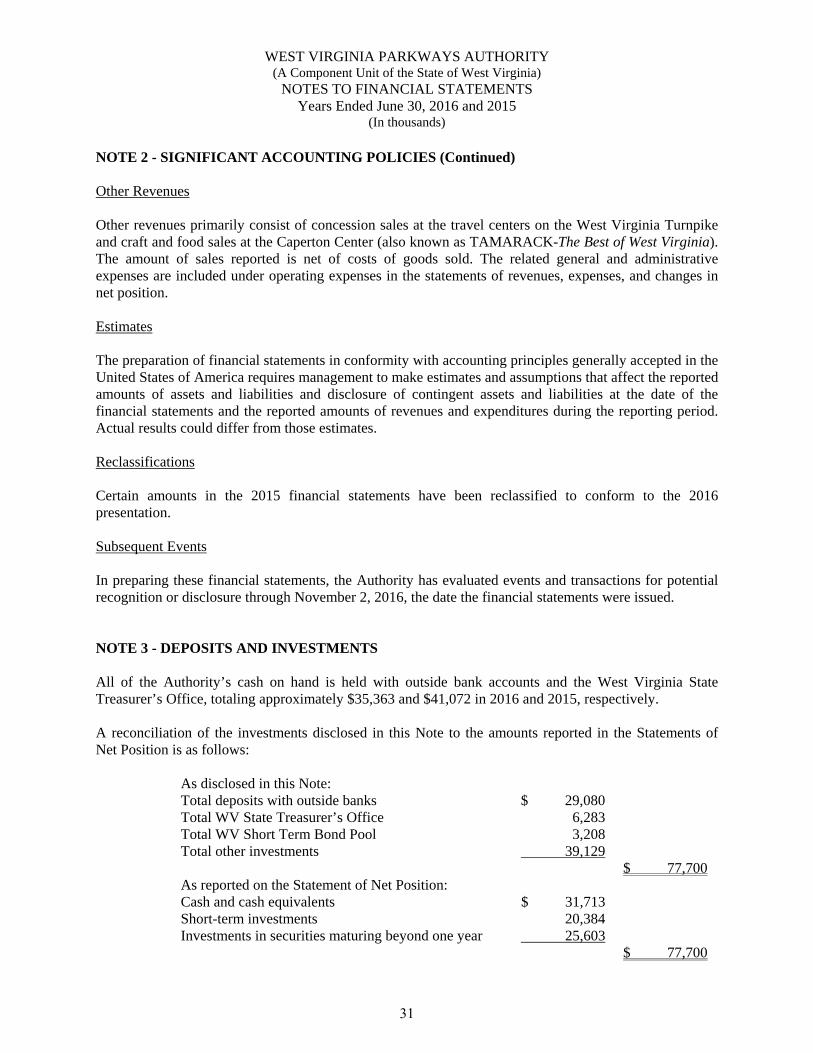
(In thousands) NOTE 2 - SIGNIFICANT ACCOUNTING POLICIES (Continued) Other Revenues Other revenues primarily consist of concession sales at the travel centers on the West Virginia Turnpike and craft and food sales at the Caperton Center (also known as TAMARACK-The Best of West Virginia). The amount of sales reported is net of costs of goods sold. The related general and administrative expenses are included under operating expenses in the statements of revenues, expenses, and changes in net position. Estimates The preparation of financial statements in conformity with accounting principles generally accepted in the United States of America requires management to make estimates and assumptions that affect the reported amounts of assets and liabilities and disclosure of contingent assets and liabilities at the date of the financial statements and the reported amounts of revenues and expenditures during the reporting period. Actual results could differ from those estimates. Reclassifications Certain amounts in the 2015 financial statements have been reclassified to conform to the 2016 presentation. Subsequent Events In preparing these financial statements, the Authority has evaluated events and transactions for potential recognition or disclosure through November 2, 2016, the date the financial statements were issued. NOTE 3 - DEPOSITS AND INVESTMENTS All of the Authority’s cash on hand is held with outside bank accounts and the West Virginia State Treasurer’s Office, totaling approximately $35,363 and $41,072 in 2016 and 2015, respectively. A reconciliation of the investments disclosed in this Note to the amounts reported in the Statements of Net Position is as follows:
As disclosed in this Note: Total deposits with outside banks $ 29,080 Total WV State Treasurer’s Office 6,283 Total WV Short Term Bond Pool 3,208 Total other investments 39,129 $ 77,700As reported on the Statement of Net Position: Cash and cash equivalents $ 31,713 Short-term investments 20,384 Investments in securities maturing beyond one year 25,603 $ 77,700
31
WEST VIRGINIA PARKWAYS AUTHORITY (A Component Unit of the State of West Virginia)
NOTES TO FINANCIAL STATEMENTS Years Ended June 30, 2016 and 2015
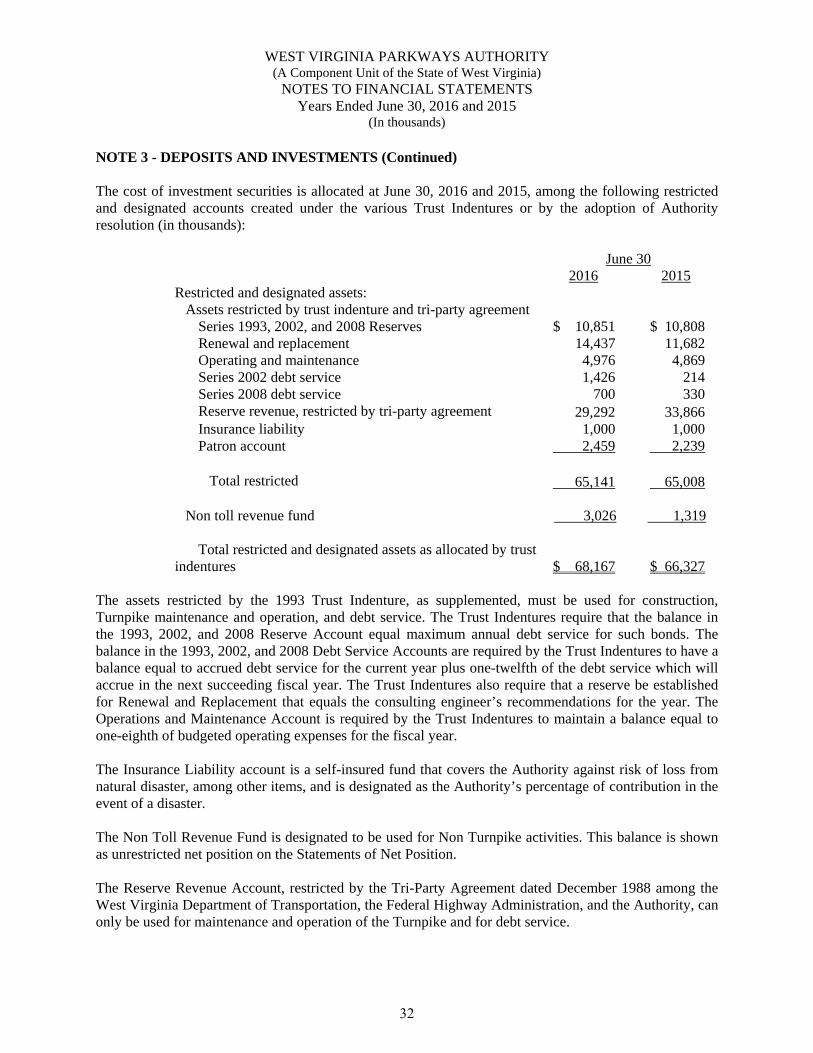
(In thousands) NOTE 3 - DEPOSITS AND INVESTMENTS (Continued) The cost of investment securities is allocated at June 30, 2016 and 2015, among the following restricted and designated accounts created under the various Trust Indentures or by the adoption of Authority resolution (in thousands):
June 30 2016 2015 Restricted and designated assets:
Assets restricted by trust indenture and tri-party agreement Series 1993, 2002, and 2008 Reserves $ 10,851 $ 10,808 Renewal and replacement 14,437 11,682 Operating and maintenance 4,976 4,869 Series 2002 debt service 1,426 214 Series 2008 debt service 700 330 Reserve revenue, restricted by tri-party agreement 29,292 33,866 Insurance liability 1,000 1,000 Patron account 2,459 2,239 Total restricted 65,141 65,008 Non toll revenue fund 3,026 1,319
Total restricted and designated assets as allocated by trust indentures $ 68,167 $ 66,327
The assets restricted by the 1993 Trust Indenture, as supplemented, must be used for construction, Turnpike maintenance and operation, and debt service. The Trust Indentures require that the balance in the 1993, 2002, and 2008 Reserve Account equal maximum annual debt service for such bonds. The balance in the 1993, 2002, and 2008 Debt Service Accounts are required by the Trust Indentures to have a balance equal to accrued debt service for the current year plus one-twelfth of the debt service which will accrue in the next succeeding fiscal year. The Trust Indentures also require that a reserve be established for Renewal and Replacement that equals the consulting engineer’s recommendations for the year. The Operations and Maintenance Account is required by the Trust Indentures to maintain a balance equal to one-eighth of budgeted operating expenses for the fiscal year. The Insurance Liability account is a self-insured fund that covers the Authority against risk of loss from natural disaster, among other items, and is designated as the Authority’s percentage of contribution in the event of a disaster.
The Non Toll Revenue Fund is designated to be used for Non Turnpike activities. This balance is shown as unrestricted net position on the Statements of Net Position. The Reserve Revenue Account, restricted by the Tri-Party Agreement dated December 1988 among the West Virginia Department of Transportation, the Federal Highway Administration, and the Authority, can only be used for maintenance and operation of the Turnpike and for debt service.
32
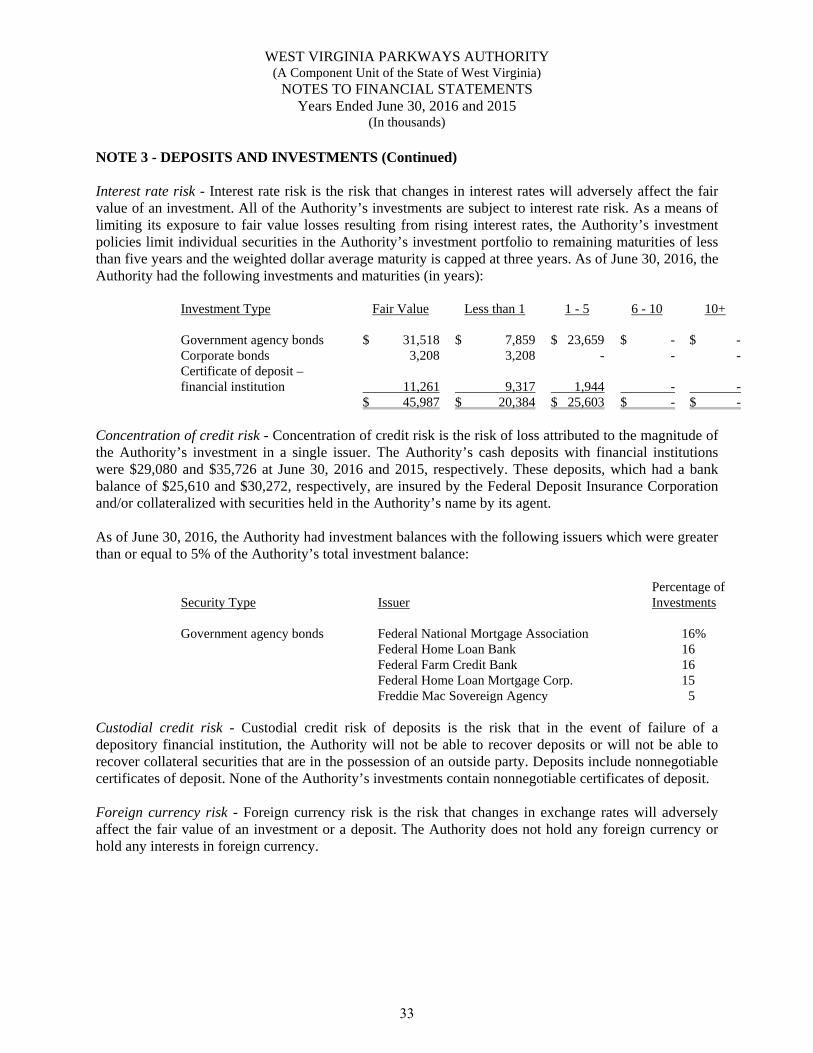
WEST VIRGINIA PARKWAYS AUTHORITY (A Component Unit of the State of West Virginia)
NOTES TO FINANCIAL STATEMENTS Years Ended June 30, 2016 and 2015
(In thousands) NOTE 3 - DEPOSITS AND INVESTMENTS (Continued) Interest rate risk - Interest rate risk is the risk that changes in interest rates will adversely affect the fair value of an investment. All of the Authority’s investments are subject to interest rate risk. As a means of limiting its exposure to fair value losses resulting from rising interest rates, the Authority’s investment policies limit individual securities in the Authority’s investment portfolio to remaining maturities of less than five years and the weighted dollar average maturity is capped at three years. As of June 30, 2016, the Authority had the following investments and maturities (in years):
Investment Type Fair Value Less than 1 1 - 5 6 - 10 10+ Government agency bonds $ 31,518 $ 7,859 $ 23,659 $ - $ - Corporate bonds 3,208 3,208 - - - Certificate of deposit – financial institution 11,261 9,317 1,944 - - $ 45,987 $ 20,384 $ 25,603 $ - $ -
Concentration of credit risk - Concentration of credit risk is the risk of loss attributed to the magnitude of the Authority’s investment in a single issuer. The Authority’s cash deposits with financial institutions were $29,080 and $35,726 at June 30, 2016 and 2015, respectively. These deposits, which had a bank balance of $25,610 and $30,272, respectively, are insured by the Federal Deposit Insurance Corporation and/or collateralized with securities held in the Authority’s name by its agent. As of June 30, 2016, the Authority had investment balances with the following issuers which were greater than or equal to 5% of the Authority’s total investment balance:
Percentage of Security Type Issuer Investments Government agency bonds Federal National Mortgage Association 16% Federal Home Loan Bank 16 Federal Farm Credit Bank 16 Federal Home Loan Mortgage Corp. 15 Freddie Mac Sovereign Agency 5
Custodial credit risk - Custodial credit risk of deposits is the risk that in the event of failure of a depository financial institution, the Authority will not be able to recover deposits or will not be able to recover collateral securities that are in the possession of an outside party. Deposits include nonnegotiable certificates of deposit. None of the Authority’s investments contain nonnegotiable certificates of deposit. Foreign currency risk - Foreign currency risk is the risk that changes in exchange rates will adversely affect the fair value of an investment or a deposit. The Authority does not hold any foreign currency or hold any interests in foreign currency.
33
WEST VIRGINIA PARKWAYS AUTHORITY (A Component Unit of the State of West Virginia)
NOTES TO FINANCIAL STATEMENTS Years Ended June 30, 2016 and 2015
(In thousands) NOTE 3 - DEPOSITS AND INVESTMENTS (Continued) BTI DISCLOSURE INFORMATION The West Virginia Board of Treasury Investment (BTI) has adopted an investment policy in accordance with the “Uniform Prudent Investor Act.” The “prudent investor rule” guides those with responsibility for investing the money for others. Such fiduciaries must act as a prudent person would be expected to act, with discretion and intelligence, to seek reasonable income, preserve capital, and, in general, avoid speculative investments. The BTI’s investment policy is to invest assets in a manner that strives for maximum safety, provides adequate liquidity to meet all operating requirements, and achieves the highest possible investment return consistent with the primary objectives of safety and liquidity. The BTI recognizes that risk, volatility, and the possibility of loss in purchasing power are present to some degree in all types of investments. Due to the short-term nature of BTI’s Consolidated Fund, the BTI believes that it is imperative to review and adjust the investment policy in reaction to interest rate market fluctuations/trends on a regular basis and has adopted a formal review schedule. Investment policies have been established for each investment pool and account of the BTI’s Consolidated Fund. Of the BTI’s Consolidated Fund pools and accounts in which the Authority invests, all are subject to credit risk. WV Short Term Bond Pool: Credit Risk — The BTI limits the exposure to credit risk in the WV Short Term Bond Pool by requiring all corporate bonds to be rated BBB- or higher by Standard & Poor’s (or its equivalent). Commercial paper must be rated at least A-1 by Standard & Poor’s and P-1 by Moody’s. Mortgage-backed and asset-backed securities must be rated AAA by Standard & Poor’s and Aaa by Moody’s. The pool must have at least 15% of its assets in U.S. Treasury obligations or obligations guaranteed as to repayment of interest and principal by the United States of America. As this pool has not been rated, the following table provides information on the credit ratings of the WV Short Term Bond Pool’s investments.
34
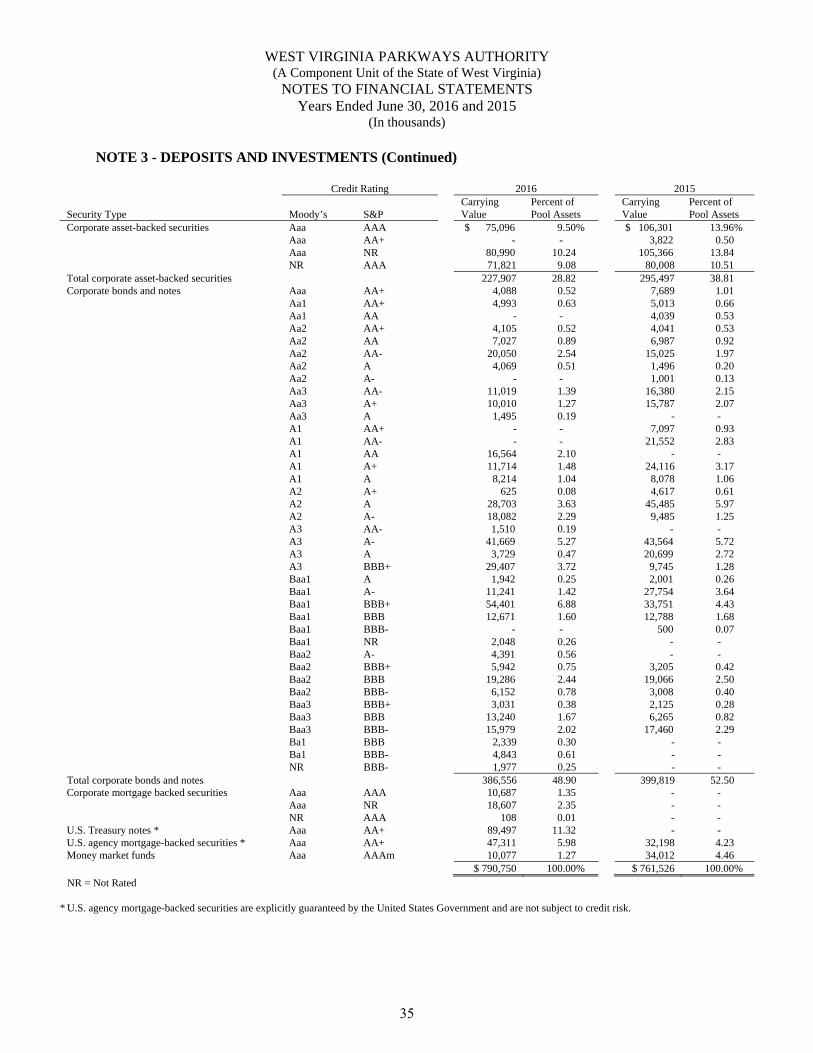
WEST VIRGINIA PARKWAYS AUTHORITY (A Component Unit of the State of West Virginia)
NOTES TO FINANCIAL STATEMENTS Years Ended June 30, 2016 and 2015
(In thousands) NOTE 3 - DEPOSITS AND INVESTMENTS (Continued)
Credit Rating 2016 2015 Security Type
Moody’s
S&P
Carrying Value
Percent of Pool Assets
Carrying Value
Percent of Pool Assets
Corporate asset-backed securities Aaa AAA $ 75,096 9.50% $ 106,301 13.96% Aaa AA+ - - 3,822 0.50 Aaa NR 80,990 10.24 105,366 13.84 NR AAA 71,821 9.08 80,008 10.51 Total corporate asset-backed securities 227,907 28.82 295,497 38.81 Corporate bonds and notes Aaa AA+ 4,088 0.52 7,689 1.01 Aa1 AA+ 4,993 0.63 5,013 0.66 Aa1 AA - - 4,039 0.53 Aa2 AA+ 4,105 0.52 4,041 0.53 Aa2 AA 7,027 0.89 6,987 0.92 Aa2 AA- 20,050 2.54 15,025 1.97 Aa2 A 4,069 0.51 1,496 0.20 Aa2 A- - - 1,001 0.13 Aa3 AA- 11,019 1.39 16,380 2.15 Aa3 A+ 10,010 1.27 15,787 2.07 Aa3 A 1,495 0.19 - - A1 AA+ - - 7,097 0.93 A1 AA- - - 21,552 2.83 A1 AA 16,564 2.10 - - A1 A+ 11,714 1.48 24,116 3.17 A1 A 8,214 1.04 8,078 1.06 A2 A+ 625 0.08 4,617 0.61 A2 A 28,703 3.63 45,485 5.97 A2 A- 18,082 2.29 9,485 1.25 A3 AA- 1,510 0.19 - - A3 A- 41,669 5.27 43,564 5.72 A3 A 3,729 0.47 20,699 2.72 A3 BBB+ 29,407 3.72 9,745 1.28 Baa1 A 1,942 0.25 2,001 0.26 Baa1 A- 11,241 1.42 27,754 3.64 Baa1 BBB+ 54,401 6.88 33,751 4.43 Baa1 BBB 12,671 1.60 12,788 1.68 Baa1 BBB- - - 500 0.07 Baa1 NR 2,048 0.26 - - Baa2 A- 4,391 0.56 - - Baa2 BBB+ 5,942 0.75 3,205 0.42 Baa2 BBB 19,286 2.44 19,066 2.50 Baa2 BBB- 6,152 0.78 3,008 0.40 Baa3 BBB+ 3,031 0.38 2,125 0.28 Baa3 BBB 13,240 1.67 6,265 0.82 Baa3 BBB- 15,979 2.02 17,460 2.29 Ba1 BBB 2,339 0.30 - - Ba1 BBB- 4,843 0.61 - - NR BBB- 1,977 0.25 - - Total corporate bonds and notes 386,556 48.90 399,819 52.50 Corporate mortgage backed securities Aaa AAA 10,687 1.35 - - Aaa NR 18,607 2.35 - - NR AAA 108 0.01 - - U.S. Treasury notes * Aaa AA+ 89,497 11.32 - - U.S. agency mortgage-backed securities * Aaa AA+ 47,311 5.98 32,198 4.23 Money market funds Aaa AAAm 10,077 1.27 34,012 4.46 $ 790,750 100.00% $ 761,526 100.00%
NR = Not Rated * U.S. agency mortgage-backed securities are explicitly guaranteed by the United States Government and are not subject to credit risk.
35
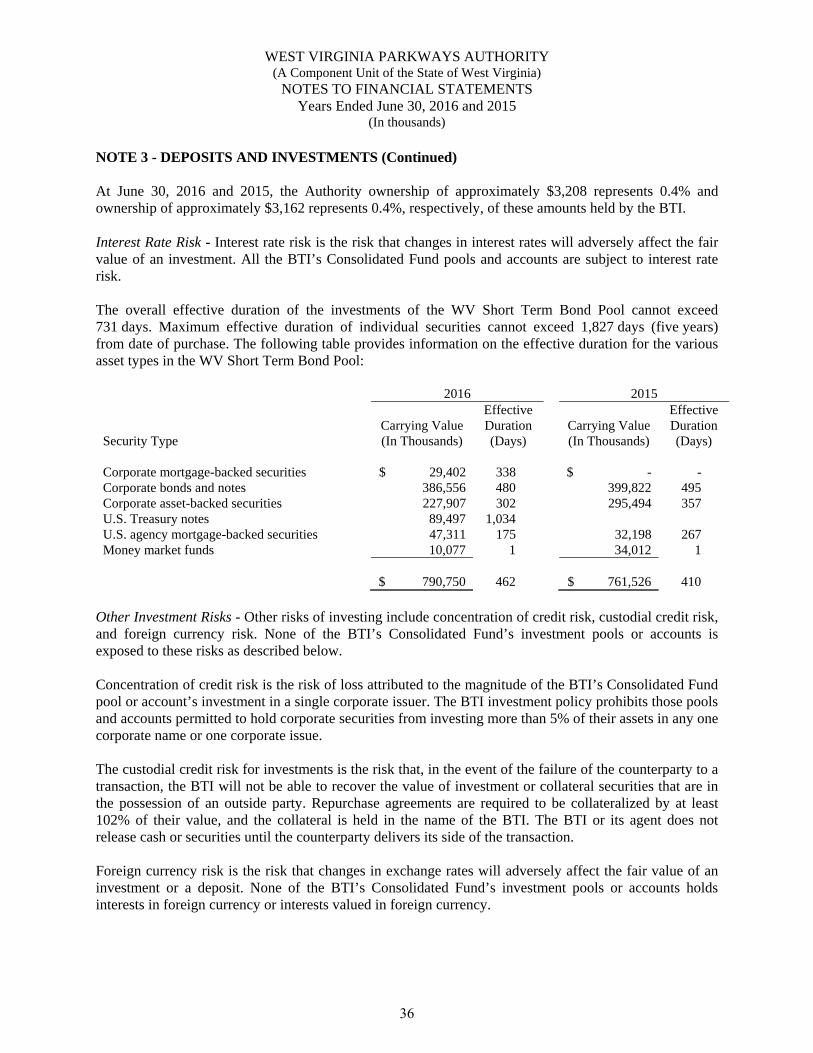
WEST VIRGINIA PARKWAYS AUTHORITY (A Component Unit of the State of West Virginia)
NOTES TO FINANCIAL STATEMENTS Years Ended June 30, 2016 and 2015
(In thousands) NOTE 3 - DEPOSITS AND INVESTMENTS (Continued) At June 30, 2016 and 2015, the Authority ownership of approximately $3,208 represents 0.4% and ownership of approximately $3,162 represents 0.4%, respectively, of these amounts held by the BTI. Interest Rate Risk - Interest rate risk is the risk that changes in interest rates will adversely affect the fair value of an investment. All the BTI’s Consolidated Fund pools and accounts are subject to interest rate risk. The overall effective duration of the investments of the WV Short Term Bond Pool cannot exceed 731 days. Maximum effective duration of individual securities cannot exceed 1,827 days (five years) from date of purchase. The following table provides information on the effective duration for the various asset types in the WV Short Term Bond Pool:
2016 2015
Security Type Carrying Value (In Thousands)
Effective Duration (Days)
Carrying Value (In Thousands)
Effective Duration (Days)
Corporate mortgage-backed securities $ 29,402 338 $ - - Corporate bonds and notes 386,556 480 399,822 495 Corporate asset-backed securities 227,907 302 295,494 357 U.S. Treasury notes 89,497 1,034 U.S. agency mortgage-backed securities 47,311 175 32,198 267 Money market funds 10,077 1 34,012 1 $ 790,750 462 $ 761,526 410
Other Investment Risks - Other risks of investing include concentration of credit risk, custodial credit risk, and foreign currency risk. None of the BTI’s Consolidated Fund’s investment pools or accounts is exposed to these risks as described below. Concentration of credit risk is the risk of loss attributed to the magnitude of the BTI’s Consolidated Fund pool or account’s investment in a single corporate issuer. The BTI investment policy prohibits those pools and accounts permitted to hold corporate securities from investing more than 5% of their assets in any one corporate name or one corporate issue. The custodial credit risk for investments is the risk that, in the event of the failure of the counterparty to a transaction, the BTI will not be able to recover the value of investment or collateral securities that are in the possession of an outside party. Repurchase agreements are required to be collateralized by at least 102% of their value, and the collateral is held in the name of the BTI. The BTI or its agent does not release cash or securities until the counterparty delivers its side of the transaction. Foreign currency risk is the risk that changes in exchange rates will adversely affect the fair value of an investment or a deposit. None of the BTI’s Consolidated Fund’s investment pools or accounts holds interests in foreign currency or interests valued in foreign currency.
36
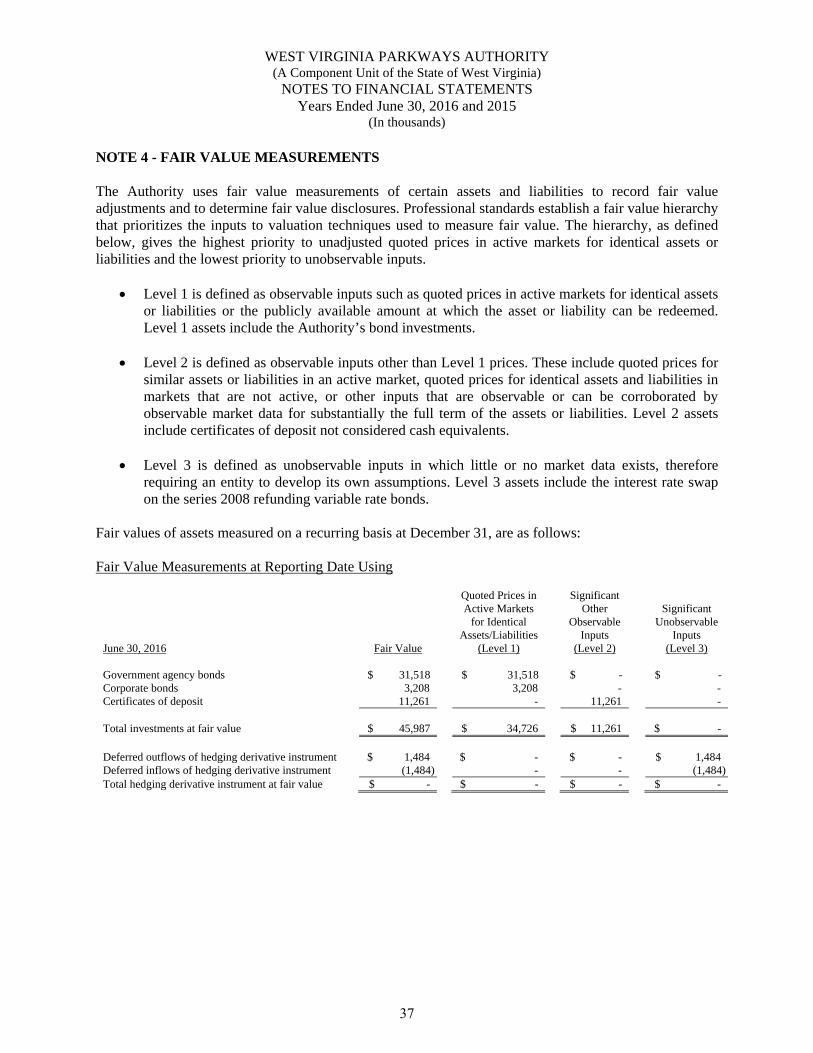
WEST VIRGINIA PARKWAYS AUTHORITY (A Component Unit of the State of West Virginia)
NOTES TO FINANCIAL STATEMENTS Years Ended June 30, 2016 and 2015
(In thousands) NOTE 4 - FAIR VALUE MEASUREMENTS The Authority uses fair value measurements of certain assets and liabilities to record fair value adjustments and to determine fair value disclosures. Professional standards establish a fair value hierarchy that prioritizes the inputs to valuation techniques used to measure fair value. The hierarchy, as defined below, gives the highest priority to unadjusted quoted prices in active markets for identical assets or liabilities and the lowest priority to unobservable inputs.
Level 1 is defined as observable inputs such as quoted prices in active markets for identical assets or liabilities or the publicly available amount at which the asset or liability can be redeemed. Level 1 assets include the Authority’s bond investments.
Level 2 is defined as observable inputs other than Level 1 prices. These include quoted prices for
similar assets or liabilities in an active market, quoted prices for identical assets and liabilities in markets that are not active, or other inputs that are observable or can be corroborated by observable market data for substantially the full term of the assets or liabilities. Level 2 assets include certificates of deposit not considered cash equivalents.
Level 3 is defined as unobservable inputs in which little or no market data exists, therefore
requiring an entity to develop its own assumptions. Level 3 assets include the interest rate swap on the series 2008 refunding variable rate bonds.
Fair values of assets measured on a recurring basis at December 31, are as follows: Fair Value Measurements at Reporting Date Using
June 30, 2016 Fair Value
Quoted Prices in Active Markets
for Identical Assets/Liabilities
(Level 1)
Significant
Other Observable
Inputs (Level 2)
Significant Unobservable
Inputs (Level 3)
Government agency bonds $ 31,518 $ 31,518 $ - $ - Corporate bonds 3,208 3,208 - - Certificates of deposit 11,261 - 11,261 -
Total investments at fair value $ 45,987 $ 34,726 $ 11,261 $ - Deferred outflows of hedging derivative instrument $ 1,484 $ - $ - $ 1,484 Deferred inflows of hedging derivative instrument (1,484) - - (1,484)Total hedging derivative instrument at fair value $ - $ - $ - $ -
37
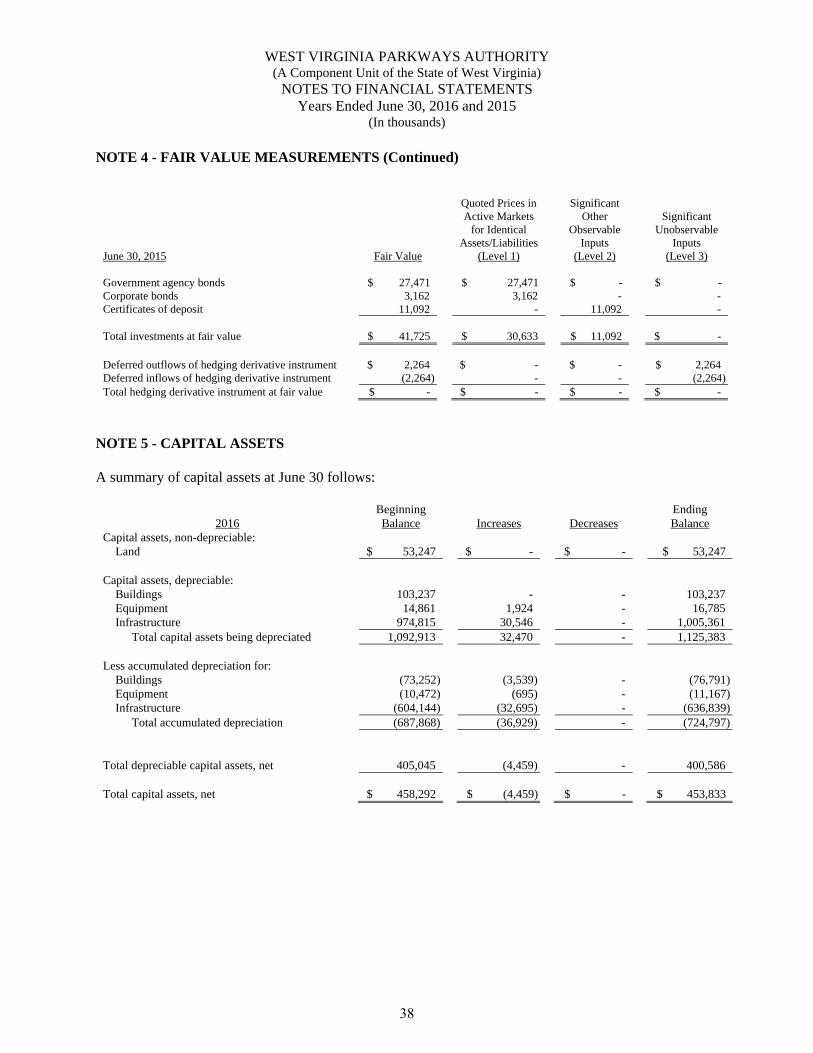
WEST VIRGINIA PARKWAYS AUTHORITY (A Component Unit of the State of West Virginia)
NOTES TO FINANCIAL STATEMENTS Years Ended June 30, 2016 and 2015
(In thousands) NOTE 4 - FAIR VALUE MEASUREMENTS (Continued)
June 30, 2015 Fair Value
Quoted Prices in Active Markets
for Identical Assets/Liabilities
(Level 1)
Significant
Other Observable
Inputs (Level 2)
Significant Unobservable
Inputs (Level 3)
Government agency bonds $ 27,471 $ 27,471 $ - $ - Corporate bonds 3,162 3,162 - - Certificates of deposit 11,092 - 11,092 -
Total investments at fair value $ 41,725 $ 30,633 $ 11,092 $ - Deferred outflows of hedging derivative instrument $ 2,264 $ - $ - $ 2,264 Deferred inflows of hedging derivative instrument (2,264) - - (2,264)Total hedging derivative instrument at fair value $ - $ - $ - $ -
NOTE 5 - CAPITAL ASSETS A summary of capital assets at June 30 follows:
2016 Beginning Balance
Increases
Decreases
Ending Balance
Capital assets, non-depreciable: Land $ 53,247 $ - $ - $ 53,247 Capital assets, depreciable: Buildings 103,237 - - 103,237 Equipment 14,861 1,924 - 16,785 Infrastructure 974,815 30,546 - 1,005,361 Total capital assets being depreciated 1,092,913 32,470 - 1,125,383 Less accumulated depreciation for: Buildings (73,252) (3,539) - (76,791) Equipment (10,472) (695) - (11,167) Infrastructure (604,144) (32,695) - (636,839) Total accumulated depreciation (687,868) (36,929) - (724,797) Total depreciable capital assets, net 405,045 (4,459) - 400,586 Total capital assets, net $ 458,292 $ (4,459) $ - $ 453,833
38
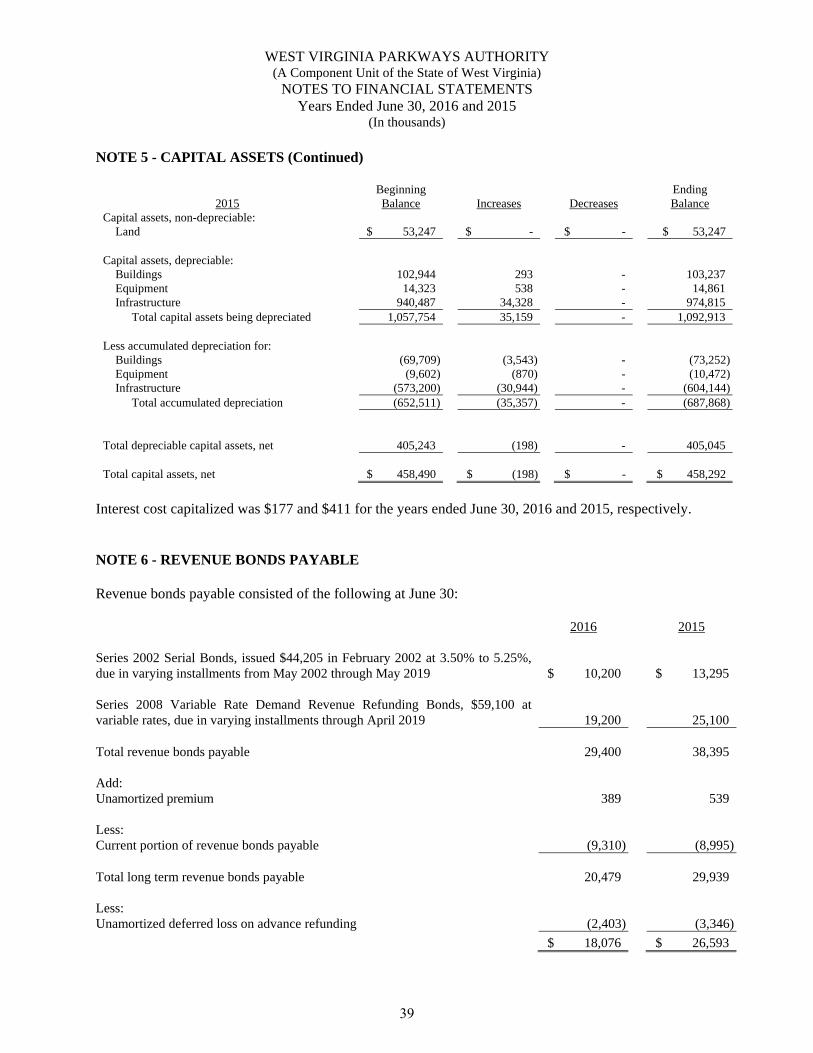
WEST VIRGINIA PARKWAYS AUTHORITY (A Component Unit of the State of West Virginia)
NOTES TO FINANCIAL STATEMENTS Years Ended June 30, 2016 and 2015
(In thousands) NOTE 5 - CAPITAL ASSETS (Continued)
2015 Beginning Balance
Increases
Decreases
Ending Balance
Capital assets, non-depreciable: Land $ 53,247 $ - $ - $ 53,247 Capital assets, depreciable: Buildings 102,944 293 - 103,237 Equipment 14,323 538 - 14,861 Infrastructure 940,487 34,328 - 974,815 Total capital assets being depreciated 1,057,754 35,159 - 1,092,913 Less accumulated depreciation for: Buildings (69,709) (3,543) - (73,252) Equipment (9,602) (870) - (10,472) Infrastructure (573,200) (30,944) - (604,144) Total accumulated depreciation (652,511) (35,357) - (687,868) Total depreciable capital assets, net 405,243 (198) - 405,045 Total capital assets, net $ 458,490 $ (198) $ - $ 458,292
Interest cost capitalized was $177 and $411 for the years ended June 30, 2016 and 2015, respectively. NOTE 6 - REVENUE BONDS PAYABLE Revenue bonds payable consisted of the following at June 30:
2016 2015 Series 2002 Serial Bonds, issued $44,205 in February 2002 at 3.50% to 5.25%, due in varying installments from May 2002 through May 2019 $ 10,200 $ 13,295 Series 2008 Variable Rate Demand Revenue Refunding Bonds, $59,100 at variable rates, due in varying installments through April 2019 19,200 25,100 Total revenue bonds payable 29,400 38,395 Add: Unamortized premium 389 539 Less: Current portion of revenue bonds payable (9,310) (8,995) Total long term revenue bonds payable 20,479 29,939 Less: Unamortized deferred loss on advance refunding (2,403) (3,346) $ 18,076 $ 26,593
39
WEST VIRGINIA PARKWAYS AUTHORITY (A Component Unit of the State of West Virginia)
NOTES TO FINANCIAL STATEMENTS Years Ended June 30, 2016 and 2015
(In thousands) NOTE 6 - REVENUE BONDS PAYABLE (Continued) The Revenue Bonds under the 1993, 2002, 2003, and 2008 Trust Indentures are secured by a pledge of the Authority’s toll revenues and all monies deposited into accounts created by the Trust Indentures. Total debt service was $10,755, $10,577, and $10,529 for the years ended June 30, 2016, 2015, and 2014, respectively. Total pledged revenues were approximately $54,100, $47,721, and $45,660, which represents 503.02%, 451.18%, and 433.66% of the total debt service, respectively, for the years ended June 30, 2016, 2015, and 2014. In 2002, $44,205 of Revenue Refunding Bonds were issued for the express purpose of defeasing $36,036 of Series 1993 Bonds. The advance refunding resulted in a $6,313 deferred loss arising from the difference between the reacquisition price and the net carrying amount of the refunded debt. Amortization of this deferral, charged annually to interest expense through 2019, approximated $371 in 2016 and 2015. The Authority completed the advance refunding to reduce its aggregate debt service payments by almost $3,003 over an 18-year period (life of the refunding bonds) and obtain an economic gain (difference between the present values of the old and new debt service payments) of $1,624. In July 2008, the Authority issued $59,100 of Variable Rate Demand Revenue Refunding Bonds for the express purpose of refunding $59,100 of the Authority’s Series 2003 Bonds. This refunding resulted in a $5,972 deferred loss arising from the difference between the reacquisition price and the net carrying amount of the refunded debt. Amortization of this deferral, charged annually to interest expense through 2019, approximated $569 in 2016 and 2015, respectively. The Authority completed the refunding to remove the requirement for bond insurance that was included in the Series 2003 Bonds. In July 2011, the Authority converted the Series 2008 Variable Rate Demand Revenue Refunding Bonds to a LIBOR Index rate and placed the bonds with a direct purchaser. The supplemental indenture established eight distinct registered bonds in principal amounts identical to the principal maturity schedule prior to the conversion. The Indenture establishes an applicable factor ranging from 67% to 82% of the one-month LIBOR Index with an additional spread ranging from 70 to 110 basis points on each bond. The Interest Rate Swap associated with the Series 2008 Variable Rate Bonds was amended to relate to the new index rate bonds under substantially similar terms. The Authority has an interest rate swap derivative instrument to synthetically fix, on a current basis, the Series 2008 Refunding Variable Rate Bonds in order to hedge interest rate fluctuations. The key provisions of the instrument are:
Type Pay-fixed interest rate swap Objective Hedge changes in cash flows on the Series 2008
Refunding Variable Rate Bonds Notional Amount $19,200 Effective Date July 2, 2008 Maturity Date April 15, 2019 Terms Pay 4.387%, receive 67% of One Month LIBOR
40
WEST VIRGINIA PARKWAYS AUTHORITY (A Component Unit of the State of West Virginia)
NOTES TO FINANCIAL STATEMENTS Years Ended June 30, 2016 and 2015
(In thousands) NOTE 6 - REVENUE BONDS PAYABLE (Continued) The fair value of this interest rate swap is estimated using the zero-coupon method. This method calculates the future net settlement payments required by the swap, assuming that the current forward rate implied by the yield curve correctly anticipates future spot interest rates. These payments are then discounted using the spot rate implied by the current yield curve for hypothetical zero-coupon bonds due on the date of the future net settlement on the swap. At June 30, 2016 and 2015, the decrease in the value of the swap since inception was equal to the market value of the swap creating a deferred inflow of resources that offsets the deferred outflow of resources in the Statements of Net Position. The fair value balance for the hedging derivative instrument outstanding at June 30, 2016, and the change in fair value of the instrument for the year ended June 30, 2016, as reported in the 2016 financial statements are as follows:
Changes in fair value: Increase (decrease) $ (780) Fair value at June 30, 2016 Amount $ 1,484
Risks Credit Risk - The credit ratings of the counterparty to the interest rate swap are A1 from Moody’s, A from Standard & Poor’s, and A+ from Fitch. The interest rate swap agreement requires certain collateralization if the credit rating of the counterparty falls below specific levels. As of June 30, 2016, no collateralization was required by the interest rate swap agreement. Interest Rate Risk - Interest rate risk is the risk that changes in interest rates will adversely affect the fair value of the interest rate swap. Basis Risk - The Authority is exposed to basis risk on the fixed interest rate swap because the variable-rate payments received by the Authority on this hedging derivative instrument are based on rates other than the interest rate the Authority pays on the hedged variable-rate debt. Termination Risk - The interest rate swap agreement provides for certain events that could cause the counterparty or the Authority to terminate the swap. The swap may be terminated by the counterparty or the Authority if the other party fails to make payments when due, there is a material breach of representations and warranties, an event of illegality occurs, and failure to comply with any other provisions of the agreement after a specified notice period. In addition, if the counterparty fails to maintain ratings of at least Baa3 by Moody’s and BBB- by Standard and Poor’s, the swap may be terminated by the Authority. If the Authority fails to maintain ratings of at least Baa3 by Moody’s and BBB- by Standard and Poor’s, the swap may be terminated by the counterparty. The amount of the termination payment is determined by market quotation by obtaining pricing levels from at least three reference market makers. The Authority has the right to optionally terminate the swap agreement at any time. The termination amount owed by either the Authority or the counterparty may be determined by market quotation. If at the time of termination the swap has a negative fair value, the Authority would owe the counterparty a payment equal to the swap’s fair value.
41
WEST VIRGINIA PARKWAYS AUTHORITY (A Component Unit of the State of West Virginia)
NOTES TO FINANCIAL STATEMENTS Years Ended June 30, 2016 and 2015
(In thousands) NOTE 6 - REVENUE BONDS PAYABLE (Continued) Rollover Risk - The Authority is exposed to rollover risk on the hedging interest rate swap that may be terminated prior to the maturity of the hedged debt. Swap Payments and Associated Debt - Using rates as of June 30, 2016, debt service requirements of the variable rate debt and net swap payments, assuming current interest rates remain the same for their term, were as follows. As rates vary, variable rate bond interest payments and net swap payments will vary.
Year Ending Variable-Rate Bonds Interest Rate June 30 Principal Interest Swap, Net Total
2017 $ 6,100 $ 242 $ 784 $ 7,1262018 6,400 169 535 7,1042019 6,700 89 274 7,063
$ 19,200 $ 500 $ 1,593 $ 21,293
Bonds Payable Progression and Maturities The following schedule summarizes the revenue bonds outstanding as of June 30:
Beginning Ending Due Within 2016 Balance Additions Retired Amortization Balance One Year
Series 2002 $ 13,834 $ - $ (3,095) $ (150) $ 10,589 $ 3,210 Series 2008 25,100 - (5,900) - 19,200 6,100 $ 38,934 $ - $ (8,995) $ (150) $ 29,789 $ 9,310
Beginning Ending Due Within
2015 Balance Additions Retired Amortization Balance One Year Series 2002 $ 16,924 $ - $ (2,940) $ (150) $ 13,834 $ 3,095 Series 2008 30,700 - (5,600) - 25,100 5,900 $ 47,624 $ - $ (8,540) $ (150) $ 38,934 $ 8,995
Debt service requirements for the Revenue Bonds subsequent to June 30, 2016, are as follows:
Interest, Year Ending Principal Including
June 30 Maturities Accretion Total
2017 $ 9,310 $ 1,367 $ 10,6772018 9,805 914 10,7192019 10,285 454 10,739
$ 29,400 $ 2,735 $ 32,135
42
WEST VIRGINIA PARKWAYS AUTHORITY (A Component Unit of the State of West Virginia)
NOTES TO FINANCIAL STATEMENTS Years Ended June 30, 2016 and 2015
(In thousands) NOTE 6 - REVENUE BONDS PAYABLE (Continued)
Principal outstanding June 30, 2016 $ 29,400 Add:
Unamortized premium 389 Less:
Current portion of revenue bonds payable (9,310) Long-term portion $ 20,479
The Revenue Bonds are subject to the arbitrage rebate provisions of the Internal Revenue Code (the Code). The Code requires that 90% of excess investment earnings on the Bond proceeds be paid to the Internal Revenue Service every five years in order for the Bonds to maintain their tax-exempt status. At June 30, 2016 and 2015, the Authority’s estimated arbitrage rebate liability was zero. NOTE 7 - POST-EMPLOYMENT BENEFITS OTHER THAN PENSIONS Plan Description The Authority participates in the West Virginia Other Post-employment Benefit Plan (OPEB Plan) of the West Virginia Retiree Health Benefit Trust Fund (RHBT), a cost-sharing multiple-employer defined benefit post-employment healthcare plan administered by the West Virginia Public Employees Insurance Agency (WVPEIA). The OPEB Plan provides retiree post-employment health care benefits for participating state and local government employers. The provisions of the Code of West Virginia, 1931, as amended (the Code), assigns the authority to establish and amend benefit plans to the WVPEIA Board of Trustees. The WVPEIA issues a publicly available financial report that includes financial statements and required supplementary information for the OPEB Plan. That report may be obtained by writing to Public Employees Insurance Agency, 601 57th Street, S.E., Suite 2, Charleston, West Virginia, 25304-2345, or by calling 1-888-680-7342. Funding Policy The Code requires the OPEB Plan to bill the participating employers 100% of the Annual Required Contribution (ARC), an amount actuarially determined in accordance with the parameters of GASB Statement 45. The ARC represents a level of funding that, if paid on an ongoing basis, is projected to cover normal cost each year and amortize any unfunded actuarial liabilities (or funding excess) of the plan over a period not to exceed thirty years. Participating plan employers are billed per active health policy per month. The Authority’s OPEB liability was $10,923, $10,293, and $9,752 and total OPEB expense was $1,368, $1,320, and $989 for the years ended June 30, 2016, 2015, and 2014, respectively. The Authority has paid premiums of $738, $779, and $844, which represents approximately 54%, 59%, and 85% of the required contributions, respectively, for the years ended June 30, 2016, 2015, and 2014.
43
WEST VIRGINIA PARKWAYS AUTHORITY (A Component Unit of the State of West Virginia)
NOTES TO FINANCIAL STATEMENTS Years Ended June 30, 2016 and 2015
(In thousands) NOTE 7 - POST-EMPLOYMENT BENEFITS OTHER THAN PENSIONS (Continued) During fiscal year 2012, the West Virginia Legislature passed legislation to provide alternate funding sources for the RHBT OPEB unfunded liability. In addition, the WVPEIA Finance Board imposed limits on the retiree subsidy currently provided for WVPEIA premiums for retirees. Future increases in the subsidy will be limited to no more than 3% per year. These actions have had a material impact on the amounts billed by the RHBT to the Authority as well as an expected material impact on amounts billed in the future, resulting in decreases in the recorded OPEB liability. NOTE 8 - PENSION PLAN All full-time Authority employees are eligible to participate in the State of West Virginia Public Employees’ Retirement System (PERS), a cost-sharing multiple-employer public employee retirement system. PERS also provides delayed retirement, early retirement, death and disability benefits. The West Virginia Consolidated Public Retirement Board issues a publicly available financial report that includes financial statements and required supplementary information for PERS. That report may be obtained by writing to West Virginia Consolidated Public Retirement Board, 4101 MacCorkle Avenue S.E., Charleston, WV 25304-1636 or by calling (304) 558-3570. Benefits Provided Benefits are provided through PERS using a two-tiered system. Effective July 1, 2015, PERS implemented the second tier, Tier II. Employees hired, for the first time, on or after July 1, 2015 are considered Tier II members. Tier I and Tier II members are subject to different regulations. Tier I: Employees who retire at or after age 60 with five or more years of credited service, or at least age 55 with age and service equal to 80 years or greater, are entitled to a retirement benefit established by State statute, payable monthly for life, in the form of a straight-life annuity equal to two percent of the employee’s final average salary multiplied by years of service. Final average salary is the average of the highest annual compensation received by an employee during any period of three consecutive years of credited service included within fifteen years of credited service immediately preceding the termination date of employment with a participating public employer or, if the employee has less than three years of credited service, the average of the annual rate of compensation received by the employee during the total years of credited service. Terminated members with at least five years of contributory service who do not withdraw their accumulated contributions may elect to receive their retirement annuity beginning at age 62. Tier II: Employees who retire at or after age 62 with ten or more years of credited service are entitled to a retirement benefit established by State statute, payable monthly for life, in the form of a straight-life annuity equal to two percent of the employee’s final average salary multiplied by years of service. Final average salary is the average of the highest annual compensation received by an employee during any period of five consecutive years of credited service included within fifteen years of credited service immediately preceding the termination date of employment with a participating public employer. Terminated members with at least ten years of contributory service who do not withdraw their accumulated contributions may elect to receive their retirement annuity beginning at age 64.
44
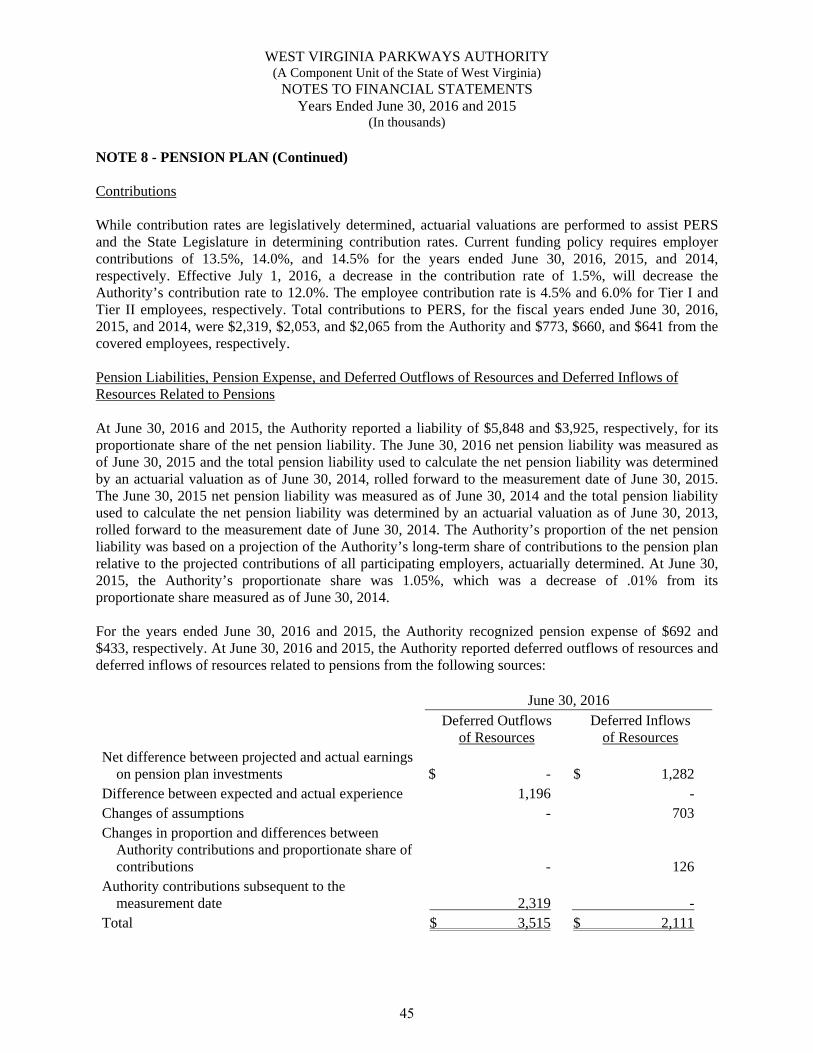
WEST VIRGINIA PARKWAYS AUTHORITY (A Component Unit of the State of West Virginia)
NOTES TO FINANCIAL STATEMENTS Years Ended June 30, 2016 and 2015
(In thousands) NOTE 8 - PENSION PLAN (Continued) Contributions While contribution rates are legislatively determined, actuarial valuations are performed to assist PERS and the State Legislature in determining contribution rates. Current funding policy requires employer contributions of 13.5%, 14.0%, and 14.5% for the years ended June 30, 2016, 2015, and 2014, respectively. Effective July 1, 2016, a decrease in the contribution rate of 1.5%, will decrease the Authority’s contribution rate to 12.0%. The employee contribution rate is 4.5% and 6.0% for Tier I and Tier II employees, respectively. Total contributions to PERS, for the fiscal years ended June 30, 2016, 2015, and 2014, were $2,319, $2,053, and $2,065 from the Authority and $773, $660, and $641 from the covered employees, respectively. Pension Liabilities, Pension Expense, and Deferred Outflows of Resources and Deferred Inflows of Resources Related to Pensions At June 30, 2016 and 2015, the Authority reported a liability of $5,848 and $3,925, respectively, for its proportionate share of the net pension liability. The June 30, 2016 net pension liability was measured as of June 30, 2015 and the total pension liability used to calculate the net pension liability was determined by an actuarial valuation as of June 30, 2014, rolled forward to the measurement date of June 30, 2015. The June 30, 2015 net pension liability was measured as of June 30, 2014 and the total pension liability used to calculate the net pension liability was determined by an actuarial valuation as of June 30, 2013, rolled forward to the measurement date of June 30, 2014. The Authority’s proportion of the net pension liability was based on a projection of the Authority’s long-term share of contributions to the pension plan relative to the projected contributions of all participating employers, actuarially determined. At June 30, 2015, the Authority’s proportionate share was 1.05%, which was a decrease of .01% from its proportionate share measured as of June 30, 2014. For the years ended June 30, 2016 and 2015, the Authority recognized pension expense of $692 and $433, respectively. At June 30, 2016 and 2015, the Authority reported deferred outflows of resources and deferred inflows of resources related to pensions from the following sources: June 30, 2016
Deferred Outflows
of Resources Deferred Inflows
of Resources Net difference between projected and actual earnings
on pension plan investments $ - $ 1,282 Difference between expected and actual experience 1,196 - Changes of assumptions - 703 Changes in proportion and differences between
Authority contributions and proportionate share of contributions - 126
Authority contributions subsequent to the measurement date 2,319 -
Total $ 3,515 $ 2,111
45
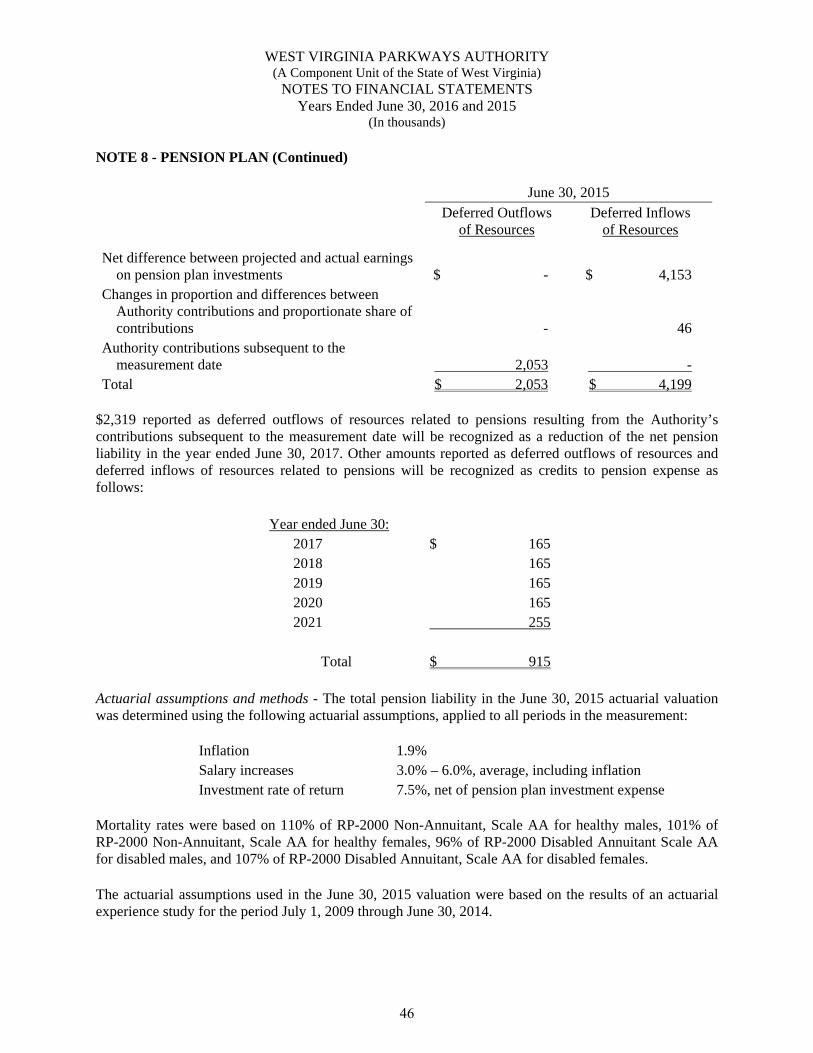
WEST VIRGINIA PARKWAYS AUTHORITY (A Component Unit of the State of West Virginia)
NOTES TO FINANCIAL STATEMENTS Years Ended June 30, 2016 and 2015
(In thousands) NOTE 8 - PENSION PLAN (Continued) June 30, 2015
Deferred Outflows
of Resources Deferred Inflows
of Resources
Net difference between projected and actual earnings on pension plan investments $ - $ 4,153
Changes in proportion and differences between Authority contributions and proportionate share of contributions - 46
Authority contributions subsequent to the measurement date 2,053 -
Total $ 2,053 $ 4,199 $2,319 reported as deferred outflows of resources related to pensions resulting from the Authority’s contributions subsequent to the measurement date will be recognized as a reduction of the net pension liability in the year ended June 30, 2017. Other amounts reported as deferred outflows of resources and deferred inflows of resources related to pensions will be recognized as credits to pension expense as follows:
Year ended June 30: 2017 $ 165 2018 165 2019 165 2020 165 2021 255 Total $ 915
Actuarial assumptions and methods - The total pension liability in the June 30, 2015 actuarial valuation was determined using the following actuarial assumptions, applied to all periods in the measurement:
Inflation 1.9% Salary increases 3.0% – 6.0%, average, including inflation Investment rate of return 7.5%, net of pension plan investment expense
Mortality rates were based on 110% of RP-2000 Non-Annuitant, Scale AA for healthy males, 101% of RP-2000 Non-Annuitant, Scale AA for healthy females, 96% of RP-2000 Disabled Annuitant Scale AA for disabled males, and 107% of RP-2000 Disabled Annuitant, Scale AA for disabled females. The actuarial assumptions used in the June 30, 2015 valuation were based on the results of an actuarial experience study for the period July 1, 2009 through June 30, 2014.
46
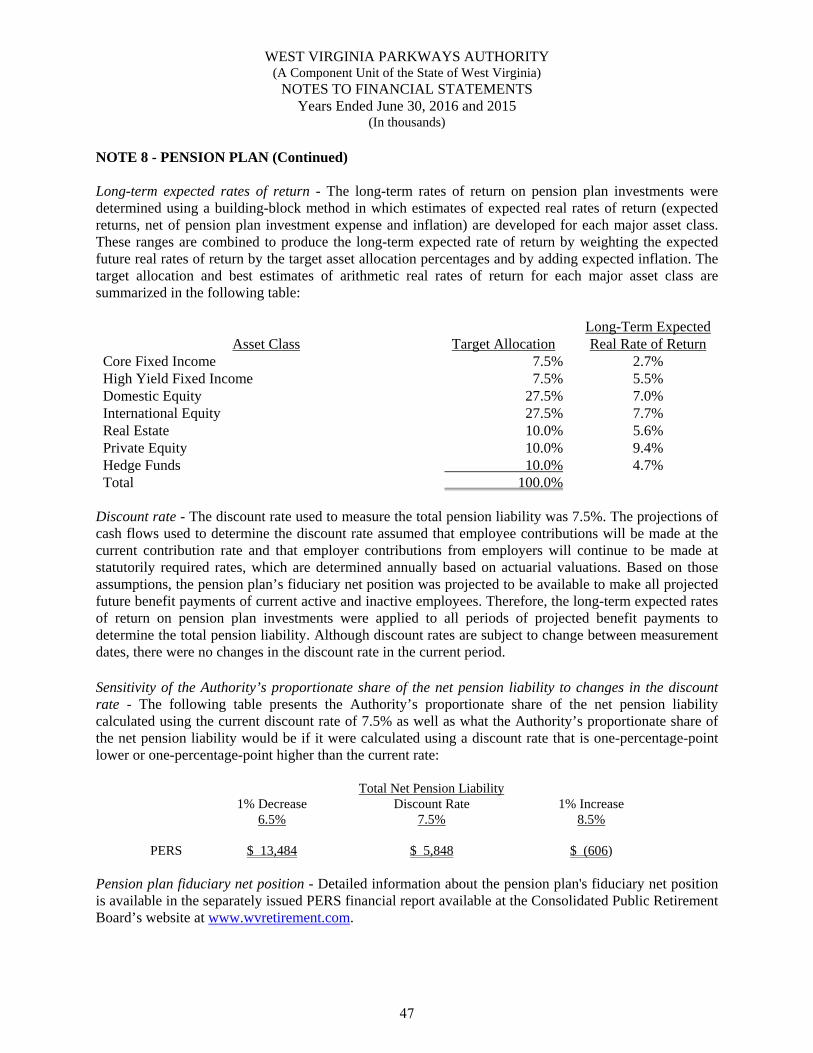
WEST VIRGINIA PARKWAYS AUTHORITY (A Component Unit of the State of West Virginia)
NOTES TO FINANCIAL STATEMENTS Years Ended June 30, 2016 and 2015
(In thousands) NOTE 8 - PENSION PLAN (Continued) Long-term expected rates of return - The long-term rates of return on pension plan investments were determined using a building-block method in which estimates of expected real rates of return (expected returns, net of pension plan investment expense and inflation) are developed for each major asset class. These ranges are combined to produce the long-term expected rate of return by weighting the expected future real rates of return by the target asset allocation percentages and by adding expected inflation. The target allocation and best estimates of arithmetic real rates of return for each major asset class are summarized in the following table:
Asset Class Target Allocation Long-Term Expected Real Rate of Return
Core Fixed Income 7.5% 2.7% High Yield Fixed Income 7.5% 5.5% Domestic Equity 27.5% 7.0% International Equity 27.5% 7.7% Real Estate 10.0% 5.6% Private Equity 10.0% 9.4% Hedge Funds 10.0% 4.7% Total 100.0%
Discount rate - The discount rate used to measure the total pension liability was 7.5%. The projections of cash flows used to determine the discount rate assumed that employee contributions will be made at the current contribution rate and that employer contributions from employers will continue to be made at statutorily required rates, which are determined annually based on actuarial valuations. Based on those assumptions, the pension plan’s fiduciary net position was projected to be available to make all projected future benefit payments of current active and inactive employees. Therefore, the long-term expected rates of return on pension plan investments were applied to all periods of projected benefit payments to determine the total pension liability. Although discount rates are subject to change between measurement dates, there were no changes in the discount rate in the current period. Sensitivity of the Authority’s proportionate share of the net pension liability to changes in the discount rate - The following table presents the Authority’s proportionate share of the net pension liability calculated using the current discount rate of 7.5% as well as what the Authority’s proportionate share of the net pension liability would be if it were calculated using a discount rate that is one-percentage-point lower or one-percentage-point higher than the current rate:
Total Net Pension Liability 1% Decrease
6.5% Discount Rate
7.5% 1% Increase
8.5% PERS $ 13,484 $ 5,848 $ (606)
Pension plan fiduciary net position - Detailed information about the pension plan's fiduciary net position is available in the separately issued PERS financial report available at the Consolidated Public Retirement Board’s website at www.wvretirement.com.
47
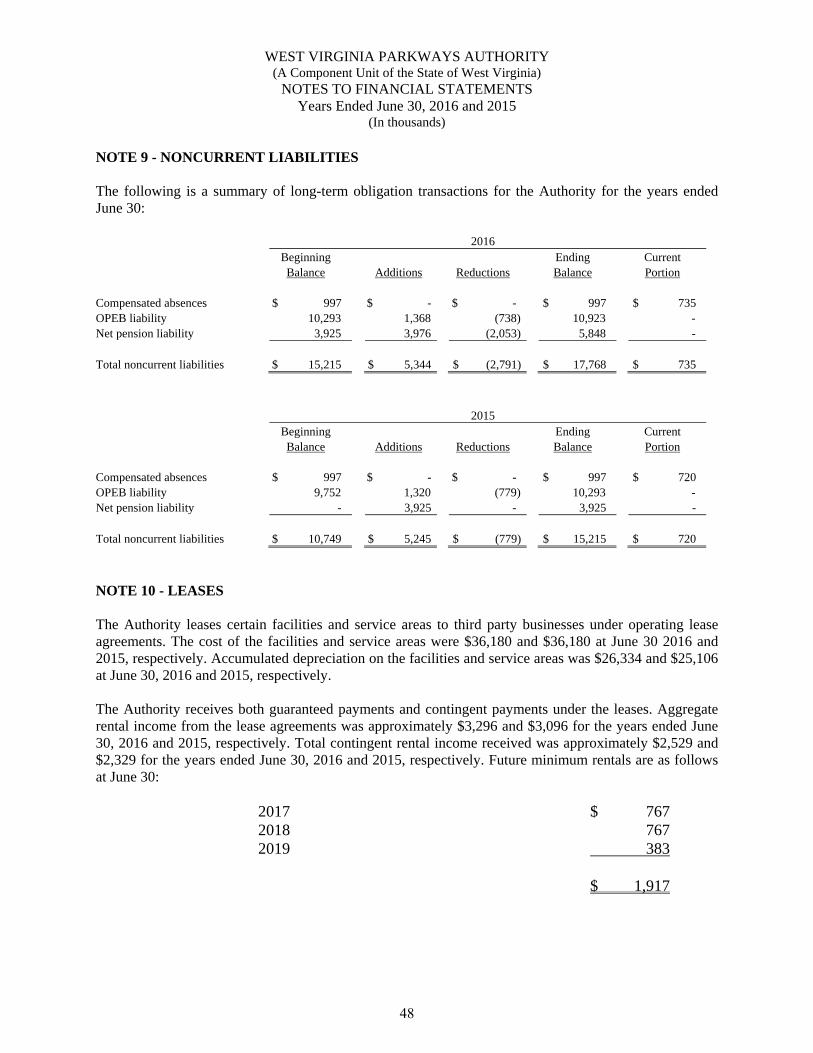
WEST VIRGINIA PARKWAYS AUTHORITY (A Component Unit of the State of West Virginia)
NOTES TO FINANCIAL STATEMENTS Years Ended June 30, 2016 and 2015
(In thousands) NOTE 9 - NONCURRENT LIABILITIES The following is a summary of long-term obligation transactions for the Authority for the years ended June 30: 2016 Beginning Ending Current Balance Additions Reductions Balance Portion Compensated absences $ 997 $ - $ - $ 997 $ 735 OPEB liability 10,293 1,368 (738) 10,923 - Net pension liability 3,925 3,976 (2,053) 5,848 - Total noncurrent liabilities $ 15,215 $ 5,344 $ (2,791) $ 17,768 $ 735 2015 Beginning Ending Current Balance Additions Reductions Balance Portion Compensated absences $ 997 $ - $ - $ 997 $ 720 OPEB liability 9,752 1,320 (779) 10,293 - Net pension liability - 3,925 - 3,925 - Total noncurrent liabilities $ 10,749 $ 5,245 $ (779) $ 15,215 $ 720 NOTE 10 - LEASES The Authority leases certain facilities and service areas to third party businesses under operating lease agreements. The cost of the facilities and service areas were $36,180 and $36,180 at June 30 2016 and 2015, respectively. Accumulated depreciation on the facilities and service areas was $26,334 and $25,106 at June 30, 2016 and 2015, respectively. The Authority receives both guaranteed payments and contingent payments under the leases. Aggregate rental income from the lease agreements was approximately $3,296 and $3,096 for the years ended June 30, 2016 and 2015, respectively. Total contingent rental income received was approximately $2,529 and $2,329 for the years ended June 30, 2016 and 2015, respectively. Future minimum rentals are as follows at June 30:
2017 $ 767 2018 767 2019 383 $ 1,917
48
WEST VIRGINIA PARKWAYS AUTHORITY (A Component Unit of the State of West Virginia)
NOTES TO FINANCIAL STATEMENTS Years Ended June 30, 2016 and 2015
(In thousands) NOTE 11 - RISK MANAGEMENT The Authority is exposed to various risks of loss related to torts; theft of, damage to, and destruction of assets; errors and omissions; injuries to and illnesses of employees; and natural disasters. The Authority has obtained coverage for job-related injuries of employees and health coverage for its employees from a commercial insurer, and the West Virginia Public Employees Insurance Agency (PEIA). In exchange for the payment of premiums to PEIA and the commercial insurer, the Authority has transferred its risks related to health coverage for employees and job-related injuries of employees. The Authority, for an annual premium, obtains insurance coverage for general liability, property damage, business interruption, errors and omissions, and natural disasters through the West Virginia Board of Risk and Insurance Management, a public risk pool entity insuring the State of West Virginia, its component units, local government entities, and eligible not-for-profit organizations. Liability coverage provided to all insured entities under this policy is limited to $1,000 per occurrence, subject to an annual aggregate limit of coverage of $22,000. To further reduce its risk of loss, the Authority, for an annual premium paid to a commercial insurer, has obtained an additional liability policy which provides coverage of $10,000 over and above the coverage provided by the West Virginia Board of Risk and Insurance Management. For the fiscal years ended June 30, 2016, 2015, and 2014, the Authority’s insurance coverage has been sufficient to meet all claims and settlements against the Authority. NOTE 12 - COMMITMENTS AND CONTINGENCIES Litigation The Authority is a defendant in certain legal proceedings pertaining to matters incidental to routine operations. Based on the current status of these legal proceedings, it is the opinion of Authority management and counsel that the ultimate resolution of these matters will not have a material effect on the Authority’s financial position. Construction Commitments At June 30, 2016, the Authority had contractual commitments totaling $26,936 for various Turnpike System improvement projects. Subsequent to June 30, 2016, the Authority entered into additional contractual commitments totaling $37,536. NOTE 13 - ACCOUNTING PRONOUNCEMENTS Newly Adopted Statements Issued by the Governmental Accounting Standards Board The Governmental Accounting Standards Board has issued Statement No. 72, Fair Value Measurement and Application, effective for fiscal years beginning after June 15, 2015. This Statement will enhance comparability of financial statements among governments by requiring measurement of certain assets and liabilities at fair value using a consistent and more detailed definition of fair value and accepted valuation techniques. This Statement also will enhance fair value application guidance and related disclosures in order to provide information to financial statement users about the impact of fair value measurements on a government's financial position. See additional disclosures at Note 4.
49
WEST VIRGINIA PARKWAYS AUTHORITY (A Component Unit of the State of West Virginia)
NOTES TO FINANCIAL STATEMENTS Years Ended June 30, 2016 and 2015
(In thousands) NOTE 13 - ACCOUNTING PRONOUNCEMENTS (Continued) The Governmental Accounting Standards Board has also issued Statement No. 76, The Hierarchy of Generally Accepted Accounting Principles for State and Local Governments, effective for fiscal years beginning after June 15, 2015. The requirements of this Statement will identify—in the context of the current governmental financial reporting environment—the hierarchy of generally accepted accounting principles (GAAP). The “GAAP hierarchy” consists of the sources of accounting principles used to prepare financial statements of state and local governmental entities in conformity with GAAP and the framework for selecting those principles. This Statement reduces the GAAP hierarchy to two categories of authoritative GAAP and addresses the use of authoritative and nonauthoritative literature in the event that the accounting treatment for a transaction or other event is not specified within a source of authoritative GAAP. The adoption of GASB Statement No. 76 had no impact on the June 30, 2016 financial statements. The Governmental Accounting Standards Board has also issued Statement No. 79, Certain External Investment Pools and Pool Participants, effective for fiscal years beginning after June 15, 2015. This Statement addresses accounting and financial reporting for certain external investment pools and pool participants. Specifically, it establishes criteria for an external investment pool to qualify for making the election to measure all of its investments at amortized cost for financial reporting purposes. An external investment pool qualifies for that reporting if it meets all of the applicable criteria established in this Statement. The specific criteria address (1) how the external investment pool transacts with participants; (2) requirements for portfolio maturity, quality, diversification, and liquidity; and (3) calculation and requirements of a shadow price. Significant noncompliance prevents the external investment pool from measuring all of its investments at amortized cost for financial reporting purposes. Professional judgment is required to determine if instances of noncompliance with the criteria established by this Statement during the reporting period, individually or in the aggregate, were significant. The adoption of GASB Statement No. 79 had no impact on the June 30, 2016 financial statements. The Governmental Accounting Standards Board has also issued Statement No. 82, Pension Issues an amendment of GASB Statements No. 67, No. 68, and No. 73, effective for fiscal years beginning after June 15, 2016. The objective of this Statement is to address certain issues that have been raised with respect to Statements No. 67, Financial Reporting for Pension Plans, No. 68, Accounting and Financial Reporting for Pensions, and No. 73, Accounting and Financial Reporting for Pensions and Related Assets That Are Not within the Scope of GASB Statement 68, and Amendments to Certain Provisions of GASB Statements 67 and 68. Specifically, this Statement addresses issues regarding (1) the presentation of payroll-related measures in required supplementary information, (2) the selection of assumptions and the treatment of deviations from the guidance in an Actuarial Standard of Practice for financial reporting purposes, and (3) the classification of payments made by employers to satisfy employee (plan member) contribution requirements. The adoption of GASB Statement No. 82 had no impact on the June 30, 2016 financial statements.
50
WEST VIRGINIA PARKWAYS AUTHORITY (A Component Unit of the State of West Virginia)
NOTES TO FINANCIAL STATEMENTS Years Ended June 30, 2016 and 2015
(In thousands) NOTE 13 - ACCOUNTING PRONOUNCEMENTS (Continued) Recent Statements Issued by the Governmental Accounting Standards Board The Governmental Accounting Standards Board has also issued Statement No. 73, Accounting and Financial Reporting for Pensions and Related Assets That Are Not within the Scope of GASB Statement 68, and Amendments to Certain Provisions of GASB Statements 67 and 68, effective for fiscal years beginning after June 15, 2016, and the requirements of this Statement that address financial reporting for assets that accumulate for purposes of providing those pensions are effective for fiscal years beginning after June 15, 2015. The requirements of this Statement will improve financial reporting by establishing a single framework for the presentation of information about pensions, which will enhance the comparability of pension-related information reported by employers and nonemployer contributing entities. The Authority has not yet determined the effect that the adoption of GASB Statement No. 73 may have on its financial statements. The Governmental Accounting Standards Board has also issued Statement No. 74, Financial Reporting for Postemployment Benefit Plans Other Than Pension Plans, effective for fiscal years beginning after June 15, 2016. The requirements of this Statement will improve the usefulness of information about postemployment benefits other than pensions (other postemployment benefits or OPEB) included in the general purpose external financial reports of state and local governmental OPEB plans for making decisions and assessing accountability. The Authority has not yet determined the effect that the adoption of GASB Statement No. 74 may have on its financial statements. The Governmental Accounting Standards Board has also issued Statement No. 75, Accounting and Financial Reporting for Postemployment Benefits Other Than Pensions, effective for fiscal years beginning after June 15, 2017. The requirements of this Statement will improve accounting and financial reporting by state and local governments for postemployment benefits other than pensions (other postemployment benefits or OPEB). It also improves information provided by state and local governmental employers about financial support for OPEB that is provided by other entities. The Authority has not yet determined the effect that the adoption of GASB Statement No. 75 may have on its financial statements. The Governmental Accounting Standards Board has also issued Statement No. 77, Tax Abatement Disclosures, effective for fiscal years beginning after December 15, 2015. The requirements of this Statement will improve financial reporting by giving users of financial statements essential information that is not consistently or comprehensively reported to the public at present. Disclosure of information about the nature and magnitude of tax abatements will make these transactions more transparent to financial statement users. As a result, users will be better equipped to understand (1) how tax abatements affect a government's future ability to raise resources and meet its financial obligations and (2) the impact those abatements have on a government's financial position and economic condition. The Authority has not yet determined the effect that the adoption of GASB Statement No. 77 may have on its financial statements.
51
WEST VIRGINIA PARKWAYS AUTHORITY (A Component Unit of the State of West Virginia)
NOTES TO FINANCIAL STATEMENTS Years Ended June 30, 2016 and 2015
(In thousands) NOTE 13 - ACCOUNTING PRONOUNCEMENTS (Continued) The Governmental Accounting Standards Board has also issued Statement No. 78, Pensions Provided through Certain Multiple-Employer Defined Benefit Pension Plans, effective for fiscal years beginning after December 15, 2015. The objective of this Statement is to address a practice issue regarding the scope and applicability of Statement No. 68, Accounting and Financial Reporting for Pensions. This issue is associated with pensions provided through certain multiple-employer defined benefit pension plans and to state or local governmental employers whose employees are provided with such pensions The Authority has not yet determined the effect that the adoption of GASB Statement No. 78 may have on its financial statements. The Governmental Accounting Standards Board has also issued Statement No. 80, Blending Requirements for Certain Component Units an amendment of GASB Statement No. 14, effective for fiscal years beginning after June 15, 2016. The objective of this Statement is to improve financial reporting by clarifying the financial statement presentation requirements for certain component units. This Statement amends the blending requirements established in paragraph 53 of Statement No. 14, The Financial Reporting Entity, as amended.The Authority has not yet determined the effect that the adoption of GASB Statement No. 80 may have on its financial statements. The Governmental Accounting Standards Board has also issued Statement No. 81, Irrevocable Split-Interest Agreements, effective for fiscal years beginning after December 15, 2016. The objective of this Statement is to improve accounting and financial reporting for irrevocable split-interest agreements by providing recognition and measurement guidance for situations in which a government is a beneficiary of the agreement.The Authority has not yet determined the effect that the adoption of GASB Statement No. 81 may have on its financial statements.
52
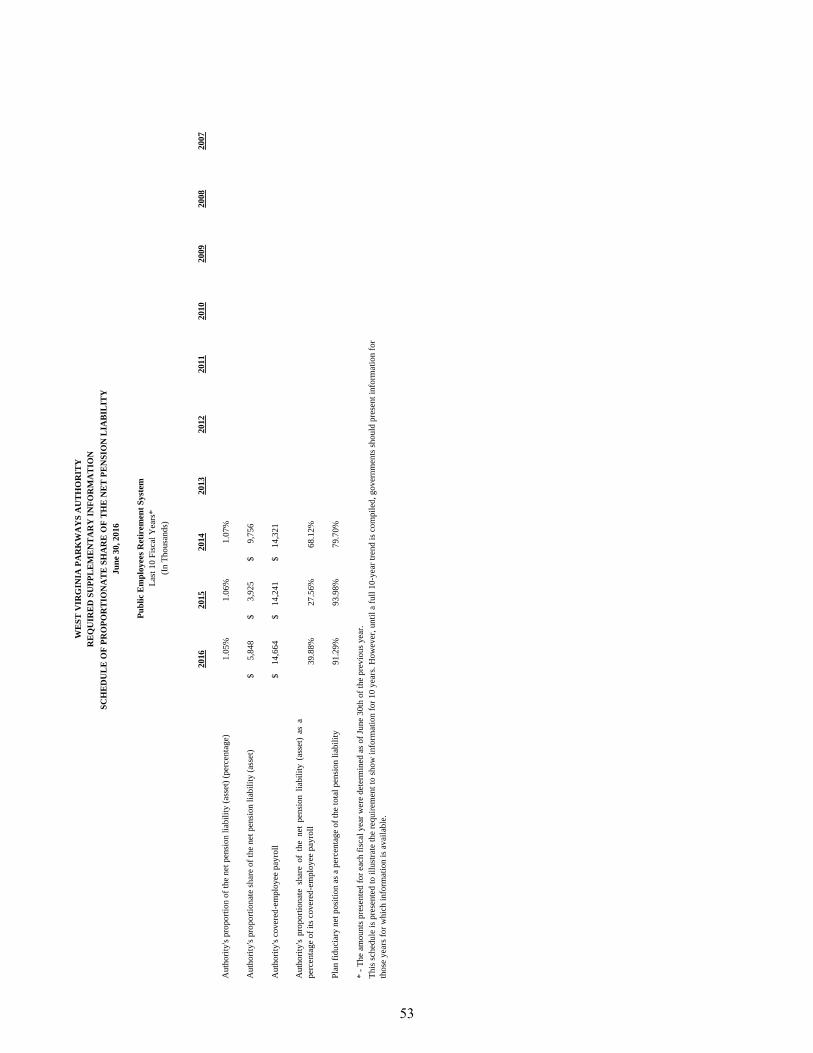
2016
2015
2014
2013
2012
2011
2010
2009
2008
2007
Aut
horit
y's p
ropo
rtion
of t
he n
et p
ensi
on li
abili
ty (a
sset
) (pe
rcen
tage
)1.
05%
1.06
%1.
07%
Aut
horit
y's p
ropo
rtion
ate
shar
e of
the
net p
ensi
on li
abili
ty (a
sset
)5,
848
$
3,
925
$
9,
756
$
Aut
horit
y's c
over
ed-e
mpl
oyee
pay
roll
14,6
64$
14,2
41$
14,3
21$
Aut
horit
y's
prop
ortio
nate
shar
eof
the
net
pens
ion
liabi
lity
(ass
et)
asa
perc
enta
ge o
f its
cov
ered
-em
ploy
ee p
ayro
ll39
.88%
27.5
6%68
.12%
Plan
fidu
ciar
y ne
t pos
ition
as a
per
cent
age
of th
e to
tal p
ensi
on li
abili
ty91
.29%
93.9
8%79
.70%
* - T
he a
mou
nts p
rese
nted
for e
ach
fisca
l yea
r wer
e de
term
ined
as o
f Jun
e 30
th o
f the
pre
viou
s yea
r.Th
is sc
hedu
le is
pre
sent
ed to
illu
stra
te th
e re
quire
men
t to
show
info
rmat
ion
for 1
0 ye
ars.
How
ever
, unt
il a
full
10-y
ear t
rend
is c
ompi
led,
gov
ernm
ents
shou
ld p
rese
nt in
form
atio
n fo
r th
ose
year
s for
whi
ch in
form
atio
n is
ava
ilabl
e.
WE
ST
VIR
GIN
IA P
AR
KW
AY
S A
UT
HO
RIT
Y
SC
HE
DU
LE
OF
PR
OP
OR
TIO
NA
TE
SH
AR
E O
F T
HE
NE
T P
EN
SIO
N L
IAB
ILIT
Y
Jun
e 30
, 201
6
Pu
bli
c E
mp
loye
es R
etir
emen
t S
yste
mLa
st 1
0 Fi
scal
Yea
rs*
(In
Thou
sand
s)
RE
QU
IRE
D S
UP
PL
EM
EN
TA
RY
IN
FO
RM
AT
ION
53
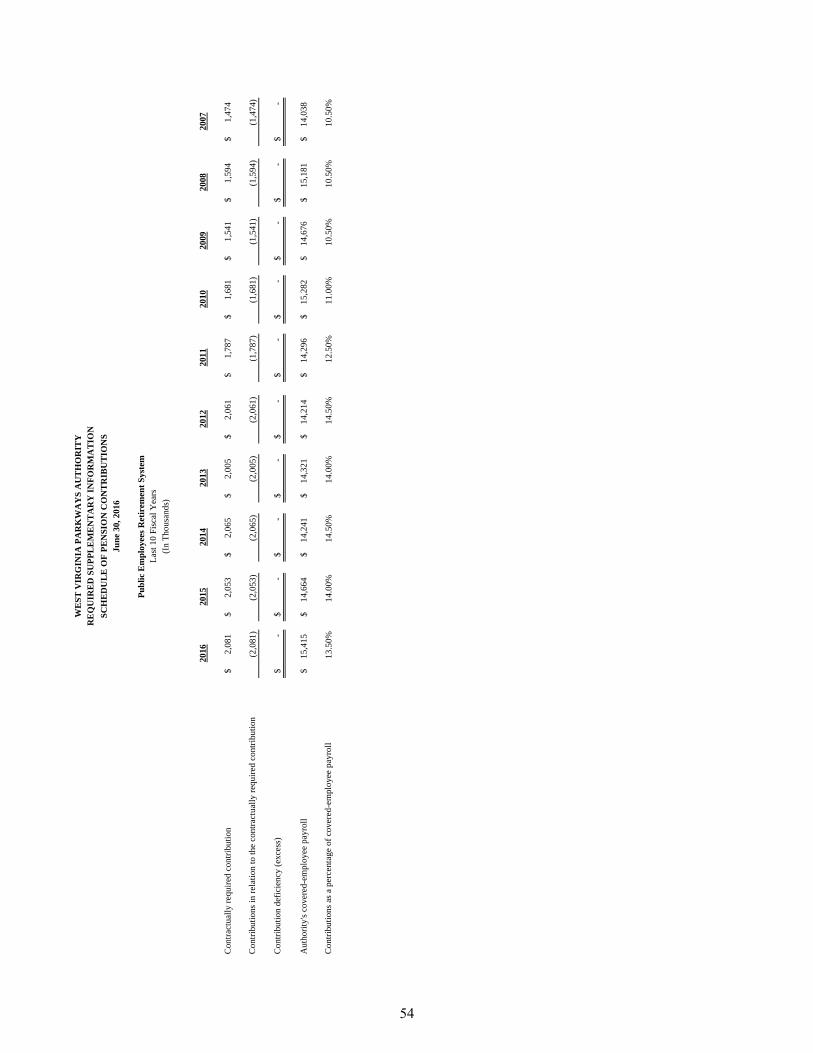
2016
2015
2014
2013
2012
2011
2010
2009
2008
2007
Con
tract
ually
requ
ired
cont
ribut
ion
2,08
1$
2,05
3$
2,06
5$
2,00
5$
2,06
1$
1,78
7$
1,68
1$
1,54
1$
1,59
4$
1,47
4$
Con
tribu
tions
in re
latio
n to
the
cont
ract
ually
requ
ired
cont
ribut
ion
(2,0
81)
(2
,053
)
(2,0
65)
(2
,005
)
(2,0
61)
(1
,787
)
(1,6
81)
(1
,541
)
(1,5
94)
(1
,474
)
Con
tribu
tion
defic
ienc
y (e
xces
s)-
$
-$
-
$
-$
-
$
-$
-
$
-$
-
$
-$
Aut
horit
y's c
over
ed-e
mpl
oyee
pay
roll
15,4
15$
14,6
64$
14,2
41$
14,3
21$
14,2
14$
14,2
96$
15,2
82$
14,6
76$
15,1
81$
14,0
38$
Con
tribu
tions
as a
per
cent
age
of c
over
ed-e
mpl
oyee
pay
roll
13.5
0%14
.00%
14.5
0%14
.00%
14.5
0%12
.50%
11.0
0%10
.50%
10.5
0%10
.50%
WE
ST
VIR
GIN
IA P
AR
KW
AY
S A
UT
HO
RIT
Y
SC
HE
DU
LE
OF
PE
NS
ION
CO
NT
RIB
UT
ION
S
Jun
e 30
, 201
6
Pu
bli
c E
mp
loye
es R
etir
emen
t S
yste
mLa
st 1
0 Fi
scal
Yea
rs(I
n Th
ousa
nds)
RE
QU
IRE
D S
UP
PL
EM
EN
TA
RY
IN
FO
RM
AT
ION
54
WEST VIRGINIA PARKWAYS AUTHORITY (A Component Unit of the State of West Virginia)
NOTE TO REQUIRED SUPPLEMENTARY INFORMATION Year Ended June 30, 2016
Amounts reported during the year ended June 30, 2016 reflect an adjustment of the expectation of life after disability to more closely reflect actual experience. For amounts reported in 2016, the expectation of retired life mortality was based on RP-2000 Mortality Tables rather than on the 1983 Group Annuity Mortality Table, which was used to determine amounts reported prior to 2016. Amounts reported in 2016 also reflect a change in salary increase assumptions to more closely reflect actual experience. There were no other factors that affected trends in the amounts reported. If necessary, additional information can be obtained from the CPRB Comprehensive Annual Financial Report for the year ended June 30, 2015.
55
Statistical Section
West Virginia Parkways Authority
56
Statistical Section This part of the West Virginia Parkways Authority’s Comprehensive Annual Financial Report presents detailed information as a context for understanding what the information in the financial statements, note disclosures, and required supplementary information say about the Authority’s overall financial health. Contents _________________________________________________________________ Page Financial Trends ........................................................................................................................ 58 These schedules contain trend information to help the reader understand how the Authority’s financial performance and well-being have changed over time. Debt Capacity ............................................................................................................................. 60 These schedules contain trend information to help the reader understand the Authority’s outstanding debt, the capacity to repay that debt, and the ability to issue additional debt in the future. Revenue Capacity....................................................................................................................... 62 This schedule contains trend information to help the reader understand the Authority’s capacity to earn revenues and the primary sources of those revenues. Demographic and Economic Information ............................................................................... 63 These schedules offer indicators to help the reader understand the environment within which the Authority’s financial activities take place and to help make comparisons. Miscellaneous Statistics ............................................................................................................. 65 This information may provide the reader with more insight into the Authority’s financial history and operating environment.
57
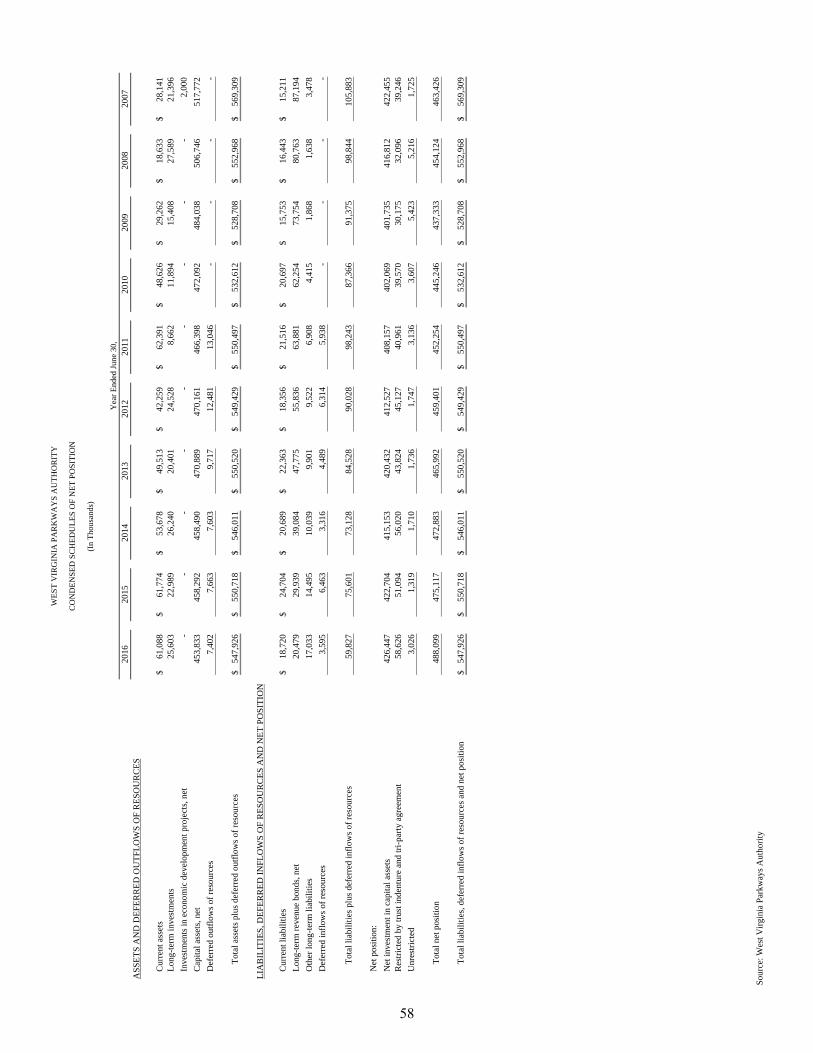
2016
2015
2014
2013
2012
2011
2010
2009
2008
2007
ASS
ETS
AN
D D
EFER
RED
OU
TFLO
WS
OF
RES
OU
RC
ES
Cur
rent
ass
ets
61,0
88$
61,7
74$
53,6
78$
49,5
13$
42,2
59$
62,3
91$
48,6
26$
29,2
62$
18,6
33$
28,1
41$
Long
-term
inve
stm
ents
25,6
03
22
,989
26
,240
20
,401
24
,528
8,
662
11
,894
15
,408
27
,589
21
,396
In
vest
men
ts in
eco
nom
ic d
evel
opm
ent p
roje
cts,
net
-
-
-
-
-
-
-
-
-
2,00
0
Cap
ital a
sset
s, ne
t45
3,83
3
45
8,29
2
45
8,49
0
47
0,88
9
47
0,16
1
466,
398
472,
092
484,
038
506,
746
517,
772
Def
erre
d ou
tflow
s of r
esou
rces
7,40
2
7,66
3
7,60
3
9,71
7
12,4
81
13,0
46
-
-
-
-
Tota
l ass
ets p
lus d
efer
red
outfl
ows o
f res
ourc
es54
7,92
6$
55
0,71
8$
54
6,01
1$
55
0,52
0$
54
9,42
9$
550,
497
$
532,
612
$
528,
708
$
552,
968
$
569,
309
$
LIA
BIL
ITIE
S, D
EFER
RED
INFL
OW
S O
F R
ESO
UR
CES
AN
D N
ET P
OSI
TIO
N
Cur
rent
liab
ilitie
s18
,720
$
24
,704
$
20
,689
$
22
,363
$
18
,356
$
21
,516
$
20
,697
$
15
,753
$
16
,443
$
15
,211
$
Lo
ng-te
rm re
venu
e bo
nds,
net
20,4
79
29
,939
39
,084
47
,775
55
,836
63
,881
62
,254
73
,754
80
,763
87
,194
O
ther
long
-term
liab
ilitie
s17
,033
14,4
95
10,0
39
9,90
1
9,52
2
6,
908
4,
415
1,
868
1,
638
3,
478
D
efer
red
inflo
ws o
f res
ourc
es3,
595
6,
463
3,
316
4,
489
6,
314
5,93
8
-
-
-
-
Tota
l lia
bilit
ies p
lus d
efer
red
inflo
ws o
f res
ourc
es59
,827
75,6
01
73,1
28
84,5
28
90,0
28
98,2
43
87,3
66
91,3
75
98,8
44
105,
883
Net
pos
ition
:N
et in
vest
men
t in
capi
tal a
sset
s42
6,44
7
42
2,70
4
415,
153
42
0,43
2
412,
527
40
8,15
7
402,
069
40
1,73
5
416,
812
42
2,45
5
Res
trict
ed b
y tru
st in
dent
ure
and
tri-p
arty
agr
eem
ent
58,6
26
51
,094
56
,020
43
,824
45
,127
40
,961
39
,570
30
,175
32
,096
39
,246
U
nres
trict
ed3,
026
1,
319
1,
710
1,
736
1,
747
3,13
6
3,60
7
5,42
3
5,21
6
1,72
5
Tota
l net
pos
ition
488,
099
475,
117
472,
883
465,
992
459,
401
45
2,25
4
44
5,24
6
43
7,33
3
45
4,12
4
46
3,42
6
Tota
l lia
bilit
ies,
defe
rred
inflo
ws o
f res
ourc
es a
nd n
et p
ositi
on54
7,92
6$
55
0,71
8$
54
6,01
1$
55
0,52
0$
54
9,42
9$
550,
497
$
532,
612
$
528,
708
$
552,
968
$
569,
309
$
Yea
r End
ed Ju
ne 3
0,
WES
T V
IRG
INIA
PA
RK
WA
YS
AU
THO
RIT
Y
CO
ND
ENSE
D S
CH
EDU
LES
OF
NET
PO
SITI
ON
(In
Thou
sand
s)
Sour
ce: W
est V
irgin
ia P
arkw
ays A
utho
rity
58
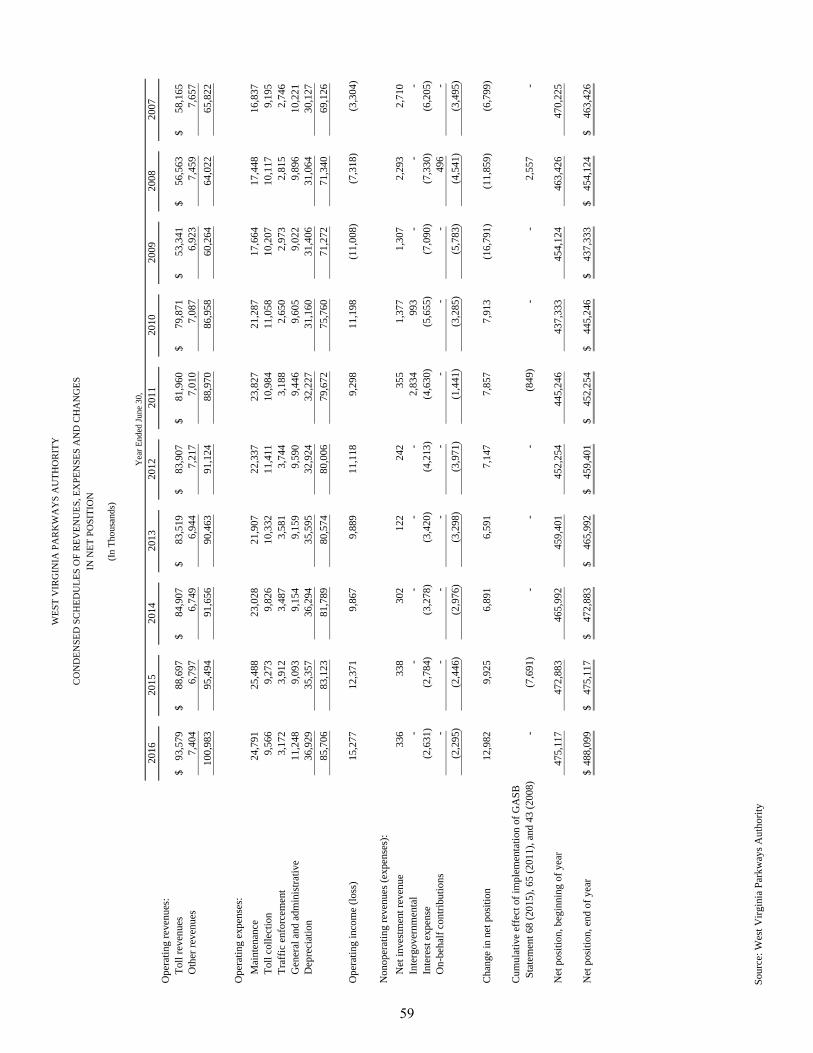
2016
2015
2014
2013
2012
2011
2010
2009
2008
2007
Ope
ratin
g re
venu
es:
Toll
reve
nues
93,5
79$
88
,697
$
84
,907
$
83
,519
$
83
,907
$
81
,960
$
79
,871
$
53
,341
$
56
,563
$
58
,165
$
O
ther
reve
nues
7,40
4
6,79
7
6,74
9
6,94
4
7,21
7
7,01
0
7,
087
6,
923
7,
459
7,
657
10
0,98
3
95
,494
91
,656
90
,463
91
,124
88,9
70
86,9
58
60,2
64
64,0
22
65
,822
Ope
ratin
g ex
pens
es:
Mai
nten
ance
24,7
91
25
,488
23
,028
21
,907
22
,337
23
,827
21
,287
17
,664
17
,448
16
,837
To
ll co
llect
ion
9,56
6
9,27
3
9,
826
10,3
32
11,4
11
10,9
84
11,0
58
10,2
07
10,1
17
9,19
5
Tr
affic
enf
orce
men
t3,
172
3,
912
3,48
7
3,
581
3,74
4
3,
188
2,65
0
2,
973
2,81
5
2,
746
Gen
eral
and
adm
inis
trativ
e11
,248
9,09
3
9,
154
9,15
9
9,
590
9,44
6
9,
605
9,02
2
9,
896
10,2
21
Dep
reci
atio
n36
,929
35,3
57
36,2
94
35,5
95
32,9
24
32
,227
31
,160
31
,406
31
,064
30,1
27
85,7
06
83
,123
81
,789
80
,574
80
,006
79,6
72
75,7
60
71,2
72
71,3
40
69
,126
Ope
ratin
g in
com
e (lo
ss)
15,2
77
12
,371
9,
867
9,
889
11
,118
9,29
8
11
,198
(1
1,00
8)
(7
,318
)
(3,3
04)
Non
oper
atin
g re
venu
es (e
xpen
ses)
:N
et in
vest
men
t rev
enue
336
338
30
2
122
24
2
355
1,
377
1,30
7
2,
293
2,71
0
In
terg
over
nmen
tal
-
-
-
-
-
2,
834
993
-
-
-
Inte
rest
exp
ense
(2,6
31)
(2
,784
)
(3,2
78)
(3,4
20)
(4,2
13)
(4
,630
)
(5
,655
)
(7
,090
)
(7
,330
)
(6,2
05)
On-
beha
lf co
ntrib
utio
ns-
-
-
-
-
-
-
-
49
6
-
(2,2
95)
(2
,446
)
(2,9
76)
(3
,298
)
(3,9
71)
(1
,441
)
(3
,285
)
(5,7
83)
(4
,541
)
(3,4
95)
Cha
nge
in n
et p
ositi
on12
,982
9,92
5
6,
891
6,59
1
7,
147
7,85
7
7,
913
(16,
791)
(1
1,85
9)
(6,7
99)
Cum
ulat
ive
effe
ct o
f im
plem
enta
tion
of G
ASB
Sta
tem
ent 6
8 (2
015)
, 65
(201
1), a
nd 4
3 (2
008)
-
(7
,691
)
-
-
-
(8
49)
-
-
2,
557
-
Net
pos
ition
, beg
inni
ng o
f yea
r47
5,11
7
47
2,88
3
46
5,99
2
45
9,40
1
45
2,25
4
44
5,24
6
437,
333
454,
124
463,
426
470,
225
Net
pos
ition
, end
of y
ear
488,
099
$
475,
117
$
472,
883
$
465,
992
$
459,
401
$
452,
254
$
44
5,24
6$
43
7,33
3$
45
4,12
4$
46
3,42
6$
(In
Thou
sand
s)
Yea
r End
ed Ju
ne 3
0,
WES
T V
IRG
INIA
PA
RK
WA
YS
AU
THO
RIT
Y
CO
ND
ENSE
D S
CH
EDU
LES
OF
REV
ENU
ES, E
XPE
NSE
S A
ND
CH
AN
GES
IN N
ET P
OSI
TIO
N
Sour
ce: W
est V
irgin
ia P
arkw
ays A
utho
rity
59
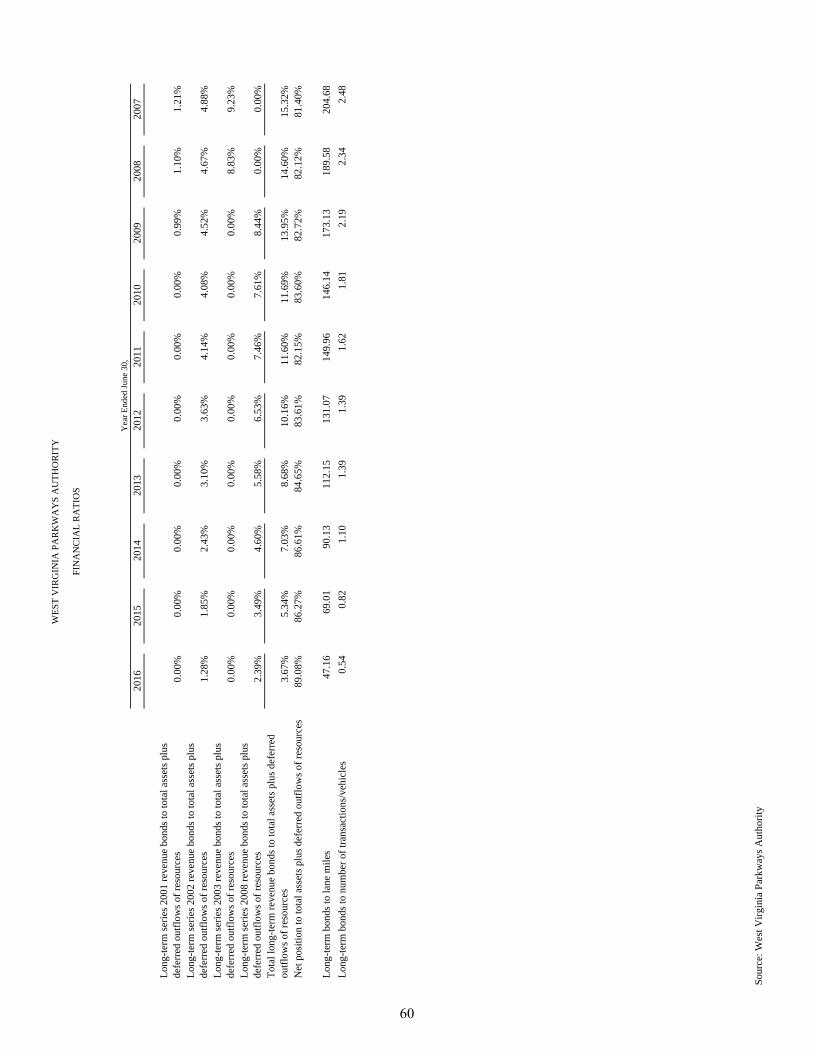
2016
2015
2014
2013
2012
2011
2010
2009
2008
2007
Long
-term
serie
s 200
1 re
venu
e bo
nds t
o to
tal a
sset
s plu
s de
ferr
ed o
utflo
ws o
f res
ourc
es0.
00%
0.00
%0.
00%
0.00
%0.
00%
0.00
%0.
00%
0.99
%1.
10%
1.21
%Lo
ng-te
rm se
ries 2
002
reve
nue
bond
s to
tota
l ass
ets p
lus
defe
rred
out
flow
s of r
esou
rces
1.28
%1.
85%
2.43
%3.
10%
3.63
%4.
14%
4.08
%4.
52%
4.67
%4.
88%
Long
-term
serie
s 200
3 re
venu
e bo
nds t
o to
tal a
sset
s plu
s de
ferr
ed o
utflo
ws o
f res
ourc
es0.
00%
0.00
%0.
00%
0.00
%0.
00%
0.00
%0.
00%
0.00
%8.
83%
9.23
%Lo
ng-te
rm se
ries 2
008
reve
nue
bond
s to
tota
l ass
ets p
lus
defe
rred
out
flow
s of r
esou
rces
2.39
%3.
49%
4.60
%5.
58%
6.53
%7.
46%
7.61
%8.
44%
0.00
%0.
00%
Tota
l lon
g-te
rm re
venu
e bo
nds t
o to
tal a
sset
s plu
s def
erre
d ou
tflow
s of r
esou
rces
3.67
%5.
34%
7.03
%8.
68%
10.1
6%11
.60%
11.6
9%13
.95%
14.6
0%15
.32%
Net
pos
ition
to to
tal a
sset
s plu
s def
erre
d ou
tflow
s of r
esou
rces
89
.08%
86.2
7%86
.61%
84.6
5%83
.61%
82.1
5%83
.60%
82.7
2%82
.12%
81.4
0%
Long
-term
bon
ds to
lane
mile
s47
.16
69.0
190
.13
112.
1513
1.07
149.
9614
6.14
173.
1318
9.58
204.
68Lo
ng-te
rm b
onds
to n
umbe
r of t
rans
actio
ns/v
ehic
les
0.54
0.82
1.10
1.39
1.39
1.62
1.81
2.19
2.34
2.48
Yea
r End
ed Ju
ne 3
0,
WES
T V
IRG
INIA
PA
RK
WA
YS
AU
THO
RIT
Y
FIN
AN
CIA
L R
ATI
OS
Sour
ce: W
est V
irgin
ia P
arkw
ays A
utho
rity
60
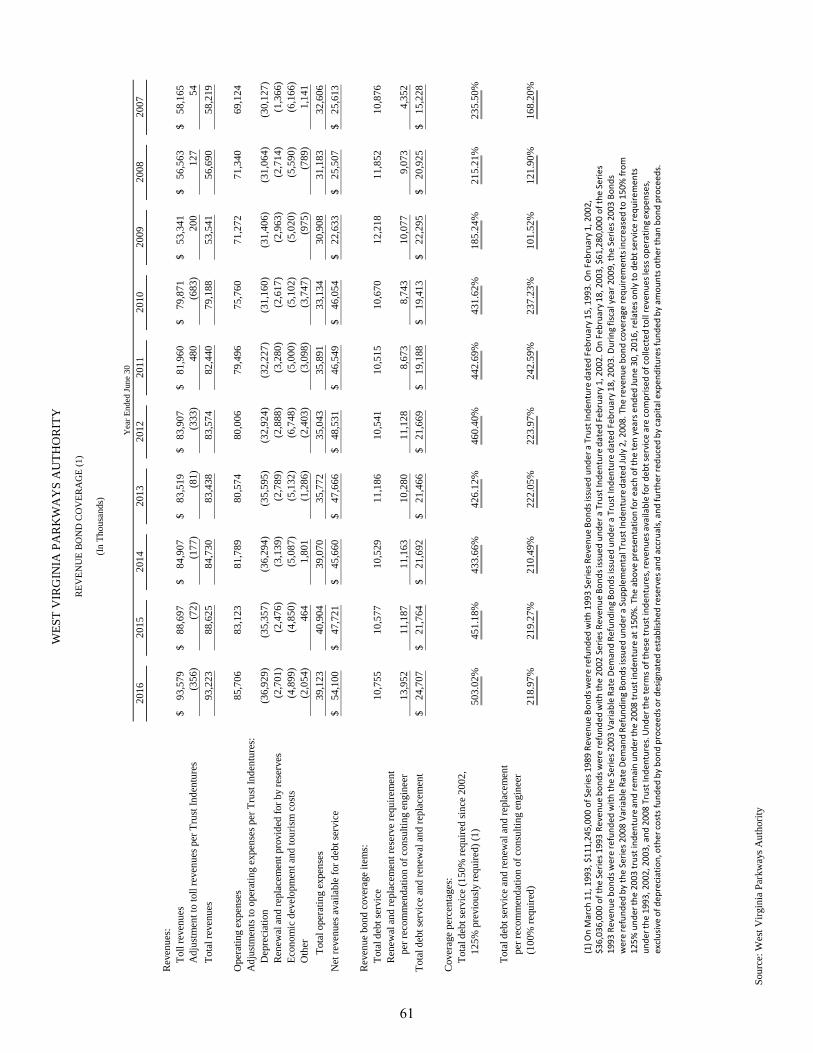
2016
2015
2014
2013
2012
2011
2010
2009
2008
2007
Rev
enue
s:To
ll re
venu
es93
,579
$
88
,697
$
84
,907
$
83
,519
$
83
,907
$
81,9
60$
79,8
71$
53,3
41$
56,5
63$
58,1
65$
Adj
ustm
ent t
o to
ll re
venu
es p
er T
rust
Inde
ntur
es(3
56)
(72)
(1
77)
(81)
(3
33)
480
(683
)
20
0
12
7
54
To
tal r
even
ues
93,2
23
88,6
25
84,7
30
83,4
38
83,5
74
82
,440
79
,188
53
,541
56
,690
58
,219
Ope
ratin
g ex
pens
es85
,706
83
,123
81
,789
80
,574
80
,006
79,4
96
75,7
60
71,2
72
71,3
40
69,1
24
Adj
ustm
ents
to o
pera
ting
expe
nses
per
Tru
st In
dent
ures
:D
epre
ciat
ion
(36,
929)
(35,
357)
(36,
294)
(35,
595)
(32,
924)
(32,
227)
(31,
160)
(31,
406)
(31,
064)
(30,
127)
Ren
ewal
and
repl
acem
ent p
rovi
ded
for b
y re
serv
es(2
,701
)
(2,4
76)
(3
,139
)
(2,7
89)
(2
,888
)
(3,2
80)
(2
,617
)
(2,9
63)
(2
,714
)
(1,3
66)
Ec
onom
ic d
evel
opm
ent a
nd to
uris
m c
osts
(4,8
99)
(4
,850
)
(5,0
87)
(5
,132
)
(6,7
48)
(5
,000
)
(5,1
02)
(5
,020
)
(5,5
90)
(6
,166
)
Oth
er(2
,054
)
464
1,80
1
(1,2
86)
(2
,403
)
(3,0
98)
(3
,747
)
(975
)
(7
89)
1,14
1
Tota
l ope
ratin
g ex
pens
es39
,123
40
,904
39
,070
35
,772
35
,043
35,8
91
33,1
34
30,9
08
31,1
83
32,6
06
Net
reve
nues
ava
ilabl
e fo
r deb
t ser
vice
54,1
00$
47,7
21$
45,6
60$
47,6
66$
48,5
31$
46
,549
$
46
,054
$
22
,633
$
25
,507
$
25
,613
$
Rev
enue
bon
d co
vera
ge it
ems:
Tota
l deb
t ser
vice
10,7
55
10,5
77
10,5
29
11,1
86
10,5
41
10
,515
10
,670
12
,218
11
,852
10
,876
R
enew
al a
nd re
plac
emen
t res
erve
requ
irem
ent
per r
ecom
men
datio
n of
con
sulti
ng e
ngin
eer
13,9
52
11,1
87
11,1
63
10,2
80
11,1
28
8,
673
8,
743
10
,077
9,
073
4,
352
To
tal d
ebt s
ervi
ce a
nd re
new
al a
nd re
plac
emen
t24
,707
$
21
,764
$
21
,692
$
21
,466
$
21
,669
$
19,1
88$
19,4
13$
22,2
95$
20,9
25$
15,2
28$
(In T
hous
ands
)
WES
T V
IRG
INIA
PA
RK
WA
YS
AU
THO
RIT
Y
REV
ENU
E BO
ND
CO
VER
AG
E (1
)
Yea
r End
ed Ju
ne 3
0
Cov
erag
e pe
rcen
tage
s:To
tal d
ebt s
ervi
ce (1
50%
requ
ired
sinc
e 20
02,
125%
pre
viou
sly re
quire
d) (1
)50
3.02
%45
1.18
%43
3.66
%42
6.12
%46
0.40
%44
2.69
%43
1.62
%18
5.24
%21
5.21
%23
5.50
%
Tota
l deb
t ser
vice
and
rene
wal
and
repl
acem
ent
per r
ecom
men
datio
n of
con
sulti
ng e
ngin
eer
(100
% re
quire
d)21
8.97
%21
9.27
%21
0.49
%22
2.05
%22
3.97
%24
2.59
%23
7.23
%10
1.52
%12
1.90
%16
8.20
%
(1) O
n March 11, 1993,$111,245,000
of Series 1
989 Re
venu
e Bo
nds w
ere refund
ed with
1993 Serie
s Reven
ue Bon
ds issued
und
er a Trust Inde
nture da
ted Februa
ry 15, 1993. On Februa
ry 1, 2002,
$36,036,000 of th
e Serie
s 1993 Re
venu
e bo
nds w
ere refund
ed with
the 2002
Series R
even
ue Bon
ds issued
und
er a Trust Inde
nture da
ted Februa
ry 1, 2002. On Februa
ry 18, 2003, $61,280,000
of the
Series
1993
Reven
ue bon
ds were refund
ed with
the Serie
s 2003 Va
riable Ra
te Dem
and Re
fund
ing Bo
nds issue
d un
der a
Trust Inde
nture da
ted Februa
ry 18, 2003. During fiscal year 2
009, th
e Serie
s 2003 Bo
nds
were refund
ed by the Serie
s 2008 Va
riable Ra
te Dem
and Re
fund
ing Bo
nds issue
d un
der a
Sup
plem
ental Trus t Inde
nture da
ted July 2, 2008. The
revenu
e bo
nd co
verage re
quire
men
ts increased to 150% from
125%
und
er th
e 2003
trust ind
enture and
remain un
der the
2008 trust ind
enture at 1
50%. The
abo
ve presentation for e
ach of th
eten years e
nded
June
30, 2016, re
lates o
nly to deb
t service re
quire
men
ts
unde
r the
1993, 2002, 2003, and
2008 Trust Ind
entures. Und
er th
e term
s of the
se trust ind
entures, re
venu
es available for d
ebtservice are com
prise
d of collected
toll revenu
es less ope
ratin
g expe
nses,
exclusive of dep
reciation, other co
sts fun
ded by
bon
d proceeds or d
esigna
ted establish
ed re
serves and
accruals, and
furthe
r red
uced
by capital expen
ditures fun
ded by
amou
nts o
ther th
an bon
d proceeds.
Sour
ce: W
est V
irgin
ia P
arkw
ays A
utho
rity
61
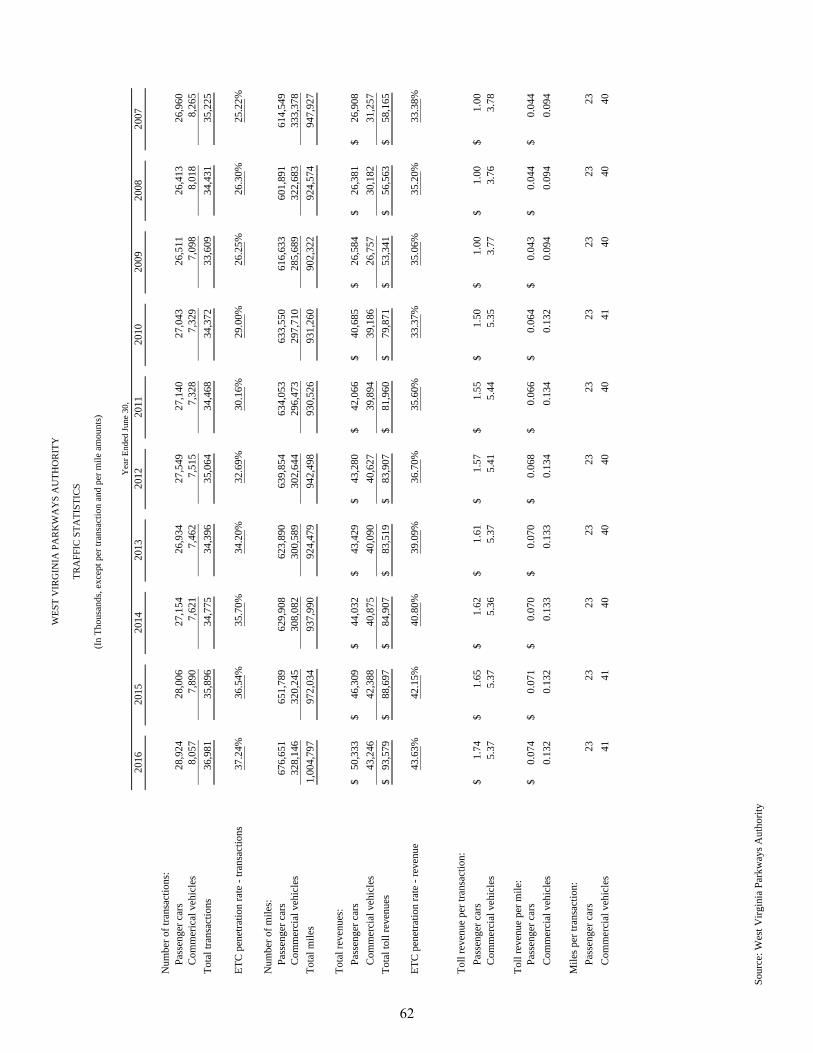
2016
2015
2014
2013
2012
2011
2010
2009
2008
2007
Num
ber o
f tra
nsac
tions
:Pa
ssen
ger c
ars
28,9
24
28
,006
27
,154
26
,934
27
,549
27
,140
27
,043
26
,511
26
,413
26
,960
C
omm
eric
al v
ehic
les
8,05
7
7,89
0
7,62
1
7,46
2
7,51
5
7,32
8
7,
329
7,
098
8,
018
8,
265
To
tal t
rans
actio
ns36
,981
35,8
96
34,7
75
34,3
96
35,0
64
34
,468
34
,372
33
,609
34
,431
35,2
25
ETC
pen
etra
tion
rate
- tra
nsac
tions
37.2
4%36
.54%
35.7
0%34
.20%
32.6
9%30
.16%
29.0
0%26
.25%
26.3
0%25
.22%
Num
ber o
f mile
s:Pa
ssen
ger c
ars
676,
651
651,
789
62
9,90
8
623,
890
63
9,85
4
63
4,05
3
633,
550
61
6,63
3
601,
891
614,
549
C
omm
erci
al v
ehic
les
328,
146
320,
245
308,
082
300,
589
302,
644
296,
473
29
7,71
0
28
5,68
9
32
2,68
3
33
3,37
8
To
tal m
iles
1,00
4,79
7
972,
034
937,
990
924,
479
942,
498
930,
526
93
1,26
0
90
2,32
2
92
4,57
4
94
7,92
7
Tota
l rev
enue
s:Pa
ssen
ger c
ars
50,3
33$
46
,309
$
44
,032
$
43
,429
$
43
,280
$
42
,066
$
40
,685
$
26
,584
$
26
,381
$
26
,908
$
C
omm
erci
al v
ehic
les
43,2
46
42
,388
40
,875
40
,090
40
,627
39,8
94
39,1
86
26,7
57
30,1
82
31
,257
To
tal t
oll r
even
ues
93,5
79$
88
,697
$
84
,907
$
83
,519
$
83
,907
$
81
,960
$
79
,871
$
53
,341
$
56
,563
$
58
,165
$
ETC
pen
etra
tion
rate
- re
venu
e43
.63%
42.1
5%40
.80%
39.0
9%36
.70%
35.6
0%33
.37%
35.0
6%35
.20%
33.3
8%
Toll
reve
nue
per t
rans
actio
n:Pa
ssen
ger c
ars
1.74
$
1.65
$
1.
62$
1.61
$
1.
57$
1.
55$
1.50
$
1.
00$
1.00
$
1.00
$
C
omm
erci
al v
ehic
les
5.37
5.37
5.
36
5.37
5.
41
5.
44
5.35
3.
77
3.76
3.78
Toll
reve
nue
per m
ile:
Pass
enge
r car
s0.
074
$
0.
071
$
0.07
0$
0.
070
$
0.06
8$
0.06
6$
0.
064
$
0.04
3$
0.
044
$
0.
044
$
Com
mer
cial
veh
icle
s0.
132
0.
132
0.13
3
0.
133
0.13
4
0.
134
0.13
2
0.
094
0.09
4
0.
094
Mile
s per
tran
sact
ion:
Pass
enge
r car
s23
23
23
23
23
23
23
23
23
23
C
omm
erci
al v
ehic
les
41
41
40
40
40
40
41
40
40
40
Yea
r End
ed Ju
ne 3
0,
WES
T V
IRG
INIA
PA
RK
WA
YS
AU
THO
RIT
Y
TRA
FFIC
STA
TIST
ICS
(In
Thou
sand
s, ex
cept
per
tran
sact
ion
and
per m
ile a
mou
nts)
Sour
ce: W
est V
irgin
ia P
arkw
ays A
utho
rity
62
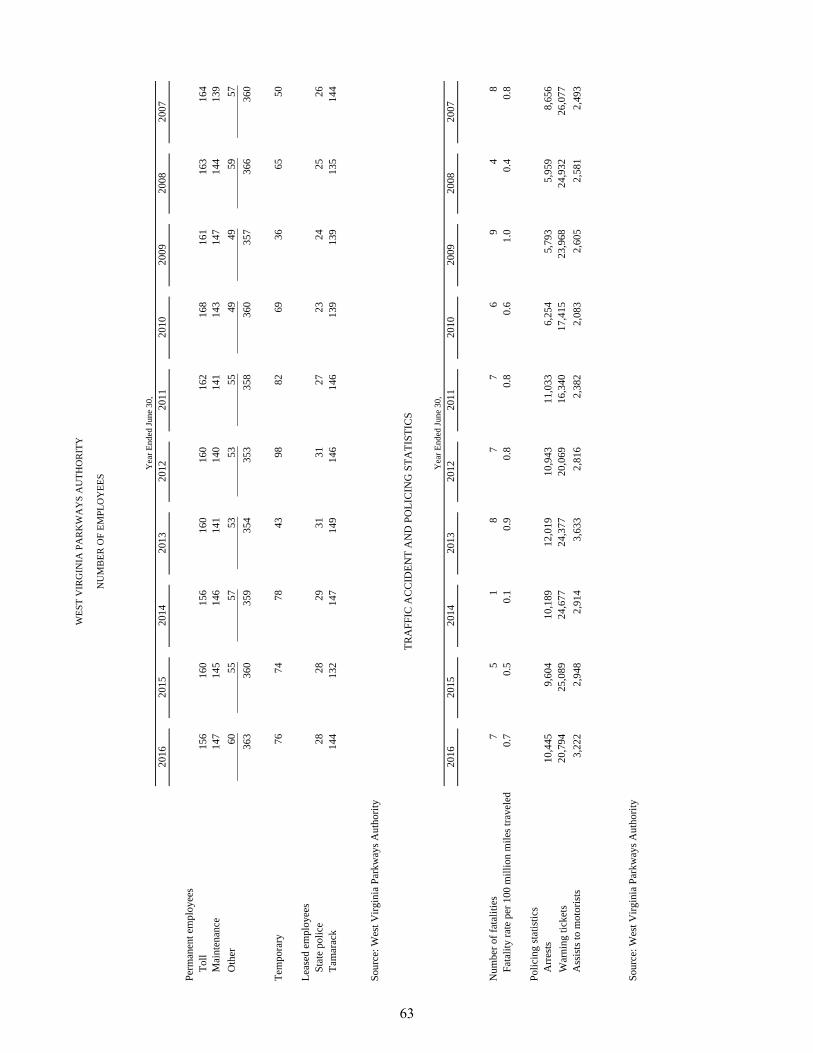
2016
2015
2014
2013
2012
2011
2010
2009
2008
2007
Perm
anen
t em
ploy
ees
Toll
156
160
15
6
160
16
0
162
16
8
161
16
3
164
M
aint
enan
ce14
7
14
5
14
6
14
1
14
0
14
1
143
147
144
139
Oth
er60
55
57
53
53
55
49
49
59
57
36
3
36
0
35
9
35
4
35
3
35
8
360
357
366
360
Tem
pora
ry76
74
78
43
98
82
69
36
65
50
Leas
ed e
mpl
oyee
sSt
ate
polic
e28
28
29
31
31
27
23
24
25
26
Tam
arac
k14
4
13
2
147
14
9
146
14
6
139
13
9
135
14
4
Sour
ce: W
est V
irgin
ia P
arkw
ays A
utho
rity
2016
2015
2014
2013
2012
2011
2010
2009
2008
2007
Num
ber o
f fat
aliti
es7
5
1
8
7
7
6
9
4
8
Fa
talit
y ra
te p
er 1
00 m
illio
n m
iles t
rave
led
0.
7
0.5
0.
1
0.9
0.
8
0.8
0.
6
1.0
0.
4
0.8
Polic
ing
stat
istic
sA
rres
ts10
,445
9,
604
10,1
89
12,0
19
10,9
43
11,0
33
6,25
4
5,
793
5,95
9
8,
656
War
ning
tick
ets
20,7
94
25,0
89
24,6
77
24,3
77
20,0
69
16,3
40
17,4
15
23,9
68
24,9
32
26,0
77
Ass
ists
to m
otor
ists
3,22
2
2,94
8
2,
914
3,63
3
2,
816
2,38
2
2,
083
2,60
5
2,
581
2,49
3
Sour
ce: W
est V
irgin
ia P
arkw
ays A
utho
rity
NU
MB
ER O
F EM
PLO
YEE
S
TRA
FFIC
AC
CID
ENT
AN
D P
OLI
CIN
G S
TATI
STIC
S
Yea
r End
ed Ju
ne 3
0,
Yea
r End
ed Ju
ne 3
0,
WES
T V
IRG
INIA
PA
RK
WA
YS
AU
THO
RIT
Y
63
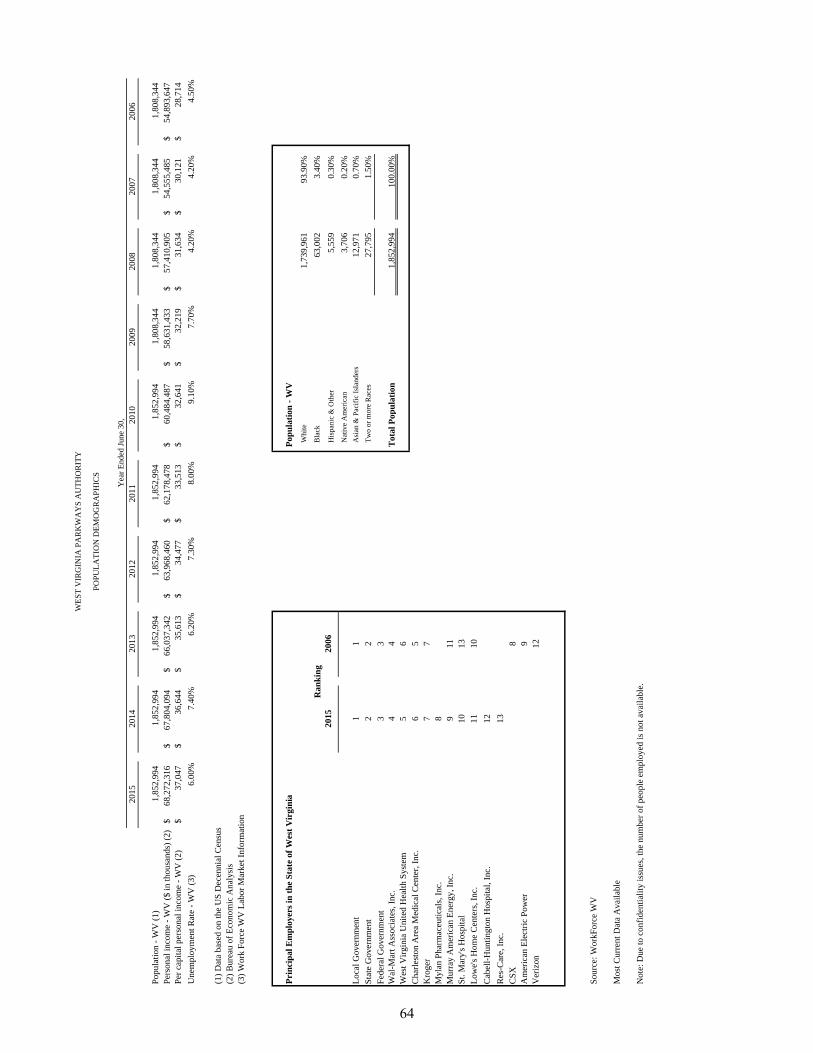
2015
2014
2013
2012
2011
2010
2009
2008
2007
2006
Popu
latio
n - W
V (1
)1,
852,
994
1,85
2,99
4
1,
852,
994
1,85
2,99
4
1,
852,
994
1,85
2,99
4
1,80
8,34
4
1,
808,
344
1,80
8,34
4
1,
808,
344
Pers
onal
inco
me
- WV
($ in
thou
sand
s) (2
)68
,272
,316
$
67
,804
,094
$
66
,037
,342
$
63
,968
,460
$
62
,178
,478
$
60
,484
,487
$
58,6
31,4
33$
57,4
10,9
05$
54,5
55,4
85$
54,8
93,6
47$
Per c
apita
l per
sona
l inc
ome
- WV
(2)
37,0
47$
36,6
44$
35,6
13$
34,4
77$
33,5
13$
32,6
41$
32
,219
$
31
,634
$
30
,121
$
28
,714
$
U
nem
ploy
men
t Rat
e - W
V (3
)6.
00%
7.40
%6.
20%
7.30
%8.
00%
9.10
%7.
70%
4.20
%4.
20%
4.50
%
(1) D
ata
base
d on
the
US
Dec
enni
al C
ensu
s(2
) Bur
eau
of E
cono
mic
Ana
lysi
s(3
) Wor
k Fo
rce
WV
Lab
or M
arke
t Inf
orm
atio
n
Pri
nci
pal
Em
plo
yers
in t
he
Sta
te o
f W
est
Vir
gin
iaP
opu
lati
on -
WV
Whi
te1,
739,
961
93.9
0%B
lack
63,0
02
3.
40%
2015
2006
His
pani
c &
Oth
er5,
559
0.30
%N
ativ
e A
mer
ican
3,70
6
0.
20%
Loca
l Gov
ernm
ent
11
Asi
an &
Pac
ific
Isla
nder
s12
,971
0.70
%St
ate
Gov
ernm
ent
22
Two
or m
ore
Rac
es27
,795
1.50
%Fe
dera
l Gov
ernm
ent
33
Wal
-Mar
t Ass
ocia
tes,
Inc.
44
Tot
al P
opu
lati
on1,
852,
994
10
0.00
%W
est V
irgin
ia U
nite
d H
ealth
Sys
tem
56
Cha
rlest
on A
rea
Med
ical
Cen
ter,
Inc.
65
Kro
ger
77
Myl
an P
harm
aceu
tical
s, In
c.8
Mur
ray
Am
eric
an E
nerg
y, In
c.9
11St
. Mar
y's H
ospi
tal
1013
Low
e's H
ome
Cen
ters
, Inc
.11
10C
abel
l-Hun
tingt
on H
ospi
tal,
Inc.
12R
es-C
are,
Inc.
13C
SX8
Am
eric
an E
lect
ric P
ower
9V
eriz
on12
Sour
ce: W
orkF
orce
WV
Mos
t Cur
rent
Dat
a A
vaila
ble
Not
e: D
ue to
con
fiden
tialit
y is
sues
, the
num
ber o
f peo
ple
empl
oyed
is n
ot a
vaila
ble.
Ran
kin
g
Yea
r End
ed Ju
ne 3
0,
WES
T V
IRG
INIA
PA
RK
WA
YS
AU
THO
RIT
Y
POPU
LATI
ON
DEM
OG
RA
PHIC
S
64
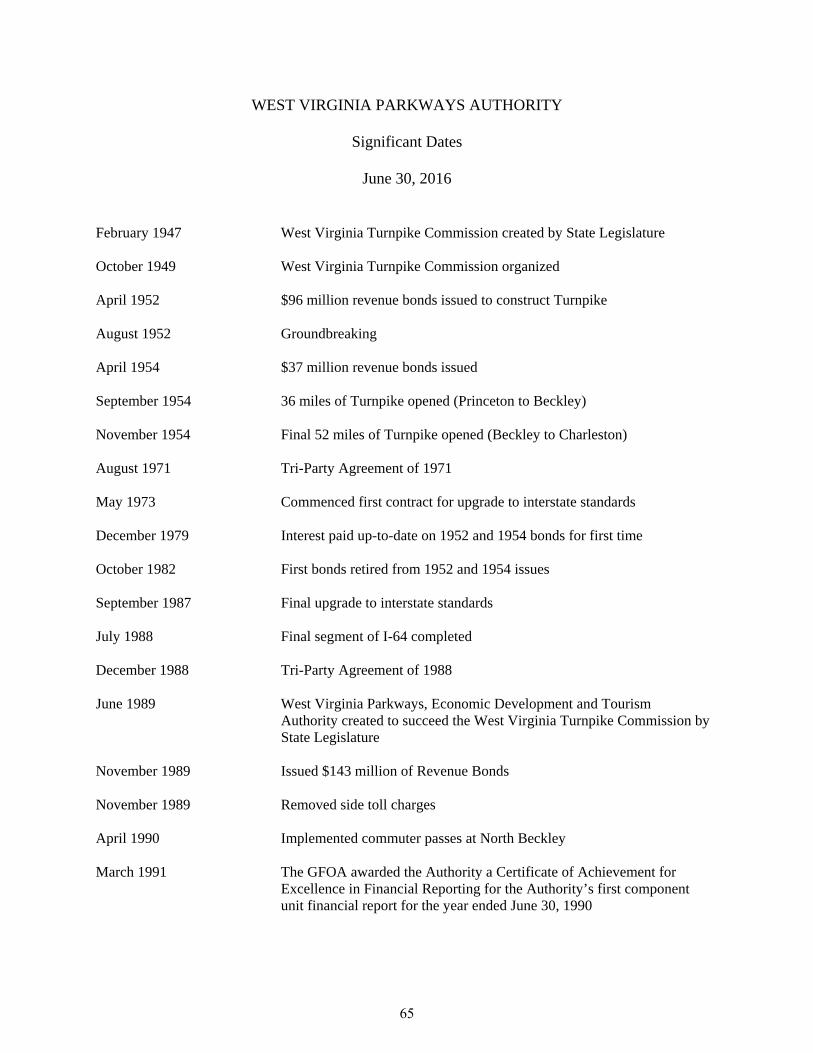
WEST VIRGINIA PARKWAYS AUTHORITY
Significant Dates
June 30, 2016
February 1947 West Virginia Turnpike Commission created by State Legislature October 1949 West Virginia Turnpike Commission organized April 1952 $96 million revenue bonds issued to construct Turnpike August 1952 Groundbreaking April 1954 $37 million revenue bonds issued September 1954 36 miles of Turnpike opened (Princeton to Beckley) November 1954 Final 52 miles of Turnpike opened (Beckley to Charleston) August 1971 Tri-Party Agreement of 1971 May 1973 Commenced first contract for upgrade to interstate standards December 1979 Interest paid up-to-date on 1952 and 1954 bonds for first time October 1982 First bonds retired from 1952 and 1954 issues September 1987 Final upgrade to interstate standards July 1988 Final segment of I-64 completed December 1988 Tri-Party Agreement of 1988 June 1989 West Virginia Parkways, Economic Development and Tourism
Authority created to succeed the West Virginia Turnpike Commission by State Legislature
November 1989 Issued $143 million of Revenue Bonds November 1989 Removed side toll charges April 1990 Implemented commuter passes at North Beckley March 1991 The GFOA awarded the Authority a Certificate of Achievement for
Excellence in Financial Reporting for the Authority’s first component unit financial report for the year ended June 30, 1990
65
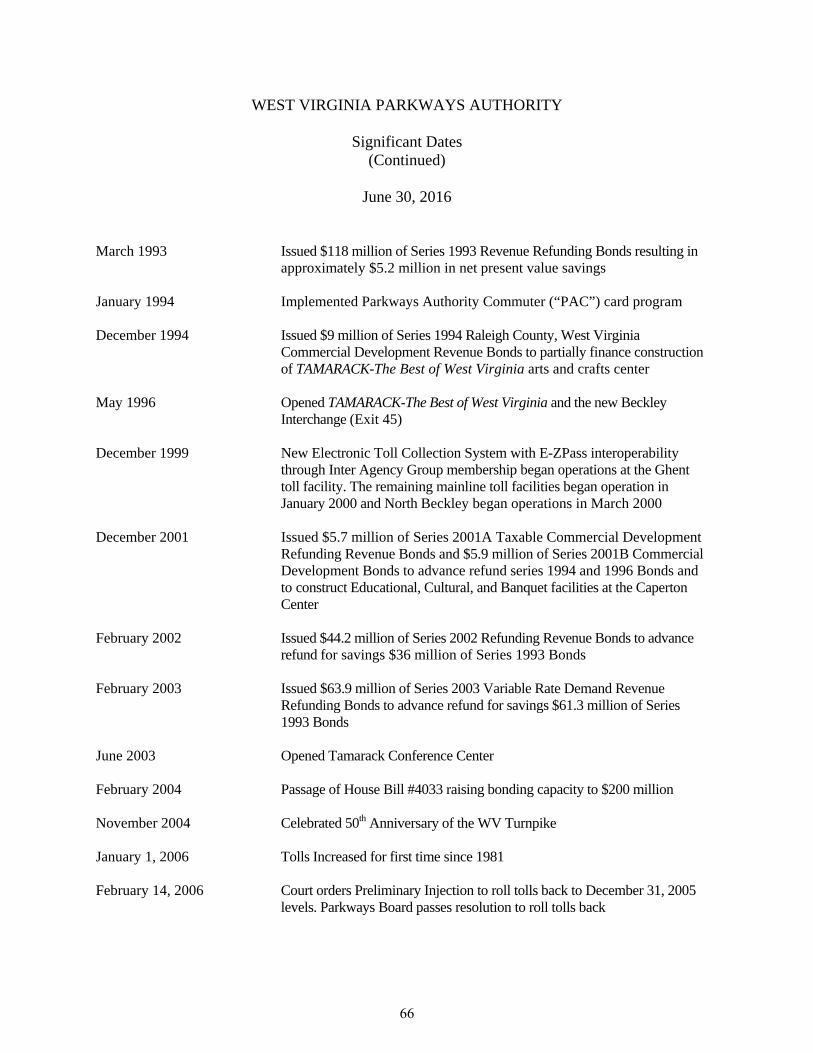
WEST VIRGINIA PARKWAYS AUTHORITY
Significant Dates (Continued)
June 30, 2016
March 1993 Issued $118 million of Series 1993 Revenue Refunding Bonds resulting in approximately $5.2 million in net present value savings
January 1994 Implemented Parkways Authority Commuter (“PAC”) card program December 1994 Issued $9 million of Series 1994 Raleigh County, West Virginia
Commercial Development Revenue Bonds to partially finance construction of TAMARACK-The Best of West Virginia arts and crafts center
May 1996 Opened TAMARACK-The Best of West Virginia and the new Beckley
Interchange (Exit 45) December 1999 New Electronic Toll Collection System with E-ZPass interoperability
through Inter Agency Group membership began operations at the Ghent toll facility. The remaining mainline toll facilities began operation in January 2000 and North Beckley began operations in March 2000
December 2001 Issued $5.7 million of Series 2001A Taxable Commercial Development
Refunding Revenue Bonds and $5.9 million of Series 2001B Commercial Development Bonds to advance refund series 1994 and 1996 Bonds and to construct Educational, Cultural, and Banquet facilities at the Caperton Center
February 2002 Issued $44.2 million of Series 2002 Refunding Revenue Bonds to advance
refund for savings $36 million of Series 1993 Bonds February 2003 Issued $63.9 million of Series 2003 Variable Rate Demand Revenue
Refunding Bonds to advance refund for savings $61.3 million of Series 1993 Bonds
June 2003 Opened Tamarack Conference Center February 2004 Passage of House Bill #4033 raising bonding capacity to $200 million November 2004 Celebrated 50th Anniversary of the WV Turnpike January 1, 2006 Tolls Increased for first time since 1981 February 14, 2006 Court orders Preliminary Injection to roll tolls back to December 31, 2005
levels. Parkways Board passes resolution to roll tolls back
66
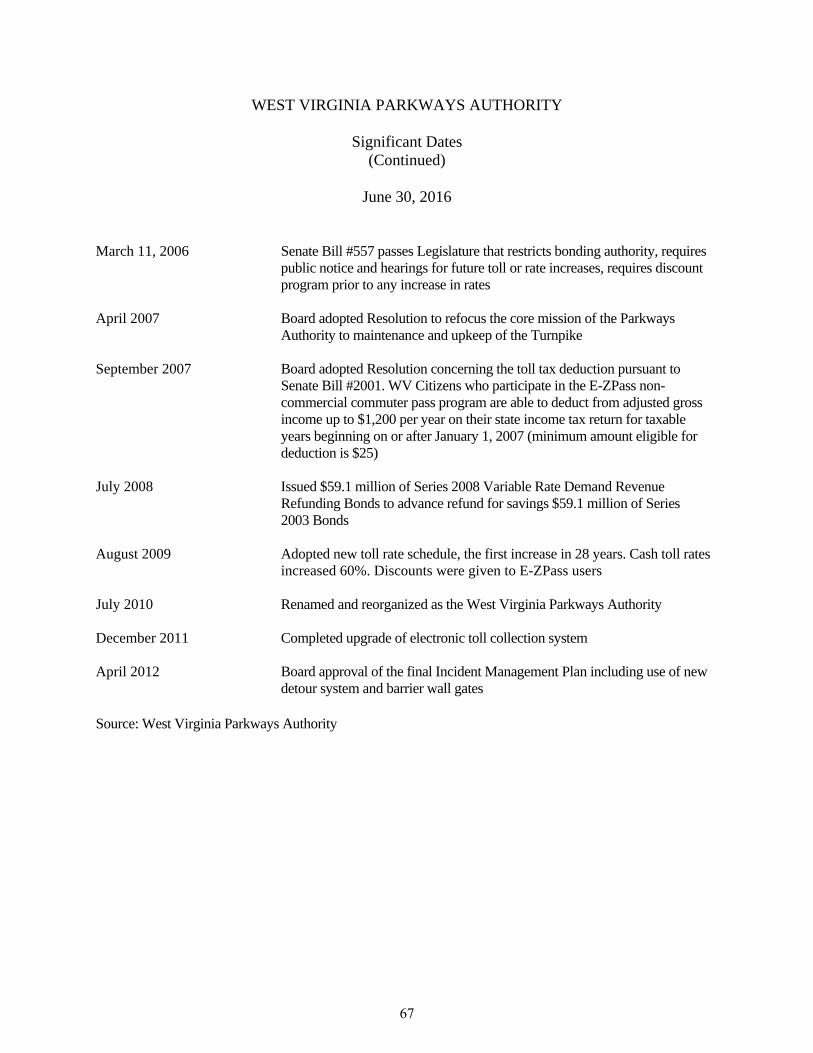
WEST VIRGINIA PARKWAYS AUTHORITY
Significant Dates (Continued)
June 30, 2016
March 11, 2006 Senate Bill #557 passes Legislature that restricts bonding authority, requires public notice and hearings for future toll or rate increases, requires discount program prior to any increase in rates
April 2007 Board adopted Resolution to refocus the core mission of the Parkways
Authority to maintenance and upkeep of the Turnpike September 2007 Board adopted Resolution concerning the toll tax deduction pursuant to
Senate Bill #2001. WV Citizens who participate in the E-ZPass non-commercial commuter pass program are able to deduct from adjusted gross income up to $1,200 per year on their state income tax return for taxable years beginning on or after January 1, 2007 (minimum amount eligible for deduction is $25)
July 2008 Issued $59.1 million of Series 2008 Variable Rate Demand Revenue
Refunding Bonds to advance refund for savings $59.1 million of Series 2003 Bonds
August 2009 Adopted new toll rate schedule, the first increase in 28 years. Cash toll rates
increased 60%. Discounts were given to E-ZPass users July 2010 Renamed and reorganized as the West Virginia Parkways Authority December 2011 Completed upgrade of electronic toll collection system April 2012 Board approval of the final Incident Management Plan including use of new
detour system and barrier wall gates
Source: West Virginia Parkways Authority
67
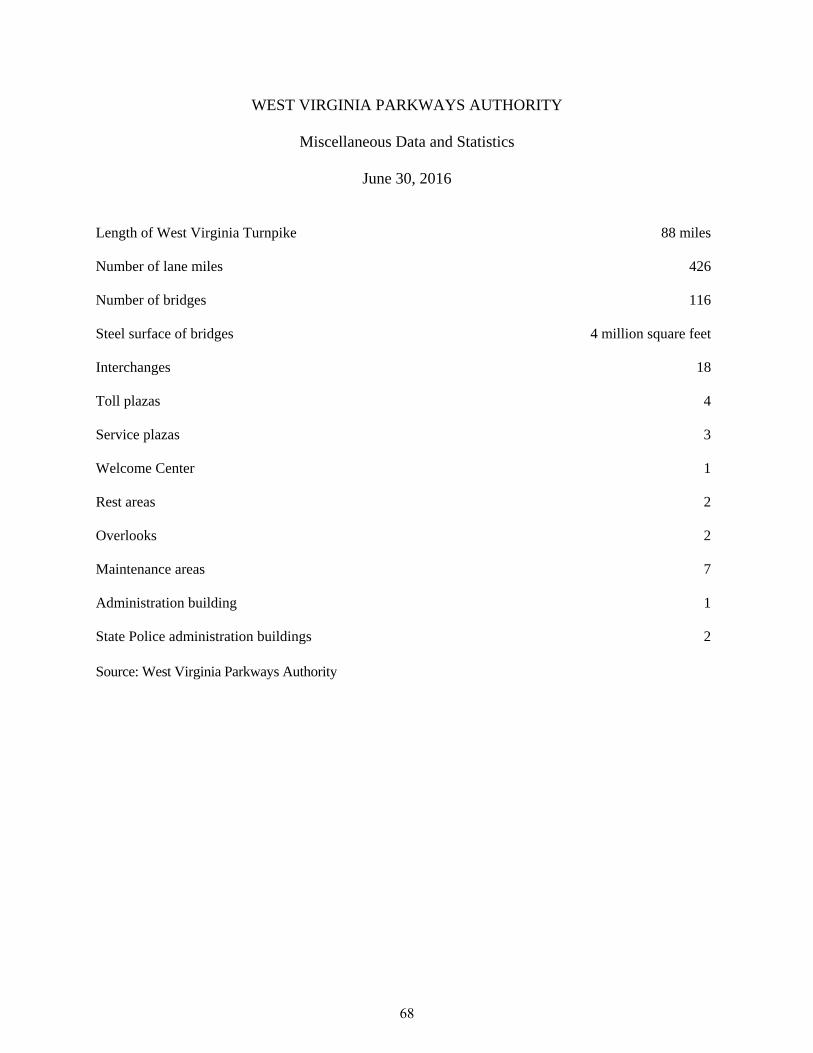
WEST VIRGINIA PARKWAYS AUTHORITY
Miscellaneous Data and Statistics
June 30, 2016
Length of West Virginia Turnpike 88 miles Number of lane miles 426 Number of bridges 116 Steel surface of bridges 4 million square feet Interchanges 18 Toll plazas 4 Service plazas 3 Welcome Center 1 Rest areas 2 Overlooks 2 Maintenance areas 7 Administration building 1 State Police administration buildings 2 Source: West Virginia Parkways Authority
68
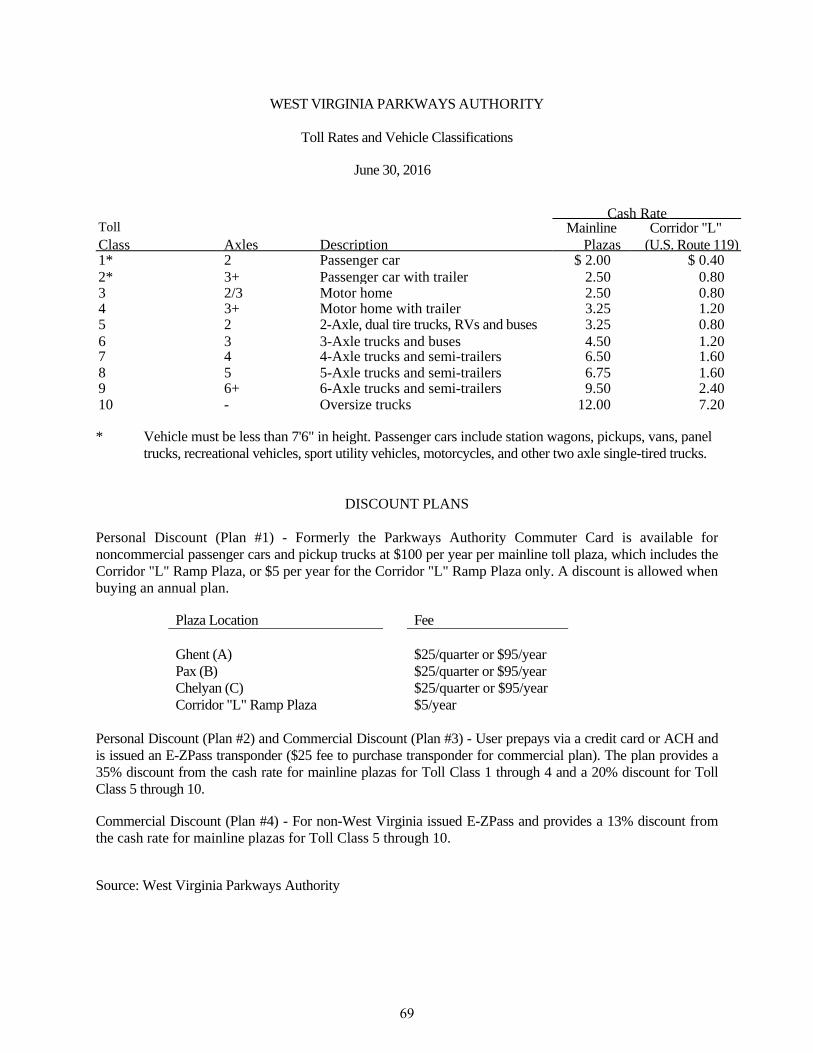
WEST VIRGINIA PARKWAYS AUTHORITY
Toll Rates and Vehicle Classifications
June 30, 2016
Cash RateToll Mainline Corridor "L" Class Axles Description Plazas (U.S. Route 119)1* 2 Passenger car $ 2.00 $ 0.40 2* 3+ Passenger car with trailer 2.50 0.803 2/3 Motor home 2.50 0.804 3+ Motor home with trailer 3.25 1.205 2 2-Axle, dual tire trucks, RVs and buses 3.25 0.80 6 3 3-Axle trucks and buses 4.50 1.207 4 4-Axle trucks and semi-trailers 6.50 1.608 5 5-Axle trucks and semi-trailers 6.75 1.609 6+ 6-Axle trucks and semi-trailers 9.50 2.4010 - Oversize trucks 12.00 7.20 * Vehicle must be less than 7'6" in height. Passenger cars include station wagons, pickups, vans, panel
trucks, recreational vehicles, sport utility vehicles, motorcycles, and other two axle single-tired trucks.
DISCOUNT PLANS Personal Discount (Plan #1) - Formerly the Parkways Authority Commuter Card is available for noncommercial passenger cars and pickup trucks at $100 per year per mainline toll plaza, which includes the Corridor "L" Ramp Plaza, or $5 per year for the Corridor "L" Ramp Plaza only. A discount is allowed when buying an annual plan.
Plaza Location Fee Ghent (A) $25/quarter or $95/year Pax (B) $25/quarter or $95/year Chelyan (C) $25/quarter or $95/year Corridor "L" Ramp Plaza $5/year
Personal Discount (Plan #2) and Commercial Discount (Plan #3) - User prepays via a credit card or ACH and is issued an E-ZPass transponder ($25 fee to purchase transponder for commercial plan). The plan provides a 35% discount from the cash rate for mainline plazas for Toll Class 1 through 4 and a 20% discount for Toll Class 5 through 10. Commercial Discount (Plan #4) - For non-West Virginia issued E-ZPass and provides a 13% discount from the cash rate for mainline plazas for Toll Class 5 through 10. Source: West Virginia Parkways Authority
69
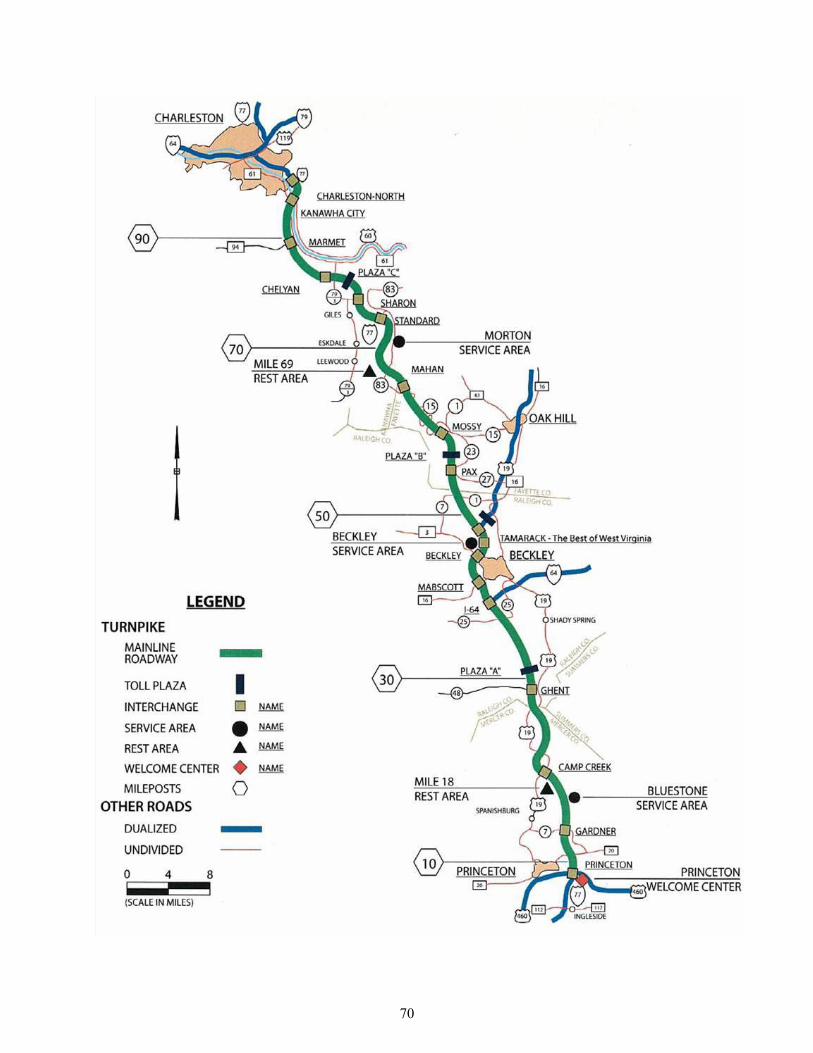
70