Embed Size (px)
Citation preview
The Virginia Port Authority is a component unit of the Commonwealth of Virginia.
VIRGINIA PORT AUTHORITY Comprehensive Annual Financial ReportFor Fiscal Year ended June 30, 2016

COMPREHENSIVE ANNUAL
FINANCIAL REPORTFOR THE
VIRGINIA PORT AUTHORITY
A COMPONENT UNIT OF THE COMMONWEALTH OF VIRGINIA
FOR THE FISCAL YEAR ENDED JUNE 30, 2016
Prepared by the Finance Division of the Virginia Port Authority
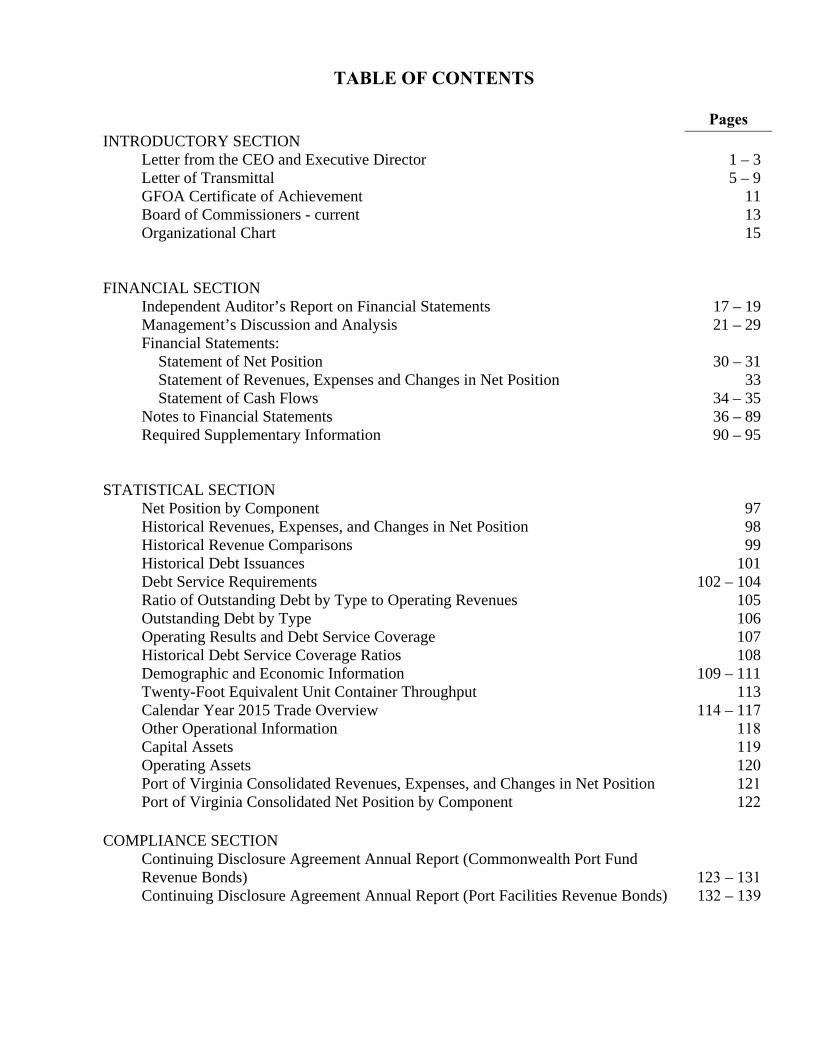
TABLE OF CONTENTS
Pages INTRODUCTORY SECTION
Letter from the CEO and Executive Director 1 – 3 Letter of Transmittal 5 – 9 GFOA Certificate of Achievement 11 Board of Commissioners - current 13
Organizational Chart 15
FINANCIAL SECTION Independent Auditor’s Report on Financial Statements 17 – 19 Management’s Discussion and Analysis 21 – 29
Financial Statements: Statement of Net Position 30 – 31 Statement of Revenues, Expenses and Changes in Net Position 33 Statement of Cash Flows 34 – 35
Notes to Financial Statements 36 – 89 Required Supplementary Information 90 – 95
STATISTICAL SECTION Net Position by Component 97 Historical Revenues, Expenses, and Changes in Net Position 98 Historical Revenue Comparisons 99 Historical Debt Issuances 101 Debt Service Requirements Ratio of Outstanding Debt by Type to Operating Revenues
102 – 104 105
Outstanding Debt by Type 106 Operating Results and Debt Service Coverage Historical Debt Service Coverage Ratios
107 108
Demographic and Economic Information 109 – 111 Twenty-Foot Equivalent Unit Container Throughput 113 Calendar Year 2015 Trade Overview 114 – 117 Other Operational Information 118
Capital Assets 119 Operating Assets 120
Port of Virginia Consolidated Revenues, Expenses, and Changes in Net Position 121 Port of Virginia Consolidated Net Position by Component 122
COMPLIANCE SECTION Continuing Disclosure Agreement Annual Report (Commonwealth Port Fund Revenue Bonds) 123 – 131 Continuing Disclosure Agreement Annual Report (Port Facilities Revenue Bonds) 132 – 139


October 26, 2016
Dear Customers, Stakeholders and Port Partners:
Fiscal year 2016 was filled with several milestones for The Port of Virginia®: we finished the fiscal year with a positive financial outcome for the second consecutive year; we continued to emphasize safety while handling a record-setting amount of container volume; rail cargo grew by 10 percent; and we were consistent in our delivery of service to our customers and port users. Most notably, we embarked on a plan to significantly expand the cargo capacity at our two primary container terminals, Virginia International Gateway and Norfolk International Terminals.
Led by Governor Terry N. McAuliffe and the General Assembly, Transportation Secretary Aubrey L. Layne and the Virginia Port Authority Board of Commissioners, we are entering an era of growth with a laser focus on making The Port of Virginia a primary gateway for global trade on the US East Coast and a catalyst for commerce in Virginia.
By 2020, we will have created the capacity to process 1 million additional container units through this port annually – a 40% increase overall – and we will move those units more safely, swiftly and sustainably than ever before. In the process, we will have created one of the East Coast’s most modern container terminal complexes that will be capable of handling the largest ships in the Atlantic trade. Deep, unobstructed channels, modern terminals, a strong partnership with labor, a long-term plan for sustainable growth, a reputation as a progressive and growing port and the dedication of the port team are but a few of the things that make this maritime asset so unique.
We are capitalizing on those assets and our commercial resurgence continued in fiscal year 2016 having completed our second consecutive fiscal year of profitability. We finished the fiscal year having handled 2.57 million twenty-foot equivalent units and the result was a $4.8 million consolidated operating profit. Beyond that, we accomplished so much in the 12 months that ended June 30:
July 2015: With the US Secretary of Transportation Anthony Foxx present, the portbreaks ground on $31 million North Gate Project at Norfolk International Terminals.
August 2015: The port posts its first yearly operating profit since 2008.
1
September 2015: Ocean carrier CMA CGM announces it will offer a bill of lading (BOL)to Richmond Marine Terminal (RMT) bringing to nine the number of ocean carriersoffering a BOL to Richmond.
October 2015: Port handles 233,466 TEUs (twenty-foot equivalent units) making it thesingle busiest month in the port’s history.
November 2015: Most productive November on record for RMT in terms of containervolume with a 9.6 percent increase when compared with prior year.
December 2015: The port sets a new calendar-year record for container volume havinghandled more than 2.5 million TEUs.
January 2016: For its efforts to keep the Elizabeth River clean, the port receives its 14th
consecutive RiverStar award from the Elizabeth River Project.
February 2016: Port and Richmond city leaders sign a 40-year lease agreement for RMT;at the same event a new $4.2 million harbor crane debuts at the terminal.
March 2016: Port leaders begin a three-stop trip in Hampton Roads, Richmond andFront Royal to deliver the State-of-the-Port address.
April 2016: The Safety of Life at Sea requirements are implemented on deadline andwithout any disruption to delivery of service.
June 2016: $1 million in grants are awarded to nine Virginia localities in support of capitalupgrades, dredging or development through the port’s Aid to Local Ports program.
July 2016: The 10,000 TEU MOL Benefactor becomes the largest, and first ship to callVirginia through the widened Panama Canal.
July 2016: The governor announces a state investment of $350 million to expand cargocapacity at NIT’s South Berth by 46 percent.
September 2016: The Port of Virginia signs a new, long-term lease for VirginiaInternational Gateway that clears the way to begin work on doubling the terminal’scapacity.
The Port of Virginia is in an enviable position.
2
Our natural assets include deep shipping channels that are easy to maintain; we are 18 miles from the open water of the Atlantic Ocean; we are situated within a day’s drive of two-thirds of the nation’s population; and we have room to add a fourth, state-owned, deep-water marine terminal. From a manmade perspective, we have the versatility to handle anything from automobiles to coffee to blade sets for massive wind turbines. Our on-dock rail service by the East’s two Class I railroads, Norfolk Southern and CSX, is also a key primary asset.
Most importantly, we have a clear path forward and a plan for the future. With a priority on safety across all phases of the operation, we are taking the momentum we gained from the positive outcome of fiscal year 2016 and converting it into action as we prepare to start work on the expansion. The work we do in these next three-to-four years is truly going to chart The Port of Virginia’s course for generations to come.
Sincerely Yours,
John F. Reinhart CEO and Executive Director
3

October 26, 2016
Board of Commissioners Virginia Port Authority 600 World Trade Center Norfolk, VA 23510
Dear Commissioners:
The Comprehensive Annual Financial Report (CAFR) of the Virginia Port Authority (“VPA” or “the Authority”) for the fiscal year ended June 30, 2016, as required by §62.1-139 of the Code of Virginia for submission to the Governor and General Assembly on or before November 1 of each year, is hereby submitted.
Responsibility for both the accuracy of the data and the completeness and fairness of presentation, including all disclosures, rests with the Authority. To the best of our knowledge and belief, the enclosed data is accurate in all material respects, and is reported in a manner designed to present fairly the financial position and results of operations of the Authority. All disclosures necessary to enable the reader to gain an understanding of the Authority's financial activities and operations have been included.
Management is also responsible for establishing and maintaining internal controls over its operations. Internal controls are designed to provide a reasonable, though not absolute, assurance that assets are safeguarded against loss from unauthorized use or disposition and that financial transactions are executed in accordance with management's authorization and recorded properly to permit the preparation of financial statements in accordance with generally accepted accounting principles. Management strongly believes that the inherent financial accounting controls coupled with the ongoing independent financial audit performed by the Authority's independent financial auditors, the Auditors at PBMares, LLP, as well as numerous other audit functions, adequately safeguard assets and provide reasonable assurance of properly recorded financial transactions.
The Auditors at PBMares, LLP have issued an unmodified opinion on the Authority's financial statements for the year ended June 30, 2016. The independent auditor's report is located at the beginning of the financial section of this report.
Management's discussion and analysis (MD&A) can be found at the beginning of the financial section, after the audit opinion and provides a narrative introduction, overview and analysis to accompany the basic financial statements. This letter of transmittal is designed to complement the MD&A and should be read in conjunction with it.
5
Profile of the Virginia Port Authority
The Virginia Port Authority was established in 1952, as a political subdivision of the Commonwealth of Virginia, for the purpose of performing any act or function which may be useful in developing, improving, or increasing the commerce of the ports of the Commonwealth. The Authority, over the years has acquired and unified certain port facilities for the benefit of the Commonwealth. The Authority owns and is responsible for the operations and security of three marine terminals: Norfolk International Terminals (NIT), Portsmouth Marine Terminal (PMT), and Newport News Marine Terminal (NNMT), and an inland intermodal facility, the Virginia Inland Port (VIP) located in Front Royal, Virginia. In addition, the Authority has an operating lease for the use and operation of the Virginia International Gateway Terminal in Portsmouth (VIG) and also for the Richmond Marine Terminal (RMT). These facilities primarily handle import and export containerized, break-bulk, and bulk cargoes.
The Authority is managed by a 13 member Board of Commissioners - the State Treasurer, the Chief Executive Officer of the Virginia Economic Development Partnership, and 11 citizens appointed by the Governor. The Board of Commissioners, the VPA CEO and Executive Director and his staff, and the management of our component unit Virginia International Terminals, LLC (VIT), work to promote, develop, and increase commerce at the ports of Virginia, and other port related industries in the Commonwealth.
VIT was established in 1981 and in 1982 began to operate the facilities controlled by the Authority. VIT operates the state-controlled ports (excluding RMT) through a Service Agreement with the Authority. Effective August 17, 2013, VIT was converted from a nonprofit, non-stock corporation to a single-member limited liability company with VPA as the sole member of the Company. VIT's financial information is presented in the Authority's financial statements as a blended component unit. As a component unit, VIT is a legally separate organization that serves or benefits those outside of the Authority, but for which the Authority, as the primary institution, is financially accountable or closely related. The financial statements of VIT were audited separately. The VIT budget is prepared annually and approved by the VPA Board of Commissioners prior to July 1 of each fiscal year. More detailed information can be found in the footnotes to the financial statements.
The Authority is included in the Commonwealth of Virginia's budget. Authority staff prepare and submit budget requests for each upcoming biennium to the Department of Planning and Budget (DPB) and the Governor, based on expected revenues and expenditures. The Governor submits the recommended budget for the Commonwealth to the General Assembly which enacts appropriations for each year of a biennium for operating and capital expenditures. The resulting Appropriation Act provides summary expenditure limitations. The appropriations are effective on July 1 of each year. The Authority's Board of Commissioners gives final approval of the detailed budget prior to July 1 based on the appropriations.
6

Finance and Risk Management
Enterprise funds are used to account for proprietary operations, similar to private business operations where the operating costs are funded through user charges. The Virginia Port Authority has one such enterprise fund to which all accounts are organized and accounted for as a single reporting entity. The Authority's primary source of funding for its operations is through the net revenues generated from terminal operations and subsequently transferred from VIT. Capital improvements are primarily funded through long-term debt and allocations of certain revenues collected by the Commonwealth.
Interest rates are near all-time lows and have allowed the restructure of some of our debt through refunding, saving millions of dollars over the lives of the debt. The Authority is working to provide the most benefit to our citizens and customers at the least cost, and will continuously explore cost saving initiatives.
Certain statistical information included in the Comprehensive Annual Financial Report (CAFR) was not obtained from the financial records of the Authority but are presented for the CAFR user's information and understanding of the Authority and the environment in which the Authority operates.
The Virginia Port Authority, together with its component unit (VIT), maintains a comprehensive risk management program, the purpose of which is the maximum protection of the assets, customers and employees of the Authority, and the reduction of the cost of risk through an innovative and professional risk management program. It is the intent of the Authority that it be protected against accidental loss or losses that would significantly affect Authority personnel, property or the ability of the organization to continue to fulfill its responsibilities. In accordance with the Service Agreement between VIT and the Authority, VIT maintains property and liability insurance on all terminal equipment and facilities. The Authority maintains property and liability insurance on non-terminal assets owned by the Authority. The Authority also maintains general liability, fiduciary liability, worker's compensation insurance and umbrella policies.
Virginia Port Authority and the Economy
The Port's success has generated significant economic spin-off benefits to the Commonwealth. Annually, port-related business and activity directly and indirectly contribute to Virginia’s economy and account for more than 374,000 jobs, $60.3 billion in spending, $17.5 billion in employee compensation, and $1.4 billion in state and local tax revenues. In calendar year 2016 (through September) alone, there have been 31 port-related economic development announcements to develop 2.5 million square feet of space, $725 million in investment, and 3,265 jobs. Since its opening, the Virginia Inland Port, located in Front Royal Virginia, has stimulated the attraction of some 39 warehousing and distribution centers near the Inland Port providing a total investment of $748 million with over 8 million square feet of space together with employee levels of over 8,000 workers. Household names like Wal-Mart, Target, Ace Hardware, Lumber Liquidators, and Keurig Green Mountain have all set up distribution/manufacturing facilities in the Commonwealth in large measure due to the presence of a world class port facility and structure.
7

Long Term Financial Planning
Over the next fifteen years, containerized cargo volume is expected to increase by over 60%, far exceeding the current capacity. The Port of Virginia has unique opportunities to meet this demand with the ability to further expand the VIG terminal, densification of NIT, and the proposed development of a new container terminal on the eastward side of Craney Island. The Hampton Roads region is also mobilizing around the opportunity to develop 20-60 million square feet of supporting distribution center space. The depth of our harbor, having the ability to accommodate the “post-Panamax” vessels and deep-loaded container ships, makes The Port of Virginia a viable option for the changing flow of global freight traffic. Virginia is in the position to become the international gateway for the East Coast.
The Port of Virginia organization is unique in the industry and has a proven track record for success. For over 30 years, this structure resulted in phenomenal growth, benefiting not only Virginians but also the entire U.S. The Authority and VIT have recently undertaken a major reorganization to re-engineer our operations to better serve our customers while being a catalyst to economic expansion within the Commonwealth. We have been charged to develop The Port of Virginia into the primary gateway for international cargo transported through the Mid-Atlantic and Mid-West regions of the United States.
Major Initiatives
The VPA is dedicated to developing transportation infrastructure aimed at providing customers as many ways as possible for efficient and economical movement of cargo. One example is thrice-weekly barge service to the Richmond Marine Terminal, which takes trucks off the highways, cuts congestion and reduces emissions. Further, the VPA is investing in gate and rail infrastructure on-terminal and, where possible, advocating for regional rail projects that will benefit The Port of Virginia and the Commonwealth. The port is also focused on diversifying its cargo mix. Though the lion’s share of the cargo will always be containerized, the port is handling more and more cars, paper and non-containerized goods. Additionally, the Authority has reorganized our Foreign Trade Zones (FTZ) into an Alternative Site Framework structure to enhance its ability to entice shipments of components for manufacturing and assembly. The backdrop for all of this is the continual capital investment and ongoing maintenance at all of the VPA terminals. This program assures that port users will be moving their cargo through safe, modern and well-maintained facilities.
Awards and Acknowledgements
The Government Finance Officers Association of the United States and Canada (GFOA) awarded a Certificate of Achievement for Excellence in Financial Reporting to the Virginia Port Authority for its Comprehensive Annual Financial Report for the fiscal year ended June 30, 2015. This was the tenth consecutive year that the Authority has achieved this prestigious award. In order to be awarded a Certificate of Achievement, a government must publish an easily readable and efficiently organized comprehensive annual financial report. This report must satisfy both generally accepted accounting principles and applicable legal requirements.
8
A Certificate of Achievement is valid for a period of one year only. We believe that our current CAFR continues to meet the Certificate of Achievement Program's requirements and we are submitting it to the GFOA to determine its eligibility for another certificate.
Preparation of the CAFR, as always, represents the combined effort of the entire Finance Division of the Virginia Port Authority and auditors at PBMares, LLP. Finally, we express our deepest appreciation to the members of the Virginia Port Authority Board of Commissioners for their continued guidance and leadership towards ensuring the fiscal integrity of the Virginia Port Authority.
Respectfully Submitted,
Chief Financial Officer And Treasurer to the Board
9
11

VIRGINIA PORT AUTHORITY
Norfolk, Virginia
BOARD OF COMMISSIONERS
John G. Milliken, Chairman
John N. Pullen, Vice Chairman
Jennifer D. Aument
J. William Cofer
Alan A. Diamonstein
Gary T. McCollum
Val S. McWhorter
Faith B. Power
Kim Scheeler
Deborah C. Waters
F. Blair Wimbush
Manju S. Ganeriwala, State Treasurer
(ex-officio member of the Board)
Daniel C. Gundersen, Interim Chief Executive Officer, Virginia Economic Development
Partnership
John F. Reinhart, CEO and Executive Director
Rodney W. Oliver, Chief Financial Officer
and Treasurer to the Board
Debra J. McNulty, Clerk and Secretary to the Board
Jodie L. Asbell, Deputy Clerk and Assistant Secretary to the Board
13
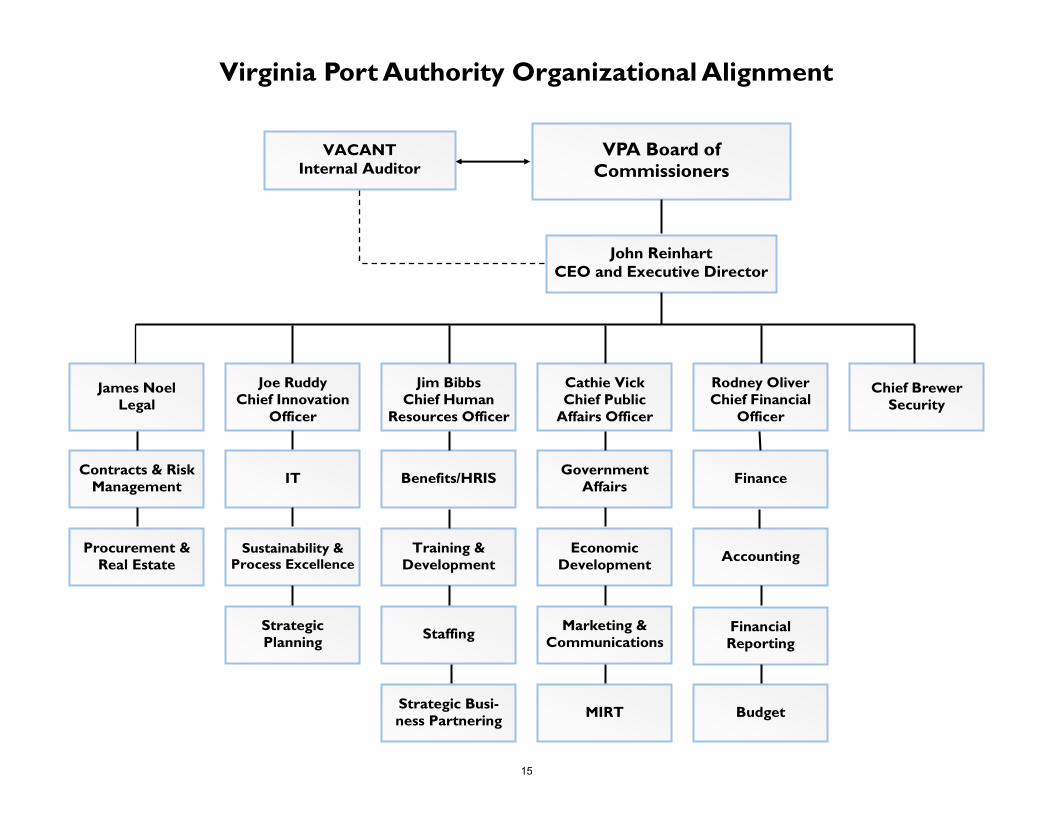
Virginia Port Authority Organizational Alignment
VPA Board of
Commissioners
VACANT
Internal Auditor
John Reinhart
CEO and Executive Director
Joe Ruddy
Chief Innovation
Officer
James Noel
Legal
Jim Bibbs
Chief Human
Resources Officer
Cathie VickChief Public
Affairs Officer
Rodney Oliver
Chief Financial
Officer
Chief Brewer
Security
Contracts & Risk
Management IT Benefits/HRIS
Government
Affairs Finance
Procurement &
Real Estate Sustainability &
Process Excellence
Training &
Development
Economic
Development Accounting
Strategic
Planning Staffing
Marketing &
Communications Financial
Reporting
Strategic Busi-
ness Partnering MIRT Budget
15
17
INDEPENDENT AUDITOR’S REPORT The Honorable Terry McAuliffe Governor of Virginia The Honorable Robert D. Orrock, Sr. Chairman, Joint Legislative Audit and Review Commission The Board of Commissioners Virginia Port Authority Report on the Financial Statements We have audited the accompanying financial statements of the business-type activities of the Virginia Port Authority (the Authority), a component unit of the Commonwealth of Virginia as of and for the year ended June 30, 2016, and the related notes to the financial statements, which collectively comprise the Authority’s basic financial statements as listed in the table of contents. Management’s Responsibility for the Financial Statements Management is responsible for the preparation and fair presentation of these financial statements in accordance with accounting principles generally accepted in the United States of America; this includes the design, implementation, and maintenance of internal control relevant to the preparation and fair presentation of financial statements that are free from material misstatement, whether due to fraud or error. Auditor’s Responsibility Our responsibility is to express opinions on these financial statements based on our audit. We conducted our audit in accordance with auditing standards generally accepted in the United States of America; the standards applicable to financial audits contained in Government Auditing Standards, issued by the Comptroller General of the United States; and the Specifications for Audits of Authorities, Boards, and Commissions issued by the Auditor of Public Accounts of the Commonwealth of Virginia. Those standards and specifications require we plan and perform the audit to obtain reasonable assurance about whether the financial statements are free from material misstatement.

18
An audit involves performing procedures to obtain audit evidence about the amounts and disclosures in the financial statements. The procedures selected depend on the auditor’s judgment, including the assessment of the risks of material misstatement of the financial statements, whether due to fraud or error. In making those risk assessments, the auditor considers internal control relevant to the Authority’s preparation and fair presentation of the financial statements in order to design audit procedures that are appropriate in the circumstances, but not for the purpose of expressing an opinion on the effectiveness of the Authority’s internal control. Accordingly, we express no such opinion. An audit also includes evaluating the appropriateness of accounting policies used and the reasonableness of significant accounting estimates made by management, as well as evaluating the overall presentation of the financial statements. We believe the audit evidence we have obtained is sufficient and appropriate to provide a basis for our audit opinions. Opinions In our opinion, the financial statements referred to above present fairly, in all material respects, the respective financial position of the business-type activities of the Authority, as of June 30, 2016, and the respective changes in financial position and cash flows, thereof, for the year then ended in accordance with accounting principles generally accepted in the United States of America. Other Matters Required Supplementary Information Accounting principles generally accepted in the United States of America require the Management's Discussion and Analysis and the required supplementary information on pages 21-29 and 90-95, respectively, be presented to supplement the basic financial statements. Such information, although not a part of the basic financial statements, is required by the Governmental Accounting Standards Board who considers it to be an essential part of financial reporting for placing the basic financial statements in an appropriate operational, economic, or historical context. We have applied certain limited procedures to the required supplementary information in accordance with auditing standards generally accepted in the United States of America, which consisted of inquiries of management about the methods of preparing the information and comparing the information for consistency with management’s responses to our inquiries, the basic financial statements, and other knowledge we obtained during our audit of the basic financial statements. We do not express an opinion or provide any assurance on the information because the limited procedures do not provide us with sufficient evidence to express an opinion or provide any assurance. Other Information Our audit was conducted for the purpose of forming opinions on the financial statements that collectively comprise the Authority’s basic financial statements. The accompanying schedules listed in the table of contents as introductory section, statistical section, and compliance section are presented for purposes of additional analysis and are not a required part of the basic financial statements. The introductory, statistical, and compliance sections, as listed in the table of contents, have not been subjected to the auditing procedures applied in the audit of the basic financial statements, and accordingly, we do not express an opinion or provide any assurance on them.
19
Other Reporting Required by Government Auditing Standards In accordance with Government Auditing Standards, we have also issued our report dated October 26, 2016 on our consideration of the Authority’s internal control over financial reporting and on our tests of its compliance with certain provisions of laws, regulations, contracts, and grant agreements and other matters. The purpose of that report is to describe the scope of our testing of internal control over financial reporting and compliance and the results of that testing, and not to provide an opinion on internal control over financial reporting or on compliance. That report is an integral part of an audit performed in accordance with Government Auditing Standards in considering the Authority’s internal control over financial reporting and compliance.
PBMares, LLP
Harrisonburg, Virginia October 26, 2016

VIRGINIA PORT AUTHORITY
MANAGEMENT’S DISCUSSION AND ANALYSIS (MD&A) AS OF AND FOR THE YEAR ENDED JUNE 30, 2016
(Unaudited)
Our discussion and analysis of the Virginia Port Authority’s (“VPA” or “the Authority”) financial performance provides an overview of VPA’s financial activities as of and for the Fiscal Year ended June 30, 2016 (FY2016), with selected comparative information for the Fiscal Year ended June 30, 2015 (FY2015). It should be read in conjunction with the Authority’s accompanying financial statements and the notes to financial statements. Virginia International Terminals, LLC (VIT) is presented in the Authority’s consolidated financial statements as a blended component unit to emphasize that it serves or benefits those outside of the Authority, but that the unit is, in substance, part of the primary government’s operations even though it is a separate legal entity. This discussion focuses on the blended presentation of VPA with its subsidiary VIT, and to the extent relevant, the results of VIT will include references accordingly.
ABOUT THE AUTHORITY
The Virginia Port Authority was established in 1952 as a political subdivision of the Commonwealth of Virginia for the purpose of stimulating commerce within the Commonwealth, through the promotion of the shipment of goods and cargoes through the ports, improvement of the navigable tidal waters within the Commonwealth, and in general engaging in any activity within the scope of its mission which may be useful in developing, improving, or increasing commerce of the ports of the Commonwealth. The Authority owns and is responsible for the operations and security of three marine terminals: Norfolk International Terminals (NIT), Portsmouth Marine Terminal (PMT), and Newport News Marine Terminal (NNMT), and an inland intermodal facility, the Virginia Inland Port (VIP) located in Front Royal, Virginia. The Authority is also responsible for the operations and security of two leased marine terminals: Virginia International Gateway (VIG), located in Portsmouth, Virginia and Richmond Marine Terminal (RMT), located in Richmond, Virginia on the James River. These facilities primarily handle import and export containerized and break-bulk cargoes. VIT operates the majority of the terminals; the exception being RMT, which is being operated by a separate third-party until November 1, 2016.
A Board of Commissioners governs the Authority. The Board is composed of the State Treasurer, the Chief Executive Officer of the Virginia Economic Development Partnership, and 11 members appointed by the Governor. While the Commissioners remain on the Board at the continuing discretion of the Governor, they serve staggered five-year terms. Commissioners may serve a maximum of two consecutive terms.
21

FINANCIAL HIGHLIGHTS
Net position for VPA at June 30, 2016 increased by $38.3 million during FY2016compared to an increase of $42.0 million during FY2015.
Operating income for VPA declined from $13.6 million to $4.7 million, marking thesecond consecutive year that VPA has reflected an operating profit.
Volume of nearly 1.5 million containers moved through the terminal properties owned orleased by VPA during FY2016, surpassing the previous year’s record volume by 1.3%.
Liquidity remained strong, with net working capital of $230.6 million and a current ratio(current assets divided by current liabilities) of 3.8.
OVERVIEW OF THE FINANCIAL STATEMENTS
Governmental accounting policy, practice and procedures fall under the auspices of the Governmental Accounting Standards Board (GASB). The Authority’s financial transactions and subsequent statements are prepared according to the GASB Statement 34 reporting model, as mandated by GASB. The purpose of the GASB 34 reporting model is to consolidate two basic forms of governmental accounting, governmental operations (such as municipalities) and proprietary operations (those entities such as the Authority which generate their own revenues and, therefore, more closely resemble a private business), into statements that give the reader a clearer picture of the financial position of the government as a whole. The Authority is considered a proprietary form of government and its specific financial transactions are recorded in a single Enterprise Fund.
As stated above, the Authority operates as a single Enterprise Fund with one blended component unit, Virginia International Terminals, LLC (VIT). The financial statements are prepared on the accrual basis of accounting, therefore revenues are recognized when earned and expenses are recognized when incurred. Capital assets are capitalized and depreciated over the useful lives of the respective assets (except for land, which is not depreciated). Please refer to Note 1 in the accompanying notes to financial statements for a summary of the Authority’s significant accounting policies. Following this MD&A are the basic financial statements and required supplementary information of the Authority, along with its blended component unit - VIT. These statements and the statistical information, along with the MD&A are designed to provide readers with a more complete understanding of the Authority’s finances as a governmental unit and on a consolidated basis.
The financial section of this annual report consists of four parts: MD&A, the basic financial statements, the notes to financial statements, and required supplementary information. The report includes the following three basic financial statements: the Statement of Net Position, the Statement of Revenues, Expenses, and Changes in Net Position, and the Statement of Cash Flows.
22

Statement of Net Position
The Statement of Net Position presents the financial position of the Authority at the end of the fiscal year. The statement includes all assets, deferred outflows of resources, liabilities, and deferred inflows of resources of the Authority. Net position, the difference between total assets and deferred outflows of resources, and total liabilities and deferred inflows of resources, is one indicator of the current fiscal health of the organization and the Authority’s financial position over time.
A condensed summary of the Authority’s assets and deferred outflows or resources, liabilities and deferred inflows of resources, and net position at June 30, 2016 and 2015, respectively, follows:
Net Position (USD millions)
2016 2015 Increase/
(Decrease) ASSETS
Current assets $ 312.8 $ 307.9 $ 4.9 Capital assets, net 783.9 774.9 9.0 Other long-term assets 52.5 52.4 0.1 Total assets 1,149.2 1,135.2 14.0
DEFERRED OUTFLOWS OF RESOURCES
18.3 5.8 12.5
Total assets and deferred outflows of resources
1,167.5 1,141.0 26.5
LIABILITIES Current liabilities 82.2 75.3 6.9 Noncurrent liabilities 556.8 578.5 (21.7) Total liabilities 639.0 653.8 (14.8)
DEFERRED INFLOWS OF RESOURCES
5.5 2.5 3.0
Total liabilities and deferred inflows of resources
644.5 656.3 (11.8)
NET POSITION Net investment in capital assets 299.2 284.9 14.3 Restricted 61.3 54.5 6.8 Unrestricted 162.5 145.3 17.2 Total net position $ 523.0 $ 484.7 $ 38.3
23
ASSETS
The increase in Current Assets is due principally to the retention of operating cash flow generated during the period. Assertive collection efforts and a measured approach to spending and investment contributed to the organization’s ability to retain cash.
Capital assets (the cost of capital assets less accumulated depreciation and amortization) increased slightly year over year. Incremental investment of $61.5 million in terminal assets and property was offset by disposal of assets with a net book value of $4.7 million and depreciation expense of $47.7. See note five in the notes to financial statements for additional discussion.
The increase to deferred outflows of resources was principally the result of changes in actuarial assumptions and actual experience vs. expected experience related to the Authority’s pension plans, as well as a higher level of contributions made after the measurement date. See note nine in the notes to financial statements for additional discussion of pensions.
LIABILITIES
The increase in current liabilities was a result of accruals related to dredging projects and higher interest payable from debt issued in June 2015.
Noncurrent liabilities decreased by $21.8 million, principally related to scheduled principal payments associated with the maturities of outstanding revenue bonds and installment purchase obligations.
NET POSITION
Net investment in capital assets represents the land, buildings, infrastructure, improvements, and equipment, etc., less the accumulated depreciation and amortization and outstanding liabilities related to those capital assets. This portion of net position increased principally as the result of principal payments on outstanding debt, increasing the “equity” in the capital assets held, and continuing capital investment, net of depreciation expense. These capital assets are the industrial base for the provision of services to major steamship lines and their agents for movement of maritime cargo. For liquidity purposes it should be noted that the resources required to repay the debt incurred to purchase and develop the capital assets must be provided annually from terminal operations (principally those of the blended component unit – VIT) and appropriation (Commonwealth Port Fund), since the capital assets themselves generally are not monetized to liquidate liabilities. The increase in net investments in capital assets is attributable to the continuing investment in the port’s facilities.
Net position - restricted represents resources, principally cash and investments, that are subject to external restrictions on how they can be used under bond resolutions and related covenants. The increase in the balance is due to higher balances in VPA’s debt service accounts that will be applied to outstanding principal and interest on July 1, 2016, as well as a higher level of restricted balances related to federal grants.
24

The remaining unrestricted net position may be used to fund the Authority’s other ongoing obligations and initiatives. The increase year over year is principally attributable to the retention of unrestricted cash generated by operations.
Statement of Revenues, Expenses, and Changes in Net Position
All of the current year’s revenues and expenses are accounted for in the Statement of Revenues, Expenses, and Changes in Net Position. This statement measures the results of operations and can be used to determine whether the fiscal condition has improved or worsened during the year. A condensed summary of the Authority’s revenues, expenses, and changes in net position for the fiscal years ended June 30, 2016 and 2015, follows:
Revenues, Expenses, and Changes in Net Position (USD Millions)
2016 2015 Increase/ Decrease
Operating revenues $ 454.8 $ 456.2 $ (1.4) Operating expenses 450.1 442.6 7.5 Operating income 4.7 13.6 (8.9)
Non-operating revenues (expenses), net (7.9) (12.7) 4.8 Income (loss) before capital contributions and transfers
(3.2) 0.9 (4.1)
Capital contributions: Commonwealth port fund allocation 42.4 38.4 4.0 Capital transactions with other government agencies (0.9) 2.7 (3.6) Increase in net position $ 38.3 $ 42.0 $ (3.7)
Ninety-seven percent (97%) of the Authority’s operating revenues originate from terminal operating revenues earned by its blended component unit – VIT. Security surcharge fees levied by the Authority separate from the terminal operations of VIT account for another 2% of operating revenues, for a total of 99% that originates from operation of the terminal properties. The remainder of operating revenues are principally attributable to operating grants from state and federal governments.
Fiscal year 2016 operating revenues were substantially flat to the prior year. The effect of a 1.3% year over year increase in container volume was offset by lower ancillary revenues associated with lower terminal congestion.
Operating expenses increased by 1.7%. Terminal maintenance expense increased by $2.6 million related to investment in the condition of property and equipment, and general and administrative expense was $10.4 million higher as a result of planned investment in personnel and capability to support future growth initiatives. These increases were offset in part by lower terminal operations
25
expense associated with realized efficiencies and lower port congestion achieved over the course of the year.
Nonoperating revenues/expenses were $4.8 million favorable to Fiscal Year 2015, principally as a result of $9.7 million in federal grant activity to support multiple projects, more notably a mobile harbor crane for the Richmond Marine Terminal, and the development of the new gate complex at NIT. The effect of this grant activity was partially offset by $4.0 million in higher interest expense from new debt issued in the second half of Fiscal Year 2015.
Capital contributions from the Commonwealth Port Fund (CPF) – allocations appropriated from the Transportation Trust Fund - are generally restricted in purpose to enhancement/major maintenance of the Authority’s terminal facilities through direct reimbursement or service of debt supported by the CPF allocation. The increase of $4.0 million over Fiscal Year 2015 is the result of timing regarding the collection of the supporting tax revenues and, while relatively stable in nature on a historical basis, is not controllable by the Authority.
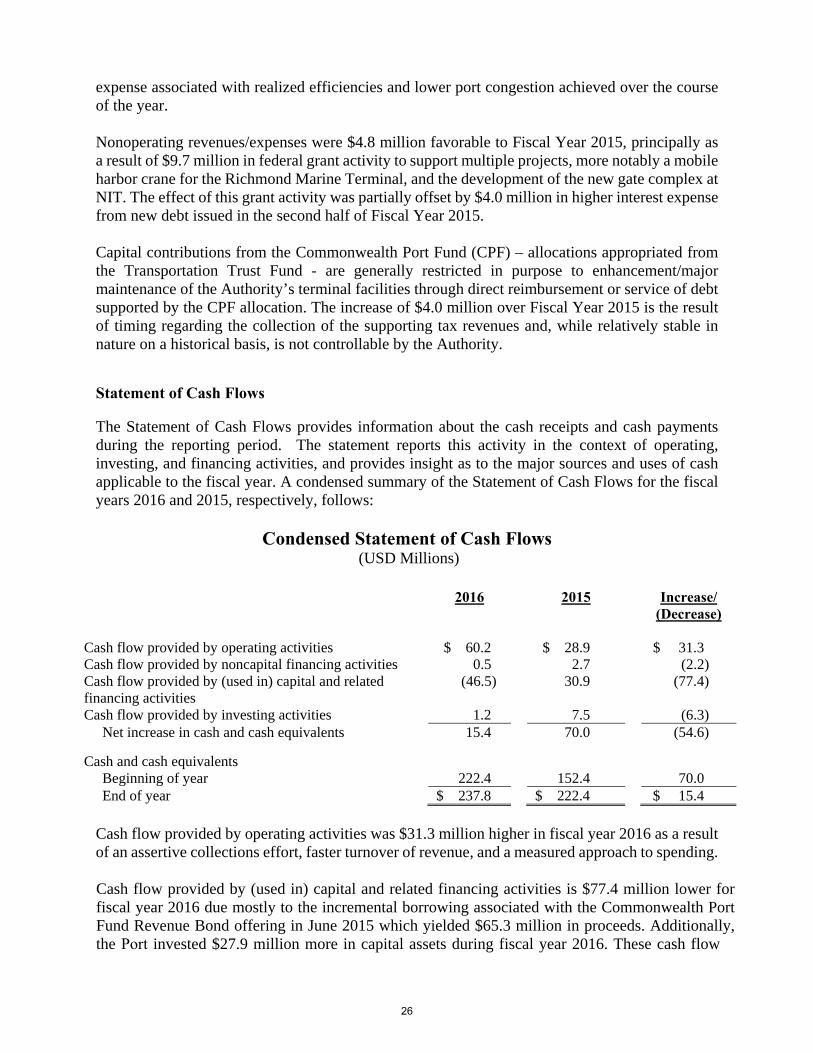
Statement of Cash Flows
The Statement of Cash Flows provides information about the cash receipts and cash payments during the reporting period. The statement reports this activity in the context of operating, investing, and financing activities, and provides insight as to the major sources and uses of cash applicable to the fiscal year. A condensed summary of the Statement of Cash Flows for the fiscal years 2016 and 2015, respectively, follows:
Condensed Statement of Cash Flows (USD Millions)
2016 2015 Increase/ (Decrease)
Cash flow provided by operating activities $ 60.2 $ 28.9 $ 31.3 Cash flow provided by noncapital financing activities 0.5 2.7 (2.2) Cash flow provided by (used in) capital and related financing activities
(46.5) 30.9 (77.4)
Cash flow provided by investing activities 1.2 7.5 (6.3) Net increase in cash and cash equivalents 15.4 70.0 (54.6)
Cash and cash equivalents Beginning of year 222.4 152.4 70.0 End of year $ 237.8 $ 222.4 $ 15.4
Cash flow provided by operating activities was $31.3 million higher in fiscal year 2016 as a result of an assertive collections effort, faster turnover of revenue, and a measured approach to spending.
Cash flow provided by (used in) capital and related financing activities is $77.4 million lower for fiscal year 2016 due mostly to the incremental borrowing associated with the Commonwealth Port Fund Revenue Bond offering in June 2015 which yielded $65.3 million in proceeds. Additionally, the Port invested $27.9 million more in capital assets during fiscal year 2016. These cash flow
26
impacts were partially offset by the receipt of $2.9 million from the sale of certain property, and $9.6 million in non-operating grants to assist with capital acquisition and other major initiatives.
Cash flow provided by investing activities principally reflects interest and dividends on invested balances and the sales/purchases of investments. The lower cash flow provided by investing activities reflects a lower volume of sales or maturities of investments for cash.
CAPITAL ASSET AND DEBT ADMINISTRATION
Capital Assets. The investment in capital assets for the Authority at June 30, 2016, carried at historical cost less accumulated depreciation, primarily includes land, buildings, wharves, roads, drainage and lighting systems, and equipment.
During the year, VPA made significant investments in the following principal areas:
Container movement and yard equipment - $13.5 million Development of the NIT North Gate – $11.4 million Rail and portal improvements at NIT - $5.6 million Maintenance dredging to ensure adequate berth depth - $5.2 million Additions to the chassis fleet - $5.5 million Investments in data equipment - $7.3 million
Further discussion of capital asset activities can be found in the note five in the notes to financial statements.
Debt and Installment Purchase Obligations
At June 30, 2016, the Authority had $523.6 million in debt outstanding, excluding issuance premiums and deferred items. Of this amount, $506.3 million is in the form of revenue bonds issued by the Authority and $17.3 million in capitalized lease obligations.
Commonwealth Port Fund Revenue bonds issued in 2006, 2011, 2012 and 2015 are supported by the Authority’s 4.2% allocation of the Commonwealth’s Transportation Trust Fund. The bonds are also backed by a sum sufficient appropriation from the Commonwealth and carry underlying ratings of AA+ from Fitch Ratings, Inc., an AA+ rating from Standard and Poor’s, and an Aa1 rating from Moody’s Investor Services. On July 1, 2016, VPA completed the defeasance of the 2006 Series.
Port Facilities Revenue bonds issued in 2007, 2010, 2013 and 2015 are supported by terminal revenues and insurance policies and carry underlying ratings of A+ from Fitch Ratings, Inc., A from Standard and Poor’s, and an Aa3 underlying rating from Moody’s Investor Services. On July 1, 2016, VPA completed the defeasance of the 2007 Series.
The Authority’s bond covenants require that net revenues available to pay debt service, as defined in the applicable bond resolution, exceed 110% and 135% of the annual debt service amount. The debt service coverage test for fiscal year 2016 was exceeded. See the compliance section for further detail.
27
On September 21, 2016, VPA entered into an amended and restated lease for the VIG terminal facility (discussed further below). In association with this transaction, VPA will also undertake to defease the Port Facilities Revenue bonds issued in 2010, 2013 and 2015 and all installment purchase obligations, and issue a 2016 Series of subordinated debt in various tranches. The combined principal amount to be refunded related to the 2010, 2013 and 2015 Series and installment purchase obligations as of June 30, 2016 is approximately $269 million.
More details on long-term debt can be found in note six in the notes to financial statements.
ECONOMIC AND OTHER FACTORS AND RECENT DEVELOPMENTS
Many of the Authority’s capital projects, either directly, or indirectly through bond issues, are funded from the Commonwealth of Virginia’s Transportation Trust Fund. The Authority receives 4.2% of Transportation Trust Fund collections, which are revenues generated primarily by state motor vehicle fuel and sales taxes. Trust Fund collections are subject to the economic conditions existing throughout the Commonwealth, and are not controlled by the Authority. Accordingly, while this funding source has proven to be historically stable and is expected to remain relatively so, it should be expected to vary from year to year.
On July 6, 2010, per an agreement between the Virginia Port Authority (lessee), APM Terminals Virginia, Inc. (lessor), Virginia International Terminals, LLC. (operator) and APM Terminals North America, Inc. (owner), APM Terminals in Portsmouth, Virginia, became a facility under the umbrella of the Authority. Existing lease commitments per those agreements extend to June 30, 2030. In July 2014, the facility was sold by APM Terminals North America, Inc. to a consortium of private investors and the facility was renamed Virginia International Gateway (VIG), with the original lease terms continuing.
On September 21, 2016, VPA entered into an amended and restated lease for the VIG terminal facility which extends the current lease until December 31, 2065. In addition to an extended term, the restated lease will provide owner/lessor financing for expansion of Phase II of the terminal property to nearly double throughput capacity, and will continue the seniority of the lease above the subordinated Port Facilities Revenue Bonds that are expected to be issued during the fourth calendar quarter of 2016. The lease payments will be increased in phases as the terminal facilities expansion progresses. Please refer to note 14 in the notes to financial statements for further discussion of this subsequent event.
The Authority leases the Richmond Marine Terminal (RMT) pursuant to a 40 year agreement that commenced on February 1, 2016, and concurrently also manages the operations of the James River Barge Line that transports containers between RMT and VIG, PMT and NIT. On October 31, 2016, the agreement with the current terminal operator will expire and, effective November 1, 2016, VIT will assume operational responsibility for RMT. The Authority continues actively seeking grants to support funding of these ventures as well as other projects to increase security, or lessen the environmental impact of, related logistics activities.
Looking into Fiscal Year 2017, container movements in fiscal year 2017 through September 2016 are 0.8% higher than the comparable prior year period and volume for the month of August 2016 set a single month record for the Port. While the fiscal year to date growth thus far is modest, the
28
terminal facilities are heavily utilized and are expected to remain so into the future. Based on economic trends and expectations, the Authority is engaging alternatives to most appropriately match future capacity to future demand, and is continuing to engage in long-term planning for opportunities to further nurture economic development within the Commonwealth. Additionally, the 2017 budget for the Commonwealth of Virginia includes an appropriation of $350 million to be invested in the modernization and optimization of NIT, VPA’s largest terminal. The investment, substantially in the form of a grant, will be used to reconfigure the South Terminal at NIT, which will increase cargo capacity by over 46% and increase throughput velocity. This document, including the attached letters and commentary, may contain discussion or statements that might be considered by a reader to be forward looking – that is, related to future, not past, events. Forward-looking statements by their nature contain degrees of uncertainty. Various risks and uncertainties, such as those included in the notes to the financial statements, may cause actual future results or actions to be materially different than those that may be indicated by any of our forward-looking statements. Such statements reflect opinions and indications as of the date of this report, and we are not obligating ourselves to revise or publicly release the results of any revision to such forward-looking statements in light of new information or future events. CONTACTING THE AUTHORITY’S FINANCIAL MANAGEMENT This financial report is designed to provide citizens, customers, and investors and creditors with a general overview of the Authority’s finances and to show the Authority’s accountability for the money we receive. If you have any questions about this report or need additional financial information, contact the Authority’s Finance Division at 600 World Trade Center, Norfolk, VA 23510-1679.
29

VIRGINIA PORT AUTHORITY STATEMENT OF NET POSITION
Primary Government Component Unit
Authority
Virginia International
Terminals, LLC Eliminations
Total Business-Type
Activities
ASSETS
Current assets:Cash and cash equivalents [Footnote 1,2] 80,879,751$ 23,862,962$ -$ 104,742,713$ Restricted assets: Cash and cash equivalents [Footnote 1,2] 78,456,933 16,068,854 - 94,525,787 Investments [Footnote 2] - 1,188,026 - 1,188,026 Accounts receivable, net - 73,324,737 - 73,324,737 Due from other governments [Footnote 4] 14,117,887 - - 14,117,887 Due from component unit 9,051,449 - (9,051,449) - Inventories [Footnote 1] - 19,579,989 - 19,579,989 Prepaid expenses and other 67,168 5,297,848 - 5,365,016
Total current assets 182,573,188 139,322,416 (9,051,449) 312,844,155
Noncurrent assets:Restricted assets: Cash and cash equivalents [Footnote 1,2] 38,580,541 - - 38,580,541 Investments [Footnote 1,2] 13,862,866 - - 13,862,866 Non-depreciable capital assets [Footnote 5] 225,186,296 - - 225,186,296 Depreciable capital assets, net [Footnote 5] 527,866,899 30,850,086 - 558,716,985
Total noncurrent assets 805,496,602 30,850,086 - 836,346,688 Total assets 988,069,790 170,172,502 (9,051,449) 1,149,190,843
DEFERRED OUTFLOWS OF RESOURCES
Deferred outflows of resources [Footnote 1] 10,828,638 7,455,439 - 18,284,077
Total assets and deferred outflows of resources 998,898,428$ 177,627,941$ (9,051,449)$ 1,167,474,920$
The accompanying Notes to Financial Statements are an integral part of this statement.
June 30, 2016
30

VIRGINIA PORT AUTHORITY STATEMENT OF NET POSITION
Primary Government Component Unit
Authority
Virginia International
Terminals, LLC Eliminations
Total Business-Type
Activities
June 30, 2016
LIABILITIES
Current liabilities:Accounts payable and accrued expenses 16,780,709$ 24,044,549$ -$ 40,825,258$ Interest payable 10,257,337 - - 10,257,337 Retainage payable 834,776 - - 834,776 Long-term debt - current portion [Footnote 6] 24,770,319 - - 24,770,319 Compensated absences - current portion [Footnote 6] 1,403,299 1,320,286 - 2,723,585 Payroll withholdings 513,595 1,895,752 - 2,409,347 Obligations under securities lending 341,453 - - 341,453 Due to parent member - 9,051,449 (9,051,449) -
Total current liabilities 54,901,488 36,312,036 (9,051,449) 82,162,075
Noncurrent liabilities:Long-term debt [Footnote 6] 520,409,213 - - 520,409,213 Compensated absences [Footnote 6] 14,724 899,548 - 914,272 Workers' compensation costs - 1,609,367 - 1,609,367 Net pension liability [Footnote 9] 10,000,682 8,872,714 - 18,873,396 Net other post employment benefits obligation [Footnote 10] - 1,321,441 - 1,321,441 Other noncurrent liabilities [Footnote 8] 13,277,025 424,802 - 13,701,827
Total noncurrent liabilities 543,701,644 13,127,872 - 556,829,516
Total liabilities 598,603,132 49,439,908 (9,051,449) 638,991,591
DEFERRED INFLOWS OF RESOURCESDeferred inflows of resources [Footnote 1] 1,677,004 3,809,529 - 5,486,533
Total liabilities and deferred inflows of resources 600,280,136 53,249,437 (9,051,449) 644,478,124
NET POSITION
Net investment in capital assets 268,348,384 30,850,086 - 299,198,470 Restricted Debt service 44,017,978 - - 44,017,978 Port improvement and maintenance - 17,256,881 - 17,256,881 Unrestricted 86,251,930 76,271,537 - 162,523,467
Total net position 398,618,292 124,378,504 - 522,996,796
Total liabilities, deferred inflows of resources and net position 998,898,428$ 177,627,941$ (9,051,449)$ 1,167,474,920$
The accompanying Notes to Financial Statements are an integral part of this statement.
31

VIRGINIA PORT AUTHORITY STATEMENT OF REVENUES, EXPENSES, AND CHANGES IN NET POSITIONFor the Year Ended June 30, 2016
Primary Government Component Unit
Authority
Virginia International
Terminals, LLC Eliminations
Total Business-Type
Activities Operating Revenues: Terminal operating revenues -$ 439,087,836$ -$ 439,087,836$ Other revenues 9,339,787 - - 9,339,787 Other revenues - grants 6,390,908 - - 6,390,908 Operating revenues from component unit 108,847,183 - (108,847,183) -
Total operating revenues 124,577,878 439,087,836 (108,847,183) 454,818,531
Operating Expenses: Terminal operations 1,506,749 190,149,073 - 191,655,822 Terminal maintenance 9,920,219 85,441,480 - 95,361,699 General and administrative 20,599,900 39,103,512 - 59,703,412 Facility rental [Footnote 8] 55,618,729 - - 55,618,729
Depreciation and amortization 44,018,111 3,705,282 - 47,723,393 Payments to Authority - 108,361,067 (108,361,067) -
Total operating expenses 131,663,708 426,760,414 (108,361,067) 450,063,055
Operating income (loss) (7,085,830) 12,327,422 (486,116) 4,755,476
Non-operating revenues (expenses) Interest income 652,550 70,380 - 722,930 Interest expense, net of capitalized interest (18,160,286) - - (18,160,286) Bond issue costs (489,036) - - (489,036) Revenues (expenses) VEDP, net 1,690,873 - - 1,690,873 Revenues from federal government 9,653,436 - - 9,653,436 Expenses (Commonwealth) (187,951) - - (187,951) Other income 2,744 - - 2,744 Loss on disposals (1,107,131) - - (1,107,131)
Total non-operating revenue (expense), net (7,944,801) 70,380 - (7,874,421)
Income (loss) before capitalcontributions (15,030,631) 12,397,802 (486,116) (3,118,945)
Capital contributions
42,366,884 - - 42,366,884 (5,722,955) - - (5,722,955)
(287,700) (198,416) 486,116 -
Commonwealth Port Fund allocationPayments to federal government - channel dredging Capital contributions (to) from component unit Capital contributions from other state agencies 4,789,728 - - 4,789,728
Increase in Net Position 26,115,326 12,199,386 - 38,314,712
Net Position - Beginning of Year 372,502,966 112,179,118 - 484,682,084
Net Position - End of Year 398,618,292$ 124,378,504$ -$ 522,996,796$
The accompanying Notes to Financial Statements are an integral part of this statement.
33
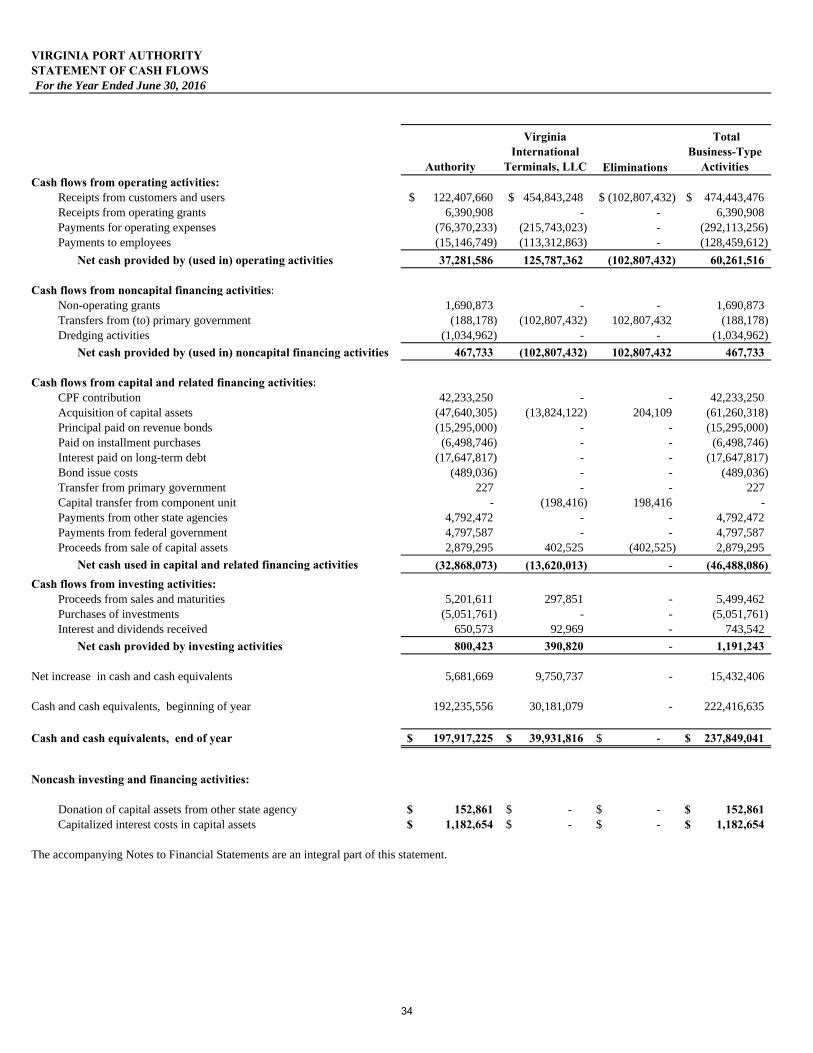
VIRGINIA PORT AUTHORITY STATEMENT OF CASH FLOWSFor the Year Ended June 30, 2016
Primary Government
Component Unit
Authority
Virginia International
Terminals, LLC Eliminations
Total Business-Type
Activities Cash flows from operating activities:
Receipts from customers and users 122,407,660$ 454,843,248$ (102,807,432)$ 474,443,476$ Receipts from operating grants 6,390,908 - - 6,390,908 Payments for operating expenses (76,370,233) (215,743,023) - (292,113,256) Payments to employees (15,146,749) (113,312,863) - (128,459,612)
Net cash provided by (used in) operating activities 37,281,586 125,787,362 (102,807,432) 60,261,516
Cash flows from noncapital financing activities:Non-operating grants 1,690,873 - - 1,690,873 Transfers from (to) primary government (188,178) (102,807,432) 102,807,432 (188,178) Dredging activities (1,034,962) - - (1,034,962)
Net cash provided by (used in) noncapital financing activities 467,733 (102,807,432) 102,807,432 467,733
Cash flows from capital and related financing activities:CPF contribution 42,233,250 - - 42,233,250 Acquisition of capital assets (47,640,305) (13,824,122) 204,109 (61,260,318) Principal paid on revenue bonds (15,295,000) - - (15,295,000) Paid on installment purchases (6,498,746) - - (6,498,746) Interest paid on long-term debt (17,647,817) - - (17,647,817) Bond issue costs (489,036) - - (489,036) Transfer from primary government 227 - - 227 Capital transfer from component unit - (198,416) 198,416 - Payments from other state agencies 4,792,472 - - 4,792,472 Payments from federal government 4,797,587 - - 4,797,587 Proceeds from sale of capital assets 2,879,295 402,525 (402,525) 2,879,295
Net cash used in capital and related financing activities (32,868,073) (13,620,013) - (46,488,086) Cash flows from investing activities:
Proceeds from sales and maturities 5,201,611 297,851 - 5,499,462 Purchases of investments (5,051,761) - - (5,051,761) Interest and dividends received 650,573 92,969 - 743,542
Net cash provided by investing activities 800,423 390,820 - 1,191,243
Net increase in cash and cash equivalents 5,681,669 9,750,737 - 15,432,406
Cash and cash equivalents, beginning of year 192,235,556 30,181,079 - 222,416,635
Cash and cash equivalents, end of year 197,917,225$ 39,931,816$ -$ 237,849,041$
Noncash investing and financing activities:
Donation of capital assets from other state agency 152,861$ -$ -$ 152,861$ Capitalized interest costs in capital assets 1,182,654$ -$ -$ 1,182,654$
The accompanying Notes to Financial Statements are an integral part of this statement.
34
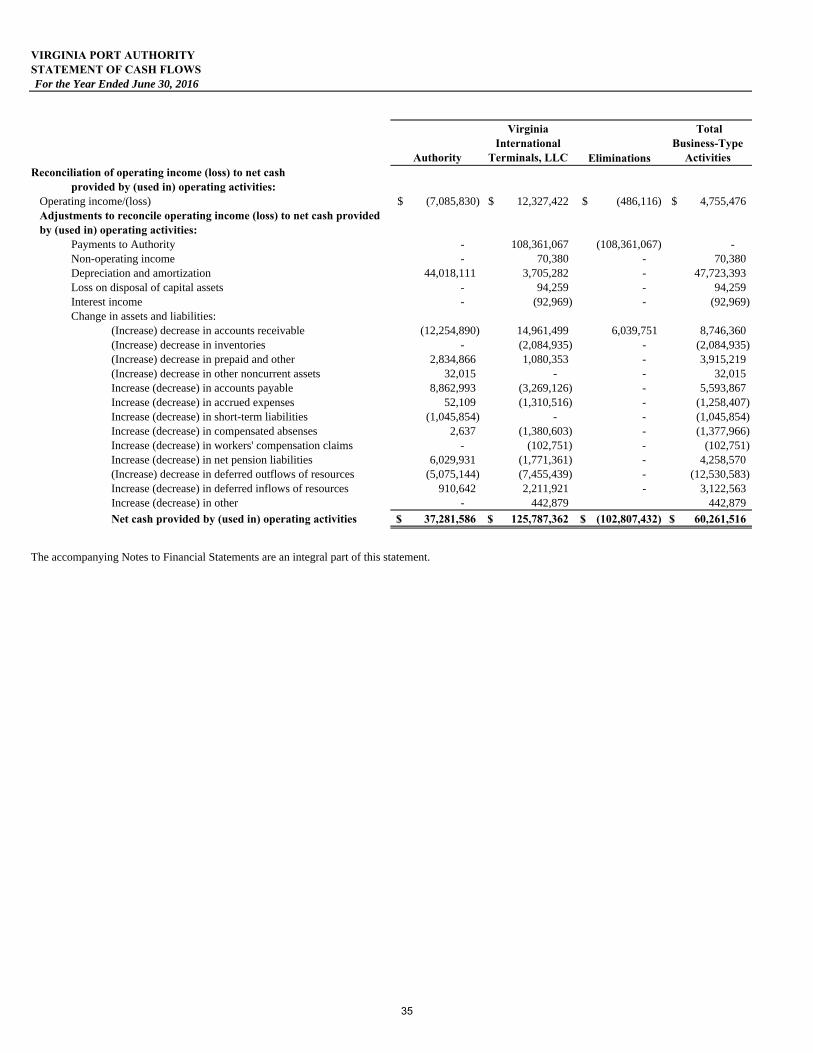
VIRGINIA PORT AUTHORITY STATEMENT OF CASH FLOWSFor the Year Ended June 30, 2016
Primary Government Component Unit
Authority
Virginia International
Terminals, LLC Eliminations
Total Business-Type
Activities Reconciliation of operating income (loss) to net cash
provided by (used in) operating activities: Operating income/(loss) (7,085,830)$ 12,327,422$ (486,116)$ 4,755,476$ Adjustments to reconcile operating income (loss) to net cash provided by (used in) operating activities:
Payments to Authority - 108,361,067 (108,361,067) - Non-operating income - 70,380 - 70,380 Depreciation and amortization 44,018,111 3,705,282 - 47,723,393 Loss on disposal of capital assets - 94,259 - 94,259 Interest income - (92,969) - (92,969) Change in assets and liabilities:
(Increase) decrease in accounts receivable (12,254,890) 14,961,499 6,039,751 8,746,360 (Increase) decrease in inventories - (2,084,935) - (2,084,935) (Increase) decrease in prepaid and other 2,834,866 1,080,353 - 3,915,219 (Increase) decrease in other noncurrent assets 32,015 - - 32,015 Increase (decrease) in accounts payable 8,862,993 (3,269,126) - 5,593,867 Increase (decrease) in accrued expenses 52,109 (1,310,516) - (1,258,407) Increase (decrease) in short-term liabilities (1,045,854) - - (1,045,854) Increase (decrease) in compensated absenses 2,637 (1,380,603) - (1,377,966) Increase (decrease) in workers' compensation claims - (102,751) - (102,751) Increase (decrease) in net pension liabilities 6,029,931 (1,771,361) - 4,258,570 (Increase) decrease in deferred outflows of resources (5,075,144) (7,455,439) - (12,530,583) Increase (decrease) in deferred inflows of resources 910,642 2,211,921 - 3,122,563 Increase (decrease) in other - 442,879 442,879
Net cash provided by (used in) operating activities 37,281,586$ 125,787,362$ (102,807,432)$ 60,261,516$
The accompanying Notes to Financial Statements are an integral part of this statement.
35

VIRGINIA PORT AUTHORITY NOTES TO FINANCIAL STATEMENTS
JUNE 30, 2016
NOTES TO FINANCIAL STATEMENTS (including Blended Component Unit Virginia International Terminals, LLC)
36

VIRGINIA PORT AUTHORITY NOTES TO FINANCIAL STATEMENTS
JUNE 30, 2016
1. SUMMARY OF SIGNIFICANT ACCOUNTING POLICIES
Reporting Entity
The Virginia Port Authority (“the Authority” or “VPA”) was established in 1952, as a political subdivision of the Commonwealth of Virginia, for the purpose of performing any act or function which may be useful in developing, improving, or increasing the commerce of the ports of the Commonwealth. A Board of Commissioners composed of 13 members oversees the Authority. The Board consists of the State Treasurer, the Chief Executive Officer of the Virginia Economic Development Partnership, and 11 members appointed by the Governor, subject to confirmation by the General Assembly, who shall serve at the discretion of the Governor. The Authority's major activities are developing water transportation facilities; providing security services; maintaining ports, facilities, and services; providing public relations and domestic and international advertising; and developing Virginia's ports through cargo solicitation and promotion throughout the world.
Virginia International Terminals, Inc. was incorporated as a non-stock, nonprofit corporation on June 30, 1981, for the purpose of operating marine terminals controlled by the Authority through ownership, lease or other means. Effective August 17, 2013, Virginia International Terminals, Inc. converted from a nonprofit, non-stock corporation to a single-member limited liability company with VPA as the sole member of the Company. As a result, the Authority has determined that Virginia International Terminals, LLC (VIT) should be included in the Authority's financial statements as a blended component unit. A blended component unit is, in substance, part of the primary government’s operations, even though it is a legally separate entity. As a blended component unit, VIT serves or benefits those outside the Authority, but for which the Authority, as the primary institution, is financially accountable or closely related. VIT’s audit report can be obtained by contacting the Director of Financial Reporting at 1431 Terminal Blvd, Norfolk, VA 23505.
The Authority is a blended component unit of the Commonwealth of Virginia. A separate report is prepared for the Commonwealth of Virginia, which includes all agencies, boards, commissions, and authorities meeting the blended component unit definition. The Authority is an integral part of the reporting entity of the Commonwealth of Virginia; accordingly, all funds of the Authority are included in the financial statements of the Commonwealth as a part of the reporting entity.
Basis of Accounting
The activities of the Authority are accounted for as an enterprise fund. The enterprise fund is used to account for operations that are financed and operated in a manner similar to private business enterprises where the intent of the governing body is that the costs of providing goods and services to the general public on a continuing basis be financed or recovered primarily through user charges.
37
VIRGINIA PORT AUTHORITY NOTES TO FINANCIAL STATEMENTS
JUNE 30, 2016
1. SUMMARY OF SIGNIFICANT ACCOUNTING POLICIES - continued
Basis of Accounting - continued
The Authority prepares its financial statements on the accrual basis of accounting in conformitywith accounting principles generally accepted in the United States of America, which providesthat revenues are recorded when earned and expenses are recorded when incurred. Grants arerecognized as revenue as the applicable activity occurs and as soon as all eligibilityrequirements imposed by the grantor have been met.
Use of Estimates
The Authority prepares its financial statements in conformity with accounting principlesgenerally accepted in the United States of America, which requires management to makeestimates and assumptions that affect certain reported amounts and disclosures. Actual resultscould differ from those estimates.
Cash and Cash Equivalents
The Authority considers all highly liquid debt instruments purchased with an original maturityof three months or less to be cash equivalents. The Authority invests available cash balancesin conformity with the guidelines of the Commonwealth of Virginia.
Investments
All investments of the Authority are reported at fair value.
Accounts Receivable
Accounts receivable represent amounts billed to customers for services. Management believesthese amounts are fully collectible and no allowance has been recorded as of June 30, 2016 forthe Authority. VIT utilizes the allowance method for doubtful accounts. Accounts receivableare shown net of the allowance for doubtful accounts of approximately $4.0 million as of June30, 2016 for VIT. The allowance for doubtful accounts is an amount management believeswill be adequate to absorb losses on existing accounts receivable that may becomeuncollectible.
Inventory
The Authority purchases supplies on an as needed basis. Inventories of VIT consist of suppliesand equipment parts and are reported using the average cost method. An inventory allowancehas been established for parts identified as obsolete or to be disposed of within the next 12months. The VIT allowance for inventory totaled $100 thousand at June 30, 2016.
38
VIRGINIA PORT AUTHORITY NOTES TO FINANCIAL STATEMENTS
JUNE 30, 2016
1. SUMMARY OF SIGNIFICANT ACCOUNTING POLICIES - continued
Capital Assets
Capital assets are generally assets with an initial cost of $5,000 or more and an estimated usefullife in excess of two years. Capital assets are valued at historical cost or estimated historicalcost if actual cost is not available. Capital assets are comprised of land, buildings,infrastructure, other improvements, equipment, and construction in progress. Infrastructureassets are considered capital assets that can be preserved for a significantly greater number ofyears than most capital assets. Examples include roads, wharves, dredging, lighting anddrainage systems.
Depreciation on capital assets is computed on the straight-line method over the estimateduseful lives of the assets as follows:
Buildings 3 - 41 years Improvements 5 - 50 years Infrastructure 4 - 41 years Equipment 3 - 28 years
The cost for maintenance and repairs is charged to operations as incurred. When items are retired or otherwise disposed of, the related costs and accumulated depreciation are derecognized from the accounts and any resulting gain or loss on such dispositions is reflected in non-operating revenues or expenses.
Interest costs associated with the construction of the Authority's capital assets are capitalized and reflected as part of the cost of the asset. Interest cost incurred is charged to the assets under construction. Projects funded entirely by a specific borrowing receive the effective interest rate on that borrowing. Projects funded by multiple borrowings receive interest based on the weight average interest rate of all Authority borrowings. No interest is capitalized on the portion of projects funded by grants. Interest capitalized for the fiscal year ended June 30, 2016 was approximately $1.2 million.
A capital asset is considered impaired when its service utility has declined significantly and unexpectedly. If determined to be permanently impaired, capital assets are reported at the lower of carrying or fair value. Any insurance recoveries associated with events leading to an asset impairment are netted against impairment losses. The Authority did not maintain any impaired assets as of June 30, 2016.
39

VIRGINIA PORT AUTHORITY NOTES TO FINANCIAL STATEMENTS
JUNE 30, 2016
1. SUMMARY OF SIGNIFICANT ACCOUNTING POLICIES - continued
Long-Term Obligations
Long-term obligations are reported as liabilities in the Statement of Net Position. Bondpremiums and discounts are deferred and amortized over the life of the bonds using theeffective interest method. Bonds payable are reported net of the applicable bond premium ordiscount with allowable refunding gains or losses recorded as deferred inflows and outflowsof resources. Bond issuance costs are expensed as incurred with the exception of bondinsurance costs which are reported as deferred outflows of resources and amortized over theterm of the related debt.
Compensated Absences
Compensated absences represent the amounts of paid time off (PTO) and legacy leave earnedby employees of the Authority, but not taken at June 30, 2016. On January 1, 2015 theAuthority converted the employees’ earned but not used compensated absence balances as ofDecember 31, 2014 into a separate Legacy Leave Bank. Legacy Leave is available for use aspaid time off until December 31, 2019. Balances remaining unused at January 1, 2020 will befrozen to use. Legacy Leave may be paid out upon termination based on an employee’sDecember 31, 2014 wage rate times the then current balance or 160 hours, whichever is less.
Additionally, modifications to the current PTO policy require that any unused PTO in excessof 40 hours be forfeited at the end of each calendar year. Up to forty hours of earned butunused PTO at the end of a calendar year may be carried over into the next calendar year foruse within the next 6 months. At June 30, all prior year earned but unused PTO balances willbe forfeited. Balances are earned on a quarterly basis but available for use on January 1 eachyear. PTO used in excess of amounts actually earned at termination are to be repaid to theAuthority.
VIT has an identical compensated absences policy. See note six for further discussion.
Budgets and Budgetary Accounting
The Appropriation Act as enacted by the General Assembly of Virginia established theAuthority’s budget for the year ended June 30, 2016. No payments can be made out of thestate treasury except in pursuance of appropriations made by law.
Restricted Assets
Restricted assets are utilized in accordance with the restrictions placed upon the resources.When a cost is incurred, for which both restricted and unrestricted assets are available,management determines on an individual basis how resources are allocated.
40

VIRGINIA PORT AUTHORITY NOTES TO FINANCIAL STATEMENTS
JUNE 30, 2016
1. SUMMARY OF SIGNIFICANT ACCOUNTING POLICIES - continued
Cost of Issuance
Issuance costs are expensed when incurred unless they relate to bond insurance which is record as a deferred outflow of resources. Amortization expense for the year ended June 30, 2016 was $32,015 and included only bond insurance costs.
Net Position
The Authority records net position that is subject to external restrictions based on individual agreements. The restrictions are established by the Authority’s governing jurisdictions or other requirements. The restricted net position may include the Authority’s advance contributions for future construction and amounts held for debt service payments.
Deferred Outflows/Inflows of Resources
In addition to assets, the Statement of Net Position will sometimes report a separate section for deferred outflows of resources. This separate financial statement element, deferred outflows of resources, represents a consumption of net position that applies to a future period and so will not be recognized as an outflow of resources (expense) until consumption. At June 30, 2016, the Authority had $10,828,638 of deferred outflows of resources; $5,228,647 were pension-related with the balance, $5,599,991 being bond-related.
In addition to liabilities, the Statement of Net Position will sometimes report a separate section for deferred inflows of resources. This separate financial statement element, deferred inflows of resources, represents an acquisition of net position that applies to a future period and so will not be recognized as an inflow of resources (revenue) until that period. At June 30, 2016, the Authority had $1,677,004 of deferred inflows of resources; $743,702 for the stand-alone pension plan, $215,000 for the multiple-employer pension plan, and $718,302 related to bonds.
Pensions
For purposes of measuring the net pension liability, deferred outflows of resources and deferred inflows of resources related to pensions, and pension expense, information about the fiduciary net position of the Authority’s Retirement Plan and the additions to/deductions from the Authority’s Retirement Plan’s net fiduciary position have been determined on the same basis as they were reported by the Virginia Retirement System (VRS). For the stand-alone plan and the multiple employer plan, benefit payments (including refunds of employee contributions) are recognized when due and payable in accordance with the benefit terms.
41
VIRGINIA PORT AUTHORITY NOTES TO FINANCIAL STATEMENTS
JUNE 30, 2016
1. SUMMARY OF SIGNIFICANT ACCOUNTING POLICIES - continued
Net Pension Liability
The Authority’s stand-alone net pension liability was measured as of June 30, 2015. The total pension liability used to calculate the net pension liability was determined by an actuarial valuation performed as of June 30, 2015 using updated actuarial assumptions, applied to all periods included in the measurement.
The Authority’s multiple-employer plan’s net pension liability was measured as of June 30, 2015. The total pension liability used to calculate the net pension liability was determined by an actuarial valuation performed as of June 30, 2014, using updated actuarial assumptions, applied to all periods included in the measurement and rolled forward to the measurement date of June 30, 2015.
Operating vs. Nonoperating
Operating revenues and expenses generally result from providing services in connection with ongoing operations. The principal revenue for the Authority is funds collected from VIT in accordance with a service agreement. The Authority also recognizes other operating revenue in the form of rents, license agreements, and charges for services (for example, security surcharges). Operating expenses include the cost of services, administrative expenses and depreciation and amortization on capital assets. All revenues and expenses not meeting this definition are reported as nonoperating revenues and expenses.
Investment Income
Interest income, including net realized and unrealized gains or losses on investment transactions and investment expenses, is recorded as non-operating revenue.
Subsequent Events
In preparing these financial statements, the Authority has evaluated events and transactions for potential recognition or disclosure through October 26, 2016, the date the financial statements were available to be issued.
42

VIRGINIA PORT AUTHORITY NOTES TO FINANCIAL STATEMENTS
JUNE 30, 2016
1. SUMMARY OF SIGNIFICANT ACCOUNTING POLICIES - continued
Recently Issued Accounting Pronouncements
GASB Statement No. 75, Accounting and Financial Reporting for Postemployment Benefits Other Than Pensions, will improve accounting and financial reporting by state and local governments for OPEB. It will also require the recognition of the entire OPEB liability and a comprehensive measure of OPEB expense. GASB Statement No. 75 will be effective for fiscal years beginning after June 15, 2017.
GASB Statement No. 78, Pensions Provided Through Certain Multiple-Employer Defined Benefit Pension Plans, amends the scope and applicability of GASB Statement No. 68, Accounting and Financial Reporting for Pensions, to exclude pensions provided to employees of state or local governmental employers through a cost-sharing multiple-employer defined benefit pension plan that meets specified criteria established in the Statement. The Statement further establishes requirements for recognition and measurement of pension expense, expenditures, and liabilities; note disclosures; and required supplementary information for pensions thereof. The provisions of GASB Statement No. 78 are effective for fiscal years beginning after December 15, 2015.
GASB Statement No.79, Certain External Investment Pools and Pool Participants, establishes criteria for an external investment pool to qualify for making the election to measure all of its investments at amortized cost for financial reporting purposes, and for pool participants thereof. The specific criteria that must be met as established in the Statement address (1) how the external investment pool transacts with pool participants; (2) requirements for portfolio maturity, quality, diversification, and liquidity; (3) calculation and requirements of a shadow price. Provisions of GASB Statement No. 79 for certain requirements for portfolio quality, custodial credit risk, and shadow pricing are effective for fiscal years beginning after June 15, 2015.
GASB Statement No. 80, Blending Requirements for Certain Component Units, provides clarification on financial statement presentation requirements for certain component units previously established by GASB Statement No. 14, The Financial Reporting Entity. The Statement creates an additional blending requirement that becomes the third requirement for the financial statement presentation of component units and applies to component units that are organized as not-for-profit corporations in which the primary government is the sole corporate member. The provisions of GASB Statement No. 80 are effective for fiscal years beginning after June 15, 2016.
43
VIRGINIA PORT AUTHORITY NOTES TO FINANCIAL STATEMENTS
JUNE 30, 2016
1. SUMMARY OF SIGNIFICANT ACCOUNTING POLICIES - concluded
Recently Issued Accounting Pronouncements – concluded
GASB Statement No. 82, Pension Issues—an amendment of GASB Statements No. 67, No. 68,and No. 73, address certain issues that have been raised with respect to GASB Statement No.67, Financial Reporting for Pension Plans, GASB Statement No. 68, Accounting andFinancial Reporting for Pensions, and GASB Statement No. 73, Accounting and FinancialReporting for Pensions and Related Assets That Are Not within the Scope of GASB StatementNo 68, and Amendments to Certain Provisions of GASB Statement Nos 67 and 68. Theprovisions of GASB Statement No. 82 are effective for fiscal years beginning after June 15,2016 except for the requirements of this Statement for the selection of assumptions in acircumstance in which an employer’s pension liability is measured as of a date other than theemployer’s most recent fiscal year-end. In that circumstance, the requirements for the selectionof assumptions are effective for that employer in the first reporting period in which themeasurement date of the pension liability is on or after June 15, 2017.
Management is evaluating the above referenced pronouncements and has yet to determine theimpact on the company’s financial statements.
2. CASH, CASH EQUIVALENTS, AND INVESTMENTS
As of June 30, 2016, the Treasurer of Virginia, pursuant to Section 2.2-1800, et seq., Code ofVirginia, who is responsible for the collection, disbursement, custody, and investment of statefunds, held $54,388,278 in cash and cash equivalents for the Authority.
44
VIRGINIA PORT AUTHORITY NOTES TO FINANCIAL STATEMENTS
JUNE 30, 2016
2. CASH, CASH EQUIVALENTS, AND INVESTMENTS - continued Certain deposits and investments are held by the Authority or are held by trustees for the Authority. These accounts are collateralized in accordance with the Virginia Security for Public Deposits Act, Section 2.2-4400, et seq., Code of Virginia, or covered by the Federal Deposit Insurance Corporation (FDIC). Under the Act, banks and savings institutions holding public deposits in excess of the FDIC amounts must pledge collateral to the Commonwealth of Virginia Treasury Board. At June 30, 2016, all Authority deposits were considered fully collateralized and were not exposed to Custodial Credit Risk. Short-term investments generally represent deposits and securities with maturities of one year or less. Long-term investments generally represent securities with maturities of greater than one year.
The Authority is required to segregate liquid assets (cash and investments) that are restricted for various purposes. As of June 30, 2016, these assets aggregated $130,900,340, with $78,456,933 classified as current and $52,443,407 classified as noncurrent based on the purpose for which the assets are restricted. Current restricted assets consist of: $27,504,447 in cash related to debt service payments to be made July 1, 2016, $48,391,121 in a construction fund, and $2,561,365 in cash and investments for other purposes.
Noncurrent restricted assets consist of: $19,223,881 in cash and investments reserved to secure debt service in future years as
required by the Authority’s bond covenants, $26,535,610 in construction fund cash and investments held by trustees that will be used
to fund applicable projects, and $6,683,916 in cash and investments for other purposes.
VIT also held $17,256,880 in restricted cash and investments at June 30, 2016, as a required reserve to fund capital and extraordinary maintenance. Statutes authorize the investment of funds held by the Authority in obligations of the Commonwealth, federal government, other states or political subdivisions thereof, Virginia political subdivisions, the International Bank for Reconstruction and Development, the Asian Development Bank, and the African Development Bank. In addition, the Authority may invest in prime quality commercial paper rated prime 1 by Moody's Investment Service or A-1 by Standard and Poor's Incorporated, overnight term or open repurchase agreements, and money market funds comprised of investments which are not rated but are otherwise legal investments of the Authority.
45
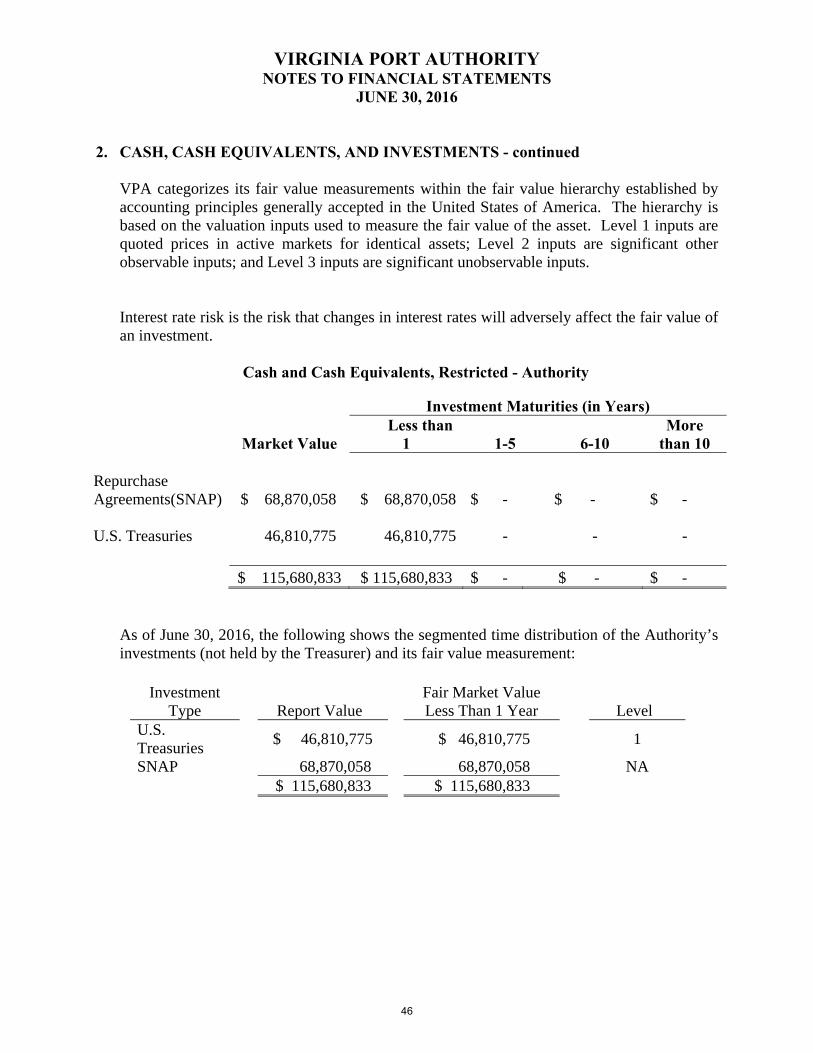
VIRGINIA PORT AUTHORITY NOTES TO FINANCIAL STATEMENTS
JUNE 30, 2016
2. CASH, CASH EQUIVALENTS, AND INVESTMENTS - continued
VPA categorizes its fair value measurements within the fair value hierarchy established byaccounting principles generally accepted in the United States of America. The hierarchy isbased on the valuation inputs used to measure the fair value of the asset. Level 1 inputs arequoted prices in active markets for identical assets; Level 2 inputs are significant otherobservable inputs; and Level 3 inputs are significant unobservable inputs.
Interest rate risk is the risk that changes in interest rates will adversely affect the fair value of an investment.
Cash and Cash Equivalents, Restricted - Authority
As of June 30, 2016, the following shows the segmented time distribution of the Authority’s investments (not held by the Treasurer) and its fair value measurement:
Investment Type Report Value
Fair Market Value Less Than 1 Year Level
U.S. Treasuries
$ 46,810,775 $ 46,810,775 1
SNAP 68,870,058 68,870,058 NA$ 115,680,833 $ 115,680,833
Investment Maturities (in Years)
Market Value Less than
1 1-5 6-10 More
than 10
Repurchase Agreements(SNAP) $ 68,870,058 $ 68,870,058 $ - $ - $ -
U.S. Treasuries 46,810,775 46,810,775 - - -
$ 115,680,833 $ 115,680,833 $ - $ - $ -
46

VIRGINIA PORT AUTHORITY NOTES TO FINANCIAL STATEMENTS
JUNE 30, 2016
2. CASH, CASH EQUIVALENTS, AND INVESTMENTS - continued
Investments held by the Treasurer of Virginia
Investments and cash equivalents held by the Treasurer of Virginia represent the Authority's allocated share of cash collateral received and reinvested and securities received for the State Treasury's securities lending program. Information related to the credit risk of these investments and the State Treasury’s securities lending program is available on a statewide level in the Commonwealth of Virginia’s Comprehensive Annual Financial Report. The Commonwealth’s policy is to record unrealized gains and losses in the General Fund in the Commonwealth’s basic financial statements. When gains or losses are realized, the actual gains and losses are recorded by the affected agencies.
Blended Component Unit – VIT
Interest rate risk is the risk that changes in interest rates will adversely affect the fair value of an investment. VIT does not have a formal investment policy that limits investment maturities as a means of managing its exposure to fair value losses arising from increasing interest rates.
Fair value measurement: VIT categorizes its fair value measurements within the fair value hierarchy established by accounting principles generally accepted in the United States of America. The hierarchy is based on the valuation inputs used to measure the fair value of the asset. Level 1 inputs are quoted prices in active markets for identical assets; Level 2 inputs are significant other observable inputs; and Level 3 inputs are significant unobservable inputs.
VIT has the following recurring fair value measurements as of June 30, 2016:
Investment securities of $1,188,026 are valued using quoted market prices (Level 1 inputs).
47
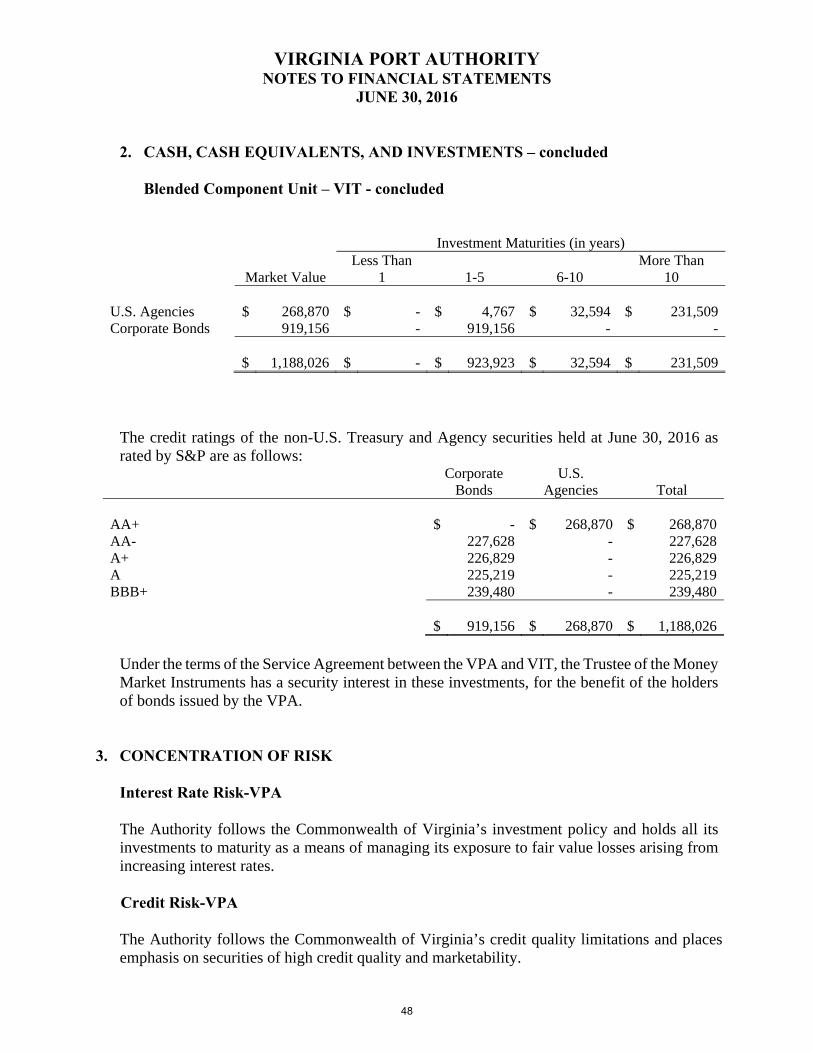
VIRGINIA PORT AUTHORITY NOTES TO FINANCIAL STATEMENTS
JUNE 30, 2016
2. CASH, CASH EQUIVALENTS, AND INVESTMENTS – concluded
Blended Component Unit – VIT - concluded
Investment Maturities (in years) Less Than More Than
Market Value 1 1-5 6-10 10
U.S. Agencies $ 268,870 $ - $ 4,767 $ 32,594 $ 231,509Corporate Bonds 919,156 - 919,156 - -
$ 1,188,026 $ - $ 923,923 $ 32,594 $ 231,509
The credit ratings of the non-U.S. Treasury and Agency securities held at June 30, 2016 as rated by S&P are as follows:
Corporate U.S.Bonds Agencies Total
AA+ $ - $ 268,870 $ 268,870AA- 227,628 - 227,628A+ 226,829 - 226,829A 225,219 - 225,219BBB+ 239,480 - 239,480
$ 919,156 $ 268,870 $ 1,188,026
Under the terms of the Service Agreement between the VPA and VIT, the Trustee of the Money Market Instruments has a security interest in these investments, for the benefit of the holders of bonds issued by the VPA.
3. CONCENTRATION OF RISK
Interest Rate Risk-VPA
The Authority follows the Commonwealth of Virginia’s investment policy and holds all itsinvestments to maturity as a means of managing its exposure to fair value losses arising fromincreasing interest rates.
Credit Risk-VPA
The Authority follows the Commonwealth of Virginia’s credit quality limitations and places emphasis on securities of high credit quality and marketability.
48

VIRGINIA PORT AUTHORITY NOTES TO FINANCIAL STATEMENTS
JUNE 30, 2016
3. CONCENTRATION OF RISK - concluded
http://www.trs.virginia.gov/Documents/Cash/GenAcctInvstPolicy.pdf
Concentration of Credit Risk-VPA
The Authority places no limit on the amount it may invest in any one issuer.
Concentration of Risk - VIT
VIT places no limit on the amount it may invest in any one issuer. More than 5% of VIT’s investments are in Federal Home Loan Mortgage Corporation as U.S. Agencies, AT&T, Bank of Nova Scotia, Caterpillar Financial Services, and Chevron Corporation. These investments are 23%, 20%, 19%, 19%, and 19%, respectively, of VIT’s total investments. It should be noted that restricted short-term investments at June 30, 2016 comprise 6.9% of combined restricted cash and cash equivalents plus restricted short-term investments.
Other financial instruments that potentially subject the Company to credit risk consist of accounts receivable. VIT provides labor-intensive services to major shipping-lines that import and export products through the marine terminals that it operates in Hampton Roads. VIT can hold cargo shipped through the terminals as collateral for these receivables. Since VIT controls the movement of cargo through the terminals, it has ready access to the collateral.
For the year ended June 30, 2016, approximately 23% of total revenue was derived from two customers. Receivables outstanding at June 30, 2016 for this concentration totaled $12,626,132.
A significant portion of VIT’s labor is provided by contract with the International Longshoremen’s Association. The current contract expires September 30, 2018.
4. DUE FROM OTHER GOVERNMENTS
Amounts due from other governments as of June 30, 2016 include:
US Department of Transportation Virginia Department of Transportation
$ 4,855,849 416,446
Virginia Department of Emergency Management Virginia Commonwealth Port Fund
264,3821,076,870
Transportation Trust Fund 7,504,340Total $ 14,117,887
49
Policy details can be found in the General Account Investment Guidelines document at:
Credit Risk-VPA - concluded

VIRGINIA PORT AUTHORITY NOTES TO FINANCIAL STATEMENTS
JUNE 30, 2016
5. CAPITAL ASSETS
A summary of changes in capital assets of the Authority follows:
Balance BalanceJune 30, 2015 Additions Deletions Transfers June 30, 2016
Capital assets not being depreciated or amortized:
Land and improvements $ 105,539,821 $ - $ (2,790,674) $ -. $ 102,749,147
Construction in progress 108,312,870 45,845,385 (225,981) (31,495,125) 122,437,149
213,852,691 45,845,385 (3,016,655) (31,495,125) 225,186,296Depreciable capital assets:
Infrastructure 632,420,711 126,078 - 24,208,051 656,754,840Buildings 101,690,881 - (1,487,933) (6,119,126) 94,083,822Improvements other than buildings 30,975,431 39,463 (898,995) 11,500 30,127,399Equipment 295,791,643 1,629,379 (6,650,391) 13,394,700 304,165,331
1,060,878,666 1,794,920 (9,037,319) 31,495,125 1,085,131,392Less accumulated depreciation and amortization for:
Infrastructure 252,454,907 21,029,254 - - 273,484,161 Buildings 62,129,465 2,758,710 (401,085) - 64,487,090Improvements other than buildings 24,082,098 757,573 (774,737) - 24,064,934 Equipment 182,406,125 19,472,574 (6,650,391) - 195,228,308
Total accumulated depreciation and amortization 521,072,595 44,018,111 (7,826,213) - 557,264,493
Depreciable capital assets, net 539,806,071 (42,223,191) (1,211,106) 31,495,125 527,866,899
Total capital assets, net $ 753,658,762 $ 3,622,194 $ (4,227,761) $ - $ 753,053,195
50

VIRGINIA PORT AUTHORITY NOTES TO FINANCIAL STATEMENTS
JUNE 30, 2016
5. CAPITAL ASSETS - concluded
Blended Component Unit – VIT
Changes in capital assets for the year ended June 30, 2016 are summarized as follows:
Balance Balance June 30, 2015 Additions Deletions June 30,2016
Capital assets $ 88,562,724 $ 13,824,122 $ (6,339,667) $ 96,047,179 Less: Accumulated depreciation & amortization 67,334,695 3,705,282 (5,842,884) 65,197,093 Net capital assets $ 21,228,029 $ 10,118,840 $ (496,783) $ 30,850,086
6. LONG-TERM DEBT
Changes in Long-Term Indebtedness
A summary of changes in long-term liability activity (including current portion) for the Authority follows:
Balance June 30, 2015 Increases Decreases
Balance June 30, 2016
Amounts Due
Within one Year
Revenue Bonds $ 521,640,000 $ - $ (15,295,000) $ 506,345,000 $ 17,070,000
Issuance Premium 23,226,805 - (1,684,374) 21,542,431 1,403,259
Total Revenue Bonds 544,866,805 - (16,979,374) 527,887,431 18,473,259
Installment Purchases 23,790,847 - (6,498,746) 17,292,101 6,297,060
Compensated Absences 877,161 1,945,295 (1,404,433) 1,418,023 1,403,299
Total $ 569,534,813 $ 1,945,295 $ (24,882,553) $ 546,597,555 $ 26,173,618
51

VIRGINIA PORT AUTHORITY NOTES TO FINANCIAL STATEMENTS
JUNE 30, 2016
6. LONG-TERM DEBT - continued
Details of Long-Term Indebtedness
Revenue Bonds Balance as of June 30, 2016
On April 6, 2006, Commonwealth Port Fund Refunding Bonds, dated the same, were issued in the principal amount of $21,730,000. The bonds are payable in annual installments, the final installment of $1,365,000 with interest of 5.5% payable semiannually, due July 1, 2016. These bonds are payable primarily from the Commonwealth Port Fund. $ 1,365,000
On April 11, 2007, Port Facilities Revenue Refunding Bonds Series 2007, dated the same, were issued in the principal amount of $74,255,000. On March 19, 2015, funds were placed in escrow, with irrevocable instructions to refund $52,715,000 (all but $6,900,000) on April 20, 2015. The remaining outstanding bonds are payable in annual installments, the final installment of $3,535,000 with interest of 5.0% payable semiannually, due July 1, 2016. The bonds are payable from the net revenues of the Authority. 3,535,000
On May 6, 2010, Port Facilities Revenue Refunding Bond Series 2010 (the “Series 2010 Bonds”), dated April 21, 2010, were issued in the principal amount of $68,630,000. The bonds are payable in annual installments varying from $1,515,000 to $4,590,000 beginning July 1, 2016. Semi-annual interest payments commence January 1, 2011 with interest of 3.375% to 5.0% payable semiannually, the final installment due July 1, 2040. The bonds are payable from the net revenues of the Authority. Proceeds of the Series 2010 Bonds have been used, together with other funds, (a) to currently refund in full the outstanding principal amount of the Authority’s $65,000,000 Subordinate Port Facilities Revenue Bond Anticipation Note, Series 2009 (the “Series 2009 BAN”), (b) to fund a Debt Service Reserve Account for the Series 2010 Bonds as required under the Resolution, and (c) to pay all or a portion of the expenses incurred with respect to the issuance of the Series 2010 Bonds and the refunding of the Series 2009 BAN. 68,630,000
52

VIRGINIA PORT AUTHORITY NOTES TO FINANCIAL STATEMENTS
JUNE 30, 2016
6. LONG-TERM DEBT - continued
Details of Long-Term Indebtedness – continued
Revenue Bonds - continued
On July 27, 2011, Commonwealth Port Fund Revenue Bonds Series 2011 (Non-AMT), (the “Series 2011 Bonds”), dated the same, were issued in the principal amount of $57,370,000. The bonds are payable in annual installments varying from $2,565,000 to $9,250,000 beginning July 1, 2028. Semi-annual interest payments commence January 1, 2012 with interest of 5.0% payable semiannually, the final installment due July 1, 2036. These bonds are payable primarily from the Commonwealth Port Fund. Proceeds of the Series 2011 Bonds have been used to finance or refinance the costs of the Craney Island Eastward Expansion (the “2011 Project”) and to pay costs of issuance.
Balance as of June 30, 2016
$ 57,370,000
On January 25, 2012, Commonwealth Port Fund Revenue Refunding Bonds Series 2012 (Taxable), (the “Series 2012 Bonds”), dated the same, were issued in the principal amount of $108,015,000. The bonds are payable in annual installments varying from $6,470,000 to $8,730,000 with semi-annual interest payments interest ranging from 1.16% to 3.72% payable semiannually, the final installment due July 1, 2027. Proceeds of the Series 2012 Bonds have been used to (a) refund in full the outstanding principal amount of the Authority’s Commonwealth Port Fund Revenue Bonds (2002 Resolution) (the “Series 2002”) issued on July 23, 2002, and (b) pay all or a portion of the expenses incurred with respect to the issuance of the Series 2012 Bonds and the refunding of the Series 2002 Bonds. The Series 2012 Bonds are payable primarily from the Commonwealth Port Fund. 88,970,000
53

VIRGINIA PORT AUTHORITY NOTES TO FINANCIAL STATEMENTS
JUNE 30, 2016
6. LONG-TERM DEBT - continued
Details of Long-Term Indebtedness - continued
Revenue Bonds - continued On September 26, 2012, Commonwealth Port Fund Revenue Refunding Bonds, Series 2012B (Taxable), (the “Series 2012B Bonds”) dated the same, issued in the principal amount of $45,230,000. The bonds are payable in annual installments varying from $2,745,000 to $3,630,000 with interest of .725% to 3.376% payable semiannually, the final installment due July 1, 2029. Proceeds of the Series 2012B Bonds will be used (a) to pay the costs of refunding all or a portion of the Series 2005A Bonds, and (b) to pay costs of issuance of the Series 2012B Bonds. The Series 2005A Bonds were issued on April 14, 2005. As of July 1, 2012, the outstanding principal amount of the Series 2005A Bonds was $44,990,000. The Series 2005A Bonds are subject to optional redemption on or after July 1, 2015 at a redemption price of 100% of the principal amount thereof. The Series 2012B Bonds are payable primarily from the Commonwealth Port Fund. On September 26, 2012, Commonwealth Port Fund Revenue Refunding Bonds, Series 2012C (Non-AMT), (the “Series 2012C Bonds”) dated the same, were issued in the principal amount of $4,795,000. The bonds are payable in the principal amounts of $780,000 and $4,015,000, are due July 1, 2029 and July 1, 2030, respectively. Semi-annual interest payments commence July 1, 2013 with interest of 3.0% to 5.0% payable semiannually, the final installment due July 1, 2030. These bonds have a first optional redemption date of July 1, 2022. The proceeds of the Series 2012C Bonds will be used (a) to pay the costs of refunding all or a portion of the Series 2005B Bonds, and (b) to pay costs of issuance of the Series 2012C Bonds. The Series 2005B Bonds were issued on April 14, 2005. As of July 1, 2012, the outstanding principal amount of the Series 2005B Bonds was $4,905,000. The Series 2005B Bonds are subject to optional redemption on or after July 1, 2015 at a redemption price of 100% of the principal amount thereof. The Series 2012C Bonds are payable primarily from the Commonwealth Port Fund.
Balance as of June 30, 2016
$ 43,170,000
4,795,000
54

VIRGINIA PORT AUTHORITY NOTES TO FINANCIAL STATEMENTS
JUNE 30, 2016
6. LONG-TERM DEBT - continued
Details of Long-Term Indebtedness - continued
Revenue Bonds - continued
On October 22, 2013, Port Facilities Fund Revenue Refunding Bonds, Series 2013, (the “Series 2013 Bonds”) dated the same, were issued in the amount of $37,945,000. The bonds are payable in annual principal installments varying from $610,000 to $9,840,000 beginning July 1, 2016. Semi-annual interest payments commence July 1, 2014 with interest of 3.09% payable semiannually, the final installment due July 1, 2028. The proceeds of the Series 2013 Bonds have been used (a) to pay the costs of refunding a portion of the Series 2003 Bonds, (b) to pay the cost of refunding a portion of the Series 2006 Bonds and (c) to pay costs of issuance of the Series 2013 Bonds. The Series 2013 Bonds are payable from the net revenues of the Authority.
On March 19, 2015, Port Facilities Fund Revenue Refunding Bonds, Series 2015A (AMT) (the “Series 2015A Bonds”) dated the same, were issued in the amount of $85,130,000. The bonds are payable in principal annual installment amounts varying from $8,915,000 to $12,545,000, with the first principal installment due on July 1, 2029. Semi-annual interest payments commence July 1, 2015 with interest of 5.0% payable semiannually, the final installment due July 1, 2036. These bonds have a first optional redemption date of July 1, 2025. The proceeds of the Series 2015A Bonds have been used (a) to pay the costs of refunding all of the remaining Series 2003 Bonds and Series 2006 Bonds, and (b) to pay costs of issuance of the Series 2015A Bonds and are payable from the net revenues of the Authority.
On March 19, 2015, Port Facilities Fund Revenue Refunding Bonds, Series 2015B (Taxable) (the “Series 2015B Bonds”) dated the same, were issued in the amount of $56,755,000. The bonds are payable in the principal annual installments varying from $830,000 and $5,835,000 beginning July 1, 2016 with interest of 1.019% to 3.515% payable semiannually, the final installment due July 1, 2027. The proceeds of the Series 2015B Bonds have been used (a) to pay the costs of refunding a portion of the remaining Series 2007 Bonds, and (b) to pay costs of issuance of the Series 2015B Bonds. The Series 2015B Bonds are payable from the net revenues of the Authority.
Balance as of June 30, 2016
$ 37,945,000
85,130,000
56,755,000
55
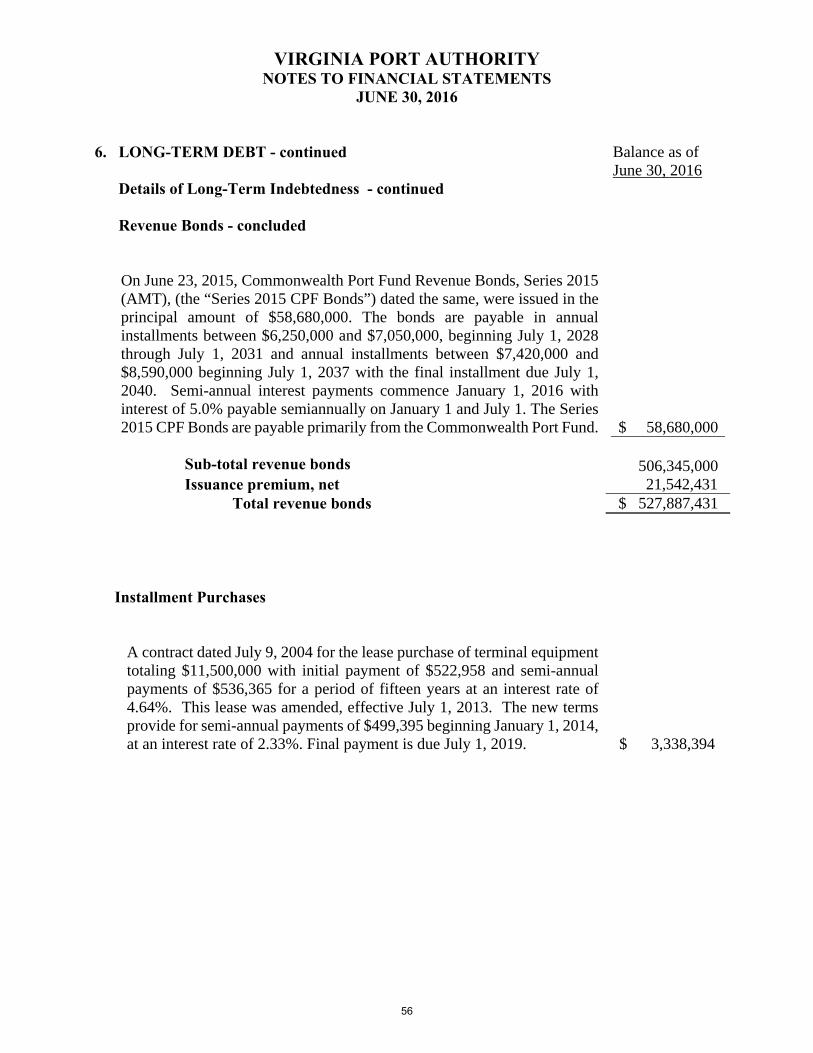
VIRGINIA PORT AUTHORITY NOTES TO FINANCIAL STATEMENTS
JUNE 30, 2016
6. LONG-TERM DEBT - continued Details of Long-Term Indebtedness - continued Revenue Bonds - concluded
On June 23, 2015, Commonwealth Port Fund Revenue Bonds, Series 2015 (AMT), (the “Series 2015 CPF Bonds”) dated the same, were issued in the principal amount of $58,680,000. The bonds are payable in annual installments between $6,250,000 and $7,050,000, beginning July 1, 2028 through July 1, 2031 and annual installments between $7,420,000 and $8,590,000 beginning July 1, 2037 with the final installment due July 1, 2040. Semi-annual interest payments commence January 1, 2016 with interest of 5.0% payable semiannually on January 1 and July 1. The Series 2015 CPF Bonds are payable primarily from the Commonwealth Port Fund.
Balance as of June 30, 2016
$ 58,680,000 Sub-total revenue bonds 506,345,000 Issuance premium, net 21,542,431
Total revenue bonds $ 527,887,431 Installment Purchases
A contract dated July 9, 2004 for the lease purchase of terminal equipment totaling $11,500,000 with initial payment of $522,958 and semi-annual payments of $536,365 for a period of fifteen years at an interest rate of 4.64%. This lease was amended, effective July 1, 2013. The new terms provide for semi-annual payments of $499,395 beginning January 1, 2014, at an interest rate of 2.33%. Final payment is due July 1, 2019. $ 3,338,394..
56
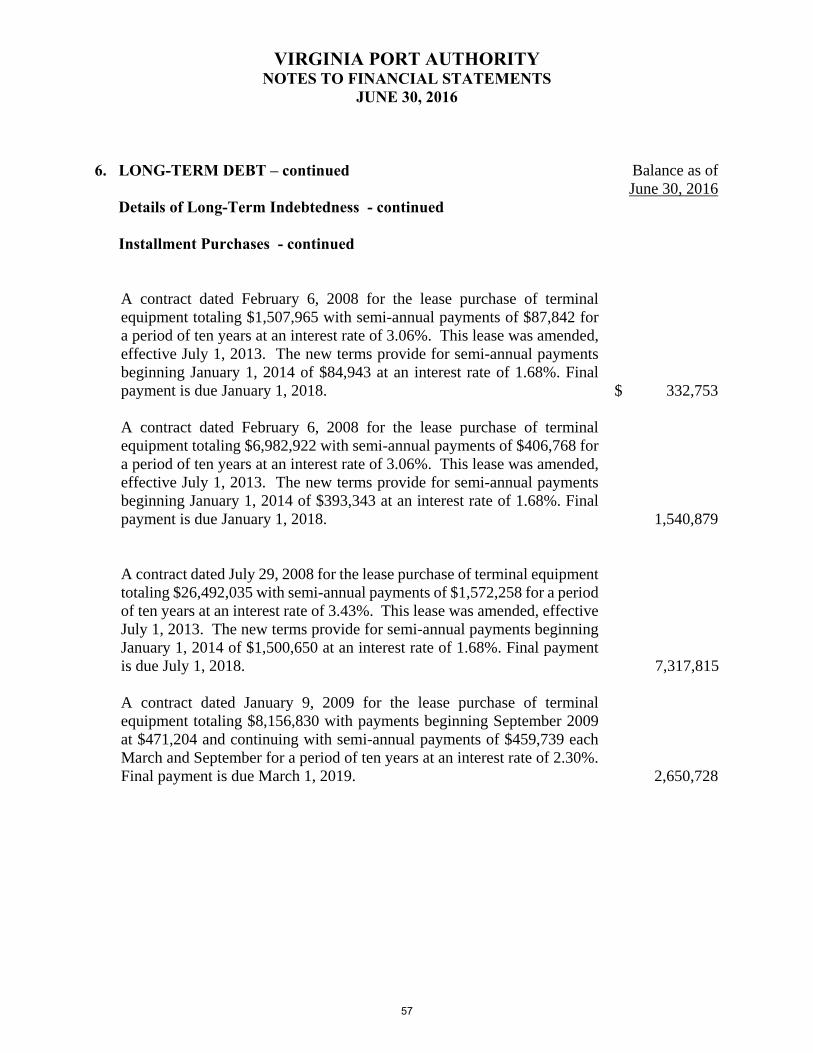
VIRGINIA PORT AUTHORITY NOTES TO FINANCIAL STATEMENTS
JUNE 30, 2016
6. LONG-TERM DEBT – continued
Details of Long-Term Indebtedness - continued
Installment Purchases - continued
A contract dated February 6, 2008 for the lease purchase of terminal equipment totaling $1,507,965 with semi-annual payments of $87,842 for a period of ten years at an interest rate of 3.06%. This lease was amended, effective July 1, 2013. The new terms provide for semi-annual payments beginning January 1, 2014 of $84,943 at an interest rate of 1.68%. Final payment is due January 1, 2018.
A contract dated February 6, 2008 for the lease purchase of terminal equipment totaling $6,982,922 with semi-annual payments of $406,768 for a period of ten years at an interest rate of 3.06%. This lease was amended, effective July 1, 2013. The new terms provide for semi-annual payments beginning January 1, 2014 of $393,343 at an interest rate of 1.68%. Final payment is due January 1, 2018.
Balance as of June 30, 2016
$ 332,753
1,540,879
A contract dated July 29, 2008 for the lease purchase of terminal equipment totaling $26,492,035 with semi-annual payments of $1,572,258 for a period of ten years at an interest rate of 3.43%. This lease was amended, effective July 1, 2013. The new terms provide for semi-annual payments beginning January 1, 2014 of $1,500,650 at an interest rate of 1.68%. Final payment is due July 1, 2018. 7,317,815.
A contract dated January 9, 2009 for the lease purchase of terminal equipment totaling $8,156,830 with payments beginning September 2009 at $471,204 and continuing with semi-annual payments of $459,739 each March and September for a period of ten years at an interest rate of 2.30%. Final payment is due March 1, 2019. 2,650,728
57
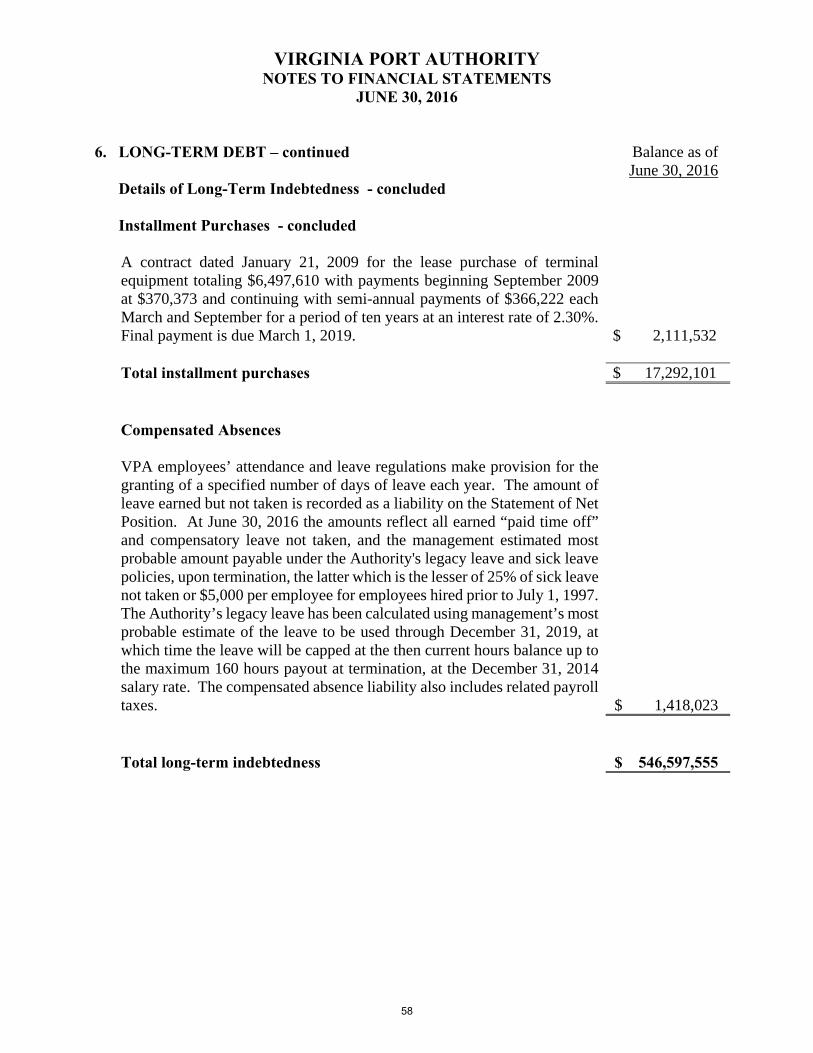
VIRGINIA PORT AUTHORITY NOTES TO FINANCIAL STATEMENTS
JUNE 30, 2016
6. LONG-TERM DEBT – continued Details of Long-Term Indebtedness - concluded Installment Purchases - concluded
Balance as of June 30, 2016
A contract dated January 21, 2009 for the lease purchase of terminal equipment totaling $6,497,610 with payments beginning September 2009 at $370,373 and continuing with semi-annual payments of $366,222 each March and September for a period of ten years at an interest rate of 2.30%. Final payment is due March 1, 2019. $ 2,111,532 Total installment purchases $ 17,292,101 Compensated Absences VPA employees’ attendance and leave regulations make provision for the granting of a specified number of days of leave each year. The amount of leave earned but not taken is recorded as a liability on the Statement of Net Position. At June 30, 2016 the amounts reflect all earned “paid time off” and compensatory leave not taken, and the management estimated most probable amount payable under the Authority's legacy leave and sick leave policies, upon termination, the latter which is the lesser of 25% of sick leave not taken or $5,000 per employee for employees hired prior to July 1, 1997. The Authority’s legacy leave has been calculated using management’s most probable estimate of the leave to be used through December 31, 2019, at which time the leave will be capped at the then current hours balance up to the maximum 160 hours payout at termination, at the December 31, 2014 salary rate. The compensated absence liability also includes related payroll taxes. $ 1,418,023
Total long-term indebtedness $ 546,597,555
58

VIRGINIA PORT AUTHORITY NOTES TO FINANCIAL STATEMENTS
JUNE 30, 2016
6. LONG-TERM DEBT – continued
Annual Long-Term Debt Requirements
A summary of future principal and interest maturities under long-term debt obligations as ofJune 30, 2016 (excluding compensated absences), is as follows:
Revenue Bonds
Installment Purchases
Year Ending June 30, Principal Interest Total
2017 $ 6,297,060 $ 311,525 $ 6,608,585
2018 6,419,090 189,495 6,608,585
2019 4,082,307 69,056 4,151,363
2020 493,644 5,751 499,395
Total $ 17,292,101 $ 575,827 $ 17,867,928
Year EndingJune 30, Principal Interest Total
2017 $ 17,070,000 $ 19,990,624 $ 37,060,6242018 17,605,000 19,583,500 37,188,500 2019 17,965,000 19,216,774 37,181,774 2020 18,350,000 18,786,266 37,136,266 2021 18,815,000 18,295,315 37,110,315
2022 - 2026 102,795,000 82,384,665 185,179,6652027 – 2031 121,330,000 62,179,961 183,509,961
2032 - 2036 117,765,000 33,218,875 150,983,875
2037 - 2041 74,650,000 8,150,250 82,800,250
Total Bonds 506,345,000 281,806,230 788,151,230
Issuance Premium 21,542,431 - 21,542,431
Total $ 527,887,431 $ 281,806,230 $ 809,693,661
59

VIRGINIA PORT AUTHORITY NOTES TO FINANCIAL STATEMENTS
JUNE 30, 2016
6. LONG-TERM DEBT – concluded
A summary of indebtedness by type (including current portion) for the Authority follows:
Debt Premium/Disc Total LT Debt Commonwealth Port Fund Bonds $ 254,350,000 $ 9,617,685 $ 263,967,685
Port Facilities Revenue Bonds 251,995,000 11,924,746 263,919,746
Installment Purchases 17,292,101 - 17,292,101
$ 523,637,101 $ 21,542,431 $ 545,179,532
Compensated Absences 1,418,023
$ 546,597,555
Blended Component Unit – VIT
On January 1, 2015, VIT converted employees’ earned but not used vacation and personal leave balances at December 31, 2014 into a new Legacy Leave Bank. Legacy Leave is available for use as paid time off until December 31, 2019. Balances remaining unused at January 1, 2020 will be frozen to use. Legacy Leave may be paid out upon termination of an employee at the employee’s December 31, 2014 wage rate times the lesser of their then current legacy leave balance or 160 hours. Additionally on January 1, 2015, VIT implemented a new Paid Time Off (PTO) policy, providing compensated absences that can be used each calendar year. At the end of each calendar year, any earned but unused PTO in excess of 40 hours will be forfeited. Up to 40 hours of earned but unused PTO at the end of a calendar year may be carried forward for use within the next 6 months. At June 30, any remaining prior year earned but unused PTO will be forfeited. PTO is earned on a quarterly basis but available for use on January 1 of each year. Leave used over and above the earned amounts, at termination, are to be repaid to VIT. As of June 30, 2016, VIT has recorded a liability of $2,219,834 for compensated absences.
7. DEFEASANCE OF DEBT Advanced Refundings
On March 19, 2015 the Authority issued $56,755,000 (par value) of Port Facilities Revenue Refunding Bonds, Series 2015B (Taxable) to advance refund $52,715,000 in principal amount of the Authority's Port Facilities Revenue Bond, Series 2007 Bonds issued in the original par amounts of $74,255,000. The net proceeds from the issuance, along with other funds available
60
VIRGINIA PORT AUTHORITY NOTES TO FINANCIAL STATEMENTS
JUNE 30, 2016
7. DEFEASANCE OF DEBT - concluded
Advanced Refundings - concluded
from the Authority, were deposited in an irrevocable trust with an escrow agent to provide debtservice payments at the earliest call date, July 1, 2016. At June 30, 2016, $52,715,000 of thesedefeased bonds were outstanding.
The refunding was undertaken to take advantage of the lower interest rates available to reducetotal future debt service payments. As a result of the advance refunding, the Authority reducedits total debt service requirements by $4,500,252, which resulted in an economic gain(difference between the present value of the debt service payments on the old debt and the newdebt) of $3,908,830. The trust account assets and the related liability for the defeased bondsare not reflected in the Authority’s financial statements. The reacquisition price of $56,417,103netted against the book value of the refunded debt resulted in a deferred outflow of resourcesof $1,806,299. At June 30, 2016, $1,617,369 remained as unamortized deferred outflows ofresources.
8. COMMITMENTS AND CONTINGENCIES
As of June 30, 2016 the Authority has commitments to construction contracts totaling$145,401,638 of which $103,286,479 has been incurred.
The Authority established a Master Equipment Lease Program on October 15, 2003. Allequipment financed subsequent to that date and prior to May 25, 2007 serves as collateral forall debt outstanding under the original Master Lease.
The Authority established a second Master Equipment Lease Program on May 25, 2007. Allequipment financed subsequent to that date serves as collateral for all debt outstanding underthe second Master Lease.
Payments for rent under an operating lease agreement amounted to $772,164 for the year paidby VIT and recorded as a transfer to the Authority for space rental of offices at the World TradeCenter.
Expenses for operating lease agreements amounted to $55,618,730 in fiscal year 2016.
61
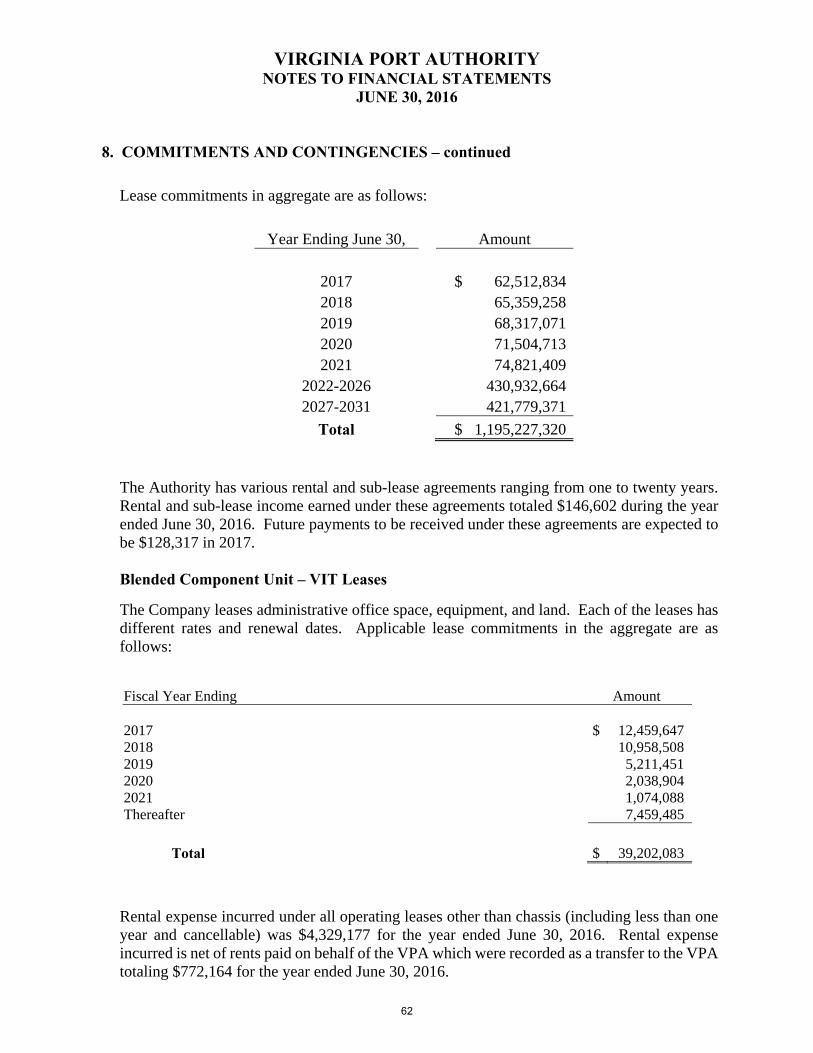
VIRGINIA PORT AUTHORITY NOTES TO FINANCIAL STATEMENTS
JUNE 30, 2016
8. COMMITMENTS AND CONTINGENCIES – continued
Lease commitments in aggregate are as follows:
Year Ending June 30, Amount
2017 $ 62,512,834 2018 65,359,258 2019 68,317,071 2020 71,504,713 2021 74,821,409
2022-2026 430,932,664 2027-2031 421,779,371
Total $ 1,195,227,320
The Authority has various rental and sub-lease agreements ranging from one to twenty years. Rental and sub-lease income earned under these agreements totaled $146,602 during the year ended June 30, 2016. Future payments to be received under these agreements are expected to be $128,317 in 2017.
Blended Component Unit – VIT Leases
The Company leases administrative office space, equipment, and land. Each of the leases has different rates and renewal dates. Applicable lease commitments in the aggregate are as follows:
Fiscal Year Ending Amount
2017 $ 12,459,6472018 10,958,5082019 5,211,4512020 2,038,9042021 1,074,088Thereafter 7,459,485
Total $ 39,202,083
Rental expense incurred under all operating leases other than chassis (including less than one year and cancellable) was $4,329,177 for the year ended June 30, 2016. Rental expense incurred is net of rents paid on behalf of the VPA which were recorded as a transfer to the VPA totaling $772,164 for the year ended June 30, 2016.
62

VIRGINIA PORT AUTHORITY NOTES TO FINANCIAL STATEMENTS
JUNE 30, 2016
8. COMMITMENTS AND CONTINGENCIES – continued
Hampton Roads Chassis Pool II (HRCP II) is a wholly owned subsidiary of VIT that operates a chassis pool for rental to shipping lines and constituent motor carriers. HRCP II leases chassis under various operating lease agreements. The agreements may be renewed or terminated at the end of each term. HRCP II must maintain and repair chassis delivered to the pool. Rent expense under the operating leases totaled $11,941,824 during the year ended June 30, 2016 and is included in operating expenses.
VIT has various rental and sub-lease agreements ranging from one to three years. Rental and sub-lease income received under these agreements totaled $2,918,399 during the year ended June 30, 2016. Future payments to be received under these agreements are expected to be $2,772,544 in 2017.
Federal Grants
The Authority receives federal grant funding from the United States Department of Transportation, Maritime Administration to purchase equipment, support barge movements and to improve security around the ports of Virginia in the wake of the terrorist attacks on September 11, 2001. In addition, the Authority has also been awarded grants from the Environmental Protection Agency, FEMA and other federal agencies. The grants are subject to review and audit under the "Uniform Guidance." Entitlement to these resources is conditional upon compliance with the terms and conditions of the agreements, including the expenditure of resources for allowable purposes. The Authority is required to comply with various federal regulations issued by the Office of Management and Budget.
Imposed Non Exchange Transaction
The Authority, through a Joint Memorandum of Agreement, received $1.9 million in fiscal year 2009 as a mitigation payment from Virginia Natural Gas to fund Army Corps of Engineers approved enhancements to Anchorage K for future dredging and navigation activities associated with the provision of a deeper anchorage area in the waters that are contiguous to the area known as Hampton Roads. As of June 30, 2016, $2,042,367 remains in the account.
63
VIRGINIA PORT AUTHORITY NOTES TO FINANCIAL STATEMENTS
JUNE 30, 2016
8. COMMITMENTS AND CONTINGENCIES – concluded
Lawsuits and Claims
The Authority, from time to time, is a defendant in lawsuits generally incidental to its business.It is management's opinion that the financial position of the Authority will not be materiallyaffected by the ultimate resolution of litigation pending or threatened at June 30, 2016.
Other Noncurrent Liabilities
The Authority, through the Virginia International Gateway lease, acquired $13.3 million in terminal assets. The lease agreement requires that upon dissolution of the lease, terminal assets are to be transferred back to the terminal owner. The Authority is committed to transferring back $13.3 million (CPI adjusted) in operational assets, or cash. Assets transferred at the end of the lease with a fair market value greater than $13.3 million (CPI adjusted) will be purchased by the terminal owner in accordance with the agreement.
Blended Component Unit – VIT
VIT is a defendant in various lawsuits generally incidental to its business. It is management's opinion that the financial position of the Company will not be materially affected by the ultimate resolution of litigation pending or threatened at June 30, 2016.
On April 7, 2014, VIT obtained a letter of credit available in the amount of $1,001,300 for workers' compensation claims. It bears interest at prime and is set to expire at May 31, 2017. At June 30, 2016, there were no borrowings outstanding.
VIT is also contingently liable for Legacy Leave of $5,218,371 at June 30, 2016 representing amounts employees could use during their period of employment. Legacy Leave is available for use as paid time off until December 31, 2019. Balances remaining unused at January 1, 2020 will be frozen to use.
9. PENSION PLANS
Pensions
The Authority provides two defined benefit plans for its employees. Employees of record onJuly 1, 1997, had the option of electing to be covered as a State employee, and their benefitsmaintained under the Virginia Retirement System (VRS), or electing to be covered under anewly created pension plan (the VPA Defined Benefit Plan). The VPA Defined Benefit Plancovers all employees hired between July 1, 1997 and February 1, 2014. Employees hired afterFebruary 1, 2014 are eligible for a defined contribution plan only.
64
VIRGINIA PORT AUTHORITY NOTES TO FINANCIAL STATEMENTS
JUNE 30, 2016
9. PENSION PLANS - continued
Pensions - continued
Employees of the Authority who elected to remain employees of the Commonwealthparticipate in a defined benefit pension plan administered by the Virginia Retirement System(VRS). For information on the VRS retirement plan, please see the VRS website athttp://www.varetire.org/employers/financial-reporting/gasb-resources.asp for pension planreporting information. The VRS also administers life insurance and health related plans forretired employees. Information relating to these plans is available at the statewide level onlyin the Commonwealth of Virginia's Comprehensive Annual Financial Report (CAFR). TheCommonwealth, not the Authority, has overall responsibility for contributions to these plans.The Authority has elected not to disclose information related to the VRS Plan. VRS NetPension Liability is recorded as $651,000 at June 30, 2016.
The VPA Defined Benefit Plan is a single employer, noncontributory defined benefit pensionplan administered by the Authority. The plan provides retirement, disability, and deathbenefits to plan members and beneficiaries. Benefit provisions and obligations are establishedand may be amended by the Board of Commissioners of the Authority. The latest actuarialreport on the VPA Defined Benefit Plan may be obtained by contacting the Finance Divisionof the Authority.
In January 2014, the Board of Commissioners voted to amend the VPA Defined Benefit Planto freeze participation and to provide that no new participants shall be admitted or readmittedafter January 28, 2014. The effect of those changes is included in the accompanying pensiondata.
VPA Defined Benefit Plan
General Eligibility Rules
Former employees and beneficiaries of the Virginia Port Authority satisfy retirement eligibilityif (1) they commence retirement benefits immediately upon termination and (2) under any oneof the following conditions:
General Police Normal Retirement
(a) Age 65 60Early Retirement
(a) Age 50 50(b) Service 10 5
Early Retirement (a) Age 55 NA(b) Service 5 NA
Disability(a) Service 5 5
65
VIRGINIA PORT AUTHORITY NOTES TO FINANCIAL STATEMENTS
JUNE 30, 2016
9. PENSION PLANS – continued
VPA Defined Benefit Plan – continued
General Eligibility Rules - concluded
Effective Date:
August 1, 1998; latest amendment effective May 26, 2009.
Eligibility:
Generally, each employee hired prior to January 28, 2014 is eligible to enter the plan on his orher date of employment. Employees hired prior to August 1, 1998 who elected continuedcoverage under the Virginia Retirement System (VRS) are not eligible to participate in thisplan.
Normal Retirement Age: Age 65; for sworn employees, normal retirement age is 60.
Normal Retirement Benefit: An employee’s normal retirement benefit equals 1.7% of final average compensation multiplied by credited service.
Accrued Retirement Benefit: The accrued retirement benefit is determined in the same manner as the normal retirement benefit with final average compensation and credited service as of the date of computation.
Unreduced Early Retirement Date: The date an employee attains age 50 and completes 30 years of service. A sworn employee attains his or her unreduced early retirement date upon attaining age 50 and completing 25 years of service.
Reduced Early Retirement Date: The date an employee attains age 55 and 5 years of service, or age 50 and 10 years of service. For sworn employees, the reduced early retirement date is age 50 and 5 years of service.
Summary of Principal Plan Provisions
Early Retirement Benefit:
The benefit is the employee’s accrued benefit payable at normal retirement age without reduction, or without reduction at age 50 if the employee has completed the number of years of credited service required for unreduced early retirement. Otherwise, if the employee retires at age 55 or later, the benefit is the accrued benefit reduced by .5% for each month up to 60
66
VIRGINIA PORT AUTHORITY NOTES TO FINANCIAL STATEMENTS
JUNE 30, 2016
9. PENSION PLANS – continued
VPA Defined Benefit Plan – continued
Summary of Principal Plan Provisions - continued
months and .4% for each month in excess of 60 months that his or her early retirement dateprecedes the earlier of normal retirement age or the date the employee would have reached hisor her first unreduced early retirement date assuming employment had continued.
If the employee retires before age 55 and is not entitled to an unreduced benefit, the benefit isreduced to 55 by .5% for each month up to 60 months and .4% for each month in excess of 60months that his or her early retirement date precedes the earlier of normal retirement age or thedate the employee would have reached his or her first unreduced early retirement date assumingemployment had continued, and is further reduced by .6% for each month by which the actualretirement date precedes age 55.
Disability Retirement Benefit:
Total and permanent disability and five years of credited service are required for eligibility.Benefits are payable at the member’s normal retirement date. The disability retirement benefitis calculated in the same manner as the normal retirement benefit assuming credited serviceand monthly compensation, as determined for the plan year immediately preceding date ofdisablement, and continues until the normal retirement date.
Late Retirement Benefit:
Retirement after normal retirement date. A member’s late retirement benefit is equal to theaccrued retirement benefit with final average compensation and credited service as of his orher late retirement date.
Vesting:
A participant’s accrued benefit becomes vested after five years of credited service.
Form of Benefit:
Payable for life. 50% or 100% joint and last survivor options and a Social Security option areavailable on an actuarially equivalent basis.
Credited Service:
Credited service is based on years and completed months of employment.
67
VIRGINIA PORT AUTHORITY NOTES TO FINANCIAL STATEMENTS
JUNE 30, 2016
9. PENSION PLANS – continued
VPA Defined Benefit Plan - continued
Summary of Principal Plan Provisions - continued
Final Average Compensation:
The highest average of monthly compensation determined over any consecutive 36 monthspreceding date of termination.
Pre-Retirement Death Benefit:
If an employee dies after becoming eligible for retirement and before retirement benefits havebegun, the employee’s beneficiary will receive a benefit payable for life. The amount of thebenefit is the monthly benefit the deceased member would have received had the employeeretired on the day before date of death and elected a 100% joint and last survivor option.
If a vested member who had not yet begun receiving retirement benefits dies prior to becomingeligible for retirement, his or her beneficiary is entitled to receive a benefit. The amount of thebenefit is equal to 100% of the monthly benefit the member would have received if the memberhad terminated employment rather than died, survived to the earliest retirement age and diedhaving elected a 100% joint and last survivor option.
Sworn Supplement:
Employees in sworn positions receive an enhancement to their accrued benefit equal to .3% offinal average compensation for each year of credited service earned in a sworn position. Up to5 years of credited service in a hazardous position with another employer may be recognizedfor purposes of this enhancement.
Employees who were hired prior to December 1, 2001 may elect to receive an alternative swornsupplement, in lieu of the .3% enhancement described in the preceding paragraph. Thisalternative supplement provides, for employees in sworn positions who have completed 15years of credited service, a supplemental benefit equal to $13,128 per year, which is payablefrom retirement until Social Security normal retirement age. For purposes of satisfying the 15years of credited service requirement, up to 5 years of credited service in a hazardous positionwith another governmental employer may be credited.
Integration with VRS Benefits for Sworn Employees:
Sworn employees who receive their basic retirement benefit from VRS and for whom VRSdoes not provide the normal retirement age, unreduced early retirement benefits and reducedearly retirement benefits described for sworn employees under the VPA plan, will receive anadditional benefit from the VPA plan. The amount of the benefit is equal to the (1) benefitdetermined using VPA credited service and the VPA plan normal retirement age, unreduced
68
VIRGINIA PORT AUTHORITY NOTES TO FINANCIAL STATEMENTS
JUNE 30, 2016
9. PENSION PLANS – continued
VPA Defined Benefit Plan – continued
Summary of Principal Plan Provisions - concluded
early retirement benefit and/or reduced early retirement, minus (2) the benefit to which the participant is entitled under VRS based on VPA credited service.
Contributions
As the plan sponsor for the VPA Defined Benefit Plan, the Authority sets a contribution rate annually based on recommendations provided by the plan’s Actuary. The Authority elected to contribute 27.47% of base pay in 2016 for employees receiving the basic retirement benefit from the plan. The plan does not specify a minimum funding requirement.
Actuarial Methods and Assumptions
The annual pension cost for the current year was actuarially determined as of June 30, 2015 using the Entry Age Normal cost method. The actuarial value of plan assets was determined using fair value. The discount rate used in determining the actuarial liability was 7.0% and a 3.5% factor was used for future annual compensation increases.
Schedules
Members covered by the benefit terms:
Inactive members or beneficiaries currently receiving benefits 75 Inactive members entitled to but not yet receiving benefits 41 Active Eligible Members 129
245
69
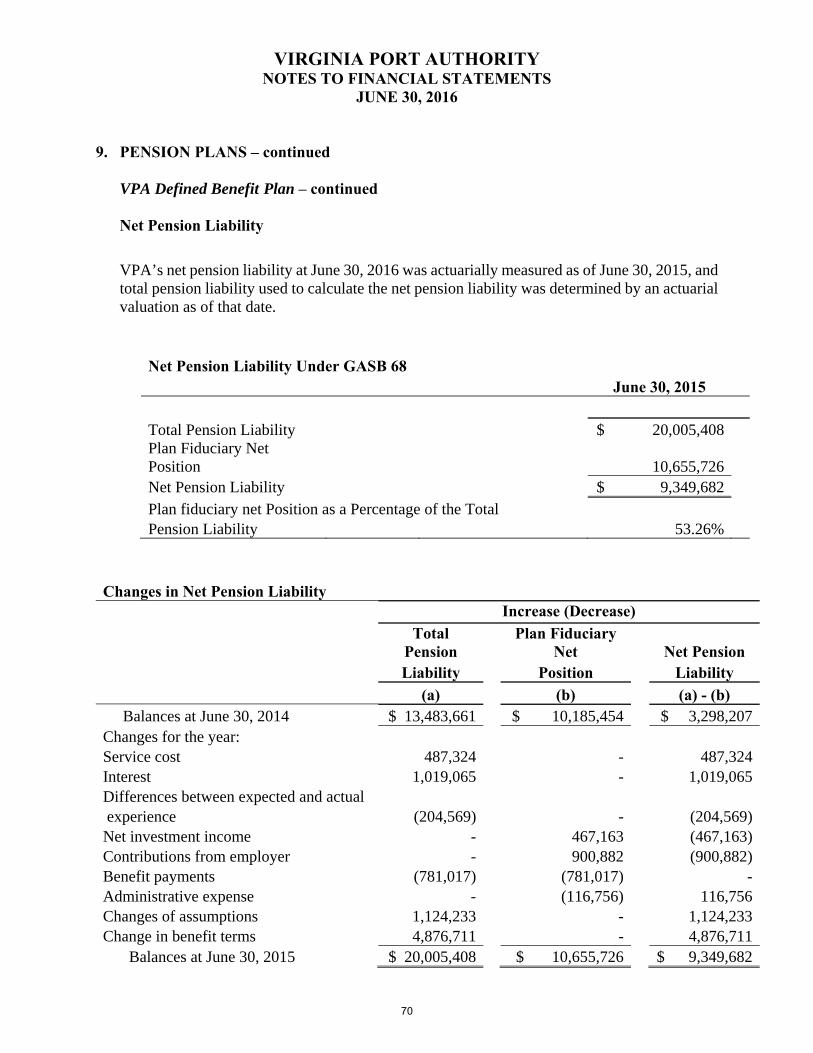
VIRGINIA PORT AUTHORITY NOTES TO FINANCIAL STATEMENTS
JUNE 30, 2016
9. PENSION PLANS – continued VPA Defined Benefit Plan – continued Net Pension Liability VPA’s net pension liability at June 30, 2016 was actuarially measured as of June 30, 2015, and total pension liability used to calculate the net pension liability was determined by an actuarial valuation as of that date.
Net Pension Liability Under GASB 68 June 30, 2015
Total Pension Liability $ 20,005,408
Plan Fiduciary Net Position 10,655,726
Net Pension Liability $ 9,349,682 Plan fiduciary net Position as a Percentage of the Total
Pension Liability 53.26% Changes in Net Pension Liability
Increase (Decrease)
Total
Pension Plan Fiduciary
Net Net Pension Liability Position Liability (a) (b) (a) - (b) Balances at June 30, 2014 $ 13,483,661 $ 10,185,454 $ 3,298,207 Changes for the year: Service cost 487,324 - 487,324 Interest 1,019,065 - 1,019,065 Differences between expected and actual experience (204,569) - (204,569)Net investment income - 467,163 (467,163)Contributions from employer - 900,882 (900,882)Benefit payments (781,017) (781,017) - Administrative expense - (116,756) 116,756Changes of assumptions 1,124,233 - 1,124,233Change in benefit terms 4,876,711 - 4,876,711
Balances at June 30, 2015 $ 20,005,408 $ 10,655,726 $ 9,349,682
70

VIRGINIA PORT AUTHORITY NOTES TO FINANCIAL STATEMENTS
JUNE 30, 2016
9. PENSION PLANS – continued
VPA Defined Benefit Plan – continued
Sensitivity of the Net Pension Liability to Changes in the Discount Rate: The following presents the net pension liability of the VPA Defined Benefit plan, calculated using the discount rate of 7 percent, as well as what VPA Defined Benefit Plan’s net pension liability would be if it were calculated using a discount rate that is 1-percentage-point lower (6 percent) or 1-percentage-point higher (8 percent) than the current rate:
Sensitivity
The following table illustrates the impact of interest rate sensitivity on the Net Pension Liability for fiscal year end June 30, 2016:
1% Decrease Current Rate 1% Increase (6%) (7%) (8%)
Total Pension Liability $ 23,159,357 $ 20,005,408 $ 17,438,803
Plan Fiduciary Net Position 10,655,726 10,655,726 10,655,726 Net Pension Liability $ 12,503,631 $ 9,349,682 $ 6,783,077
Deferred Outflows/Inflows of Resources Related to Pensions
At June 30, 2016, reported deferred outflows of resources and deferred inflows of resources related to pensions originated from the following sources:
Deferred Outflows/Inflows of Resources
Deferred Deferred Outflows Inflows
of Resources of Resources Difference between actual and expected experience measurement date June 30, 2015 $ 159,916 $ (168,930) Employer contributions subsequent to measurement date 3,850,943 - Assumption changes 928,374 - Net difference between expected and actual earnings on pension plan investments 237,489 (574,772) Total $ 5,176,722 $ (743,702)
71
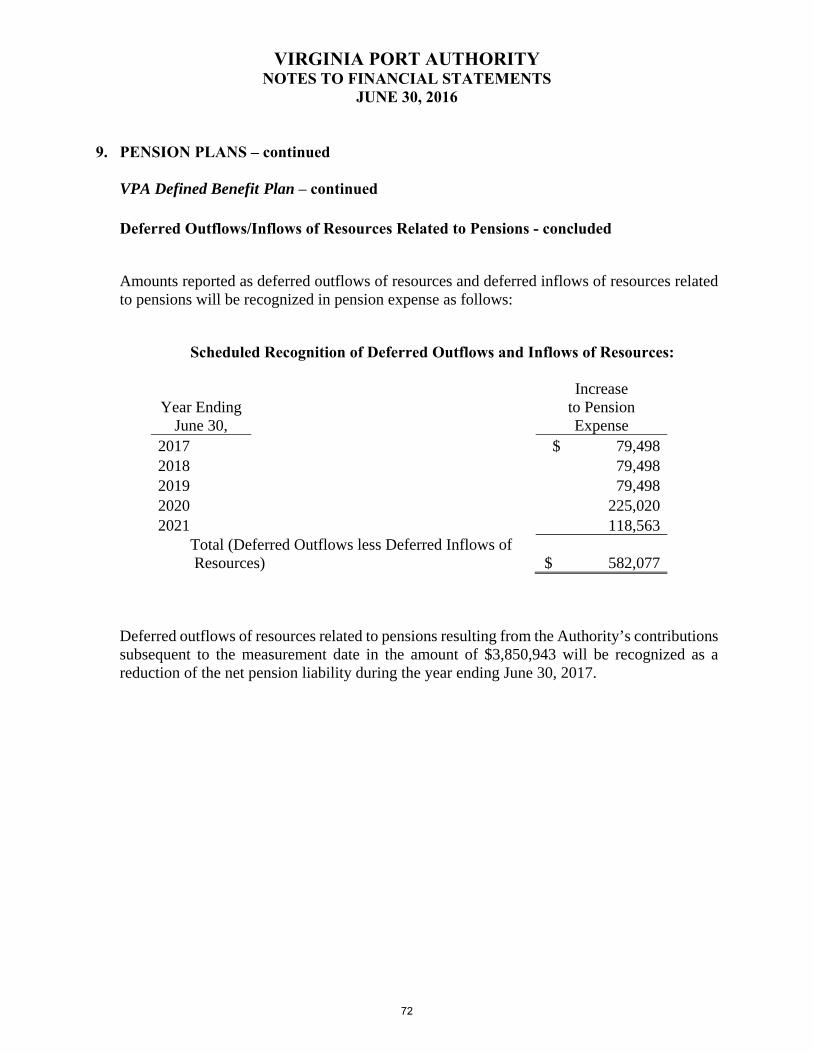
VIRGINIA PORT AUTHORITY NOTES TO FINANCIAL STATEMENTS
JUNE 30, 2016
9. PENSION PLANS – continued
VPA Defined Benefit Plan – continued
Deferred Outflows/Inflows of Resources Related to Pensions - concluded
Amounts reported as deferred outflows of resources and deferred inflows of resources related to pensions will be recognized in pension expense as follows:
Scheduled Recognition of Deferred Outflows and Inflows of Resources:
Year Ending June 30,
Increase to Pension Expense
2017 $ 79,4982018 79,4982019 79,4982020 225,0202021 118,563
Total (Deferred Outflows less Deferred Inflows of Resources) $ 582,077
Deferred outflows of resources related to pensions resulting from the Authority’s contributions subsequent to the measurement date in the amount of $3,850,943 will be recognized as a reduction of the net pension liability during the year ending June 30, 2017.
72
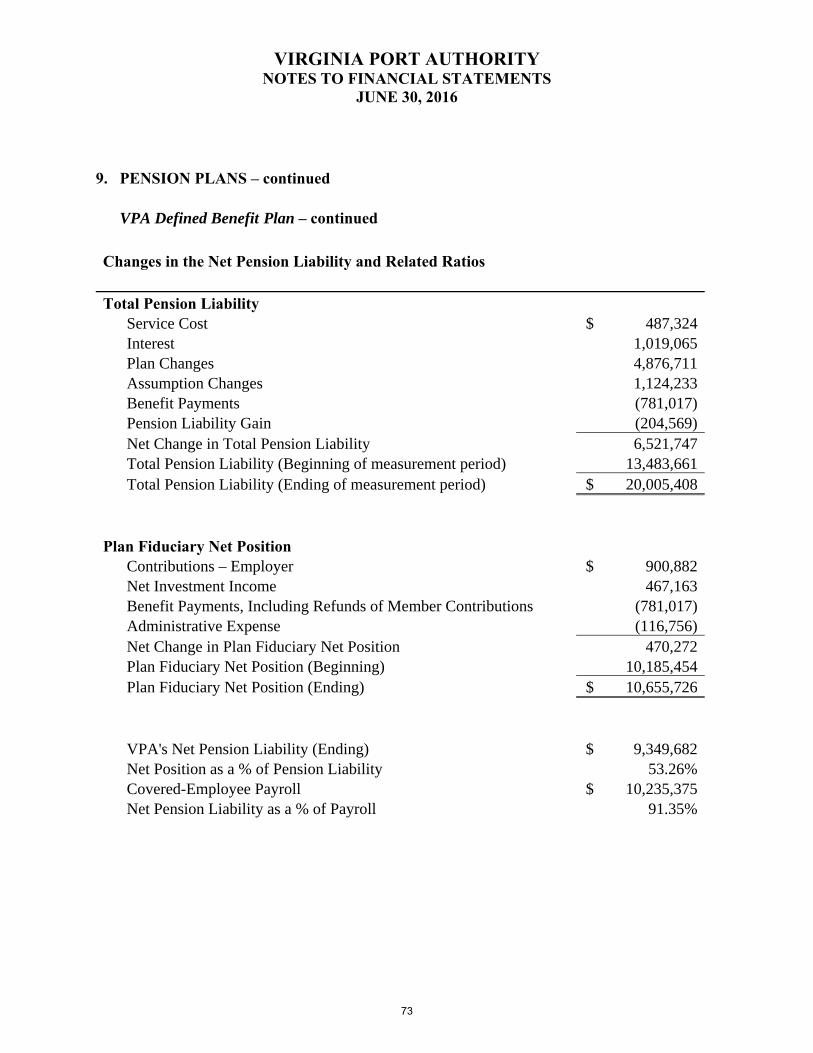
VIRGINIA PORT AUTHORITY NOTES TO FINANCIAL STATEMENTS
JUNE 30, 2016
9. PENSION PLANS – continued VPA Defined Benefit Plan – continued
Changes in the Net Pension Liability and Related Ratios Total Pension Liability Service Cost $ 487,324
Interest 1,019,065 Plan Changes 4,876,711 Assumption Changes 1,124,233 Benefit Payments (781,017) Pension Liability Gain (204,569) Net Change in Total Pension Liability 6,521,747 Total Pension Liability (Beginning of measurement period) 13,483,661 Total Pension Liability (Ending of measurement period) $ 20,005,408
Plan Fiduciary Net Position Contributions – Employer $ 900,882
Net Investment Income 467,163 Benefit Payments, Including Refunds of Member Contributions (781,017) Administrative Expense (116,756)
Net Change in Plan Fiduciary Net Position 470,272 Plan Fiduciary Net Position (Beginning) 10,185,454 Plan Fiduciary Net Position (Ending) $ 10,655,726 VPA's Net Pension Liability (Ending) $ 9,349,682 Net Position as a % of Pension Liability 53.26% Covered-Employee Payroll $ 10,235,375 Net Pension Liability as a % of Payroll 91.35%
73

VIRGINIA PORT AUTHORITY NOTES TO FINANCIAL STATEMENTS
JUNE 30, 2016
9. PENSION PLANS – continued
VPA Defined Benefit Plan – continued
Contributions
Contractually Required Contribution (CRC) $ 1,772,010 Contributions made in Relation to the CRC $ 3,850,943 Contribution Deficiency (Excess) $(2,078,933)Covered-Employee Payroll $10,235,375 Contributions as a % of Payroll 37.62%
Valuation Date: Actuarially determined contribution rates are calculated as of July 1, one year prior to the end of
the fiscal year in which contributions are reported.
Methods and assumptions used to determine contribution rates:
Actuarial Cost Method Aggregate Level Percent of Payroll.
Asset Valuation Method Fair Value.
General Inflation 2.50%
Salary Increases 3.50%
Investment Rate of Return 7.00%, net of pension plan investment expense, including inflation.
Retirement Age varies by age and service, same as GASB 68.
Mortality rates were based on the RP-2014 Healthy Annuitant/Non Annuitant Mortality Table for Males or Females,
as appropriate, with adjustments for mortality improvements based on Scale MP-2015.
Investment Return
Valuation date
7/1/2008 7/1/2009 7/1/2010 7/1/2011 7/1/2012 7/1/2013 7/1/2014 7/1/2015
Return on Assets
5.4% (21.9%) 11.7% 21.8% (0.5%) 13.9% 18.2% 4.6%
The Schedule of Funding Progress, presented as Required Supplementary Information following the notes to the consolidated financial statements, presents multi-year trend information about whether the actuarial value of the plan assets is increasing or decreasing over time relative to the actuarial accrued liability (AAL) for benefits.
74

VIRGINIA PORT AUTHORITY NOTES TO FINANCIAL STATEMENTS
JUNE 30, 2016
9. PENSION PLANS – continued VPA Defined Benefit Plan – concluded
Deferred Compensation Plan
In addition to the defined benefit pension plans, the Authority maintains two deferred compensation plans and a matching savings plan under Internal Revenue Code Sections 457 and 401(a), respectively. Employees who maintain status under VRS are covered under a deferred compensation plan administered by VRS. Information relating to this plan is available at the statewide level only in the Commonwealth of Virginia’s Comprehensive Annual Financial Report (CAFR).
The VPA Deferred Compensation Plan covers all employees hired after July 1, 1997, and those employees electing coverage under the Authority’s deferred compensation plan. The Matching Savings Plan covers substantially all employees. The Matching Savings Plan requires VPA to match contributions in an amount equal to 50% of the first 6% of the participant's base pay contributed to the plan for employees hired on or before January 28, 2014. VPA's total contribution to the Matching Savings Plan was $110,720 for the year ended June 30, 2016. On January 28, 2014, the Authority’s Board adopted Resolution 14-2 Freezing Pension Plan to New Participants and Establishing Enhanced Defined Contribution Plan for New Employees in order to move toward normalizing the retirement benefits between the Authority and Virginia International Terminals, LLC. Beginning April 1, 2014, employees hired after January 28, 2014 (Enhanced Participants), will be provided an employer contribution of 4% of Compensation and are also eligible for a matching contribution of 50% of the first 4% of compensation contributed to the Deferred Compensation Plan. VPA’s total contribution to the Virginia Port Authority Defined Contribution Plan for Enhanced Participants for the year ended June 30, 2016 was $163,384 for the Defined Contribution and $60,970 for the Enhanced Participant Employer Matching Contribution. Employees transferring to the Authority from VIT, as part of the Port of Virginia (POV) restructure or shared services agreement, that had been hired by VIT prior to July 1, 2012 and were active participants of VIT’s pension plan at the time of the transfer, and are not eligible for the Enhanced Defined Contribution plan, are eligible for a matching contribution of 50% of the first 3% of compensation contributed to the Deferred Compensation Plan. VPA’s total matching contribution to the Virginia Port Authority Defined Contribution Plan for VIT Plan Participants for the year ended June 30, 2016 was $68,569. The right to modify, alter, amend, or terminate the Authority’s Deferred Compensation Plan and the Matching Savings Plan vests with the Board of Commissioners of the Authority.
75

VIRGINIA PORT AUTHORITY NOTES TO FINANCIAL STATEMENTS
JUNE 30, 2016
9. PENSION PLANS - continued
Blended Component Unit – VIT
Plan Description
The Virginia International Terminals, LLC Pension Plan (VITPP) is a single employer,noncontributory defined benefit pension plan administered by VIT. The Plan providesretirement, disability, and death benefits to plan members and beneficiaries. Benefit provisionsand obligations are established and may be amended by resolutions of the Board ofCommissioners of the Virginia Port Authority. The plan issues a stand-alone financial report.The most recent report is as of June 30, 2015 and is available upon request from VPA’sadministrative offices.
Benefits Provided
VITPP provides retirement, disability, and death benefits to plan members and beneficiaries.Normal Retirement benefits are in the form of life annuities based on the Normal RetirementBenefit which is calculated as 1.4% x Final Average Earnings x Credited Service PLUS 0.4%x Final Average Excess Earnings x Credited Service (max. 35 years). Final Average Earningsis the highest average of the employee’s Benefit Earnings in sixty (60) consecutive months ofCredited Service. Final Average Excess Earnings is the excess, if any of Final AverageEarnings over Covered Compensation. Covered Compensation is equal to the 35 year averageof the Social Security Taxable Base during an employee’s working career. Entry into the planwas frozen as of June 30, 2012. Vesting is over seven years of service, ranging from 20% attwo years of service, with 60% at five years of service and full vesting at seven years of service.Disability Benefits are available to those with five years of credited service and eligibility forSocial Security disability benefits is required. Benefits commence on an employee’s normalretirement date and are computed using credited service as of the normal retirement date andfinal average earnings as of the disability retirement date. Pre-retirement Death Benefits arepayable to the spouse of a vested employee who dies before retirement benefits have begun.The benefit will be equal to the monthly amount the spouse would have received if theemployee had terminated employment just before their death, serviced to the earliest date onwhich they could have retired, and died having elected a 50% joint and survivor benefit.
76
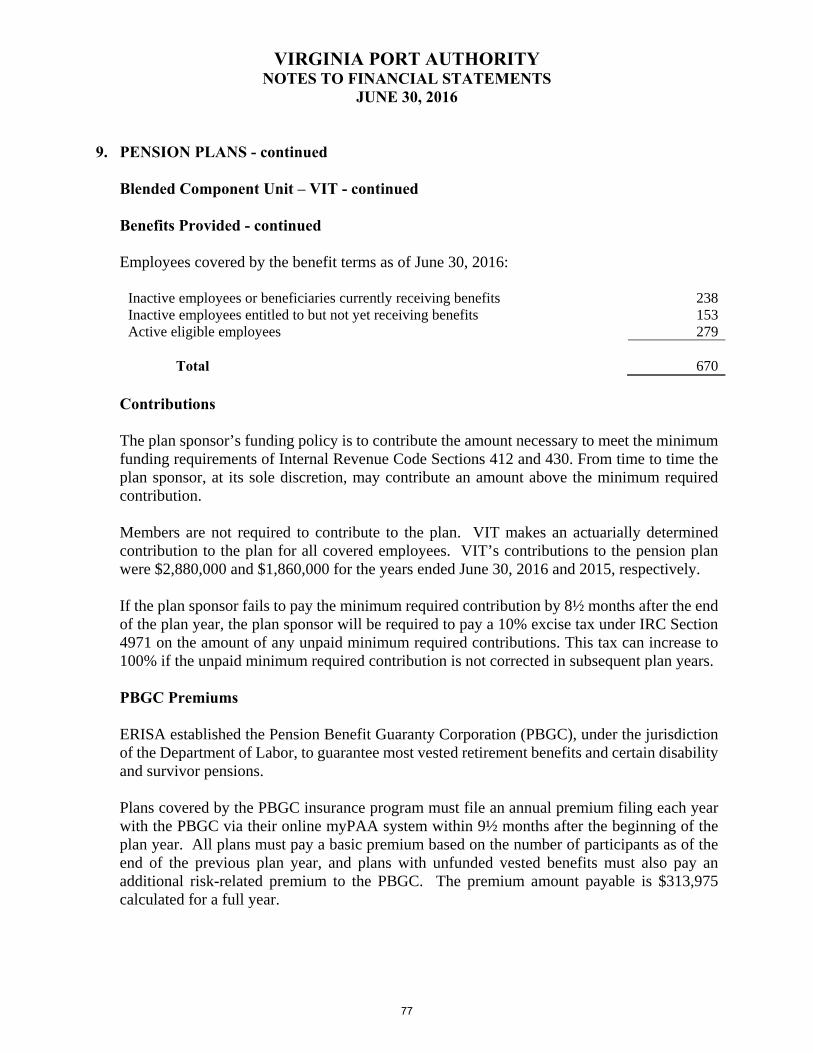
VIRGINIA PORT AUTHORITY NOTES TO FINANCIAL STATEMENTS
JUNE 30, 2016
9. PENSION PLANS - continued
Blended Component Unit – VIT - continued
Benefits Provided - continued
Employees covered by the benefit terms as of June 30, 2016:
Inactive employees or beneficiaries currently receiving benefits 238Inactive employees entitled to but not yet receiving benefits 153Active eligible employees 279
Total 670
Contributions
The plan sponsor’s funding policy is to contribute the amount necessary to meet the minimum funding requirements of Internal Revenue Code Sections 412 and 430. From time to time the plan sponsor, at its sole discretion, may contribute an amount above the minimum required contribution.
Members are not required to contribute to the plan. VIT makes an actuarially determined contribution to the plan for all covered employees. VIT’s contributions to the pension plan were $2,880,000 and $1,860,000 for the years ended June 30, 2016 and 2015, respectively.
If the plan sponsor fails to pay the minimum required contribution by 8½ months after the end of the plan year, the plan sponsor will be required to pay a 10% excise tax under IRC Section 4971 on the amount of any unpaid minimum required contributions. This tax can increase to 100% if the unpaid minimum required contribution is not corrected in subsequent plan years.
PBGC Premiums
ERISA established the Pension Benefit Guaranty Corporation (PBGC), under the jurisdiction of the Department of Labor, to guarantee most vested retirement benefits and certain disability and survivor pensions.
Plans covered by the PBGC insurance program must file an annual premium filing each year with the PBGC via their online myPAA system within 9½ months after the beginning of the plan year. All plans must pay a basic premium based on the number of participants as of the end of the previous plan year, and plans with unfunded vested benefits must also pay an additional risk-related premium to the PBGC. The premium amount payable is $313,975 calculated for a full year.
77
VIRGINIA PORT AUTHORITY NOTES TO FINANCIAL STATEMENTS
JUNE 30, 2016
9. PENSION PLANS - continued
Blended Component Unit – VIT - continued Net Pension Liability
VIT’s net pension liability at June 30, 2016 was measured as of June 30, 2015, and the total pension liability used to calculate the net pension liability was determined by an actuarial valuation as of that date. Actuarial Present Value of Accumulated Plan Benefits The actuarial present value of accumulated plan benefits as determined by an independent actuary using end of year benefit information as of June 30, 2015 is that amount that results from applying actuarial assumptions to adjust the accumulated plan benefits to reflect the time value of money (through discounts for interest) and the probability of payment (by means of decrements such as for death, disability, withdrawal, or retirement) between the valuation date and the expected date of payment. The significant actuarial assumptions used in the valuation measured at June 30, 2015 were (a) life expectancy of participants (the RP-2014 Mortality Table Adjusted to 2006 with Generational Projection (Scale MP-2015), (b) retirement age (age 65), (c) investment return (average rate of return of 7%), (d) taxable wage base (2.5%), and (e) salary scale assumption of 3.5%. The foregoing actuarial assumptions are based on the presumption that the Plan will continue. Were the Plan to terminate, different actuarial assumptions and other factors might be applicable in determining the actuarial present value of accumulated plan benefits.
Asset Valuation Method IRC Section 430(g) provides that plan assets be valued at either their fair market value on the valuation date or at the “average” value of assets on the valuation date. Under the average value, the value of plan assets is set equal to the average of the fair market value of assets on the valuation date and the adjusted fair market value of assets (including expected earnings) determined for one or more earlier determination dates (up to a 2-year limit). The resulting average value must be constrained so that it falls between 90% and 110% of the fair market value of plan assets on the valuation date. Contributions for a prior plan year that are made after the beginning of this plan year are adjusted for interest at the effective interest rate under Section 430(h)(2).
78
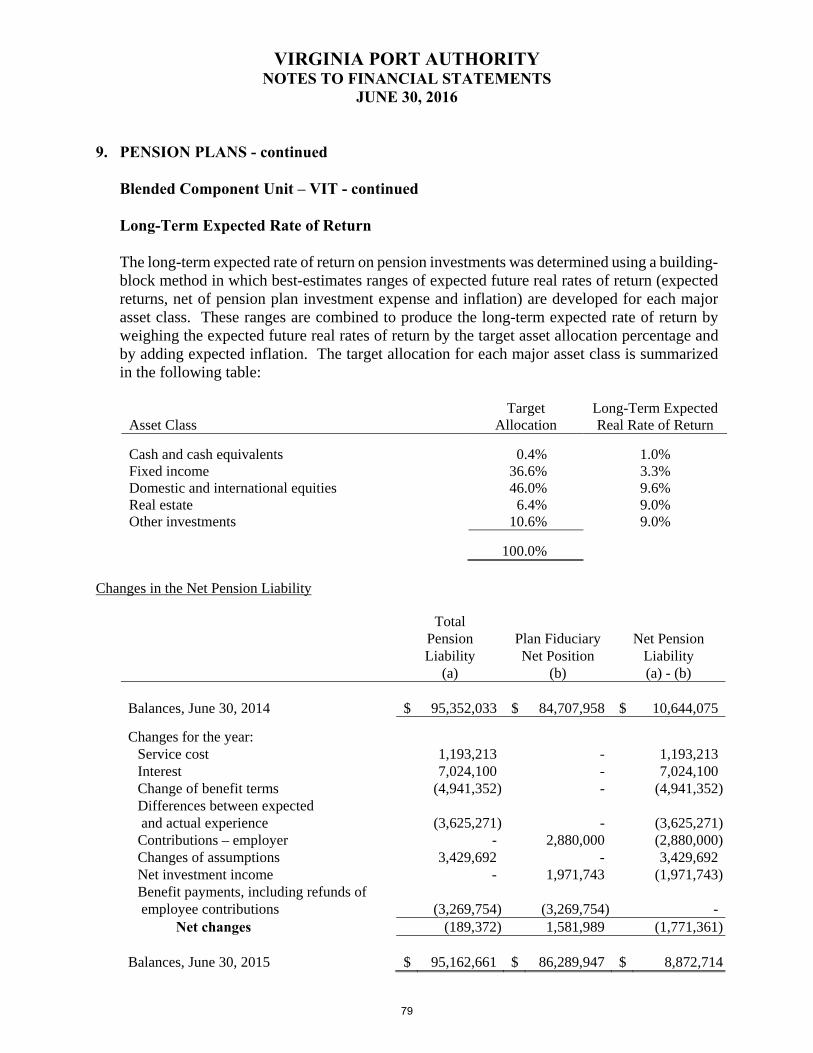
VIRGINIA PORT AUTHORITY NOTES TO FINANCIAL STATEMENTS
JUNE 30, 2016
9. PENSION PLANS - continued
Blended Component Unit – VIT - continued Long-Term Expected Rate of Return The long-term expected rate of return on pension investments was determined using a building-block method in which best-estimates ranges of expected future real rates of return (expected returns, net of pension plan investment expense and inflation) are developed for each major asset class. These ranges are combined to produce the long-term expected rate of return by weighing the expected future real rates of return by the target asset allocation percentage and by adding expected inflation. The target allocation for each major asset class is summarized in the following table:
Target Long-Term Expected
Asset Class Allocation Real Rate of Return
Cash and cash equivalents
0.4% 1.0% Fixed income 36.6% 3.3% Domestic and international equities 46.0% 9.6% Real estate 6.4% 9.0% Other investments 10.6% 9.0%
100.0%
Changes in the Net Pension Liability
Total Pension Plan Fiduciary Net Pension Liability Net Position Liability (a) (b) (a) - (b) Balances, June 30, 2014 $ 95,352,033 $ 84,707,958 $ 10,644,075
Changes for the year: Service cost 1,193,213 - 1,193,213Interest 7,024,100 - 7,024,100Change of benefit terms (4,941,352) - (4,941,352)Differences between expected and actual experience (3,625,271) - (3,625,271)Contributions – employer - 2,880,000 (2,880,000)Changes of assumptions 3,429,692 - 3,429,692Net investment income - 1,971,743 (1,971,743)Benefit payments, including refunds of employee contributions (3,269,754) (3,269,754) -
Net changes (189,372) 1,581,989 (1,771,361) Balances, June 30, 2015 $ 95,162,661 $ 86,289,947 $ 8,872,714
79
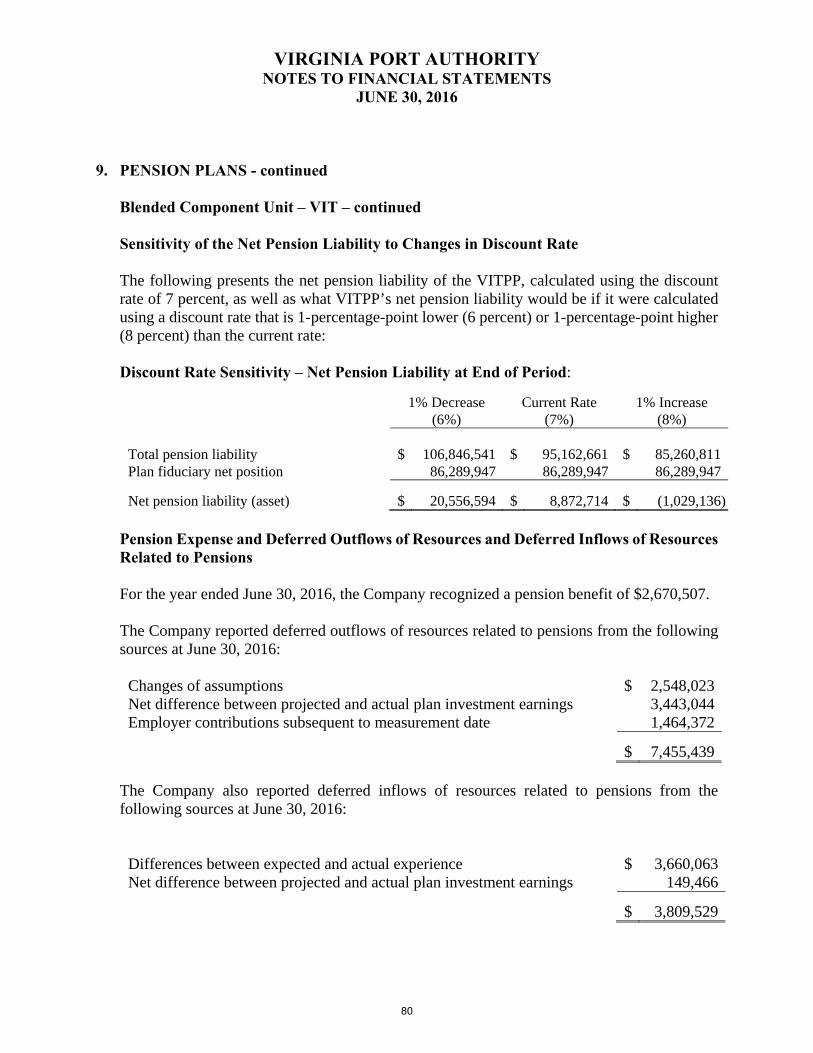
VIRGINIA PORT AUTHORITY NOTES TO FINANCIAL STATEMENTS
JUNE 30, 2016
9. PENSION PLANS - continued
Blended Component Unit – VIT – continued
Sensitivity of the Net Pension Liability to Changes in Discount Rate
The following presents the net pension liability of the VITPP, calculated using the discountrate of 7 percent, as well as what VITPP’s net pension liability would be if it were calculatedusing a discount rate that is 1-percentage-point lower (6 percent) or 1-percentage-point higher(8 percent) than the current rate:
Discount Rate Sensitivity – Net Pension Liability at End of Period:
1% Decrease Current Rate 1% Increase (6%) (7%) (8%)
Total pension liability $ 106,846,541 $ 95,162,661 $ 85,260,811Plan fiduciary net position 86,289,947 86,289,947 86,289,947
Net pension liability (asset) $ 20,556,594 $ 8,872,714 $ (1,029,136)
Pension Expense and Deferred Outflows of Resources and Deferred Inflows of Resources Related to Pensions
For the year ended June 30, 2016, the Company recognized a pension benefit of $2,670,507.
The Company reported deferred outflows of resources related to pensions from the following sources at June 30, 2016:
Changes of assumptions $ 2,548,023Net difference between projected and actual plan investment earnings 3,443,044Employer contributions subsequent to measurement date 1,464,372
$ 7,455,439
The Company also reported deferred inflows of resources related to pensions from the following sources at June 30, 2016:
Differences between expected and actual experience $ 3,660,063Net difference between projected and actual plan investment earnings 149,466
$ 3,809,529
80

VIRGINIA PORT AUTHORITY NOTES TO FINANCIAL STATEMENTS
JUNE 30, 2016
9. PENSION PLANS - concluded
Blended Component Unit – VIT – concluded Pension Expense and Deferred Outflows of Resources and Deferred Inflows of Resources
Related to Pensions – concluded
Deferred outflows of resources resulting from employer contributions subsequent to measurement date in the amount of $1,464,372 will be recognized as a reduction of the net pension liability in the year ending June 30, 2017. Amounts reported as deferred inflows and outflows of resources related to pensions will be recognized in pension expense as follows:
Year Amount 2017 $ 329,0812018 329,0812019 662,6182020 860,758
$ 2,181,538
The Schedule of Funding Progress, presented as Required Supplementary Information following the notes to the consolidated financial statements, presents multi-year trend information about whether the actuarial value of plan assets is increasing or decreasing over time relative to the actuarial accrued liability (AAL) for benefits.
VIT sponsors noncontributory supplemental plans covering certain key employees. Assets of $2,529,570 as of June 30, 2016, have been allocated for future benefit payments under the provisions of the supplemental plans. The accrued liability was $2,954,372 as of June 30, 2016. The net accrued liability for the supplemental retirement plans was $424,802 at June 30, 2016. Contributions to the plans were $200,000 for the year ended June 30, 2016.
In addition, VIT sponsors a deferred compensation plan and a matching savings plan under Internal Revenue Code Sections 457 and 401(a), respectively, which cover substantially all nonunion employees with 90 days or more of service. The matching savings plan requires VIT to match employee contributions in an amount equal to 50% of the first 3% of the participant’s base pay contributed to the deferred compensation plan. VIT’s total contribution to the matching savings plan was $513,895 for the year ended June 30, 2016.
81

VIRGINIA PORT AUTHORITY NOTES TO FINANCIAL STATEMENTS
JUNE 30, 2016
10. OTHER POST RETIREMENT EMPLOYEE BENEFITS (“OPEB”)
Effective January 1, 2015, VPA ceased providing formal post-employment benefits to all employees except for two subsets of employees whose benefits were grandfathered: (1) 42 VPA employees who were transferred from VIT will, if they retire at age 62 or older with at least 30 years of service, receive a premium subsidy of $500 per month until they reach age 65; and (2) 4 retired VPA employees are being allowed to remain in the VPA health and dental plans until age 65, but must pay the full actuarially determined premium to retain coverage. Based on an evaluation of these limited benefits by VPA’s actuary, management has determined the recording of an OPEB liability and further disclosure are not necessary.
Blended Component Unit – VIT
Plan Description VIT also sponsors a non-pension post-retirement medical insurance benefits plan that covers individuals who are at least 62 years of age with 30 years of service. The significant actuarial assumptions used in the valuations were (a) discount rate for net periodic postretirement benefit cost (4.00%), (b) payroll growth rate (3.5%), (c) rate of increase in medical claims cost at the valuation date (7.50%), (d) period over which accrued actuarial liabilities are amortized (26 years), (e) general inflation rate (2.5%), and (f) actuarial value of assets (fair value).
Funding Policy The contributions to OPEB are established by and may be amended by VIT. The contributions are typically based on projected pay-as-you-go financing requirements. There are no assets that have been segregated and restricted to provide for retiree medical benefits. GASB Statement No. 45 requires recognition of the current expense of OPEB based on the annual required contribution, but does not require funding of the related liability.
Annual OPEB Cost and Net OPEB Obligation VIT is required to contribute the annual required contribution (ARC) which represents a level of funding that, if paid on an ongoing basis is projected to cover normal cost each year and amortize any unfunded actuarial liabilities over a period not to exceed thirty years on a closed basis. The following table shows the components of the annual OPEB costs for the year, the amounts actually contributed for the year, and the changes in the net OPEB obligation.
82
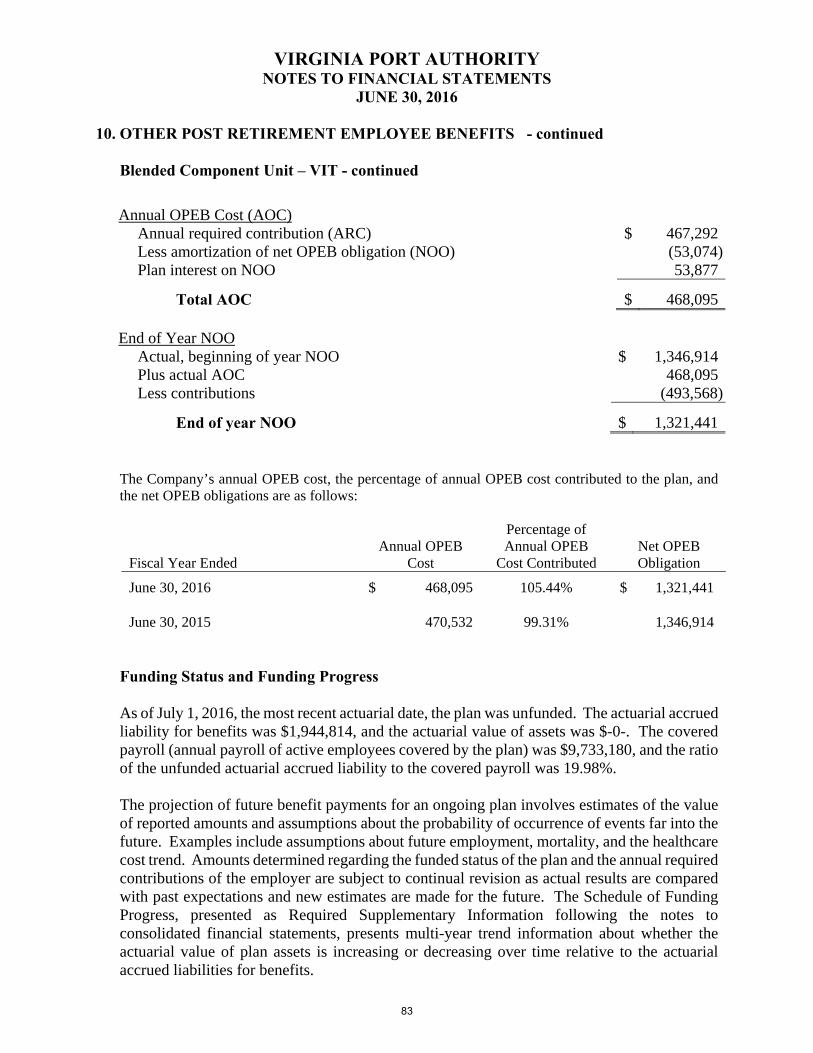
VIRGINIA PORT AUTHORITY NOTES TO FINANCIAL STATEMENTS
JUNE 30, 2016
10. OTHER POST RETIREMENT EMPLOYEE BENEFITS - continued
Blended Component Unit – VIT - continued
Annual OPEB Cost (AOC) Annual required contribution (ARC) $ 467,292Less amortization of net OPEB obligation (NOO) (53,074)Plan interest on NOO 53,877
Total AOC $ 468,095
End of Year NOO Actual, beginning of year NOO $ 1,346,914Plus actual AOC 468,095Less contributions (493,568)
End of year NOO $ 1,321,441
The Company’s annual OPEB cost, the percentage of annual OPEB cost contributed to the plan, and the net OPEB obligations are as follows:
Percentage ofAnnual OPEB Annual OPEB Net OPEB
Fiscal Year Ended Cost Cost Contributed Obligation
June 30, 2016 $ 468,095 105.44% $ 1,321,441
June 30, 2015 470,532 99.31% 1,346,914
Funding Status and Funding Progress
As of July 1, 2016, the most recent actuarial date, the plan was unfunded. The actuarial accrued liability for benefits was $1,944,814, and the actuarial value of assets was $-0-. The covered payroll (annual payroll of active employees covered by the plan) was $9,733,180, and the ratio of the unfunded actuarial accrued liability to the covered payroll was 19.98%.
The projection of future benefit payments for an ongoing plan involves estimates of the value of reported amounts and assumptions about the probability of occurrence of events far into the future. Examples include assumptions about future employment, mortality, and the healthcare cost trend. Amounts determined regarding the funded status of the plan and the annual required contributions of the employer are subject to continual revision as actual results are compared with past expectations and new estimates are made for the future. The Schedule of Funding Progress, presented as Required Supplementary Information following the notes to consolidated financial statements, presents multi-year trend information about whether the actuarial value of plan assets is increasing or decreasing over time relative to the actuarial accrued liabilities for benefits.
83
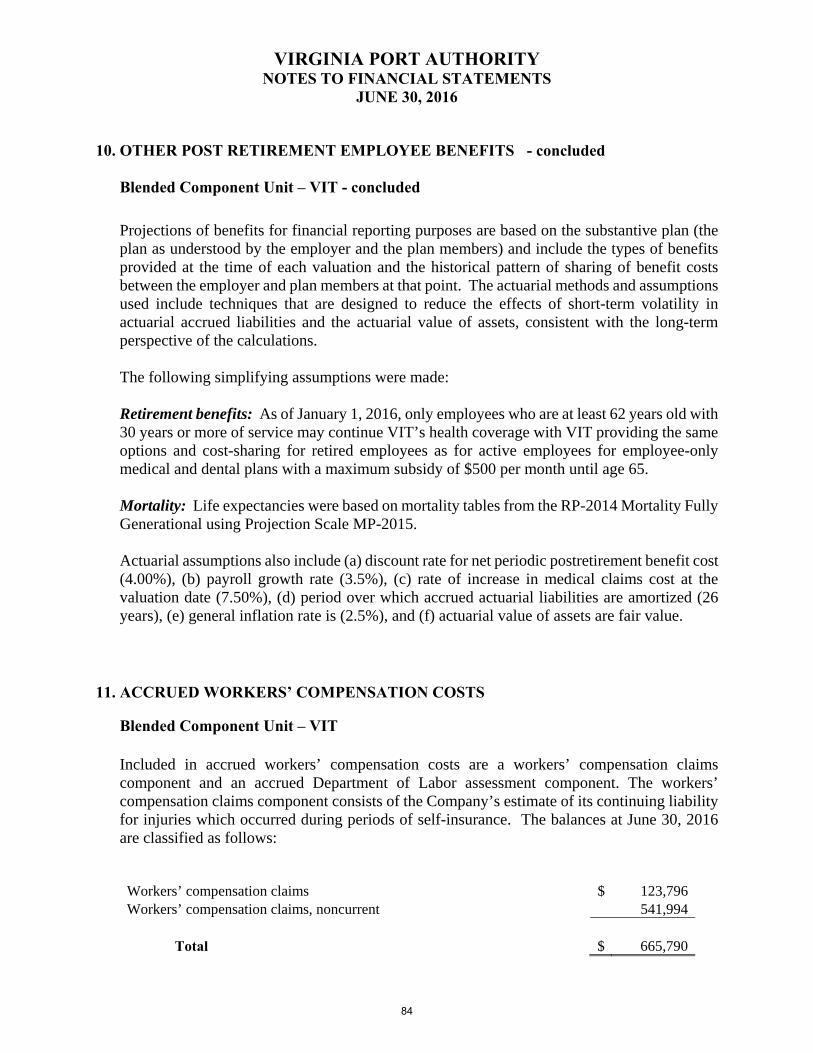
VIRGINIA PORT AUTHORITY NOTES TO FINANCIAL STATEMENTS
JUNE 30, 2016
10. OTHER POST RETIREMENT EMPLOYEE BENEFITS - concluded
Blended Component Unit – VIT - concluded Projections of benefits for financial reporting purposes are based on the substantive plan (the plan as understood by the employer and the plan members) and include the types of benefits provided at the time of each valuation and the historical pattern of sharing of benefit costs between the employer and plan members at that point. The actuarial methods and assumptions used include techniques that are designed to reduce the effects of short-term volatility in actuarial accrued liabilities and the actuarial value of assets, consistent with the long-term perspective of the calculations. The following simplifying assumptions were made: Retirement benefits: As of January 1, 2016, only employees who are at least 62 years old with 30 years or more of service may continue VIT’s health coverage with VIT providing the same options and cost-sharing for retired employees as for active employees for employee-only medical and dental plans with a maximum subsidy of $500 per month until age 65. Mortality: Life expectancies were based on mortality tables from the RP-2014 Mortality Fully Generational using Projection Scale MP-2015. Actuarial assumptions also include (a) discount rate for net periodic postretirement benefit cost (4.00%), (b) payroll growth rate (3.5%), (c) rate of increase in medical claims cost at the valuation date (7.50%), (d) period over which accrued actuarial liabilities are amortized (26 years), (e) general inflation rate is (2.5%), and (f) actuarial value of assets are fair value.
11. ACCRUED WORKERS’ COMPENSATION COSTS
Blended Component Unit – VIT
Included in accrued workers’ compensation costs are a workers’ compensation claims component and an accrued Department of Labor assessment component. The workers’ compensation claims component consists of the Company’s estimate of its continuing liability for injuries which occurred during periods of self-insurance. The balances at June 30, 2016 are classified as follows:
Workers’ compensation claims $ 123,796Workers’ compensation claims, noncurrent 541,994
Total $ 665,790
84
VIRGINIA PORT AUTHORITY NOTES TO FINANCIAL STATEMENTS
JUNE 30, 2016
11. ACCRUED WORKERS’ COMPENSATION COSTS - concluded
Blended Component Unit – VIT - concluded
The accrued U.S. Department of Labor (DOL) assessment component is the Company’s estimate of the present value of its future liability to the Department of Labor for participation in the U.S. Department of Labor’s Second Injury Fund. The total liability has been discounted using a rate of 7.0% at June 30, 2016. The undiscounted liability totaled approximately $2,430,000 at June 30, 2016. The Company expects to pay these assessments annually through 2025. The balances at June 30, 2016 are classified as follows:
Accrued U.S. Department of Labor assessment $ 758,237Accrued U.S. Department of Labor assessment, noncurrent 1,067,373
Total $ 1,825,610
12. RISK MANAGEMENT AND EMPLOYEE HEALTH CARE PLANS
The Authority is exposed to various risks of loss related to torts; theft or, damage to, and destruction of assets; errors and omissions; non-performance of duty; injuries to employees; and natural disasters. The Authority participates in a General/Law Enforcement Liability plan called “VARisk 2” maintained by the Commonwealth of Virginia. Health care related benefits for employees hired prior to July 1, 1997 are covered by the state employee health care plan administered by the Department of Human Resource Management. Information relating to the Commonwealth’s insurance plans is available at the statewide level in the Commonwealth of Virginia’s Comprehensive Annual Financial Report (CAFR).
85
VIRGINIA PORT AUTHORITY NOTES TO FINANCIAL STATEMENTS
JUNE 30, 2016
12. RISK MANAGEMENT AND EMPLOYEE HEALTH CARE PLANS - concluded
Through its operating agreement, the Authority requires Virginia International Terminals, LLC to maintain property insurance coverage on all plant and equipment located on the terminals.
The Authority maintains its own insurance coverage for health (for employees hired on or after July 1, 1997), property, auto, workers’ compensation, and international liabilities, as well as an umbrella policy providing excess liability coverage over and above losses not covered in primary policies. The Authority is partially self-insured for employee health coverage. The Authority is responsible for actual claim costs up to $125,000 per individual for calendar year 2015. The aggregate deductible for VIT and VPA combined claims in excess of the $125,000 individual limit was $7,045,764 for calendar year 2016.
Blended Component Unit – VIT
VIT participates in a workers’ compensation insurance pool. VIT remains obligated under its former self-insured plan for future losses as a result of accidents that occurred prior to April 12, 1999. VIT is partially self-insured for those workers' compensation claims and maintains insurance coverage of $5,000,000 per claim, but is obligated to pay the first $1,000,000 of any individual's claims per incident. The Company offers health/medical insurance to its employees, and bears some self-insurance risk for claims cost in excess of employee premiums/contributions received. Pursuant to a joint arrangement with the VPA, the entity carries stop loss insurance to mitigate exposure to significant claims. The stop loss policy is on a calendar year basis, with renewals effective each January 1. During the calendar years of 2015 and 2016, the individual claim cost limit (deductible) under the policy for the Company was $125,000. The aggregate deductible for VIT and VPA combined claims in excess of the $125,000 individual limit was $7,045,764 for calendar year 2016 and $6,799,081 for calendar year 2015. As of June 30, 2016, the Company had accrued $373,830 for claims incurred but not reported (IBNR).
86

VIRGINIA PORT AUTHORITY NOTES TO FINANCIAL STATEMENTS
JUNE 30, 2016
13. RELATED PARTIES
VIT also makes lease payments on behalf of the VPA for various equipment and office space. Total payments on behalf of the VPA for these lease agreements totaled $865,975 for the year ended June 30, 2016.
On August 8, 2014, an Agreement for Shared Services was executed between the VPA and VIT and HRCP, in an effort to streamline the administration of the Port of Virginia and reduce costs. Services shared include Accounting and Finance, Purchasing, Risk Management, Innovation, and Human Resources. Costs are billed to each entity based on a budgeted allocation with actual true up to expenditures on a quarterly but no less than annual frequency. The shared services agreement became effective on January 1, 2015. For the year ended June 30, 2016, VIT’s allocated services were $14,089,129 and HRCP’s were $2,394,214.
From time to time, related parties will extend short-term cash advances. For the year ended June 30, 2016, VIT received $1,173,139 from the VPA, which was repaid in July of 2015. No HRCP contributions were passed through to the VPA. No interest is earned or charged on any advances. At June 30, 2016, there were no related-party advances outstanding between any of the Port Entities.
For the year ended June 30, 2016, VIT recorded $108,361,067 as operating transfers to VPA pursuant to the Operating Agreement. The calculations are performed as of the end of the applicable month, and payment is made by the 15th of the subsequent month. VIT also collected and remitted to the VPA $8,827,022 in Security Surcharges from VPA customers for the year ended June 30, 2016.
On January 1, 2016, a liability for compensated absences in the amount of $486,116 was transferred from VIT to the VPA for benefits earned by employees during their service with VIT. Employees will have until December 31, 2019 to utilize the leave balances associated with this liability.
14. SUBSEQUENT EVENTS
Management has evaluated subsequent events through October 26, 2016, which is the date the consolidated financial statements were available to be issued. Management has determined the following subsequent events warrant disclosure in the consolidated financial statements.
87

VIRGINIA PORT AUTHORITY NOTES TO FINANCIAL STATEMENTS
JUNE 30, 2016
14. SUBSEQUENT EVENTS – continued
On September 6, 2016, the U.S. Bankruptcy Court in Newark, New Jersey granted Hanjin Shipping’s (Hanjin) request to have its rehabilitation filed in Korean Bankruptcy Court recognized in the United States. Hanjin is, based on capacity, the seventh largest ship line in the world, and is a customer of VIT. VIT has taken measures to mitigate exposure to the bankruptcy including, but not limited to, requiring cash deposits and advance payments, affirming guarantees from third parties, and securing collateralized property on the terminal grounds. While the outcome of the proceedings and absolute effect on the Company is uncertain at this time, based on available information and management’s assessment of the matter, the bankruptcy is not expected to have a material adverse effect on the Company’s consolidated net position.
On September 21, 2016, the VPA announced an agreement for the extension and restatement of the lease with Virginia International Gateway, Inc. from its current expiration date of July 1, 2030 to December 31, 2065. The restated lease will provide for, among other things, the development of 60 acres (designated as Phase II) of the terminal property, expansion of the existing wharf by 650 feet, provision of an additional 10,000 feet of on-dock rail, and the effective doubling of the capacity of the VIG terminal.
The lessor is financing the Phase II development costs, estimated at $320 million, and development is expected to be completed in approximately three years. Upon commencement, the payment terms of the restated lease will change to eliminate volume rent, and will consist of an initial annual base rent of $51.7 million, plus $11 million of expansion rent during the first lease year, increasing to $22 million of expansion rent during the second lease year, and finally $33 million during the third lease year and thereafter (e.g. $84.7 million of annual base rent from year three forward); the amount of additional rent could fluctuate up or down depending on the ultimate expansion cost funded. During the construction period, the restated lease also provides for an additional $1 million annually of interim construction rent. After years five and ten of the restated lease, the total annual rent is increased by an additional $1 million at each interval. All lease payments are subject to escalation based on changes in the Consumer Price Index.
There are certain conditions precedent to the formal commencement of the lease, including, but not limited to, the defeasance of existing Port Facilities Revenue Bonds (Series 2010, 2013, 2015A and 2015B) and installment purchases obligations and refunding through a 2016 series that will be subordinated to the lease obligation. Other conditions precedent include validation of funding sources, approval of the project plan, and various regulatory and administrative matters. Based on progress to date, management believes that the conditions precedent will be satisfied and the lease formally commenced during November 2016. Upon commencement, the restated lease will be accounted for as a capital lease. VIT will continue as the terminal operator.
88
VIRGINIA PORT AUTHORITY NOTES TO FINANCIAL STATEMENTS
JUNE 30, 2016
14. SUBSEQUENT EVENTS – concluded
On October 31, 2016, VPA’s contract with the current operator of RMT will expire. On November 1, 2016, VIT will become the operator of RMT.
89
REQUIRED SUPPLEMENTARY INFORMATION (RSI)
(UNAUDITED)
90

VIRGINIA PORT AUTHORITYVPA DEFINED BENEFIT PENSION PLANSCHEDULE OF CONTRIBUTIONS
June 30, 2015 June 30, 2016
Contractually Required Contribution 874,897$ 1,772,010$
900,882 3,850,943 Contribution Deficiency (excess) (25,985)$ (2,078,933)$ Covered - Employee Payroll 5,707,279$ 10,235,375$ Contributions as a % of Payroll 15.78% 37.62%
Notes to Schedule:
1) Valuation Date: July 1, 2014 July 1, 2015
which contributions are reported.
3) Methods and assumptions used to determine contribution rates:
Actuarial cost method Aggregate Level of Payroll Aggregate Level of PayrollAsset valuation method Fair Value Fair Value
2.50% 2.50%4.0% 3.50%
Investment rate of return
Retirement Age Varies by age and service Varies by age and service
Mortality rates
Mortality rates were based on the RP-2000 Healthy Annuitant/Non Annuitant Mortality Table for Males or Females, as appropriate, with generational projections for mortality improvements based on Scale AA
Mortality rates were based on the RP-2014 Healthy Annuitant/Non Annuitant Mortality Table for Males or Females, as appropriate, with generational projections for mortality improvements based on Scale MP-2015
4) This schedule is presented to illustrate the requirement to show information for 10 years. However, until a full10-year trend is compiled, the Authority will present information for those years for which information is available.
7.5%, net of pension plan investmentexpense, including inflation
Contributions made in Relation to theActuarially Determined Contribution
Fiscal Year Ended
7.0%, net of pension plan investmentexpense, including inflation
IRS limit increasesProjected salary increases
2) Actuarially determined contribution rates are calculated as of July 1, one year prior to the end of the fiscal year in
91
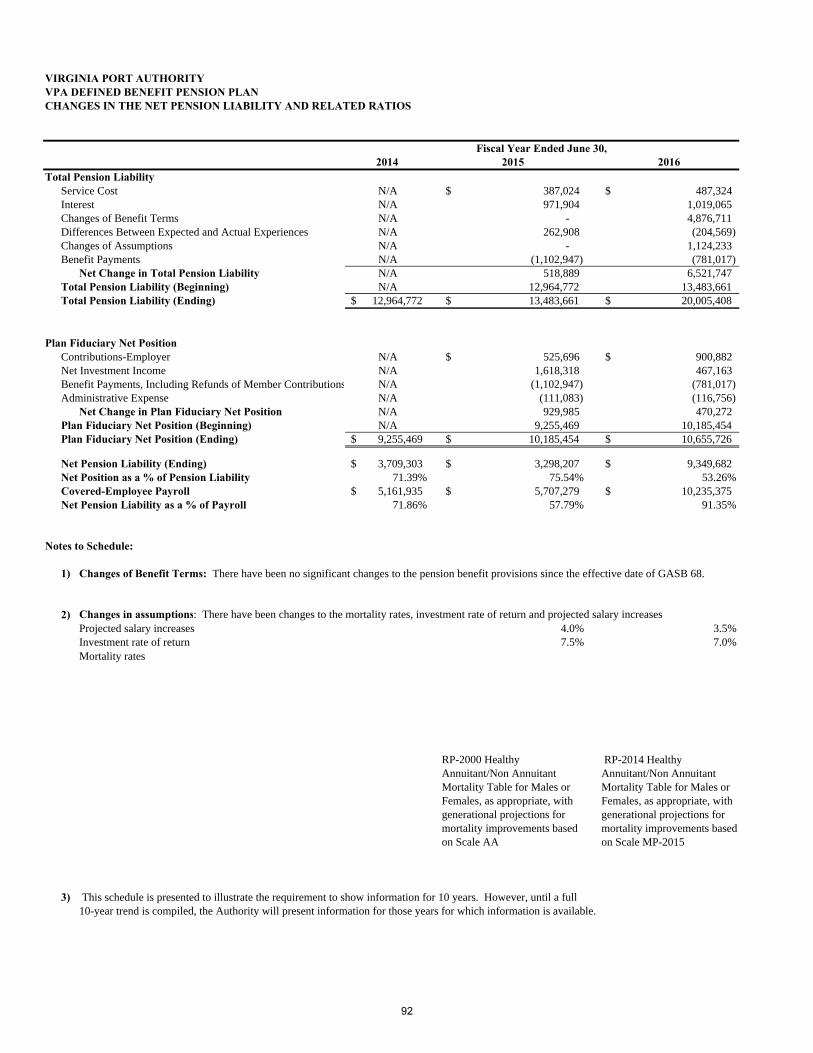
VIRGINIA PORT AUTHORITYVPA DEFINED BENEFIT PENSION PLANCHANGES IN THE NET PENSION LIABILITY AND RELATED RATIOS
2014 2015 2016Total Pension Liability
Service Cost N/A 387,024$ 487,324$ Interest N/A 971,904 1,019,065 Changes of Benefit Terms N/A - 4,876,711 Differences Between Expected and Actual Experiences N/A 262,908 (204,569) Changes of Assumptions N/A - 1,124,233 Benefit Payments N/A (1,102,947) (781,017)
Net Change in Total Pension Liability N/A 518,889 6,521,747 Total Pension Liability (Beginning) N/A 12,964,772 13,483,661 Total Pension Liability (Ending) 12,964,772$ 13,483,661$ 20,005,408$
Plan Fiduciary Net PositionContributions-Employer N/A 525,696$ 900,882$ Net Investment Income N/A 1,618,318 467,163 Benefit Payments, Including Refunds of Member Contributions N/A (1,102,947) (781,017) Administrative Expense N/A (111,083) (116,756)
Net Change in Plan Fiduciary Net Position N/A 929,985 470,272 Plan Fiduciary Net Position (Beginning) N/A 9,255,469 10,185,454 Plan Fiduciary Net Position (Ending) 9,255,469$ 10,185,454$ 10,655,726$
Net Pension Liability (Ending) 3,709,303$ 3,298,207$ 9,349,682$ Net Position as a % of Pension Liability 71.39% 75.54% 53.26%Covered-Employee Payroll 5,161,935$ 5,707,279$ 10,235,375$ Net Pension Liability as a % of Payroll 71.86% 57.79% 91.35%
Notes to Schedule:
1)
2) Changes in assumptions: There have been changes to the mortality rates, investment rate of return and projected salary increasesProjected salary increases 4.0% 3.5%Investment rate of return 7.5% 7.0%Mortality rates
RP-2000 Healthy Annuitant/Non Annuitant Mortality Table for Males or Females, as appropriate, with generational projections for mortality improvements based on Scale AA
RP-2014 Healthy Annuitant/Non Annuitant Mortality Table for Males or Females, as appropriate, with generational projections for mortality improvements based on Scale MP-2015
3) This schedule is presented to illustrate the requirement to show information for 10 years. However, until a full10-year trend is compiled, the Authority will present information for those years for which information is available.
Fiscal Year Ended June 30,
Changes of Benefit Terms: There have been no significant changes to the pension benefit provisions since the effective date of GASB 68.
92

VIRGINIA INTERNATIONAL TERMINALS, LLCDEFINED BENEFIT PLANSCHEDULE OF COMPANY CONTRIBUTIONS
Fiscal Year Fiscal YearJune 30, 2015 June 30, 2016
Actuarially determined contribution 3,072,285$ 2,745,069$ Contributions in relation to the actuarially determined contribution 2,157,789 722,211
Contribution deficiency (excess) 914,496$ 2,022,858$
Covered-employee payroll 23,660,725$ 17,885,926$
9.12% 4.04%
Notes to Schedule:
1) Valuation date:
June 30, 2015
2) Methods and assumptions used to determine contribution rates:
Actuarial cost method Entry age
Amortization method Level of Payroll, Closed30 years
Asset valuation method Fair Value
Entry age normal - level percentage of pay Level of Payroll, Closed 30 yearsFair Value
2.5% 2.0%3.5% 3.5%
Interest rate of return 7.0% Retirement age 55
Mortality
3)
4) The valuation at June 30, 2015 represents a short year valuation to conform the reporting of this plan to others within theorganization.
RP2014 mortality table adjusted to 2006 with generational projection (Scale MP-2015)
65
This schedule is presented to illustrate the requirement to show information for 10 years. However, until a full 10-year trend is compiled, the Company will present information for those years for which information is available.
4%
Actuarially determined contribution rates are calculated as of September 30, the fiscal year of the plan.
RP2000 Combined Mortality Table (Projected Using Scale BB)
Contributions as a percentage of covered-employee payroll
Remaining amortization
Inflation Projected salary increases
93
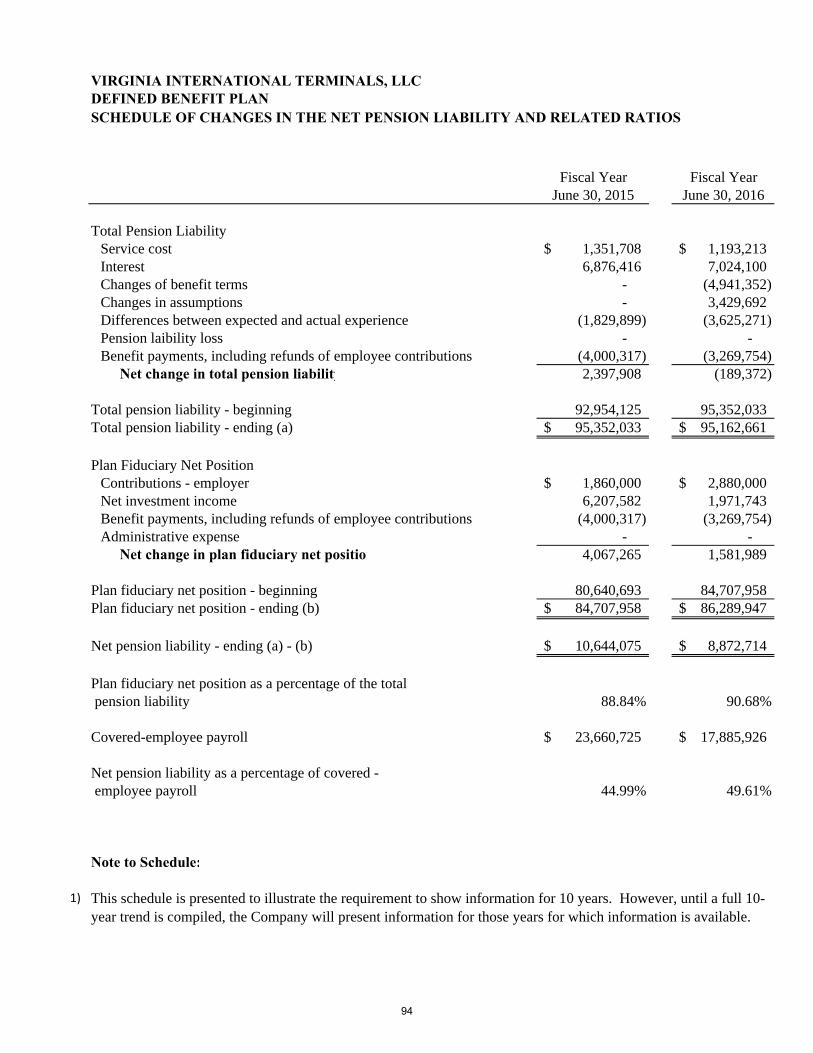
SCHEDULE OF CHANGES IN THE NET PENSION LIABILITY AND RELATED RATIOS
Fiscal Year Fiscal YearJune 30, 2015 June 30, 2016
Total Pension LiabilityService cost 1,351,708$ 1,193,213$ Interest 6,876,416 7,024,100 Changes of benefit terms - (4,941,352) Changes in assumptions - 3,429,692 Differences between expected and actual experience (1,829,899) (3,625,271) Pension laibility loss - - Benefit payments, including refunds of employee contributions (4,000,317) (3,269,754)
Net change in total pension liability 2,397,908 (189,372)
Total pension liability - beginning 92,954,125 95,352,033Total pension liability - ending (a) 95,352,033$ 95,162,661$
Plan Fiduciary Net PositionContributions - employer 1,860,000$ 2,880,000$ Net investment income 6,207,582 1,971,743 Benefit payments, including refunds of employee contributions (4,000,317) (3,269,754) Administrative expense - -
Net change in plan fiduciary net position 4,067,265 1,581,989
Plan fiduciary net position - beginning 80,640,693 84,707,958Plan fiduciary net position - ending (b) 84,707,958$ 86,289,947$
Net pension liability - ending (a) - (b) 10,644,075$ 8,872,714$
Plan fiduciary net position as a percentage of the total pension liability 88.84% 90.68%
Covered-employee payroll 23,660,725$ 17,885,926$
Net pension liability as a percentage of covered - employee payroll 44.99% 49.61%
Note to Schedule:
1)
VIRGINIA INTERNATIONAL TERMINALS, LLCDEFINED BENEFIT PLAN
This schedule is presented to illustrate the requirement to show information for 10 years. However, until a full 10-year trend is compiled, the Company will present information for those years for which information is available.
94
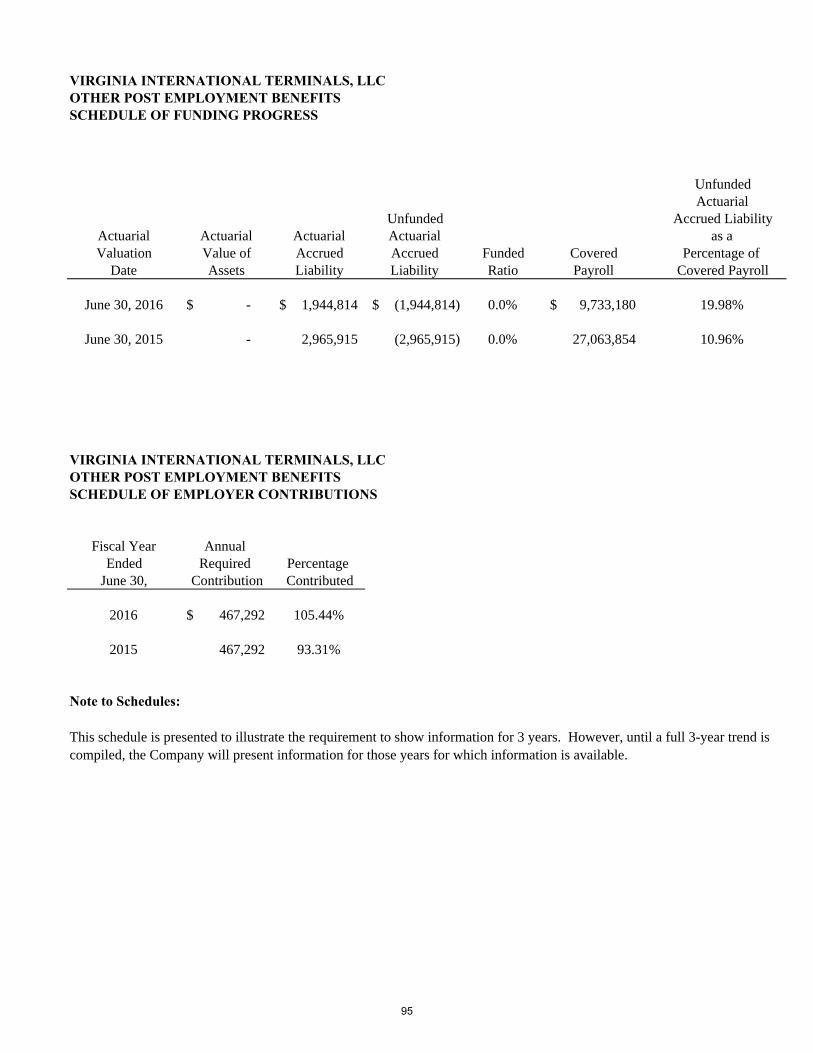
UnfundedActuarial
Unfunded Accrued LiabilityActuarial Actuarial Actuarial Actuarial as aValuation Value of Accrued Accrued Funded Covered Percentage of
Date Assets Liability Liability Ratio Payroll Covered Payroll
June 30, 2016 -$ 1,944,814$ (1,944,814)$ 0.0% 9,733,180$ 19.98%
June 30, 2015 - 2,965,915 (2,965,915) 0.0% 27,063,854 10.96%
Fiscal Year Annual Ended Required Percentage
June 30, Contribution Contributed
2016 467,292$ 105.44%
2015 467,292 93.31%
Note to Schedules:
VIRGINIA INTERNATIONAL TERMINALS, LLC
SCHEDULE OF FUNDING PROGRESS
VIRGINIA INTERNATIONAL TERMINALS, LLC
This schedule is presented to illustrate the requirement to show information for 3 years. However, until a full 3-year trend is compiled, the Company will present information for those years for which information is available.
OTHER POST EMPLOYMENT BENEFITS
OTHER POST EMPLOYMENT BENEFITSSCHEDULE OF EMPLOYER CONTRIBUTIONS
95
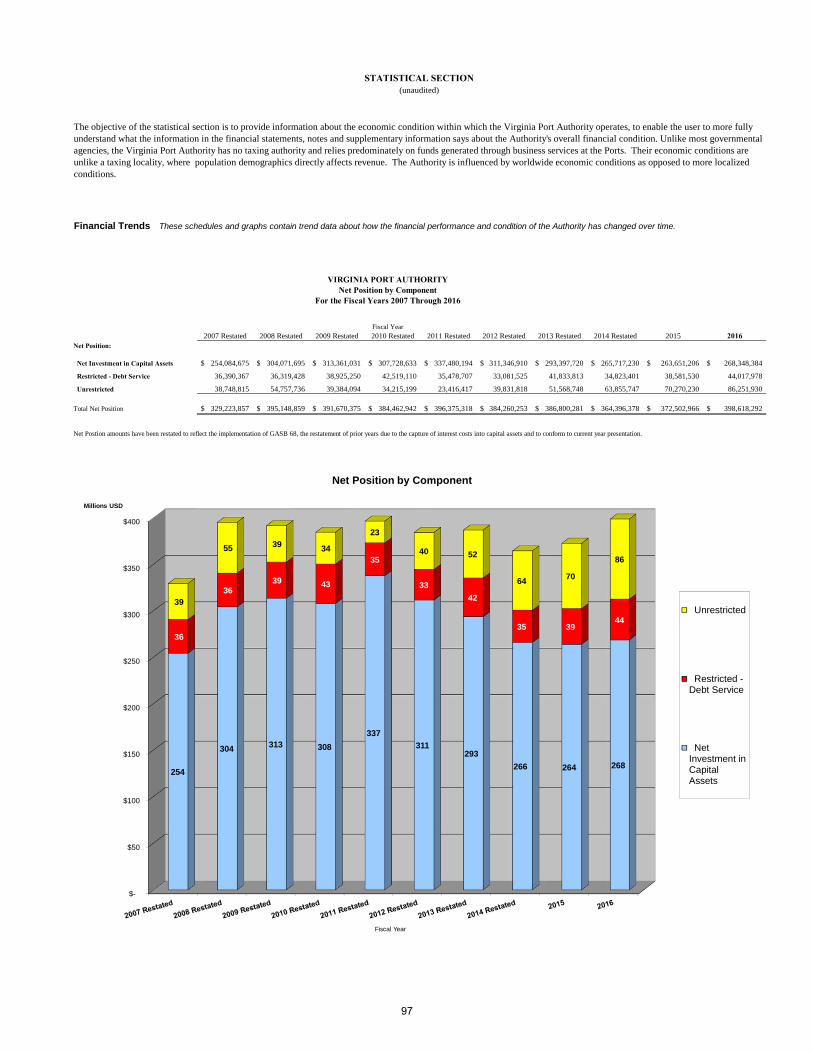
Financial Trends These schedules and graphs contain trend data about how the financial performance and condition of the Authority has changed over time.
2007 Restated 2008 Restated 2009 Restated 2010 Restated 2011 Restated 2012 Restated 2013 Restated 2014 Restated 2015 2016Net Position:
Net Investment in Capital Assets 254,084,675$ 304,071,695$ 313,361,031$ 307,728,633$ 337,480,194$ 311,346,910$ 293,397,720$ 265,717,230$ 263,651,206$ 268,348,384$
Restricted - Debt Service 36,390,367 36,319,428 38,925,250 42,519,110 35,478,707 33,081,525 41,833,813 34,823,401 38,581,530 44,017,978
Unrestricted 38,748,815 54,757,736 39,384,094 34,215,199 23,416,417 39,831,818 51,568,748 63,855,747 70,270,230 86,251,930
Total Net Position 329,223,857$ 395,148,859$ 391,670,375$ 384,462,942$ 396,375,318$ 384,260,253$ 386,800,281$ 364,396,378$ 372,502,966$ 398,618,292$
Net Postion amounts have been restated to reflect the implementation of GASB 68, the restatement of prior years due to the capture of interest costs into capital assets and to conform to current year presentation.
The objective of the statistical section is to provide information about the economic condition within which the Virginia Port Authority operates, to enable the user to more fully understand what the information in the financial statements, notes and supplementary information says about the Authority's overall financial condition. Unlike most governmental agencies, the Virginia Port Authority has no taxing authority and relies predominately on funds generated through business services at the Ports. Their economic conditions are unlike a taxing locality, where population demographics directly affects revenue. The Authority is influenced by worldwide economic conditions as opposed to more localized conditions.
STATISTICAL SECTION(unaudited)
For the Fiscal Years 2007 Through 2016Net Position by Component
VIRGINIA PORT AUTHORITY
Fiscal Year
$-
$50
$100
$150
$200
$250
$300
$350
$400
254
304 313 308
337
311293
266 264 268
36
36 39 43
35
33
42
35 39 44
39
55 39 34
23
40 52
64 70
86
Millions USD
Fiscal Year
Net Position by Component
Unrestricted
Restricted -Debt Service
NetInvestment inCapitalAssets
97

2007 Restated 2008 Restated 2009 Restated 2010 Restated 2011 Restated 2012 Restated 2013 Restated 2014 Restated 2015 2016Operating Revenues: Operating revenues from component unit 67,399,813$ 71,370,049$ 48,448,053$ 46,184,870$ 81,348,960$ 88,458,998$ 90,272,604$ 75,058,836$ 94,845,407$ 108,847,183$
Other revenues 4,946,483 6,049,718 4,707,316 1,030,769 3,596,326 6,283,332 7,970,579 5,192,084 9,147,626 9,339,787
Operating revenues - grants ‐ ‐ ‐ 4,742,848 6,274,000 6,519,292 4,903,439 7,762,729 6,179,493 6,390,908
Total operating revenues 72,346,296 77,419,767 53,155,369 51,958,487 91,219,286 101,261,622 103,146,622 88,013,649 110,172,526 124,577,878
Operating Expenses: Terminal operations 1,842,680 1,842,533 1,875,888 1,917,506 1,995,005 2,068,666 2,128,546 1,309,688 1,132,625 1,506,749
Terminal maintenance 4,586,595 4,878,215 6,055,480 6,849,226 7,962,089 10,492,515 8,731,182 8,324,365 8,936,463 9,920,219
General and administrative 21,153,082 23,263,380 20,191,192 19,748,554 22,600,035 22,089,260 18,577,038 26,205,663 19,213,457 20,599,900
Facility rental ‐ ‐ ‐ ‐ 29,740,480 37,063,827 47,229,466 52,479,613 55,679,447 55,618,729
Depreciation and amortization 33,546,305 35,283,706 38,905,389 43,961,670 46,135,517 44,840,342 44,095,008 43,084,669 42,653,783 44,018,111
Total operating expenses 61,128,662 65,267,834 67,027,949 72,476,956 108,433,126 116,554,610 120,761,240 131,403,998 127,615,775 131,663,708
Operating income (loss) 11,217,634 12,151,933 (13,872,580) (20,518,469) (17,213,840) (15,292,988) (17,614,618) (43,390,349) (17,443,249) (7,085,830)
Non-operating revenues (expenses) Interest income 6,983,909 4,290,858 1,855,775 578,313 697,221 636,920 482,181 330,581 441,454 652,550
Interest expense, net of capitalized interest (17,645,103) (16,613,369) (17,163,304) (15,687,770) (18,984,951) (23,070,737) (20,531,918) (16,888,384) (14,160,492) (18,160,286)
Bond issue costs (921,160) (678,876) (20,000) (694,650) (538,986) (734,427) (917,063) (69,000) (1,024,231) (489,036)
Commonwealth Rail Relocation income (& ARRA) 1,120,000 20,781,163 ‐ ‐ 2,014,416 6,375,798 244,424 ‐ ‐ ‐
Commonwealth Rail Relocation expenses (1,447,474) (22,102,404) (26,817,021) (8,223,576) (2,272,191) (6,296,498) (394,990) (133,770) ‐ ‐
Operating Expenses to Component Unit (4,498,144) ‐ (4,852,551) ‐ ‐ ‐ ‐ ‐ ‐ ‐
Revenues from federal government 300,787 876,048 16,711,588 6,076,191 12,588,643 4,612,432 3,471,137 626,643 740,452 9,653,436
Revenues (expenses) Commonwealth (173,802) 23,948,420 (155,867) (105,427) (261,468) (297,267) (158,628) 306,335 1,324,350 (187,951)
Revenues (expenses) VEDP, net ‐ ‐ ‐ ‐ ‐ ‐ ‐ ‐ ‐ 1,690,873
Voluntary non-exchange revenue ‐ ‐ 1,900,000 ‐ ‐ ‐ ‐ ‐ ‐ ‐
Other income (expense) 166,303 35,590 38,825 7,787 8,996 8,722 ‐ ‐ ‐ 2,744
Gain (loss) on disposals (430,311) (852,527) 3,793 (2,093,785) 88,879 (15,266,083) 708,585 2,652 ‐ (1,107,131)
Income (loss) before capitalcontributions and transfers (5,327,361) 21,836,836 (42,371,342) (40,661,386) (23,873,281) (49,324,128) (34,710,890) (59,215,292) (30,121,716) (15,030,631)
Capital contributions and transfers
Commonwealth Port Fund allocation 36,500,057 36,036,914 32,663,448 32,784,966 34,717,391 36,252,985 37,223,718 36,652,218 38,418,111 42,366,884
Capital contributions (to) from component unit 1,968,604 662,502 6,229,410 668,987 1,068,266 956,079 27,200 159,171 (189,807) (287,700)
Payments to federal government - channel dredging ‐ ‐ ‐ ‐ ‐ ‐ ‐ ‐ ‐ (5,722,955)
Capital contributions (to) from other state agencies ‐ 7,388,750 ‐ ‐ ‐ ‐ ‐ ‐ ‐ 4,789,728
Increase (decrease) in Net Position 33,141,300 65,925,002 (3,478,484) (7,207,433) 11,912,376 (12,115,064) 2,540,028 (22,403,903) 8,106,588 26,115,326
Net Position - Beginning of Year 296,082,557 329,223,857 395,148,859 391,670,375 384,462,942 396,375,318 384,260,253 386,800,281 364,396,378 372,502,966
Net Position - End of Year 329,223,857$ 395,148,859$ 391,670,375$ 384,462,942$ 396,375,318$ 384,260,253$ 386,800,281$ 364,396,378$ 372,502,966$ 398,618,292$
Note this has been reorganized to reflect non operating incomes and expenses as they are currently depicted in the financial statements presented herein.
This has also been restated for the implementation of GASB 68 and the affect of the prior period adjustment for capitalized interest (see footnotes FY15 for details)
For the Fiscal Years 2007 Through 2016Statement of Revenues, Expenses and Changes in Net Position
VIRGINIA PORT AUTHORITY
98
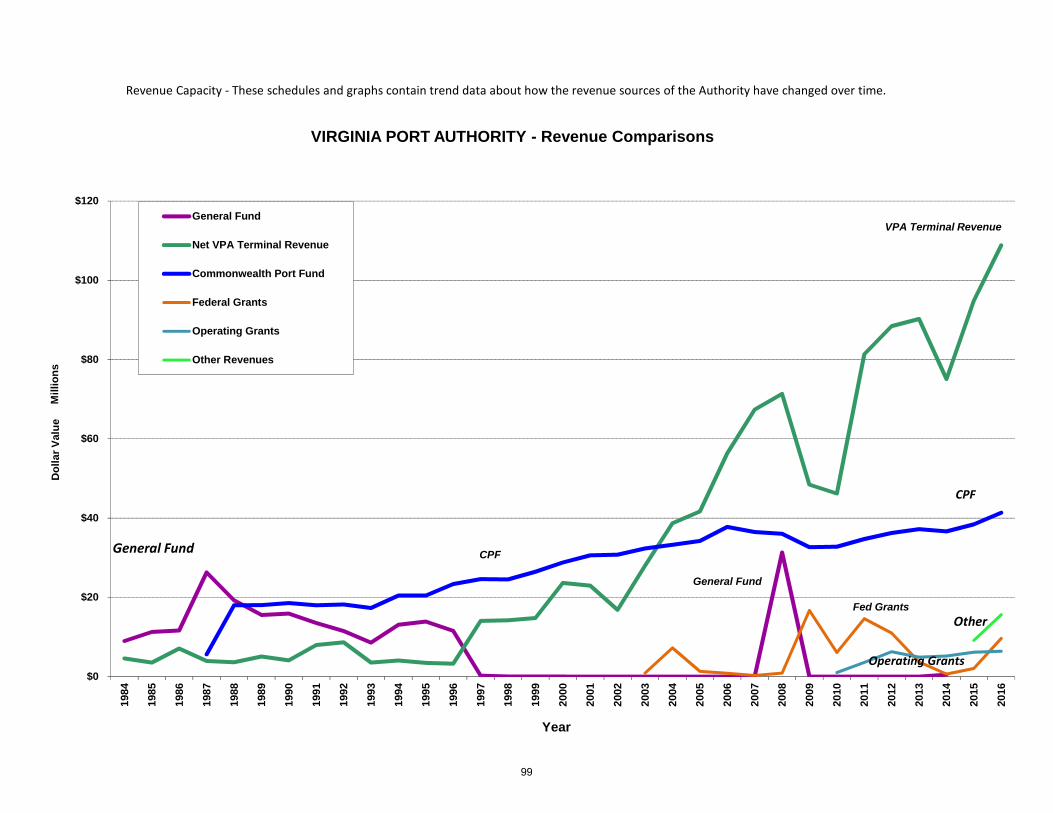
$0
$20
$40
$60
$80
$100
$120
1984
1985
1986
1987
1988
1989
1990
1991
1992
1993
1994
1995
1996
1997
1998
1999
2000
2001
2002
2003
2004
2005
2006
2007
2008
2009
2010
2011
2012
2013
2014
2015
2016
Do
llar
Val
ue
Mil
lio
ns
Year
VIRGINIA PORT AUTHORITY - Revenue Comparisons
General Fund
Net VPA Terminal Revenue
Commonwealth Port Fund
Federal Grants
Operating Grants
Other Revenues
General Fund
CPF
VPA Terminal Revenue
Revenue Capacity ‐ These schedules and graphs contain trend data about how the revenue sources of the Authority have changed over time.
Fed Grants
Operating Grants
CPF
General Fund
Other
99

Debt Capacity These schedules present information about the Authority’s ability to pay debt service and their ability to issue debt in the future.
100
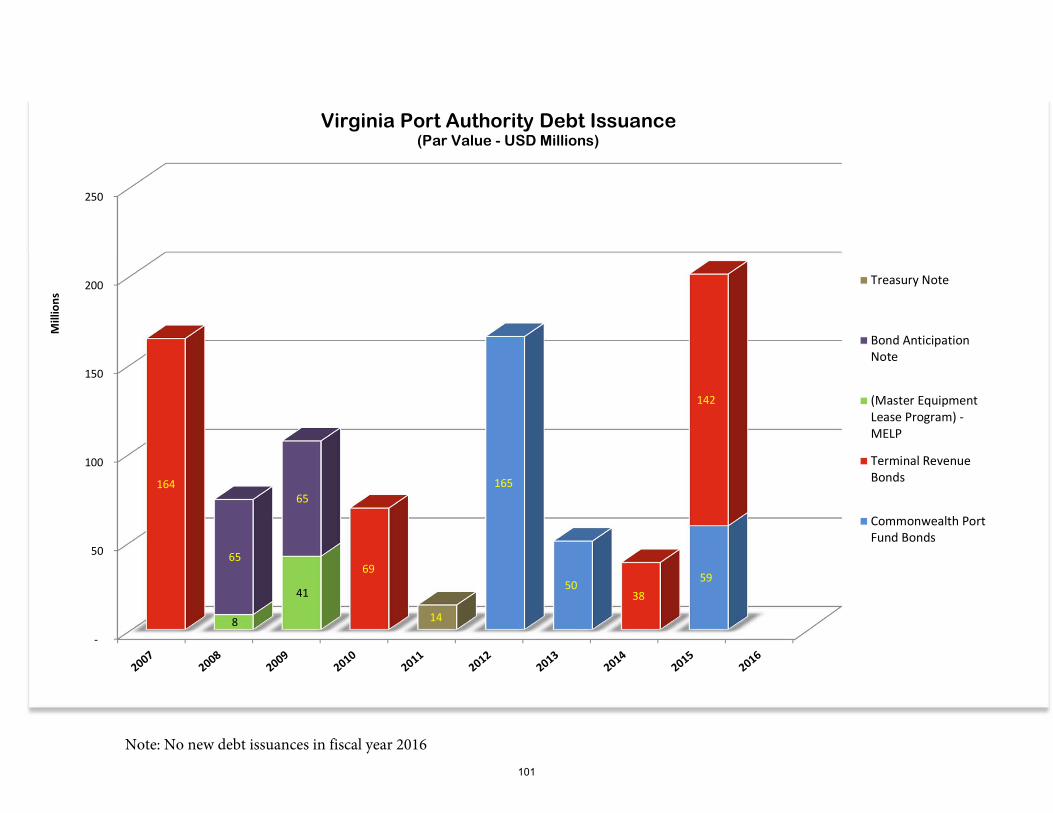
‐
50
100
150
200
250
165
5059
164
69
38
142
8
41
65
65
14
Millions
Treasury Note
Bond AnticipationNote
(Master EquipmentLease Program) ‐MELP
Terminal RevenueBonds
Commonwealth PortFund Bonds
Virginia Port Authority Debt Issuance(Par Value - USD Millions)
Note: No new debt issuances in fiscal year 2016
101

Issued 7/27/2011 Issued 1/25/2012 Issued 9/26/2012 Issued 9/26/2012 Issued 6/23/2015Fiscal Year Ending Series 2006 Total BondsJune 30, Principal Interest Debt Service Principal Interest Debt Service Principal Interest Debt Service Principal Interest Debt Service Principal Interest Debt Service Principal Interest Debt Service Debt Service
2017 1,365,000$ 37,538$ 1,402,538$ -$ 2,868,500$ 2,868,500$ 6,470,000$ 2,531,455$ 9,001,455$ 2,745,000$ 1,107,499$ 3,852,499$ -$ 224,150$ 224,150$ -$ 2,934,000$ 2,934,000$ 20,283,142$ 2018 - - - - 2,868,500 2,868,500 6,575,000 2,423,521 8,998,521 2,775,000 1,075,965 3,850,965 - 224,150 224,150 - 2,934,000 2,934,000 18,876,136 2019 - - - - 2,868,500 2,868,500 6,695,000 2,294,020 8,989,020 2,810,000 1,036,716 3,846,716 - 224,150 224,150 - 2,934,000 2,934,000 18,862,386 2020 - - - - 2,868,500 2,868,500 6,835,000 2,138,591 8,973,591 2,855,000 988,762 3,843,762 - 224,150 224,150 - 2,934,000 2,934,000 18,844,003 2021 - - - - 2,868,500 2,868,500 7,005,000 1,959,731 8,964,731 2,900,000 931,722 3,831,722 - 224,150 224,150 - 2,934,000 2,934,000 18,823,103 2022 - - - - 2,868,500 2,868,500 7,190,000 1,759,489 8,949,489 2,970,000 865,796 3,835,796 - 224,150 224,150 - 2,934,000 2,934,000 18,811,935 2023 - - - - 2,868,500 2,868,500 7,405,000 1,540,848 8,945,848 3,035,000 792,352 3,827,352 - 224,150 224,150 - 2,934,000 2,934,000 18,799,851 2024 - - - - 2,868,500 2,868,500 7,625,000 1,304,419 8,929,419 3,115,000 710,979 3,825,979 - 224,150 224,150 - 2,934,000 2,934,000 18,782,048 2025 - - - - 2,868,500 2,868,500 7,875,000 1,048,963 8,923,963 3,200,000 621,105 3,821,105 - 224,150 224,150 - 2,934,000 2,934,000 18,771,718 2026 - - - - 2,868,500 2,868,500 8,140,000 773,005 8,913,005 3,295,000 521,348 3,816,348 - 224,150 224,150 - 2,934,000 2,934,000 18,756,003 2027 - - - - 2,868,500 2,868,500 8,425,000 477,249 8,902,249 3,400,000 412,695 3,812,695 - 224,150 224,150 - 2,934,000 2,934,000 18,741,594 2028 - - - - 2,868,500 2,868,500 8,730,000 162,378 8,892,378 3,510,000 297,098 3,807,098 - 224,150 224,150 - 2,934,000 2,934,000 18,726,126 2029 - - - 2,565,000 2,804,375 5,369,375 - - - 3,630,000 172,611 3,802,611 - 224,150 224,150 6,250,000 2,777,750 9,027,750 18,423,886 2030 - - - 2,690,000 2,673,000 5,363,000 - - - 2,930,000 53,853 2,983,853 780,000 212,450 992,450 6,620,000 2,456,000 9,076,000 18,415,303 2031 - - - 2,820,000 2,535,250 5,355,250 - - - - - - 4,015,000 100,375 4,115,375 6,780,000 2,121,000 8,901,000 18,371,625 2032 - - - 7,245,000 2,283,625 9,528,625 - - - - - - - - - 7,050,000 1,775,250 8,825,250 18,353,875 2033 - - - 7,610,000 1,912,250 9,522,250 - - - - - - - - - - 1,599,000 1,599,000 11,121,250 2034 - - - 7,990,000 1,522,250 9,512,250 - - - - - - - - - - 1,599,000 1,599,000 11,111,250 2035 - - - 8,390,000 1,112,750 9,502,750 - - - - - - - - - - 1,599,000 1,599,000 11,101,750 2036 - - - 8,810,000 682,750 9,492,750 - - - - - - - - - - 1,599,000 1,599,000 11,091,750 2037 - - - 9,250,000 231,250 9,481,250 - - - - - - - - - - 1,599,000 1,599,000 11,080,250 2038 - - - - - - - - - - - - - - - 7,420,000 1,413,500 8,833,500 8,833,500 2039 - - - - - - - - - - - - - - - 7,790,000 1,033,250 8,823,250 8,823,250 2040 - - - - - - - - - - - - - - - 8,180,000 634,000 8,814,000 8,814,000 2041 - - - - - - - - - - - - - - - 8,590,000 214,750 8,804,750 8,804,750
1,365,000$ 37,538$ 1,402,538$ 57,370,000$ 50,179,500$ 107,549,500$ 88,970,000$ 18,413,669$ 107,383,669$ 43,170,000$ 9,588,502$ 52,758,502$ 4,795,000$ 3,226,775$ 8,021,775$ 58,680,000$ 55,628,500$ 114,308,500$ 391,424,484$
7/1/2016 7/1/2036 7/1/2027 7/1/2029 7/1/2030 7/1/2040
Maturity Maturity Maturity Maturity Maturity Maturity
¹ The bonds are payable primarily from the Commonwealth Port fund. Such revenues currently consist of a portion of the additional revenues derived from certain increases in motor vehicle fuel taxes, sales and use taxes, and annual motor vehicle registration fees.
Series 2015Series 2012-CSeries 2011 Series 2012 Series 2012-B
VIRGINIA PORT AUTHORITYCommonwealth Port Fund (CPF) Revenue Bonds¹
Debt Service Payment Requirements
102

VIRGINIA PORT AUTHORITYPort Facilities Revenue Bonds¹
Debt Service Payment Requirements
FiscalYear
Ending Series 2010 Bonds Total BondsJune 30, Principal Interest Total Principal Interest Total Principal Interest Total Principal Interest Total Principal Interest Total Debt Service
2017 3,535,000$ 88,375$ 3,623,375$ 1,515,000$ 3,278,019$ 4,793,019$ 610,000$ 1,163,076$ 1,773,076$ - 4,256,500$ 4,256,500$ 830,000$ 1,501,512$ 2,331,512$ 16,777,482$ 2018 - - - 1,575,000 3,208,344 4,783,344 2,135,000 1,120,666 3,255,666 - 4,256,500 4,256,500 4,545,000 1,471,854 6,016,854 18,312,364 2019 - - - 1,655,000 3,141,041 4,796,041 2,200,000 1,053,690 3,253,690 - 4,256,500 4,256,500 4,605,000 1,408,157 6,013,157 18,319,388 2020 - - - 1,710,000 3,070,363 4,780,363 2,275,000 984,551 3,259,551 - 4,256,500 4,256,500 4,675,000 1,320,849 5,995,849 18,292,263 2021 - - - 1,795,000 2,991,713 4,786,713 2,340,000 913,250 3,253,250 - 4,256,500 4,256,500 4,775,000 1,215,750 5,990,750 18,287,213 2022 - - - 1,865,000 2,909,188 4,774,188 2,415,000 839,785 3,254,785 - 4,256,500 4,256,500 4,885,000 1,095,503 5,980,503 18,265,976 2023 - - - 1,960,000 2,813,563 4,773,563 2,490,000 764,003 3,254,003 - 4,256,500 4,256,500 5,020,000 960,331 5,980,331 18,264,397 2024 - - - 2,060,000 2,723,363 4,783,363 2,565,000 685,903 3,250,903 - 4,256,500 4,256,500 5,155,000 812,925 5,967,925 18,258,691 2025 - - - 2,140,000 2,629,822 4,769,822 2,645,000 605,408 3,250,408 - 4,256,500 4,256,500 5,305,000 653,877 5,958,877 18,235,607 2026 - - - 2,245,000 2,531,178 4,776,178 2,725,000 522,442 3,247,442 - 4,256,500 4,256,500 5,470,000 483,321 5,953,321 18,233,441 2027 - - - 2,335,000 2,428,388 4,763,388 2,805,000 437,003 3,242,003 - 4,256,500 4,256,500 5,655,000 300,246 5,955,246 18,217,137 2028 - - - 2,450,000 2,312,613 4,762,613 2,900,000 348,861 3,248,861 - 4,256,500 4,256,500 5,835,000 102,550 5,937,550 18,205,524 2029 - - - 2,570,000 2,191,138 4,761,138 9,840,000 152,028 9,992,028 - 4,256,500 4,256,500 - - - 19,009,666 2030 - - - 2,695,000 2,063,663 4,758,663 - - - 8,915,000 4,033,625 12,948,625 - - - 17,707,288 2031 - - - 2,825,000 1,930,063 4,755,063 - - - 9,360,000 3,576,750 12,936,750 - - - 17,691,813 2032 - - - 2,960,000 1,787,750 4,747,750 - - - 9,825,000 3,097,125 12,922,125 - - - 17,669,875 2033 - - - 3,110,000 1,636,000 4,746,000 - - - 10,320,000 2,593,500 12,913,500 - - - 17,659,500 2034 - - - 3,265,000 1,476,625 4,741,625 - - - 10,835,000 2,064,625 12,899,625 - - - 17,641,250 2035 - - - 3,425,000 1,309,375 4,734,375 - - - 11,380,000 1,509,250 12,889,250 - - - 17,623,625 2036 - - - 3,600,000 1,133,750 4,733,750 - - - 11,950,000 926,000 12,876,000 - - - 17,609,750 2037 - - - 3,780,000 949,250 4,729,250 - - - 12,545,000 313,625 12,858,625 - - - 17,587,875 2038 - - - 3,965,000 755,625 4,720,625 - - - - - - - - - 4,720,625 2039 - - - 4,165,000 552,375 4,717,375 - - - - - - - - - 4,717,375 2040 - - - 4,375,000 338,875 4,713,875 - - - - - - - - - 4,713,875 2041 - - - 4,590,000 114,750 4,704,750 - - - - - - - - - 4,704,750
$ 3,535,000 $ 88,375 $ 3,623,375 $ 68,630,000 $ 50,276,832 $ 118,906,832 $ 37,945,000 $ 9,590,665 $ 47,535,665 $ 85,130,000 $ 73,449,000 $ 158,579,000 $ 56,755,000 $ 11,326,875 $ 68,081,875 $ 396,726,746
7/1/2027 7/1/2040 7/1/2028 7/1/2036 7/1/2027
Maturity Maturity Maturity Maturity Maturity¹ The bonds are payable from the net revenues of the Authority.
Series 2015B Bonds
Final
Series 2013 Bonds Series 2015A BondsSeries 2007 Bonds
103
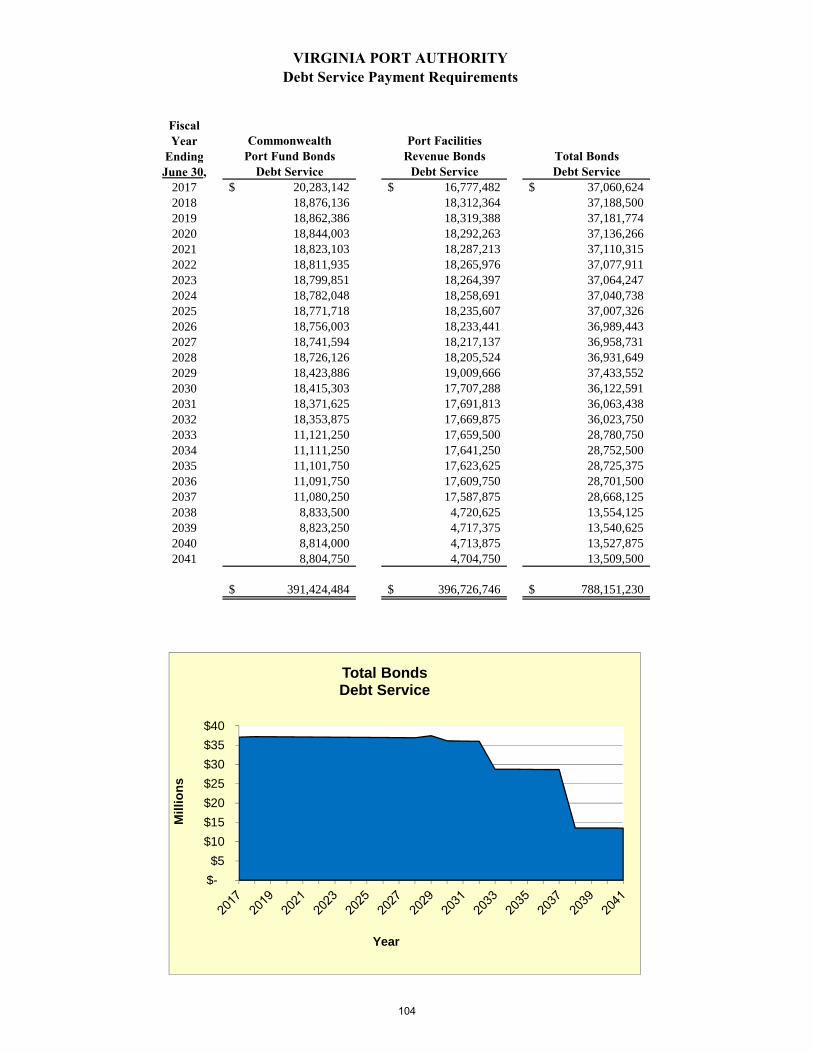
FiscalYear Commonwealth Port Facilities
Ending Port Fund Bonds Revenue Bonds Total BondsJune 30, Debt Service Debt Service Debt Service
2017 20,283,142$ 16,777,482$ 37,060,624$ 2018 18,876,136 18,312,364 37,188,500 2019 18,862,386 18,319,388 37,181,774 2020 18,844,003 18,292,263 37,136,266 2021 18,823,103 18,287,213 37,110,315 2022 18,811,935 18,265,976 37,077,911 2023 18,799,851 18,264,397 37,064,247 2024 18,782,048 18,258,691 37,040,738 2025 18,771,718 18,235,607 37,007,326 2026 18,756,003 18,233,441 36,989,443 2027 18,741,594 18,217,137 36,958,731 2028 18,726,126 18,205,524 36,931,649 2029 18,423,886 19,009,666 37,433,552 2030 18,415,303 17,707,288 36,122,591 2031 18,371,625 17,691,813 36,063,438 2032 18,353,875 17,669,875 36,023,750 2033 11,121,250 17,659,500 28,780,750 2034 11,111,250 17,641,250 28,752,500 2035 11,101,750 17,623,625 28,725,375 2036 11,091,750 17,609,750 28,701,500 2037 11,080,250 17,587,875 28,668,125 2038 8,833,500 4,720,625 13,554,125 2039 8,823,250 4,717,375 13,540,625 2040 8,814,000 4,713,875 13,527,875 2041 8,804,750 4,704,750 13,509,500
391,424,484$ 396,726,746$ 788,151,230$
VIRGINIA PORT AUTHORITYDebt Service Payment Requirements
$-
$5
$10
$15
$20
$25
$30
$35
$40
Mil
lio
ns
Year
Total Bonds Debt Service
104
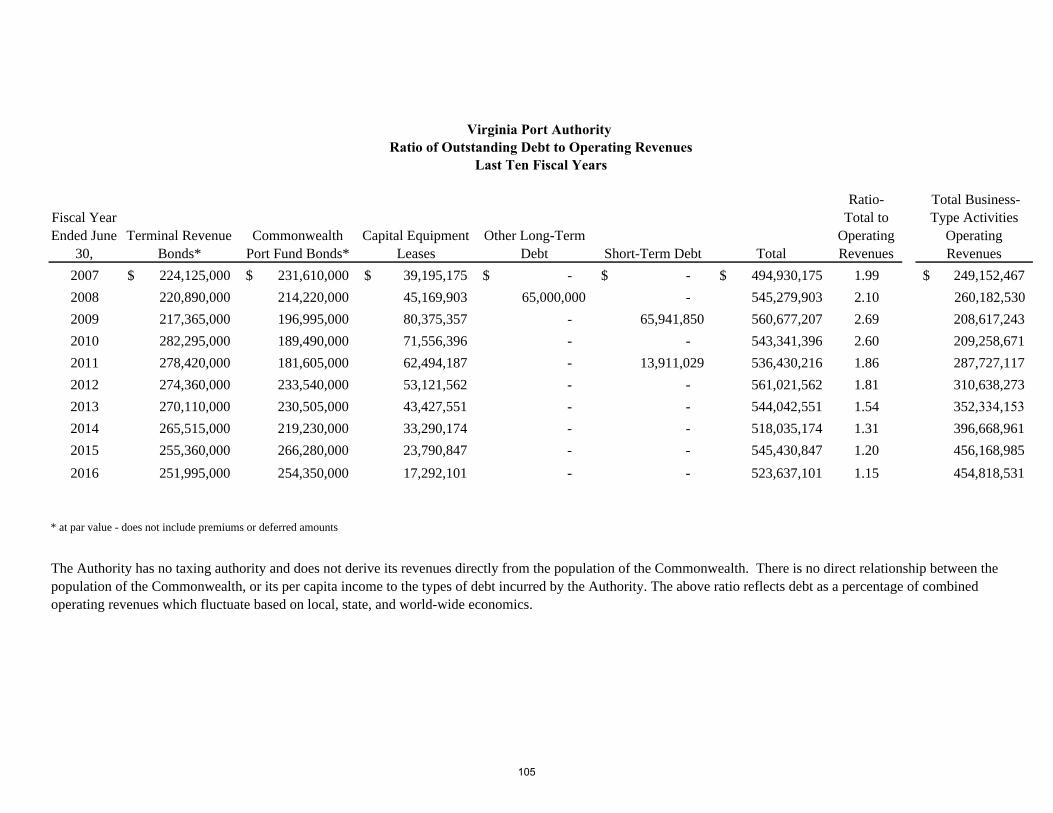
Fiscal Year Ended June
30,Terminal Revenue
Bonds*Commonwealth
Port Fund Bonds*Capital Equipment
LeasesOther Long-Term
Debt Short-Term Debt Total
Ratio- Total to
Operating Revenues
Total Business-Type Activities
Operating Revenues
2007 224,125,000$ 231,610,000$ 39,195,175$ -$ -$ 494,930,175$ 1.99 249,152,467$
2008 220,890,000 214,220,000 45,169,903 65,000,000 - 545,279,903 2.10 260,182,530
2009 217,365,000 196,995,000 80,375,357 - 65,941,850 560,677,207 2.69 208,617,243
2010 282,295,000 189,490,000 71,556,396 - - 543,341,396 2.60 209,258,671
2011 278,420,000 181,605,000 62,494,187 - 13,911,029 536,430,216 1.86 287,727,117
2012 274,360,000 233,540,000 53,121,562 - - 561,021,562 1.81 310,638,273
2013 270,110,000 230,505,000 43,427,551 - - 544,042,551 1.54 352,334,1532014 265,515,000 219,230,000 33,290,174 - - 518,035,174 1.31 396,668,961
2015 255,360,000 266,280,000 23,790,847 - - 545,430,847 1.20 456,168,985
2016 251,995,000 254,350,000 17,292,101 - - 523,637,101 1.15 454,818,531
* at par value - does not include premiums or deferred amounts
Virginia Port Authority Ratio of Outstanding Debt to Operating Revenues
Last Ten Fiscal Years
The Authority has no taxing authority and does not derive its revenues directly from the population of the Commonwealth. There is no direct relationship between the population of the Commonwealth, or its per capita income to the types of debt incurred by the Authority. The above ratio reflects debt as a percentage of combined operating revenues which fluctuate based on local, state, and world-wide economics.
105

0
100
200
300
400
500
600
224 221 217
282 278 274 270 266 255 252
232 214
197
189 182
234 231
219
266 254
39
45 80
72
62
53 43
33
24
17 $‐
65 ‐ ‐
‐‐ ‐
‐
‐
‐
‐
‐
66
‐
14
‐
‐
‐
‐
‐
Millions $
FISCAL YEAR
Short‐Term Debt Other Long‐Term Debt Capital Equipment Leases Commonwealth Port Fund Bonds* Terminal Revenue Bonds*
Virginia Port Authority Outstanding Debt by Type
* at par value ‐ does not include premiums or deferred amounts
$
106

VIRGINIA PORT AUTHORITY AND COMPONENT UNIT VITOPERATING RESULTS AND DEBT SERVICE COVERAGECASH BASISFor the Fiscal Years 2007-2016
Actual ActualFY 2007 FY 2008 FY 2009 FY 2010 FY2011 FY2012 FY2013 FY2014 FY2015 FY2016
Virginia International Terminals6.89% 7.26% -16.30% -9.43% -6.12% -5.10% 2.51% -5.20%
VIT Gross Receipts (plus Interest) 238,319,892$ 255,622,375$ 213,953,605$ 193,786,201$ 262,193,694$ 285,172,289$ 319,328,898$ 312,014,454$ 356,486,579$ 420,225,842$
VIT Current Expenses (173,427,457) (185,366,708) (157,368,268) (147,306,627) (178,543,458) (197,617,574) (222,110,006) (223,495,865) (258,033,599) (304,119,912)
5,800,000 - - 2,200,000 (900,000) 1,562,000 - 2,595,997 3,450,564 (4,652,679)VIT Deposits to CEMA (2,862,031) (2,079,126) (7,781,079) (1,815,981) (3,842,153) (4,701,389) (4,635,516) (9,243,097) (7,215,154) (8,689,854)
Fixed Asset Proceeds less expenses pd on behalf of VPA - - - - - 385,738 (768,363) (733,364) (673,155) (335,823)
- VIT Net Revenue 67,830,404 68,176,541 48,804,258 46,863,593 78,908,083 84,801,064 91,815,013 81,138,125 94,015,235 102,427,574
Virginia Port Authority
VPA Gross RevenuesVIT Net Revenue 67,830,404 68,176,541 48,804,258 46,863,593 78,908,083 84,801,064 91,815,013 81,138,125 94,015,235 102,427,574Other Income 4,227,669 6,520,593 4,825,652 9,430,005 6,126,614 6,357,859 8,881,695 6,924,491 7,990,753 25,310,365Interest Income 928,880 796,621 134,182 44,490 73,737 28,359 98,956 9,066 140,228 5,998
Total VPA Gross Revenues 72,986,953 75,493,754 53,764,092 56,338,088 85,108,434 91,187,282 100,795,664 88,071,682 102,146,216 127,743,937
VPA Current Expenses (26,502,895) (27,754,385) (25,071,082) (22,977,885) (55,359,088) (65,269,973) (70,046,960) (72,577,974) (78,801,935) (93,003,181)
VPA Net Revenues 46,484,058 47,739,369 28,693,010 33,360,203 29,749,346 25,917,309 30,748,704 15,493,708 23,344,282 34,740,756
VPA CPF for O & M 5,096,647 3,967,632 3,453,823 4,440,626 5,604,072 4,032,026 3,704,328 4,337,882 3,764,820 4,408,734
Debt Service Coverage
Port Facilities Revenue Bonds Net Debt Service 13,166,322 13,568,697 13,906,715 14,174,477 17,780,512 17,389,491 17,571,928 15,113,582 13,332,637 16,984,789Pledged Net Revenues 49,346,089 49,818,496 36,474,089 35,176,184 33,591,499 30,618,698 35,384,220 24,736,804 30,559,435 43,430,610Pledged Adjusted Net Revenues 54,442,736 53,786,129 39,927,912 39,616,810 39,195,571 34,650,724 39,088,547 29,074,686 34,324,255 47,839,344
Pledged Net Revenue Coverage (1.1x test) 3.75 3.67 2.62 2.48 1.89 1.76 2.01 1.64 2.29 2.56
Pledged Adjusted Net Revenue Coverage (1.35x test) 4.13 3.96 2.87 2.79 2.20 1.99 2.22 1.92 2.57 2.82
VIT Current Expense (CE) Reserve (Deposit)/Withdrawal
107

2.56
2.82
0.00
0.50
1.00
1.50
2.00
2.50
3.00
3.50
4.00
4.50
Pledged NetRevenueCoverage (1.1xtest)
PledgedAdjusted NetRevenueCoverage(1.35x test)
Debt Service Coverage Ratios
FISCAL YEAR
108

Demographic and Economic Information – these schedules give economic information regarding the environment in which the Authority operates.
109

Fast Facts
50‐foot channels and berths
Zero air‐draft restrictions Fully authorized and permitted for future
marine terminal expansion
22 Suez‐class ship‐to‐shore cranes port‐wide
34 percent of cargo arrives and departs the port by rail,
the largest percentage of any U.S. East Coast port
2.5 hours to open sea
2 Class I railroads operating on-dock 16 Midwest and Southeast inland points served by rail
The Port of Virginia℠ and the ship-design logo are service marks owned and used by Virginia Port Authority, and are used by Virginia International Terminals, LLC under license.
110
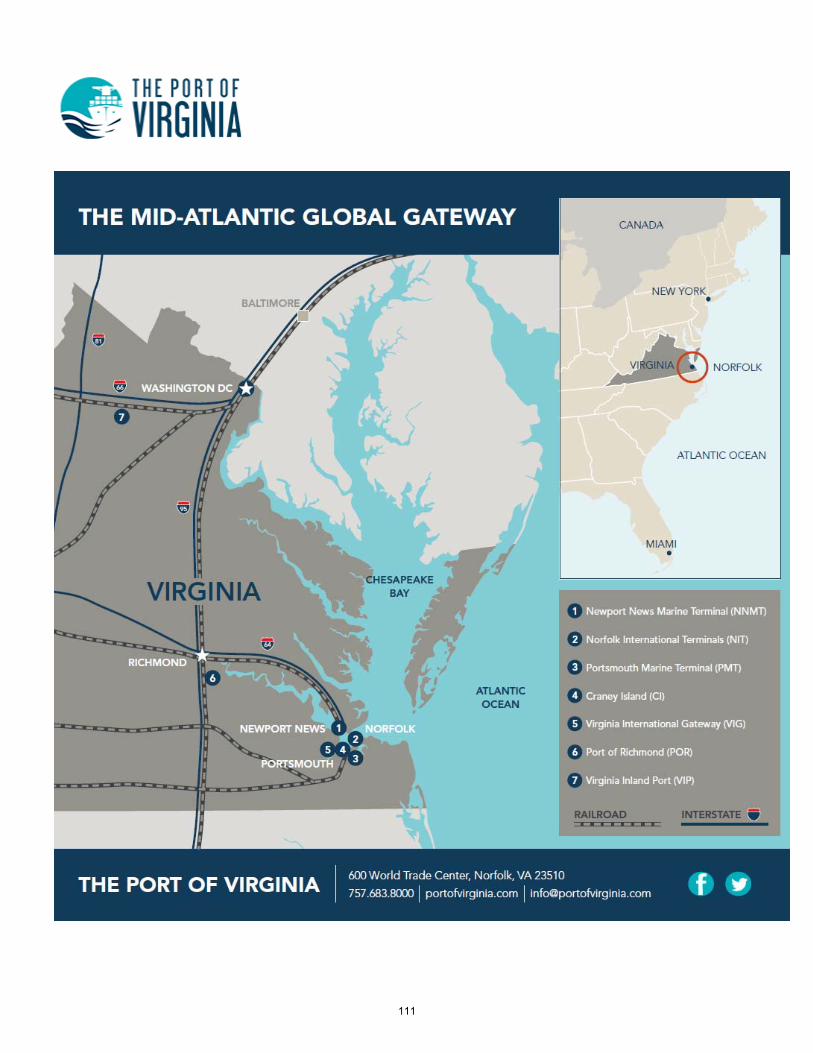
111

0
500,000
1,000,000
1,500,000
2,000,000
2,500,000
3,000,000
2,573,635
Qu
anti
ty
Fiscal Year
Virginia Port AuthorityTwenty-Foot Equivalent Units (TEU's)
TEU is a twenty-foot equivalent unit container
113
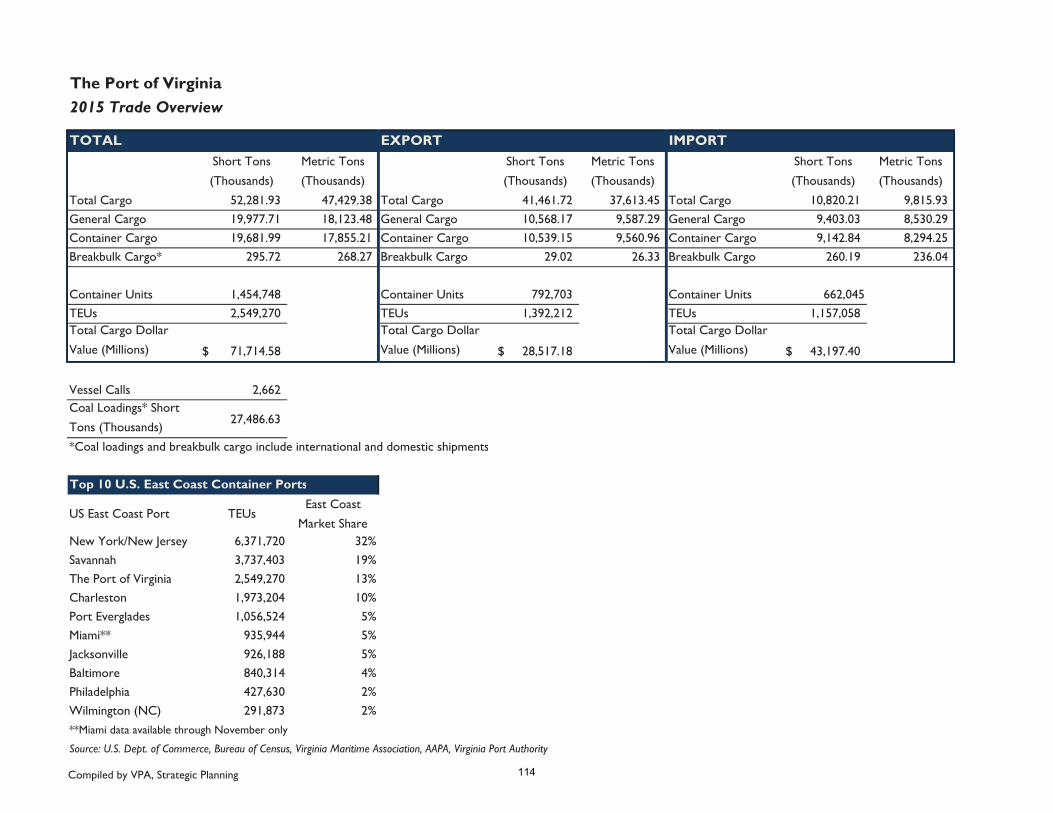
The Port of Virginia2015 Trade Overview
TOTAL EXPORT IMPORTShort Tons
(Thousands)
Metric Tons
(Thousands)
Short Tons
(Thousands)
Metric Tons
(Thousands)
Short Tons
(Thousands)
Metric Tons
(Thousands)
Total Cargo 52,281.93 47,429.38 Total Cargo 41,461.72 37,613.45 Total Cargo 10,820.21 9,815.93 General Cargo 19,977.71 18,123.48 General Cargo 10,568.17 9,587.29 General Cargo 9,403.03 8,530.29 Container Cargo 19,681.99 17,855.21 Container Cargo 10,539.15 9,560.96 Container Cargo 9,142.84 8,294.25 Breakbulk Cargo* 295.72 268.27 Breakbulk Cargo 29.02 26.33 Breakbulk Cargo 260.19 236.04
Container Units 1,454,748 Container Units 792,703 Container Units 662,045TEUs 2,549,270 TEUs 1,392,212 TEUs 1,157,058 Total Cargo Dollar
Value (Millions) 71,714.58$
Total Cargo Dollar
Value (Millions) 28,517.18$
Total Cargo Dollar
Value (Millions) 43,197.40$
Vessel Calls 2,662 Coal Loadings* Short
Tons (Thousands)27,486.63
*Coal loadings and breakbulk cargo include international and domestic shipments
Top 10 U.S. East Coast Container Ports
US East Coast Port TEUsEast Coast
Market ShareNew York/New Jersey 6,371,720 32%Savannah 3,737,403 19%The Port of Virginia 2,549,270 13%Charleston 1,973,204 10%Port Everglades 1,056,524 5%Miami** 935,944 5%Jacksonville 926,188 5%Baltimore 840,314 4%Philadelphia 427,630 2%Wilmington (NC) 291,873 2%**Miami data available through November only
Source: U.S. Dept. of Commerce, Bureau of Census, Virginia Maritime Association, AAPA, Virginia Port Authority
Compiled by VPA, Strategic Planning 114
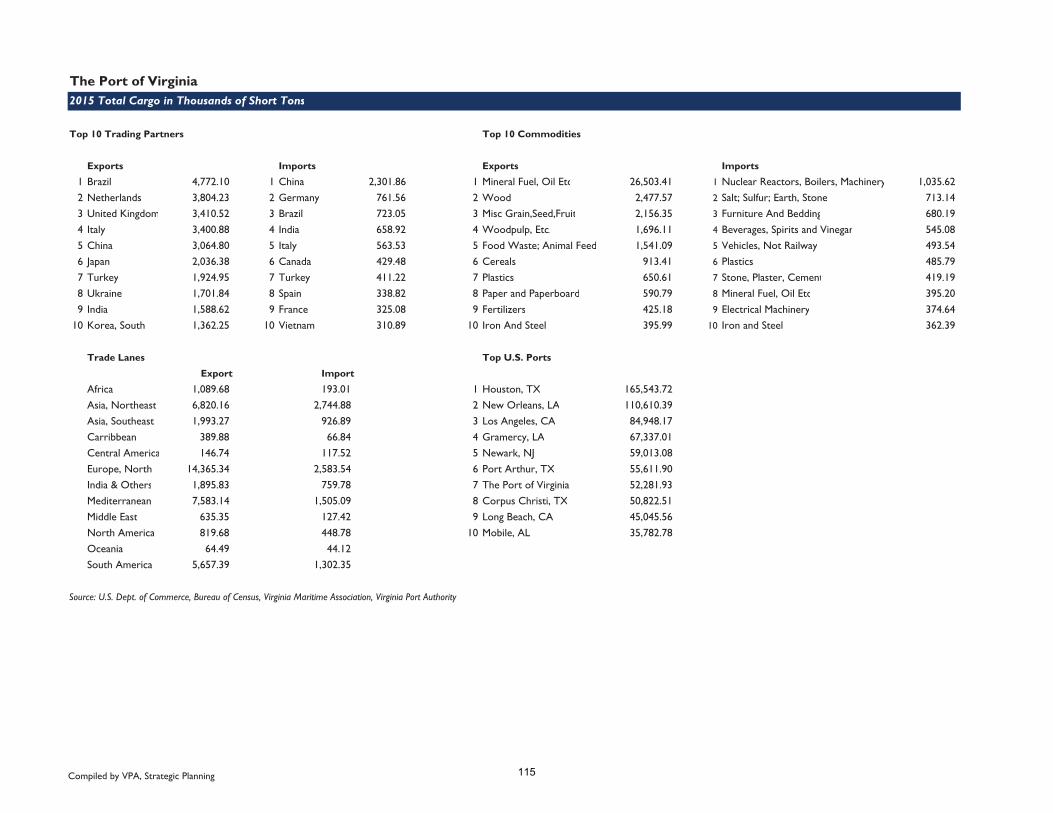
The Port of Virginia
Top 10 Trading Partners Top 10 Commodities
Exports Imports Exports Imports
1 Brazil 4,772.10 1 China 2,301.86 1 Mineral Fuel, Oil Etc 26,503.41 1 Nuclear Reactors, Boilers, Machinery 1,035.62 2 Netherlands 3,804.23 2 Germany 761.56 2 Wood 2,477.57 2 Salt; Sulfur; Earth, Stone 713.14 3 United Kingdom 3,410.52 3 Brazil 723.05 3 Misc Grain,Seed,Fruit 2,156.35 3 Furniture And Bedding 680.19 4 Italy 3,400.88 4 India 658.92 4 Woodpulp, Etc. 1,696.11 4 Beverages, Spirits and Vinegar 545.08 5 China 3,064.80 5 Italy 563.53 5 Food Waste; Animal Feed 1,541.09 5 Vehicles, Not Railway 493.54 6 Japan 2,036.38 6 Canada 429.48 6 Cereals 913.41 6 Plastics 485.79 7 Turkey 1,924.95 7 Turkey 411.22 7 Plastics 650.61 7 Stone, Plaster, Cement 419.19 8 Ukraine 1,701.84 8 Spain 338.82 8 Paper and Paperboard 590.79 8 Mineral Fuel, Oil Etc 395.20 9 India 1,588.62 9 France 325.08 9 Fertilizers 425.18 9 Electrical Machinery 374.64
10 Korea, South 1,362.25 10 Vietnam 310.89 10 Iron And Steel 395.99 10 Iron and Steel 362.39
Trade Lanes Top U.S. Ports
Export Import
Africa 1,089.68 193.01 1 Houston, TX 165,543.72 Asia, Northeast 6,820.16 2,744.88 2 New Orleans, LA 110,610.39 Asia, Southeast 1,993.27 926.89 3 Los Angeles, CA 84,948.17 Carribbean 389.88 66.84 4 Gramercy, LA 67,337.01 Central America 146.74 117.52 5 Newark, NJ 59,013.08 Europe, North 14,365.34 2,583.54 6 Port Arthur, TX 55,611.90 India & Others 1,895.83 759.78 7 The Port of Virginia 52,281.93 Mediterranean 7,583.14 1,505.09 8 Corpus Christi, TX 50,822.51 Middle East 635.35 127.42 9 Long Beach, CA 45,045.56 North America 819.68 448.78 10 Mobile, AL 35,782.78 Oceania 64.49 44.12 South America 5,657.39 1,302.35
Source: U.S. Dept. of Commerce, Bureau of Census, Virginia Maritime Association, Virginia Port Authority
2015 Total Cargo in Thousands of Short Tons
Compiled by VPA, Strategic Planning 115

The Port of Virginia
Top 10 Trading Partners Top 10 Commodities
Exports Imports Exports Imports
1 Brazil 4,329.18 1 China 2,088.21 1 Mineral Fuel, Oil Etc 24,043.49 1 Nuclear Reactors, Boilers, Machinery 939.50 2 Netherlands 3,451.14 2 Germany 690.87 2 Wood 2,247.61 2 Salt; Sulfur; Earth, Stone 646.95 3 United Kingdom 3,093.97 3 Brazil 655.94 3 Misc Grain,Seed,Fruit 1,956.21 3 Furniture And Bedding 617.06 4 Italy 3,085.23 4 India 597.76 4 Woodpulp, Etc. 1,538.69 4 Beverages, Spirits and Vinegar 494.49 5 China 2,780.34 5 Italy 511.23 5 Food Waste; Animal Feed 1,398.05 5 Vehicles, Not Railway 447.73 6 Japan 1,847.37 6 Canada 389.62 6 Cereals 828.63 6 Plastics 440.70 7 Turkey 1,746.29 7 Turkey 373.05 7 Plastics 590.22 7 Stone, Plaster, Cement 380.28 8 Ukraine 1,543.88 8 Spain 307.37 8 Paper and Paperboard 535.95 8 Mineral Fuel, Oil Etc 358.52 9 India 1,441.17 9 France 294.90 9 Fertilizers 385.72 9 Electrical Machinery 339.87
10 Korea, South 1,235.82 10 Vietnam 282.03 10 Iron And Steel 359.24 10 Iron and Steel 328.75
Trade Lanes Top U.S. Ports
Export Import
Africa 988.54 175.09 1 Houston, TX 150,178.78 Asia, Northeast 6,187.15 2,490.11 2 New Orleans, LA 100,344.09 Asia, Southeast 1,808.26 840.86 3 Los Angeles, CA 77,063.70 Carribbean 353.70 60.63 4 Gramercy, LA 61,087.12 Central America 133.12 106.61 5 Newark, NJ 53,535.78 Europe, North 13,032.02 2,343.75 6 Port Arthur, TX 50,450.28 India & Others 1,719.87 689.26 7 The Port of Virginia 47,429.38 Mediterranean 6,879.31 1,365.39 8 Corpus Christi, TX 46,105.42 Middle East 576.38 115.59 9 Long Beach, CA 40,864.66 North America 743.60 407.12 10 Mobile, AL 32,461.60 Oceania 58.51 40.03 South America 5,132.30 1,181.48
Source: U.S. Dept. of Commerce, Bureau of Census, Virginia Maritime Association, Virginia Port Authority
2015 Total Cargo in Thousands of Metric Tons
Compiled by VPA, Strategic Planning 116

The Port of Virginia
Top 10 Trading Partners Top 10 Commodities
Exports Imports Exports Imports1 China 2,863.84 1 China 10,841.22 1 Nuclear Reactors, Boilers, Machinery 4,473.79 1 Nuclear Reactors, Boilers, Machinery 10,047.93 2 Belgium 1,946.62 2 Germany 4,269.31 2 Plastics 2,120.35 2 Electrical Machinery 3,279.70 3 Germany 1,911.45 3 India 2,598.61 3 Pharmaceutical Products 1,591.99 3 Vehicles, Not Railway 2,908.27 4 United Kingdom 1,711.14 4 Italy 2,463.02 4 Vehicles, Not Railway 1,407.92 4 Furniture And Bedding 2,235.29 5 Brazil 1,643.89 5 Japan 1,800.65 5 Organic Chemicals 1,361.54 5 Apparel, Knitted or Crocheted 1,713.12 6 Netherlands 1,463.44 6 Brazil 1,787.81 6 Electrical Machinery 1,080.18 6 Pharmaceutical Products 1,599.55 7 Saudi Arabia 1,044.51 7 United Kingdom 1,524.20 7 Misc. Chemical Products 1,067.14 7 Plastics 1,597.26 8 Japan 1,026.94 8 Vietnam 1,422.29 8 Tobacco 1,050.20 8 Apparel, Not Knitted or Crocheted 1,261.38 9 India 992.41 9 Indonesia 1,404.91 9 Optic, Photo, Etc, Medic or Surgical Instruments 1,042.53 9 Toys, Games, Sports Equipment 1,180.14
10 Korea, South 718.66 10 Malaysia 1,328.34 10 Misc. Grain, Seed, Fruit 871.77 10 Beverages, Spirits and Vinegar 1,151.10
Trade Lanes Top U.S. PortsExport Import
Africa 1,809.73 461.76 1 Los Angeles, CA 269,754.95 Asia, Northeast 5,187.87 13,650.94 2 Newark, NJ 153,600.14 Asia, Southeast 2,073.15 5,358.58 3 Houston, TX 136,029.73 Carribbean 244.75 26.72 4 Long Beach, CA 90,291.73 Central America 322.65 464.58 5 Savannah, GA 87,321.12 Europe, North 10,426.77 12,065.83 6 Charleston, SC 75,797.23 India & Others 1,342.41 3,063.19 7 The Port of Virginia 71,714.58 Mediterranean 1,697.44 4,998.80 8 Tacoma, WA 52,139.98 Middle East 2,344.41 485.98 9 Baltimore, MD 51,119.84 North America 79.69 117.11 10 New York, NY 47,304.39 Oceania 324.45 77.93 South America 2,661.98 2,425.96
Source: U.S. Dept. of Commerce, Bureau of Census, Virginia Maritime Association, Virginia Port Authority
2015 Total Cargo in Millions of U.S. Dollars
Compiled by VPA, Strategic Planning 117
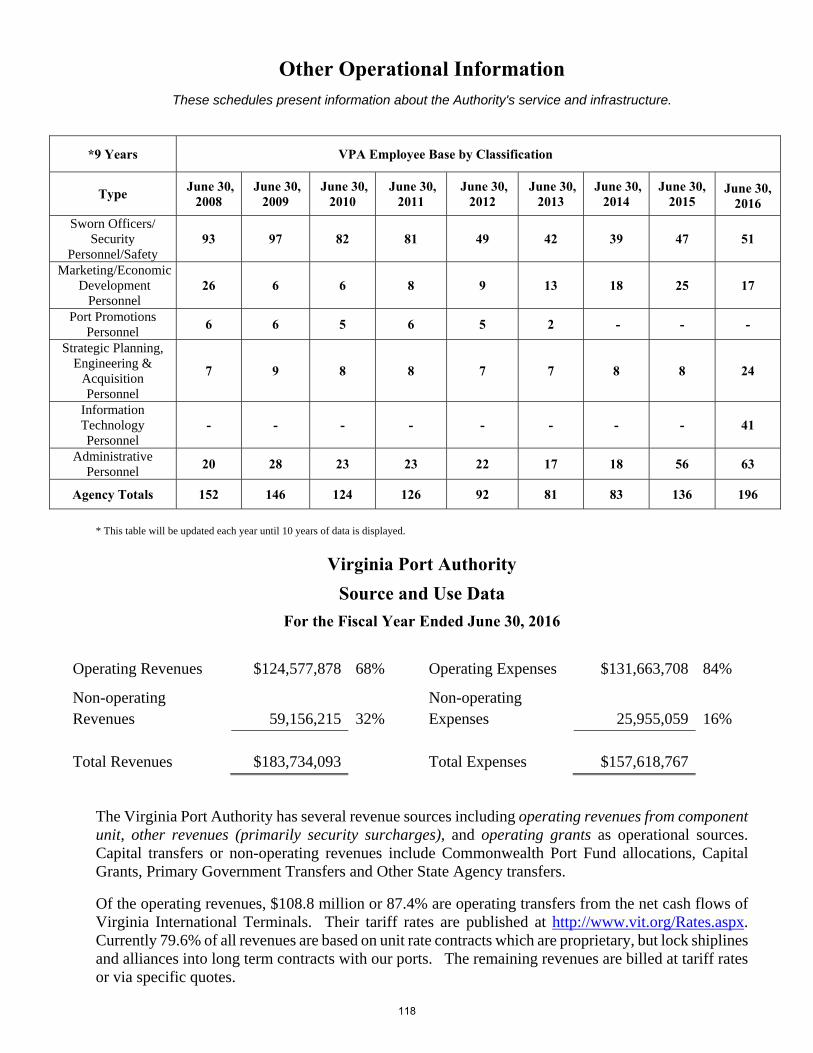
Other Operational Information These schedules present information about the Authority's service and infrastructure.
*9 Years VPA Employee Base by Classification
Type June 30, 2008
June 30, 2009
June 30, 2010
June 30, 2011
June 30, 2012
June 30, 2013
June 30, 2014
June 30, 2015
June 30, 2016
Sworn Officers/ Security
Personnel/Safety 93 97 82 81 49 42 39 47 51
Marketing/Economic Development
Personnel 26 6 6 8 9 13 18 25 17
Port Promotions Personnel
6 6 5 6 5 2 - - -
Strategic Planning, Engineering &
Acquisition Personnel
7 9 8 8 7 7 8 8 24
Information Technology Personnel
- - - - - - - - 41
Administrative Personnel
20 28 23 23 22 17 18 56 63
Agency Totals 152 146 124 126 92 81 83 136 196
* This table will be updated each year until 10 years of data is displayed.
Virginia Port Authority Source and Use Data
For the Fiscal Year Ended June 30, 2016
Operating Revenues $124,577,878 68% Operating Expenses $131,663,708 84%
Non-operating Revenues 59,156,215 32%
Non-operating Expenses 25,955,059 16%
Total Revenues $183,734,093 Total Expenses $157,618,767
The Virginia Port Authority has several revenue sources including operating revenues from component unit, other revenues (primarily security surcharges), and operating grants as operational sources. Capital transfers or non-operating revenues include Commonwealth Port Fund allocations, Capital Grants, Primary Government Transfers and Other State Agency transfers.
Of the operating revenues, $108.8 million or 87.4% are operating transfers from the net cash flows of Virginia International Terminals. Their tariff rates are published at http://www.vit.org/Rates.aspx. Currently 79.6% of all revenues are based on unit rate contracts which are proprietary, but lock shiplines and alliances into long term contracts with our ports. The remaining revenues are billed at tariff rates or via specific quotes.
118
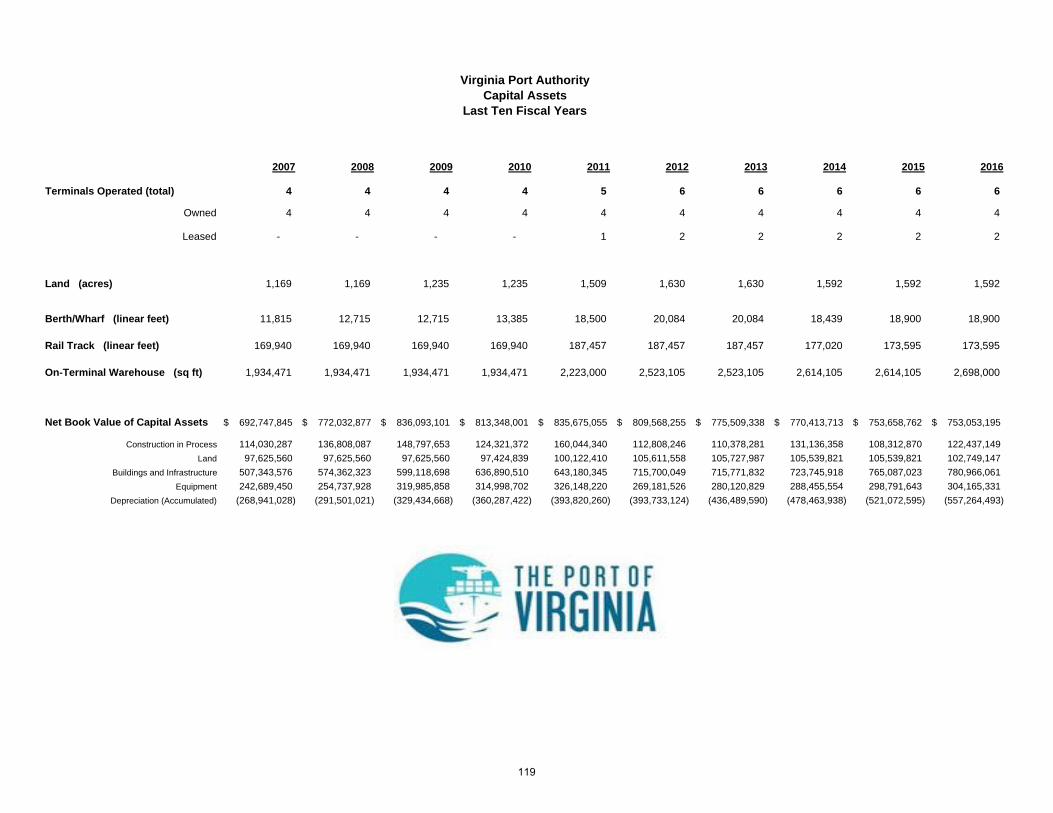
2007 2008 2009 2010 2011 2012 2013 2014 2015 2016
Terminals Operated (total) 4 4 4 4 5 6 6 6 6 6
Owned 4 4 4 4 4 4 4 4 4 4
Leased - - - - 1 2 2 2 2 2
Land (acres) 1,169 1,169 1,235 1,235 1,509 1,630 1,630 1,592 1,592 1,592
Berth/Wharf (linear feet) 11,815 12,715 12,715 13,385 18,500 20,084 20,084 18,439 18,900 18,900
Rail Track (linear feet) 169,940 169,940 169,940 169,940 187,457 187,457 187,457 177,020 173,595 173,595
On-Terminal Warehouse (sq ft) 1,934,471 1,934,471 1,934,471 1,934,471 2,223,000 2,523,105 2,523,105 2,614,105 2,614,105 2,698,000
Net Book Value of Capital Assets 692,747,845$ 772,032,877$ 836,093,101$ 813,348,001$ 835,675,055$ 809,568,255$ 775,509,338$ 770,413,713$ 753,658,762$ 753,053,195$
Construction in Process 114,030,287 136,808,087 148,797,653 124,321,372 160,044,340 112,808,246 110,378,281 131,136,358 108,312,870 122,437,149
Land 97,625,560 97,625,560 97,625,560 97,424,839 100,122,410 105,611,558 105,727,987 105,539,821 105,539,821 102,749,147
Buildings and Infrastructure 507,343,576 574,362,323 599,118,698 636,890,510 643,180,345 715,700,049 715,771,832 723,745,918 765,087,023 780,966,061
Equipment 242,689,450 254,737,928 319,985,858 314,998,702 326,148,220 269,181,526 280,120,829 288,455,554 298,791,643 304,165,331
Depreciation (Accumulated) (268,941,028) (291,501,021) (329,434,668) (360,287,422) (393,820,260) (393,733,124) (436,489,590) (478,463,938) (521,072,595) (557,264,493)
Virginia Port AuthorityCapital Assets
Last Ten Fiscal Years
119
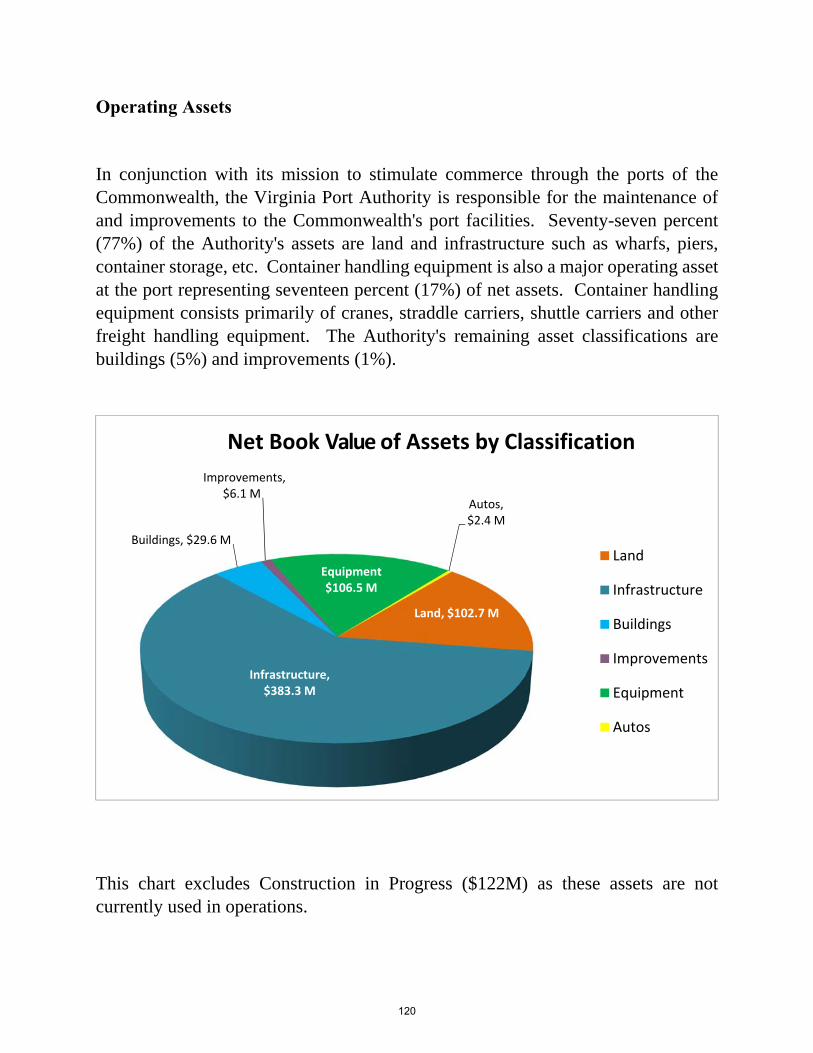
Operating Assets
In conjunction with its mission to stimulate commerce through the ports of the Commonwealth, the Virginia Port Authority is responsible for the maintenance of and improvements to the Commonwealth's port facilities. Seventy-seven percent (77%) of the Authority's assets are land and infrastructure such as wharfs, piers, container storage, etc. Container handling equipment is also a major operating asset at the port representing seventeen percent (17%) of net assets. Container handling equipment consists primarily of cranes, straddle carriers, shuttle carriers and other freight handling equipment. The Authority's remaining asset classifications are buildings (5%) and improvements (1%).
This chart excludes Construction in Progress ($122M) as these assets are not currently used in operations.
Land, $102.7 M
Infrastructure, $383.3 M
Buildings, $29.6 M
Net Book Value of Assets by Classification Improvements,
$6.1 M
Equipment $106.5 M
Autos,$2.4 M
Land
Infrastructure
Buildings
Improvements
Equipment
Autos
120

2007 Restated(1) 2008 Restated(1) 2009 Restated(1) 2010 Restated(1) 2011 Restated(1) 2012 Restated(1) 2013 Restated(1) 2014 Restated(1) 2015 2016Operating Revenues: Terminal operating revenues 244,205,984$ 254,132,812$ 203,909,927$ 203,485,054$ 277,856,791$ 297,835,649$ 339,460,135$ 383,714,148$ 440,841,866$ 439,087,836$ Other revenues 4,946,483 6,049,718 4,707,316 4,742,848 6,274,000 6,519,292 7,970,579 7,762,729 9,147,626 9,339,787 Operating revenues - grants - - - 1,030,769 3,596,326 6,283,332 4,903,439 5,192,084 6,179,493 6,390,908 Total operating revenues 249,152,467 260,182,530 208,617,243 209,258,671 287,727,117 310,638,273 352,334,153 396,668,961 456,168,985 454,818,531
Operating Expenses: Terminal operations 115,428,213 120,459,517 99,327,311 91,215,794 121,983,405 128,782,659 153,682,077 176,243,834 198,126,233 191,655,822 Terminal maintenance 46,495,513 53,257,263 45,593,108 44,018,197 54,745,598 54,936,881 70,958,589 92,160,744 92,737,533 95,361,699 General and administrative 38,398,898 41,301,275 40,210,132 43,951,276 47,905,140 51,903,912 43,556,452 46,063,032 49,318,501 59,703,412 Facility rental - - - - 32,538,640 37,063,827 47,229,466 52,479,613 55,679,447 55,618,729
Depreciation and amortization 38,181,505 40,661,311 44,152,797 48,710,646 50,630,851 49,271,899 47,979,055 46,612,042 46,693,840 47,723,393Total operating expenses 238,504,129 255,679,366 229,283,348 227,895,913 307,803,634 321,959,178 363,405,639 413,559,265 442,555,554 450,063,055
Operating income (loss) 10,648,338 4,503,164 (20,666,105) (18,637,242) (20,076,517) (11,320,905) (11,071,486) (16,890,304) 13,613,431 4,755,476
Non-operating revenues (expenses) Interest income 8,732,891 6,035,464 2,684,532 1,507,788 1,181,739 1,510,827 333,654 555,518 459,132 722,930
Interest expense, net of amounts capitalized (17,645,103) (16,613,369) (17,163,304) (15,687,770) (18,984,951) (23,070,738) (20,531,918) (16,888,384) (14,160,492) (18,160,286)
Bond issue costs (921,160) (678,876) (20,000) (694,650) (538,986) (734,427) (917,063) (69,000) (1,024,231) (489,036)
Revenues (expenses) VEDP, net - - - - - - - - - 1,690,873
Commonwealth Rail Relocation income (& ARRA) 1,120,000 20,781,163 - - 2,014,416 6,375,798 244,424 - - -
Commonwealth Rail Relocation expenses (1,447,474) (22,102,404) (26,817,021) (8,223,576) (2,272,191) (6,296,498) (394,990) (133,770) - -
Revenues (expenses) other state agencies - 7,388,750 - - - - - - - -
Revenues from federal government 300,787 876,048 16,711,588 6,076,191 12,588,643 4,612,432 3,471,137 626,643 740,452 9,653,436
Revenues (expense) Commonwealth (173,802) 23,948,420 (155,867) (105,427) (261,468) (297,267) (158,628) 306,335 1,324,350 (187,951)
Voluntary non-exchange revenue - - 1,900,000 - - - - - - -
Other income (expense) 166,303 35,590 38,825 7,787 8,996 8,722 - - - 2,744
Gain (loss) on disposals (446,302) (1,017,897) 34,854 (2,093,785) 88,879 (15,266,083) 708,585 2,652 - (1,107,131) Income (loss) before capital
contributions and transfers 334,478 23,156,053 (43,452,498) (37,850,684) (26,251,440) (44,478,139) (28,316,285) (32,490,310) 952,642 (3,118,945)
Capital contributions and transfers Commonwealth Port Fund allocation 36,500,057 36,036,914 32,663,448 32,784,966 34,717,391 36,252,985 37,223,718 36,652,218 38,418,111 42,366,884
Capital contributions (to) from component unit - - - - - - - 11,000 2,665,000 -
Payments to federal government - channel dredging - - - - - - - - - (5,722,955)
Capital contributions (to) from other state agencies - - - - - - - - - 4,789,728
Cumulative effect of changes in accounting principle (2) - - - - - - (4,564,965) 12,207,272 (29,915,563) -
Increase (decrease) in Net Position 36,834,535 59,192,967 (10,789,050) (5,065,718) 8,465,951 (8,225,154) 4,342,468 16,380,180 12,120,190 38,314,712
Net Position - Beginning of Year 371,425,715 408,260,250 467,453,217 456,664,167 451,598,449 460,064,400 451,839,246 456,181,714 472,561,894 484,682,084
Net Position - End of Year 408,260,250$ 467,453,217$ 456,664,167$ 451,598,449$ 460,064,400$ 451,839,246$ 456,181,714$ 472,561,894$ 484,682,084$ 522,996,796$
VIRGINIA PORT AUTHORITY/ VIRGINIA INTERNATIONAL TERMINALS, LLC.Consolidated Statement of Revenues, Expenses and Changes in Net Position
For the Fiscal Years 2007 Through 2016
(2) 2013/2014 VIT adopted GASB pronouncements in lieu of FASB pronouncements in order to conform to the VPA accounting methodology; 2015 VPA/VIT adopted GASB 68 Accounting and Financial Reporting for Pensions-an amendment of GASB Statement No 27
(1) Restatements include the adoption of GASB 65 in 2014 and a prior period adjustment to correct the capitalization of interest costs for periods prior to 2015.
121

2007 Restated 2008 Restated 2009 Restated 2010 Restated 2011 Restated 2012 Restated 2013 Restated 2014 Restated 2015 2016Net Position:
Net Investment in Capital Assets 268,222,604$ 315,716,870$ 319,365,374$ 305,972,237$ 318,020,499$ 290,000,862$ 284,918,598$ 269,881,033$ 284,879,235$ 299,198,470$
Restricted 60,619,827 58,134,695 64,545,940 64,266,192 68,594,913 68,272,355 66,720,529 52,020,379 54,464,665 61,274,859
Unrestricted 79,417,819 93,601,652 72,752,853 81,360,020 73,448,988 93,566,029 104,542,587 150,660,482 145,338,184 162,523,467
Total Net Position 408,260,250$ 467,453,217$ 456,664,167$ 451,598,449$ 460,064,400$ 451,839,246$ 456,181,714$ 472,561,894$ 484,682,084$ 522,996,796$
Net Postion amounts have been restated to reflect the implementation of GASB 68, the restatement of prior years due to the capture of interest costs into capital assets and to conform to current year presentation.
VIRGINIA PORT AUTHORITY/VIRGINIA INTERNATIONAL TERMINALS, LLCConsolidated Net Position by ComponentFor the Fiscal Years 2007 Through 2016
Fiscal Year
$(50)
$50
$150
$250
$350
$450
$550
268
316 319 306 318 290 285 270 285 299
61
58 65 64
69
68 67
52 54
61
79
94 73 81
73 94 105 151
145
163
Millions USD
Fiscal Year
Consolidated Net Position by Component
Unrestricted
Restricted
Net Investmentin CapitalAssets
122


VIRGINIA PORT AUTHORITY
CONTINUING DISCLOSURE AGREEMENT
ANNUAL REPORT (unaudited)
FOR FISCAL YEAR ENDED
JUNE 30, 2016
COMMONWEALTH PORT FUND REVENUE BONDS, SERIES 2011 (non-AMT)
COMMONWEALTH PORT FUND REVENUE REFUNDING BONDS, SERIES 2012 (Taxable)
COMMONWEALTH PORT FUND REVENUE REFUNDING BONDS, SERIES 2012B (Taxable)
COMMONWEALTH PORT FUND REVENUE REFUNDING BONDS, SERIES 2012C (Non-AMT)
COMMONWEALTH PORT FUND REVENUE BONDS, SERIES 2015 (AMT)
BASE CUSIP NUMBER: 928075
123
VIRGINIA PORT AUTHORITY
Continuing Disclosure Agreement Annual Report
For Fiscal Year Ended June 30, 2016
Commonwealth Port Fund Revenue Bonds, Series 2011 (non-AMT)
Commonwealth Port Fund Revenue Refunding Bonds, Series 2012 (Taxable)
Commonwealth Port Fund Revenue Refunding Bonds, Series 2012B (Taxable)
Commonwealth Port Fund Revenue Refunding Bonds, Series 2012C (Non-AMT)
Commonwealth Port Fund Revenue Bonds, Series 2015 (AMT)
Table of Contents
Table 1 Taxes Appropriated to Commonwealth Port Fund
Table 2 Net Transfers to the Commonwealth Port Fund
Table 3 Debt Service Requirements and Coverage
Table 4 Authority Revenues and Expenses
Table 5 Cargo Data
124

TABLE 1 - TAXES APPROPRIATED TO COMMONWEALTH PORT FUND
The General Assembly of the Commonwealth of Virginia (the “Commonwealth”) has appropriated the net additional revenues, from the tax and fee increases enacted pursuant to Chapters 11, 12 and 15 of the Acts of Assembly, 1986 Special Session, in each biennia, to the Commonwealth’s Transportation Trust Fund (the “Transportation Fund”) and directed the Commonwealth’s Transportation Board to allocate 4.2% thereof to the Commonwealth Port Fund (the “Port Fund”).
The following table sets forth the annual collections of the taxes that have been allocated to the Transportation Trust Fund beginning with the fiscal year ended June 30, 2007.
TRANSPORTATION TRUST FUND STATEMENT OF REVENUE COLLECTIONS
FISCAL YEARS 2007 THROUGH 2016
Transportation Trust Fund (in millions)
Fiscal Year 2007 2008 2009 2010 2011 2012 2013 2014 2015 2016
Retail Sales and Use Tax $517.3 $524.9 $499.4 $490.7 $477.3 $503.1 $521.2 $526.6 $590.7 $599.1 Motor Vehicle Sales and Use Tax(1) 215.4 194.3 150.8 162.0 183.6 198.3 201.8 207.4 224.9 237.2 Motor Fuel Taxes(2) 118.0 122.4 116.8 115.0 117.7 115.5 123.7 115.0 118.8 138.8 Motor Vehicle Registration Fees(3) 21.3 21.4 21.6 20.8 21.2 21.2 21.7 21.8 22.0 21.8 Total Transportation Trust Fund
Revenues(4) $872.0 $863.0 $788.6 $788.5 $799.8 $838.1 $868.4 $870.8 $956.4 $996.9
_______________ (1) Motor Vehicle Sales and Use Tax and Motor Vehicle Rental Tax. (2) Motor Fuel Tax, Special Fuel Tax, Aviation Special Fuel Tax and Road Tax. (3) Includes Fines, Penalties and Truck Permits when collected (4) Does not reflect investment income credited to such Fund or any Accelerated Revenue __________________ Source: Commonwealth of Virginia/Department of Accounts and Department of Transportation.
60%24%
14%
2%
Transportation Trust Fund CollectionsFiscal Year 2016
Retail Sales and Use Tax Motor Vehicle Sales and Use Tax
Motor Fuel Taxes Motor Vehicle Registration Fees
125

TABLE 2 - NET TRANSFERS TO THE COMMONWEALTH PORT FUND
The following table shows the allocation of Transportation Trust Fund revenue to the Port Fund, the interest credited to the Port Fund prior to its transfer to the Income Account under the Authority’s Commonwealth Port Fund Revenue Bond Resolution (the “Bond Resolution”) and the expenses charged thereto for the fiscal years 2007 through 2016. The net transfers to the Income Account (“Primary Income”) are pledged to the payment of bonds issued under the Bond Resolution.
Fiscal Year Allocation(1) (+) Interest
Earned(2) (—) Indirect
Expenses(2)
(=) Net Transfers
2007 $36,480,142 $421,590 $48,300 $36,853,432 2008 36,086,327 410,267 48,700 36,477,894 2009 32,966,292 257,621 - 33,223,913 2010 32,716,363 232,650 - 32,949,013 2011 33,450,399 149,292 - 33,599,691 2012 36,101,349 232,501 - 36,333,850 2013 37,200,445 228,015 - 37,428,460 2014 37,340,888 226,124 - 37,567,012 2015 39,640,666 291,495 - 39,932,161 2016 41,481,432 277,242 - 41,758,674
____________________________________________________________________________________________
(1) 4.2% of total Transportation Trust Fund revenues less certain estimated expenses. (2) The allocation to the Port Fund is proportionally (i) assessed the indirect cost recovery charges imposed on the
Transportation Trust Fund by the General Assembly, (ii) credited with the allocable investment income of the Transportation Trust Fund and (iii) charged up to 20 basis points for the services of the Department of the Treasury in managing such investments.
Source: Commonwealth of Virginia/Department of Accounts and Department of Transportation.
0
5
10
15
20
25
30
35
40
45
Mill
ion
s
Fiscal Year
Commonwealth Port Fund Net Transfers
126
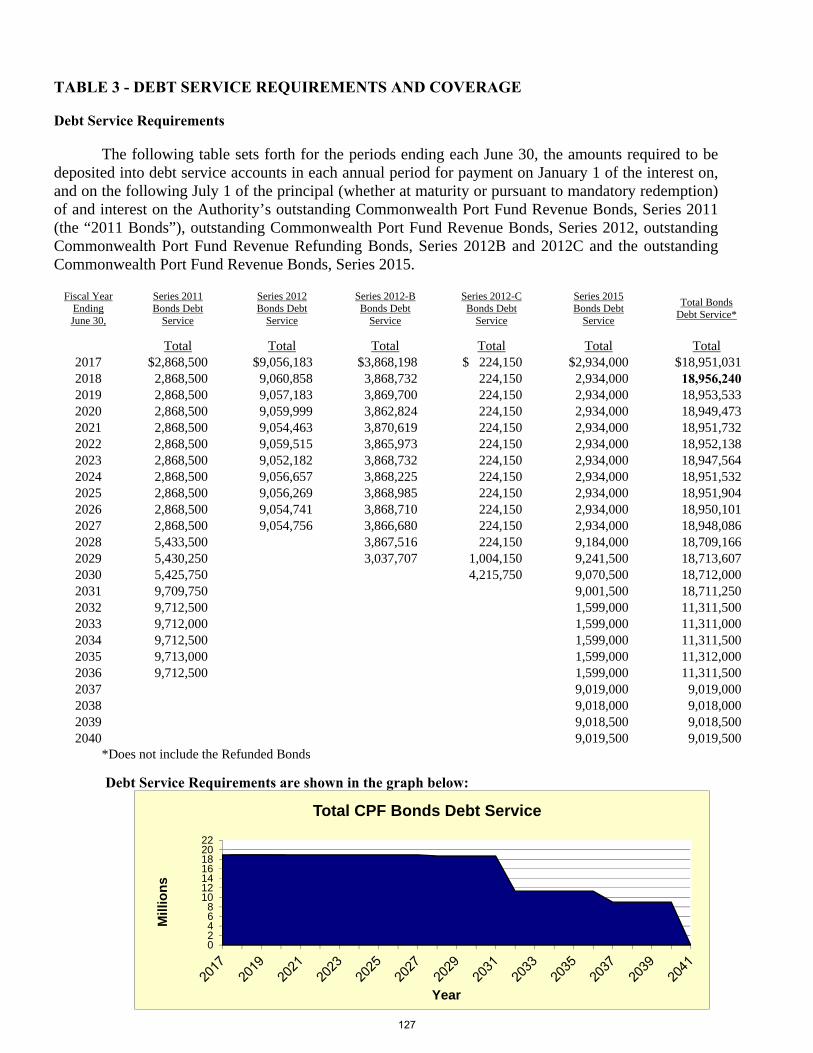
TABLE 3 - DEBT SERVICE REQUIREMENTS AND COVERAGE
Debt Service Requirements
The following table sets forth for the periods ending each June 30, the amounts required to be deposited into debt service accounts in each annual period for payment on January 1 of the interest on, and on the following July 1 of the principal (whether at maturity or pursuant to mandatory redemption) of and interest on the Authority’s outstanding Commonwealth Port Fund Revenue Bonds, Series 2011 (the “2011 Bonds”), outstanding Commonwealth Port Fund Revenue Bonds, Series 2012, outstanding Commonwealth Port Fund Revenue Refunding Bonds, Series 2012B and 2012C and the outstanding Commonwealth Port Fund Revenue Bonds, Series 2015.
Fiscal Year Ending June 30,
Series 2011 Bonds Debt
Service
Series 2012 Bonds Debt
Service
Series 2012-B Bonds Debt
Service
Series 2012-C Bonds Debt
Service
Series 2015 Bonds Debt
Service
Total Bonds Debt Service*
Total Total Total Total Total Total 2017 $2,868,500 $9,056,183 $3,868,198 $ 224,150 $2,934,000 $18,951,031 2018 2,868,500 9,060,858 3,868,732 224,150 2,934,000 18,956,240 2019 2,868,500 9,057,183 3,869,700 224,150 2,934,000 18,953,533 2020 2,868,500 9,059,999 3,862,824 224,150 2,934,000 18,949,473 2021 2,868,500 9,054,463 3,870,619 224,150 2,934,000 18,951,732 2022 2,868,500 9,059,515 3,865,973 224,150 2,934,000 18,952,138 2023 2,868,500 9,052,182 3,868,732 224,150 2,934,000 18,947,564 2024 2,868,500 9,056,657 3,868,225 224,150 2,934,000 18,951,532 2025 2,868,500 9,056,269 3,868,985 224,150 2,934,000 18,951,904 2026 2,868,500 9,054,741 3,868,710 224,150 2,934,000 18,950,101 2027 2,868,500 9,054,756 3,866,680 224,150 2,934,000 18,948,086 2028 5,433,500 3,867,516 224,150 9,184,000 18,709,166 2029 5,430,250 3,037,707 1,004,150 9,241,500 18,713,607 2030 5,425,750 4,215,750 9,070,500 18,712,000 2031 9,709,750 9,001,500 18,711,250 2032 9,712,500 1,599,000 11,311,500 2033 9,712,000 1,599,000 11,311,000 2034 9,712,500 1,599,000 11,311,500 2035 9,713,000 1,599,000 11,312,000 2036 9,712,500 1,599,000 11,311,500 2037 9,019,000 9,019,000 2038 9,018,000 9,018,000 2039 9,018,500 9,018,500 2040 9,019,500 9,019,500
*Does not include the Refunded Bonds
Debt Service Requirements are shown in the graph below:
02468
10121416182022
Mill
ion
s
Year
Total CPF Bonds Debt Service
127

TABLE 3 - DEBT SERVICE REQUIREMENTS AND COVERAGE - continued
Debt Service Coverage
Coverage of maximum annual debt service on the 2011, 2012 and 2015 Bonds by Commonwealth Port Fund Primary Income for the fiscal year ended June 30, 2016 is shown below:
Commonwealth Port Fund Primary Income for the fiscal year ended June 30, 2016 ....................................................................................... $41,758,674
Maximum Annual Debt Service (FY 2018) .................................................... $18,956,240
Pro Forma Maximum Annual Debt Service Coverage ................................................... 2.20
1.00
1.20
1.40
1.60
1.80
2.00
2007 2008 2009 2010 2011 2012 2013 2014 2015 2016
1.26
1.29
1.89
1.87
1.64
1.88
1.92 1.96 1.95
2.20
Rat
io
Fiscal Year
Maximum Annual Debt Service Coverage
128

TABLE 4 - AUTHORITY REVENUES AND EXPENSES
VIRGINIA PORT AUTHORITY FIVE-YEAR SCHEDULE OF REVENUES AND EXPENSES
(Cash Basis)
Fiscal Year 2012 2013 2014 2015 2016
Special Fund $91,187,281 $101,471,234 $88,460,520 $104,269,515 $127,743,936 Commonwealth Port Fund 39,567,591 36,407,247 39,731,544 38,717,385 41,481,608 General Fund and Other 16,308,868 9,900,445 2,201,158 3,975,966 11,730,181
Total Revenues 147,063,740 147,778,926 130,393,222 146,962,866 180,955,725
Expenses Economic Development Services: National & International Trade Services
3,968,242 3,439,495 2,809,353 3,752,130 3,453,741
Commerce Advertising 559,698 469,076 319,643 415,028 352,525
Port Facilities Planning, Maintenance, Acquisition & Construction: Maintenance and Operation of Port Facilities
19,799,331 9,773,168 7,953,557 8,929,426 11,073,508
Port Facilities Planning 1,010,574 1,127,590 1,641 - (118) Debt Service for Port Facilities 49,920,920 52,319,515 35,902,767 46,656,033 41,141,983
Financial Assistance for Port Activities: Agency Service Fee - 94 160 193 - Aid to Local Ports 1,101,807 720,869 390,189 877,113 1,684,863 Payment in Lieu of Taxes 1,094,329 1,138,819 1,524,353 960,345 1,118,955
Administration & Support Services: General Management & Direction 6,824,650 6,492,465 6,739,974 8,736,079 20,203,715 Facility Rental 39,786,987 46,780,747 52,224,628 56,383,151 55,525,236 Security Services 14,280,805 13,188,697 8,317,511 8,908,378 9,236,985
Total Operating Expenditures 138,347,343 135,450,535 116,183,776 135,617,876 143,791,393
Funds Available for Capital Projects
$ 8,716,397 $ 12,328,391 $ 14,209,446 $ 11,344,990 $37,164,332
129

TABLE 5 - CARGO DATA
The Authority’s ports handle a variety of general cargo. Bulk cargo, such as petroleum products, grain and coal, is not handled at the Port Facilities but is handled at facilities owned by railroads and other private operators. Set forth below are the major categories of general cargo handled by the Port Facilities based on the top 5 leading import and export commodities for the most recent calendar year.
Leading Exported and Imported General Cargo Commodities* (Calendar Year)
(Short Tons)
2011 2012 2013 2014 2015Exports
Paper and Paperboard 925,574 1,070,721 1,069,168 976,840 901,543Wood Pulp 545,493 699,825 843,103 864,696 758,466Logs and Lumber 511,124 584,624 638,178 770,646 852,913Soybeans and Products 311,957 508,371 813,475 758,695 844,039Pet and Animal Feeds 207,270 215,322 289,134 390,139 502,409
Imports Furniture 397,934 479,352 524,312 551,034 583,881Auto Parts 366,673 479,586 471,108 511,662 487,757Paper and Paperboard 175,400 219,207 194,110 219,032 202,032Metal ware 140,692 202,859 222,982 241,527 297,466Plastic Products 201,062 207,873 254,282 287,536 274,003
* This table includes both import and export data for all facilities that comprise the Port of Virginia, some of which are not ownedor operated by the Authority. The Authority believes that the VPA Facilities handle in excess of 95% of the general cargotransported through the Port of Virginia.
Source: Port Import Export Reporting Service
130
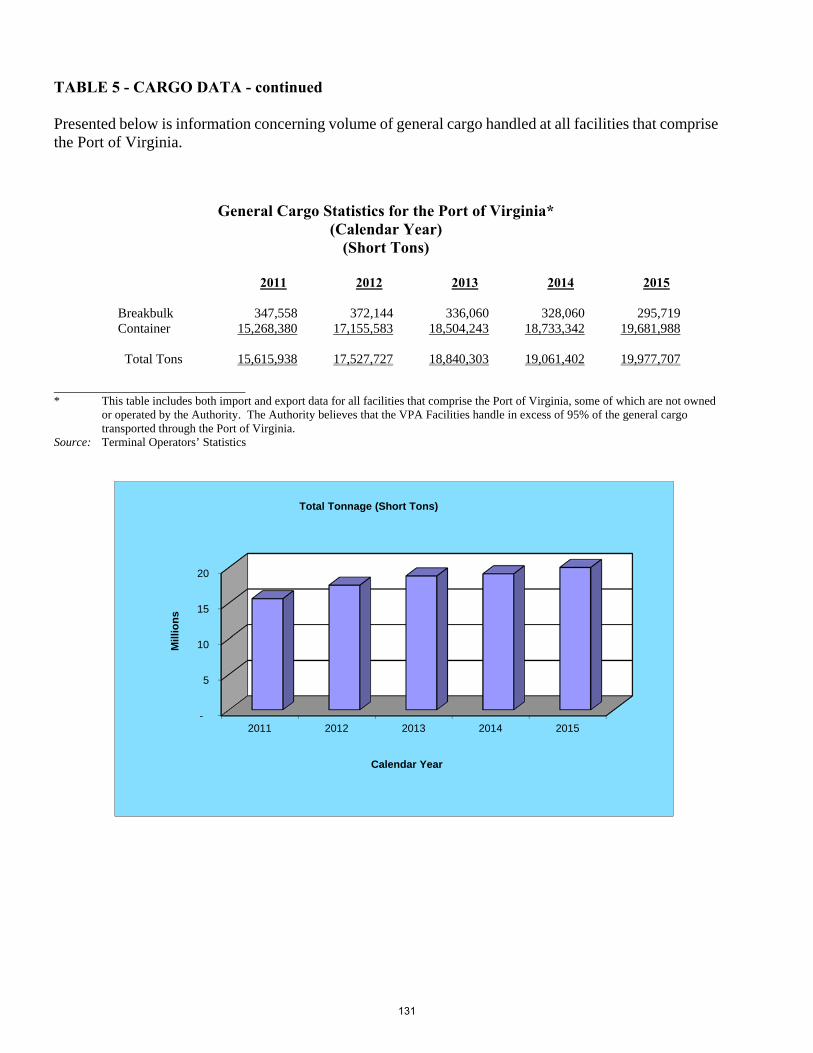
TABLE 5 - CARGO DATA - continued
Presented below is information concerning volume of general cargo handled at all facilities that comprise the Port of Virginia.
General Cargo Statistics for the Port of Virginia* (Calendar Year)
(Short Tons)
2011 2012 2013 2014 2015
Breakbulk 347,558 372,144 336,060 328,060 295,719 Container 15,268,380 17,155,583 18,504,243 18,733,342 19,681,988
Total Tons 15,615,938 17,527,727 18,840,303 19,061,402 19,977,707
* This table includes both import and export data for all facilities that comprise the Port of Virginia, some of which are not ownedor operated by the Authority. The Authority believes that the VPA Facilities handle in excess of 95% of the general cargotransported through the Port of Virginia.
Source: Terminal Operators’ Statistics
-
5
10
15
20
2011 2012 2013 2014 2015
Mill
ion
s
Calendar Year
Total Tonnage (Short Tons)
131
VIRGINIA PORT AUTHORITY
CONTINUING DISCLOSURE AGREEMENT
ANNUAL REPORT (unaudited)
FOR FISCAL YEAR ENDED
JUNE 30, 2016
PORT FACILITIES REVENUE REFUNDING BONDS, SERIES 2010
PORT FACILITIES REVENUE REFUNDING BONDS, SERIES 2013
PORT FACILITIES REVENUE REFUNDING BONDS, SERIES 2015A
PORT FACILITIES REVENUE REFUNDING BONDS, SERIES 2015B
BASE CUSIP NUMBER: 928077
132
VIRGINIA PORT AUTHORITY
Continuing Disclosure Agreement Annual Report
For Fiscal Year Ended June 30, 2016
Port Facilities Revenue Refunding Bonds, Series 2010 Port Facilities Revenue Refunding Bonds, Series 2013
Port Facilities Revenue Refunding Bonds, Series 2015A Port Facilities Revenue Refunding Bonds, Series 2015B
Table of Contents
Table 1 Authority Revenues and Expenses
Table 2 VIT Revenues and Expenses
Table 3 Operating Results and Debt Service Coverage
Table 4 Debt Service Requirements
Table 5 Cargo Data
133

TABLE 1 - AUTHORITY REVENUES AND EXPENSES
VIRGINIA PORT AUTHORITY FIVE-YEAR SCHEDULE OF REVENUES AND EXPENSES
(Cash Basis)
Fiscal Year 2012 2013 2014 2015 2016
Special Fund $91,187,281 $101,471,234 $88,460,520 $104,269,515 $127,743,936 Commonwealth Port Fund 39,567,591 36,407,247 39,731,544 38,717,385 41,481,608 General Fund and Other 16,308,868 9,900,445 2,201,158 3,975,966 11,730,181
Total Revenues 147,063,740 147,778,926 130,393,222 146,962,866 180,955,725
Expenses Economic Development Services: National & International Trade Services
3,968,242 3,439,495 2,809,353 3,752,130 3,453,741
Commerce Advertising 559,698 469,076 319,643 415,028 352,525
Port Facilities Planning, Maintenance, Acquisition & Construction: Maintenance and Operation of Port Facilities
19,799,331 9,773,168 7,953,557 8,929,426 11,073,508
Port Facilities Planning 1,010,574 1,127,590 1,641 - (118) Debt Service for Port Facilities 49,920,920 52,319,515 35,902,767 46,656,033 41,141,983
Financial Assistance for Port Activities: Agency Service Fee - 94 160 193 - Aid to Local Ports 1,101,807 720,869 390,189 877,113 1,684,863 Payment in Lieu of Taxes 1,094,329 1,138,819 1,524,353 960,345 1,118,955
Administration & Support Services: General Management & Direction 6,824,650 6,492,465 6,739,974 8,736,079 20,203,715 Facility Rental 39,786,987 46,780,747 52,224,628 56,383,151 55,525,236 Security Services 14,280,805 13,188,697 8,317,511 8,908,378 9,236,985
Total Operating Expenditures 138,347,343 135,450,535 116,183,776 135,617,876 143,791,393
Funds Available for Capital Projects
$ 8,716,397 $ 12,328,391 $ 14,209,446 $ 11,344,990 $37,164,332
134
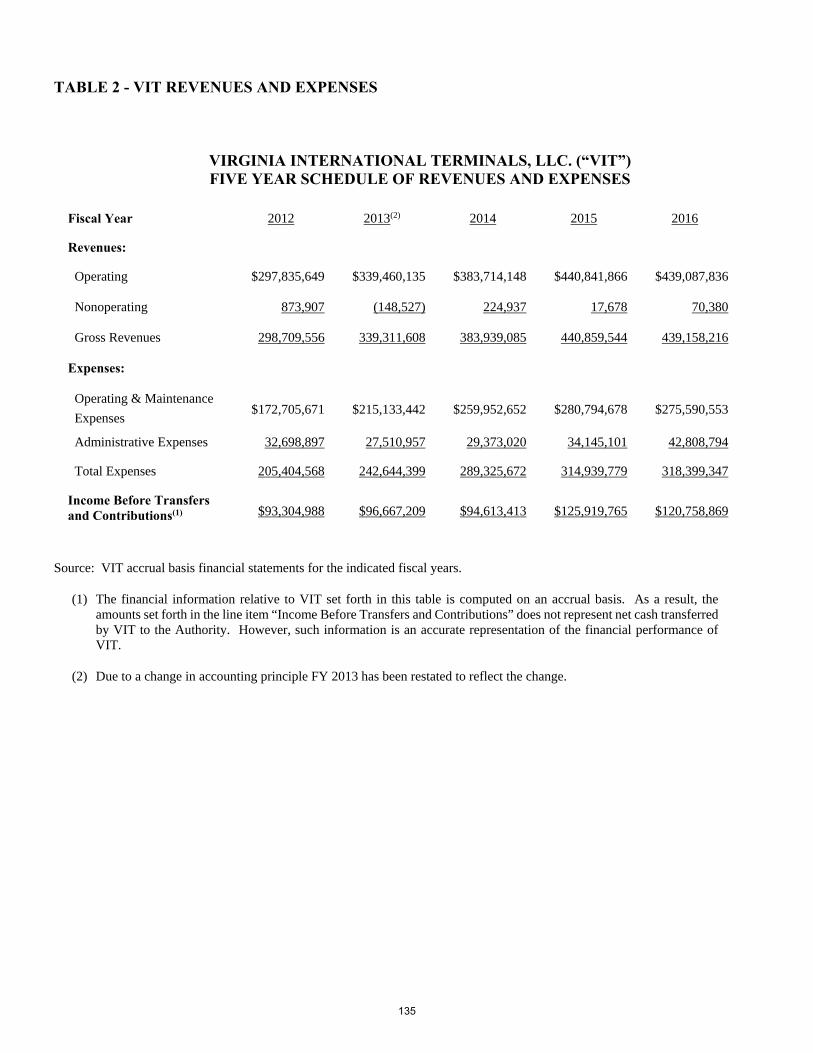
TABLE 2 - VIT REVENUES AND EXPENSES
VIRGINIA INTERNATIONAL TERMINALS, LLC. (“VIT”) FIVE YEAR SCHEDULE OF REVENUES AND EXPENSES
Fiscal Year 2012 2013(2) 2014 2015 2016
Revenues:
Operating $297,835,649 $339,460,135 $383,714,148 $440,841,866 $439,087,836
Nonoperating 873,907 (148,527) 224,937 17,678 70,380
Gross Revenues 298,709,556 339,311,608 383,939,085 440,859,544 439,158,216
Expenses:
Operating & Maintenance
Expenses $172,705,671 $215,133,442 $259,952,652 $280,794,678 $275,590,553
Administrative Expenses 32,698,897 27,510,957 29,373,020 34,145,101 42,808,794
Total Expenses 205,404,568 242,644,399 289,325,672 314,939,779 318,399,347
Income Before Transfers and Contributions(1) $93,304,988 $96,667,209 $94,613,413 $125,919,765 $120,758,869
Source: VIT accrual basis financial statements for the indicated fiscal years.
(1) The financial information relative to VIT set forth in this table is computed on an accrual basis. As a result, the amounts set forth in the line item “Income Before Transfers and Contributions” does not represent net cash transferred by VIT to the Authority. However, such information is an accurate representation of the financial performance of VIT.
(2) Due to a change in accounting principle FY 2013 has been restated to reflect the change.
135
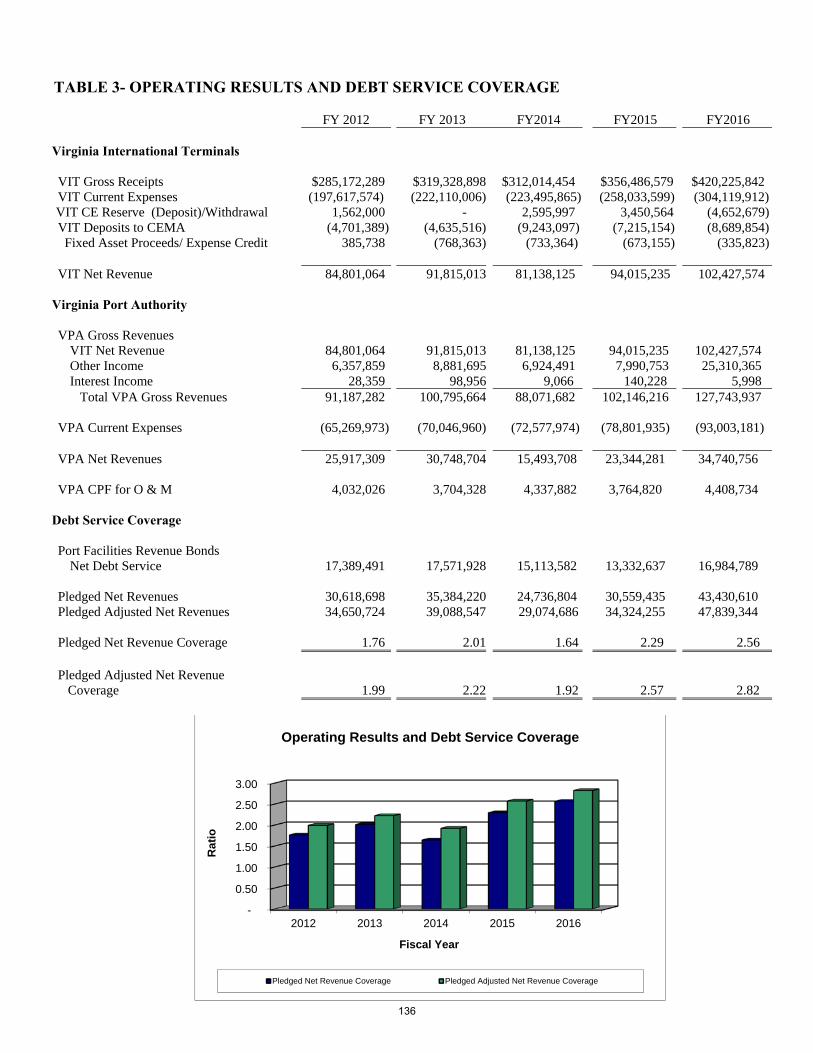
TABLE 3- OPERATING RESULTS AND DEBT SERVICE COVERAGE
FY 2012 FY 2013 FY2014 FY2015 FY2016
Virginia International Terminals
VIT Gross Receipts $285,172,289 $319,328,898 $312,014,454 $356,486,579 $420,225,842 VIT Current Expenses (197,617,574) (222,110,006) (223,495,865) (258,033,599) (304,119,912) VIT CE Reserve (Deposit)/Withdrawal 1,562,000 - 2,595,997 3,450,564 (4,652,679) VIT Deposits to CEMA (4,701,389) (4,635,516) (9,243,097) (7,215,154) (8,689,854) Fixed Asset Proceeds/ Expense Credit 385,738 (768,363) (733,364) (673,155) (335,823)
VIT Net Revenue 84,801,064 91,815,013 81,138,125 94,015,235 102,427,574
Virginia Port Authority
VPA Gross Revenues VIT Net Revenue 84,801,064 91,815,013 81,138,125 94,015,235 102,427,574 Other Income 6,357,859 8,881,695 6,924,491 7,990,753 25,310,365 Interest Income 28,359 98,956 9,066 140,228 5,998
Total VPA Gross Revenues 91,187,282 100,795,664 88,071,682 102,146,216 127,743,937
VPA Current Expenses (65,269,973) (70,046,960) (72,577,974) (78,801,935) (93,003,181)
VPA Net Revenues 25,917,309 30,748,704 15,493,708 23,344,281 34,740,756
VPA CPF for O & M 4,032,026 3,704,328 4,337,882 3,764,820 4,408,734
Debt Service Coverage
Port Facilities Revenue Bonds Net Debt Service 17,389,491 17,571,928 15,113,582 13,332,637 16,984,789
Pledged Net Revenues 30,618,698 35,384,220 24,736,804 30,559,435 43,430,610 Pledged Adjusted Net Revenues 34,650,724 39,088,547 29,074,686 34,324,255 47,839,344
Pledged Net Revenue Coverage 1.76 2.01 1.64 2.29 2.56
Pledged Adjusted Net Revenue Coverage 1.99 2.22 1.92 2.57 2.82
-
0.50
1.00
1.50
2.00
2.50
3.00
2012 2013 2014 2015 2016
Rat
io
Fiscal Year
Operating Results and Debt Service Coverage
Pledged Net Revenue Coverage Pledged Adjusted Net Revenue Coverage
136
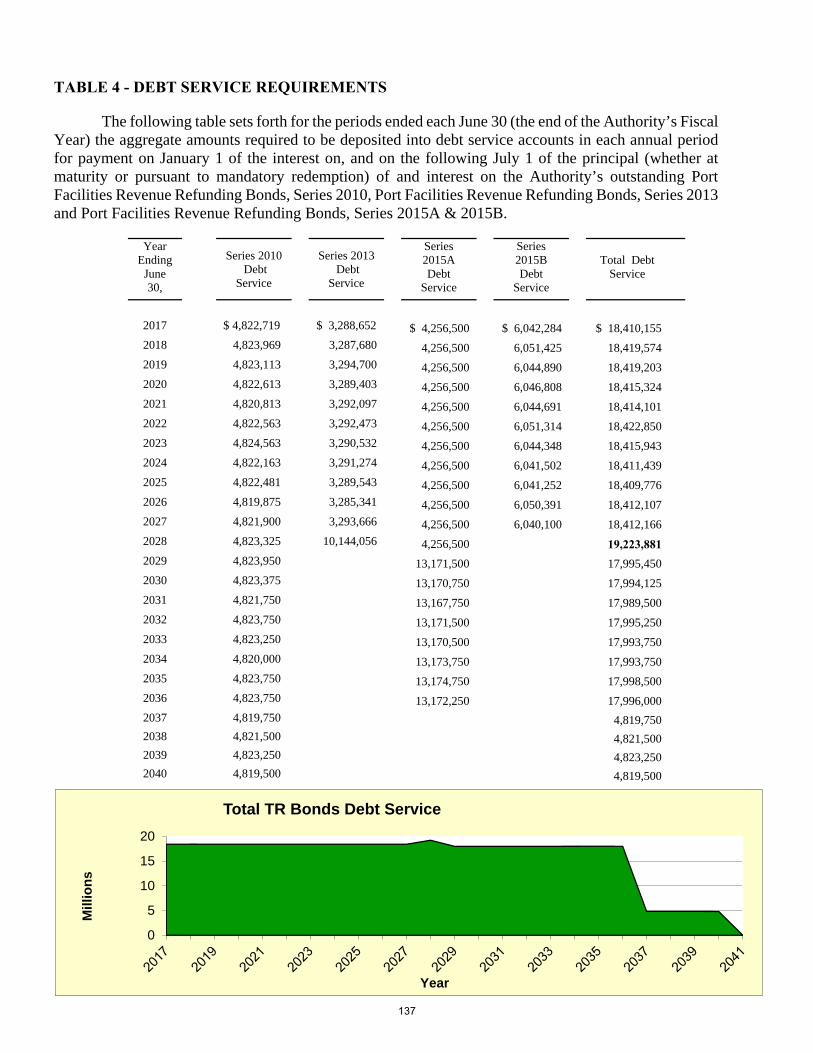
TABLE 4 - DEBT SERVICE REQUIREMENTS
The following table sets forth for the periods ended each June 30 (the end of the Authority’s Fiscal Year) the aggregate amounts required to be deposited into debt service accounts in each annual period for payment on January 1 of the interest on, and on the following July 1 of the principal (whether at maturity or pursuant to mandatory redemption) of and interest on the Authority’s outstanding Port Facilities Revenue Refunding Bonds, Series 2010, Port Facilities Revenue Refunding Bonds, Series 2013 and Port Facilities Revenue Refunding Bonds, Series 2015A & 2015B.
Year Ending
June 30,
Series 2010 Debt
Service
Series 2013 Debt
Service
Series 2015A Debt
Service
Series 2015B Debt
Service
Total Debt Service
2017 $ 4,822,719 $ 3,288,652 $ 4,256,500 $ 6,042,284 $ 18,410,155
2018 4,823,969 3,287,680 4,256,500 6,051,425 18,419,574
2019 4,823,113 3,294,700 4,256,500 6,044,890 18,419,203
2020 4,822,613 3,289,403 4,256,500 6,046,808 18,415,324
2021 4,820,813 3,292,097 4,256,500 6,044,691 18,414,101
2022 4,822,563 3,292,473 4,256,500 6,051,314 18,422,850
2023 4,824,563 3,290,532 4,256,500 6,044,348 18,415,943
2024 4,822,163 3,291,274 4,256,500 6,041,502 18,411,439
2025 4,822,481 3,289,543 4,256,500 6,041,252 18,409,776
2026 4,819,875 3,285,341 4,256,500 6,050,391 18,412,107
2027 4,821,900 3,293,666 4,256,500 6,040,100 18,412,166
2028 4,823,325 10,144,056 4,256,500 19,223,881 2029 4,823,950 13,171,500 17,995,450
2030 4,823,375 13,170,750 17,994,125
2031 4,821,750 13,167,750 17,989,500
2032 4,823,750 13,171,500 17,995,250
2033 4,823,250 13,170,500 17,993,750
2034 4,820,000 13,173,750 17,993,750
2035 4,823,750 13,174,750 17,998,500
2036 4,823,750 13,172,250 17,996,000
2037 4,819,750 4,819,750 2038 4,821,500 4,821,500 2039 4,823,250 4,823,250 2040 4,819,500 4,819,500
0
5
10
15
20
Mill
ion
s
Year
Total TR Bonds Debt Service
137
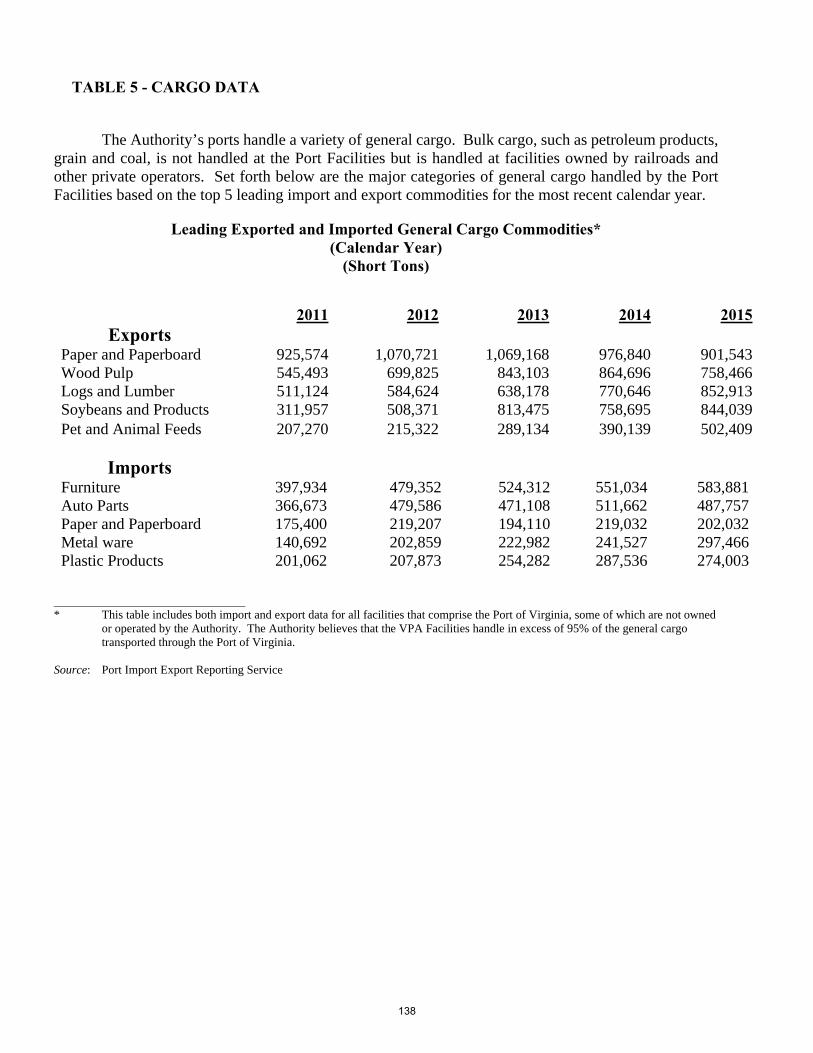
TABLE 5 - CARGO DATA
The Authority’s ports handle a variety of general cargo. Bulk cargo, such as petroleum products, grain and coal, is not handled at the Port Facilities but is handled at facilities owned by railroads and other private operators. Set forth below are the major categories of general cargo handled by the Port Facilities based on the top 5 leading import and export commodities for the most recent calendar year.
Leading Exported and Imported General Cargo Commodities* (Calendar Year)
(Short Tons)
2011 2012 2013 2014 2015Exports
Paper and Paperboard 925,574 1,070,721 1,069,168 976,840 901,543Wood Pulp 545,493 699,825 843,103 864,696 758,466Logs and Lumber 511,124 584,624 638,178 770,646 852,913Soybeans and Products 311,957 508,371 813,475 758,695 844,039Pet and Animal Feeds 207,270 215,322 289,134 390,139 502,409
Imports Furniture 397,934 479,352 524,312 551,034 583,881Auto Parts 366,673 479,586 471,108 511,662 487,757Paper and Paperboard 175,400 219,207 194,110 219,032 202,032Metal ware 140,692 202,859 222,982 241,527 297,466Plastic Products 201,062 207,873 254,282 287,536 274,003
* This table includes both import and export data for all facilities that comprise the Port of Virginia, some of which are not ownedor operated by the Authority. The Authority believes that the VPA Facilities handle in excess of 95% of the general cargotransported through the Port of Virginia.
Source: Port Import Export Reporting Service
138

TABLE 5 - CARGO DATA – continued
Presented below is information concerning volume of general cargo handled at all facilities that comprise the Port of Virginia.
General Cargo Statistics for the Port of Virginia* (Calendar Year)
(Short Tons)
2011 2012 2013 2014 2015
Breakbulk 347,558 372,144 336,060 328,060 295,719 Container 15,268,380 17,155,583 18,504,243 18,733,342 19,681,988
Total Tons 15,615,938 17,527,727 18,840,303 19,061,402 19,977,707
* This table includes both import and export data for all facilities that comprise the Port of Virginia, some of which are not ownedor operated by the Authority. The Authority believes that the VPA Facilities handle in excess of 95% of the general cargotransported through the Port of Virginia.
Source: Terminal Operators’ Statistics
-
5
10
15
20
2011 2012 2013 2014 2015
Mill
ion
s
Calendar Year
Total Tonnage (Short Tons)
139

VIRGINIA PORT AUTHORITY 600 World Trade CenterNorfolk, VA 23510