Embed Size (px)
Citation preview
Comprehensive Plan: Building Basehor – Growing Together
Comprehensive Plan for the City of Basehor, Kansas
July, 2013
Prepared by The City of Basehor, Kansas
Acknowledgements
Comprehensive Plan: Building Basehor – Growing Together
Acknowledgements
Mayor David K. Breuer City Council:
Travis Miles Richard Drennon Vernon Fields
Ty Garver Brian Healy
Planning Commission:
John Matthews Jon Gallion Ed Bush John Flower
Terry Gall Tracey Hannah Fred Farris
City Administration:
Lloyd Martley, Chief of Police & Interim City Administrator Mitch Pleak, City Engineer Corey Swisher, City Clerk & Finance Director Gene Myracle, City Superintendent

Table of Contents
Comprehensive Plan: Building Basehor – Growing Together i
City of Basehor, Kansas Comprehensive Plan
Table of Contents Executive Summary Page iii Overview of the Comprehensive Plan and its Development Page 1 The Plan and its Role.................................................................... 1 Community Input …………………………………..................................... 2 Overview of the City / Existing Conditions Page 3 Background Information............................................................... 3 Demographics.............................................................................. 3 Existing Land Use......................................................................... 6 Transportation............................................................................. 7 Ecological Profile / Physical Limitations.......................................... 8 Community Facilities Page 10 Wastewater System...................................................................... 10 Stormwater System...................................................................... 10 Water System.............................................................................. 10 Electric System............................................................................. 10 Gas System.................................................................................. 11 Law Enforcement......................................................................... 11 Fire Protection............................................................................. 11 Emergency Medical Services......................................................... 11 City Offices.................................................................................. 11 Parks and Recreation.................................................................... 11 Education.................................................................................... 12 Library......................................................................................... 12 Community Vision and Planning Goals Page 13 Topics of Importance.................................................................... 13 Annexation........................................................................ 15 Zoning and Physical Image................................................. 16 Infrastructure..................................................................... 18 Streets / Transportation...................................................... 19 Public Safety...................................................................... 21 City Center......................................................................... 22 Parks and Recreation.......................................................... 23 Education.......................................................................... 25 Economic Development....................................................... 26

Table of Contents
Comprehensive Plan: Building Basehor – Growing Together ii
Future Land Uses / Future Land Use Map....................................... 27 Residential......................................................................... 27 Planned Residential............................................................ 29 Mixed Use.......................................................................... 29 Commercial........................................................................ 30 Industrial........................................................................... 33 Public / Institutional and Open Space................................... 33 Future Land Use Map………………………………………………………..35 Plan Implementation Page 36 The Public’s Role – Civic Responsibility........................................... 36 Role of the Planning Commission................................................... 36 Role of the City Council................................................................. 37 Role of City Codes, Specifications, Studies, and Plans...................... 37 Role of the Planning & Zoning Department..................................... 39 The Basis of Decision-Making........................................................ 39
Appendices
Appendix A: Demographic Data.............................................................. 40
Appendix B: 2012 Citizen Survey Results................................................59

Executive Summary
Comprehensive Plan: Building Basehor – Growing Together iii
Executive Summary Purpose of a Comprehensive Plan The purpose of a Comprehensive Plan is to establish a vision for the community and proactively prepare for the future. The Plan will be a guiding tool for Basehor over the next 10-15 years. It provides a clear vision for the future of the community, which will direct the decisions and actions of elected and appointed officials, city staff, developers, and citizens. The Plan helps establish what kind of city Basehor wants to be and emphasizes building a community and not just a city. Preparation of a Comprehensive Plan The manner in which a Comprehensive Plan is developed is vital to its success because it must reflect the desires of the community at large. For this reason citizen involvement is essential throughout the process. Preparation of a Comprehensive Plan begins with information gathering and community input that identifies priorities for the future of the community. Developing goals, strategies, and action steps is a primary step in the long-range planning process addressing those priorities. Vision Statement The vision of the community provides an overall picture for where Basehor as a whole wants to be 10-15 years from now. It is this broad, yet optimistic, perspective by which all decisions should adhere. The following vision statement was created through the input and participation of citizens, elected officials, appointed officials, and others with an interest in the future of the community:
“Basehor, a vibrant community, proud of our past, planning a future where life and business flourish.”
Plan Specifics The Planning Commission, in part with the 2012 Community Survey, has established what topics are important to the future of the community and should be addressed in the Plan. The following, in no particular order, are the topics of importance.
Annexation Zoning and Physical Image Infrastructure Streets/Transportation Public Safety
City Center Parks and Recreation Education Economic Development
Executive Summary
Comprehensive Plan: Building Basehor – Growing Together iv
The Planning Commission complemented with a community survey set forth the topics of importance. The goals, strategies, and action steps developed will require both public and private resources and cooperation in order to achieve them. The following section is intended to provide additional information on common concerns raised regarding a comprehensive plan and specific topics and recommendations discussed in the Plan. Will adoption of the Comprehensive Plan affect my property’s current zoning or use? No. The Comprehensive Plan does not intend to suddenly change or fix every zoning, land use or development issue within the City; rather it is designed to guide the community as it makes decisions about the future so that the goals established in the Plan can be reached. The Plan is another tool the City possesses in which to evaluate development and redevelopment opportunities. Will adoption of the Comprehensive Plan cause changes to the current zoning ordinance and subdivision regulations? Adoption of the Comprehensive Plan will not immediately change the current zoning and subdivision regulations. However, the Plan does recommend the regulations be changed and updated because planning and development policies and practices have changed. How will the recommendations outlined in the Comprehensive Plan be implemented? Implementation is the key to a successful comprehensive plan and community participation is the key to successful implementation. To initiate implementation of the Plan the City Council and Planning Commission will meet in joint work sessions to prioritize and delegate tasks. Although the City will utilize the Plan the most and be the primary contributor on many of the tasks, it cannot accomplish the goals alone. Organizations and agencies like the Park Association, the school district, homeowner’s associations, Mid-America Regional Council and the State of Kansas and individual citizens are key components to implementing the plan. Why is planning being done for such a large area? For many years, Basehor has experienced a considerable amount of growth both in terms of population and area and it is anticipated that this trend will continue. With the City’s recent sanitary sewer plant expansion and voluntary annexation, the need for a broad planning is essential. Additionally, the request to be annexed into the City is often accompanied by a rezoning application. By preparing a plan that addresses possible annexation areas the City will be prepared to make decisions that are in-line with the desires of the community regarding these areas.
Overview of the Comprehensive Plan and its Development
Comprehensive Plan: Building Basehor – Growing Together Page 1
Overview of the Comprehensive Plan and its Development The Plan and its Role Possessing a future goal and vision is important because the decisions made now will impact the community for decades to come. The intent of the Comprehensive Plan is to establish a vision for the future of Basehor and guide decision making, policies, programs, and projects so that the vision may be realized. It provides a comprehensive, long-term and general policy framework, which will direct the future growth of the City. The Plan strives to ensure Basehor will experience orderly, healthy and harmonious growth that maximizes public benefit while minimizing public cost. More specifically the Plan:
1. Delineates the City’s major planning goals and provides a sense of direction for City employees, elected and appointed officials, and citizens.
2. Serves as a database for the City’s long-term planning activities. 3. Develops a framework for systematic and collaborative decision-making and provides
a basis for which future development requests can be considered and evaluated. 4. Assists with the allocation of resources. 5. Analyzes the factors that affect Basehor’s development and assesses planning
implications. 6. Presents recommended changes to the City’s land use and development control
regulations as a means to implement the Plan’s recommendations.
The Comprehensive Plan not only aims to define the long-term vision for the entire community, but is designed to ensure visible progress is made in achieving the community’s goals. The Plan outlines the City’s goals for near-term and recommends action steps that will enable the City to achieve its long-term goals. The achievement of these actions steps will serve as a measure of success for the Plan’s implementation.
The City possesses a broad ability to mitigate the public impact of private development. This is an authority that has been used to uphold laws mandating historic preservation, natural resource protection, zoning, signage restriction, aesthetic regulation, impact fees, excise taxes and required dedications. These land use and development regulations shape the locations, types, quality, and comprehensiveness of the physical development of Basehor. The Comprehensive Plan is the nexus to the legal framework on which such regulations are enacted and amended. It provides the justification for the implementation of these regulations.
Within Kansas, state law provides cities the authority to prepare and adopt a Comprehensive Plan, through KSA 12-747(a).
A city planning commission is hereby authorized to make or cause to be made a comprehensive plan for the development of such city and any unincorporated territory lying outside of the city but within the same county in which such city is located, which in the opinion of the planning commission, forms the total community of which the city is a part.
Overview of the Comprehensive Plan and its Development
Comprehensive Plan: Building Basehor – Growing Together Page 2
Under current planning and zoning statues, the City is under no obligation to prepare a comprehensive plan unless it wants to adopt subdivision regulations (KSA 12-749). Similarly, the City is not required by statues to follow the recommendations of the Plan unless so specified by City ordinance. In spite of this, case law within Kansas and throughout the country has effectively established that the Comprehensive Plan forms the basis for enforcing zoning regulations. Without a Comprehensive Plan, determining and justifying specific zoning districts within a city is arbitrary at best.
To this extent, the Comprehensive Plan is often primarily used by the Planning Commission as a guide when presented with rezoning requests. In considering a rezoning request, state statues (KSA-756) require the City to review the application in relation to “matters to be considered” as adopted in the Zoning Regulations. These considerations should include review of the applications’ consistency with the Comprehensive Plan. Although the City is not required to follow the Plan’s recommendations regarding future land use, state statues specifically provide that rezoning requests that are consistent with the Plan are presumed to be reasonable (KSA 12-756).
However, it must be clear that the Plan is not a set of regulations or zoning ordinance. Because community planning is dynamic, the Plan is a guide, providing direction regarding the community’s preferred future, goals, objectives, priorities and policies. The interpretation of the Plan may be altered as situations change and development possibilities evolve. Although it is a guide and is flexible, proposals that do not conform to the intent of the Plan should be seen as inappropriate and the necessary steps should be taken to either amend the proposal or amend the Plan. For these reasons the Plan must be kept up to date. State statues require the Planning Commission to review or reconsider the Plan at least once each year in order to ensure that the Plan is still valid and relevant. During this review the Planning Commission is authorized to propose amendments, extensions or additions to the Plan following the same procedure for adoption of the original Plan. Community Input A Comprehensive Plan must be based on the collective desires the community has for its future. If the plan does not reflect these desires, it is irrelevant. To ensure the Plan is representative of the community’s vision, a community survey was sent to all residents (4,692) in October of 2012 to obtain citizen input. Approximately, 1710 citizens participated in the community survey (36% of the population). The survey gave an opportunity for the citizens to recommend the prioritization of public services, community development, and investment opportunities. Referencing the recent citizen survey, the existing Comprehensive Plan, a study of the surrounding areas as well as research by the Planning Commission, the Planning Commission developed the updated Comprehensive Plan. However, the participation of the community cannot end once the Comprehensive Plan is written and adopted. In order to achieve the goals established in the Plan, the community must participate in the implementation stage of the process. Successful development and revitalization is feasible provided community leaders and caring and concerned citizens take action, use the Plan as a guide, adhere to sound judgment, and use thoughtful, intelligent and reasonable observation and decision making.

Overview of the City / Existing Conditions
Comprehensive Plan: Building Basehor – Growing Together Page 3
Overview of the City / Existing Conditions Background Information Basehor is a rapidly growing suburban community located on the west side of the Kansas City Metropolitan Area. It was founded in 1889 and thrived as a railroad town for several years until the down turn of the economy in the early 1900’s. From the early 1900’s until after World War II Basehor remained a quiet rural community. Since that time the town has experienced steady growth with new businesses, new schools, and many new houses. Basehor’s close proximity to Kansas City and easy access to major thoroughfares like I-70, I-435 and Kansas State Highways 24/40 and 7 have contributed to this steady growth.
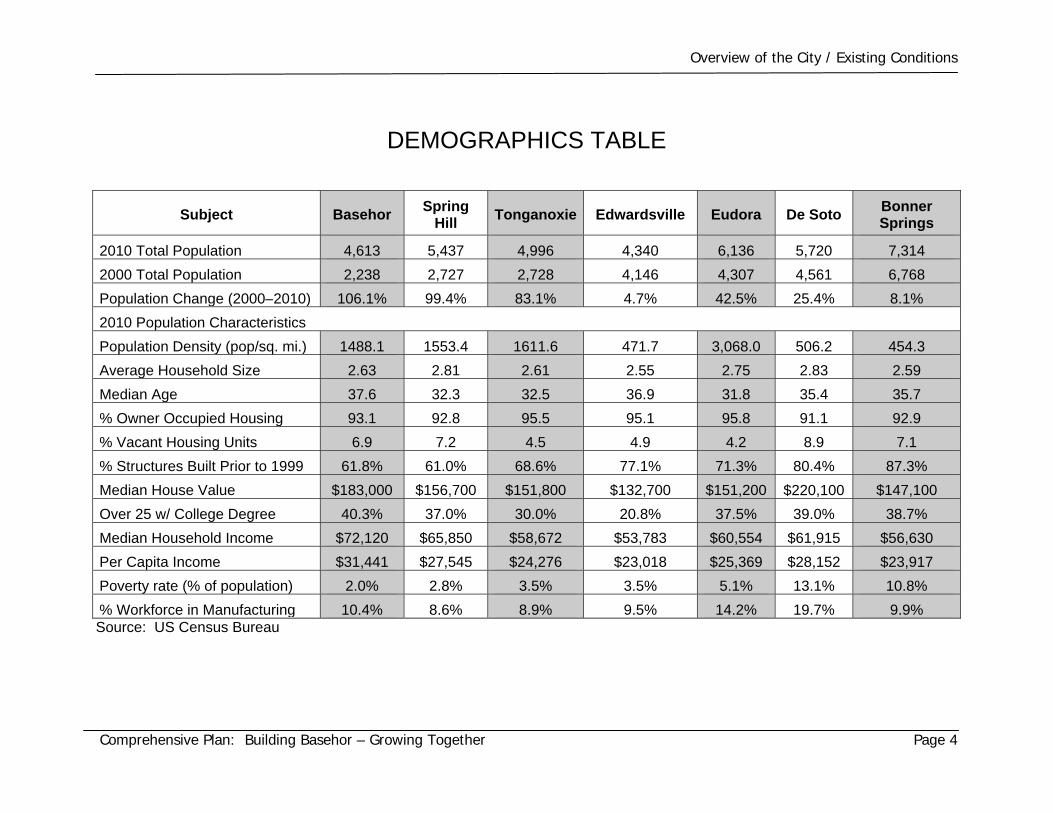
Demographics Demographics are the characteristics of human populations and are one form of measurable social information. They provide a variety of data, including the number of people in the community, the community’s education levels, income levels, and housing stock. By examining local demographic data it is possible to recognize certain trends and anomalies. This data and trends can help evaluate the existing and future needs of the community. There is a large amount of information available from the United States Census Bureau and many pages could be dedicated to displaying and analyzing demographic data for the City of Basehor. However, much of this information will have little benefit in developing specific proposals that will benefit the community. Therefore, this Plan will highlight a limited amount of statistical data concerning population, housing, and economics that may be of interest to the community and may lead to the creation of specific implementation proposals. The following table provides a comparison of selected demographic data from Basehor with other similarly sized cities also located in or near the Kansas City Metropolitan Area.
Overview of the City / Existing Conditions
Comprehensive Plan: Building Basehor – Growing Together Page 4
DEMOGRAPHICS TABLE
Subject Basehor Spring Hill Tonganoxie Edwardsville Eudora De Soto Bonner
Springs
2010 Total Population 4,613 5,437 4,996 4,340 6,136 5,720 7,314
2000 Total Population 2,238 2,727 2,728 4,146 4,307 4,561 6,768
Population Change (2000–2010) 106.1% 99.4% 83.1% 4.7% 42.5% 25.4% 8.1%
2010 Population Characteristics
Population Density (pop/sq. mi.) 1488.1 1553.4 1611.6 471.7 3,068.0 506.2 454.3
Average Household Size 2.63 2.81 2.61 2.55 2.75 2.83 2.59
Median Age 37.6 32.3 32.5 36.9 31.8 35.4 35.7
% Owner Occupied Housing 93.1 92.8 95.5 95.1 95.8 91.1 92.9
% Vacant Housing Units 6.9 7.2 4.5 4.9 4.2 8.9 7.1
% Structures Built Prior to 1999 61.8% 61.0% 68.6% 77.1% 71.3% 80.4% 87.3%
Median House Value $183,000 $156,700 $151,800 $132,700 $151,200 $220,100 $147,100
Over 25 w/ College Degree 40.3% 37.0% 30.0% 20.8% 37.5% 39.0% 38.7%
Median Household Income $72,120 $65,850 $58,672 $53,783 $60,554 $61,915 $56,630
Per Capita Income $31,441 $27,545 $24,276 $23,018 $25,369 $28,152 $23,917
Poverty rate (% of population) 2.0% 2.8% 3.5% 3.5% 5.1% 13.1% 10.8%
% Workforce in Manufacturing 10.4% 8.6% 8.9% 9.5% 14.2% 19.7% 9.9%Source: US Census Bureau
Overview of the City / Existing Conditions
Comprehensive Plan: Building Basehor – Growing Together Page 5
Population In recent years the Community has experienced a significant amount of growth with the population increasing by nearly 106% between 2000 and 2010. Although Basehor has the smallest population among the cities compared, it is near the top in terms of percentage of population growth. The City has good highway access, a quality school system and is in close proximity to growing commercial areas like Village West. These factors have and continue to contribute to Basehor’s growth.
Policy Implications Similar to the other communities, Basehor is likely to experience continued population growth. An increase in population will place an increased demand on services, infrastructure, and schools. The impact on schools will be especially great if younger families continue to move to the area.
Housing In general all the communities evaluated have similar housing characteristics with high percentages of owner occupied homes and low percentages of vacant structures. 93% of Basehor’s housing stock is owner occupied. Overall, between 61% to 87% of all the cities’ housing structures were built prior to 1999. Basehor is at the top with 62% built before 1999. In terms of housing value, Basehor has the second highest median house value at nearly $183,000.
Policy Implications It is anticipated that Basehor will continue to grow, which will create a demand for housing. Especially with such a small portion of the existing structures being vacant, new housing construction is nearly certain. As demand increases, it is likely that housing prices will go up across the community. Generally, this is a good situation, but it is also important to consider what affect this will have on first time home buyers and lower-income households.
Economics / Education Generally, there is a correlation between educational attainment, income and poverty rates. There seems to be a few examples of this among the communities compared. All of the communities have relatively high median household incomes with the majority being in the low $60,000s. Basehor has the highest median household income at $72,000 and highest per capita income. In terms of poverty rate, Basehor has the lowest poverty rate at 2%.
Policy Implications Basehor is fortunate enough to be in close proximity to a
variety of employment opportunities due to the nearness of the Kansas City metro area, Lawrence and Fort Leavenworth. Maintaining a high quality of life will help ensure the City continues to grow and maintains a low poverty rate and high income level by attracting people who work in these areas.
Overview of the City / Existing Conditions
Comprehensive Plan: Building Basehor – Growing Together Page 6
Considering the connection between educational attainment and income levels it will be important for the community to continue to support education.
Existing Land Use The way in which land use is distributed throughout a city requires thoughtful decision-making and is not simply a random process. Several factors influence how a piece of property is zoned and used. Economic variables such as market demands, the cost of property, and the cost of construction, as well as, environment factors like soil conditions, topography, and locations of floodplains all influence land use patterns. Although these factors are out of the control of the City there are other influencing factors that the City can control. This includes traffic patterns, the capacity and location of public utilities, the delivery of municipal services and the City’s physical appearance. However, these factors are not constant and just as they influence land use, each change in land use impacts them. Basehor currently has thirteen zoning districts, of which seven are residential land uses, one is for recreational vehicle parks, two are business land uses, and three are industrial uses. Following are the current zoning districts:
Residential Business R-0 Suburban Residential CP-1 Neighborhood Business R-1 Single Family Residential CP-2 General Business R-2 Two Family Residential R-3 Multi-Family Residential Industrial PR Planned Residential PI Planned Industrial MH-1 Mobile Home Park I Light Industrial MH-2 Mobile Home Park I-2 Heavy Industrial
Other RV-1 Recreational Vehicle Park
This is an excessive number of zoning districts creating administrative problems, conflicts between districts, and general misunderstandings regarding zoning. Suggestions on changes to the zoning districts are discussed further under the “Implementation” section of the Plan. The majority of land within the City is zoned either R-0 Suburban Residential or R-1 Single Family Residential. Additionally, there are several large pockets of PR Planned Residential. The bulk of the commercial areas are located along Highway 24/40 with several parcels of neighborhood business in the city center area along 155th Street. Two industrial areas exist on the east side of the City. However, it is important to remember that zoning classification and land use do not always coincide. In recent years Basehor has experienced significant growth causing an increase in the amount of acres used for many of the land use categories, especially single family residential. Although there are some vacant and agricultural properties inside the City, much of the growth has and is occurring in agricultural areas that were outside the City
Overview of the City / Existing Conditions
Comprehensive Plan: Building Basehor – Growing Together Page 7
limits, but have been annexed as development occurs. Considering growth trends it is likely this development will persist and additional land will continue to be incorporated into the City’s boundaries. While the preponderance of development has and continues to be residential, the increase in population will attract new businesses causing vacant land to be developed for commercial purposes.
Policy Implications The City is experiencing growth and several requests for land use changes. These changes will require careful consideration to ensure the proposed land use patterns are most appropriate for the City and the particular area. Basehor should continue to evaluate its anticipated annexation area and the anticipated land use of those areas. To improve clarity and be in-line with current development standards, updates to the zoning code will be necessary.
Transportation The transportation system is a vital component of the community. It affects almost every aspect of activity within the community either directly or indirectly. The transportation system is highly visible and deficiencies and improvements are readily noticed. The City currently maintains 47 miles of streets, but this number is steadily increasing due to annexation and development. Community planning and transportation systems are greatly interrelated and interdependent. An adequate transportation network is a key component of new growth. For this reason, development almost always entails the construction of new transportation networks or the upgrading of existing ones. The costs associated with constructing and maintaining roads continues to rise. In 2012 dollars, it costs nearly $600 per linear foot for new collector level streets and $800-$1000 per linear foot for retrofitting. Considering these figures it is important for the City to plan well. It is cheaper and more efficient to construct and maintain a community that is compact and well connected because it reduces the miles of streets that must be built, repaired, and maintained. Additionally, a compact and well connected city can reduce the response times of emergency vehicles. To assist in the planning, design and maintenance of a street network, streets are broken down using a functional classification system. This system identifies different types of roads based on their design and intended function. While no classification system can fit all situations, they do serve as an effective guide in helping the community adopt standards appropriate to its needs. A typical classification system identifies four basic types of streets: expressway, arterial, collector, and local. Expressways are most often regional facilities, such as I-70 and K-7, constructed and maintained by the State. For the purpose of this plan, expressways will not be included in the functional classification of streets for the City. The following table provides additional information on the functional classification of streets in Basehor.

Overview of the City / Existing Conditions
Comprehensive Plan: Building Basehor – Growing Together Page 8
Arterial Collector Local
Purpose Move large volumes of traffic efficiently
Move moderate amounts of traffic
Provide direct access to properties
# of Lanes/ Lane Width
4 or more (12’) 2 to 3 (12’) 2 (14’)
ROW Width 100’ or more 60’ 50’ Pavement Width 48’ or more 24’ to36’ 28’
Sidewalks Both Sides Both Sides One or Both Sides Parking Prohibited Prohibited Permitted
Average Daily Traffic More than 12,000 1,500 – 12,000 Less than 1,500 Speed (MPH) 45 MPH or more 30 – 45 MPH 30 MPH
Based on the table above and current conditions, existing streets within Basehor can be placed into an appropriate classification that takes function, land use and traffic volumes into account. Currently Basehor possesses one arterial street, U.S. Highway 24/40. The following streets are classified as collectors:
155th Street Parallel Street Leavenworth Road 150th Street
Falcon Lakes Drive Pinehurst Drive Wolf Creek Parkway 166th Street
All other streets are considered local streets. The utilization of bicycles as a viable transportation mode has been steadily increasing over the last several years. To accommodate the growing trend governments at all levels are implementing bicycle programs. The Federal Government has provided funding and guidelines for bike facilities with programs. Cities are becoming more conscious of incorporating trails and sidewalks into their transportation network.
Policy Implications Because the land within Basehor’s city limits is not contiguous the maintenance of the street network, specifically snow removal, is inefficient. As development and annexation continues the way existing and new roads interface, as well as, design specifications should be examined. Additionally, the City should begin to plan for the incorporation of bicycle transportation systems in new developments and in older neighborhoods.
Ecological Profile / Physical Limitations The physical characteristics of a community can reveal a lot about its growth patterns, health and vitality. Additionally, understanding the existing physical condition and limitations of the community will offer a better understanding of what issues need to be addressed. Identifying both positive and negative aspects of the community’s physical environment will provide valuable insight in developing specific strategies on improving the overall physical image and condition of the community and understanding growth limitations.
Overview of the City / Existing Conditions
Comprehensive Plan: Building Basehor – Growing Together Page 9
Topography Overall, the land within the City limits is relatively flat with no significant topographical features. Basehor is located in two different drainage areas, the Wolf Creek basin to the east and the Stranger Creek basin to the west. A considerable amount of the land within the community is located in the Wolf Creek basin while the wastewater treatment plant is located in the Stranger Creek basin, requiring a large portion of the City’s sewer to be pumped to the wastewater treatment facility. Another issue to consider as the City expands is the Hog and Frog Creek drainage basin located to the north of the City. Because the drainage flow of this basin is away from the City, the ability to provide sewer to this area will be a factor as growth and possible annexation occurs in the vicinity of the basin. Surrounding Growth Factors Much of the land surrounding Basehor is currently used for agricultural and/ or residential purposes. These types of land uses are conducive to growth and will allow Basehor to extend its corporate limits. However, there are factors that will limit the City’s expansion. Growth to the east will be restricted by the proximity of incorporated Kansas City, KS, the western boundary of which is currently located on the east side of Kansas Highway 7. Other cities may also impact the extent to which the City limits may be extended, however, it will require many years of continuous growth and annexation before Basehor encounters this situation. Interstate 70 will pose another physical challenge to the City’s expansion. The road will not necessarily put a halt to growth, but several significant factors will need to be given careful consideration prior to the City annexing land on the south side of the interstate.
Policy Implications Because the land within Basehor’s city limits is not contiguous the ability to supply all areas of the City with water and sewer services is less efficient. As development and annexation continues the way existing and new infrastructure interfaces , as well as, infrastructure design specifications should be examined. Additionally, the City should begin to plan gravity flow sewers.

Community Facilities
Comprehensive Plan: Building Basehor – Growing Together Page 10
Community Facilities To be truly comprehensive, this Plan must explore the relationship between growth and the services and facilities which must support this growth. If the necessary support facilities are not made available, growth will cease. In particular, the City must monitor its public works and utility services, public safety, and its public building and recreational facilities to properly accommodate new and current citizens and businesses as the community grows.
Wastewater System
The wastewater system is a critical issue for Basehor, Kansas. The existing plant discharges into Hog Creek, via Stranger Creek in the Kansas River Basin. The wastewater facility completed an expansion project in 2010 and currently has a capacity of serving approximately 20,000 residents. The Cities collection system consists of over 50 miles of gravity mains of various sizes, 15 miles of force mains of various sizes, as well as 17 lift stations of various sizes to covey all raw sewage to the facility. Stormwater System Overall, the City’s stormwater system is functioning properly and efficiently with no significant inadequacies in the system. Older portions of town do not possess curb and gutter and they are not being added during planned improvements. Although some citizens would like the older portions of town to be retrofitted with curb and gutter, the open ditch drainage system currently in place works properly and improves water quality by providing for natural filtration of the stormwater. All new subdivisions are being constructed with curb and gutter.
Water System
Basehor’s water is supplied by two companies, Consolidated Rural Water #1 and Suburban Water. The companies possess the necessary capacity to accommodate growth while continuing to provide an adequate level of service to all its customers. Main upgrades will be necessary to meet the needs of new development and the providers have established long term plans which address this issue. Currently, the City and the two companies have an open dialogue regarding services and development. This communication must continue and expand. Specifically, better communication is needed in regards to updating codes and which organization is responsibility for what type of review and inspection. Electric System Westar Energy provides Basehor and the surrounding areas with electrical services. The company is adequately prepared to handle increasing demands for the next twenty years as there are currently three substations located near Basehor, which possess expansion capabilities. To ensure Westar may accommodate growing needs and changing circumstances, the City must engage the provider during the planning stages of development, major road improvements, and right-of-way changes. The company has also expressed an interest in working with the City to establish a consistent process regarding street lighting.

Community Facilities
Comprehensive Plan: Building Basehor – Growing Together Page 11
Gas System Basehor’s natural gas is supplied by Atmos Energy. As development occurs, the company has installed the necessary infrastructure and will continue to provide infrastructure on an as needed basis. To ensure Atmos may accommodate growing needs and changing circumstances, the City must engage the provider during the planning stages of development, major road improvements, and right-of-way changes.
Law Enforcement
The Police department consists of fifteen staff members including the Chief, Lieutenant/Detective, Animal Control Officer, and Court Clerk. With an increasing population the police force will need to be amplified. An assessment should be conducted that examines the current level of service and available resources, plus identifies the desired level of service and the facilities needed to achieve this level. It is likely that additional shifts, personnel, facilities, and training will be necessary to achieve the desired level of service.
Fire Protection
Basehor receives its fire protection and emergency services from the Fairmount Township Fire Department. The Department is supported by an all volunteer staff, which consisted of 30 people in 2012. It has ten different fire protection apparatuses, which provides them the support they need to fight a variety of fire situations. The Department responds to all fire calls as well as all medical emergencies, traffic accidents, and special rescue in Fairmount Township. The number of calls the department responses to continues to increase each year due to the growth that is occurring in the township. EMS (Emergency Medical Services)
Basehor receives its EMS from Leavenworth County. Leavenworth County EMS provides both emergency (911) and non-emergency services to our community. Leavenworth County EMS provides coverage to all of Leavenworth County, Fort Leavenworth, and three prisons. Three EMS stations exist in the County. Two stations are located in Leavenworth and one in Tonganoxie. Leavenworth County EMS has 31 non-volunteer staff members. City Offices
City Hall is currently located off of 155th Street near city center. The building is occupied by the City Clerk, City Administration, Planning & Zoning, Police Department, the City Council room, and the Municipal Courtroom. At this time there are significant space needs within the municipal offices.
Parks and Recreation
Currently, Basehor possesses a community park, sporting complex, and a public golf course called Falcon Lakes. City Park was established through a joint effort between the City and the Basehor Park Association. It is located in the northwest corner of town on Leavenworth Road approximately one mile west of 155th Street. Basehor City Park has a gazebo, covered shelter, pavilion, two children's playground areas, picnic facilities throughout the park, sand

Community Facilities
Comprehensive Plan: Building Basehor – Growing Together Page 12
volleyball court, restroom facilities, water hydrants, and ample open space. Reservations are available through city hall for each of the individual locations as well as the entire park for special events. The field of Dreams sporting complex offers recreational opportunities for youth to participate in softball, t-ball, and football.
As the community’s population continues to grow, the existing number of parks and recreational opportunities will not meet the needs of the citizens. As new residential development occurs, the City must work with developers to provide recreational opportunities in the vicinity.
Education Unified School District 458, Basehor-Linwood, serves students and families in a 90 square mile area of southern Leavenworth County. K-12 students attend one of six district attendance centers. There are K-5 buildings located in both Linwood and the Glenwood Ridge Subdivision. There is also a K-2 building and 3-5 building located within the city limits of Basehor. Students in grades 6, 7, and 8 attend Basehor-Linwood Middle School in the center of the district. Basehor-Linwood High School, located in Basehor, is a 4A school, serving students in grades 9 through 12. In addition, the district operates Basehor-Linwood Virtual School, an internet-based school serving approximately 200 K-12 students statewide. During the 2012-13 school year, the total enrollment for all schools was approximately 2,160. The district also employs 133 professional staff members and 90 support staff.
Library
The Basehor Community Library, located off 158th Street, offers a variety of books and programs for children, teens, and adults. Additionally, the library provides DVDs, interlibrary loans, public internet access, computers for public use, wifi, private study rooms, community rooms, fax and copy machine services, laminating, voter registration, tax forms. The library receives an average of over 8,000 visits per month and offers 55,100 items in the collection.
Community Vision and Planning Goals
Comprehensive Plan: Building Basehor – Growing Together Page 13
Community Vision and Planning Goals
The vision statement outlines in general terms what kind of community Basehor wants to be in the future. It centers on community values and principles that are the foundation of the comprehensive plan. All decisions should adhere to this perspective. Basehor’s vision statement:
“Basehor, a vibrant community, proud of our past, planning a future where life and business flourish.”
As the community establishes its vision and goals for the future, the items that need improvement or present challenges to the community are often the focus, while the positive aspects of the community are neglected. However, it is important that the Plan identify the community’s assets and incorporate their maintenance and enhancement into the goals and action plans. The following items make Basehor a great place in which to live.
Growth Family values Learning – education/ great schools Neighborhoods Quality businesses Work, live, play Progressive Location/ proximity to KC metro area Ease of access and low traffic Peaceful Quality of life Small town atmosphere/ sense of
community Religious diversity/ churches Friendly/ know your neighbors
Clean/ pollution free Quality developments Safe Community activities Recreation/ youth activities Rural setting School-community interactions Active civic organization and
volunteerism Police department Fire department Chamber of Commerce Excellent opportunity for
economic growth
Topics of Importance The Planning Commission, in part with the 2012 Community Survey, have established what topics are important to the future of the community and should be addressed in the Plan. The following, in no particular order, are the topics of importance.
Annexation Zoning and Physical Image Infrastructure Streets/Transportation Public Safety
City Center Parks and Recreation Education Economic Development
The Planning Commission analyzed each topic of importance. The Planning Commission developed goals, strategies, and action steps related to each topic. Goals are the vision the community has for that specific topic while the strategies are objectives designed to accomplish the overall goal. Action steps are specific acts intended to achieve the desired
Community Vision and Planning Goals
Comprehensive Plan: Building Basehor – Growing Together Page 14
objectives. Action steps may have targets for completion in the form of population growth, development, and time. To determine if the community is working towards and achieving the desired goals, the Comprehensive Plan shall be reviewed in January annually.
Community Vision and Planning Goals
Comprehensive Plan: Building Basehor – Growing Together Page 15
Annexation Growth brings a number of benefits to a community; however, it also brings a number of impacts and costs. This makes annexation a vital part of planning for the future of the City because it provides a mechanism to incorporate those areas outside the city limits anticipated for future growth. It also ensures there is adequate land and space for future growth and development. Annexation does come with a cost, which must be carefully analyzed. The City must evaluate its ability to provide an adequate level of services to the annexed area. Additionally, the City needs to promote a development pattern that represents the sustainable use of land, energy and other resources by encouraging orderly, contiguous growth and minimizing single-use or low-density, dispersed development. Annexation is an important topic for Basehor as the City grows. Goal: Provide the opportunity for future urban growth as urban infill and in the planned growth areas of Basehor. Strategy: Manage growth in an orderly manner that creates compact and contiguous development patterns and not leapfrog beyond areas that can be reasonably served by utilities and services. Action Steps:
1. Promote annexation of unincorporated “infill” areas contiguous to the city limits in response to growth.
2. Continue promoting vacant land within the City limits. 3. Require developments to analyze their impact on public infrastructure and to make
improvements to accommodate the development’s impact. 4. Provide a variety of high-quality locations for industrial and business development. 5. Market Basehor needs. 6. Future targeted annexation should follow Fairmount Township boundaries. 7. Have proactive communication with property owners. 8. Incorporate annexation costs with the Capital Improvement Program. 9. Planning Commission and City Council review growth annually and determine
annexation needs.
Community Vision and Planning Goals
Comprehensive Plan: Building Basehor – Growing Together Page 16
Zoning and Physical Image Zoning is the legal tool for regulating growth, land use, and design and development specifications. Additionally, zoning regulations are a key to implementing the goals of the comprehensive plan and the City’s physical image. The physical image of the community entails the perception people have of the physical assets of the City. Improving the physical image has a wide variety of benefits to the community including improved property values, enhanced economic development, increased tourism, and community pride. Goal: Maintain City regulations and policies which encourage a strong vibrant growing community. Strategy: Provide zoning regulations which are up-to-date and reflect the goals of the community Action Steps:
1. Review the Zoning Ordinance and Subdivision Regulations annually. 2. Consider zoning for the long term and beyond the City limits. 3. Tie zoning to the Future Land Use Map and Comprehensive Plan.
Goal: Possess an appealing and unique physical image Strategy: Create a gateway to the community and enhance the City’s amenities. Action Steps:
1. Incorporate the “Building Basehor – Growing Together” motto. 2. Enforce City Codes.
Strategy: Possess commercial developments that have an attractive design. Action Steps:
1. Require more traditional type developments that have personality and unique character.
2. Blend new development to existing development. 3. Follow Architectural Design Standards.
Strategy: Encourage a variety of residential developments and styles that incorporate sufficient open space. Action Steps:
1. Utilize different architecture to reduce “cookie cutter” homes and break up monotony and create diversity.
2. Implement New Urbanist ideas for residential development. New Urbanism promotes the creation of diverse, walkable, compact places with an emphasis on quality of life. These types of development are often referred as traditional developments because they incorporate traditional design elements such as grid pattern streets, alleyway, recessed garages, front porches and amenities (parks, schools, stores) located within walking distance.
Measures:
Community Vision and Planning Goals
Comprehensive Plan: Building Basehor – Growing Together Page 17
Because physical image entails people’s perception, it is recommended that community surveys be utilized to determine citizens’ attitudes towards the physical image of the City.
Community Vision and Planning Goals
Comprehensive Plan: Building Basehor – Growing Together Page 18
Infrastructure
A City’s infrastructure helps define the community and is important to the planning process. The street network provides for the community’s internal movement and connects it to places beyond its boundaries. The location and pattern of roads, sewer lines, water lines and electric lines will influence the pattern of growth within the community. Additionally, infrastructure such as parks, pedestrian amenities, and recreational areas help establish the quality of life in the community. The goals established in this Plan directly affect future infrastructure improvements because it helps create a priority list. By having the community’s goals for growth and development outlined, local officials can ensure they are allocating money for infrastructure improvements that the community believes are important. Goal: Provide the community with an integrated and efficient infrastructure system. Strategy: When ever possible, utilize a gravity flow system for the community’s sewer system. Action Steps:
1. Coordinate sewer master plan with development. 2. Development a plan that would allow the sewer lines to be easily converted to a
gravity flow system. 3. Evaluate the existing sewer systems annually and implement findings to the an annual
sewer improvement program. 4. Examine locations that would allow a larger amount of the basin to be served by
gravity flow. 5. Biennially examine the feasibility for a future gravity flow system in the Wolf Creek
basin. Strategy: Improve the City’s stormwater management system. Action Steps:
1. Develop a Stormwater Management System Plan. 2. Develop Best Management Practices Standards. 3. Encourage the use of natural stormwater mitigation techniques to improve water
quality (i.e. - filter strips, vegetated swales, pervious pavement, bioretention).

Community Vision and Planning Goals
Comprehensive Plan: Building Basehor – Growing Together Page 19
Streets/ Transportation
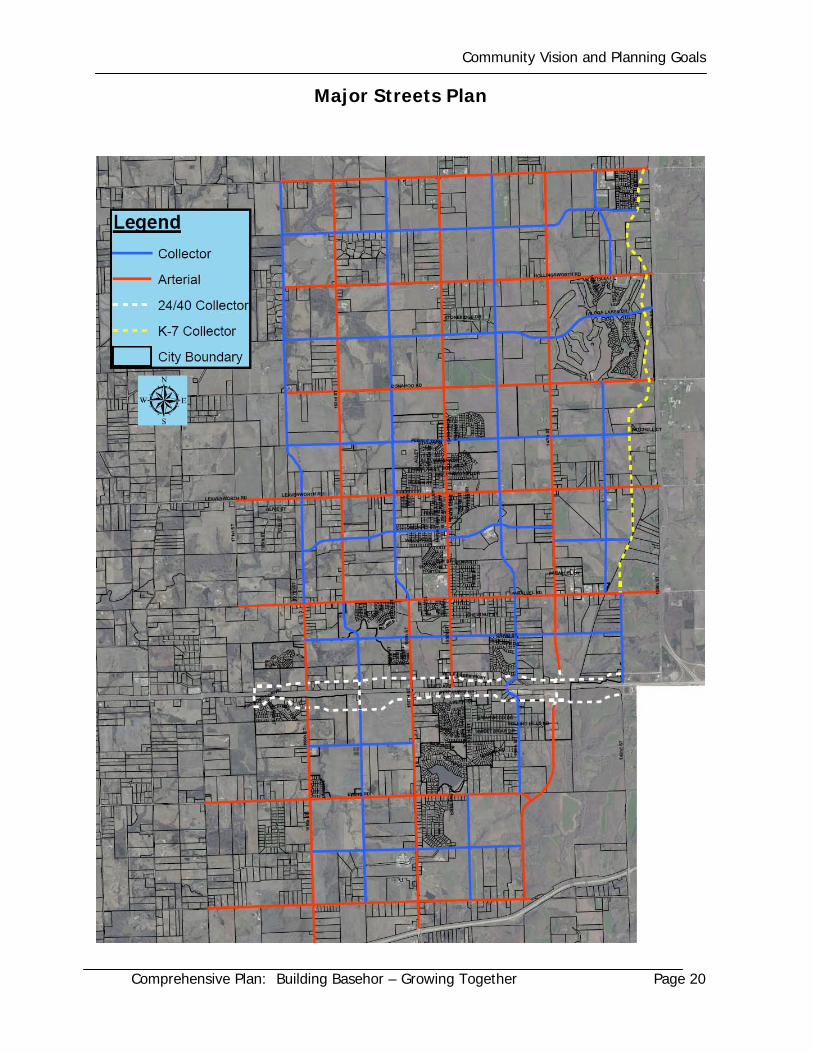
Transportation is a vital component of the community and affects almost every aspect of activity within the community. Community planning and transportation are greatly interrelated and interdependent. Development is often contingent upon an adequate transportation system, which generally requires construction of new roadways or repair of existing ones. To ensure the transportation network is developed in a manner that will adequately handle the City’s traffic and be conducive to efficient maintenance, it is important for the community to develop transportation goals and a Major Streets Plan.
Goal: Establish an efficient transportation system capable of supporting the community’s growing population while keeping maintenance costs to a minimum.
Strategy: Ensure a strong transportation system. Action Steps:
1. Use the Major Streets Plan as a guide for development (see following page). 2. Annually review traffic trends to forecast future improvement needs. Coordinate such
needs with the Capital Improvement Program. 3. Continue annual Pavement Management Program to maintain the existing
transportation system. 4. Coordinate the Capital Improvement Program needs with County, State, and Federal
grant programs. 5. Coordinate transportation improvements with the Kansas Department of
Transportation’s K-7 Corridor Management Plan and US-24/40 Corridor Study. 6. Require developers to build streets to the appropriate level as specified on the Major
Streets Plan. 7. Acquire right-of-way for anticipated future roadways during the subdivision of property
throughout the City.
Strategy: Ensure quality construction to reduce maintenance costs. Action Steps:
1. Review proposed streets in terms of compactness and connectedness to increase maintenance efficiency.
2. Review design standards and specifications for roadway construction.
Strategy: Provide appropriate facilities to accommodate pedestrian traffic. Action Steps:
1. Review transportation plans in relation to the Parks Plan to ensure pedestrian and bicycle connections.
2. Conduct a sidewalk gap survey and prioritize areas of improvements. 3. Partner with the School District on submitting an application to Safe Routes to School
Program for sidewalk improvements.
Community Vision and Planning Goals
Comprehensive Plan: Building Basehor – Growing Together Page 20
Major Streets Plan
Community Vision and Planning Goals
Comprehensive Plan: Building Basehor – Growing Together Page 21
Public Safety
A community’s ability to provide efficient and effective life and safety services is a good indicator of its quality of life. The community will be in a better position to achieve its public safety goals if life and safety services are taken into consideration during the planning process and when development goals are established. This is especially important for growing communities because as the growth continues so will the demand for services. Goal: Provide life and safety services that meet the needs of the citizens efficiently and effectively. Strategy: Provide improved life and safety services for current and future citizens. Action Steps:
1. Maintain appropriate public safety staff levels as the City grows. 2. Coordinate public safety concerns during the planning stages of new development. 3. Address public safety concerns to existing developments or neighborhoods. 4. Communicate development trends and concerns with the Leavenworth County
Emergency Medical Service (EMS), Fairmount Fire Department, and the Office of Leavenworth County Emergency Management.
5. Encourage public safety training to the public. 6. Continue public safety communication.
Community Vision and Planning Goals
Comprehensive Plan: Building Basehor – Growing Together Page 22
City Center
For many cities, the city center is the core and primary activity center of the city. A healthy and vibrant city center boosts the economic health and quality of life in a community. Basehor is unique due to the existing downtown is small creating an opportunity for the community to design and build its city center with few pre-existing conditions or restraints. The proposed city center boundaries (north-south) is the City Park to Basehor Community Library and (west-east) the City Park to Basehor Intermediate School. The city center includes:
Basehor Community Library Basehor Elementary School Basehor High School Basehor Historical Museum Basehor Intermediate School Basehor VFW City Hall City Park Fairmount Fire Department
Goal: Establish a vibrant and diversified city center that provides a central gathering place for the community. Strategy: Provide a city center that is located near public facilities, schools, and parks conducive to pedestrian activities. Action Steps:
1. Incorporate green space and public areas in the design and connect these areas to the City’s parks and trail system.
2. Require wider sidewalks in the city center area.
Strategy: Incorporate a mix of uses, including retail, office, institutional, residential and recreational into the city center. Action Steps:
1. Establish zoning to allow a mix of uses and to create areas of transition from commercial in the city center to higher density residential/ row houses to traditional single-family homes.
2. Consider a community or civic center.

Community Vision and Planning Goals
Comprehensive Plan: Building Basehor – Growing Together Page 23
Parks and Recreation Goal: Have a park system that meets the recreational needs of the citizens. Per the 2012 Community Survey results, citizens support maintenance and construction investments toward sidewalks, parks, and trails. Strategy: Develop an action plan for the growth of parks, trails, and recreation within a two-year timeframe. Action Steps:
1. Conduct a Community Parks and Recreation Needs Survey to identify future investments.
2. Compare the survey to the existing infrastructure and programs in place. 3. City Council administers the selection of individual needs and creates a financial plan
to execute. 4. Planning Commission, Park Association, and Staff develop near and long term project
schedule to be approved by City Council in coordination with the financial plan. 5. Update the Future Parks Plan Map.
Strategy: Develop a City Wide trail system that links parks together. Action Steps:
1. Requiring developers to dedicate land for trails. 2. Ensure that street plans include pedestrian connections. 3. Work with the County and Leavenworth County Cities in adopting a countywide trails
plan. Strategy: Increase the number of parks and recreation. Action Steps:
1. Work with the Park Association regarding future needs of existing and future parks. 2. Create a master plan for the Field of Dreams sports complex. 3. Review the parkland dedication ordinance for new development within a two-year
timeframe. 4. Continue the incorporation of trails in the Capital Improvement Program.
The 2006 Future Parks Plan (see following page) will remain in the Comprehensive Plan until it is revised as part of an action step with in the next two years.

Community Vision and Planning Goals
Comprehensive Plan: Building Basehor – Growing Together Page 24
Existing Parks Plan

Community Vision and Planning Goals
Comprehensive Plan: Building Basehor – Growing Together Page 25
Education
Education is critical to a community’s economic well-being. Research has shown that quality public schools can help make states and localities more economically competitive and public schools indisputably influence residential property values both positively and negatively. It is important to understand that schools belong to the community. As such, it takes the whole community to ensure that the product is of high quality. Goal: Have a school system that meets the needs of the community while exceeding State requirements Strategy: Improve the relationship between the school and the community. Action Steps:
1. Establish a liaison between the School Board and City Council (i.e. - have a representative from each organization attend the meetings of the other organization).
2. Have the City Council review their meeting schedule to coincide with other public boards and State requirements.
3. Increase the amount of press educational issues receive. 4. Have more school sponsored/ co-sponsored youth activities. 5. Educate the community on the importance of education. 6. Create a brochure showing the figures of the Basehor-Linwood School District
compared to surrounding districts. Strategy: As growth continues, consider possibility of a junior college to be located in Basehor.
Community Vision and Planning Goals
Comprehensive Plan: Building Basehor – Growing Together Page 26
Economic Development
Goal: Encourage development in the City of Basehor in an orderly and efficient pattern, providing services for growth in a fiscally responsible manner. Strategy: Insure adequate developable land and sound capital improvement planning through controlled growth and annexation. Action Steps:
1. Annually review growth patterns and make necessary revisions to the Comprehensive Plan and Capital Improvement Program as necessary.
2. Plan for expansion of municipal services to target growth areas and extend municipal services only upon annexation.
3. Encourage new urban development to locate in areas where municipal services and public facilities are already present or where service can easily be extended.
Strategy: Minimize initial and future private and public costs of new development. Action Steps:
1. The cost of any on-site or off-site required improvements to a subdivision, which improvements exclusively serve the subdivision, shall be borne by the developer or owners of property within the subdivision.
Strategy: Attract commerce to the City. Action Steps:
1. Create a marketing strategy to attract visitors to Basehor businesses and coordinate with regional events to bring people to Basehor.
2. Promote existing businesses. 3. Create a search committee within 3 months to actively search for new businesses. 4. Annually review the Development Standards to ensure responsible and competitive
growth. Partner with the Chamber of Commerce, Leavenworth County Development Corporation, MARC, and the State of Kansas for economic opportunities.
5. Encourage tax incentive programs. 6. Work with KDOT to install Basehor signs along I-70 and K-7. 7. Organize an open house with the School District for employees of new businesses to
the Kansas metro area. 8. Assist the promotion of Basehor Dairy Days outside the community.
Community Vision and Planning Goals
Comprehensive Plan: Building Basehor – Growing Together Page 27
Future Land Uses/ Future Land Use Map With continued growth the City must make decisions on expansion, new developments and zoning. A key factor in the decision making process, especially regarding zoning, is conformance with the Comprehensive Plan and Future Land Use Map. The Future Land Use Map identifies locations where different land uses may occur during the next 10 to 20 years and where the City would support the development of these uses. The Future Land Use Map is not intended to provide specific land use designations for individual parcels. Instead, it establishes broad guidelines for land use patterns and should be applied in combination with the goals, guiding principles, and policies contained in the Comprehensive Plan document. The Future Land Use Map shows general land use categories - residential, mixed use, commercial, industrial, parks and public - while the Comprehensive Plan explains the types of developments that may occur within each land use designation. Residential The majority of the Future Land Use Map is designated as residential. Although the Map generally shows this as one classification, there are four different types of residential development: Suburban Residential, Single Family Residential, Two-Family Residential, and Multi-Family Residential. The type of residential development appropriate for a specific area will depend on several factors including, but not limited to, surrounding land uses, transportation systems and availability of services. The following information describes each type of residential development and will assist in determining the appropriate location for each type and in evaluating development proposals. SUBURBAN RESIDENTIAL (R-O): The Suburban Residential designation is intended to provide a rural setting for large-lot, very low-density single-family housing on the urban fringe. Lot sizes and layouts for Suburban Residential developments are largely dependent upon topographical constraints. In many cases, large portions of the lot remain in an undisturbed state, reinforcing the rural character of this development pattern. Due to their location on the urban fringe, individual sewage treatment systems, and either individual water wells or rural water districts, may serve the homes; however, if possible this situation should be avoided and the development should connect to City services. Homes typically occur on tracts between 2 and 20 acres in size, but in some cases tracts may exceed 20 acres. Suburban Residential development is typically located at the fringe of urban development and near existing rural/ suburban residential subdivisions. Suburban residential sites are generally located in agricultural areas, areas where the terrain offers rolling and hillside sites, and areas with more terrain relief, such as near rivers. In some cases, they serve as a transition between more intense urban neighborhoods and natural features to be protected. Cluster development patterns should be utilized as a means of preserving scenic views and providing open space for the common use and enjoyment of residents. The use of cluster development patterns as a means of preserving cohesive blocks of agricultural land is also encouraged. Access road and driveway configurations should follow the natural contours of topographic features to minimize slope disturbances, maximize scenic views, and conserve natural features and vegetation. Access management policies should be established along rural
Community Vision and Planning Goals
Comprehensive Plan: Building Basehor – Growing Together Page 28
highways and highway corridors leading into the community to reduce the number of uncontrolled access points and improve safety. SINGLE FAMILY RESIDENTIAL District (R-1): Single Family Residential is considered Low Density Residential consisting mainly of single-family detached dwellings. This category is also appropriate for planned public and semi-public uses which are generally considered compatible with residential uses. 1.0 to 5.0 units per acre. The intent of this district is to create a transition between Suburban Residential (R-O) and Two-Family Residential (R-2) development patterns. Low Density Residential neighborhoods are typically located away from major shopping centers and major thoroughfares, such as Highway 24 and 7; however they still remain connected to these services with convenient access and interconnected roadway systems. Low Density Residential neighborhoods are within walking distance to community facilities and services that will be utilized by residents of the neighborhood, including schools, parks, and other community facilities. Where topographically feasible, neighborhoods should be bounded by parks, public areas or collector streets with accessible connection to work, shopping and leisure activities. To avoid monotonous streetscapes, the incorporation of a variety of housing models and sizes is strongly encouraged in all new development. TWO-FAMILY RESIDENTIAL DISTRICT(R-2): Two-Family Residential District is considered Moderate Density Residential consisting of smaller lot single-family detached and attached dwellings and duplexes. This category is also appropriate for planned public and semi-public uses which are generally considered compatible with residential uses. 4.0 to 7.0 units per acre. The intent of this district is to create a transition between Single Family Residential (R-1) and Multi-Family Residential (R-3) development patterns. MULTI-FAMILY Residential District (R-3): Multi-Family Residential District is considered High Density Residential consisting of single, two-, and multi-family dwellings. More than 5.0 units and up to 12.0 units per acre. The intent of this district is to create a transition between Two-Family Residential District (R-2) and Commercial District development patterns. In developed areas of the City, the scale and density of individual structures should be limited as necessary to maintain harmony with the surrounding area. However, retirement homes, rest homes, adult congregate living facilities and similar uses also may be appropriate in this category at higher densities and higher unit counts given that the impact of these types of dwellings units is often far less than a “standard” residential development. Multi-Family Residential Districts should be located close to arterial and collector streets. The neighborhoods should possess direct connection to work, shopping, and leisure activities, but settings where the only access provided consists of local streets passing through lower density neighborhoods should be avoided. To avoid monotonous streetscapes, the incorporation of a variety of housing models and sizes is strongly encouraged. Larger buildings shall be designed with a variety of wall planes and roof forms to create visual interest. Projects should be compatible with the established mass and scale of other buildings along the block.
Community Vision and Planning Goals
Comprehensive Plan: Building Basehor – Growing Together Page 29
PLANNED RESIDENTIAL DISTRICT (P-R) Planned Residential District is intended to offer a mixture of residential opportunities in a single development. The purpose of this district is to provide for elements of flexibility in design, placement, arrangement, bulk, and other considerations; to interrelated and compatible with the residential character of these development areas and adjacent developments; and to maintain the desired overall intensity; efficiency in the provision of public facilities and services, and to provide protection for existing development while allowing new construction in accordance with current development and performance standards and density objectives. Dwelling units within the district should be developed with a variety of architectural styles and layouts. Planned Residential Districts shall contain a minimum 40 acres of land. Planned Residential Districts shall contain a minimum of three (3) dwelling unit types (minimum ten percent (10%) of the overall housing units to count). The different dwelling units include the following:
1. Multi-family dwellings containing more than 4 units per building; 2. Single-family detached dwellings; 3. Single-family units served by alleys; 4. Two-family dwellings; 5. Triplexes, or four-plexes; 6. Assisted living; 7. Elderly housing.
Mixed Use The vision for Mixed Use entails a traditional city center with a compact, vibrant setting at a pedestrian scale with a mix of uses including businesses, services, shopping, recreational opportunities, and residential. The most prominent mixed used area will be in and around the city center, but areas with an urban residential character may also support mixed use, provided the scale, location and design is compatible with the character and intensity of the neighborhood. MIXED USE RESIDENTIAL DISTRICT (MU-1): The Comprehensive Plan encourages that walkable, mixed-used neighborhoods be incorporated into Basehor’s new development. These developments are intended to consist of a variety of residential uses, civic, cultural, retail, commercial and business uses, and professional offices and financial institutions in a compact, vibrant setting at a pedestrian friendly scale. They shall be designed to include a network of direct and interconnected streets, pedestrian, and bicycle connections. Mixed use areas should be internally served by a system of collector and local streets, as well as sidewalks and pedestrian and bicycle pathways.
Community Vision and Planning Goals
Comprehensive Plan: Building Basehor – Growing Together Page 30
Developments should contain a focal point or activity center which possesses the most intense and largest number of uses. From this activity center uses should become less intense transitioning from commercial to higher density residential to low density residential. The transitioning should be gradual, allowing one area to interface well with the other. Mixed use neighborhoods shall be designed in a manner which protects and preserves natural features of the site, including mature stands of trees, wetlands, drainages, or ridgelines, as open space amenities that serve as identifying or character defining features. Infill and redevelopment shall be designed in a manner that is sensitive to and reflects the character of the surrounding neighborhood. Important design considerations include building scale, mass, roof form, height, and orientation, parking location, lot coverage, architectural character, and landscape elements. Conversion of upper floors above retail storefronts to office or residential uses is strongly encouraged to reinforce the variety and vitality of the city center environment. The provision of outdoor dining and seating areas along the sidewalk edge is strongly encouraged, particularly in the city center area, to create activity along the street and increase the overall vitality of the area. Active, visible uses that encourage pedestrian activity, such as restaurants or retail storefronts, are most appropriate as first floor uses in the core area of the city center. Offices, residential, or other uses that typically are “closed off” from the street and lend little to the pedestrian atmosphere should be encouraged as upper floor uses in retail areas. Neighborhood streets and access roads should follow the natural contours of topographic features to minimize slope disturbances, maximize scenic views, and conserve natural features and vegetation. Access management shall be provided along arterial streets to limit the number of curb-cuts and maintain traffic carrying capacity and safety. Commercial Currently, a fairly small number of commercial areas provide the residents with goods and services. Commercial developments must be located and designed to balance market opportunities with access and location. In addition, the location and design of commercial areas must be incorporated into surrounding areas, rather than altering the character of surrounding neighborhoods. Area along Highway 24 continues to remain the primary hub of commercial activity for the City of Basehor. Future commercial activity will increase along Highway 24 and 7. The city center area will eventually become the main service and activity center with pedestrian scale commercial uses. Several main intersections are designated as commercial in order to provide opportunities for neighborhood commercial development. The exact location and size of these commercial areas will be contingent upon development. Commercial proposals shall be evaluated based on several factors including the compatibility with the surrounding neighborhood, the impact on the area, and the following guidelines. COMMERCIAL- GENERAL GUIDELINES FOR ALL CATEGORIES The scale, purpose, location, and intensity of a commercial development will determine whether it is designated as Neighborhood Business District, General Business District, or mixed use.

Community Vision and Planning Goals
Comprehensive Plan: Building Basehor – Growing Together Page 31
Commercial centers should be distributed throughout the community to provide ease of access for all residents and minimize the need for cross-town vehicle trips. Commercial services should be concentrated and contained within planned activity centers, or nodes, throughout the community. Development of distinct commercial nodes will help preserve the residential character of many of the major street corridors throughout the community and help prevent the negative impacts caused by multiple access points along a corridor. Commercial activities, when grouped in cohesive centers or nodes, result in more viable areas compared to scattered or isolated single use commercial sites. Activity centers, or nodes, provide a variety of services in a concentrated location to promote “one-stop shopping” and minimize the need for multiple vehicle trips. Each center has a limited number of vehicle access points to minimize impacts on surrounding uses and maintain an efficient traffic flow to and from the site. Uses are typically clustered on larger sites near the intersection of two major streets rather than being developed in linear, “strip” configurations along major street corridors. Linear development patterns, particularly when parcels provide a single use and are developed independently, can require multiple access points and lead to disruption of traffic flow on adjacent streets. Although lot sizes and/or configurations in some areas may warrant the use of a more linear development pattern, it is generally discouraged. New development and redevelopment should include a mix of uses of different types and sizes, creating a diversity of activity and avoiding large, single-use buildings and dominating parking areas. The physical design of commercial development areas shall promote a high quality environment, as expressed by site layout, building materials and design, landscaping, parking area design, and pedestrian-oriented facilities. NEIGHBORHOOD BUSINESS DISTRICT (CP-1) Neighborhood Business District Centers are intended to provide a range of services, including supermarkets, restaurants, movie rentals, drycleaners, drugstores, filling stations, smaller specialty shops, retail and health services and business and professional offices, for residential areas. Neighborhood centers will vary in scale and character. Smaller, limited use centers may be fully integrated into the surrounding neighborhood and be accessed primarily by pedestrian or bicycle; while larger centers will function more independently, providing ample parking and numerous stores. Neighborhood Centers often serve more than one nearby neighborhood in order to maintain sufficient economy of scale. Neighborhood Business District Centers should generally be located at the intersection of arterial and collector streets. However, smaller centers with limited uses may be appropriate within a residential area at the intersection of two collector streets, or at the intersection of a collector and a local street, provided they are designed to be compatible with the surrounding neighborhood and meet a minimum level of design criteria. Neighborhood Business District Centers typically require a site of approximately 1-3 acres depending on the size of its service area and the extent of its mixed-use characteristics. Neighborhood Business District Centers shall be designed to be compatible with and sensitive to surrounding residences. Building materials and architectural detailing should be compatible
Community Vision and Planning Goals
Comprehensive Plan: Building Basehor – Growing Together Page 32
with and reflect the character of the surrounding neighborhood. Building heights and scale should be similar to surrounding residences. Main entrances and driveways should be integrated with the surrounding street network to provide clear connections between uses for vehicles, pedestrians, and bicycles. Clear, direct pedestrian connections shall be provided between uses within the center and to the surrounding neighborhood. Large, uninterrupted expanses of parking should be avoided. Parking areas shall be divided into smaller “blocks” by landscaping and walkways. To the extent possible, parking blocks shall be distributed between the front and sides of buildings, or the front and rear, rather than placed solely in front of the building. Attractive transitions should be provided between the center and surrounding residences, while not limiting access between the center and the neighborhood for all modes of travel. Transitions can be accomplished by stepping down the height of taller structures to meet residences, providing landscape buffers or screening. It is vital to use creative design to avoid simply “walling” off residential areas from neighborhood centers. GENERAL BUSINESS DISTRICT (CP-2) General Business District Centers provide a mix of retail and commercial services in a concentrated and unified setting that serves the local community and may also provide a limited draw for the surrounding region. These centers are typically anchored by a larger national chain, between 120,000 and 250,000 square feet, which may provide sales of a variety of general merchandise, grocery, apparel, appliances, hardware, lumber, and other household goods. Centers may also be anchored by smaller uses, such as a grocery store, and may include a variety of smaller, complementary uses, such as restaurants, specialty stores (such as books, furniture, computers, audio, office supplies, or clothing stores), professional offices and health services. The concentrated, unified design of a community commercial center allows it to meet a variety of community needs in a “one-stop shop” setting, minimizing the need for multiple vehicle trips to various commercial areas around the community. General Business District Centers should be located at the intersection of one or more major arterial streets, specifically along Highway 24/40 and 7. They may be located adjacent to higher density residential neighborhoods and may occur along major highway corridors. Large footprint retail buildings (often known as “big-box” stores) shall only be permitted in areas of the City where adequate access and services can be provided. Typically a site of between 3 and 30 acres is required. General Business District Centers shall be required to meet a basic level of architectural detailing, compatibility of scale with surrounding areas, pedestrian and bicycle access, and mitigation of negative visual impacts such as large building walls, parking areas, and service and loading areas. While these requirements apply to all General Business District development, they are particularly important to consider for larger footprint retail buildings, or “big box” stores. Community commercial services should be concentrated and contained within planned activity centers, or nodes. Within each activity center or node, complementary uses should be

Community Vision and Planning Goals
Comprehensive Plan: Building Basehor – Growing Together Page 33
clustered within walking distance of each other to facilitate efficient, “one-stop shopping”, and minimize the need to drive between multiple areas of the center. Large footprint retail buildings or “big-box” stores should be incorporated as part of an activity center or node along with complementary uses. Isolated single store developments are discouraged. Uninterrupted expanses of parking should be avoided. Parking areas should be broken into smaller blocks divided by landscaping and pedestrian walkways. Parking areas should be distributed between the front and sides of buildings, or front and rear, rather than solely in front of buildings to the extent possible. Clear, direct pedestrian connections should be provided through parking areas to building entrances and to surrounding neighborhoods or streets. Integrate main entrances or driveways with the surrounding street network to provide clear connections between uses for vehicles, pedestrians, and bicycles. Industrial The Industrial designation is intended to provide locations for manufacturing, warehousing and distribution, indoor, and screened outdoor storage, and a wide range of other industrial services and operations. Because of their potential environmental impacts, industrial uses should generally be located away from population centers or must be adequately buffered. Traffic generated by industrial uses should not pass through residential areas. Sites should have access to one or more major arterials or highways capable of handling heavy truck traffic. Railroad access is also beneficial to certain types of industrial uses. Light industrial uses can typically be located in areas that also contain some highway-oriented commercial uses, and might benefit from close proximity and better access to their local customer base. Storage, loading, and work operations should be screened from view along all industrial area boundaries (when adjacent to non-industrial uses) and along all public streets. Such screening shall incorporate features such as trees, plantings and berms. Public/ Institutional and Open Space Public/ Institutional and open space uses may exist in any of the other land use categories provided they are compatible with and have a minimal impact on the surrounding neighborhood. Public or institutional uses involve an array of public facilities such as schools, government offices, community centers, fire stations, libraries, hospitals, cemeteries, and places of worship. It also entails facilities needed for essential public services such as electrical substations, water, and wastewater facilities. Open space uses include numerous kinds of recreational and conservation uses, ranging from ball fields and tot lots to preserved natural areas along stream corridors. Both public and open space uses play an important role in the community and should be incorporated into neighborhoods as development occurs.
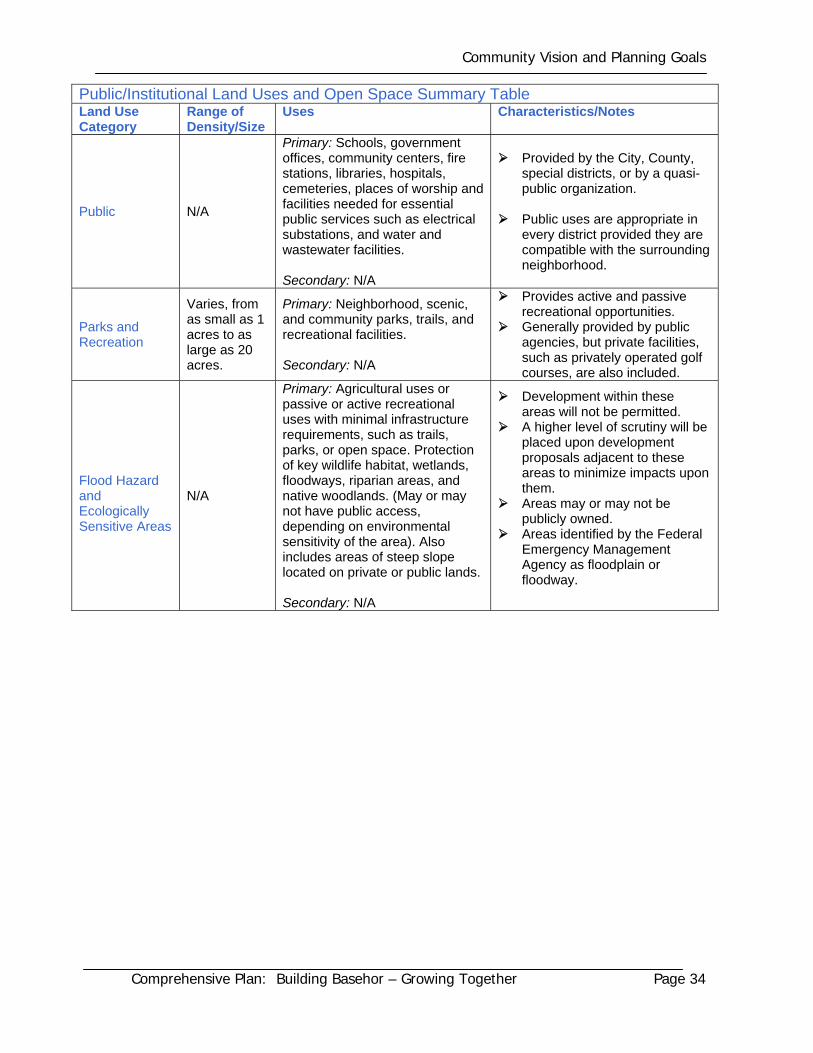
Community Vision and Planning Goals
Comprehensive Plan: Building Basehor – Growing Together Page 34
Public/Institutional Land Uses and Open Space Summary Table Land Use Category
Range of Density/Size
Uses Characteristics/Notes
Public N/A
Primary: Schools, government offices, community centers, fire stations, libraries, hospitals, cemeteries, places of worship and facilities needed for essential public services such as electrical substations, and water and wastewater facilities. Secondary: N/A
Provided by the City, County, special districts, or by a quasi-public organization.
Public uses are appropriate in
every district provided they are compatible with the surrounding neighborhood.
Parks and Recreation
Varies, from as small as 1 acres to as large as 20 acres.
Primary: Neighborhood, scenic, and community parks, trails, and recreational facilities. Secondary: N/A
Provides active and passive recreational opportunities.
Generally provided by public agencies, but private facilities, such as privately operated golf courses, are also included.
Flood Hazard and Ecologically Sensitive Areas
N/A
Primary: Agricultural uses or passive or active recreational uses with minimal infrastructure requirements, such as trails, parks, or open space. Protection of key wildlife habitat, wetlands, floodways, riparian areas, and native woodlands. (May or may not have public access, depending on environmental sensitivity of the area). Also includes areas of steep slope located on private or public lands. Secondary: N/A
Development within these areas will not be permitted.
A higher level of scrutiny will be placed upon development proposals adjacent to these areas to minimize impacts upon them.
Areas may or may not be publicly owned.
Areas identified by the Federal Emergency Management Agency as floodplain or floodway.

Community Vision and Planning Goals
Comprehensive Plan: Building Basehor – Growing Together Page 35
Future Land Use Map

Plan Implementation
Comprehensive Plan: Building Basehor – Growing Together Page 36
Plan Implementation The healthy and orderly growth of a community relies on the successful implementation of a set of well-defined development policies that serve as guidelines for all development decisions at present and in the future. These development policies should be formulated around a well-structured scope of planning that looks ahead and even beyond a pre-set time horizon. Zoning changes, subdivisions, annexation, infill development, redevelopment, and new development should generally be reviewed for conformance with the future land use map. While the map provides recommendations of how land should be developed, it should be remembered that is it only a guide and other factors should also be evaluated when determining the ultimate development pattern of the community. Utilizing the Comprehensive Plan to evaluate future growth is important, but near-term implementation is essential as well. The full effect of the Plan is realized through the application of codes and ordinances, rules and regulations, and policies and programs that the City adopts and enforces on a daily basis. Following are the roles played by key policy makers and officials, and the relationship of the Plan to Basehor’s regulations. The Public’s Role – Civic Responsibility Civic responsibility is critical to the strength of the community. Citizens who actively participate to make the community a better place understand that their neighborhoods and community will grow and strengthen only with their participation. At the same time they recognize that the overall well-being of the community is in their individual interest. It is this mutual dependence and benefit that builds strong neighborhoods and communities. As such, the citizens of Basehor should be embraced – their leadership welcomed and dedication, enthusiasm and talents directed toward community betterment. The Plan is developed based on this principle. Likewise, as the community progresses and the Plan evolves, citizen input and support will be critical to the Plan’s implementation and reaching the preferred future of Basehor. Role of the Planning Commission The following are the roles of the Planning Commission in the planning and zoning process.
1. Adopt a Comprehensive Plan for the physical development of land within the City of Basehor and Basehor’s anticipated growth area. The Comprehensive Plan shall be reviewed annually in January. a. Before amending the Comprehensive Plan, hold a public hearing. b. After adoption, certify a copy of the adopted Plan to the City Council and City
Clerk. c. Record a copy of the adopted Comprehensive Plan in the Office of the County
Register of Deeds office. d. Revise the Zoning Ordinance per the adopted Comprehensive Plan by July
annually. 2. Assist in facilitating the implementation of the Comprehensive Plan.
Plan Implementation
Comprehensive Plan: Building Basehor – Growing Together Page 37
3. Serve as an advisory body to the City Council. a. Hold public hearings to obtain public opinion regarding each rezoning and special
use permit application and proposed zoning ordinance text amendment. b. Provide a recommendation to the City Council on each rezoning, special use
permit, proposed zoning ordinance text amendment, plat, and site plan application. When making recommendations regarding rezoning and special use permit requests, the Planning Commission should consider Kansas case law, specifically the seven golden criteria, in determining whether the request has merit. These criteria are: i. Whether the zoning/ use would be consistent with the zoning and uses of
nearby properties. ii. Whether the zoning/ use is compatible with the character of the
neighborhood. iii. Suitability of the property for uses to which it has been restricted. iv. Extent of detrimental effects to nearby parcels should the rezoning/ permit
be approved. v. Length of time the property has remained vacant as zoned. vi. Relative gain to the public health, safety and welfare as opposed to the
hardship imposed upon the landowner by denying the request. vii. Whether the zoning/ use is in keeping with the Comprehensive Plan.
4. Initiate requests for studies and plans regarding Basehor’s growth, development, or other land use issue.
Role of the City Council The following are the roles of the City Council in the planning and zoning process.
1. Adopt and amend the Comprehensive Plan after considering the Planning Commission’s recommendation.
2. Facilitate the implementation of the Comprehensive Plan. 3. Take action on each rezoning, special use permit, proposed zoning ordinance text
amendment, plat, and site plan application after considering the Planning Commission’s recommendation.
4. Approve annexation following the appropriate considerations. 5. Grant waivers to required public improvements and/ or public improvement
specifications of the Subdivision Regulations as deemed necessary. 6. Accept or reject dedications of easements, rights-of-way, and public lands on
subdivision final plats. 7. Approve engineering plans for construction of public improvements. 8. Approve financial guarantees or financing mechanisms to ensure construction of all
public improvements within subdivision plats. 9. Accept public improvements after they have been constructed and are found to have
been constructed in accordance with the approved engineering plans. Role of City Codes, Specifications, Studies, and Plans The Zoning Ordinance and Subdivision Regulations are the most common legislative tools to implement the Comprehensive Plan. These two sets of code aim to encourage appropriate land use, guide the subdivision of land, promote quality development, and maintain and
Plan Implementation
Comprehensive Plan: Building Basehor – Growing Together Page 38
stabilize the value of property. The City of Basehor needs to assess elements of the Zoning Ordinance and Subdivision Regulations for amendment in response to planning issues and the goals and strategies of the Plan. The following segments outline specific code changes that will facilitate the implementation of the Plan. Zoning Districts Currently, Basehor has 13 zoning districts, which may create confusion and conflicts among districts. It is recommended that the zoning code be amended so the total number of zoning districts is reduced to eight. The eight zoning districts would include the following:
Residential Business R-0 Suburban Residential C-1 Neighborhood Business R-1 Single-Family Residential C-2 General Business R-2 Multi-Family Residential
Industrial Planned I Industrial Planned Development
Mixed Use MU Mixed Use
Regarding the changes in zoning districts, three of the existing zoning districts, MH-1 Mobile Home Park, MH-2 Mobile Home Park, and RV-1 Recreational Vehicle Park would become Planned Districts. In order to facilitate the expansion of mixed use developments a new zoning district is suggested. This could be accomplished in one of two ways. A MU Mixed-Use district could be created, which would allow for mixed-use developments provided certain criteria were followed. Or a PD Planned Development district could be created, which would allow mixed-use developments on a case by case basis with review of a specific development plan. Considering that most of today’s industrial uses have similar impacts on surrounding properties, there would be one industrial zoning district instead of three. With the amended zoning districts several items would need to be addressed. One specific issue is duplexes or two-family dwelling units. Currently, there is a R-2 Two Family Residential District designed to “provide for moderate density residential development, including duplexes and higher density single-family dwellings”. With the restructuring of the districts the community would need to decide if duplexes would be allowed in the R-1 Single Family Residential district, perhaps as a conditional use or if they should only be allowed in the new R-2 Multi-Family Residential district. Another alternative would be to keep both the existing R-2 Two Family Residential district and R-3 Multi-Family Residential district should the community decided that the current number of duplexes and demand for new ones justifies keeping the district. Further, with the alteration and elimination of zoning districts many properties will need to rezoned. City Council, Legal Staff, and Planning Staff shall develop means to transfer properties from the existing zoning districts to the revised zoning districts. Public Works Specifications Low maintenance and longevity of developments are also vital to the community’s livability. Public works specifications will ensure streets, sewer systems, and water systems are built to

Plan Implementation
Comprehensive Plan: Building Basehor – Growing Together Page 39
a uniform standard. In order to facilitate this process it is recommended that the City review and update specifications. Corridor Studies The Kansas Department of Transportation has created a K-7 Corridor Plan and a 24/40 Highway Corridor Study. Both of these plans and studies will impact Basehor. The City will need to be actively engaged in the implementation of the K-7 Corridor Plan and of the 24/40 study as they will impact many aspects of the highways such as traffic flow, access management, and physical image. Additionally, the highway corridor studies will play a role in the decision making process for development along both roadways. Role of the Planning & Zoning Department The Planning & Zoning Department is charged with implementing the policy decisions of the City Council and the Planning Commission. In addition, the Planning & Zoning Department is responsible for performing building inspections and investigating code violations. This is a significant volume of work and as Basehor continues to experience growth the amount of work will increase. This plan recommends that the Planning & Zoning department continue to oversee the different activities, however, they should be separated and additional staff should be provided to focus on each of the critical areas: planning and zoning, building codes and permits, and code enforcement. This would allow for a more thorough evaluation of issues as they arise. The costs associated with the Planning & Zoning Department partly offset by the fees collected for applications, permits, and violations. The existing fee structure should be reviewed and compared with other similar communities so that appropriate changes can be made, while keeping the fees competitive with other communities. The Basis of Decision-Making The Comprehensive Plan forms a guide for enforcing zoning and subdivision regulations. As with other “police powers,” the exercise of zoning and subdivision regulations is subject to certain legal limitations. One of the most important of these limitations requires that zoning and subdivision regulations cannot be applied in an “arbitrary and capricious” manner. Decisions regarding zoning and subdivision issues cannot be fixed or arrived at through exercise of will or by caprice, without consideration or adjustment with reference to principles, circumstances, or significance. The Comprehensive Plan serves as a foundation for making educated and logical decisions regarding application of the City’s regulations. Consistency with the Comprehensive Plan should be one of the matters considered when reviewing regulatory applications including proposed zoning district changes (rezoning), annexations, development plans (site plans), subdivisions (plats), special use permits, text amendments, and ordinance updates.

Appendix A: Demographic Data
Comprehensive Plan: Building Basehor – Growing Together Page 40
Appendix A: Demographic Data
DP-1. Profile of General Population and Housing Characteristics: 2010 Data Set: 2010 Demographic Profile Data Geographic Area: Basehor city, Kansas
NOTE: For more information on confidentiality protection, nonsampling error, and definitions, see http://www.census.gov/prod/cen2010/doc/dpsf.pdf.
Subject Number Percent SEX AND AGE Total population 4,613 100% Under 5 years 340 7.4% 5 to 9 years 336 7.3% 10 to 14 years 349 7.6% 15 to 19 years 301 6.5% 20 to 24 years 171 3.7% 25 to 29 years 287 6.2% 30 to 34 years 359 7.8% 35 to 39 years 333 7.2% 40 to 44 years 332 7.2% 45 to 49 years 301 6.5% 50 to 54 years 354 7.7% 55 to 59 years 314 6.8% 60 to 64 years 275 6.0% 65 to 69 years 200 4.3% 70 to 74 years 126 2.7% 75 to 79 years 87 1.9% 80 to 84 years 80 1.7% 85 years and over 68 1.5% Median age (years) 37.6 ( X ) 18 years and over 3,389 73.5% 21 years and over 3,262 70.7% 62 years and over 712 15.4% 65 years and over 561 12.2% Male population 2,239 48.5%
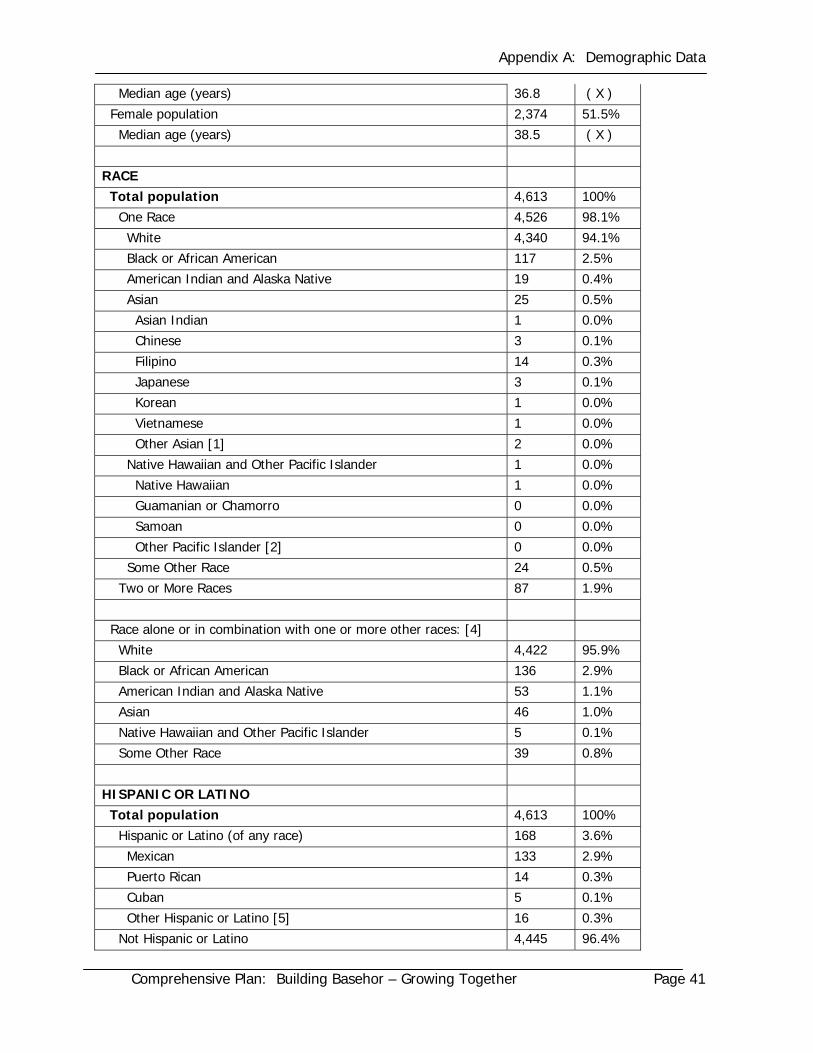
Appendix A: Demographic Data
Comprehensive Plan: Building Basehor – Growing Together Page 41
Median age (years) 36.8 ( X ) Female population 2,374 51.5% Median age (years) 38.5 ( X ) RACE Total population 4,613 100% One Race 4,526 98.1% White 4,340 94.1% Black or African American 117 2.5% American Indian and Alaska Native 19 0.4% Asian 25 0.5% Asian Indian 1 0.0% Chinese 3 0.1% Filipino 14 0.3% Japanese 3 0.1% Korean 1 0.0% Vietnamese 1 0.0% Other Asian [1] 2 0.0% Native Hawaiian and Other Pacific Islander 1 0.0% Native Hawaiian 1 0.0% Guamanian or Chamorro 0 0.0% Samoan 0 0.0% Other Pacific Islander [2] 0 0.0% Some Other Race 24 0.5% Two or More Races 87 1.9% Race alone or in combination with one or more other races: [4] White 4,422 95.9% Black or African American 136 2.9% American Indian and Alaska Native 53 1.1% Asian 46 1.0% Native Hawaiian and Other Pacific Islander 5 0.1% Some Other Race 39 0.8% HISPANIC OR LATINO Total population 4,613 100% Hispanic or Latino (of any race) 168 3.6% Mexican 133 2.9% Puerto Rican 14 0.3% Cuban 5 0.1% Other Hispanic or Latino [5] 16 0.3% Not Hispanic or Latino 4,445 96.4%

Appendix A: Demographic Data
Comprehensive Plan: Building Basehor – Growing Together Page 42
RELATIONSHIP Total population 4,613 100% In households 4,613 100% Householder 1,751 38.0% Spouse [6] 1,100 23.8% Child 1,439 31.2% Own child under 18 years 1,142 24.8% Other relatives 161 3.5% Under 18 years 67 1.5% 65 years and over 30 0.7% Nonrelatives 162 3.5% Under 18 years 15 0.3% 65 years and over 13 0.3% Unmarried partner 81 1.8% In group quarters 0 0.0% Institutionalized population 0 0.0% Noninstitutionalized population 0 0.0% HOUSEHOLDS BY TYPE Total households 1,751 100% Family households (families) [7] 1,337 76.4% With own children under 18 years 610 34.8% Husband-wife family 1,100 62.8% With own children under 18 years 465 26.6% Male householder, no wife present 72 4.1% With own children under 18 years 47 2.7% Female householder, no husband present 165 9.4% With own children under 18 years 98 5.6% Nonfamily households [7] 414 23.6% Householder living alone 338 19.3% Male 139 7.9% 65 years and over 25 1.4% Female 199 11.4% 65 years and over 111 6.3% Households with individuals under 18 years 654 37.4% Households with individuals 65 years and over 395 22.6% Average household size 2.63 ( X )

Appendix A: Demographic Data
Comprehensive Plan: Building Basehor – Growing Together Page 43
Average family size [7] 3.02 ( X ) HOUSING OCCUPANCY Total housing units 1,881 100% Occupied housing units 1,751 93.1% Vacant housing units 130 6.9% For rent 36 1.9% Rented, not occupied 1 0.1% For sale only 67 3.6% Sold, not occupied 7 0.4% For seasonal, recreational, or occasional use 0 0.0% All other vacants 19 1.0% Homeowner vacancy rate (percent) [8] 4.6 ( X ) Rental vacancy rate (percent) [9] 8.8 ( X ) HOUSING TENURE Occupied housing units 1,751 100% Owner-occupied housing units 1,377 78.6% Population in owner-occupied housing units 3,711 ( X ) Average household size of owner-occupied units 2.69 ( X ) Renter-occupied housing units 374 21.4% Population in renter-occupied housing units 902 ( X ) Average household size of renter-occupied units 2.41 ( X ) X Not applicable. [1] Other Asian alone, or two or more Asian categories. [2] Other Pacific Islander alone, or two or more Native Hawaiian and Other Pacific Islander categories. [3] One of the four most commonly reported multiple-race combinations nationwide in Census 2000. [4] In combination with one or more of the other races listed. The six numbers may add to more than the total population, and the six percentages may add to more than 100 percent because individuals may report more than one race.
[5] This category is composed of people whose origins are from the Dominican Republic, Spain, and Spanish-speaking Central or South American countries. It also includes general origin responses such as "Latino" or "Hispanic."
[6] "Spouse" represents spouse of the householder. It does not reflect all spouses in a household. Responses of "same-sex spouse" were edited during processing to "unmarried partner."
[7] "Family households" consist of a householder and one or more other people related to the householder by birth, marriage, or adoption. They do not include same-sex married couples even if the marriage was performed in a state issuing marriage certificates for same-sex couples. Same-sex couple households are included in the family households category if there is at least one additional person related to the householder by birth or adoption. Same-sex couple households with no relatives of the housholder present are tabulated in nonfamily households. "Nonfamily households" consist of people living alone and households which do not have any members related to the
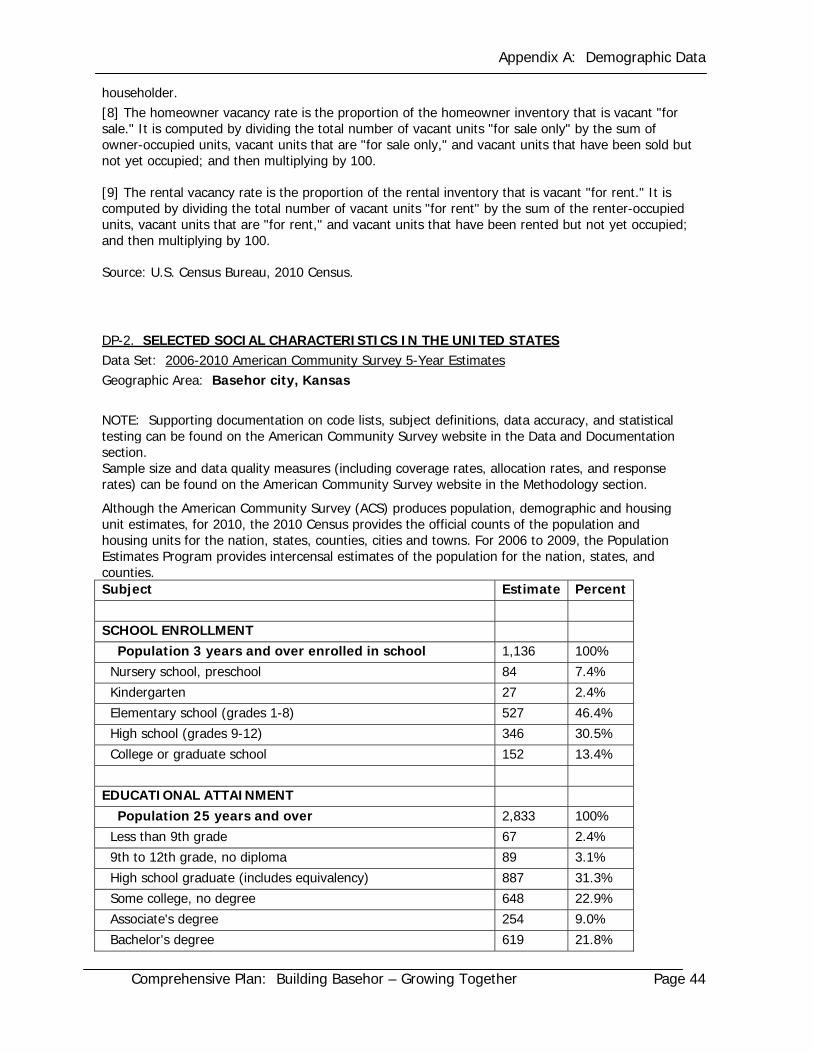
Appendix A: Demographic Data
Comprehensive Plan: Building Basehor – Growing Together Page 44
householder. [8] The homeowner vacancy rate is the proportion of the homeowner inventory that is vacant "for sale." It is computed by dividing the total number of vacant units "for sale only" by the sum of owner-occupied units, vacant units that are "for sale only," and vacant units that have been sold but not yet occupied; and then multiplying by 100.
[9] The rental vacancy rate is the proportion of the rental inventory that is vacant "for rent." It is computed by dividing the total number of vacant units "for rent" by the sum of the renter-occupied units, vacant units that are "for rent," and vacant units that have been rented but not yet occupied; and then multiplying by 100.
Source: U.S. Census Bureau, 2010 Census. DP-2. SELECTED SOCIAL CHARACTERISTICS IN THE UNITED STATES Data Set: 2006-2010 American Community Survey 5-Year Estimates Geographic Area: Basehor city, Kansas NOTE: Supporting documentation on code lists, subject definitions, data accuracy, and statistical testing can be found on the American Community Survey website in the Data and Documentation section. Sample size and data quality measures (including coverage rates, allocation rates, and response rates) can be found on the American Community Survey website in the Methodology section.
Although the American Community Survey (ACS) produces population, demographic and housing unit estimates, for 2010, the 2010 Census provides the official counts of the population and housing units for the nation, states, counties, cities and towns. For 2006 to 2009, the Population Estimates Program provides intercensal estimates of the population for the nation, states, and counties. Subject Estimate Percent SCHOOL ENROLLMENT Population 3 years and over enrolled in school 1,136 100% Nursery school, preschool 84 7.4% Kindergarten 27 2.4% Elementary school (grades 1-8) 527 46.4% High school (grades 9-12) 346 30.5% College or graduate school 152 13.4% EDUCATIONAL ATTAINMENT Population 25 years and over 2,833 100% Less than 9th grade 67 2.4% 9th to 12th grade, no diploma 89 3.1% High school graduate (includes equivalency) 887 31.3% Some college, no degree 648 22.9% Associate's degree 254 9.0% Bachelor's degree 619 21.8%

Appendix A: Demographic Data
Comprehensive Plan: Building Basehor – Growing Together Page 45
Graduate or professional degree 269 9.5% Percent high school graduate or higher (X) 94.5% Percent bachelor's degree or higher (X) 31.3% MARITAL STATUS Males 15 years and over 1,563 100% Never married 326 20.9% Now married, except separated 1,096 70.1% Separated 0 0.0% Widowed 20 1.3% Divorced 121 7.7% Females 15 years and over 1,798 100% Never married 384 21.4% Now married, except separated 1,037 57.7% Separated 13 0.7% Widowed 153 8.5% Divorced 211 11.7% GRANDPARENTS Number of grandparents living with own grandchildren under 18 years
0 100%
Responsible for grandchildren 0 - VETERAN STATUS Civilian population 18 years and over 3,059 100% Civilian veterans 505 16.5% DISABILITY STATUS OF THE CIVILIAN NONINSTITUTIONALIZED POPULATION
Total Civilian Noninstitutionalized Population (X) (X) With a disability (X) (X) RESIDENCE 1 YEAR AGO Population 1 year and over 4,151 100% Same house 3,482 83.9% Different house in the U.S. 658 15.9% Same county 303 7.3% Different county 355 8.6% Same state 326 7.9% Different state 29 0.7% Abroad 11 0.3%

Appendix A: Demographic Data
Comprehensive Plan: Building Basehor – Growing Together Page 46
PLACE OF BIRTH Total population 4,192 100% Native 4,133 98.6% Born in United States 4,071 97.1% State of residence 2,626 62.6% Different state 1,445 34.5% Born in Puerto Rico, U.S. Island areas, or born abroad to American parent(s)
62 1.5%
Foreign born 59 1.4% U.S. CITIZENSHIP STATUS Foreign-born population 59 100% Naturalized U.S. citizen 59 100.0% Not a U.S. citizen 0 0.0% YEAR OF ENTRY Population born outside the United States 121 100% Native 62 100% Entered 2000 or later 0 0.0% Entered before 2000 62 100.0% Foreign born 59 100% Entered 2000 or later 33 55.9% Entered before 2000 26 44.1% WORLD REGION OF BIRTH OF FOREIGN BORN Foreign-born population, excluding population born at sea
59 100%
Europe 22 37.3% Asia 10 16.9% Africa 9 15.3% Oceania 0 0.0% Latin America 18 30.5% Northern America 0 0.0% LANGUAGE SPOKEN AT HOME Population 5 years and over 3,968 100% English only 3,869 97.5% Language other than English 99 2.5% Speak English less than "very well" 30 0.8% Spanish 42 1.1%
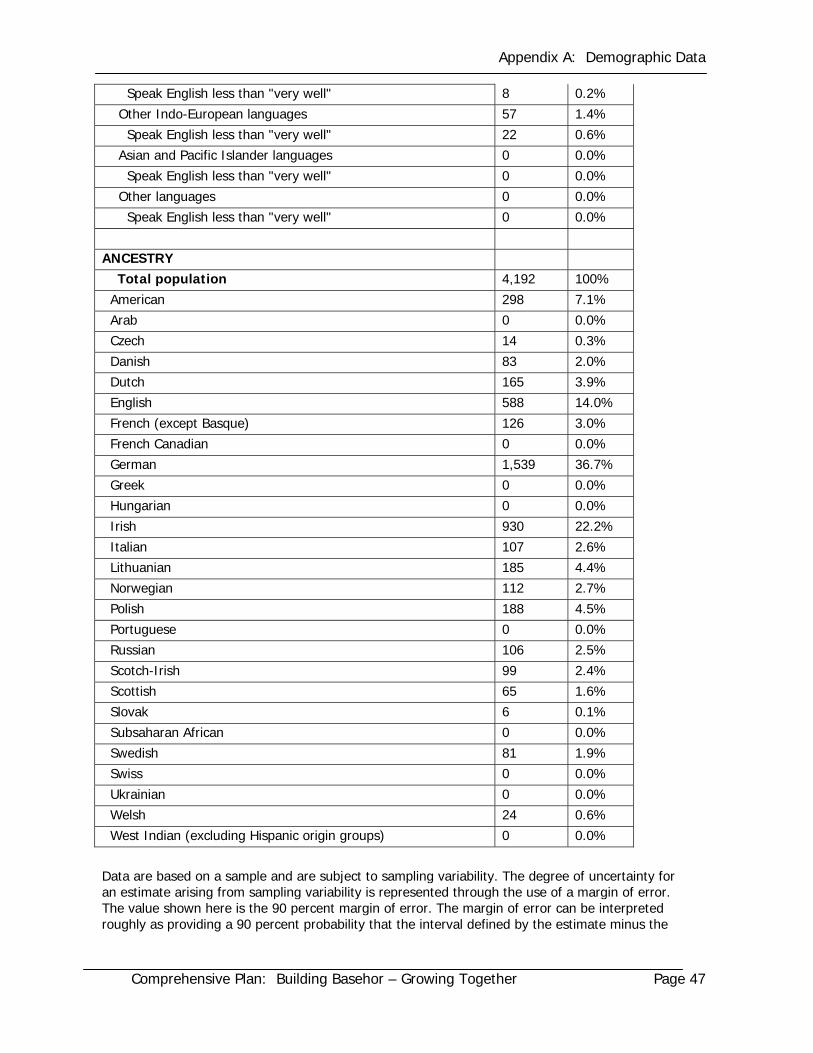
Appendix A: Demographic Data
Comprehensive Plan: Building Basehor – Growing Together Page 47
Speak English less than "very well" 8 0.2% Other Indo-European languages 57 1.4% Speak English less than "very well" 22 0.6% Asian and Pacific Islander languages 0 0.0% Speak English less than "very well" 0 0.0% Other languages 0 0.0% Speak English less than "very well" 0 0.0% ANCESTRY Total population 4,192 100% American 298 7.1% Arab 0 0.0% Czech 14 0.3% Danish 83 2.0% Dutch 165 3.9% English 588 14.0% French (except Basque) 126 3.0% French Canadian 0 0.0% German 1,539 36.7% Greek 0 0.0% Hungarian 0 0.0% Irish 930 22.2% Italian 107 2.6% Lithuanian 185 4.4% Norwegian 112 2.7% Polish 188 4.5% Portuguese 0 0.0% Russian 106 2.5% Scotch-Irish 99 2.4% Scottish 65 1.6% Slovak 6 0.1% Subsaharan African 0 0.0% Swedish 81 1.9% Swiss 0 0.0% Ukrainian 0 0.0% Welsh 24 0.6% West Indian (excluding Hispanic origin groups) 0 0.0% Data are based on a sample and are subject to sampling variability. The degree of uncertainty for an estimate arising from sampling variability is represented through the use of a margin of error. The value shown here is the 90 percent margin of error. The margin of error can be interpreted roughly as providing a 90 percent probability that the interval defined by the estimate minus the

Appendix A: Demographic Data
Comprehensive Plan: Building Basehor – Growing Together Page 48
margin of error and the estimate plus the margin of error (the lower and upper confidence bounds) contains the true value. In addition to sampling variability, the ACS estimates are subject to nonsampling error (for a discussion of nonsampling variability, see Accurcy of the Data). The effect of nonsampling error is not represented in these tables. While the 2006-2010 American Community Survey (ACS) data generally reflect the December 2009 Office of Management and Budget (OMB) definitions of metropolitan and micropolitan statistical areas; in certain instances the names, codes, and boundaries of the principal cities shown in ACS tables may differ from the OMB definitions due to differences in the effective dates of the geographic entities. Estimates of urban and rural population, housing units, and characteristics reflect boundaries of urban areas defined based on Census 2000 data. Boundaries for urban areas have not been updated since Census 2000. As a result, data for urban and rural areas from the ACS do not necessarily reflect the results of ongoing urbanization.
Source: U.S. Census Bureau, 2006-2010 American Community Survey
Explanation of Symbols: 1. An '**' entry in the margin of error column indicates that either no sample observations or too few sample observations were available to compute a standard error and thus the margin of error. A statistical test is not appropriate. 2. An '-' entry in the estimate column indicates that either no sample observations or too few sample observations were available to compute an estimate, or a ratio of medians cannot be calculated because one or both of the median estimates falls in the lowest interval or upper interval of an open-ended distribution. 3. An '-' following a median estimate means the median falls in the lowest interval of an open-ended distribution. 4. An '+' following a median estimate means the median falls in the upper interval of an open-ended distribution. 5. An '***' entry in the margin of error column indicates that the median falls in the lowest interval or upper interval of an open-ended distribution. A statistical test is not appropriate. 6. An '*****' entry in the margin of error column indicates that the estimate is controlled. A statistical test for sampling variability is not appropriate. 7. An 'N' entry in the estimate and margin of error columns indicates that data for this geographic area cannot be displayed because the number of sample cases is too small. 8. An '(X)' means that the estimate is not applicable or not available.
DP-3: SELECTED ECONOMIC CHARACTERISTICS Data Set: 2006-2010 American Community Survey 5-Year Estimates Geographic Area: Basehor city, Kansas
NOTE: Supporting documentation on code lists, subject definitions, data accuracy, and statistical testing can be found on the American Community Survey website in the Data and Documentation section. Sample size and data quality measures (including coverage rates, allocation rates, and response rates) can be found on the American Community Survey website in the Methodology section.
Although the American Community Survey (ACS) produces population, demographic and housing unit estimates, for 2010, the 2010 Census provides the official counts of the population and housing units for the nation, states, counties, cities and towns. For 2006 to 2009, the Population Estimates Program provides intercensal estimates of the population for the nation, states, and counties.

Appendix A: Demographic Data
Comprehensive Plan: Building Basehor – Growing Together Page 49
Subject Basehor city, Kansas
Estimate PercentEMPLOYMENT STATUS Population 16 years and over 3,260 100% In labor force 2,447 75.1% Civilian labor force 2,427 74.4% Employed 2,331 71.5% Unemployed 96 2.9% Armed Forces 20 0.6% Not in labor force 813 24.9% Females 16 years and over 1,750 100% In labor force 1,218 69.6% Civilian labor force 1,218 69.6% Employed 1,177 67.3% Own children under 6 years 280 100% All parents in family in labor force 235 83.9% Own children 6 to 17 years 833 100% All parents in family in labor force 640 76.8% COMMUTING TO WORK Workers 16 years and over 2,302 100% Car, truck, or van -- drove alone 2,085 90.6% Car, truck, or van -- carpooled 127 5.5% Public transportation (excluding taxicab) 0 0.0% Walked 0 0.0% Other means 0 0.0% Worked at home 90 3.9% Mean travel time to work (minutes) 28.6 (X) OCCUPATION Civilian employed population 16 years and over 2,331 100% Management, business, science, and arts occupations 906 38.9% Service occupations 199 8.5% Sales and office occupations 661 28.4% Natural resources, construction, and maintenance occupations 200 8.6% Production, transportation, and material moving occupations 365 15.7% INDUSTRY Civilian employed population 16 years and over 2,331 100% Agriculture, forestry, fishing and hunting, and mining 0 0.0% Construction 193 8.3% Manufacturing 242 10.4% Wholesale trade 111 4.8% Retail trade 222 9.5% Transportation and warehousing, and utilities 283 12.1% Information 93 4.0% Finance and insurance, and real estate and rental and leasing 93 4.0%
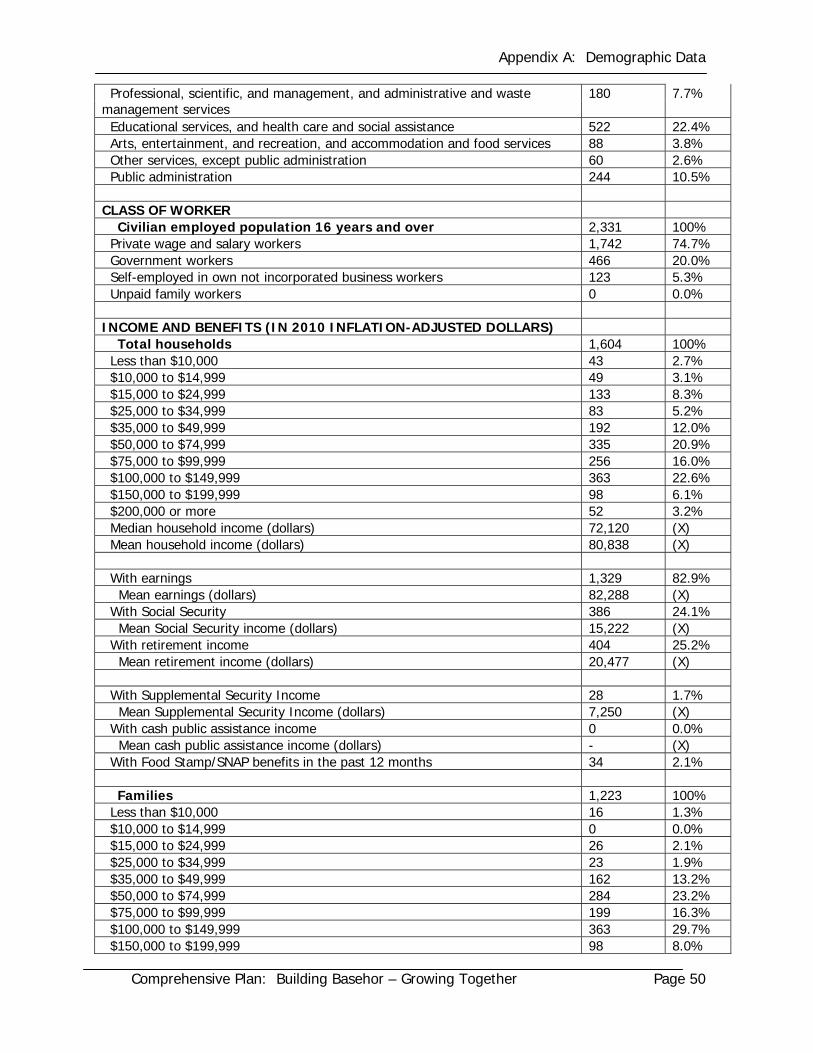
Appendix A: Demographic Data
Comprehensive Plan: Building Basehor – Growing Together Page 50
Professional, scientific, and management, and administrative and waste management services
180 7.7%
Educational services, and health care and social assistance 522 22.4% Arts, entertainment, and recreation, and accommodation and food services 88 3.8% Other services, except public administration 60 2.6% Public administration 244 10.5% CLASS OF WORKER Civilian employed population 16 years and over 2,331 100% Private wage and salary workers 1,742 74.7% Government workers 466 20.0% Self-employed in own not incorporated business workers 123 5.3% Unpaid family workers 0 0.0% INCOME AND BENEFITS (IN 2010 INFLATION-ADJUSTED DOLLARS) Total households 1,604 100% Less than $10,000 43 2.7% $10,000 to $14,999 49 3.1% $15,000 to $24,999 133 8.3% $25,000 to $34,999 83 5.2% $35,000 to $49,999 192 12.0% $50,000 to $74,999 335 20.9% $75,000 to $99,999 256 16.0% $100,000 to $149,999 363 22.6% $150,000 to $199,999 98 6.1% $200,000 or more 52 3.2% Median household income (dollars) 72,120 (X) Mean household income (dollars) 80,838 (X) With earnings 1,329 82.9% Mean earnings (dollars) 82,288 (X) With Social Security 386 24.1% Mean Social Security income (dollars) 15,222 (X) With retirement income 404 25.2% Mean retirement income (dollars) 20,477 (X) With Supplemental Security Income 28 1.7% Mean Supplemental Security Income (dollars) 7,250 (X) With cash public assistance income 0 0.0% Mean cash public assistance income (dollars) - (X) With Food Stamp/SNAP benefits in the past 12 months 34 2.1% Families 1,223 100% Less than $10,000 16 1.3% $10,000 to $14,999 0 0.0% $15,000 to $24,999 26 2.1% $25,000 to $34,999 23 1.9% $35,000 to $49,999 162 13.2% $50,000 to $74,999 284 23.2% $75,000 to $99,999 199 16.3% $100,000 to $149,999 363 29.7% $150,000 to $199,999 98 8.0%

Appendix A: Demographic Data
Comprehensive Plan: Building Basehor – Growing Together Page 51
$200,000 or more 52 4.3% Median family income (dollars) 86,382 (X) Mean family income (dollars) 94,589 (X) Per capita income (dollars) 31,441 (X) Nonfamily households 381 381 Median nonfamily income (dollars) 24,250 (X) Mean nonfamily income (dollars) 34,583 (X) Median earnings for workers (dollars) 40,785 (X) Median earnings for male full-time, year-round workers (dollars) 60,326 (X) Median earnings for female full-time, year-round workers (dollars) 40,876 (X) PERCENTAGE OF FAMILIES AND PEOPLE WHOSE INCOME IN THE PAST 12 MONTHS IS BELOW THE POVERTY LEVEL
All families (X) 1.3% With related children under 18 years (X) 1.4% With related children under 5 years only (X) 0.0% Married couple families (X) 0.8% With related children under 18 years (X) 0.0% With related children under 5 years only (X) 0.0% Families with female householder, no husband present (X) 5.5% With related children under 18 years (X) 11.8% With related children under 5 years only (X) - All people (X) 2.0% Under 18 years (X) 1.3% Related children under 18 years (X) 1.3% Related children under 5 years (X) 0.0% Related children 5 to 17 years (X) 1.6% 18 years and over (X) 2.3% 18 to 64 years (X) 0.8% 65 years and over (X) 11.1% People in families (X) 1.0% Unrelated individuals 15 years and over (X) 10.3%
Data are based on a sample and are subject to sampling variability. The degree of uncertainty for an estimate arising from sampling variability is represented through the use of a margin of error. The value shown here is the 90 percent margin of error. The margin of error can be interpreted roughly as providing a 90 percent probability that the interval defined by the estimate minus the margin of error and the estimate plus the margin of error (the lower and upper confidence bounds) contains the true value. In addition to sampling variability, the ACS estimates are subject to nonsampling error (for a discussion of nonsampling variability, see Accuracy of the Data). The effect of nonsampling error is not represented in these tables.
There were changes in the edit between 2009 and 2010 regarding Supplemental Security Income (SSI) and Social Security. The changes in the edit loosened restrictions on disability requirements for receipt of SSI resulting in an increase in the total number of SSI recipients in the American Community Survey. The changes also loosened restrictions on possible reported monthly amounts in Social Security income resulting in higher Social Security aggregate amounts. These results more closely match administrative counts compiled by the Social Security Administration.
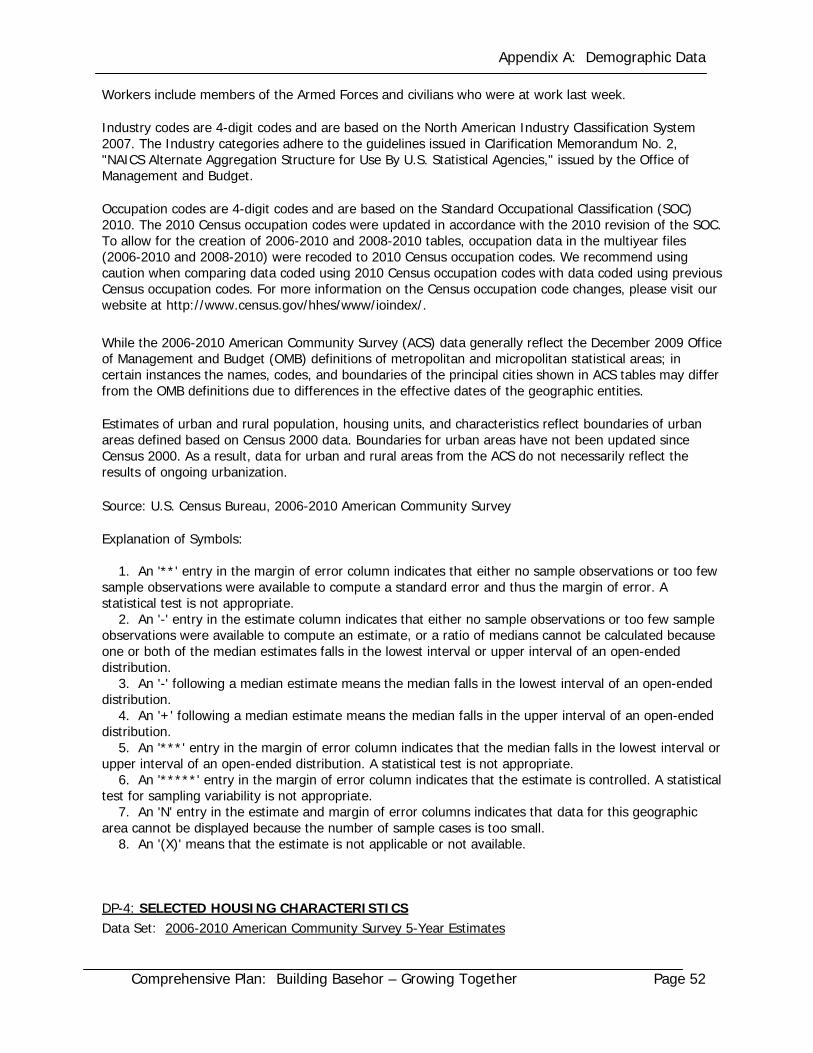
Appendix A: Demographic Data
Comprehensive Plan: Building Basehor – Growing Together Page 52
Workers include members of the Armed Forces and civilians who were at work last week.
Industry codes are 4-digit codes and are based on the North American Industry Classification System 2007. The Industry categories adhere to the guidelines issued in Clarification Memorandum No. 2, "NAICS Alternate Aggregation Structure for Use By U.S. Statistical Agencies," issued by the Office of Management and Budget.
Occupation codes are 4-digit codes and are based on the Standard Occupational Classification (SOC) 2010. The 2010 Census occupation codes were updated in accordance with the 2010 revision of the SOC. To allow for the creation of 2006-2010 and 2008-2010 tables, occupation data in the multiyear files (2006-2010 and 2008-2010) were recoded to 2010 Census occupation codes. We recommend using caution when comparing data coded using 2010 Census occupation codes with data coded using previous Census occupation codes. For more information on the Census occupation code changes, please visit our website at http://www.census.gov/hhes/www/ioindex/.
While the 2006-2010 American Community Survey (ACS) data generally reflect the December 2009 Office of Management and Budget (OMB) definitions of metropolitan and micropolitan statistical areas; in certain instances the names, codes, and boundaries of the principal cities shown in ACS tables may differ from the OMB definitions due to differences in the effective dates of the geographic entities.
Estimates of urban and rural population, housing units, and characteristics reflect boundaries of urban areas defined based on Census 2000 data. Boundaries for urban areas have not been updated since Census 2000. As a result, data for urban and rural areas from the ACS do not necessarily reflect the results of ongoing urbanization.
Source: U.S. Census Bureau, 2006-2010 American Community Survey
Explanation of Symbols: 1. An '**' entry in the margin of error column indicates that either no sample observations or too few sample observations were available to compute a standard error and thus the margin of error. A statistical test is not appropriate. 2. An '-' entry in the estimate column indicates that either no sample observations or too few sample observations were available to compute an estimate, or a ratio of medians cannot be calculated because one or both of the median estimates falls in the lowest interval or upper interval of an open-ended distribution. 3. An '-' following a median estimate means the median falls in the lowest interval of an open-ended distribution. 4. An '+' following a median estimate means the median falls in the upper interval of an open-ended distribution. 5. An '***' entry in the margin of error column indicates that the median falls in the lowest interval or upper interval of an open-ended distribution. A statistical test is not appropriate. 6. An '*****' entry in the margin of error column indicates that the estimate is controlled. A statistical test for sampling variability is not appropriate. 7. An 'N' entry in the estimate and margin of error columns indicates that data for this geographic area cannot be displayed because the number of sample cases is too small. 8. An '(X)' means that the estimate is not applicable or not available.
DP-4: SELECTED HOUSING CHARACTERISTICS Data Set: 2006-2010 American Community Survey 5-Year Estimates
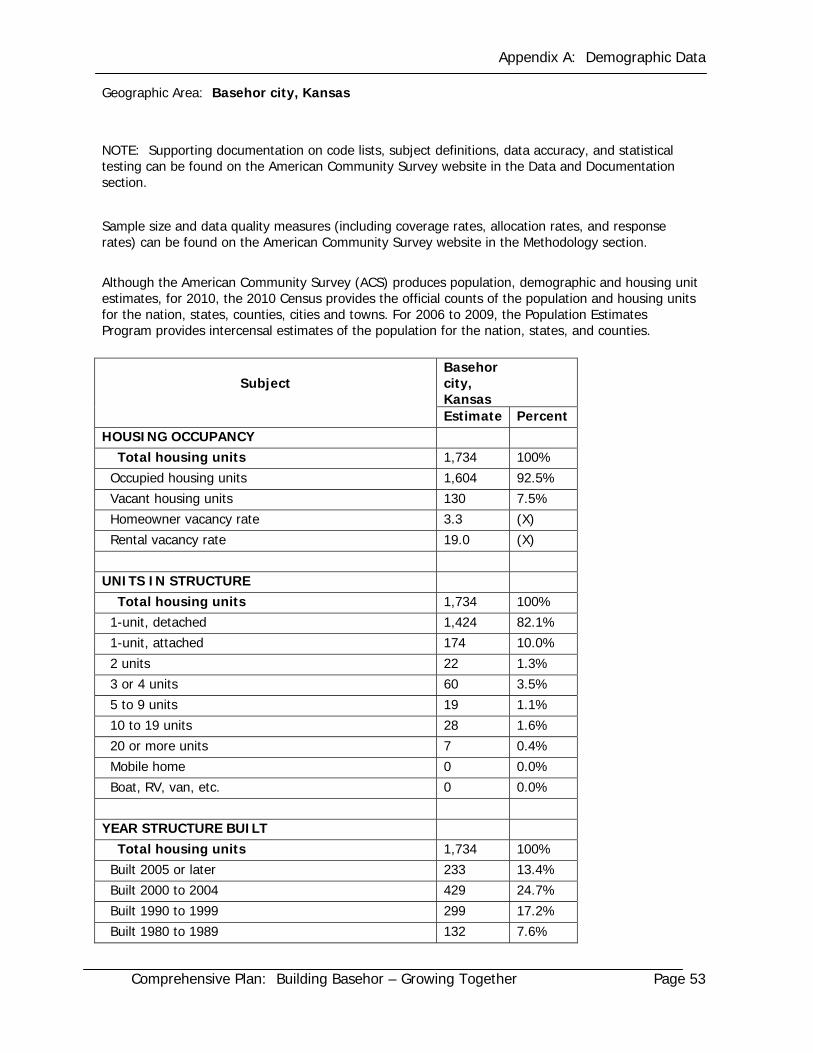
Appendix A: Demographic Data
Comprehensive Plan: Building Basehor – Growing Together Page 53
Geographic Area: Basehor city, Kansas
NOTE: Supporting documentation on code lists, subject definitions, data accuracy, and statistical testing can be found on the American Community Survey website in the Data and Documentation section.
Sample size and data quality measures (including coverage rates, allocation rates, and response rates) can be found on the American Community Survey website in the Methodology section.
Although the American Community Survey (ACS) produces population, demographic and housing unit estimates, for 2010, the 2010 Census provides the official counts of the population and housing units for the nation, states, counties, cities and towns. For 2006 to 2009, the Population Estimates Program provides intercensal estimates of the population for the nation, states, and counties.
Subject Basehor city, Kansas
Estimate Percent HOUSING OCCUPANCY Total housing units 1,734 100% Occupied housing units 1,604 92.5% Vacant housing units 130 7.5% Homeowner vacancy rate 3.3 (X) Rental vacancy rate 19.0 (X) UNITS IN STRUCTURE Total housing units 1,734 100% 1-unit, detached 1,424 82.1% 1-unit, attached 174 10.0% 2 units 22 1.3% 3 or 4 units 60 3.5% 5 to 9 units 19 1.1% 10 to 19 units 28 1.6% 20 or more units 7 0.4% Mobile home 0 0.0% Boat, RV, van, etc. 0 0.0% YEAR STRUCTURE BUILT Total housing units 1,734 100% Built 2005 or later 233 13.4% Built 2000 to 2004 429 24.7% Built 1990 to 1999 299 17.2% Built 1980 to 1989 132 7.6%
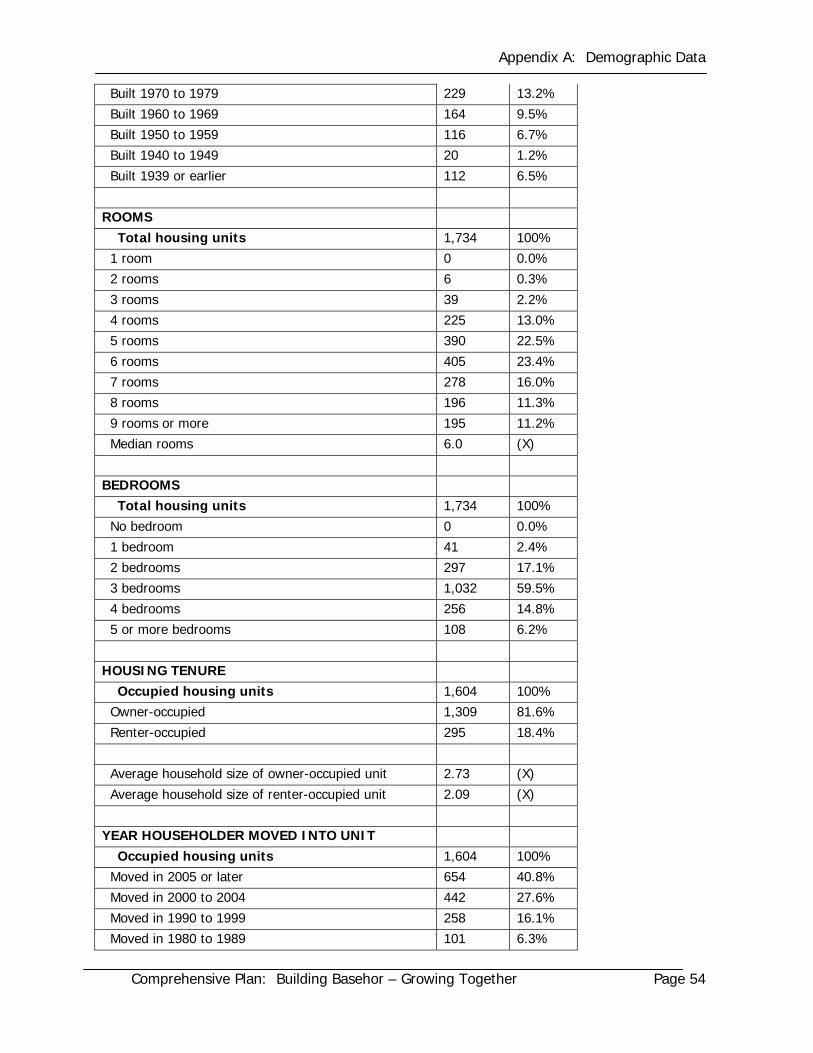
Appendix A: Demographic Data
Comprehensive Plan: Building Basehor – Growing Together Page 54
Built 1970 to 1979 229 13.2% Built 1960 to 1969 164 9.5% Built 1950 to 1959 116 6.7% Built 1940 to 1949 20 1.2% Built 1939 or earlier 112 6.5% ROOMS Total housing units 1,734 100% 1 room 0 0.0% 2 rooms 6 0.3% 3 rooms 39 2.2% 4 rooms 225 13.0% 5 rooms 390 22.5% 6 rooms 405 23.4% 7 rooms 278 16.0% 8 rooms 196 11.3% 9 rooms or more 195 11.2% Median rooms 6.0 (X) BEDROOMS Total housing units 1,734 100% No bedroom 0 0.0% 1 bedroom 41 2.4% 2 bedrooms 297 17.1% 3 bedrooms 1,032 59.5% 4 bedrooms 256 14.8% 5 or more bedrooms 108 6.2% HOUSING TENURE Occupied housing units 1,604 100% Owner-occupied 1,309 81.6% Renter-occupied 295 18.4% Average household size of owner-occupied unit 2.73 (X) Average household size of renter-occupied unit 2.09 (X) YEAR HOUSEHOLDER MOVED INTO UNIT Occupied housing units 1,604 100% Moved in 2005 or later 654 40.8% Moved in 2000 to 2004 442 27.6% Moved in 1990 to 1999 258 16.1% Moved in 1980 to 1989 101 6.3%

Appendix A: Demographic Data
Comprehensive Plan: Building Basehor – Growing Together Page 55
Moved in 1970 to 1979 96 6.0% Moved in 1969 or earlier 53 3.3% VEHICLES AVAILABLE Occupied housing units 1,604 100% No vehicles available 58 3.6% 1 vehicle available 353 22.0% 2 vehicles available 642 40.0% 3 or more vehicles available 551 34.4% HOUSE HEATING FUEL Occupied housing units 1,604 100% Utility gas 1,286 80.2% Bottled, tank, or LP gas 0 0.0% Electricity 288 18.0% Fuel oil, kerosene, etc. 0 0.0% Coal or coke 0 0.0% Wood 10 0.6% Solar energy 0 0.0% Other fuel 20 1.2% No fuel used 0 0.0% SELECTED CHARACTERISTICS Occupied housing units 1,604 100% Lacking complete plumbing facilities 0 0.0% Lacking complete kitchen facilities 0 0.0% No telephone service available 7 0.4% OCCUPANTS PER ROOM Occupied housing units 1,604 100% 1.00 or less 1,568 97.8% 1.01 to 1.50 36 2.2% 1.51 or more 0 0.0% VALUE Owner-occupied units 1,309 100% Less than $50,000 16 1.2% $50,000 to $99,999 61 4.7% $100,000 to $149,999 215 16.4% $150,000 to $199,999 573 43.8% $200,000 to $299,999 298 22.8% $300,000 to $499,999 113 8.6%

Appendix A: Demographic Data
Comprehensive Plan: Building Basehor – Growing Together Page 56
$500,000 to $999,999 25 1.9% $1,000,000 or more 8 0.6% Median (dollars) 183,000 (X) MORTGAGE STATUS Owner-occupied units 1,309 100% Housing units with a mortgage 956 73.0% Housing units without a mortgage 353 27.0% SELECTED MONTHLY OWNER COSTS (SMOC) Housing units with a mortgage 956 100% Less than $300 0 0.0% $300 to $499 0 0.0% $500 to $699 11 1.2% $700 to $999 125 13.1% $1,000 to $1,499 324 33.9% $1,500 to $1,999 327 34.2% $2,000 or more 169 17.7% Median (dollars) 1,524 (X) Housing units without a mortgage 353 100% Less than $100 0 0.0% $100 to $199 7 2.0% $200 to $299 19 5.4% $300 to $399 77 21.8% $400 or more 250 70.8% Median (dollars) 470 (X) SELECTED MONTHLY OWNER COSTS AS A PERCENTAGE OF HOUSEHOLD INCOME (SMOCAPI)
Housing units with a mortgage (excluding units where SMOCAPI cannot be computed)
956 100%
Less than 20.0 percent 405 42.4% 20.0 to 24.9 percent 177 18.5% 25.0 to 29.9 percent 116 12.1% 30.0 to 34.9 percent 94 9.8% 35.0 percent or more 164 17.2% Not computed 0 (X) Housing unit without a mortgage (excluding units where SMOCAPI cannot be computed)
353 100%

Appendix A: Demographic Data
Comprehensive Plan: Building Basehor – Growing Together Page 57
Less than 10.0 percent 158 44.8% 10.0 to 14.9 percent 80 22.7% 15.0 to 19.9 percent 34 9.6% 20.0 to 24.9 percent 14 4.0% 25.0 to 29.9 percent 7 2.0% 30.0 to 34.9 percent 15 4.2% 35.0 percent or more 45 12.7% Not computed 0 (X) GROSS RENT Occupied units paying rent 283 100% Less than $200 0 0.0% $200 to $299 17 6.0% $300 to $499 16 5.7% $500 to $749 68 24.0% $750 to $999 76 26.9% $1,000 to $1,499 86 30.4% $1,500 or more 20 7.1% Median (dollars) 921 (X) No rent paid 12 (X) GROSS RENT AS A PERCENTAGE OF HOUSEHOLD INCOME (GRAPI)
Occupied units paying rent (excluding units where GRAPI cannot be computed)
283 100.00%
Less than 15.0 percent 57 20.1% 15.0 to 19.9 percent 44 15.5% 20.0 to 24.9 percent 55 19.4% 25.0 to 29.9 percent 24 8.5% 30.0 to 34.9 percent 15 5.3% 35.0 percent or more 88 31.1% Not computed 12 (X) Data are based on a sample and are subject to sampling variability. The degree of uncertainty for an estimate arising from sampling variability is represented through the use of a margin of error. The value shown here is the 90 percent margin of error. The margin of error can be interpreted roughly as providing a 90 percent probability that the interval defined by the estimate minus the margin of error and the estimate plus the margin of error (the lower and upper confidence bounds) contains the true value. In addition to sampling variability, the ACS estimates are subject to nonsampling error (for a discussion of nonsampling variability, see Accuracy of the Data). The effect of nonsampling error is not represented in these tables. The median gross rent excludes no cash renters.
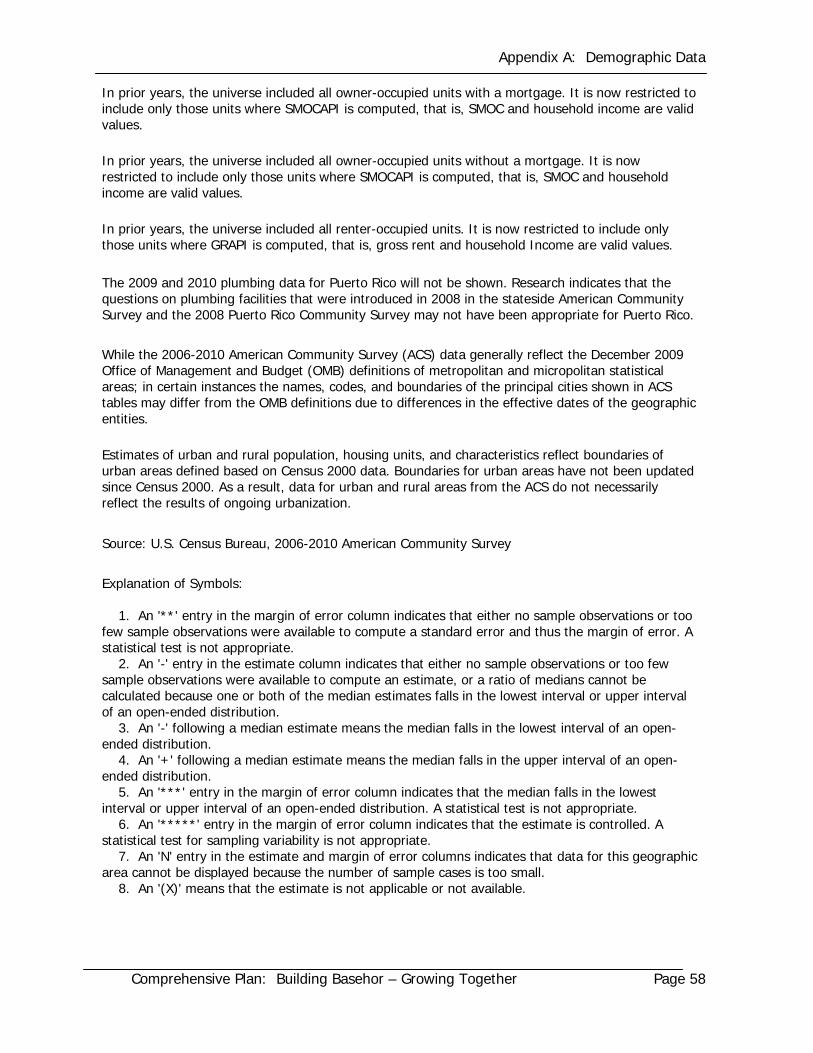
Appendix A: Demographic Data
Comprehensive Plan: Building Basehor – Growing Together Page 58
In prior years, the universe included all owner-occupied units with a mortgage. It is now restricted to include only those units where SMOCAPI is computed, that is, SMOC and household income are valid values. In prior years, the universe included all owner-occupied units without a mortgage. It is now restricted to include only those units where SMOCAPI is computed, that is, SMOC and household income are valid values. In prior years, the universe included all renter-occupied units. It is now restricted to include only those units where GRAPI is computed, that is, gross rent and household Income are valid values. The 2009 and 2010 plumbing data for Puerto Rico will not be shown. Research indicates that the questions on plumbing facilities that were introduced in 2008 in the stateside American Community Survey and the 2008 Puerto Rico Community Survey may not have been appropriate for Puerto Rico. While the 2006-2010 American Community Survey (ACS) data generally reflect the December 2009 Office of Management and Budget (OMB) definitions of metropolitan and micropolitan statistical areas; in certain instances the names, codes, and boundaries of the principal cities shown in ACS tables may differ from the OMB definitions due to differences in the effective dates of the geographic entities. Estimates of urban and rural population, housing units, and characteristics reflect boundaries of urban areas defined based on Census 2000 data. Boundaries for urban areas have not been updated since Census 2000. As a result, data for urban and rural areas from the ACS do not necessarily reflect the results of ongoing urbanization. Source: U.S. Census Bureau, 2006-2010 American Community Survey Explanation of Symbols: 1. An '**' entry in the margin of error column indicates that either no sample observations or too few sample observations were available to compute a standard error and thus the margin of error. A statistical test is not appropriate. 2. An '-' entry in the estimate column indicates that either no sample observations or too few sample observations were available to compute an estimate, or a ratio of medians cannot be calculated because one or both of the median estimates falls in the lowest interval or upper interval of an open-ended distribution. 3. An '-' following a median estimate means the median falls in the lowest interval of an open-ended distribution. 4. An '+' following a median estimate means the median falls in the upper interval of an open-ended distribution. 5. An '***' entry in the margin of error column indicates that the median falls in the lowest interval or upper interval of an open-ended distribution. A statistical test is not appropriate. 6. An '*****' entry in the margin of error column indicates that the estimate is controlled. A statistical test for sampling variability is not appropriate. 7. An 'N' entry in the estimate and margin of error columns indicates that data for this geographic area cannot be displayed because the number of sample cases is too small. 8. An '(X)' means that the estimate is not applicable or not available.
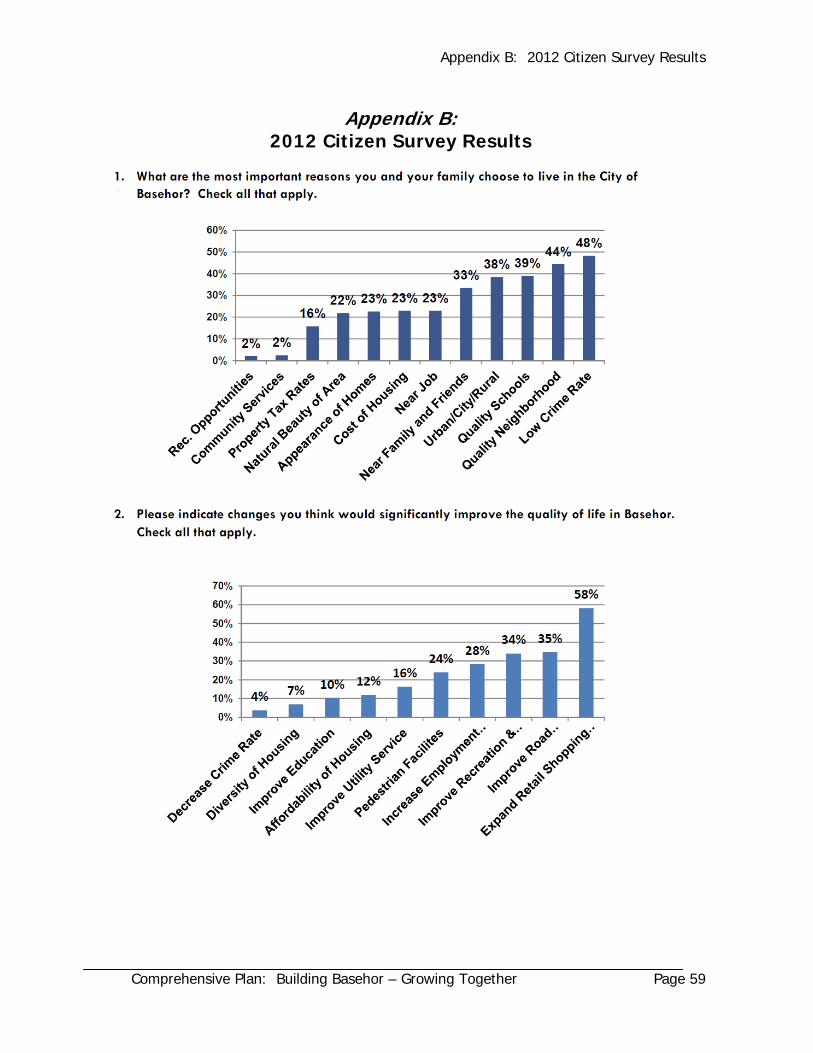
Appendix B: 2012 Citizen Survey Results
Comprehensive Plan: Building Basehor – Growing Together Page 59
Appendix B:
2012 Citizen Survey Results

Appendix B: 2012 Citizen Survey Results
Comprehensive Plan: Building Basehor – Growing Together Page 60
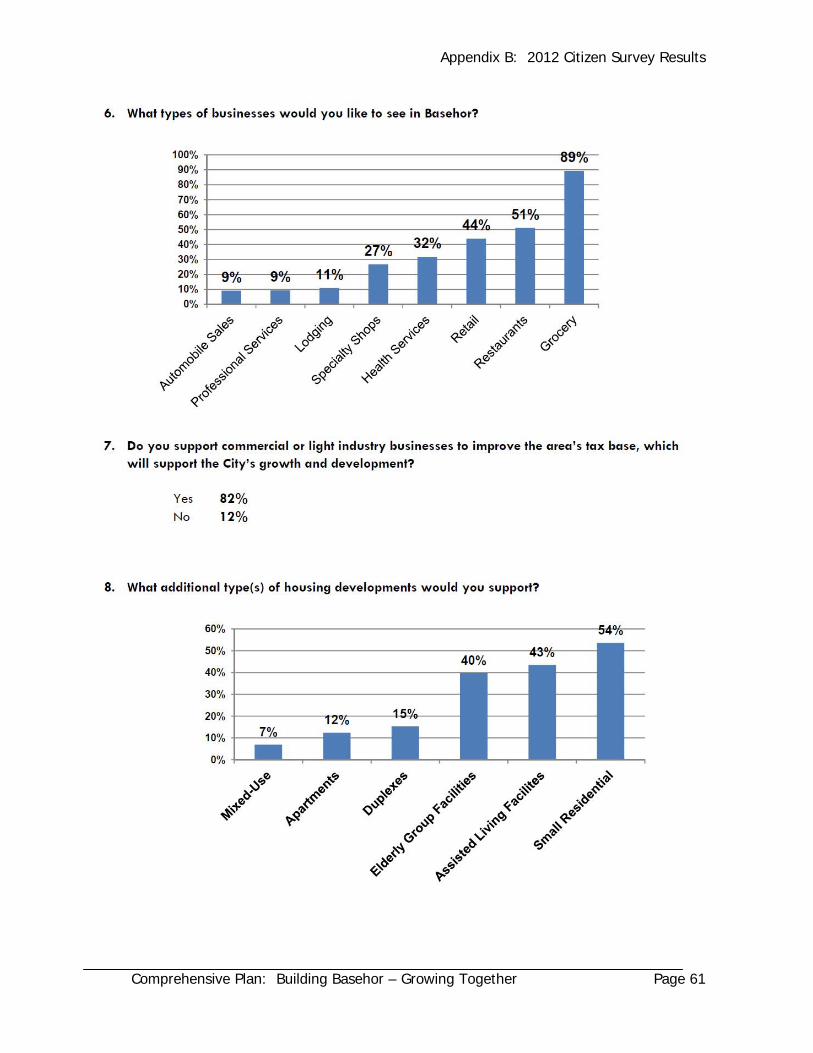
Appendix B: 2012 Citizen Survey Results
Comprehensive Plan: Building Basehor – Growing Together Page 61
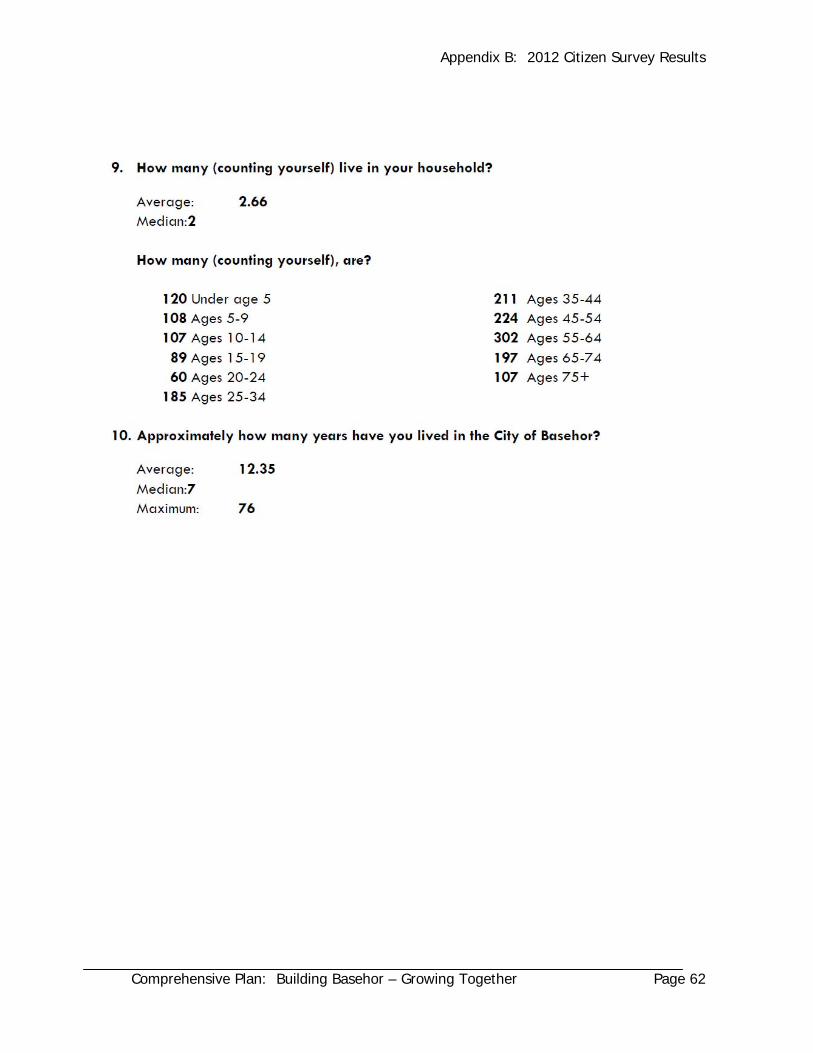
Appendix B: 2012 Citizen Survey Results
Comprehensive Plan: Building Basehor – Growing Together Page 62