Embed Size (px)
Citation preview
The influence of underframe structural
flexibility on the hunting behaviour
of a freight wagon
Sebastian StichelRoyal Institute of Technology (KTH), Railway Technology,Stockholm, Sweden.
Abstract
Within a research project at KTH simulation models of freight wagons wereestablished. During investigations it turned out that the flexible properties of theunderframe probably cannot be neglected in the models. Therefore a FE-model ofan underframe of a two-axle freight wagon was built up. The most importanteigenmodes are incorporated into a multibody vehicle model. Comparisons withmeasurements and some parameter studies are presented.
1 Introduction
Since some years a research project is going on at KTH with the aim to increasethe understanding of the running behaviour of freight wagons. Background to theproject is, on the one hand, the planned increase of axle loads and speeds forfreight traffic on Swedish main lines. On the other hand, it is well known that therunning behaviour of existing freight wagons is rather poor. In some operatingconditions existing limit values for track forces and ride comfort are exceededalready with today's axle loads and speeds. Especially hunting can be a severeproblem.
In a first step, simulation models of freight wagons with the most commonEuropean running gear were established and verified. Extensive parameter studieswere then performed to find critical operating conditions.
To investigate the running behaviour of freight wagons with help of simulationis not very common yet, at least not in Europe. Very little effort has been spent onimprovements of freight wagon running gear until very recently. Therefore not
Computers in Railways VII, C.A. Brebbia J.Allan, R.J. Hill, G. Sciutto & S. Sone (Editors) © 2000 WIT Press, www.witpress.com, ISBN 1-85312-826-0

726 Computers in Railways VII
many reliable simulation models of European standard freight wagon runninggear exist today.
In the author's early studies all vehicle bodies were regarded rigid in the mod-els. During the investigations it turned out that the flexible properties of thewagon underframe probably cannot be neglected. A simple model which regardsthe underframe as a beam, gave that the torsional eigenmode of a loaded wagonsunderframe has a frequency below 2 Hz. This is especially interesting because thetypical hunting frequency of the investigated freight wagon is about 2 Hz. It canthus be expected that these modes interact. Therefore a FE-model for the under-frame of a two-axle open freight wagon is developed with the software ANSYS[1]. The first four calculated flexible eigenmodes are incorporated into the multi-body model to test their influence on the running behaviour.
2 Vehicle model and basic running behaviour
Multibody models for freight wagons with three different UlC-running gear wereestablished within the present research project: Y25 bogie, bogie with link sus-pension, single-axle running gear with link suspension. For descriptions of thedifferent running gear and the simulation models, see for example [2] - [5].
This paper deals only with a two-axle open freight wagon, type Kbps, whichcan be seen in Fig. 1. This type of wagon is chosen because acceleration measure-ments for such a wagon have been performed together with the Swedish StateRailways in 1997 [6]. Later in this paper simulation results are compared toresults from these measurements.
The basic multibody model can be seen in Fig. 2. As simulation tool the Swed-ish multibody code GENSYS [8] is used. The model consists of three rigid bod-ies, connected with non-linear suspension elements [4], [5], [7]. Leaf springs andlink suspension can be modelled with the same suspension element. Also bumpstops for the longitudinal and lateral motion of the wheelsets relative to the car-body exist. The non-linear wheel-rail geometry is precalculated within GENSYSand the non-linear creep forces are interpolated from a precalculated four-dimen-sional table. The table is generated with the FASTSIM algorithm of Kalker [11].The track is elastic both in vertical and in lateral direction.
Figure 1: Two-axle freight wagon, type Kbps (wheelbase 9m).
Computers in Railways VII, C.A. Brebbia J.Allan, R.J. Hill, G. Sciutto & S. Sone (Editors) © 2000 WIT Press, www.witpress.com, ISBN 1-85312-826-0

Computers in Railways 111 797
X
Figure 2: Multibody model.
2.1 Running behaviour of the rigid body model
The running behaviour of both the empty (Q^ = 28 kN) and the loaded (2o =110kN) vehicle is dominated by a periodic lateral hunting motion of the vehiclewhich - depending on the wheel-rail geometry - arises at speeds above 70 to 100km/h. Hunting means in this case a yaw motion of the carbody (underframe) com-bined with a lateral motion of the wheelsets in phase with the carbody. Very littlevertical/roll motion of the carbody is included in the hunting motion. The huntingfrequency is between 1.5 and 2.5 Hz.
Comparisons between measured and simulated vehicle responses gave gener-ally rather satisfying agreement. A problem observed, however, is that the simu-lated vertical forces are too low. Besides, in measurements periodic varyingvertical forces at the same frequency as the hunting motion could be found forloaded wagons. These could not be generated in the simulations with similarlyhigh amplitudes. This problem leads to the idea that the hunting mode and a tor-sional vibration mode of the loaded wagon underframe might interact. Both thehunting mode and the torsional mode are antisymmetric with regard to the Y-Z-plane, cf. Fig. 2. A possible interaction, however, requires that the frequency ofthe torsional mode is in the same range as the frequency of the hunting mode.Therefore first a torsional mode calculated with a beam model of the underframewas tested in the simulations. The frequency of this mode was calculated to about1.5 Hz (depending on stiffness and load) [4]. Because of the uncertainties in thissimple model it was decided to develop a FE-model of the wagon underframe.
3 Underframe model
The underframe of the modelled freight wagon is a fabricated steel construction.For the FE-model ANSYS is used. As element types beams and shells are used.The total model which can be seen in Fig. 3 consists of 3500 elements. The massof the underframe is only 3600 kg, while the empty carbody has a weight of 8300kg according to information from SJ. Additional weight of the empty vehicle istherefore added in two ways. For heavier masses like buffers mass elements areadded at certain nodes. Other equipment is regarded by increasing the density ofall beam and shell elements with a factor 1.4. This is a common way to consider
Computers in Railways VII, C.A. Brebbia J.Allan, R.J. Hill, G. Sciutto & S. Sone (Editors) © 2000 WIT Press, www.witpress.com, ISBN 1-85312-826-0

Computers in Railways VII
distributed weight. The specific wagon, which is modelled here, was loaded withconcrete sleepers. It was decided to consider the load as discrete masses added atcertain nodes of the underframe model. Of course the distribution of the sleeperson the underframe is regarded.
3.1 Verification of (FE-)underframe model
A first check of the model is to compare its torsional stiffness with measuredones. The torsional stiffness of freight wagons has to be measured according tothe standard ERRI B55 [9]. If the wagon is to stiff, it might derail in transitioncurves or other locations with twisted track. To measure the underframe stiffnessthe suspensions are locked. One wheel is lifted a height h^ and the difference inwheel load AQ from the static wheel load £?o &t this wheel is measured. The tor-sional stiffness is then defined as
6,* = AG.2.2o/A,,y, (1)
where 2b is the lateral distance between rolling radii and 2a the wheelbase ofthe vehicle. For wagons similar to the present one a torsional stiffnessk* = 4-5 • 10* Nnf/rad could be found in literature [9],[10]. The stiffness ofthe FE-model with loads AQ= 20 kN as in Fig. 3 is calculated tok* = 3.6 • 10 Nm̂ /rad. This is a first indication that the model is a reasonableapproximation of the real underframe.
IAQ = 20 kN
Figure 3: Check of torsional stiffness of FE-model.
3.2 Eigenmodes of the FE-model
With help of a modal analysis the eigenmodes of the free underframe are calcu-lated. In Fig. 4 the first four eigenmodes (besides the 6 rigid body eigenmodes) ofthe loaded vehicle are shown, i.e. two torsional modes and two vertical bendingmodes. They all have frequencies below 10 Hz. The frequency of the torsionalmode is calculated to 2.5 Hz. This is somewhat higher than the frequency calcu-
Computers in Railways VII, C.A. Brebbia J.Allan, R.J. Hill, G. Sciutto & S. Sone (Editors) © 2000 WIT Press, www.witpress.com, ISBN 1-85312-826-0

Computers in Railways 171 729
lated with the simple beam model, cf. Section 2. For the empty vehicle the fre-quencies of the eigenmodes are almost doubled. This is reasonable because themass of the loaded underframe is about four times higher as for the empty wagon.The stiffness in the model is not influenced by the load. The shapes of the fourfirst eigenmodes of the empty vehicle are almost the same as for the loaded vehi-cle. Therefore they are not shown here.
The eigenmodes calculated in ANSYS are undamped. The damping ratio is notknown anyway. For the calculations within the multibody program 2% dampingof the eigenmodes is assumed.
floaded= 8.6 Hz (/empty = 15-1 Hz)
flooded - 9.5 Hz (fempty - 18.3 Hz)
Figure 4: The first four eigenmodes of the loaded underframe. 20.5 t axleload. (In parentheses: Frequencies of the eigenmodes of the emptyvehicle which look very much the same as those for the loadedvehicle shown in the Figure.)
Computers in Railways VII, C.A. Brebbia J.Allan, R.J. Hill, G. Sciutto & S. Sone (Editors) © 2000 WIT Press, www.witpress.com, ISBN 1-85312-826-0

730 Computers in Railways VII
4 Comparison between measured and simulated results
In 1997 acceleration measurements on three different freight wagons were per-formed on a track between Nykoping and Aby [6]. One of the wagons was a two-axle wagon type Kbps as mentioned before. Two straight track sections with alength of 900 m each are chosen for the comparisons with simulation results:1. A section from 1968 with BV50 rails and mean track gauge of 1428 mm. The
equivalent conicity is about \^ ~ 0.25 .2. A section with UIC60 rails from 1988 and a mean track gauge of 1437 mm.
The equivalent conicity on this track section is \^ ~ 0.07 .Wheel profiles were measured and prepared as input data for the simulation.
As rail profile a new UIC60 profile was chosen for track section 2., and a wornBV 50 rail profile for section 1. The friction coefficient has been set to \i - 0.4 forthe runs with loaded vehicle, because of dry but cloudy weather, while |i = 0.3was chosen for the simulations with empty vehicles, because it was raining fromtime to time this day.
Accelerations were measured on empty and loaded wagons. The Kbps wagonwas loaded to an axle load of 20.5 t with concrete sleepers. Fig. 5 shows the loca-tions of the accelerometers on the Kbps wagon in the on track tests. The accelera-tions in the simulations are calculated for the same points. More about themeasurements can be found in [4] and [6].
az-ws2l az-wsll<p
<) ay-ws2
®~~
Oaz-centre
ay-wsl O
azws2r az-wslr
Figure 5: Underframe Locations of the accelerometers in the tests.( z = vertical ace., y = lateral ace., ws = wheelset, 1 = left, r = right)
The results are compared by looking at power spectra of underframe accelera-tions and at a so called ride index WzG. The ride index is found as follows
WzG = 4.42(a""™)0.3
(2)
where a™™™ is the frequency weighted rms-value of an acceleration.
4.1 Empty vehicle
Because of the restricted space in the paper for the empty vehicle only powerspectra and only for track section 1 are shown (Fig. 6). However, the differencesbetween measured and simulated ride indices and between rigid and flexibleunderframe are not significant for the empty vehicle.
Computers in Railways VII, C.A. Brebbia J.Allan, R.J. Hill, G. Sciutto & S. Sone (Editors) © 2000 WIT Press, www.witpress.com, ISBN 1-85312-826-0

Computers in Railways VII
lat. ace. above ws 2
731
IUU
T7 80
L ™
^ 40I: 20
n
simulated
i
ou
|soCsJ
1:10n
ou
g40
^30CM
\"&10
n
flexible ̂^
rigid
0 5^^ 10 15
lat. ace. above ws 2
15 5f[Hz]l° ^
IUU
^ 60c\T1o 40
1 20
n
measured
i
ou
"40
c\T1o20
lion A,
ou
TT40
3̂0CM
&10
n
__jL
'«[HZ]̂ «15 15
Figure 6: Power spectra of some accelerations. Straight track between Nykopingand Aby, km 72.5 - 73.5. Loaded vehicle, v = 100 km/h, ̂ = 0.07.
The peak for the hunting mode at 2 Hz can be seen very clearly. Another inter-esting observation is a peak at 10 Hz, which is not existing at all in the simulationresults for the rigid body model. The peak in the flexible model is almost at thesame frequency as in the measurements. The amplitudes, however, differ. Com-paring with the frequencies of the eigenmodes in Fig. 4, one can find that it mustbe the first vertical bending mode of the empty vehicle which is responsible forthe peak at 10 Hz. This is another indicator that the FE-model seems to representreality quite well.
4.2 Loaded vehicle
The results for the loaded vehicle are even more interesting. The differencesbetween the simulation results for the flexible and the rigid body model respec-tively are more significant than for the empty vehicle. As for the empty vehiclethe calculated ride indices with the flexible body model are closer to the measuredones than those of the rigid body model.
4.2.1 Straight track section with low equivalent conicityFor most of the evaluated signals the simulated accelerations of the flexible modelare somewhat higher than the measured ones. The overall agreement betweenmeasurement and simulation is quite satisfying though.
Computers in Railways VII, C.A. Brebbia J.Allan, R.J. Hill, G. Sciutto & S. Sone (Editors) © 2000 WIT Press, www.witpress.com, ISBN 1-85312-826-0
732 Computers in Railways VII
4.5
3.5
3
2.5-
2
1.5
1
0.5-
0
I measured| EZl rigid carbody
I flexible carbodv
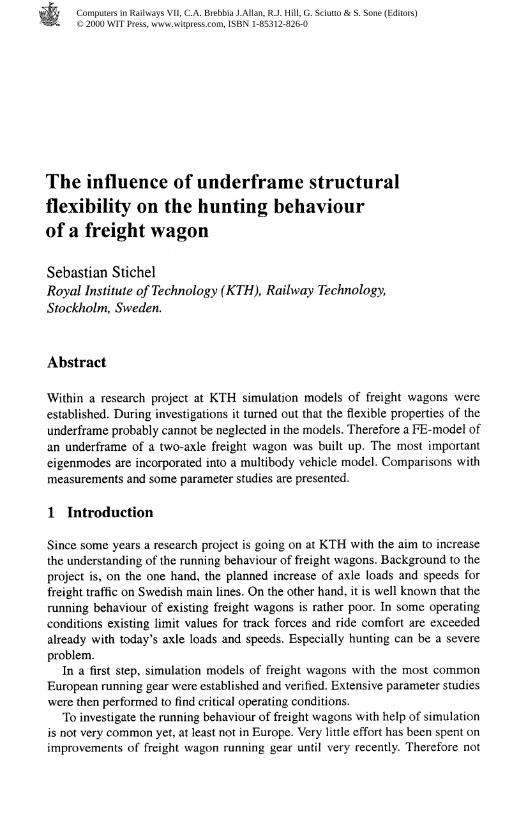
Straight track,Nykoping - Abykm 72.5 - 73.5,Loaded vehicle,v = 100 km/h,
ay-ws1 ay-ws2 az-ws2r az-ws2l az-centre
Figure 7: Comparisons of ride indices.
The same tendency can be observed for the power spectra of the same resultsin Fig. 8. The peak at 2 Hz for the flexible model is much closer to the measure-ments.
lat. ace. above ws 2 vert. ace. above ws 2 left vert, ace., centrel£U
17100c\l 80•njkr 60| 40— 20
°c
12077100P 80jjvT 60| 40— 20
0
t flexible
/""
,_vL) ^ f[Hz] 1
lat. ace. above ws 2
|
ou
NT 40
3̂0CM
&10
0 «(
\
&10
0 °C
simulated
•
JuLjL
' ^ f[Hz] ""rert. ace. above ws 2 le
measured
A JWw) 5 . ... . 1
ou
|aoCM: 20
lio
0 °(
ft50
TT40
^30CM
iio
00 C
1.' 5 f[Hz] 1
vert, ace., centre
) 5 ,_ i 1
Figure 8: Power spectra of some of the ace in Fig. 1.
Computers in Railways VII, C.A. Brebbia J.Allan, R.J. Hill, G. Sciutto & S. Sone (Editors) © 2000 WIT Press, www.witpress.com, ISBN 1-85312-826-0
Computers in Railways VII 733
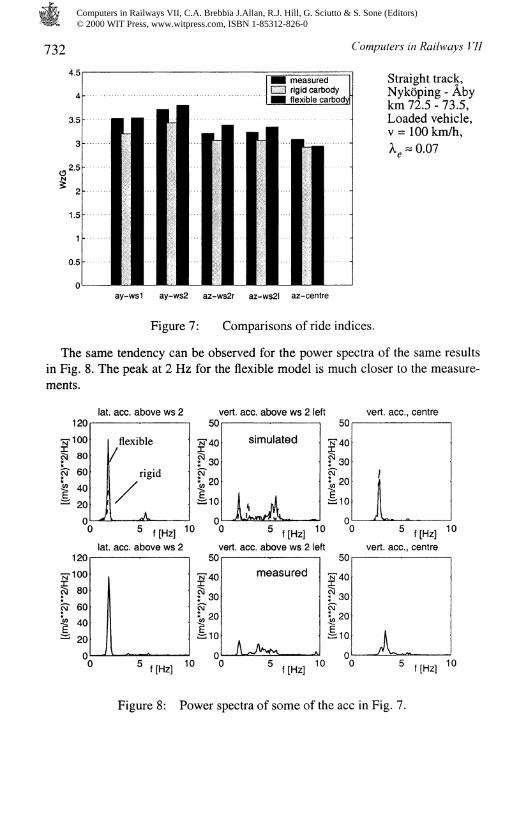
4.2.2 Straight track section with high equivalent conicityIn Fig. 9 and Fig. 10 ride indices for the high conicity track section are shown. Inprinciple the same as for the results on the track with low conicity applies: Theresults are better for the flexible model. As in Section 4.2.1, especially the differ-ence between rigid and flexible model concerning the lateral acceleration is sig-nificant.
4.5
4
3.5
3
,25
^ 2
1.5
1
0.5
0
I measured| HH rigid carbody
1 flexible carbody
Straight track,Nykoping - Abykm 59 - 60,Loaded vehicle,v = 100 km/h,
ay-ws1 ay-ws2 az-ws2r az-ws2l az-centre
C*
Figure 9: Comparisons of ride indices.
lat. ace. above ws 2
° f[Hz] 'lat. ace. above ws 2
vert. ace. above ws 2 leftIUU
80
60
40
20n
flex/
ible
/rigid
77
PC\j
I
ou
40
30
20
10n
simulated
K̂ _o f[Hz] '"
vert. ace. above ws 2 left
N
PC\T
1
IUU
80
60
40
20n JL.
ou
g40
3̂0c\T
r&10n
measured
JU*A«L_ _
vert, ace., centre3U
NT 40
boC\j
1"&10n k..
* f[Hz]vert, ace., centre
10
ou
7T40
3̂0CM
Is"&10
n L.^ f[Hz] '" " " f[Hz] '" " ° f[Hz]
Figure 10: Power spectra of some of the ace in Fig. 9.
Computers in Railways VII, C.A. Brebbia J.Allan, R.J. Hill, G. Sciutto & S. Sone (Editors) © 2000 WIT Press, www.witpress.com, ISBN 1-85312-826-0
734
5 Parameter studies
Computers in Railways VII
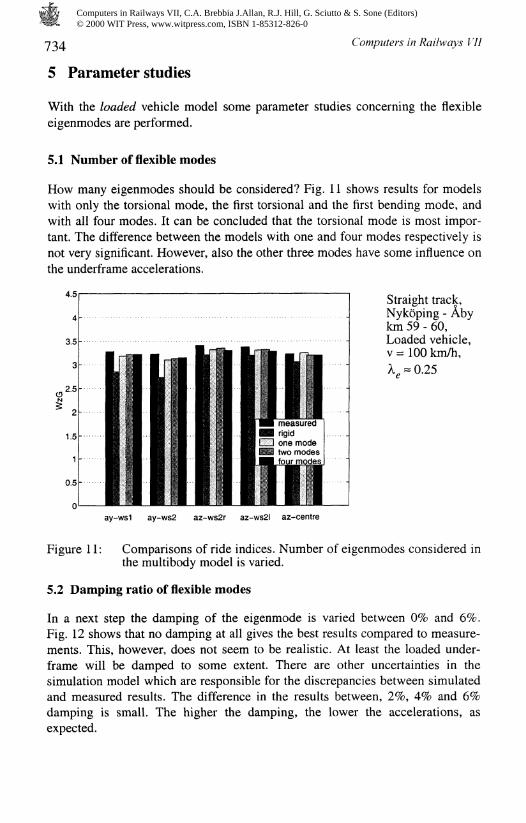
With the loaded vehicle model some parameter studies concerning the flexibleeigenmodes are performed.
5.1 Number of flexible modes
How many eigenmodes should be considered? Fig. 11 shows results for modelswith only the torsional mode, the first torsional and the first bending mode, andwith all four modes. It can be concluded that the torsional mode is most impor-tant. The difference between the models with one and four modes respectively isnot very significant. However, also the other three modes have some influence onthe underframe accelerations.
Straight track,Nykoping - Abykm 59 - 60,Loaded vehicle,v = 100 km/h,
= 0.25
ay-ws1 ay-ws2 az-ws2r az-ws2l az-centre
Comparisons of ride indices. Number of eigenmodes considered inthe multibody model is varied.
Figure 11:
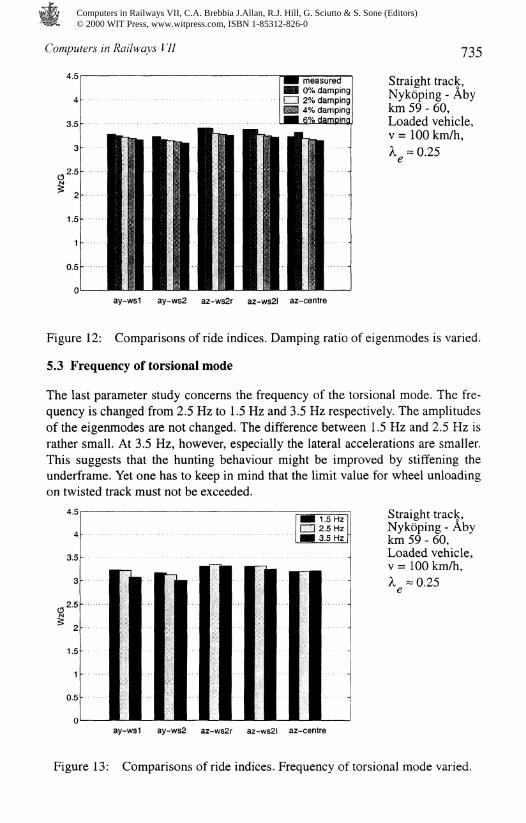
5.2 Damping ratio of flexible modes
In a next step the damping of the eigenmode is varied between 0% and 6%.Fig. 12 shows that no damping at all gives the best results compared to measure-ments. This, however, does not seem to be realistic. At least the loaded under-frame will be damped to some extent. There are other uncertainties in thesimulation model which are responsible for the discrepancies between simulatedand measured results. The difference in the results between, 2%, 4% and 6%damping is small. The higher the damping, the lower the accelerations, asexpected.
Computers in Railways VII, C.A. Brebbia J.Allan, R.J. Hill, G. Sciutto & S. Sone (Editors) © 2000 WIT Press, www.witpress.com, ISBN 1-85312-826-0
Computers in Railways VII
4.5
4
3.5
3
measured0% damping
CZ3 2% damping4% damping
735
Straight track,Nykoping - Abykm 59 - 60,Loaded vehicle,v = 100 km/h,
ay-ws1 ay-ws2 az-ws2r az-ws2l az-centre
Figure 12: Comparisons of ride indices. Damping ratio of eigenmodes is varied.
5.3 Frequency of torsional mode
The last parameter study concerns the frequency of the torsional mode. The fre-quency is changed from 2.5 Hz to 1.5 Hz and 3.5 Hz respectively. The amplitudesof the eigenmodes are not changed. The difference between 1.5 Hz and 2.5 Hz israther small. At 3.5 Hz, however, especially the lateral accelerations are smaller.This suggests that the hunting behaviour might be improved by stiffening theunderframe. Yet one has to keep in mind that the limit value for wheel unloadingon twisted track must not be exceeded.
•I 1.5 Hz |EH3 2.5 Hz
I • 3.5 Hz j
Straight track,Nykoping - Abykm 59 - 60,Loaded vehicle,v = 100 km/h,
= 0.25
ay-ws1 ay-ws2 az-ws2r az-ws2l az-centre
Figure 13: Comparisons of ride indices. Frequency of torsional mode varied.
Computers in Railways VII, C.A. Brebbia J.Allan, R.J. Hill, G. Sciutto & S. Sone (Editors) © 2000 WIT Press, www.witpress.com, ISBN 1-85312-826-0

Computers in Railways VII
6 Conclusions
Taking into account the flexible properties of a freight wagon underframe in sim-ulation models is important. The accelerations in the carbody might be influencedsignificantly. For an open-sided freight wagon loaded to an axle load of 20.5 t,four flexible modes with frequencies below 10 Hz were found. Even the tendencyto perform periodic hunting motions is increased by incorporating the flexibleunderframe in the model. Especially the torsional eigenmode which interacts withthe rigid body hunting motion is responsible for this behaviour. Comparisons withmeasured accelerations seem to prove the simulation results.
Parameter studies indicate that the torsional flexibility is the most importantone to take into account. However, also the first and second vertical bending modeand the second torsional mode have some influence on the results. By increasingthe torsional stiffness of the underframe it should be possible to improve the hunt-ing behaviour. However, the limit value for wheel unloading on twisted trackmust not be exceeded.
7 References
[1] ANSYS Programmer's Manual, Rev. 5.2. ANSYS, Inc. Houston, 1995.[2] Evans, J.R. and Rogers, P.J.: Validation of Dynamic Simulations of Rail
Vehicles with Friction Damped Y25 Bogies. Proceedings of the 15th IAVSDSymposium on the Dynamics of Vehicles on Roads and on Tracks, pp 219-234, Budapest, 1997.
[3] Lange, H.: Simulation des Fahrverhaltens zweiachsiger Guterwagen,ZEV+DET Glas. Ann. 122 (1998) 3, pp 91 - 98, 1998.
[4] Stichel, S.: Modellierung und Parameterstudien zum Fahrverhalten vonGiiterwagen mit UIC-Fahrwerken. ZEV+DET Glas. Ann. 123 (1999) 7/8,pp 289-296, 1999.
[5] Stichel, S.: How to improve the running behaviour of freight wagons withUIC link suspension. Proceedings of the 16th IAVSD Symposium on theDynamics of Vehicles on Roads and on Tracks, Pretoria, 1999.
[6] Kloow, L. and Magnusson, M.: Running tests with freight wagons typeSdggns, Kbps och Rs. (In Swedish) Report 9713-12g, SJ, Stockholm, 1997.
[7] Berg, M.: Modelling of springs and dampers for dynamic analysis of railvehicles - a pilot study, TRITA-FKT Report 94:51, KTH Stockholm, 1994.
[8] Persson, I.: Documentation ofGENSYS, DEsolver, Ostersund, 1998.[9] ERRI Question B55, RP 8 (Final Report): Prevention of derailment of goods
wagon on distorted track. Utrecht, 1983.[10] Axelson, J., Alexandersson, J. and Nellgran, A.: Osfreight wagon in a curve
(in Swedish), Report 7920-3g, SJ, Stockholm, 1982.[11] Kalker, J.J.: Three-Dimensional Elastic Bodies in Rolling Contact. Kluwer
Academic Publishers, Dordrecht, 1990.[12] Andersson, E., Berg, M., Stichel, S.: Rail Vehicle Dynamics - Fundamentals
and Guidelines. Course book. Stockholm, 1998.
Computers in Railways VII, C.A. Brebbia J.Allan, R.J. Hill, G. Sciutto & S. Sone (Editors) © 2000 WIT Press, www.witpress.com, ISBN 1-85312-826-0


![Computers in Railways VII, C.A. Brebbia J.Allan, R.J. Hill, … by desired headway and operating speeds (Pascoe [1]). The moving block concept can be defined as an automated control](https://img.pdfslide.net/doc/110x75/5aa8ba4d7f8b9a86188bdb84/computers-in-railways-vii-ca-brebbia-jallan-rj-hill-by-desired-headway.jpg)