Embed Size (px)
Citation preview
Original Article
Condition monitoring of valve clearance fault on a small four strokes petrolengine using vibration signals
Songpon Klinchaeam1 and Pornchai Nivesrangsan2*
Department of Mechanical Engineering, Faculty of Engineering,Mahanakorn University of Technology, Nong Chok, Bangkok, 10530 Thailand.
Received 10 February 2010; Accepted 24 August 2010
Abstract
This paper studies condition monitoring technique of a small four strokes, single cylinder petrol engine using vibrationsignal analysis based on time domain, crank angle domain, and signal energy. Vibration signals are acquired from the cylinderhead of the engine and used to describe engine processes such as intake/exhaust valve operations, ignition process, andcombustion process. In this study, vibration signals have been applied to monitor various fault conditions in the engine suchas intake and exhaust valve clearance faults. Vibration signals acquired in time domain could be mapped onto crank angledomain using top dead center signal. Time domain techniques were used to analyze vibration signals so that the main eventsrelated to the engine operations could be described easily. Using energy analysis technique, all fault conditions could bealso identified. For future work, signal analysis techniques must be developed and the detected signals should be comparedwith other signals such as pressure signal in order to verify the accuracy of the results.
Keywords: condition monitoring, valve clearance, vibration signals, fault condition, time domain, signal energy
Songklanakarin J. Sci. Technol.32 (6), 619-625, Nov. - Dec. 2010
1. Introduction
In the past decades, many successful efforts havebeen made to use vibration analysis as a means for conditionmonitoring of rotating machinery. A number of methods suchas statistical analysis and time domain analysis have showna high potential for the early detection of malfunctions anddiagnosis of machines (Long and Boutin, 1996; Girdhar et al.,2004). However, the use of vibration signals in applicationswith internal combustion engines (diesel and petrol engines)is quite difficult due to the complexity of the vibration signalsand large amount of data. It was early realized that anyeffective approach dedicated to internal combustion engineswould have to cope with the highly transient nature of theirvibrations (Autar, 1996; Long and Boutin, 1996; Gill et al.,
2000). These gave little scope to the classical methods, whichusually assume stationary (time invariance of statisticalproperties) of the vibrations and so cancel out all time infor-mation. This paper introduces an approach, which takes intoaccount the non-stationary nature of the vibration signalsproduced by a small four strokes petrol engine. The idea is torephrase the prospect of vibration monitoring of a small fourstrokes petrol engine into a very general framework of cyclicstationary processes, which is perfectly suited for describingthe physical phenomena generated on a cyclic basis.
Non-intrusive sensor measurement techniques (i.e.vibration measurement technique) provide information intime domain and crank angle domain. This information relatedengine processes can be described to identify existing orimpending problems by detecting deviations from a normalor an achievable condition in the engine cycle (Autar, 1996;Long and Boutin, 1996; Gill et al., 2000). A challenge ofengine monitoring system used in industry is that it has toface with a large amount of recorded data that acquired using
* Corresponding author.Email address: [email protected]
S. Klinchaeam & P. Nivesrangsan / Songklanakarin J. Sci. Technol. 32 (6), 619-625, 2010620
commercial or in-house developed software. These data canbe analyzed using exist signal processing techniques toreduce the number of data and to obtain some useful inform-ation for monitoring the engine conditions. Ideally, acondition monitoring program should mature to integratetechniques to reduce data from all sources and channels intoa centralized system that produces information accessible toall levels of the preventive maintenance.
This paper has studied vibration analysis methodsbased on time domain analysis for a condition monitoring ofa small four strokes, single cylinder petrol engine with acapacity of 125 cm3 using vibration signals. The physicalaspects of combustion characteristics of the spark ignitionengine are very crucial for the engine performance and canbe described using actual vibration signals and a referencesignal or a top dead center (TDC) signal. The analyticaltechnique and data reduction can produce a normalizedmeasure that can be used to analyze the states of the engine.
In this research, vibration signals were acquired ona small petrol engine using LabVIEW program. Vibrationsignals were acquired using an accelerometer with a magneticclamp attached on the surface of cylinder block of the petrolengine. A proximity sensor was used to record the TDCsignals. For the signal analysis, vibration signals weremapped from time domain into crank angle domain. Typicalvibration signals detected on the petrol engine are related tothe main events associated with some mechanical and fluidflow processes in the engine cycle. Thus, vibration signalscan be mapped onto various processes associated withintake/exhaust valve operation, combustion and spark igni-tion processes. For fault diagnosis, vibration signal can beanalyzed using signal energy, which is described in thisstudy.
2. Signal Processing
The analysis of vibration patterns is an evaluation ofvibration relationship to a crankshaft angle and is to obtainthe understanding of various mechanical processes in theengine cycle associated with mechanical impacts or gasleaks. Mechanical impacts, such as valve closure, producesharp vibration patterns. Gas leaks, however, typically occurover a longer period of time and have lower amplitudes(Autar, 1996; Long and Boutin, 1996; Gill et al., 2000). Gasleaks are usually affected by the changing pressure in thecylinder. A roughness or friction also produces vibrationpattern that is characterized by a noise with low amplitude(Autar, 1996; Long and Boutin, 1996; Gill et al., 2000; Antoniet al., 2002). The vibration pattern analysis of the four strokespetrol engine involves the determination of the presence andabsence of expected events associated with the engineprocesses, which occur at measurable amplitudes and at aspecific time. Abnormal events based on the mechanical expe-rience and the maintenance history of the engine operationcan be predicted using the engine knowledge, then, specificregions of the vibration pattern can be separated. Potential
faults can be defined with the vibration pattern. Anomaliesin the signal pattern can be detected by comparison with abaseline normal condition pattern.
The signal analysis techniques used in this study arebased on time domain, crank angle domain, and signal energy.Typical vibration signals are acquired on time domain andcan be converted into crank angle domain using a referencesignal that gives the TDC signal of an engine. Thus, the mainevents related to the petrol engine processes can be identi-fied. To obtain more information from the vibration signals,the signal energy technique is applied to improve signal reso-lution so that various fault conditions can be identified. Thesignal energy ( xE ) can be calculated, as follows:
2
0( )
t
x x t dtE (1)
where ( )x t is time domain waveform at time, t.In this work, the signal energy can be used to analyze
vibration signals or acceleration signals detected from anaccelerometer, thus the engine state can be described by thetime domain techniques. This work applied numericalmethods of trapezoidal rule to evaluate the area under thecurve of the signal energy.
3. Experiment
A small, single cylinder, four strokes petrol engine,Tiger brand, with capacity of 125 cm3 was used and run ata speed of 1500 rpm, no load and with various conditionssuch as the intake and exhaust valve clearance fault condi-tions as shown in Figure 1. Typical spark plug gap used inthis engine was 0.8 mm. All fault conditions were simulatedon the engine as follows:
Simulated fault at the intake valve (IV) with variousintake valve clearance fault conditions i.e. IV Fault 1 = 0.8mm, IV Fault 2 = 2 mm and IV Fault 3 = 3 mm. The typicalintake valve clearance of this engine was 1.5 mm.
Simulated fault at the exhaust valve (EV) with vari-ous exhaust valve clearance fault conditions i.e. EV Fault1 = 1 mm, EV fault 2 = 2.5 mm and EV fault 3 = 3 mm. Thetypical exhaust valve clearance of this engine was 2 mm.
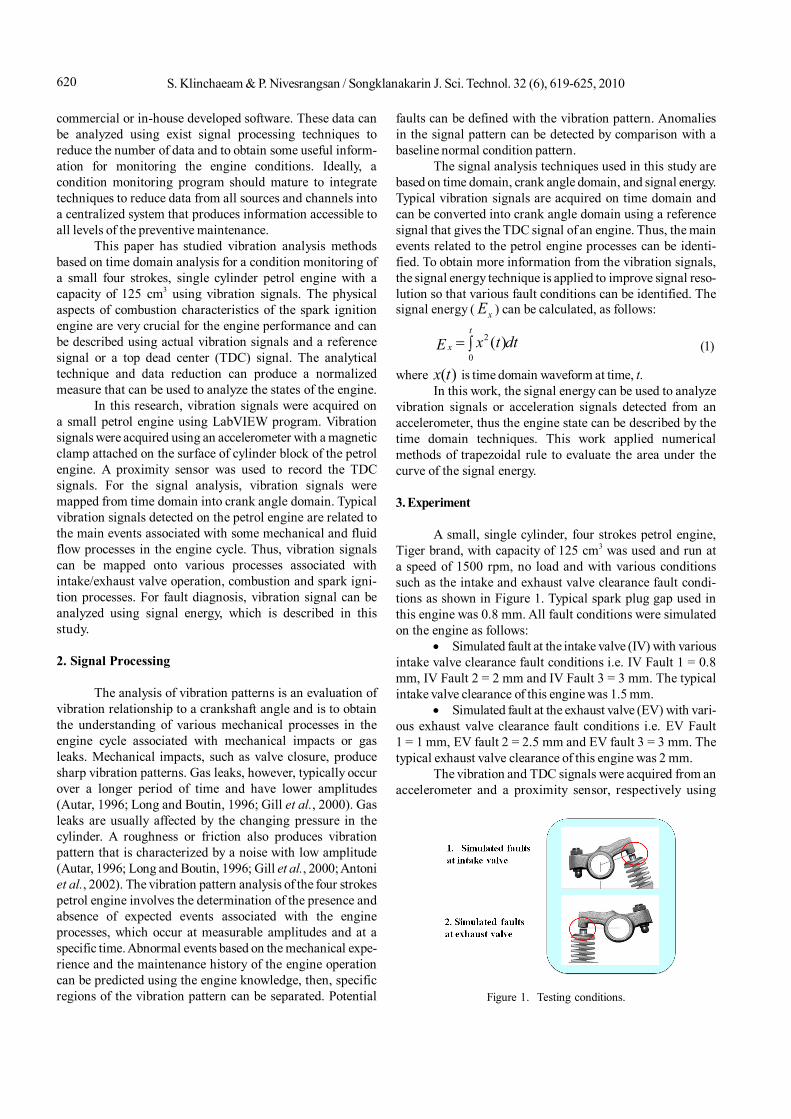
The vibration and TDC signals were acquired from anaccelerometer and a proximity sensor, respectively using
Figure 1. Testing conditions.
621S. Klinchaeam & P. Nivesrangsan / Songklanakarin J. Sci. Technol. 32 (6), 619-625, 2010
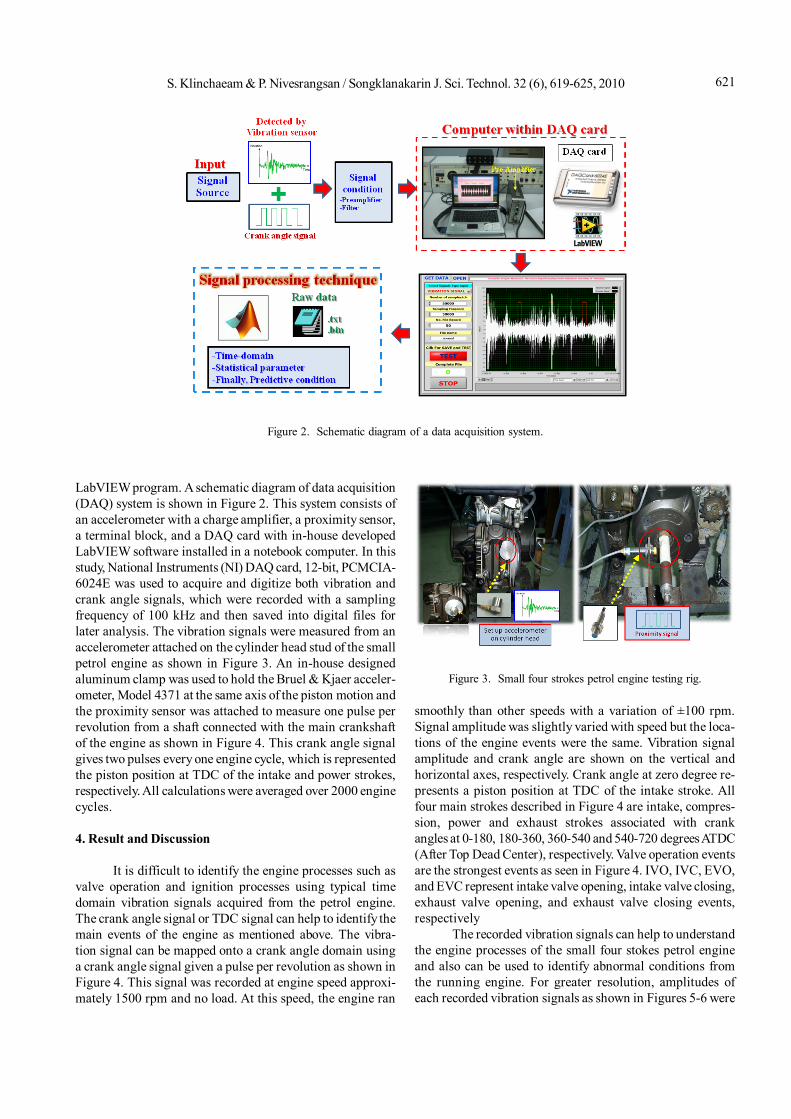
LabVIEW program. A schematic diagram of data acquisition(DAQ) system is shown in Figure 2. This system consists ofan accelerometer with a charge amplifier, a proximity sensor,a terminal block, and a DAQ card with in-house developedLabVIEW software installed in a notebook computer. In thisstudy, National Instruments (NI) DAQ card, 12-bit, PCMCIA-6024E was used to acquire and digitize both vibration andcrank angle signals, which were recorded with a samplingfrequency of 100 kHz and then saved into digital files forlater analysis. The vibration signals were measured from anaccelerometer attached on the cylinder head stud of the smallpetrol engine as shown in Figure 3. An in-house designedaluminum clamp was used to hold the Bruel & Kjaer acceler-ometer, Model 4371 at the same axis of the piston motion andthe proximity sensor was attached to measure one pulse perrevolution from a shaft connected with the main crankshaftof the engine as shown in Figure 4. This crank angle signalgives two pulses every one engine cycle, which is representedthe piston position at TDC of the intake and power strokes,respectively. All calculations were averaged over 2000 enginecycles.
4. Result and Discussion
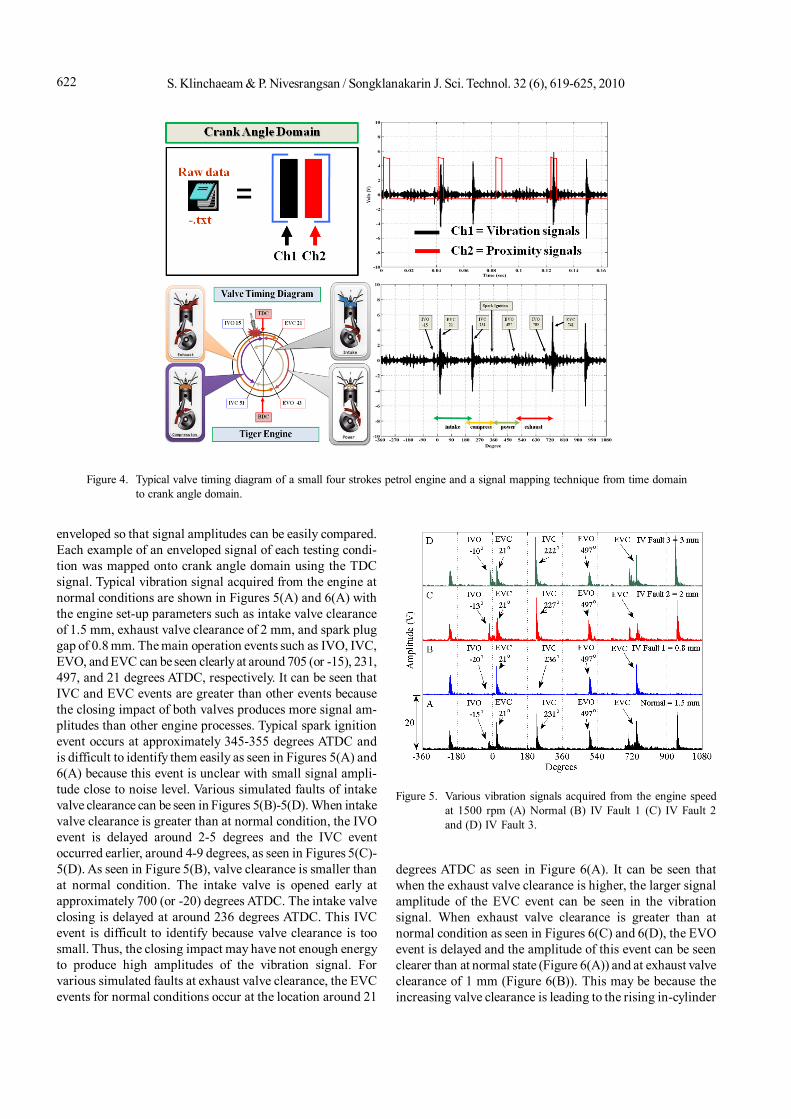
It is difficult to identify the engine processes such asvalve operation and ignition processes using typical timedomain vibration signals acquired from the petrol engine.The crank angle signal or TDC signal can help to identify themain events of the engine as mentioned above. The vibra-tion signal can be mapped onto a crank angle domain usinga crank angle signal given a pulse per revolution as shown inFigure 4. This signal was recorded at engine speed approxi-mately 1500 rpm and no load. At this speed, the engine ran
smoothly than other speeds with a variation of ±100 rpm.Signal amplitude was slightly varied with speed but the loca-tions of the engine events were the same. Vibration signalamplitude and crank angle are shown on the vertical andhorizontal axes, respectively. Crank angle at zero degree re-presents a piston position at TDC of the intake stroke. Allfour main strokes described in Figure 4 are intake, compres-sion, power and exhaust strokes associated with crankangles at 0-180, 180-360, 360-540 and 540-720 degrees ATDC(After Top Dead Center), respectively. Valve operation eventsare the strongest events as seen in Figure 4. IVO, IVC, EVO,and EVC represent intake valve opening, intake valve closing,exhaust valve opening, and exhaust valve closing events,respectively
The recorded vibration signals can help to understandthe engine processes of the small four stokes petrol engineand also can be used to identify abnormal conditions fromthe running engine. For greater resolution, amplitudes ofeach recorded vibration signals as shown in Figures 5-6 were
Figure 2. Schematic diagram of a data acquisition system.
Figure 3. Small four strokes petrol engine testing rig.
S. Klinchaeam & P. Nivesrangsan / Songklanakarin J. Sci. Technol. 32 (6), 619-625, 2010622
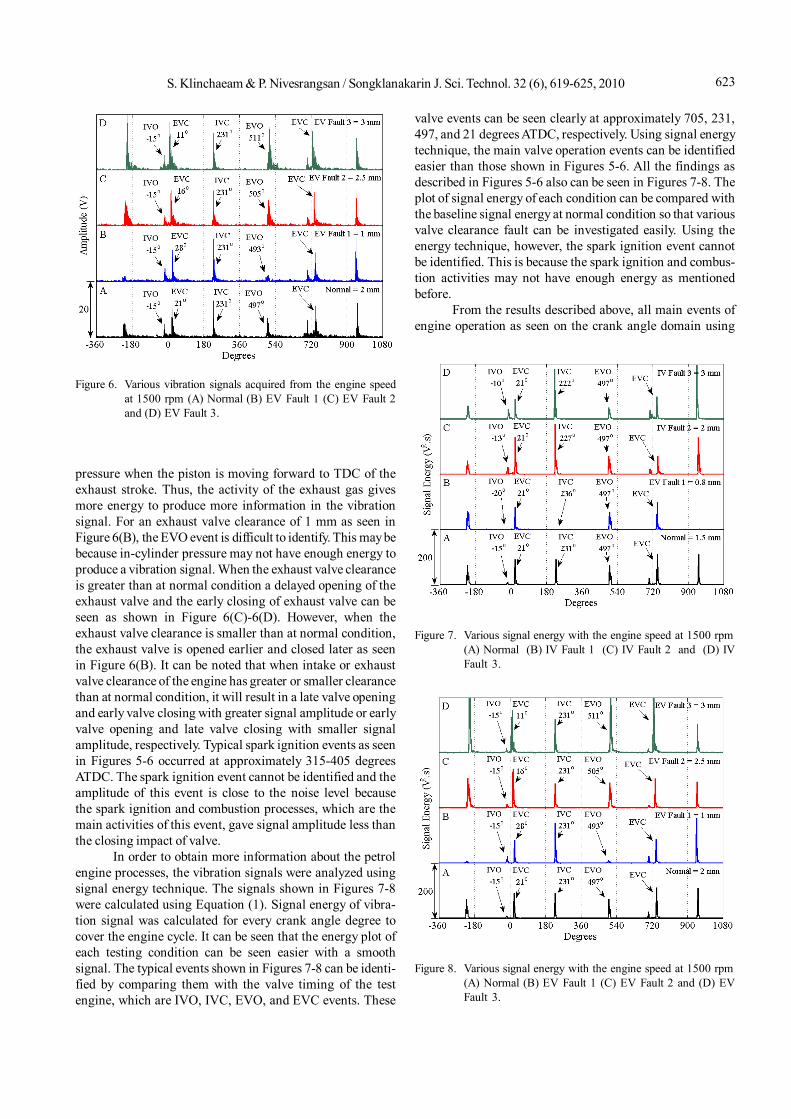
enveloped so that signal amplitudes can be easily compared.Each example of an enveloped signal of each testing condi-tion was mapped onto crank angle domain using the TDCsignal. Typical vibration signal acquired from the engine atnormal conditions are shown in Figures 5(A) and 6(A) withthe engine set-up parameters such as intake valve clearanceof 1.5 mm, exhaust valve clearance of 2 mm, and spark pluggap of 0.8 mm. The main operation events such as IVO, IVC,EVO, and EVC can be seen clearly at around 705 (or -15), 231,497, and 21 degrees ATDC, respectively. It can be seen thatIVC and EVC events are greater than other events becausethe closing impact of both valves produces more signal am-plitudes than other engine processes. Typical spark ignitionevent occurs at approximately 345-355 degrees ATDC andis difficult to identify them easily as seen in Figures 5(A) and6(A) because this event is unclear with small signal ampli-tude close to noise level. Various simulated faults of intakevalve clearance can be seen in Figures 5(B)-5(D). When intakevalve clearance is greater than at normal condition, the IVOevent is delayed around 2-5 degrees and the IVC eventoccurred earlier, around 4-9 degrees, as seen in Figures 5(C)-5(D). As seen in Figure 5(B), valve clearance is smaller thanat normal condition. The intake valve is opened early atapproximately 700 (or -20) degrees ATDC. The intake valveclosing is delayed at around 236 degrees ATDC. This IVCevent is difficult to identify because valve clearance is toosmall. Thus, the closing impact may have not enough energyto produce high amplitudes of the vibration signal. Forvarious simulated faults at exhaust valve clearance, the EVCevents for normal conditions occur at the location around 21
degrees ATDC as seen in Figure 6(A). It can be seen thatwhen the exhaust valve clearance is higher, the larger signalamplitude of the EVC event can be seen in the vibrationsignal. When exhaust valve clearance is greater than atnormal condition as seen in Figures 6(C) and 6(D), the EVOevent is delayed and the amplitude of this event can be seenclearer than at normal state (Figure 6(A)) and at exhaust valveclearance of 1 mm (Figure 6(B)). This may be because theincreasing valve clearance is leading to the rising in-cylinder
Figure 4. Typical valve timing diagram of a small four strokes petrol engine and a signal mapping technique from time domainto crank angle domain.
Figure 5. Various vibration signals acquired from the engine speedat 1500 rpm (A) Normal (B) IV Fault 1 (C) IV Fault 2and (D) IV Fault 3.
623S. Klinchaeam & P. Nivesrangsan / Songklanakarin J. Sci. Technol. 32 (6), 619-625, 2010
pressure when the piston is moving forward to TDC of theexhaust stroke. Thus, the activity of the exhaust gas givesmore energy to produce more information in the vibrationsignal. For an exhaust valve clearance of 1 mm as seen inFigure 6(B), the EVO event is difficult to identify. This may bebecause in-cylinder pressure may not have enough energy toproduce a vibration signal. When the exhaust valve clearanceis greater than at normal condition a delayed opening of theexhaust valve and the early closing of exhaust valve can beseen as shown in Figure 6(C)-6(D). However, when theexhaust valve clearance is smaller than at normal condition,the exhaust valve is opened earlier and closed later as seenin Figure 6(B). It can be noted that when intake or exhaustvalve clearance of the engine has greater or smaller clearancethan at normal condition, it will result in a late valve openingand early valve closing with greater signal amplitude or earlyvalve opening and late valve closing with smaller signalamplitude, respectively. Typical spark ignition events as seenin Figures 5-6 occurred at approximately 315-405 degreesATDC. The spark ignition event cannot be identified and theamplitude of this event is close to the noise level becausethe spark ignition and combustion processes, which are themain activities of this event, gave signal amplitude less thanthe closing impact of valve.
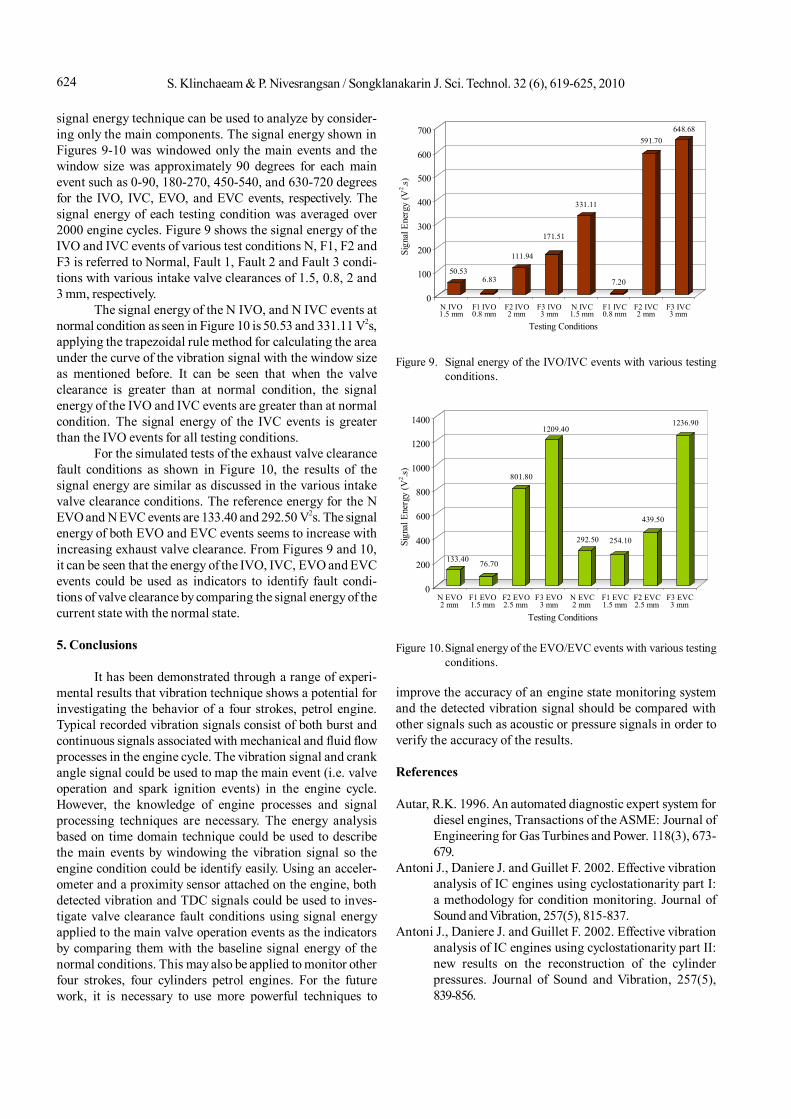
In order to obtain more information about the petrolengine processes, the vibration signals were analyzed usingsignal energy technique. The signals shown in Figures 7-8were calculated using Equation (1). Signal energy of vibra-tion signal was calculated for every crank angle degree tocover the engine cycle. It can be seen that the energy plot ofeach testing condition can be seen easier with a smoothsignal. The typical events shown in Figures 7-8 can be identi-fied by comparing them with the valve timing of the testengine, which are IVO, IVC, EVO, and EVC events. These
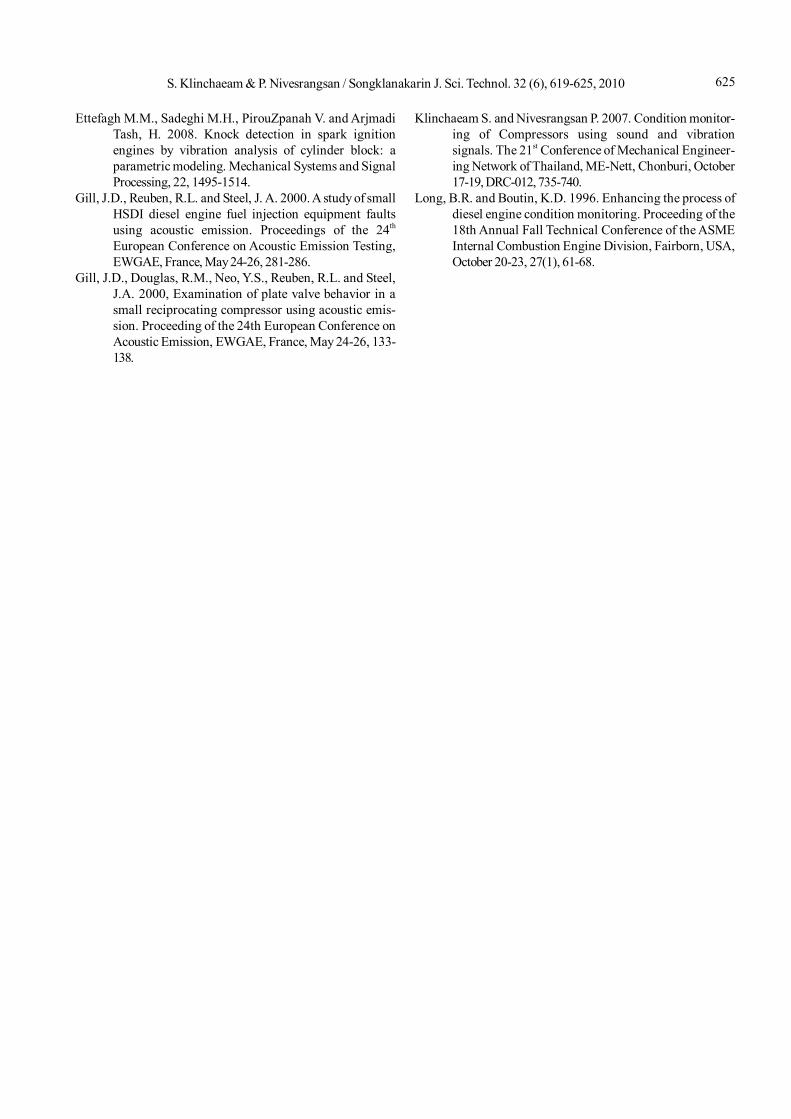
Figure 6. Various vibration signals acquired from the engine speedat 1500 rpm (A) Normal (B) EV Fault 1 (C) EV Fault 2and (D) EV Fault 3.
valve events can be seen clearly at approximately 705, 231,497, and 21 degrees ATDC, respectively. Using signal energytechnique, the main valve operation events can be identifiedeasier than those shown in Figures 5-6. All the findings asdescribed in Figures 5-6 also can be seen in Figures 7-8. Theplot of signal energy of each condition can be compared withthe baseline signal energy at normal condition so that variousvalve clearance fault can be investigated easily. Using theenergy technique, however, the spark ignition event cannotbe identified. This is because the spark ignition and combus-tion activities may not have enough energy as mentionedbefore.
From the results described above, all main events ofengine operation as seen on the crank angle domain using
Figure 7. Various signal energy with the engine speed at 1500 rpm(A) Normal (B) IV Fault 1 (C) IV Fault 2 and (D) IVFault 3.
Figure 8. Various signal energy with the engine speed at 1500 rpm(A) Normal (B) EV Fault 1 (C) EV Fault 2 and (D) EVFault 3.
S. Klinchaeam & P. Nivesrangsan / Songklanakarin J. Sci. Technol. 32 (6), 619-625, 2010624
signal energy technique can be used to analyze by consider-ing only the main components. The signal energy shown inFigures 9-10 was windowed only the main events and thewindow size was approximately 90 degrees for each mainevent such as 0-90, 180-270, 450-540, and 630-720 degreesfor the IVO, IVC, EVO, and EVC events, respectively. Thesignal energy of each testing condition was averaged over2000 engine cycles. Figure 9 shows the signal energy of theIVO and IVC events of various test conditions N, F1, F2 andF3 is referred to Normal, Fault 1, Fault 2 and Fault 3 condi-tions with various intake valve clearances of 1.5, 0.8, 2 and3 mm, respectively.
The signal energy of the N IVO, and N IVC events atnormal condition as seen in Figure 10 is 50.53 and 331.11 V2s,applying the trapezoidal rule method for calculating the areaunder the curve of the vibration signal with the window sizeas mentioned before. It can be seen that when the valveclearance is greater than at normal condition, the signalenergy of the IVO and IVC events are greater than at normalcondition. The signal energy of the IVC events is greaterthan the IVO events for all testing conditions.
For the simulated tests of the exhaust valve clearancefault conditions as shown in Figure 10, the results of thesignal energy are similar as discussed in the various intakevalve clearance conditions. The reference energy for the NEVO and N EVC events are 133.40 and 292.50 V2s. The signalenergy of both EVO and EVC events seems to increase withincreasing exhaust valve clearance. From Figures 9 and 10,it can be seen that the energy of the IVO, IVC, EVO and EVCevents could be used as indicators to identify fault condi-tions of valve clearance by comparing the signal energy of thecurrent state with the normal state.
5. Conclusions
It has been demonstrated through a range of experi-mental results that vibration technique shows a potential forinvestigating the behavior of a four strokes, petrol engine.Typical recorded vibration signals consist of both burst andcontinuous signals associated with mechanical and fluid flowprocesses in the engine cycle. The vibration signal and crankangle signal could be used to map the main event (i.e. valveoperation and spark ignition events) in the engine cycle.However, the knowledge of engine processes and signalprocessing techniques are necessary. The energy analysisbased on time domain technique could be used to describethe main events by windowing the vibration signal so theengine condition could be identify easily. Using an acceler-ometer and a proximity sensor attached on the engine, bothdetected vibration and TDC signals could be used to inves-tigate valve clearance fault conditions using signal energyapplied to the main valve operation events as the indicatorsby comparing them with the baseline signal energy of thenormal conditions. This may also be applied to monitor otherfour strokes, four cylinders petrol engines. For the futurework, it is necessary to use more powerful techniques to
improve the accuracy of an engine state monitoring systemand the detected vibration signal should be compared withother signals such as acoustic or pressure signals in order toverify the accuracy of the results.
References
Autar, R.K. 1996. An automated diagnostic expert system fordiesel engines, Transactions of the ASME: Journal ofEngineering for Gas Turbines and Power. 118(3), 673-679.
Antoni J., Daniere J. and Guillet F. 2002. Effective vibrationanalysis of IC engines using cyclostationarity part I:a methodology for condition monitoring. Journal ofSound and Vibration, 257(5), 815-837.
Antoni J., Daniere J. and Guillet F. 2002. Effective vibrationanalysis of IC engines using cyclostationarity part II:new results on the reconstruction of the cylinderpressures. Journal of Sound and Vibration, 257(5),839-856.
50.536.83
111.94
171.51
331.11
7.20
591.70648.68
0
100
200
300
400
500
600
700
1 2 3 4 5 6 7 8N IVO1.5 mm
F1 IVO0.8 mm
F2 IVO2 mm
F3 IVO3 mm
N IVC1.5 mm
F1 IVC0.8 mm
F2 IVC2 mm
F3 IVC3 mm
Testing Conditions
Sign
al E
nerg
y (V
2 .s)
Figure 9. Signal energy of the IVO/IVC events with various testingconditions.
133.40 76.70
801.80
1209.40
292.50 254.10
439.50
1236.90
0
200
400
600
800
1000
1200
1400
1 2 3 4 5 6 7 8N EVO2 mm
F1 EVO1.5 mm
F2 EVO2.5 mm
F3 EVO3 mm
N EVC2 mm
F1 EVC1.5 mm
F2 EVC2.5 mm
F3 EVC3 mm
Testing Conditions
Sign
al E
nerg
y (V
2 .s)
Figure 10.Signal energy of the EVO/EVC events with various testingconditions.
625S. Klinchaeam & P. Nivesrangsan / Songklanakarin J. Sci. Technol. 32 (6), 619-625, 2010
Ettefagh M.M., Sadeghi M.H., PirouZpanah V. and ArjmadiTash, H. 2008. Knock detection in spark ignitionengines by vibration analysis of cylinder block: aparametric modeling. Mechanical Systems and SignalProcessing, 22, 1495-1514.
Gill, J.D., Reuben, R.L. and Steel, J. A. 2000. A study of smallHSDI diesel engine fuel injection equipment faultsusing acoustic emission. Proceedings of the 24th
European Conference on Acoustic Emission Testing,EWGAE, France, May 24-26, 281-286.
Gill, J.D., Douglas, R.M., Neo, Y.S., Reuben, R.L. and Steel,J.A. 2000, Examination of plate valve behavior in asmall reciprocating compressor using acoustic emis-sion. Proceeding of the 24th European Conference onAcoustic Emission, EWGAE, France, May 24-26, 133-138.
Klinchaeam S. and Nivesrangsan P. 2007. Condition monitor-ing of Compressors using sound and vibrationsignals. The 21st Conference of Mechanical Engineer-ing Network of Thailand, ME-Nett, Chonburi, October17-19, DRC-012, 735-740.
Long, B.R. and Boutin, K.D. 1996. Enhancing the process ofdiesel engine condition monitoring. Proceeding of the18th Annual Fall Technical Conference of the ASMEInternal Combustion Engine Division, Fairborn, USA,October 20-23, 27(1), 61-68.