Embed Size (px)
Citation preview

Considerations in P&C Pricing Segmentation
February 25, 2015
Bob Weishaar, Ph.D., FCAS, MAAA
Introduction to personal lines auto pricing considerations Insurance supply and demand Statistical modeling of insurance metrics Simulation and optimization Modern pricing platforms
Agenda
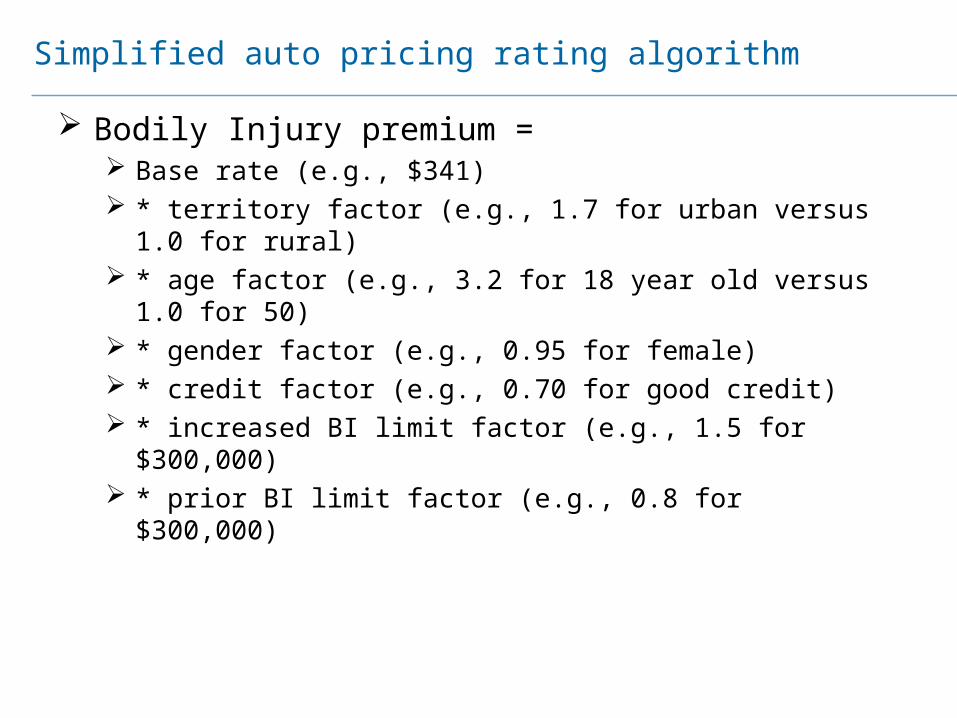
Bodily Injury premium = Base rate (e.g., $341) * territory factor (e.g., 1.7 for urban versus 1.0 for rural) * age factor (e.g., 3.2 for 18 year old versus 1.0 for 50) * gender factor (e.g., 0.95 for female) * credit factor (e.g., 0.70 for good credit) * increased BI limit factor (e.g., 1.5 for $300,000) * prior BI limit factor (e.g., 0.8 for $300,000)
Simplified auto pricing rating algorithm
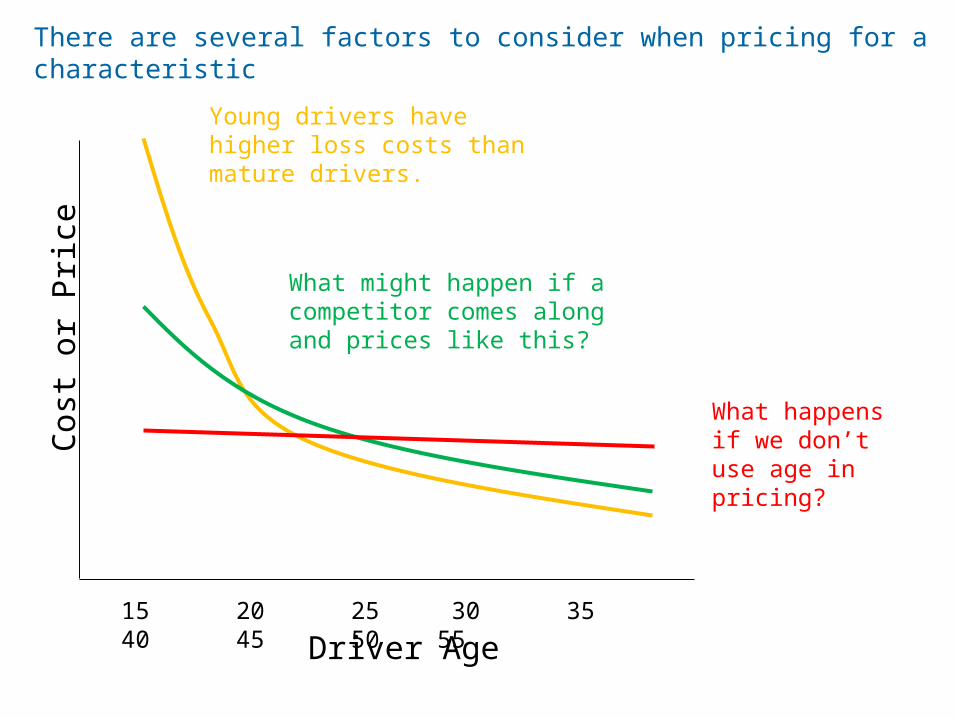
There are several factors to consider when pricing for a characteristic
Driver Age
Cost
or P
rice
15 20 25 30 35 40 45 50 55
What happens if we don’t use age in pricing?
Young drivers have higher loss costs than mature drivers.
What might happen if a competitor comes along and prices like this?
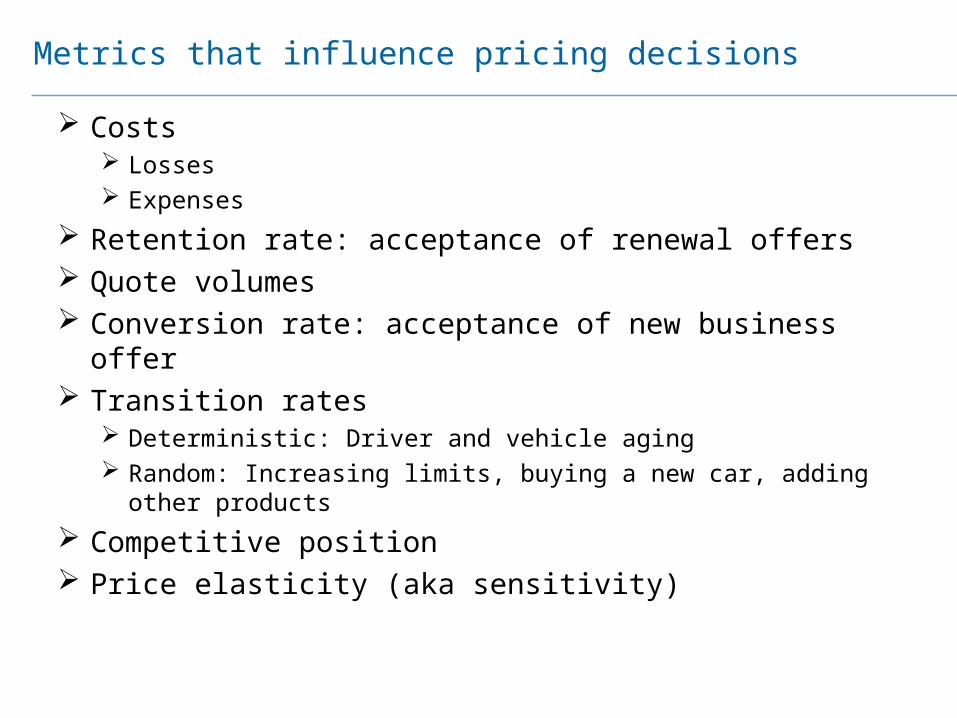
Costs Losses Expenses
Retention rate: acceptance of renewal offers Quote volumes Conversion rate: acceptance of new business offer Transition rates
Deterministic: Driver and vehicle aging Random: Increasing limits, buying a new car, adding other products
Competitive position Price elasticity (aka sensitivity)
Metrics that influence pricing decisions
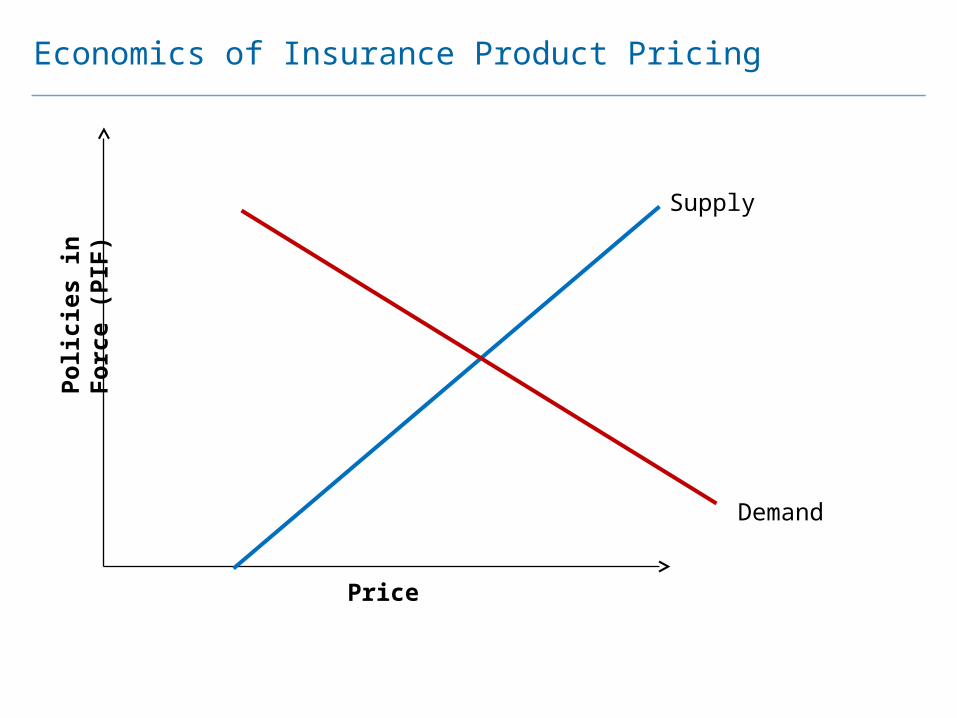
Economics of Insurance Product PricingPo
licie
s in
For
ce (P
IF)
Price
Supply
Demand
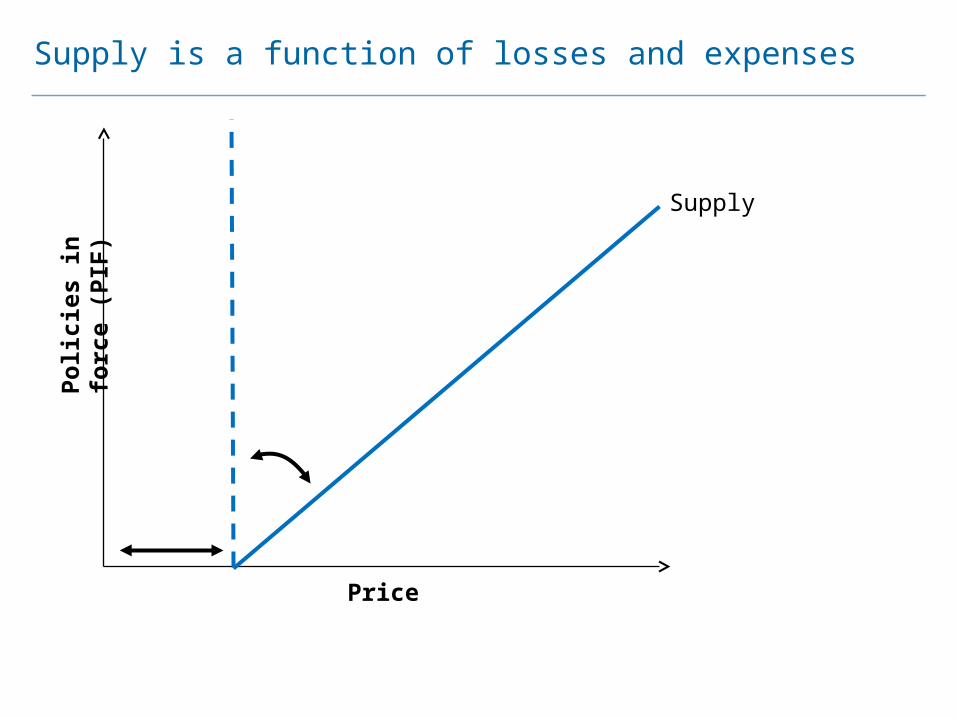
Supply is a function of losses and expensesPo
licie
s in
forc
e (P
IF)
Price
Supply
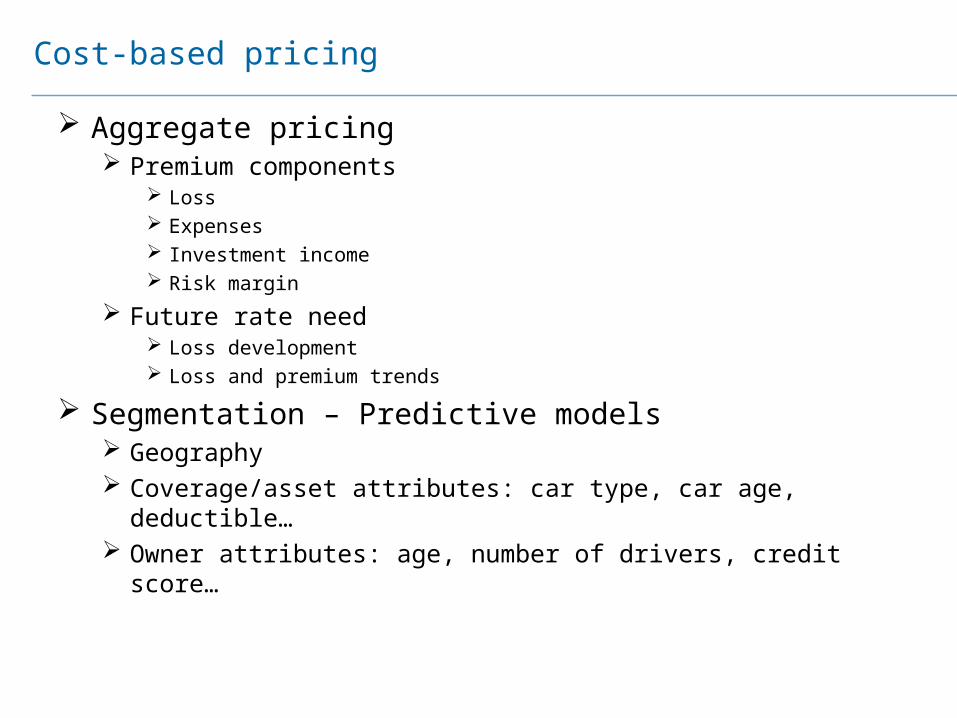
Aggregate pricing Premium components
Loss Expenses Investment income Risk margin
Future rate need Loss development Loss and premium trends
Segmentation – Predictive models Geography Coverage/asset attributes: car type, car age, deductible… Owner attributes: age, number of drivers, credit score…
Cost-based pricing
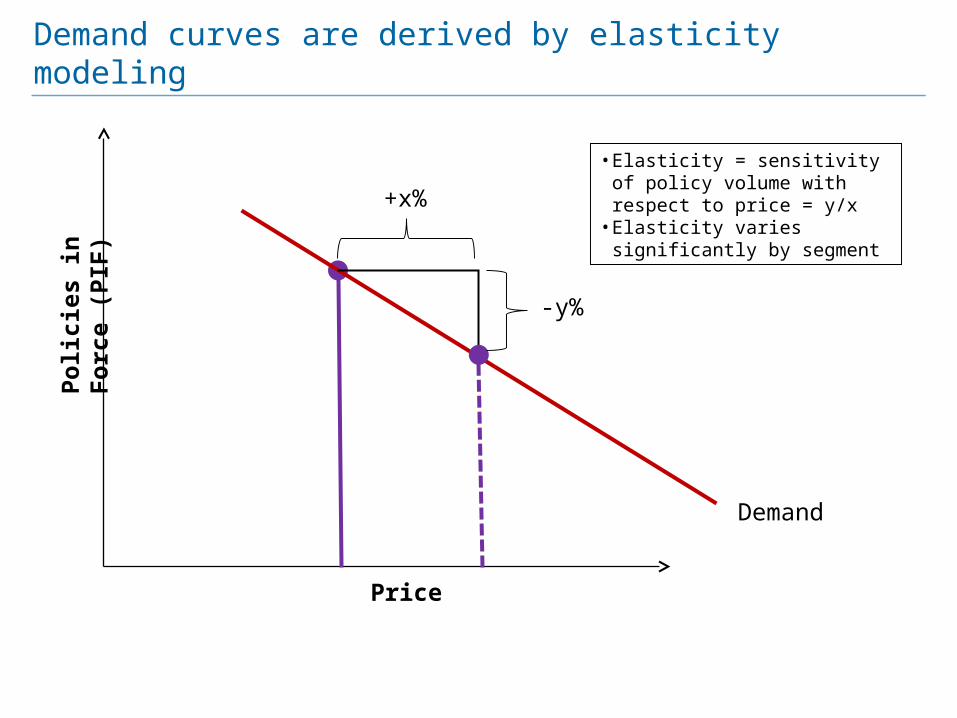
Demand curves are derived by elasticity modeling
Price
+x%
-y%
Demand
Polic
ies
in F
orce
(PIF
)
• Elasticity = sensitivity of policy volume with respect to price = y/x
• Elasticity varies significantly by segment
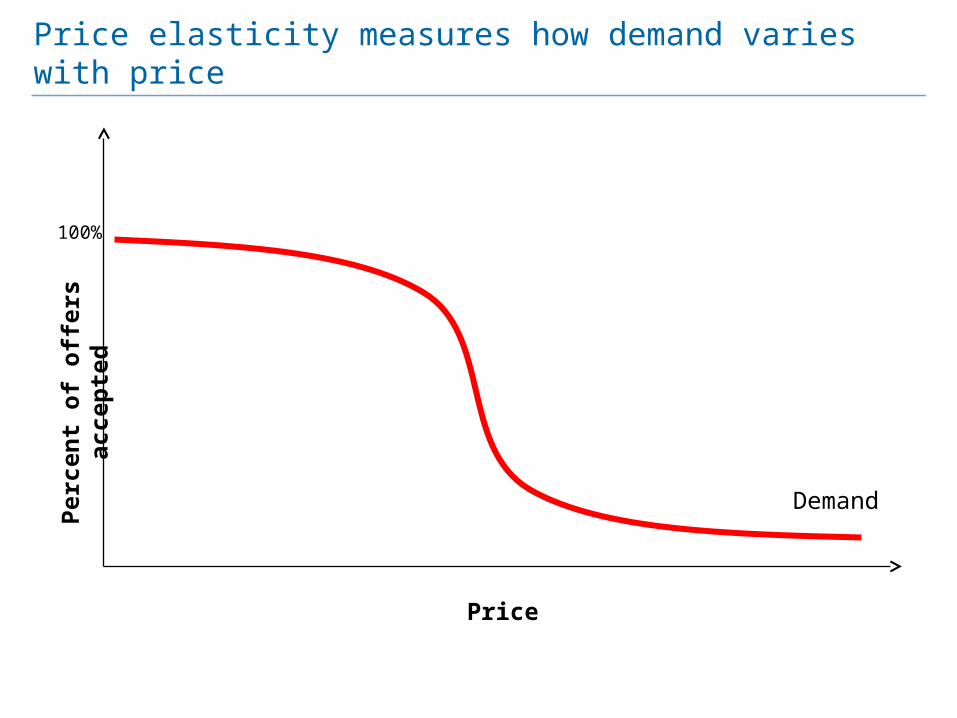
Price elasticity measures how demand varies with price
Price
Perc
ent o
f offe
rs a
ccep
ted
Demand
100%
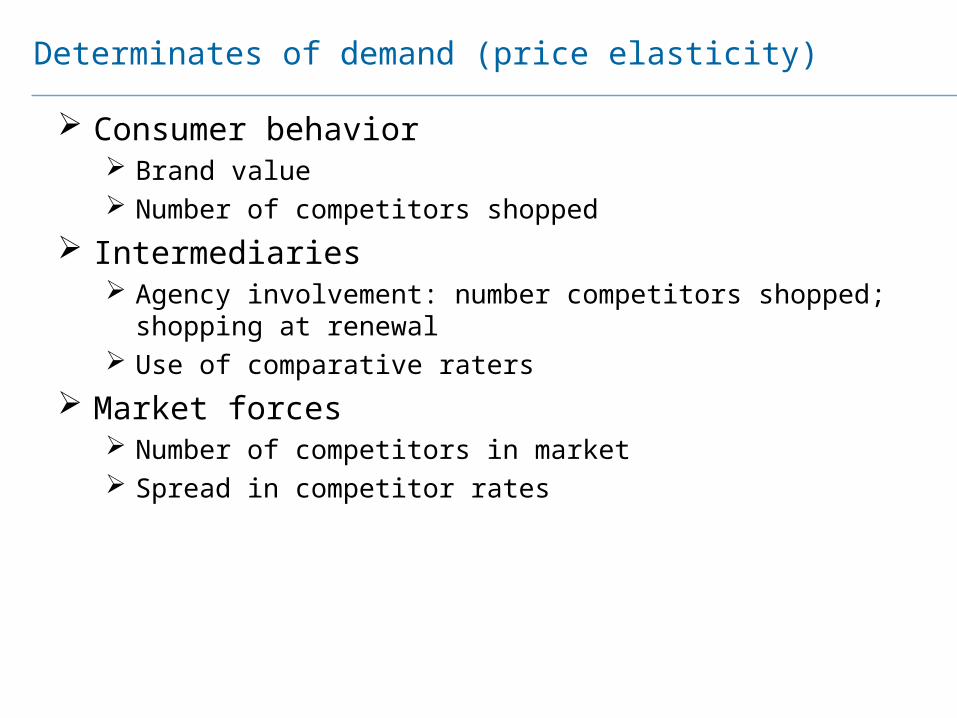
Consumer behavior Brand value Number of competitors shopped
Intermediaries Agency involvement: number competitors shopped; shopping at
renewal Use of comparative raters
Market forces Number of competitors in market Spread in competitor rates
Determinates of demand (price elasticity)
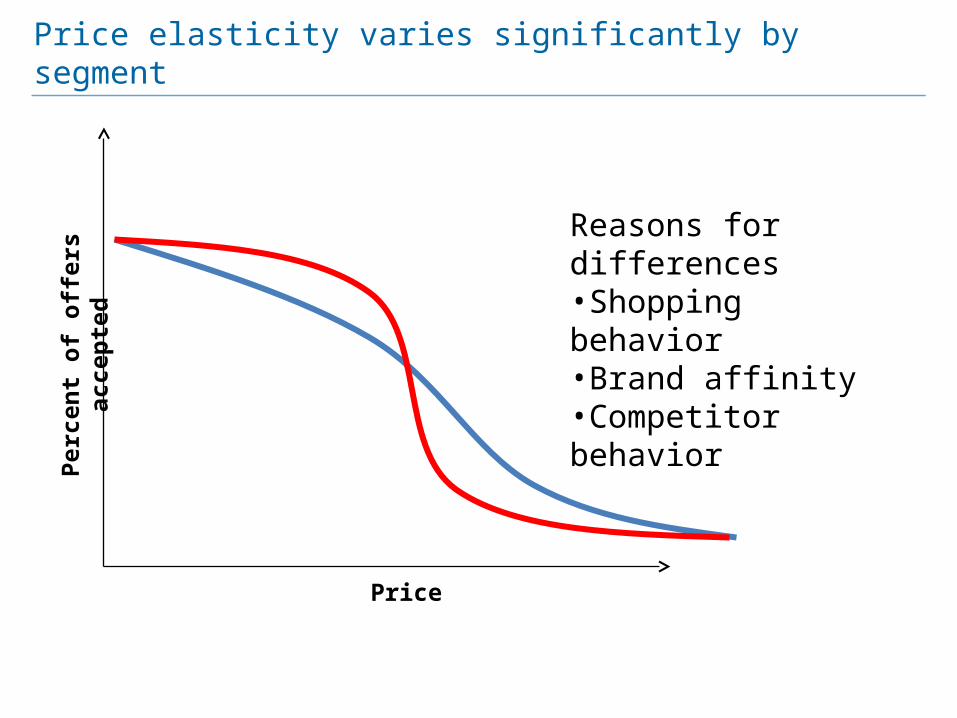
Price elasticity varies significantly by segment
Price
Perc
ent o
f offe
rs a
ccep
ted Reasons for differences
•Shopping behavior•Brand affinity•Competitor behavior
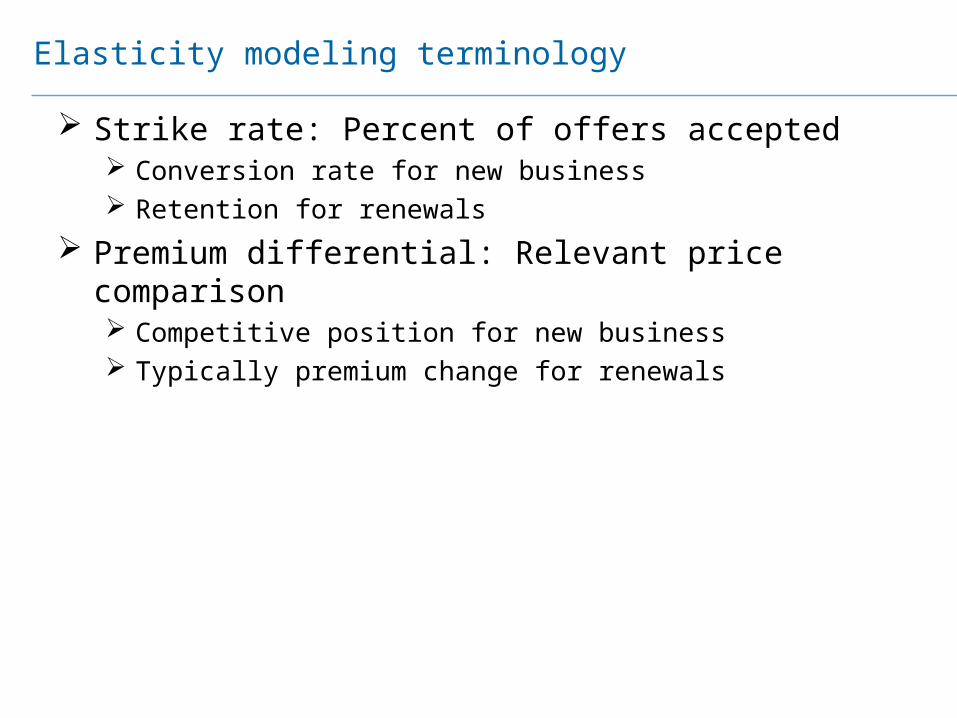
Strike rate: Percent of offers accepted Conversion rate for new business Retention for renewals
Premium differential: Relevant price comparison Competitive position for new business Typically premium change for renewals
Elasticity modeling terminology
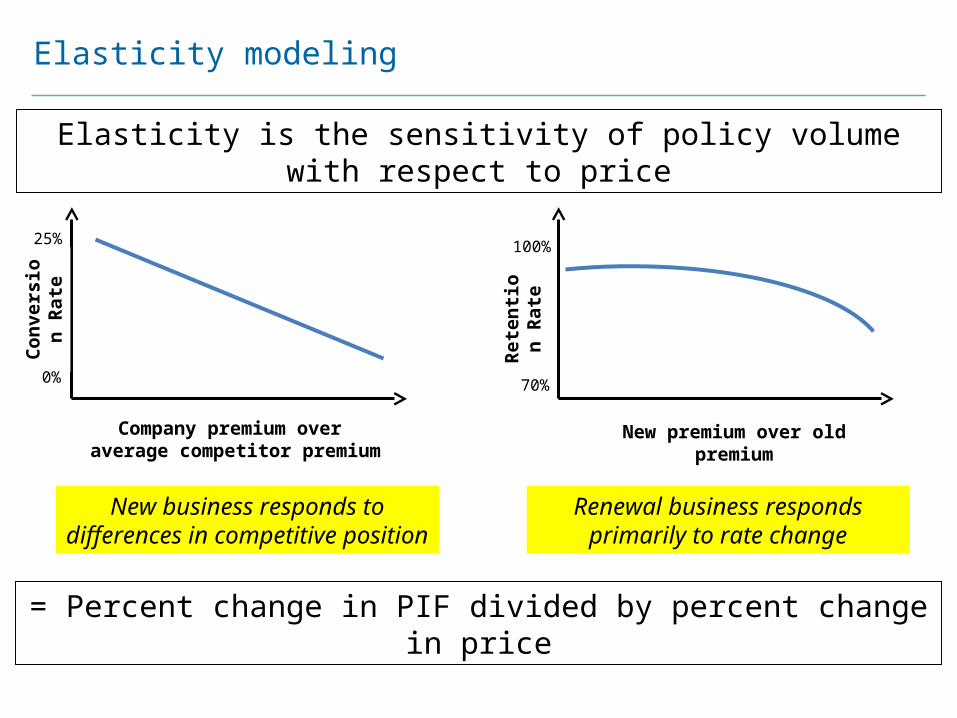
Elasticity modeling
New business responds to differences in competitive position
Renewal business responds primarily to rate change
= Percent change in PIF divided by percent change in price
Elasticity is the sensitivity of policy volume with respect to price
Company premium over average competitor premium
New premium over old premium
Conv
ersi
on
Rate
Rete
ntion
Ra
te
25%
0%
100%
70%
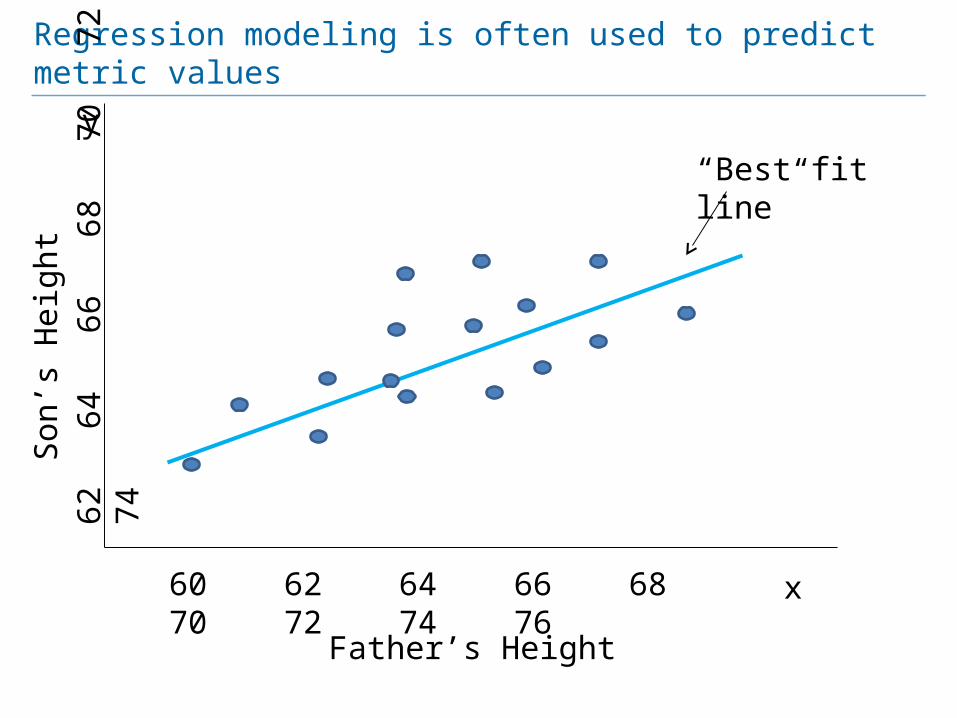
Regression modeling is often used to predict metric values
x
y
60 62 64 66 68 70 72 74 76
62
64
66
68
70
72
74
Father’s Height
Son’
s H
eigh
t
“Best fit line”

Link functions allow a variety of metrics to be modeled
Link functions determine the range of predictions
LinearExponential
Logistic1.0
x
y
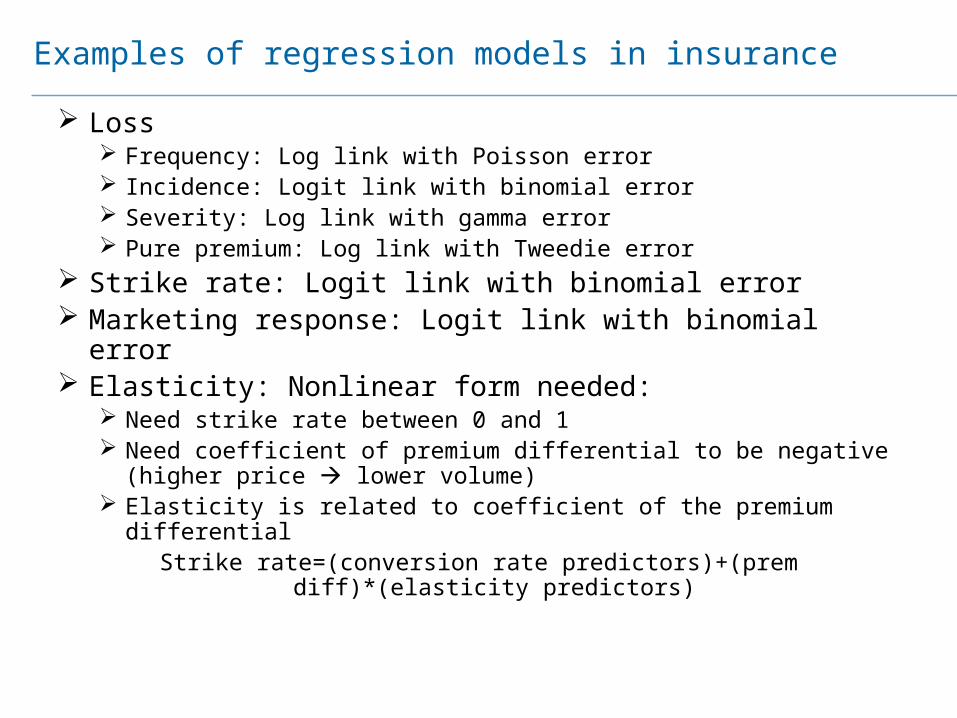
Loss Frequency: Log link with Poisson error Incidence: Logit link with binomial error Severity: Log link with gamma error Pure premium: Log link with Tweedie error
Strike rate: Logit link with binomial error Marketing response: Logit link with binomial error Elasticity: Nonlinear form needed:
Need strike rate between 0 and 1 Need coefficient of premium differential to be negative (higher price
lower volume) Elasticity is related to coefficient of the premium differential
Strike rate=(conversion rate predictors)+(prem diff)*(elasticity predictors)
Examples of regression models in insurance
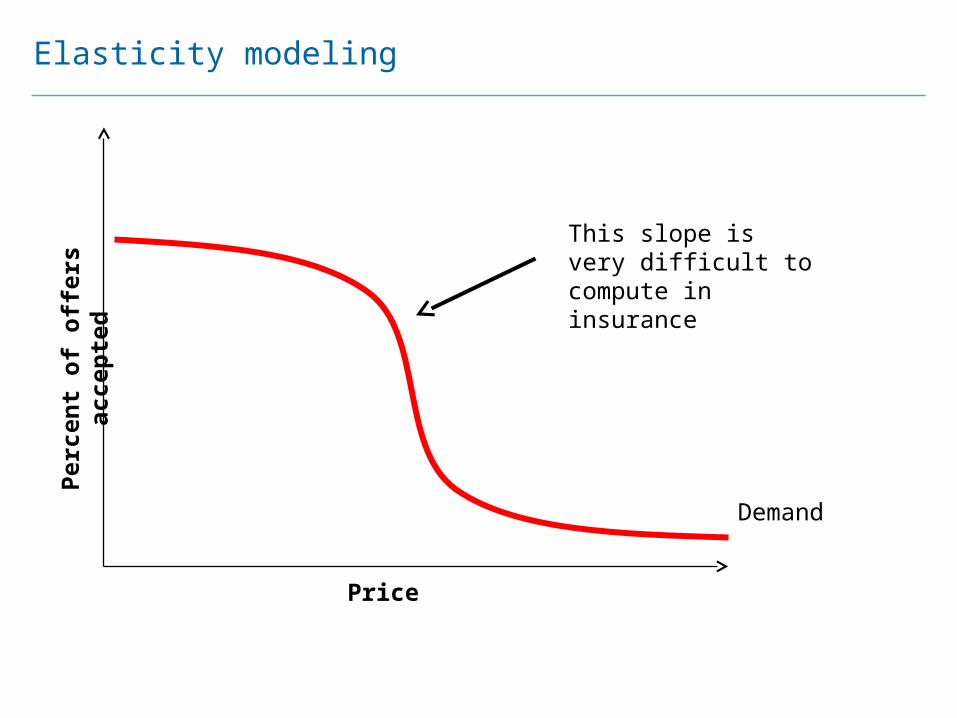
Elasticity modelingPe
rcen
t of o
ffers
acc
epte
d
Price
Demand
This slope is very difficult to compute in insurance
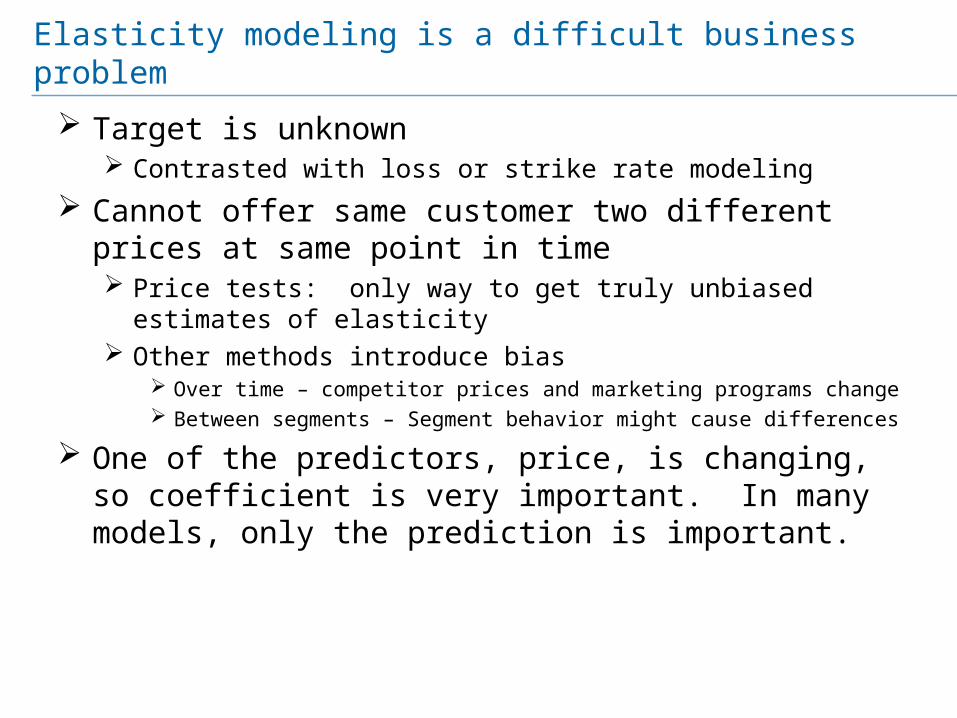
Target is unknown Contrasted with loss or strike rate modeling
Cannot offer same customer two different prices at same point in time Price tests: only way to get truly unbiased estimates of elasticity Other methods introduce bias
Over time – competitor prices and marketing programs change Between segments – Segment behavior might cause differences
One of the predictors, price, is changing, so coefficient is very important. In many models, only the prediction is important.
Elasticity modeling is a difficult business problem
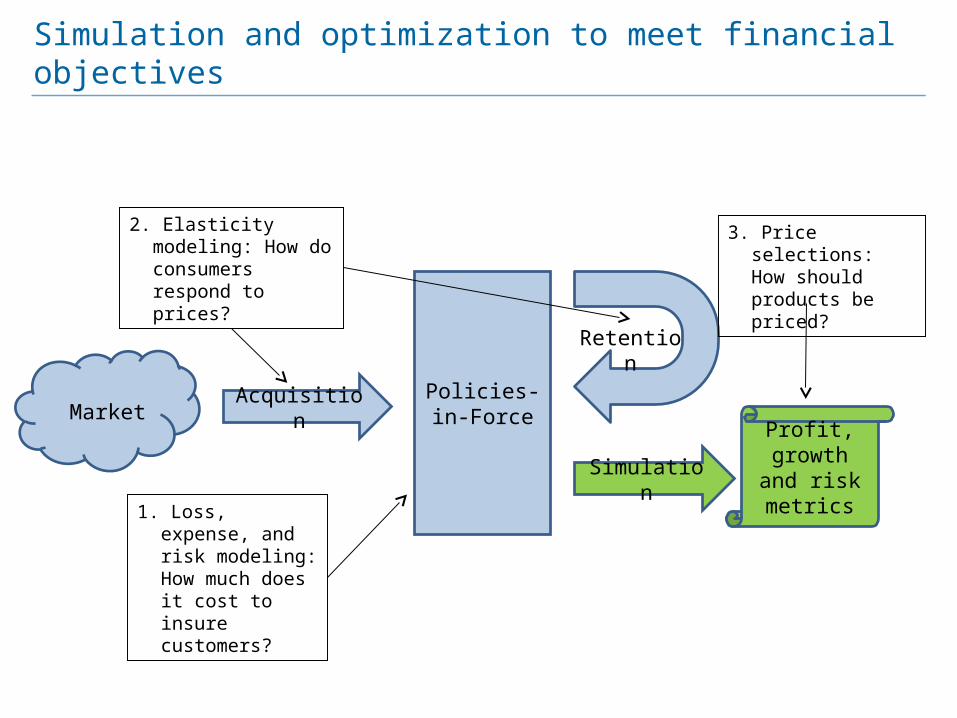
Simulation and optimization to meet financial objectives
Policies-in-ForceMarket Acquisition
Retention
Profit, growth and risk metrics
1. Loss, expense, and risk modeling: How much does it cost to insure customers?
2. Elasticity modeling: How do consumers respond to prices?
3. Price selections: How should products be priced?
Simulation
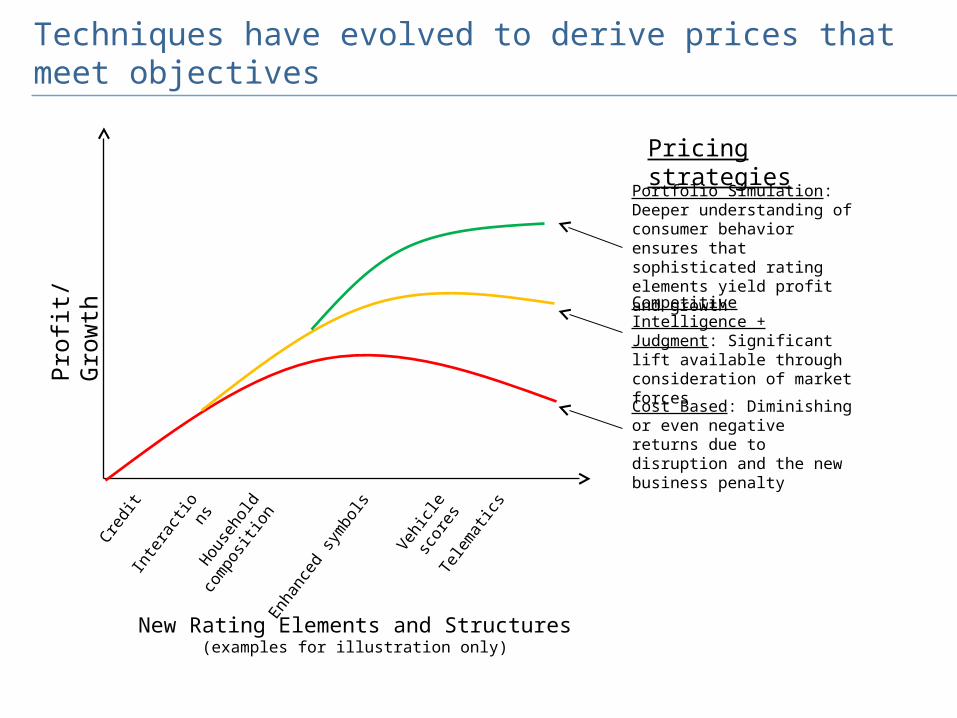
Techniques have evolved to derive prices that meet objectivesPr
ofit/
Gro
wth
Cred
itIn
tera
ction
sHou
seho
ld
com
positi
on
Vehicl
e sco
res
New Rating Elements and Structures(examples for illustration only)
Enha
nced
sym
bols
Telem
atics
Cost Based: Diminishing or even negative returns due to disruption and the new business penalty
Competitive Intelligence + Judgment: Significant lift available through consideration of market forces
Pricing strategies
Portfolio Simulation: Deeper understanding of consumer behavior ensures that sophisticated rating elements yield profit and growth
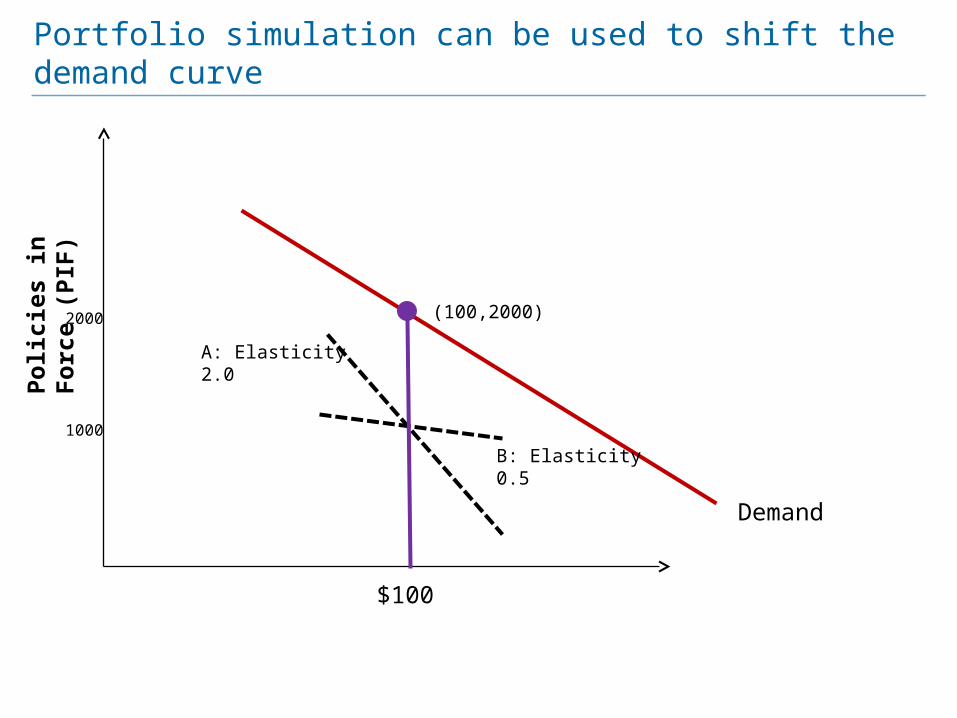
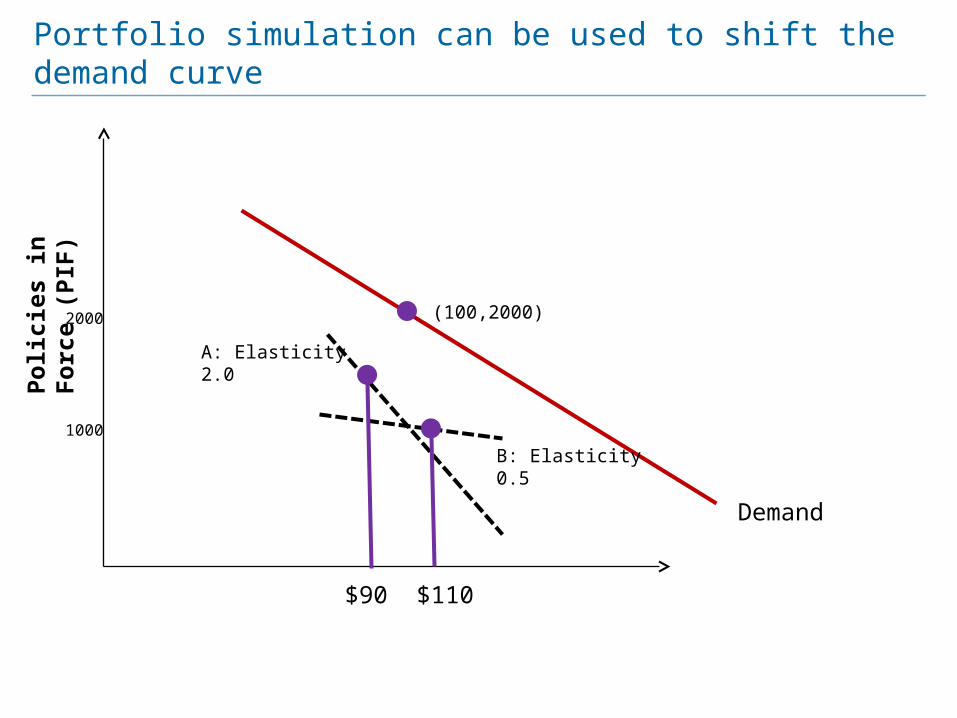
Portfolio simulation can be used to shift the demand curvePo
licie
s in
For
ce (P
IF)
Demand
B: Elasticity 0.5
A: Elasticity 2.0
$100
2000
1000
(100,2000)
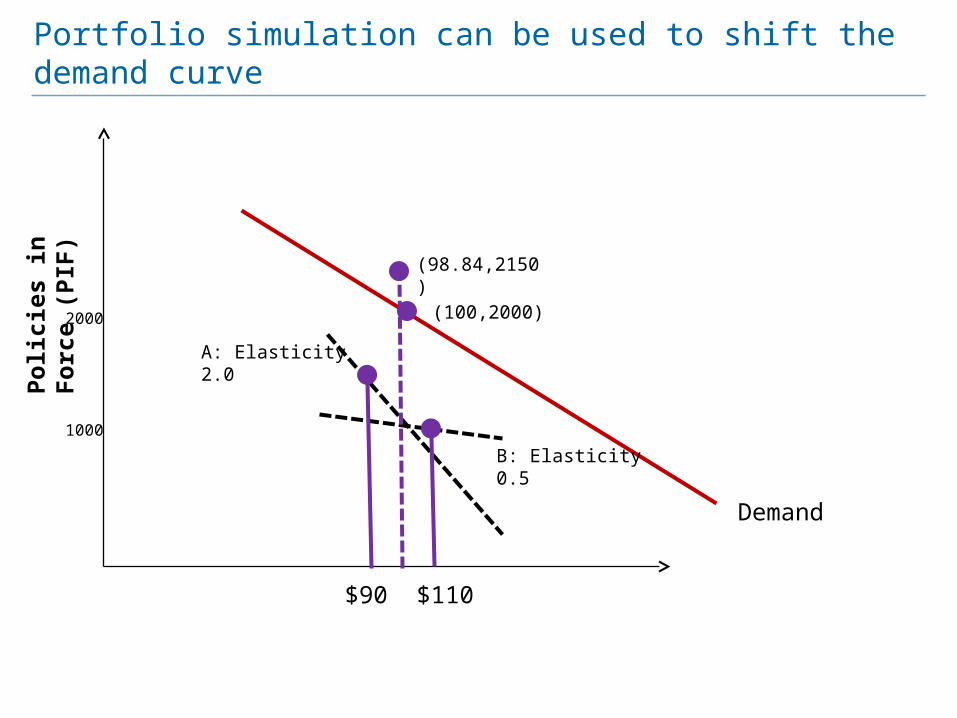
Portfolio simulation can be used to shift the demand curvePo
licie
s in
For
ce (P
IF)
Demand
B: Elasticity 0.5
A: Elasticity 2.0
$90
2000
1000
(100,2000)
$110
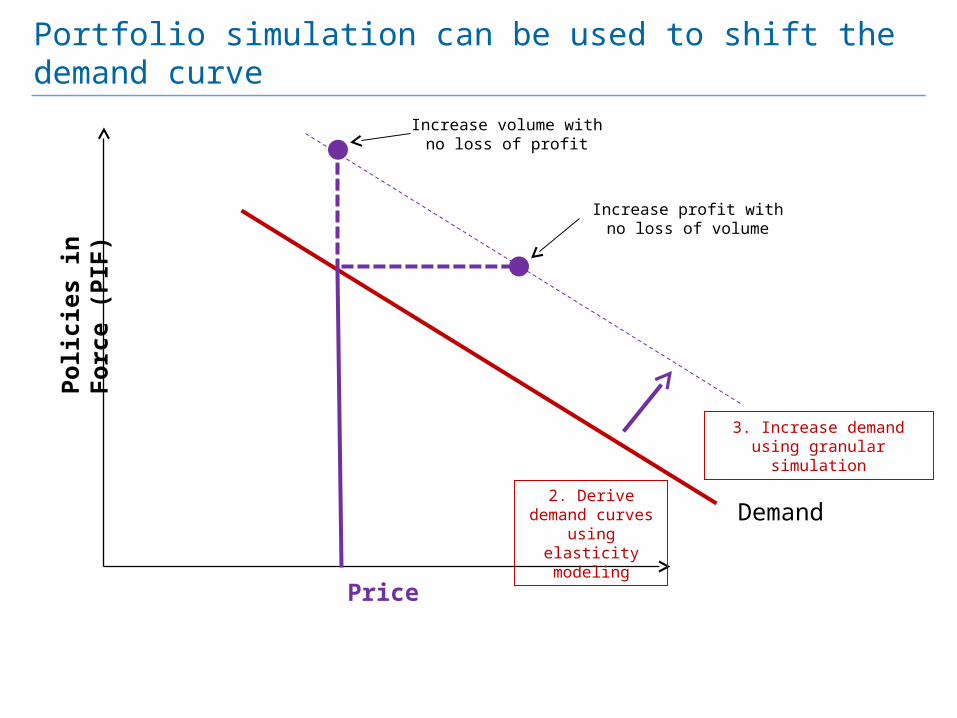
Portfolio simulation can be used to shift the demand curvePo
licie
s in
For
ce (P
IF)
Demand
B: Elasticity 0.5
A: Elasticity 2.0
$90
2000
1000
(100,2000)
(98.84,2150)
$110
Portfolio simulation can be used to shift the demand curvePo
licie
s in
For
ce (P
IF)
Price
2. Derive demand curves using
elasticity modeling
3. Increase demand using granular simulation
Demand
Increase volume with no loss of profit
Increase profit with no loss of volume
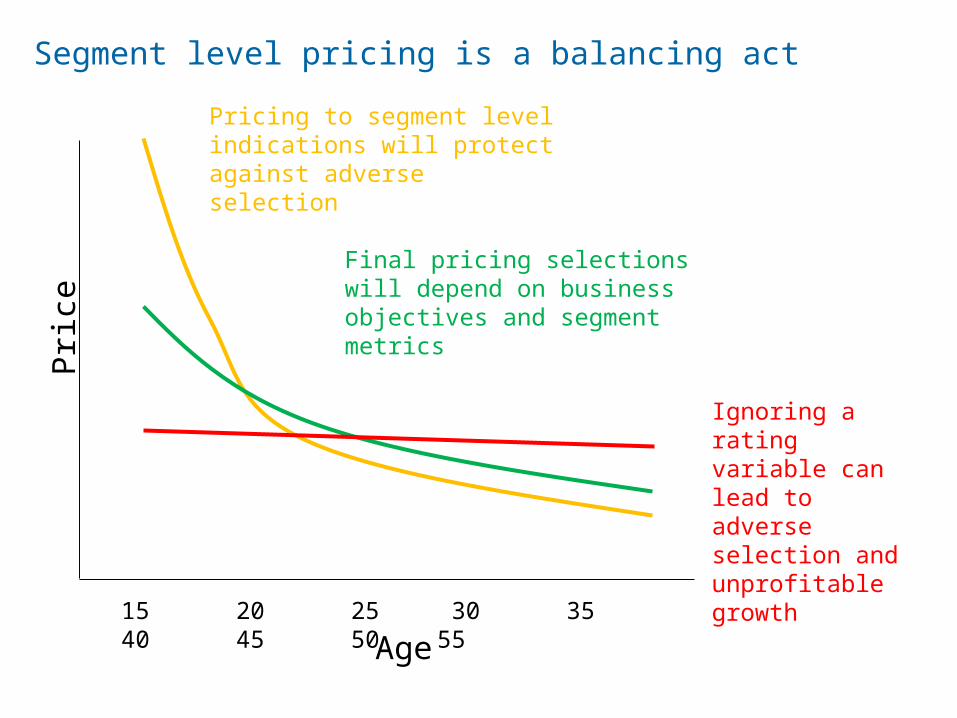
Segment level pricing is a balancing act
Age
Pric
e
15 20 25 30 35 40 45 50 55
Ignoring a rating variable can lead to adverse selection and unprofitable growth
Pricing to segment level indications will protect against adverse selection
Final pricing selections will depend on business objectives and segment metrics
Regression modeling capabilities Approach to avoid/handle “negative elasticities” Methods to incorporate customer transitions: deterministic,
simple stochastic, and major changes Simulation using integration of all relevant metrics Optimization:
Objective functions Constraint specification Policy versus segment level prices
End-user interface for business decisions Rate change specification: percents and/or rating tables Marketing/Sales/UW applications (e.g., quote volumes)
Modern pricing platforms