Embed Size (px)
Citation preview
March 11, 2015
Tom Kolde, FCAS, MAAAKathryn Walker, FCAS, MAAA, CPCU
Survey of External Data Possibilities for Commercial Insurance
2015 CAS Ratemaking and Product Management Seminar
1
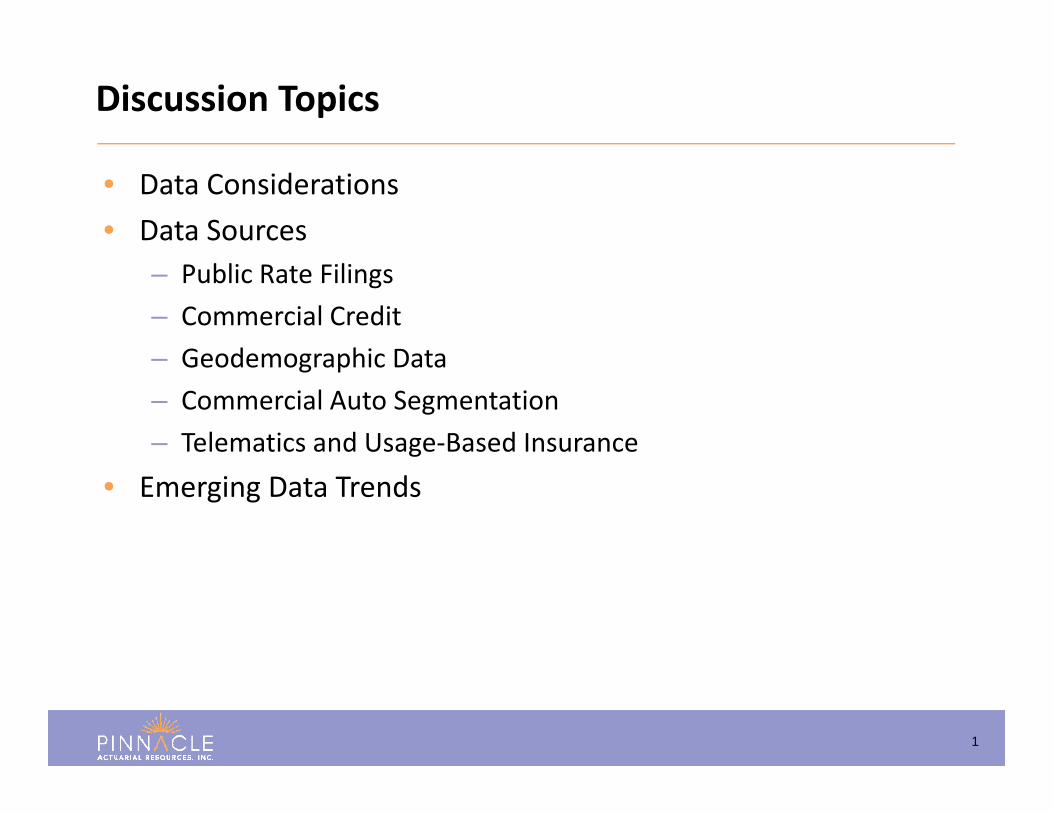
• Data Considerations• Data Sources
– Public Rate Filings– Commercial Credit– Geodemographic Data– Commercial Auto Segmentation– Telematics and Usage‐Based Insurance
• Emerging Data Trends
Discussion Topics
Data Considerations
3
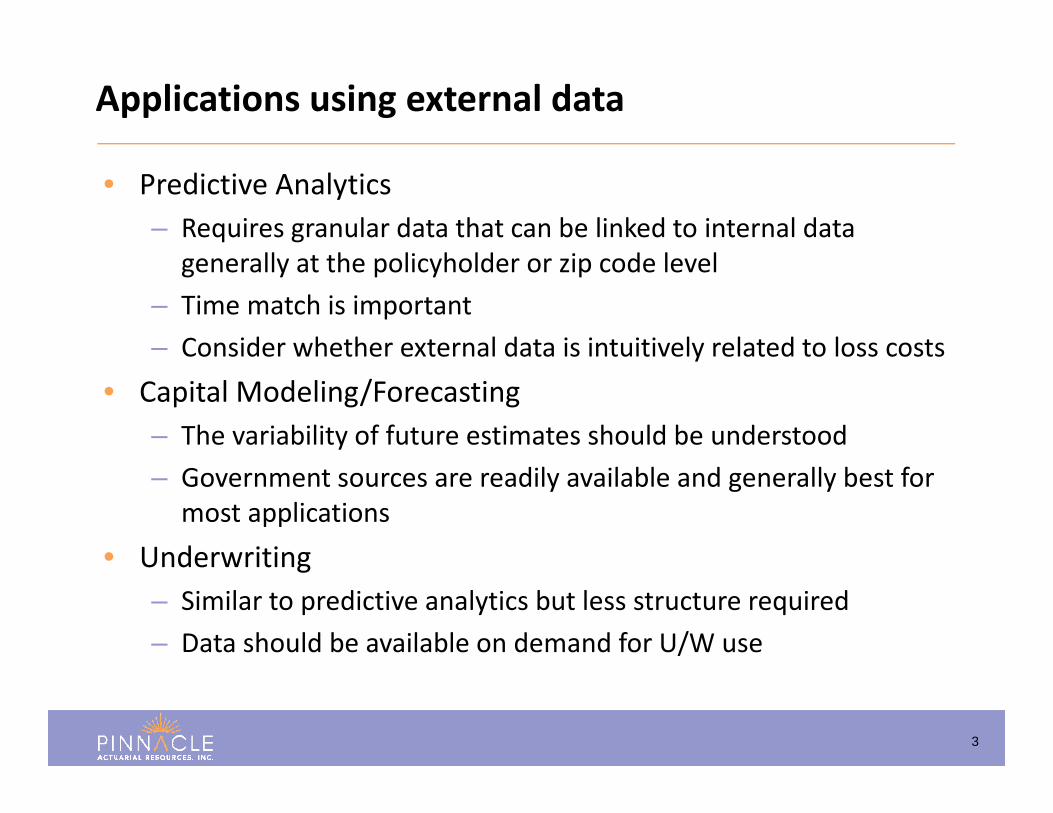
• Predictive Analytics– Requires granular data that can be linked to internal data
generally at the policyholder or zip code level– Time match is important– Consider whether external data is intuitively related to loss costs
• Capital Modeling/Forecasting– The variability of future estimates should be understood– Government sources are readily available and generally best for
most applications• Underwriting
– Similar to predictive analytics but less structure required– Data should be available on demand for U/W use
Applications using external data
4
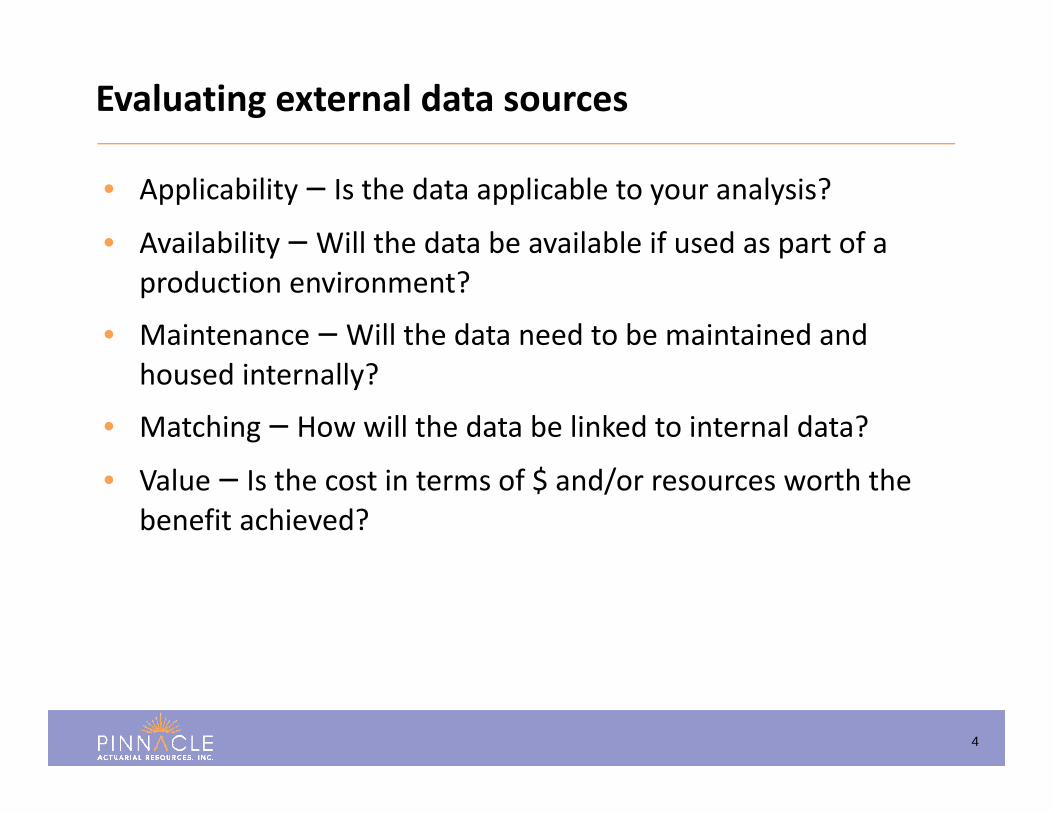
• Applicability – Is the data applicable to your analysis?
• Availability – Will the data be available if used as part of a production environment?
• Maintenance – Will the data need to be maintained and housed internally?
• Matching – How will the data be linked to internal data?
• Value – Is the cost in terms of $ and/or resources worth the benefit achieved?
Evaluating external data sources
Data Sources
6
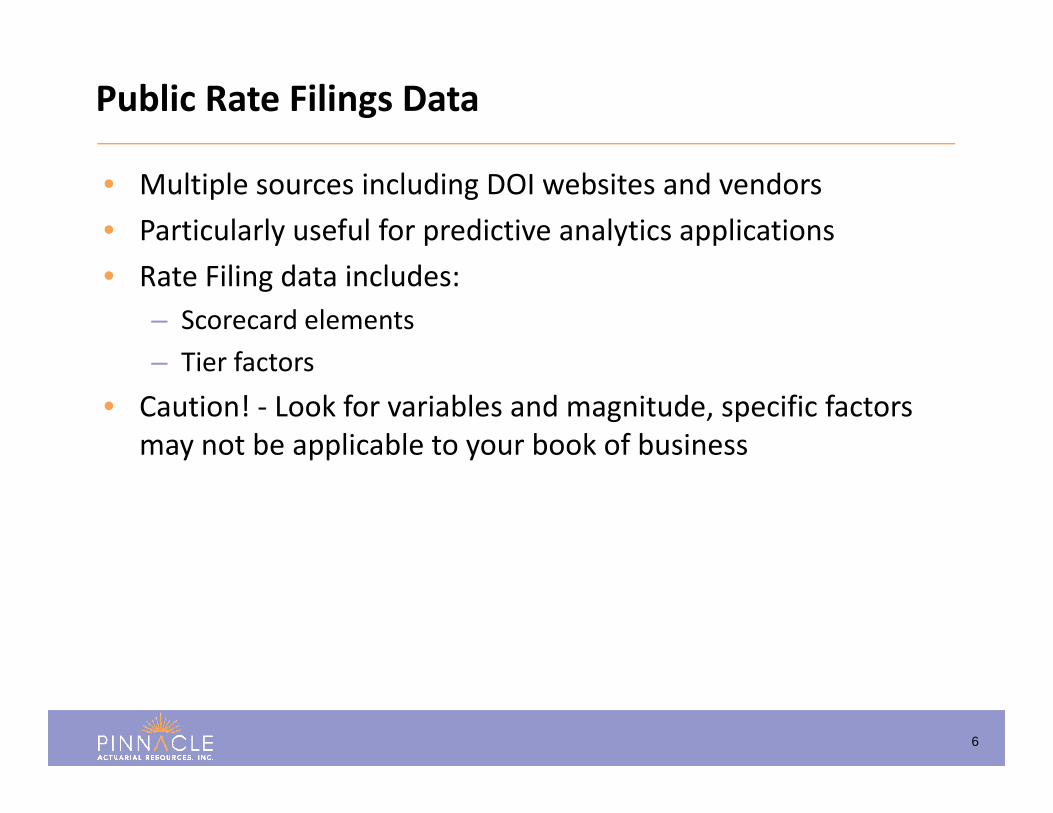
• Multiple sources including DOI websites and vendors• Particularly useful for predictive analytics applications• Rate Filing data includes:
– Scorecard elements– Tier factors
• Caution! ‐ Look for variables and magnitude, specific factors may not be applicable to your book of business
Public Rate Filings Data
7
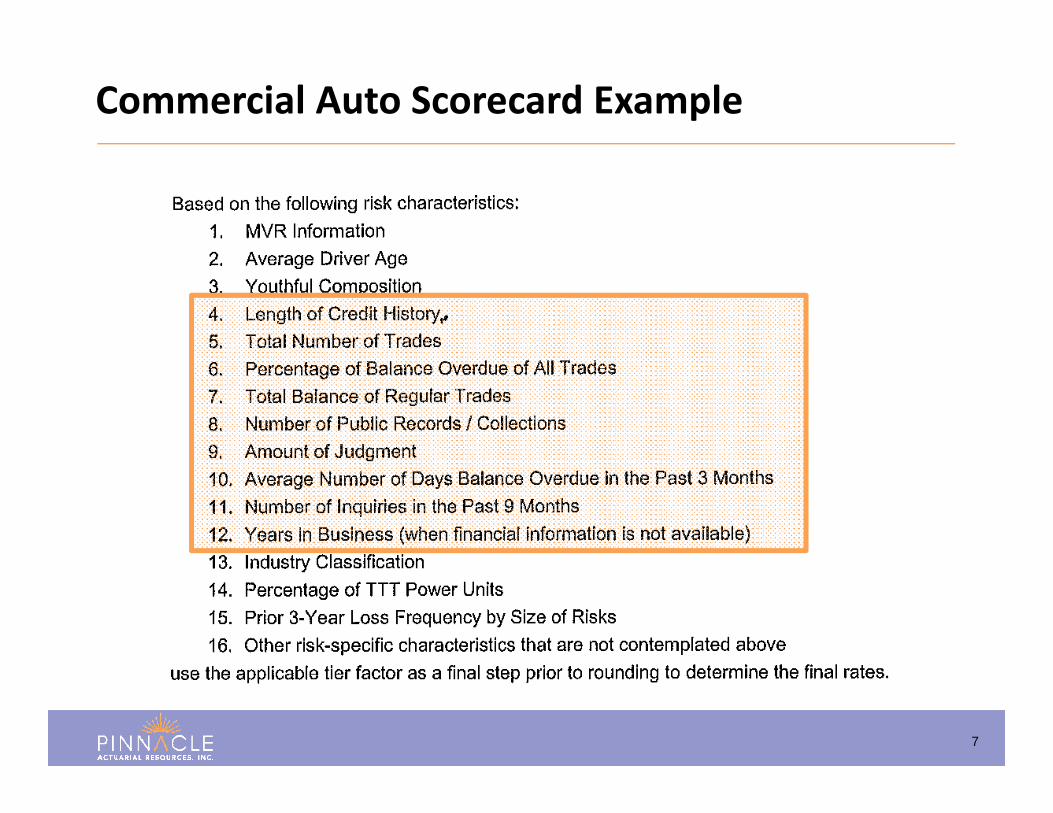
Commercial Auto Scorecard Example
8
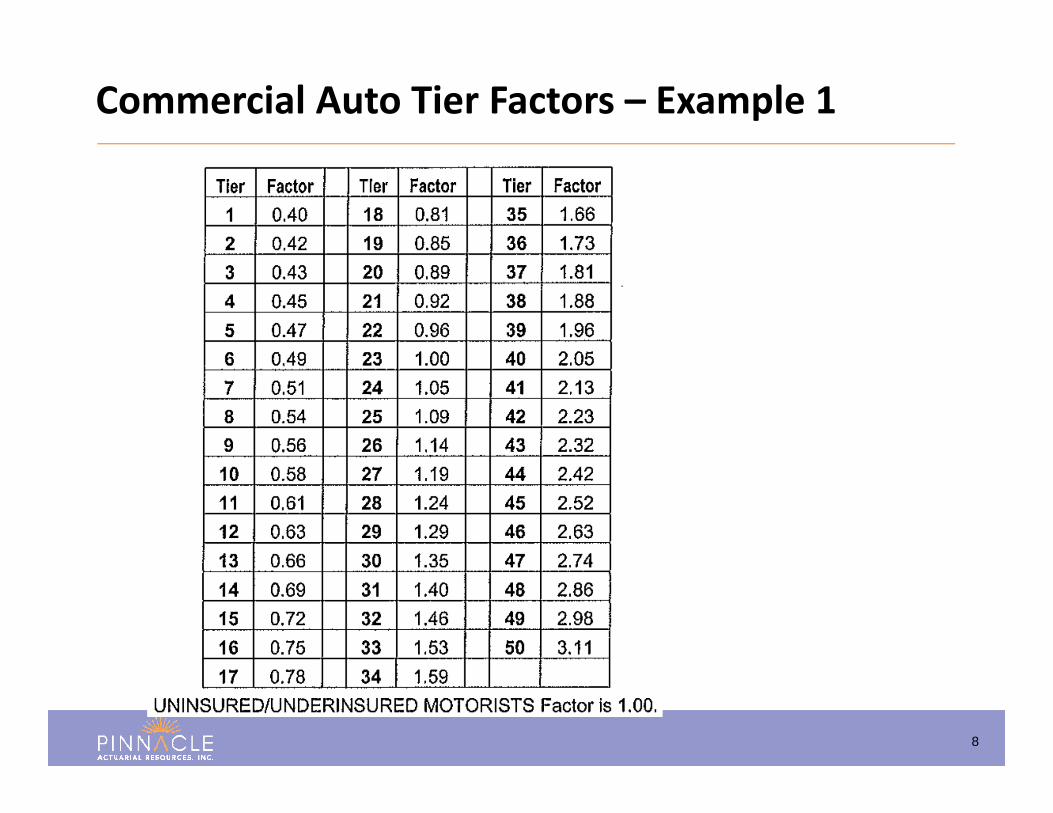
Commercial Auto Tier Factors – Example 1
9
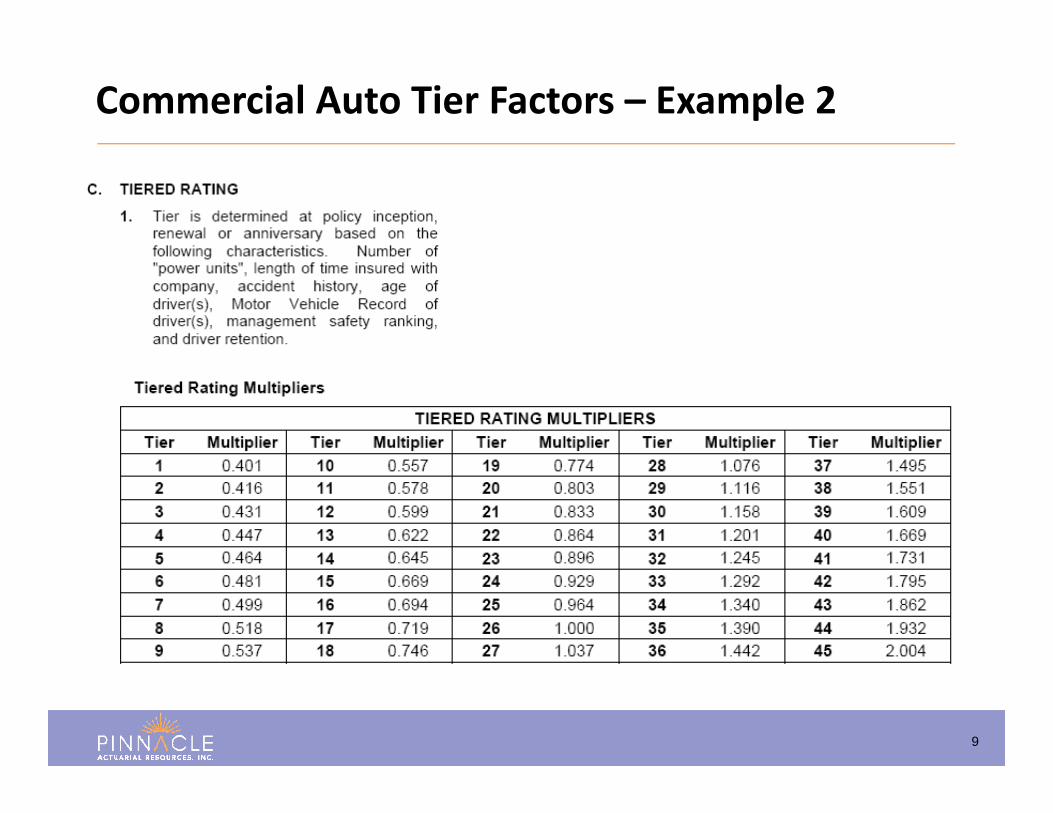
Commercial Auto Tier Factors – Example 2
10
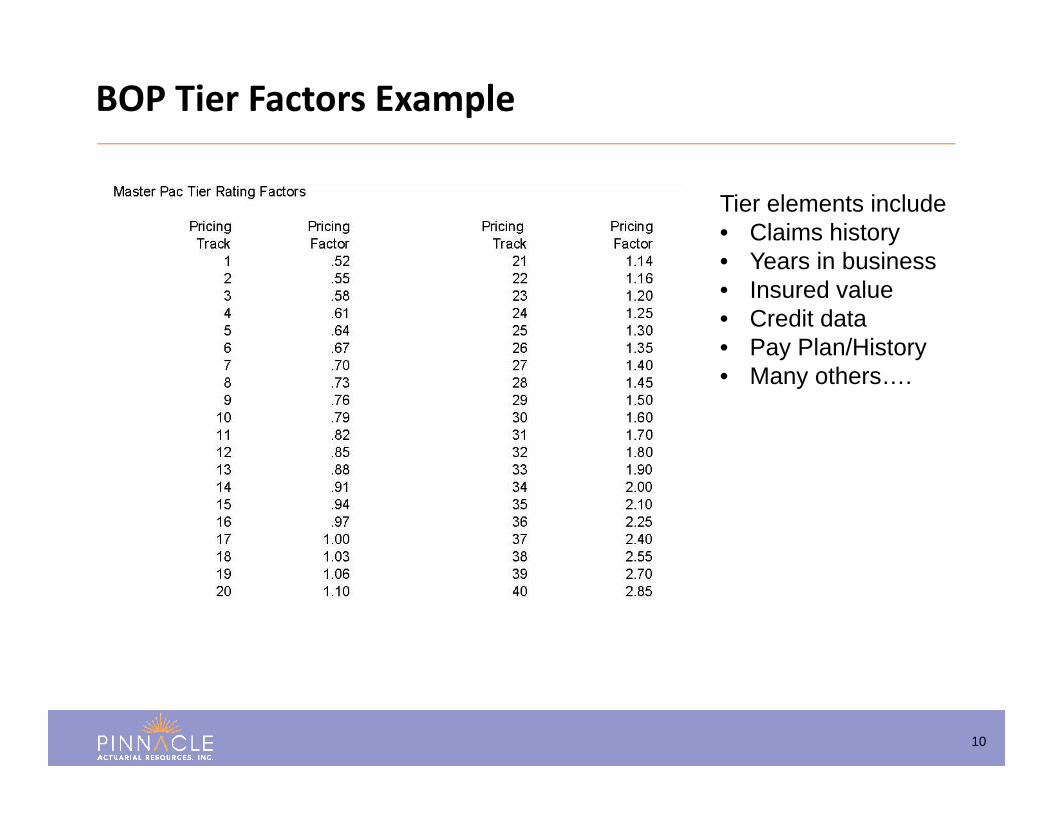
BOP Tier Factors Example
Tier elements include• Claims history• Years in business• Insured value• Credit data• Pay Plan/History• Many others….
11
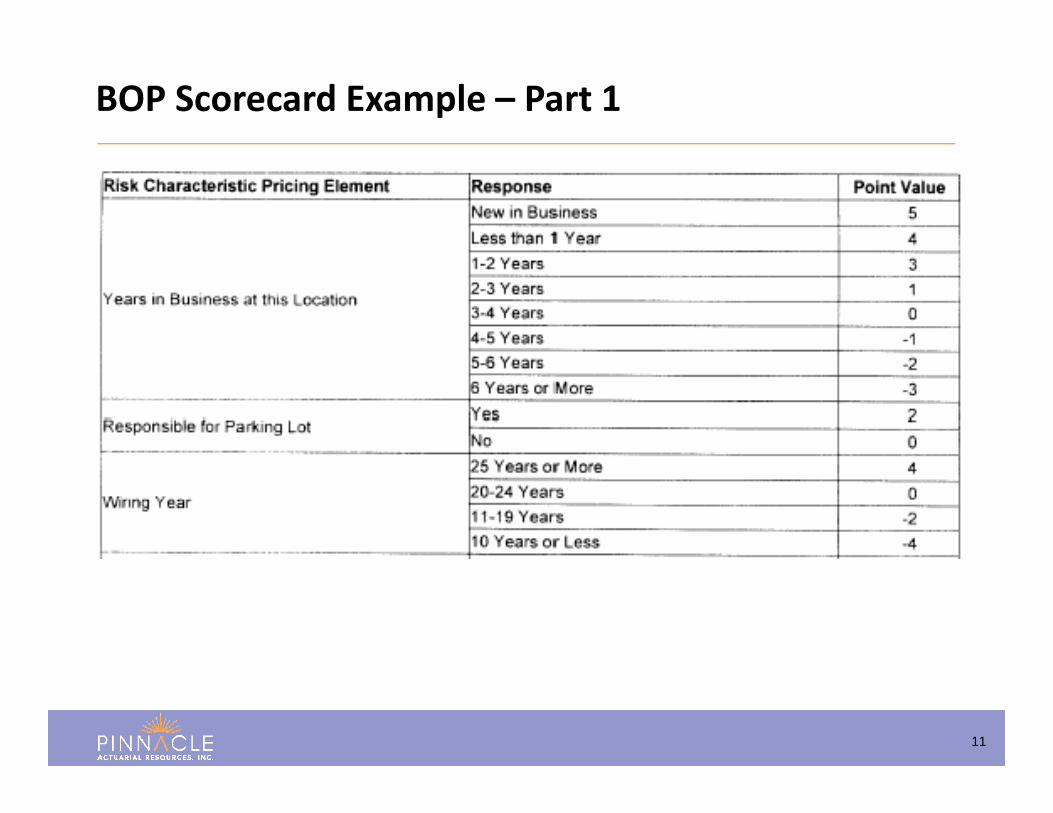
BOP Scorecard Example – Part 1
12
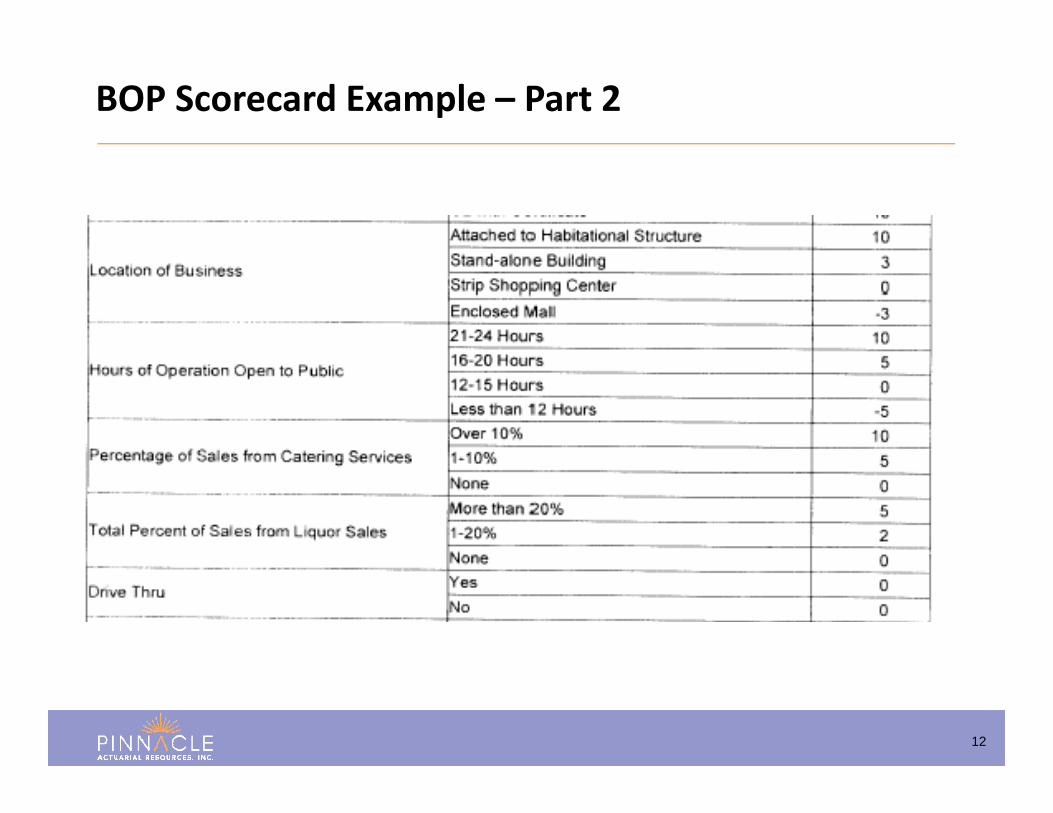
BOP Scorecard Example – Part 2
13
• Applicability – Rate filings can provide perspective on variables used and magnitude of score factors
• Availability – When viewed as a tool for guidance, competitor rate filings can be reliable.
• Maintenance – Regular maintenance and monitoring of competitor filings is required to keep up with revisions
• Matching – Look for scorecards and competitors that align with your book of business
• Value – Dollar cost is relatively low but filing research can be labor intensive.
Public Rate Filings Considerations
14
• Two main vendors: – Experian – Dun and Bradstreet
• Data Elements include:– Business summary (year started, number of employees,
industry)– Financial information (sales, assets)– Payment history and trends (aging, late payments)– Public record filings (liens, judgments, UCC filings, bankruptcies)– Proprietary scores (Intelliscore, Paydex)
• Commercial credit assumes that financial strength and credit risk is related to insurance risk
Commercial Credit Data Overview
15
• A large number of highly correlated variables– Number of trades 30–60 DBT and Number of trades 60–90 DBT
• Individual variables may not have an intuitive relationship to loss– Number of UCC filings– Number of trades 30+ DBT
• Data may not be available for small risks• Use commercial credit score or develop specific insurance risk
score?• Lift is less significant relative to internal variables• Commercial credit terminology and relationship between
variables may be unfamiliar
Commercial Credit Data Challenges
16
• Applicability – Financial strength and credit risk are linked to insurance risk
• Availability – Credit vendors provide on‐demand reports and have established track records
• Maintenance – Credit data obtained via individual reports will need to stored and any insurer models updated regularly
• Matching – Generally a match to policyholder and time period can be made under certain assumptions. Small risks may not have a credit report on file
• Value – Commercial credit shows less lift than internal variables but still significant. Also is typically already used as part of the underwriting process therefore justifying the costs of the report
Commercial Credit Data Considerations
17
• Public Sources:– US Census Bureau– Bureau of Labor Statistics (detail at both national and state level)
• Data elements include:– Population summaries by age, sex, household size, education– Housing information regarding size, value, owner/renter and
vacancies– Income summaries and distributions– Consumer expenditures– Workplace injury statistics– Economic indicators such as unemployment and productivity
• Can be viewed as an enhancement to territories
Geodemographic Data Overview

18
• A large number of highly correlated variables– Median Age and Median Income
• Individual variables may not have an intuitive relationship to loss– Proportion of public transportation users– Proportion of vacant housing units– Proportion of households with no cars
• Publically available data can be difficult to work with– Data structure needs to be understood– Many vendors sell compiled data
• Lift is tepid relative to other variables
Geodemographic Data Challenges
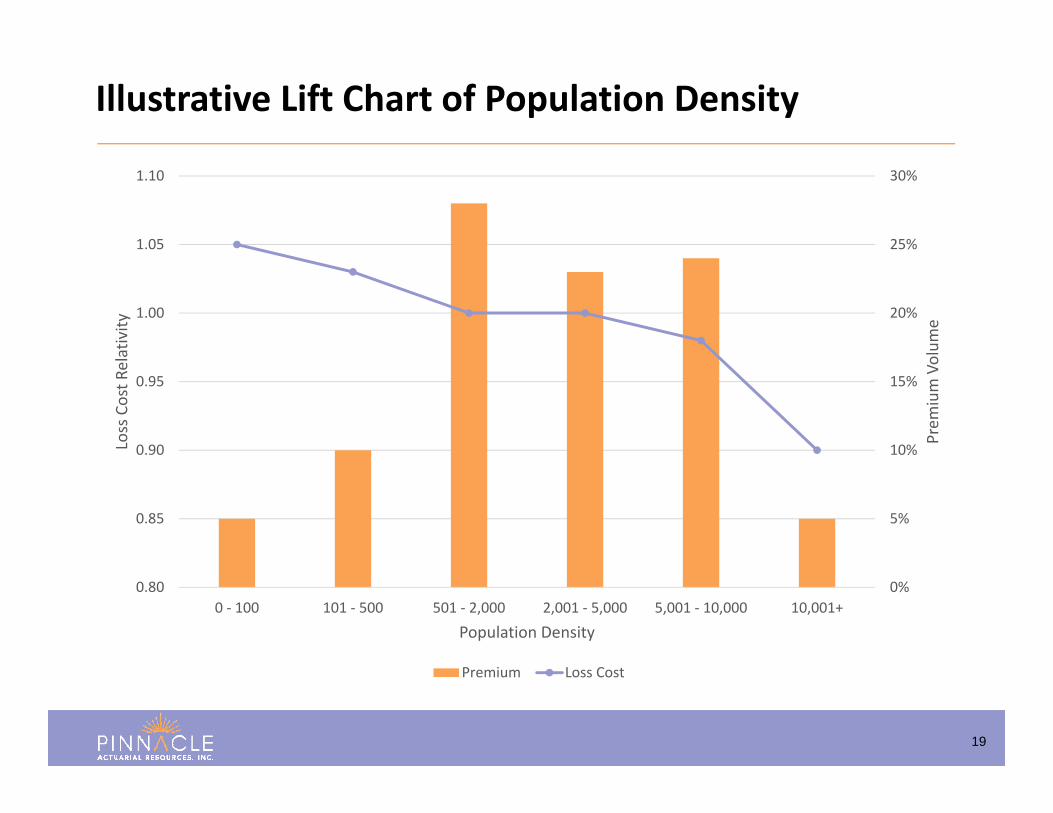
19
0%
5%
10%
15%
20%
25%
30%
0.80
0.85
0.90
0.95
1.00
1.05
1.10
0 ‐ 100 101 ‐ 500 501 ‐ 2,000 2,001 ‐ 5,000 5,001 ‐ 10,000 10,001+
Prem
ium Volum
e
Loss Cost R
elativity
Population Density
Premium Loss Cost
Illustrative Lift Chart of Population Density
20
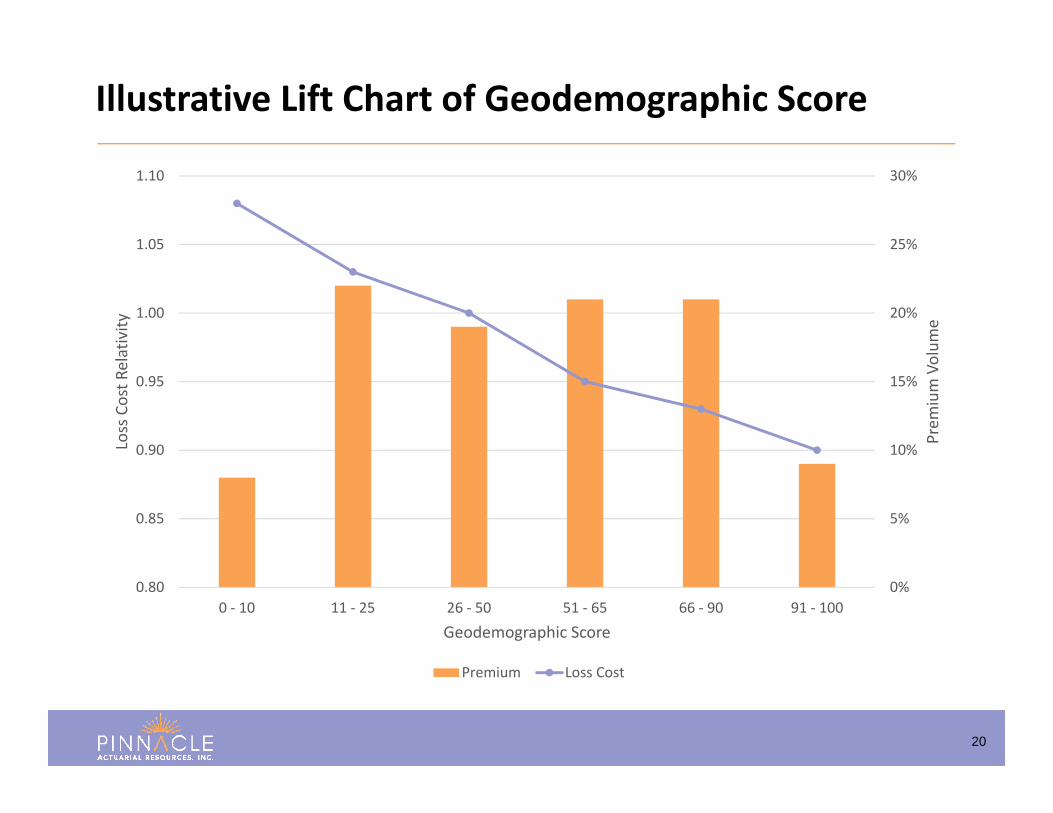
0%
5%
10%
15%
20%
25%
30%
0.80
0.85
0.90
0.95
1.00
1.05
1.10
0 ‐ 10 11 ‐ 25 26 ‐ 50 51 ‐ 65 66 ‐ 90 91 ‐ 100
Prem
ium Volum
e
Loss Cost R
elativity
Geodemographic Score
Premium Loss Cost
Illustrative Lift Chart of Geodemographic Score
21
• Applicability – Can be thought of as an enhancement (or introduction) to territory factors
• Availability – Data will need to stored within internal systems
• Maintenance – Changing demographics means that the data will need to be updated regularly
• Matching – Generally a match to zip code and time period can be made
• Value – While lift is generally tepid, cost is relatively low making geodemographic variables attractive as an external data source
Geodemographic Data Considerations
22
• VIN Decoding– Well established process– New products related to trailers, equipment modifications, etc.
• MVRs– Several vendors– Key question – Ordering Protocols – Who? How often?
• Prior Claims– Commercial C.L.U.E. gaining traction
Commercial Auto Segmentation Data
23
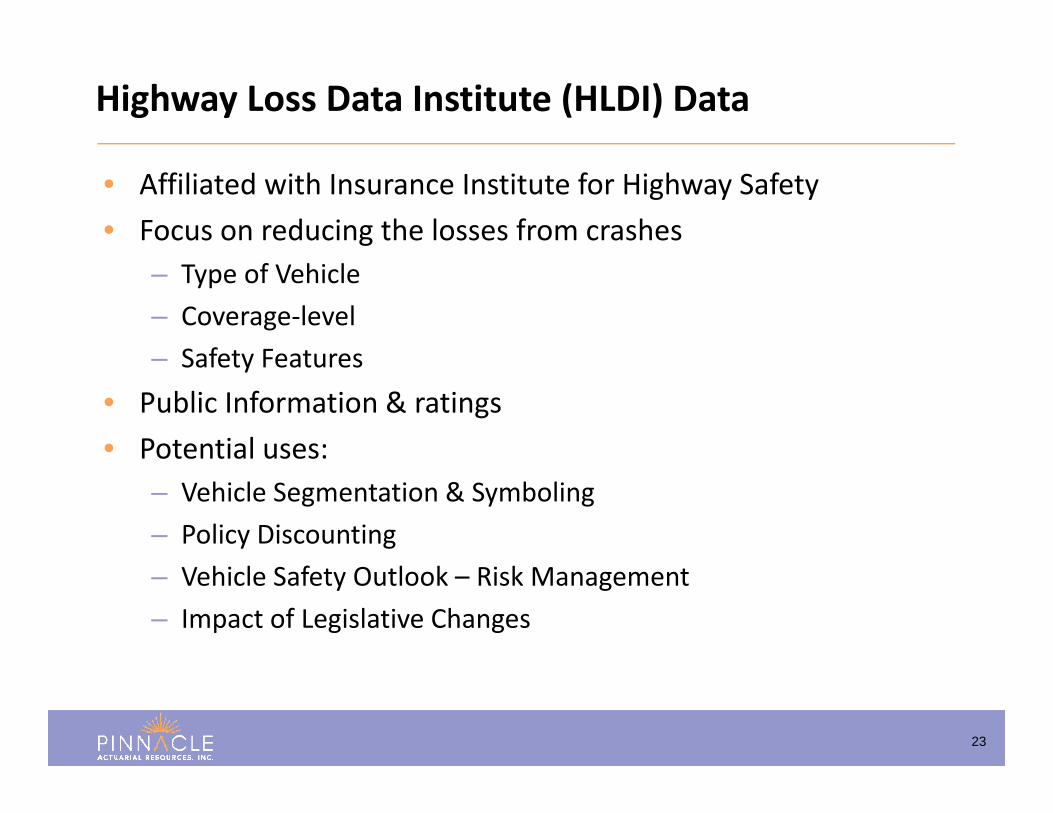
• Affiliated with Insurance Institute for Highway Safety• Focus on reducing the losses from crashes
– Type of Vehicle– Coverage‐level– Safety Features
• Public Information & ratings• Potential uses:
– Vehicle Segmentation & Symboling– Policy Discounting– Vehicle Safety Outlook – Risk Management– Impact of Legislative Changes
Highway Loss Data Institute (HLDI) Data
24
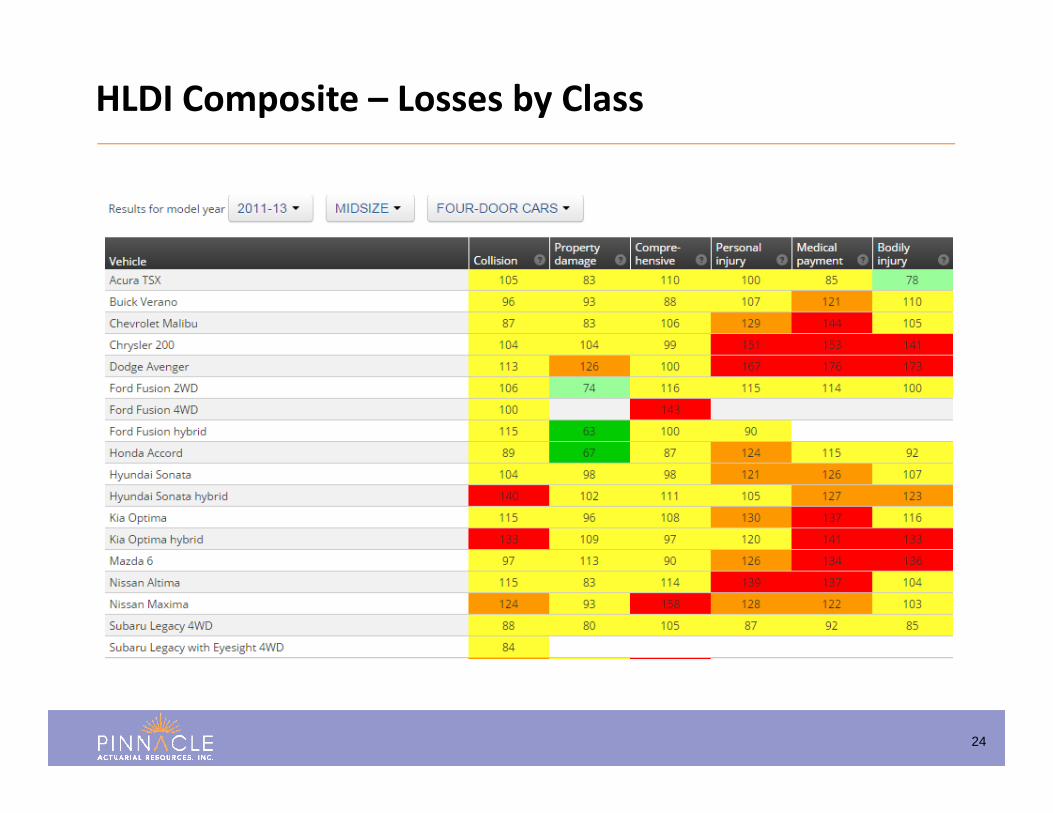
HLDI Composite – Losses by Class
25
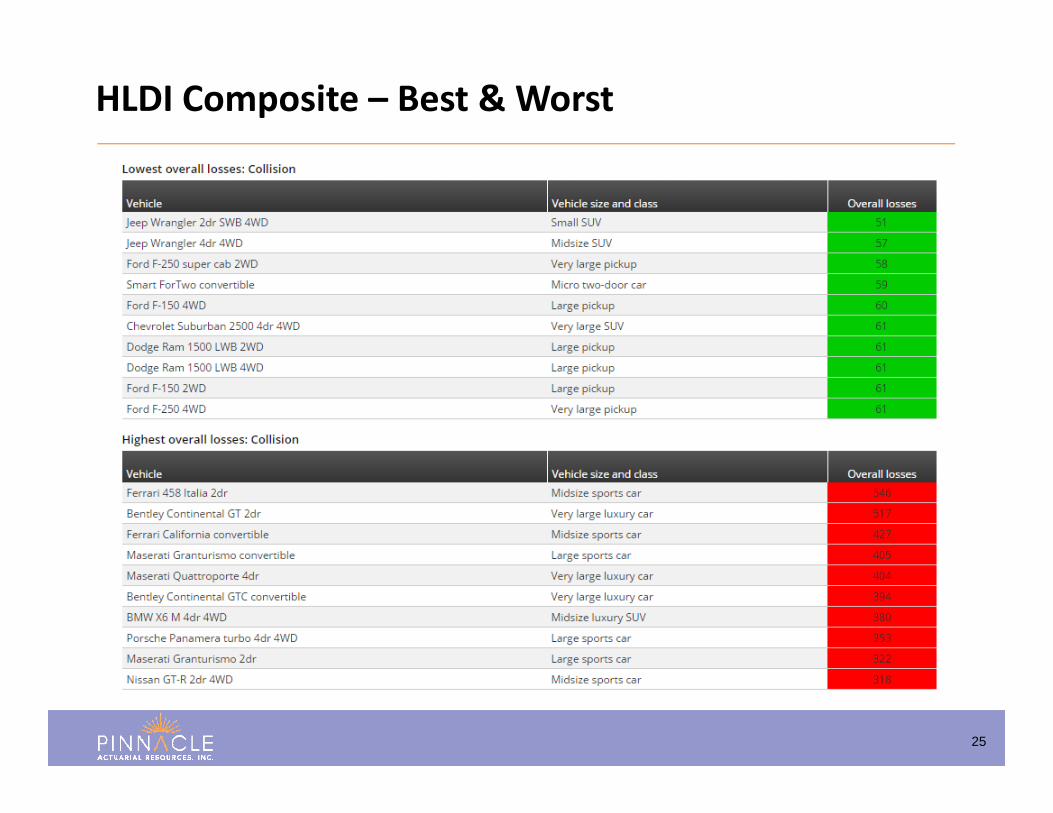
HLDI Composite – Best & Worst
26
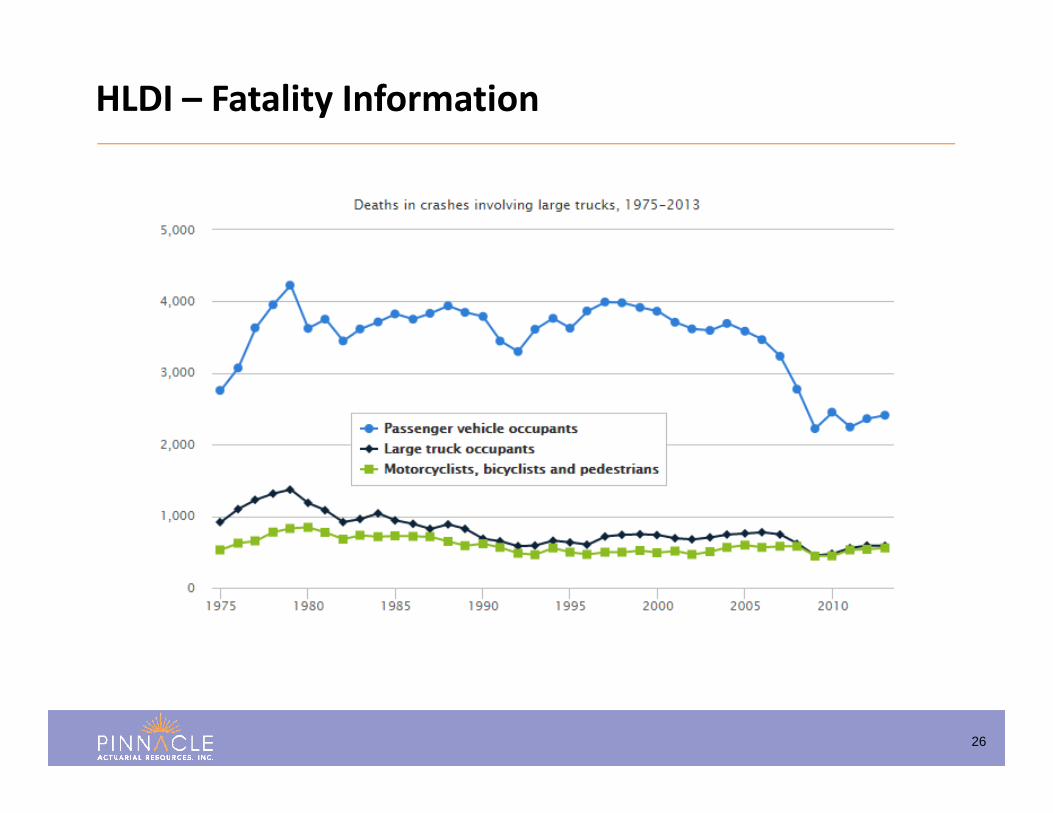
HLDI – Fatality Information
27
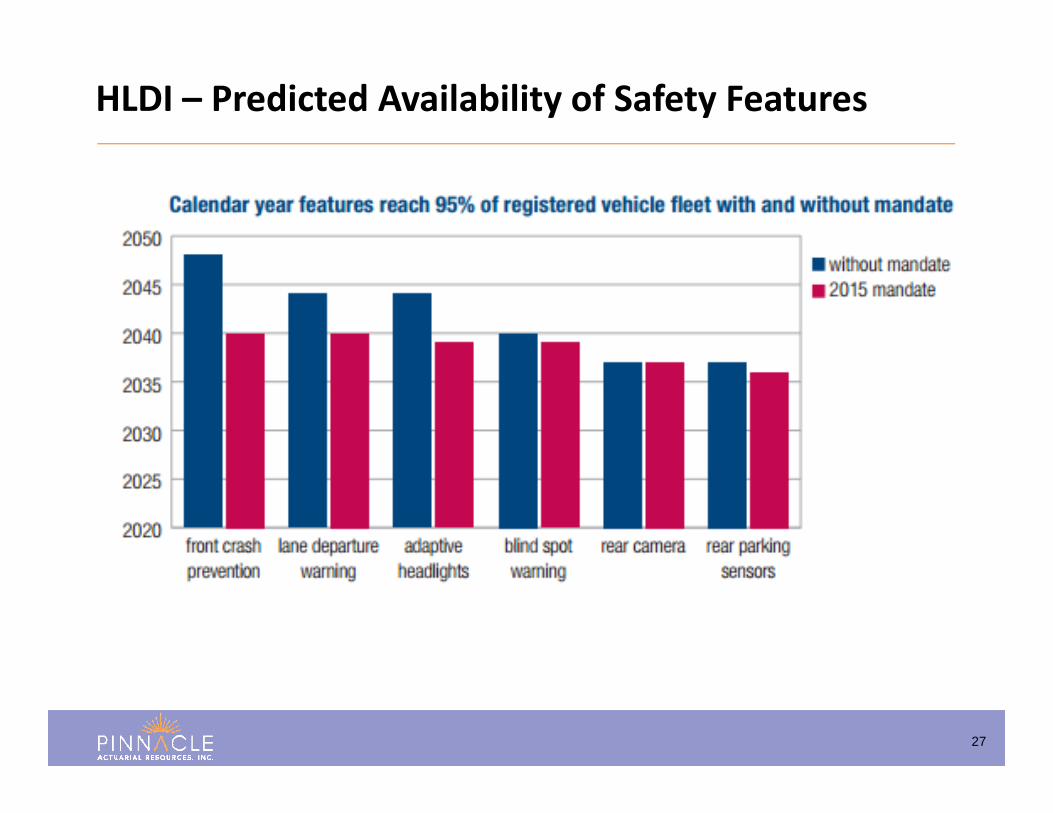
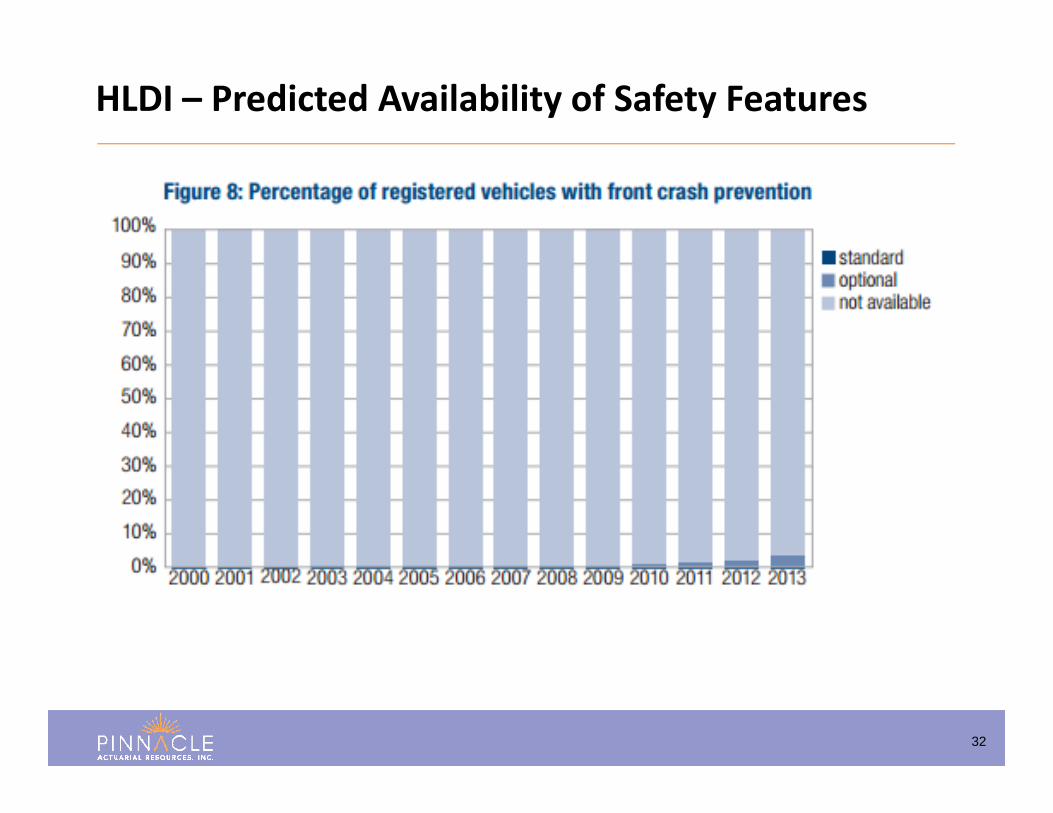
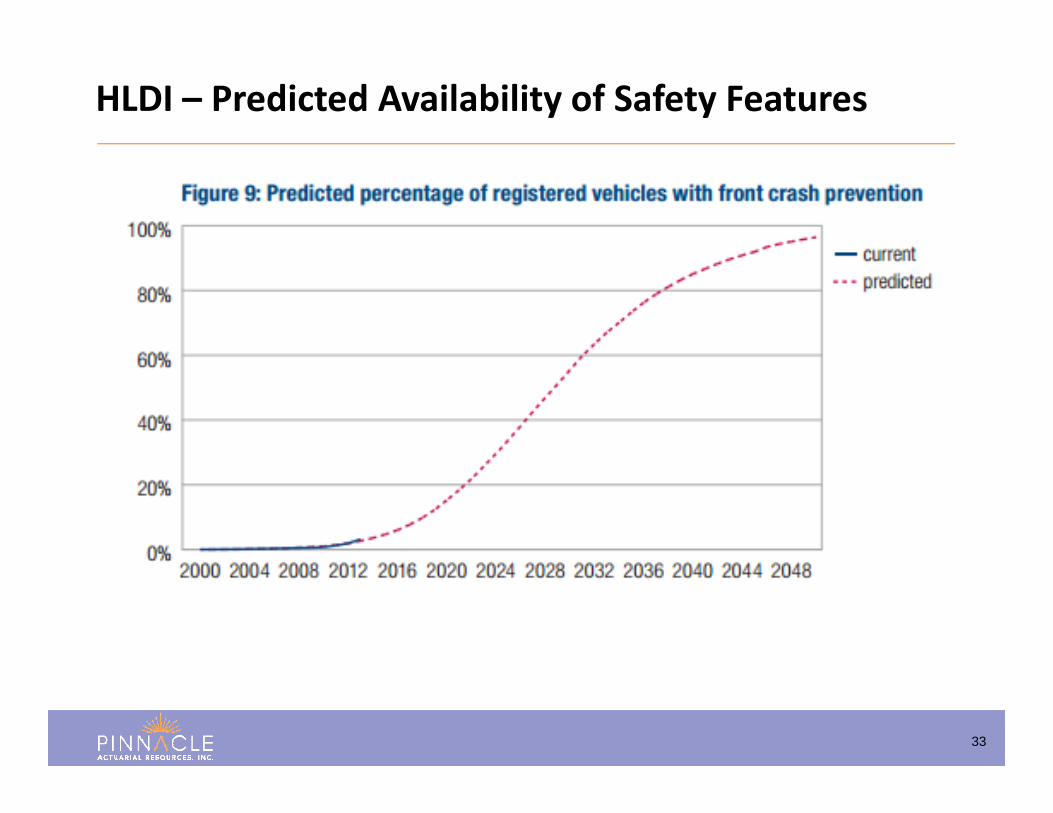
HLDI – Predicted Availability of Safety Features

28
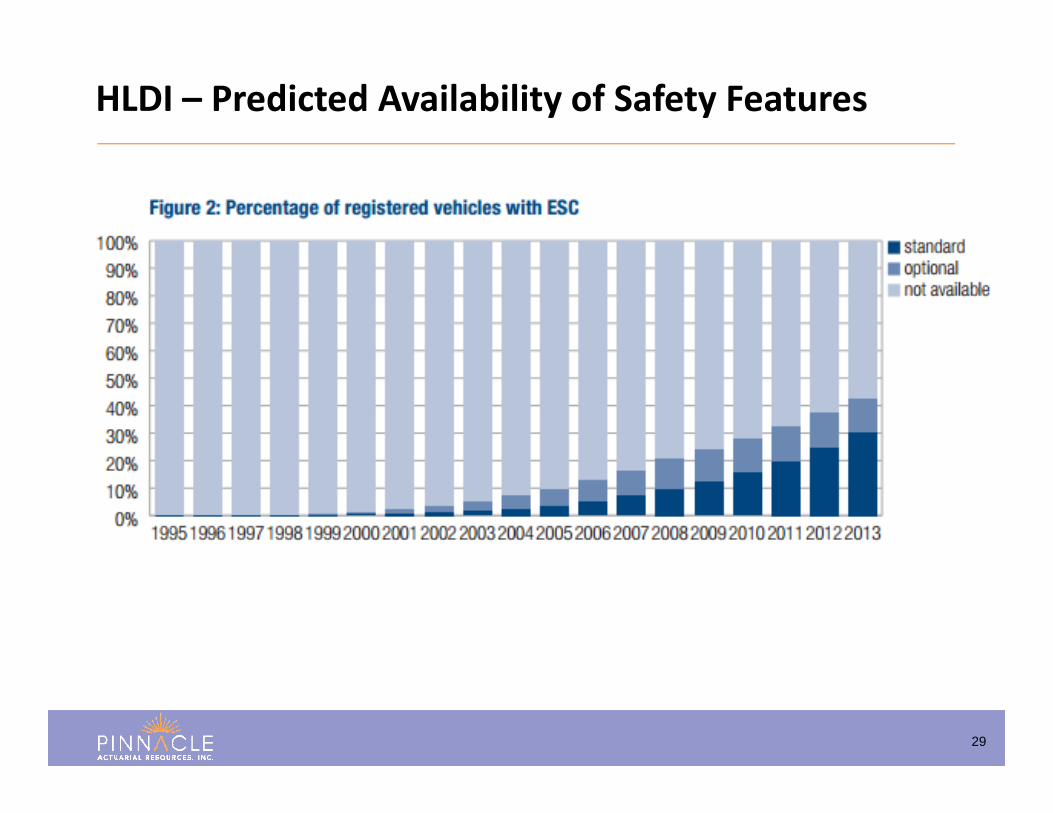
HLDI – Predicted Availability of Safety Features
29
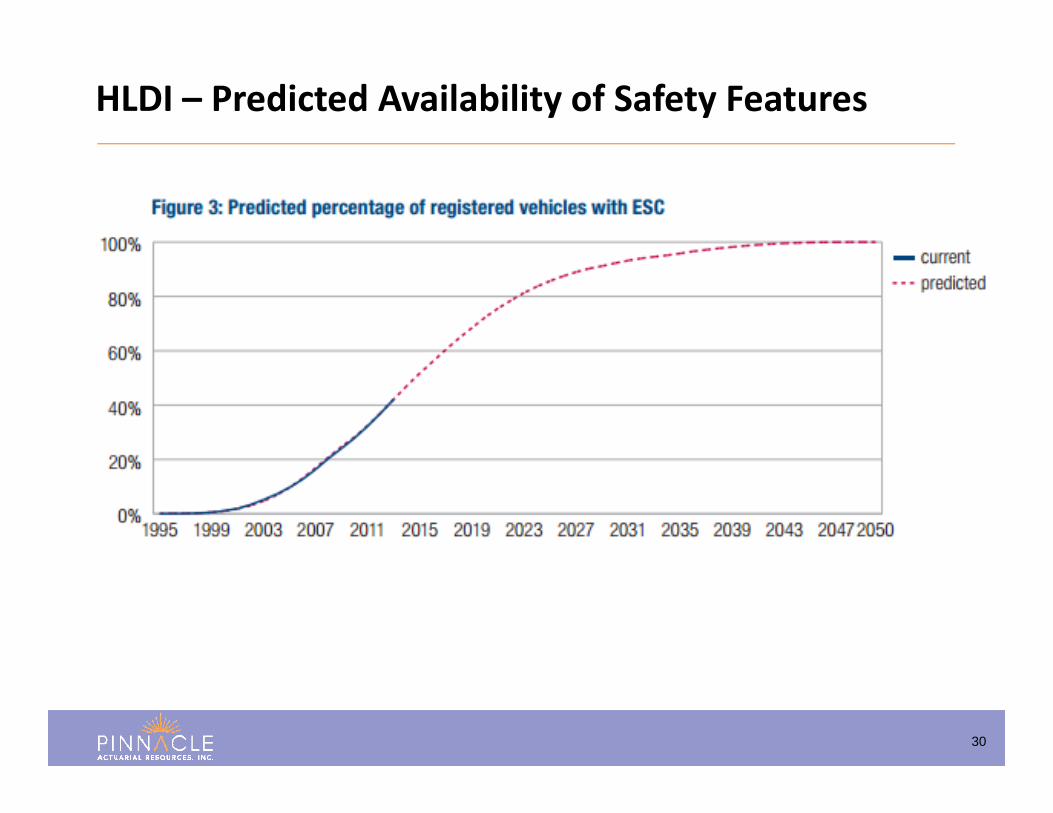
HLDI – Predicted Availability of Safety Features
30
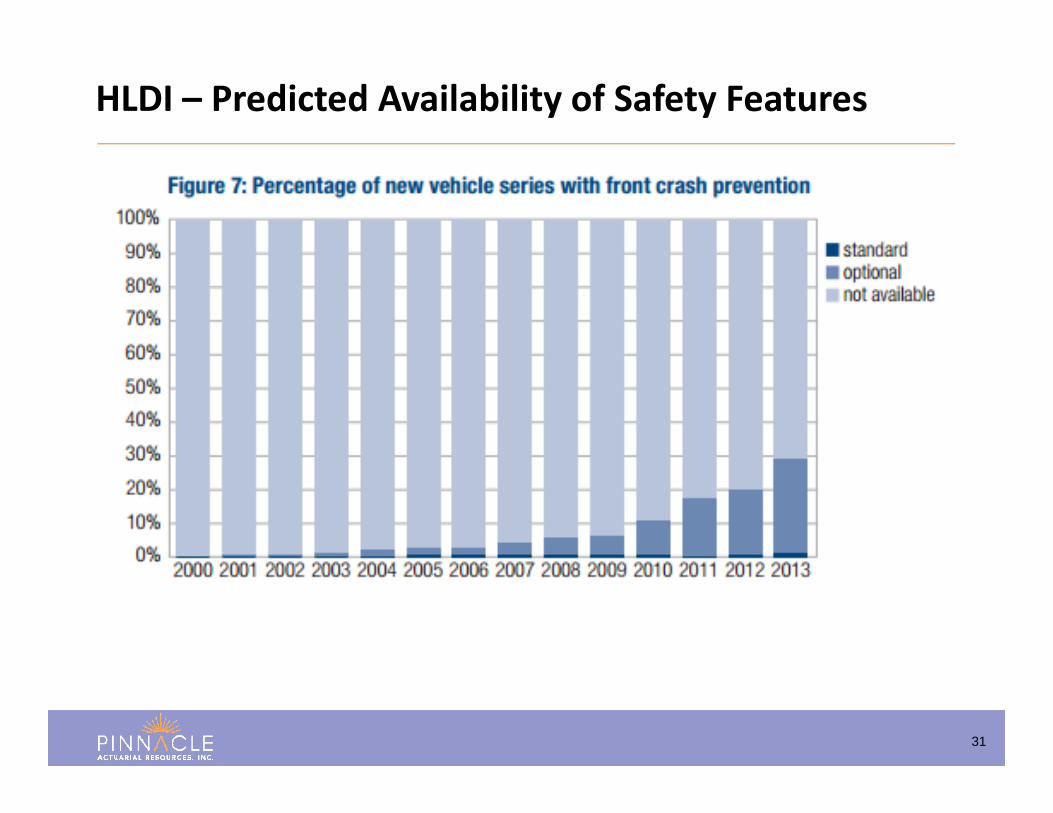
HLDI – Predicted Availability of Safety Features
31
HLDI – Predicted Availability of Safety Features
32
HLDI – Predicted Availability of Safety Features
33
HLDI – Predicted Availability of Safety Features

34
• Sponsored by Federal Motor Carrier Safety Administration• Replaced prior SAFER program• Scores companies in several categories
– Unsafe Driving (Speeding, reckless, lane changes)– Fatigued Driving/Hours of Service– Driver Fitness/Training– Controlled Substances/Alcohol– Vehicle Maintenance– Cargo‐Related (Spills, HazMat)– Crash Experience
• Publicly Available
Safety Measurement System (SMS)
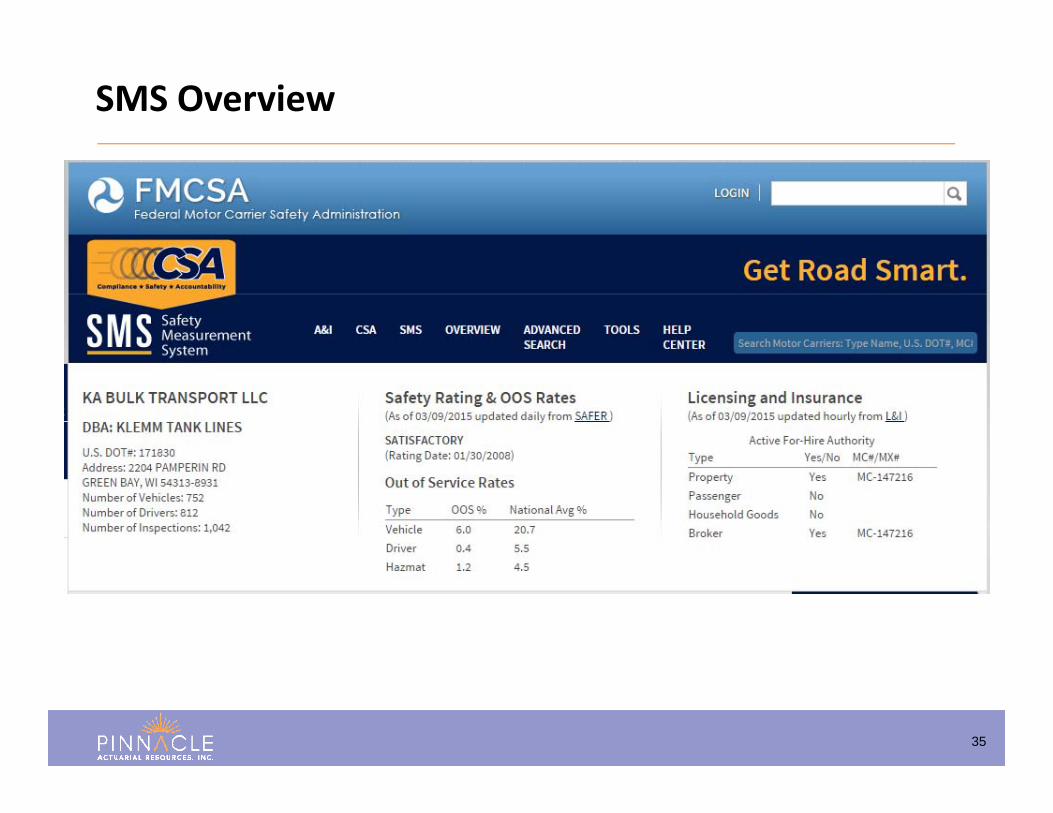
35
SMS Overview
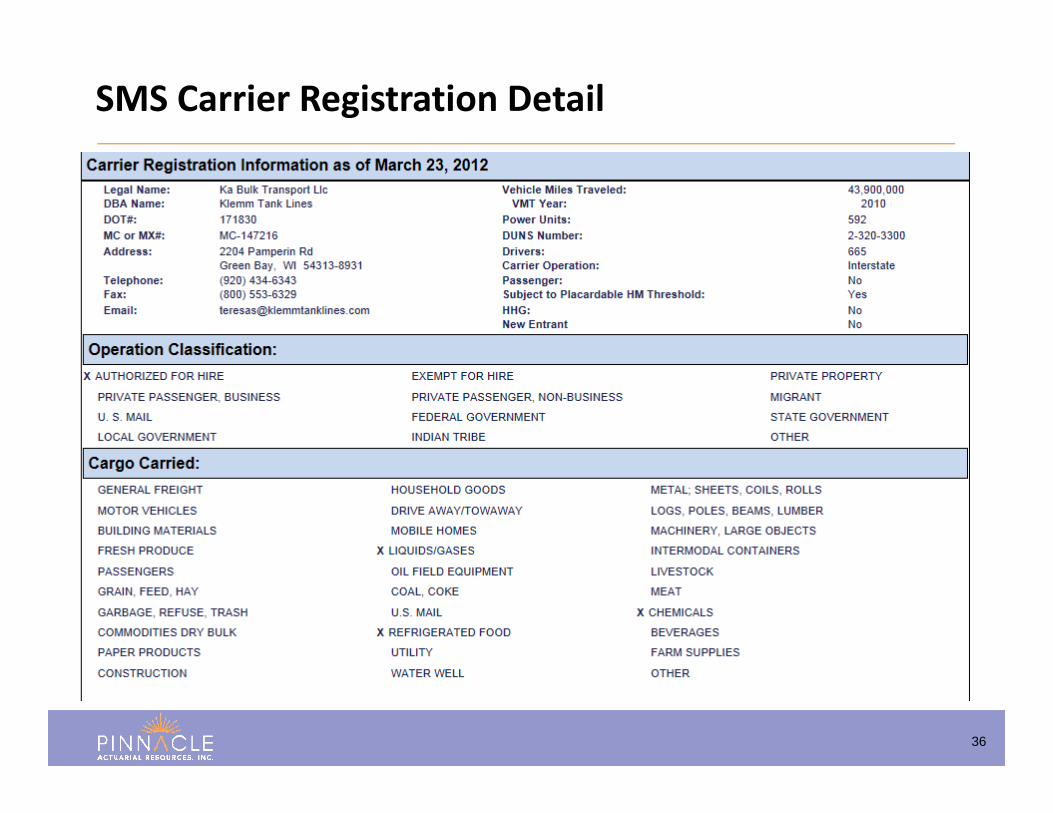
36
SMS Carrier Registration Detail
37
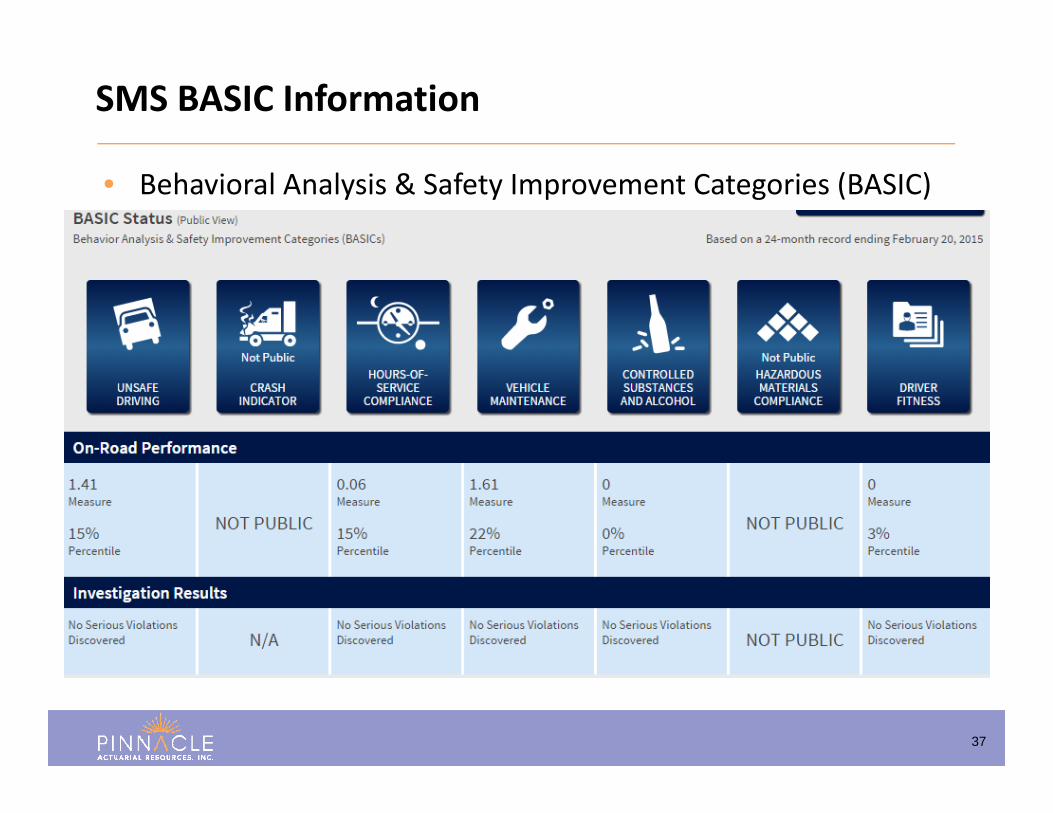
• Behavioral Analysis & Safety Improvement Categories (BASIC)
SMS BASIC Information
38
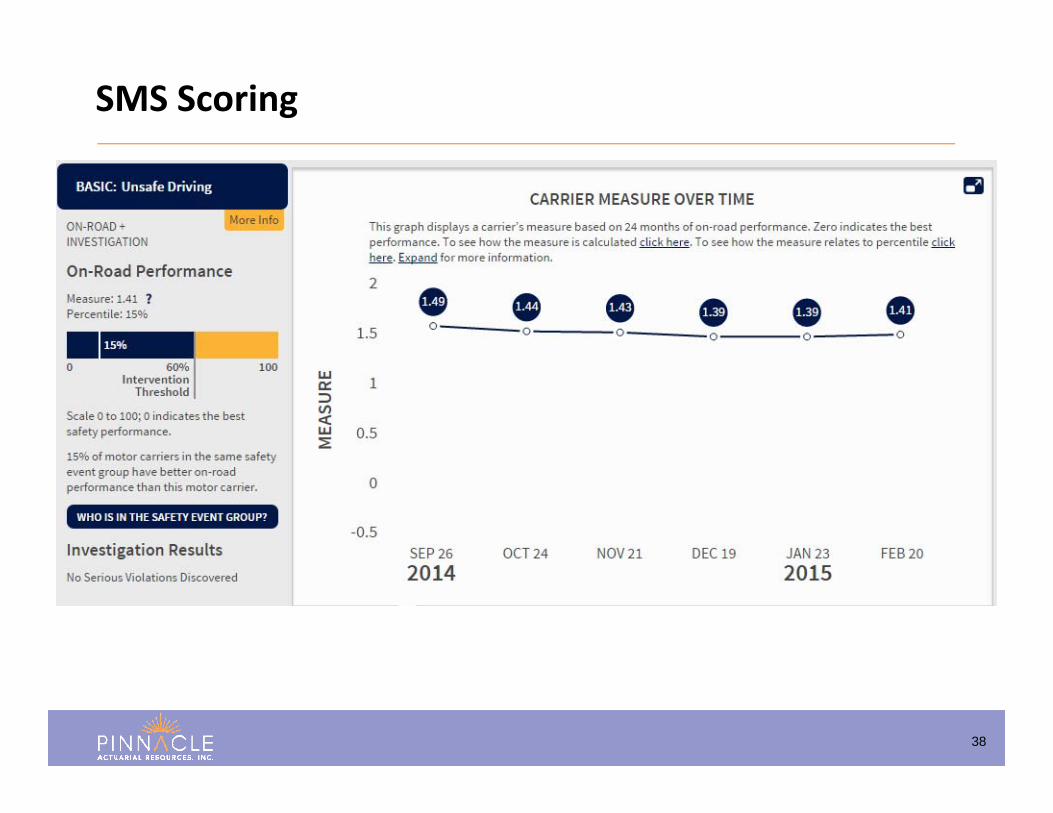
SMS Scoring
39
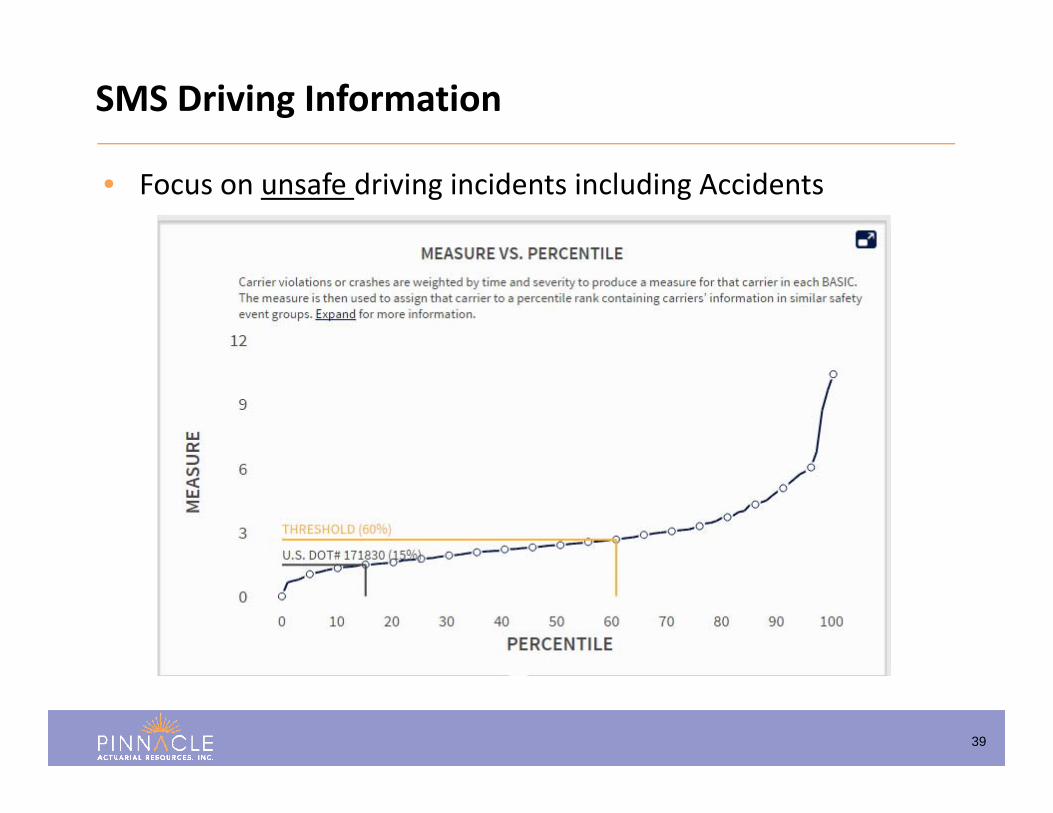
• Focus on unsafe driving incidents including Accidents
SMS Driving Information
40
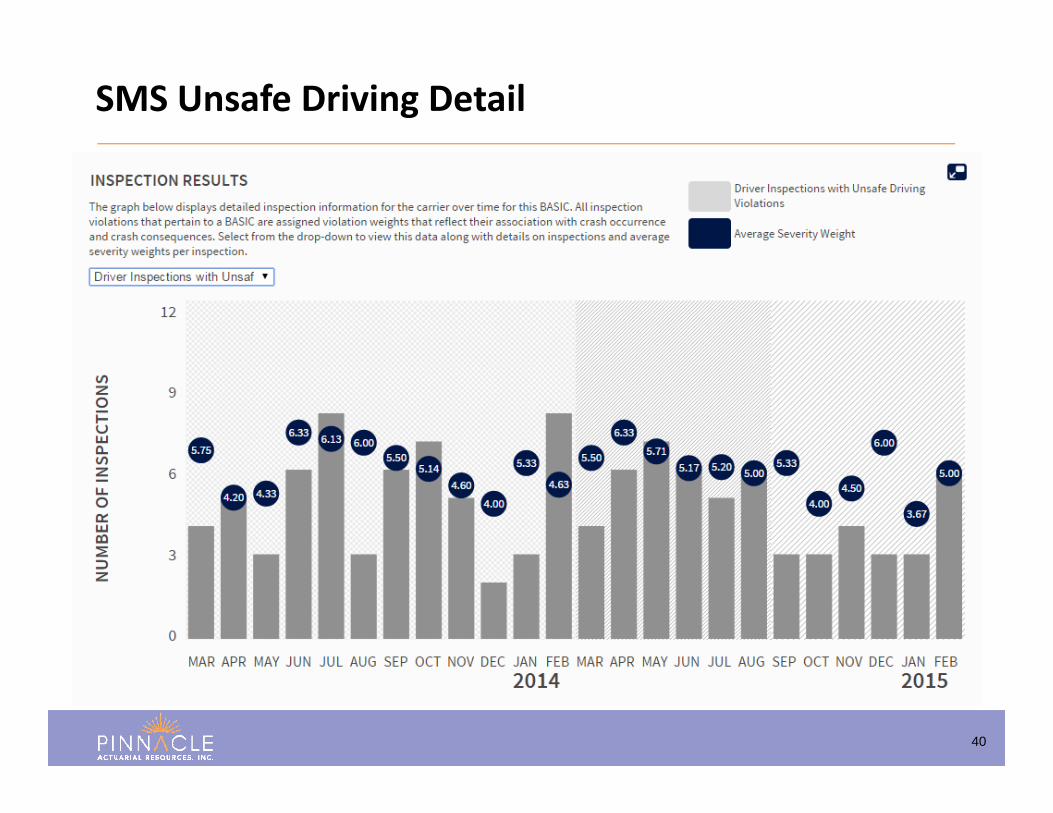
SMS Unsafe Driving Detail
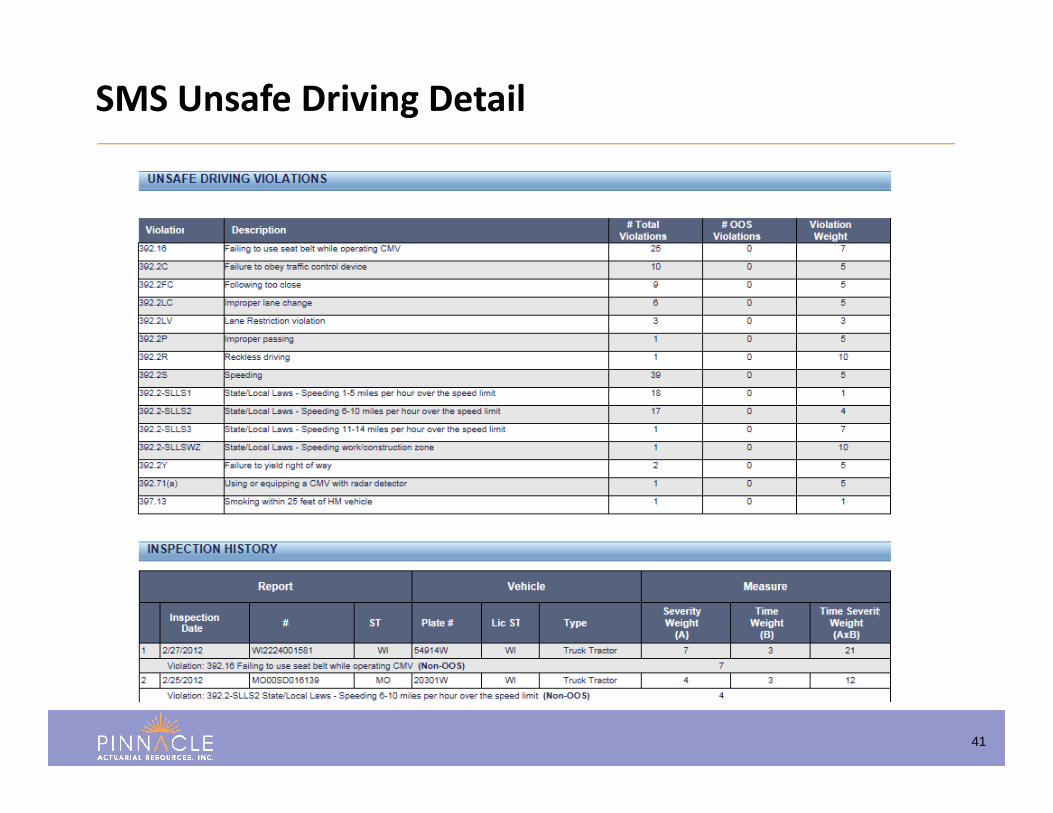
41
SMS Unsafe Driving Detail
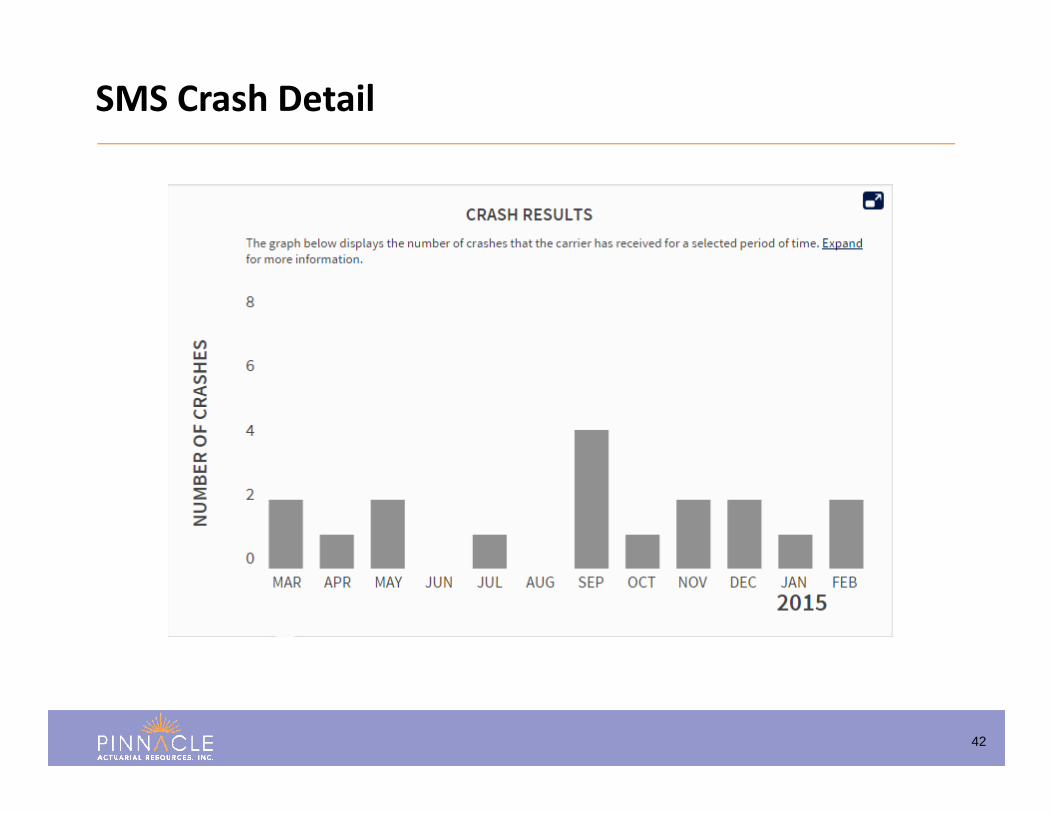
42
SMS Crash Detail
43
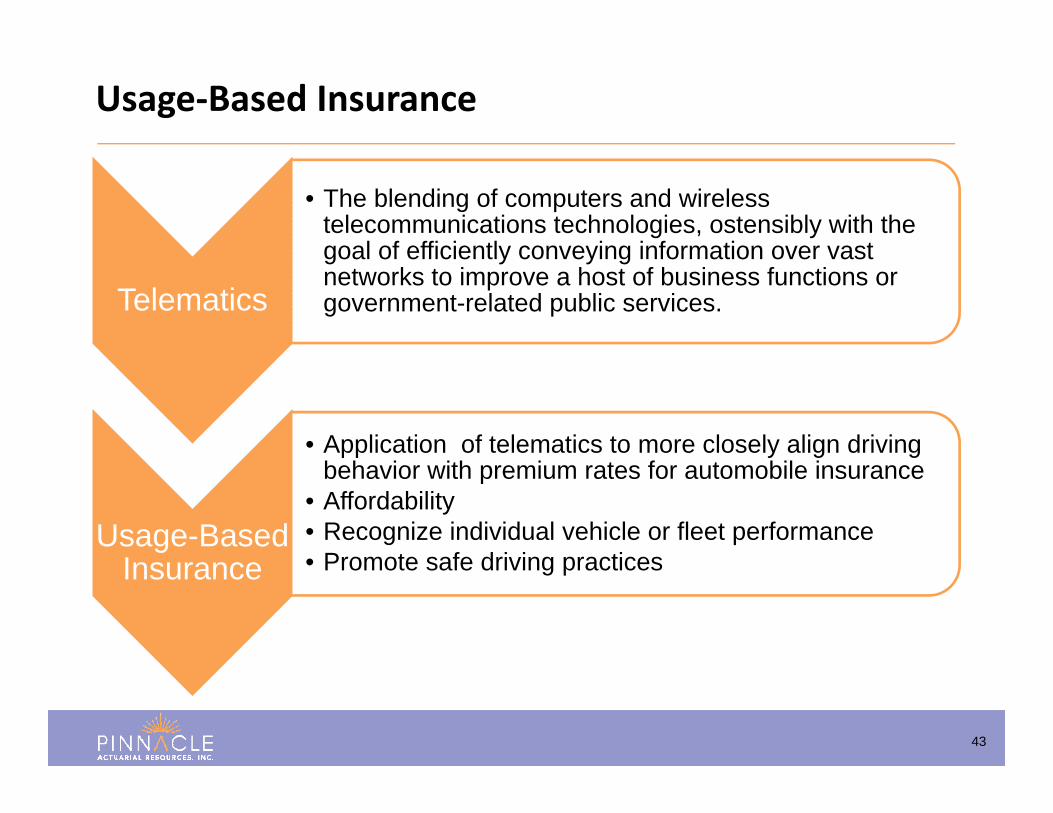
Telematics
• The blending of computers and wireless telecommunications technologies, ostensibly with the goal of efficiently conveying information over vast networks to improve a host of business functions or government-related public services.
Usage-Based Insurance
• Application of telematics to more closely align driving behavior with premium rates for automobile insurance
• Affordability• Recognize individual vehicle or fleet performance• Promote safe driving practices
Usage‐Based Insurance
44
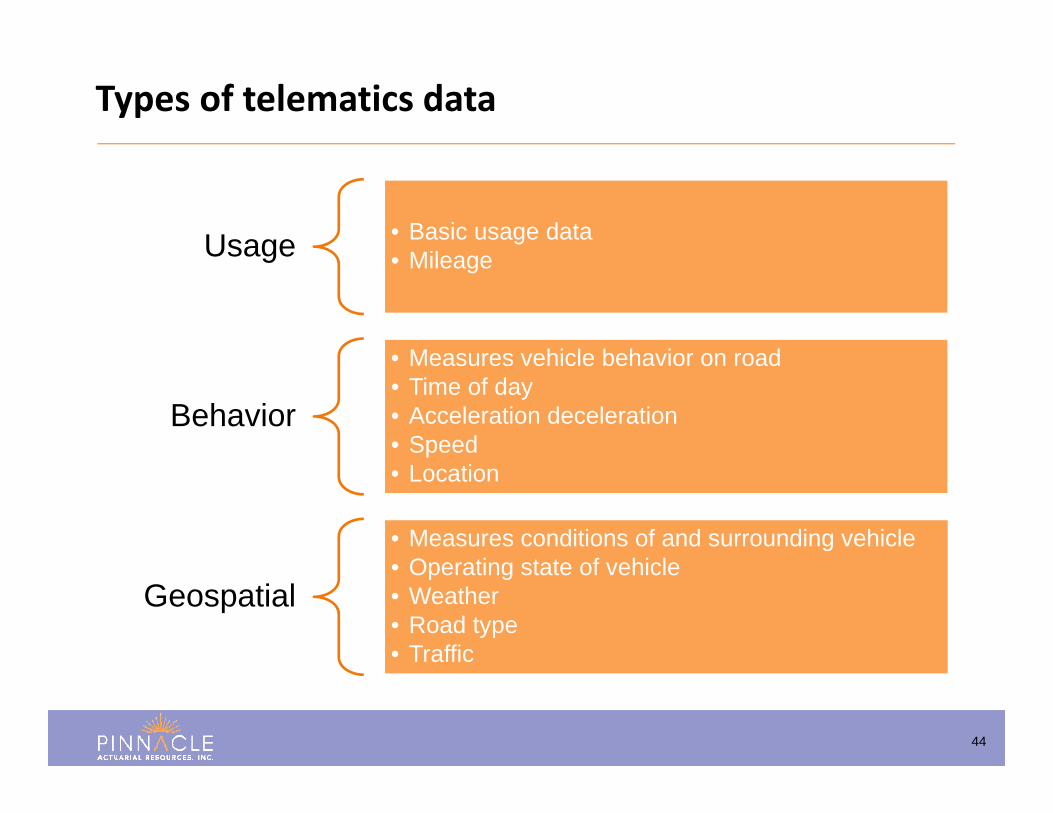
Types of telematics data
Usage • Basic usage data• Mileage
Behavior
• Measures vehicle behavior on road• Time of day• Acceleration deceleration• Speed• Location
Geospatial
• Measures conditions of and surrounding vehicle• Operating state of vehicle• Weather• Road type• Traffic
45
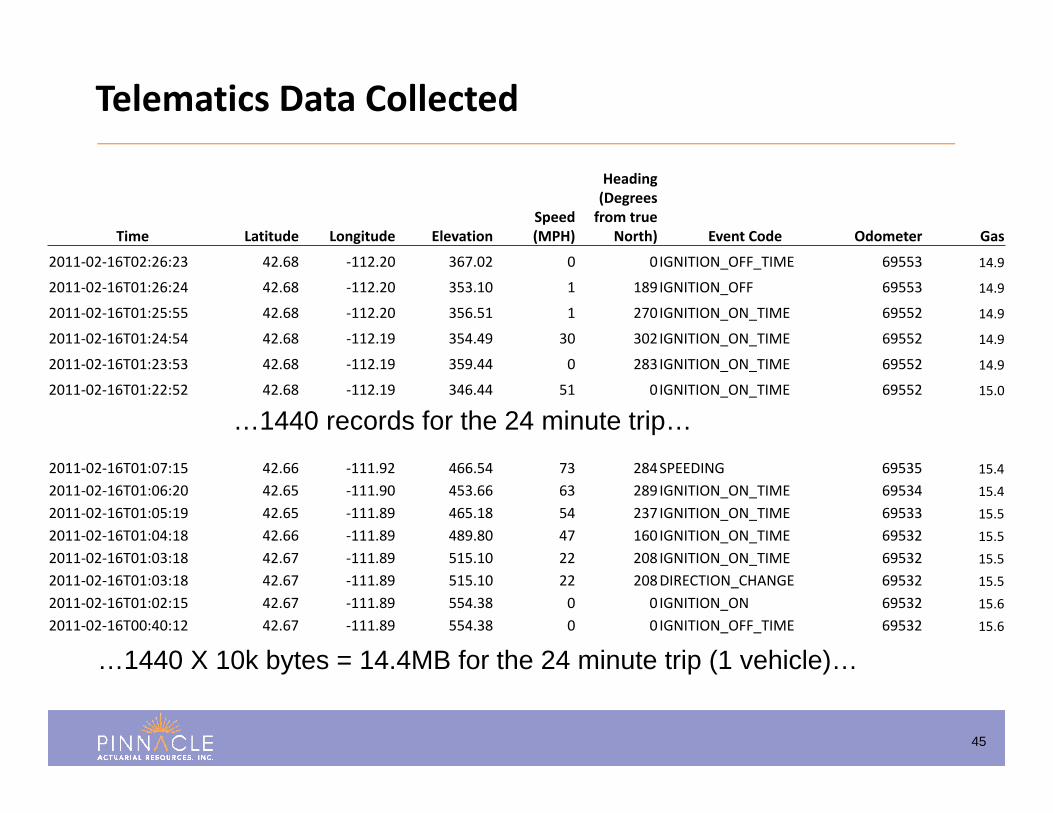
Time Latitude Longitude Elevation Speed (MPH)
Heading (Degrees from true
North) Event Code Odometer Gas
2011‐02‐16T02:26:23 42.68 ‐112.20 367.02 0 0IGNITION_OFF_TIME 69553 14.9
2011‐02‐16T01:26:24 42.68 ‐112.20 353.10 1 189IGNITION_OFF 69553 14.9
2011‐02‐16T01:25:55 42.68 ‐112.20 356.51 1 270IGNITION_ON_TIME 69552 14.9
2011‐02‐16T01:24:54 42.68 ‐112.19 354.49 30 302IGNITION_ON_TIME 69552 14.9
2011‐02‐16T01:23:53 42.68 ‐112.19 359.44 0 283IGNITION_ON_TIME 69552 14.9
2011‐02‐16T01:22:52 42.68 ‐112.19 346.44 51 0IGNITION_ON_TIME 69552 15.0
Telematics Data Collected
2011‐02‐16T01:07:15 42.66 ‐111.92 466.54 73 284SPEEDING 69535 15.42011‐02‐16T01:06:20 42.65 ‐111.90 453.66 63 289IGNITION_ON_TIME 69534 15.42011‐02‐16T01:05:19 42.65 ‐111.89 465.18 54 237IGNITION_ON_TIME 69533 15.52011‐02‐16T01:04:18 42.66 ‐111.89 489.80 47 160IGNITION_ON_TIME 69532 15.52011‐02‐16T01:03:18 42.67 ‐111.89 515.10 22 208IGNITION_ON_TIME 69532 15.52011‐02‐16T01:03:18 42.67 ‐111.89 515.10 22 208DIRECTION_CHANGE 69532 15.52011‐02‐16T01:02:15 42.67 ‐111.89 554.38 0 0 IGNITION_ON 69532 15.62011‐02‐16T00:40:12 42.67 ‐111.89 554.38 0 0 IGNITION_OFF_TIME 69532 15.6
…1440 records for the 24 minute trip…
…1440 X 10k bytes = 14.4MB for the 24 minute trip (1 vehicle)…
46
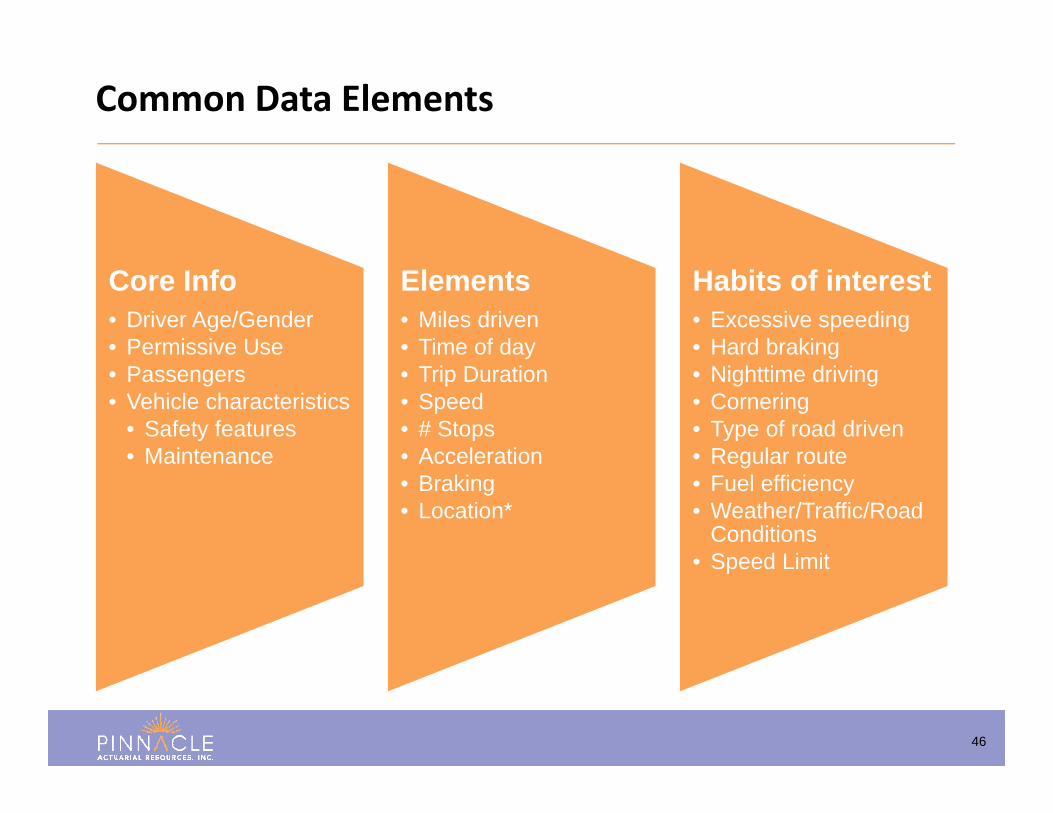
Core Info• Driver Age/Gender• Permissive Use• Passengers• Vehicle characteristics
• Safety features• Maintenance
Elements• Miles driven• Time of day• Trip Duration• Speed• # Stops• Acceleration• Braking• Location*
Habits of interest• Excessive speeding• Hard braking• Nighttime driving• Cornering• Type of road driven• Regular route• Fuel efficiency• Weather/Traffic/Road
Conditions• Speed Limit
Common Data Elements
47
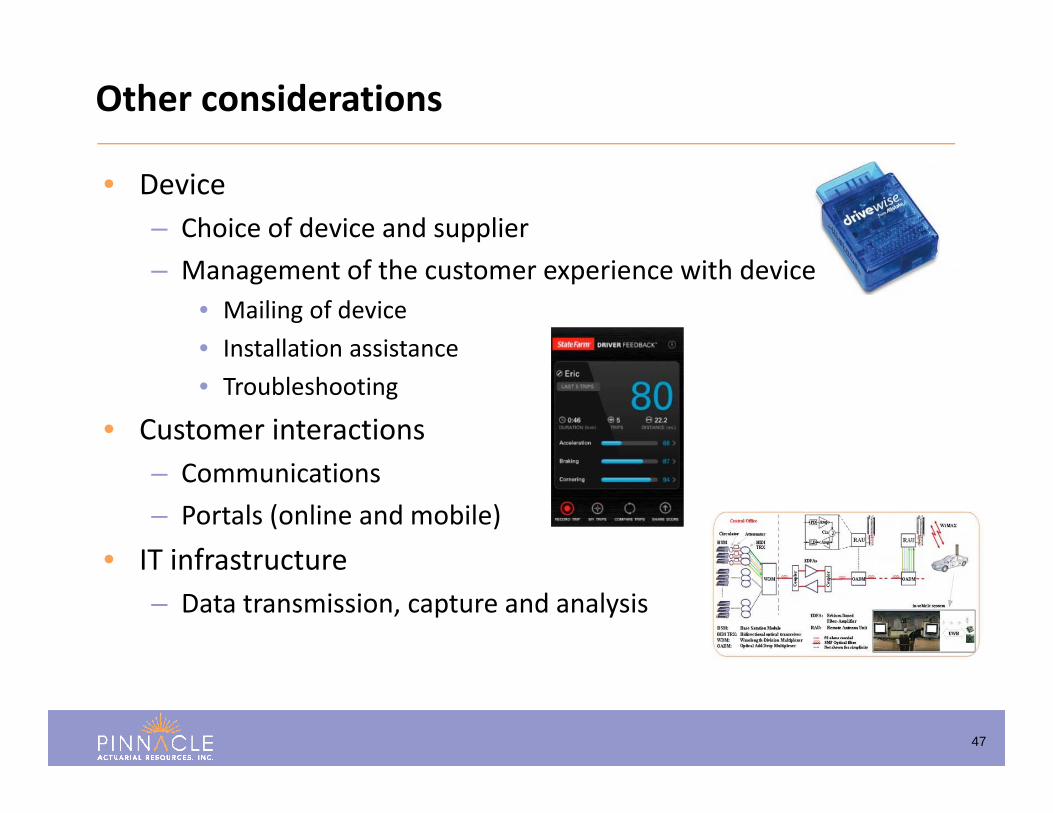
• Device– Choice of device and supplier– Management of the customer experience with device
• Mailing of device• Installation assistance• Troubleshooting
• Customer interactions– Communications– Portals (online and mobile)
• IT infrastructure– Data transmission, capture and analysis
Other considerations
48
Since 2011, there has been a proliferation of vendors offering the mobile app option as an alternative to the OBD solutions
• The overarching issues with the mobile app solution– Amount of time the app is off
• Phone off• Phone not present in vehicle
– The inability to guarantee data captured relate to the driver and vehicle
• Passenger in car pooling situations• Public transit
Mobile app solutions
49
• Price of the solution• Upfront cost, in time and money• Per driver/vehicle/policy cost
• Completeness of the solution• Comparison against the OBD alternative• Accuracy against actual results• Correlation to claims potential
Mobile app solutions – considerations
50
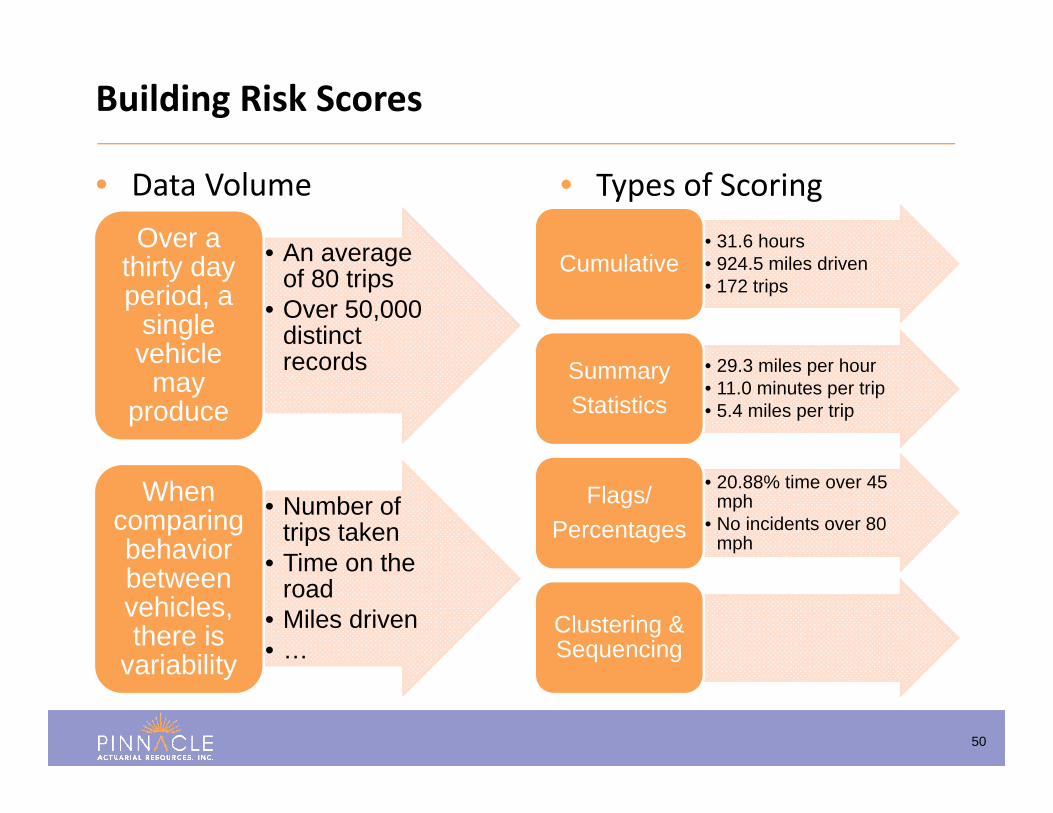
• An average of 80 trips
• Over 50,000 distinct records
Over a thirty day period, a
single vehicle
may produce
• Number of trips taken
• Time on the road
• Miles driven• …
When comparing behavior between vehicles, there is
variability
Building Risk Scores
• 31.6 hours• 924.5 miles driven• 172 trips
Cumulative
• 29.3 miles per hour• 11.0 minutes per trip• 5.4 miles per trip
Summary Statistics
• 20.88% time over 45 mph
• No incidents over 80 mph
Flags/Percentages
Clustering & Sequencing
• Types of Scoring• Data Volume
51
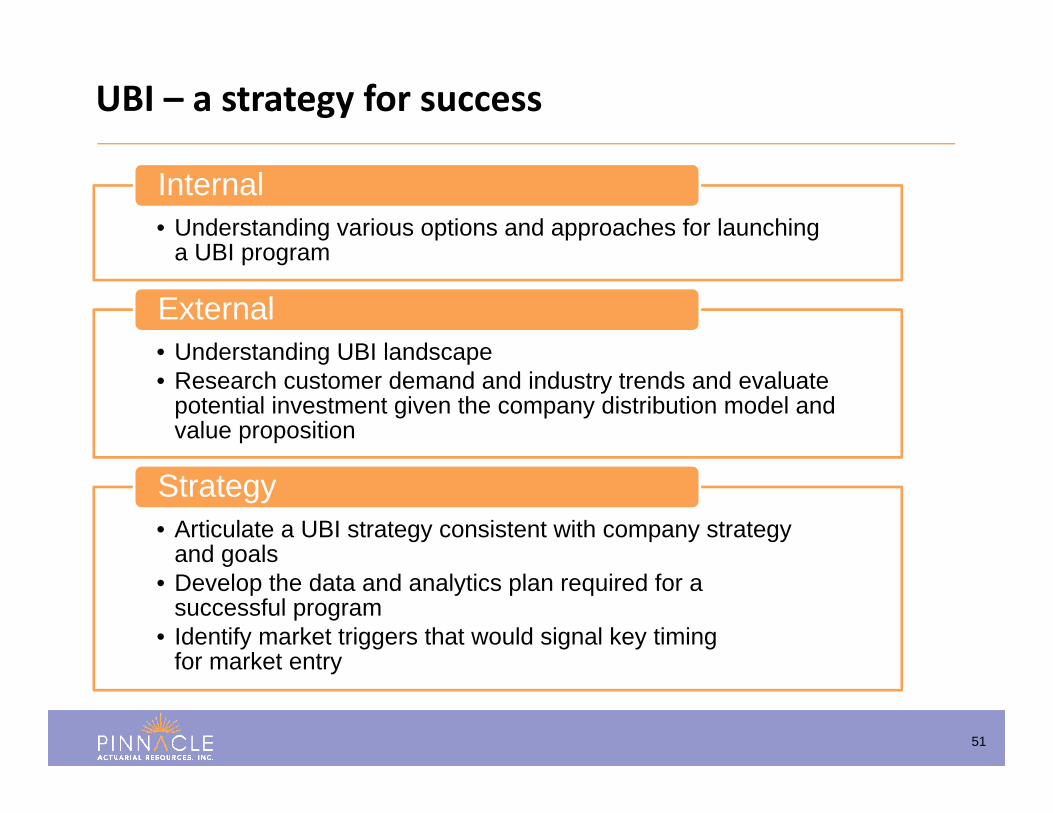
• Understanding various options and approaches for launching a UBI program
Internal
• Understanding UBI landscape• Research customer demand and industry trends and evaluate
potential investment given the company distribution model and value proposition
External
• Articulate a UBI strategy consistent with company strategy and goals
• Develop the data and analytics plan required for a successful program
• Identify market triggers that would signal key timing for market entry
Strategy
UBI – a strategy for success
52
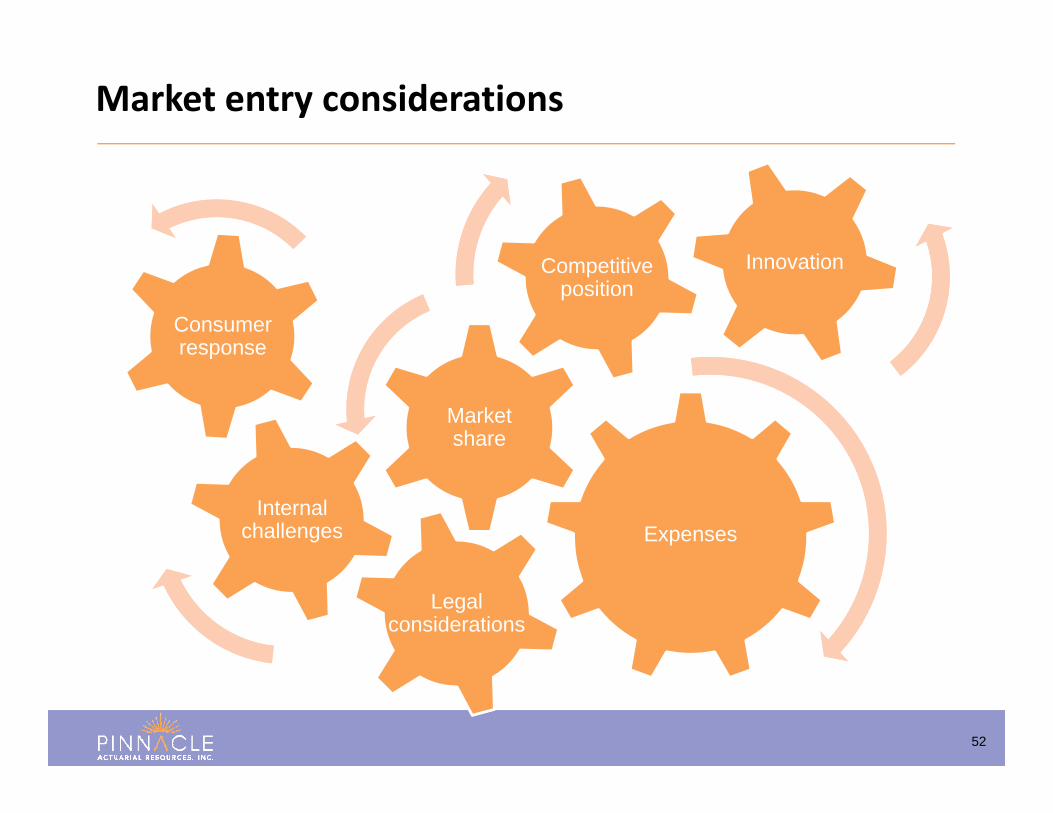
Market entry considerations
Expenses
Market share
Competitive position
InnovationInnovation
Legal considerations
Legal considerations
Internal challenges
Internal challenges
Consumer responseConsumer response
53
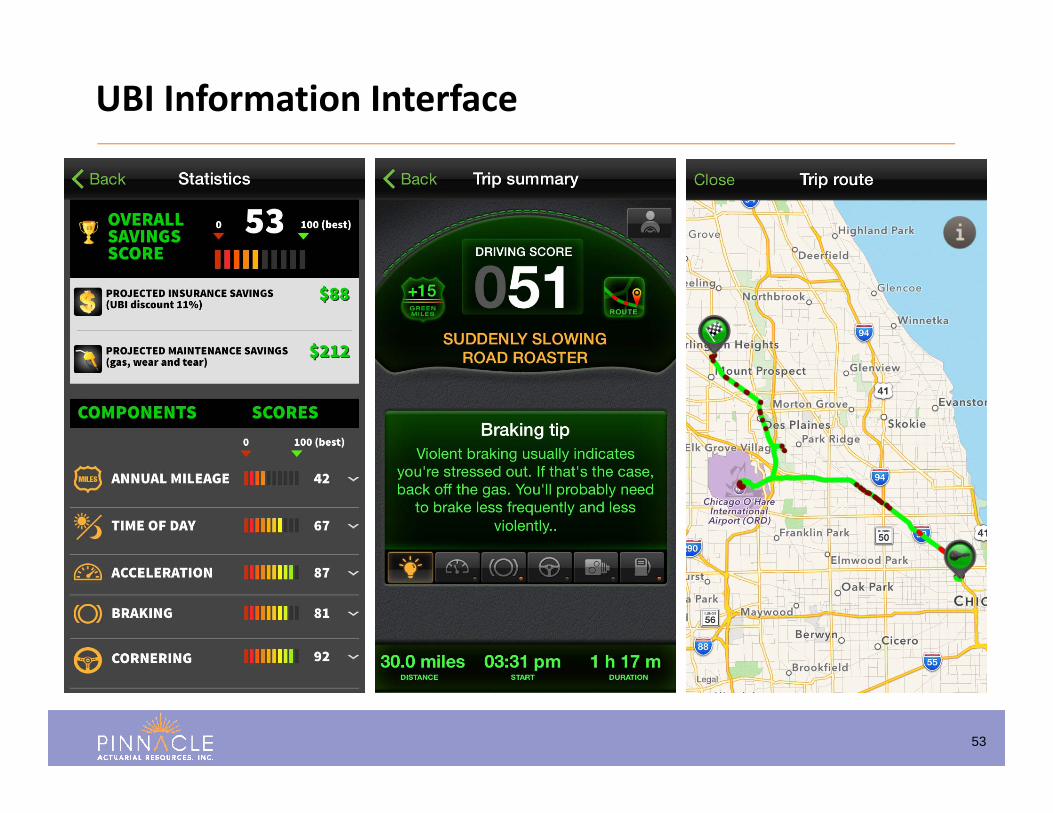
UBI Information Interface
Emerging Data Trends
55
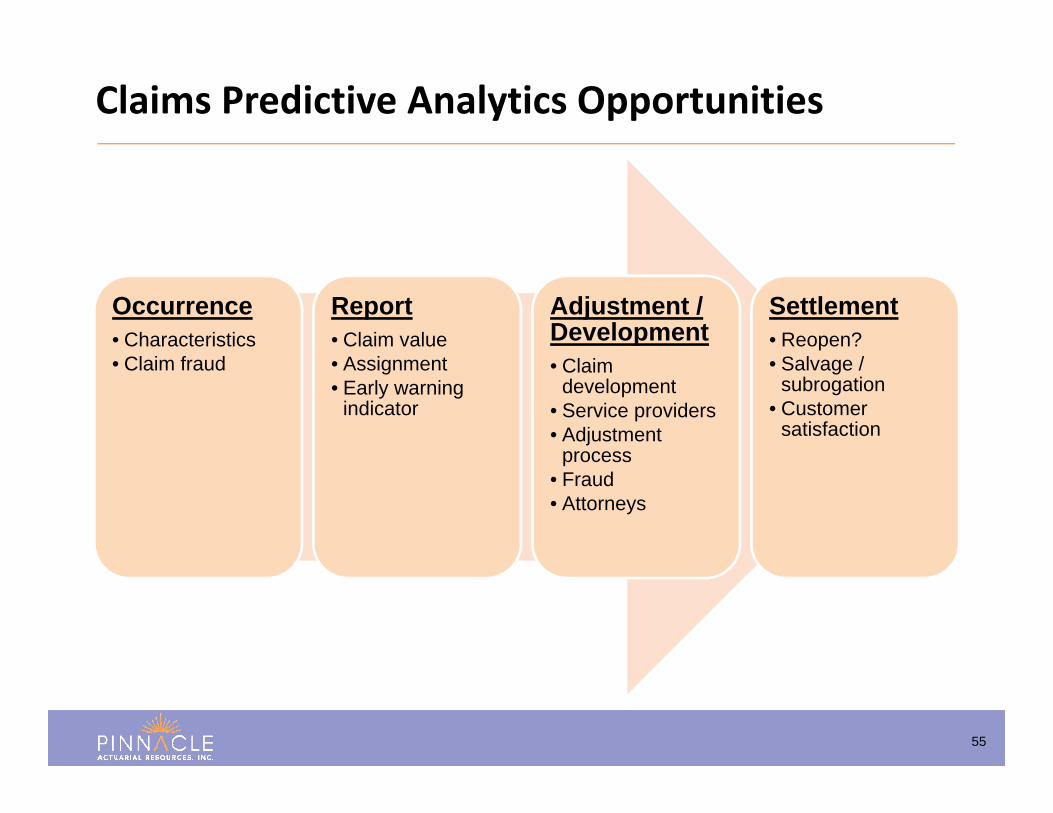
Occurrence• Characteristics• Claim fraud
Report• Claim value• Assignment• Early warning
indicator
Adjustment / Development• Claim
development• Service providers• Adjustment
process• Fraud• Attorneys
Settlement• Reopen?• Salvage /
subrogation• Customer
satisfaction
Claims Predictive Analytics Opportunities
56
• Claim settlement value estimation• Early warning system• Estimating the impact of process lags• Developing a fraud detection system• Analyzing text data to uncover claim insights
Applications of Analytics for Claims
57
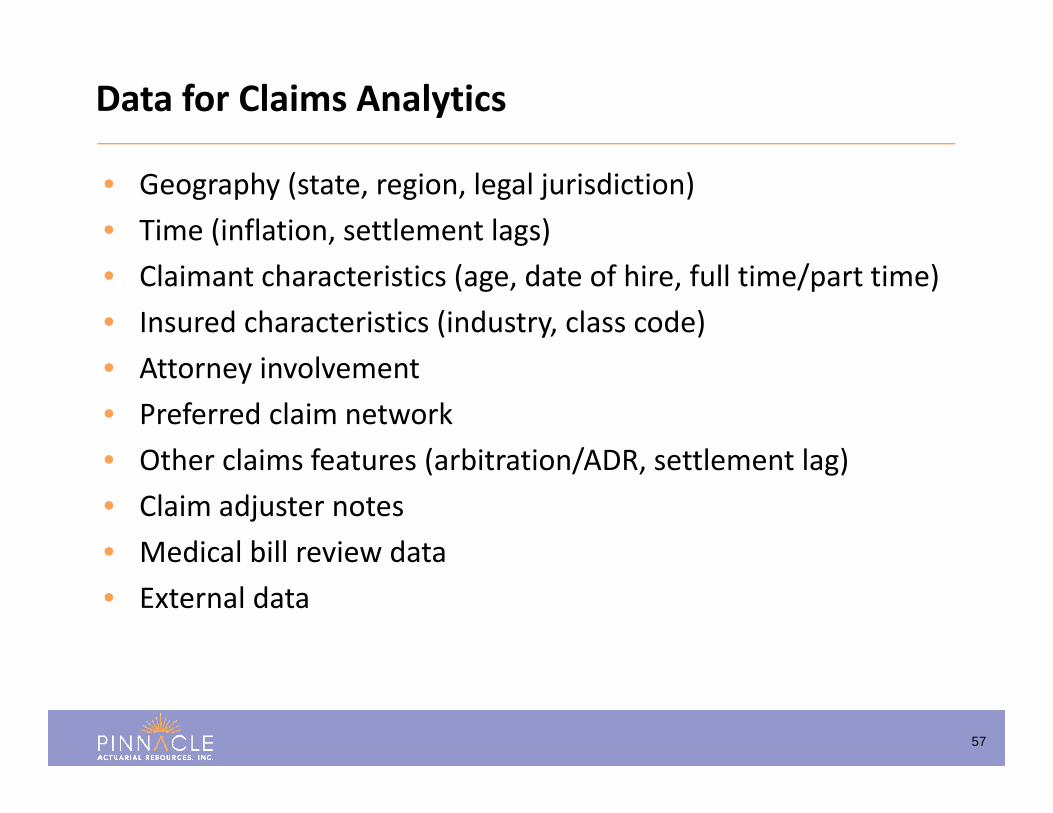
• Geography (state, region, legal jurisdiction)• Time (inflation, settlement lags)• Claimant characteristics (age, date of hire, full time/part time)• Insured characteristics (industry, class code)• Attorney involvement• Preferred claim network• Other claims features (arbitration/ADR, settlement lag)• Claim adjuster notes• Medical bill review data• External data
Data for Claims Analytics
58
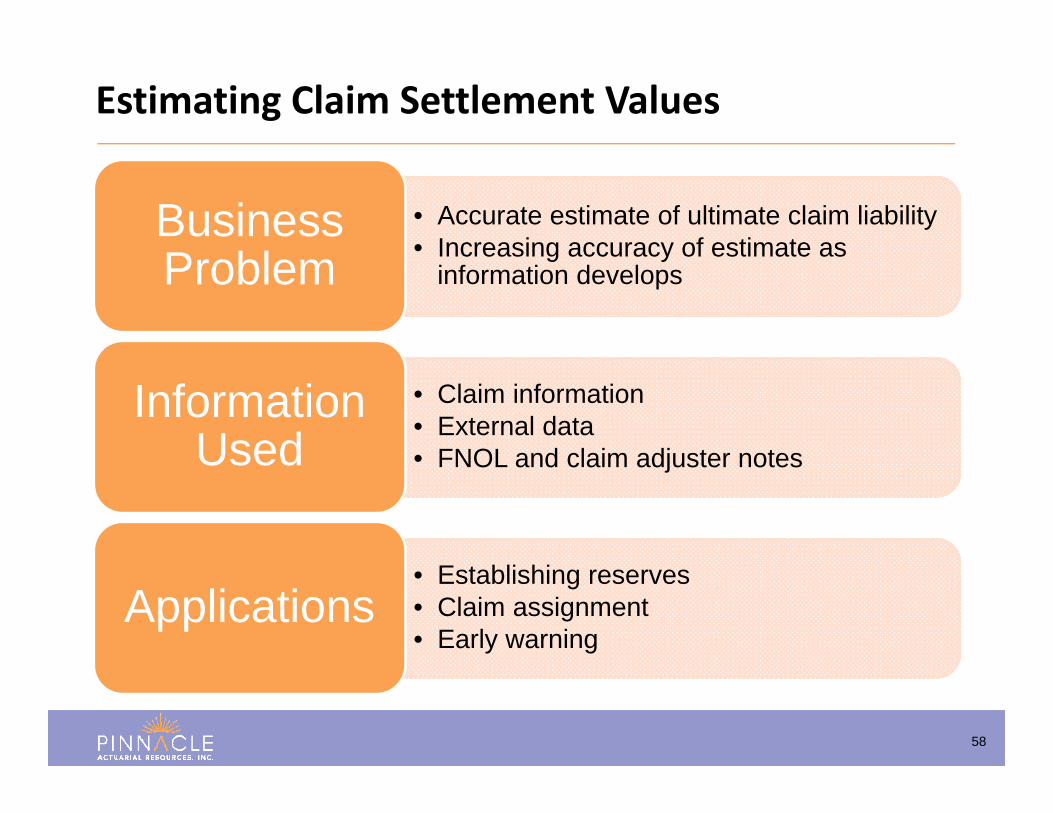
• Accurate estimate of ultimate claim liability• Increasing accuracy of estimate as
information develops
Business Problem
• Claim information• External data• FNOL and claim adjuster notes
Information Used
• Establishing reserves• Claim assignment• Early warning
Applications
Estimating Claim Settlement Values

59
Claim Settlement Value by Industry
60
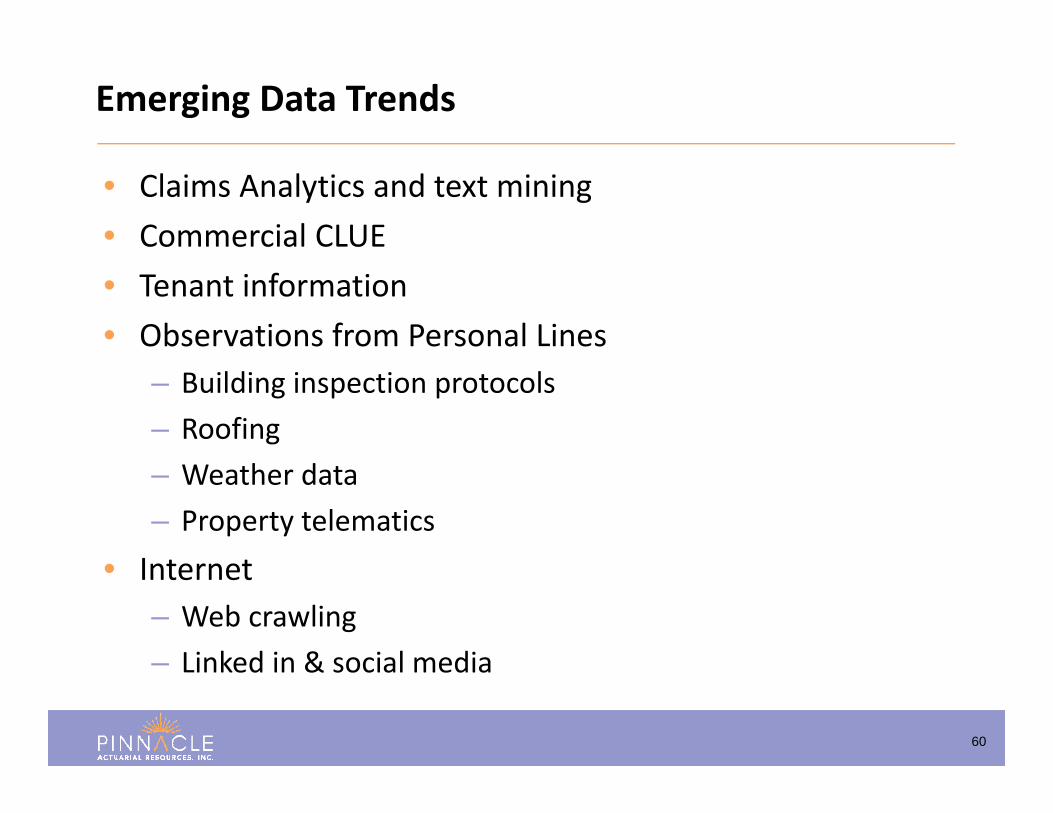
• Claims Analytics and text mining• Commercial CLUE• Tenant information• Observations from Personal Lines
– Building inspection protocols– Roofing– Weather data– Property telematics
• Internet – Web crawling– Linked in & social media
Emerging Data Trends
61
• Commercial Lines rating and underwriting continues to evolve• Companies are being challenged to find new insights and
methods of segmentation• Data sources are readily available• And new data sources continue to emerge
In Conclusion….
Commitment Beyond Numbers 62
Thank You for Your Attention
Tom Kolde630.397.5233
Kathryn Walker630.457.1298