Embed Size (px)
Citation preview

Company name: Kao Corporation Tokyo Stock Exchange in JapanStock code: 4452 (URL: www.kao.com/global/en/investor-relations/library/results/)Representative: Michitaka Sawada, President and CEOContact person: Mitsuhiro Watanabe, Vice President, Investor Relations E-mail: [email protected] date of the Annual General Meeting of Shareholders: March 25, 2020Scheduled starting date of the dividend payments: March 26, 2020Supplementary documents of the financial results: YesFinancial results information meeting: Yes (for institutional investors and analysts)
(Millions of yen, except per share amounts)(Amounts less than one million yen are rounded)
1. Consolidated financial results for the fiscal year ended December 31, 2019(from January 1, 2019 to December 31, 2019)
(1) Consolidated operating results(Percentages indicate year-on-year changes)
% %
Net sales (0.4) 1.2 Operating income 1.9 1.4 Income before income taxes 1.6 1.4 Net income (3.2) 4.5 Net income attributable to owners of the parent (3.6) 4.5 Comprehensive income 19.0 (31.5)
Basic earnings per share (Yen)Diluted earnings per share (Yen)
Ratio of operating income to net sales
(2) Consolidated financial position
Total assetsTotal equityEquity attributable to owners of the parent
February 4, 2020
314.25 314.12
150,349 210,645
123,247
Ratio of equity attributable to owners of the parent to total assets
Fiscal year ended December 31, 2019
Fiscal year ended
Ratio of income before income taxes to total assets
(Reference) Share of profit in investments accounted for using the equity method
18.9%
1,783.46 Equity attributable to owners of the parent per share (Yen)
835,509 822,360
1,653,919 871,421 857,695
1,460,986
Consolidated Financial Results for the Fiscal Year Ended December 31, 2019 [IFRS]
1,508,007 207,703 207,251
December 31, 2019 December 31, 2018
Fiscal year endedDecember 31, 2018
Fiscal year endedDecember 31, 2019
155,331
14.4% 13.8%
153,698 148,213 146,621
1,502,241 211,723
Ratio of net income to equity attributable to owners of the parent
13.5% 14.1%
2,126 2,082
December 31, 2018
306.70 306.63
17.6%
51.9% 56.3%
1,689.82

Fiscal Year Ended December 31, 2019
(3) Consolidated cash flows
Net cash flows from operating activitiesNet cash flows from investing activitiesNet cash flows from financing activities
2. Dividends
Annual cash dividends per share (Yen)1st quarter end - 2nd quarter end3rd quarter endFiscal year endTotal
Total dividend payment amountPayout ratio (consolidated)
3.(from January 1, 2020 to December 31, 2020)
(Millions of yen, except per share amounts)(Percentages indicate year-on-year changes)
%
Net salesOperating incomeIncome before income taxesNet income attributable to owners of the parentBasic earnings per share (Yen)
4. Others
(1)
(2) Changes in accounting policies and changes in accounting estimates1)
2)3) Changes in accounting estimates: None
Fiscal year ended December 31, 2018
-
- 60.00
120.00
Forecast of consolidated operating results for the fiscal year ending December 31, 2020
65.00 130.00
Ratio of dividends to equity attributable to owners of the parent (consolidated)
195,610 244,523
70.00 140.00
58,493 38.2%
7.5%
60.00 70.00
62,621
Fiscal year endedDecember 31, 2018
289,681
(94,266)(126,166)
(157,895)(108,579)
December 31, 2020(Forecast)
-
Cash and cash equivalents at the end of the year
Fiscal year ending Fiscal year ended
265,978
Fiscal year ended December 31, 2019
- 65.00
-
December 31, 2019
42.4%
7.2%
Changes in accounting principles required by IFRS: YesFor details, please refer to page 24, "Changes in Accounting Policies" in "Notes to Consolidated FinancialStatements."
41.8% - 43.7%
Changes in accounting principles due to reasons other than 1): None
Note:As of the fiscal year ending December 31, 2020, the Company plans to change its method of recognizing sales for sometransactions from the total amount to the net amount. Applying the same method to the forecast of consolidatedoperating results for the previous fiscal year would have increased net sales between 2.8% and 4.2%.
1,510,000 - 1,530,000220,000 - 230,000220,000 - 230,000154,000 - 161,000
320.22 - 334.78
December 31, 2020
0.5 - 1.8
4.4 - 9.2 3.9 - 8.6
3.9 - 8.6
Fiscal year ending
-
Changes in significant subsidiaries during the period (changes in specified subsidiaries resulting in change in scope ofconsolidation): None
Fiscal Year Ended December 31, 2019
(3) Number of issued shares outstanding at the end of the year (ordinary shares)
Number of issued shares including treasury sharesNumber of treasury shares
Notice regarding execution of audit procedures
Explanation regarding the appropriate use of forecast of operating results and other special items
December 31, 2018
Fiscal year ended
1,083,466 2,043,272
December 31, 2019
Forward-looking statements such as earnings forecasts and other projections contained in this release are based oninformation available at the time of disclosure and assumptions that management believes to be reasonable, and do notconstitute guarantees of future performance. Actual results may differ materially from expectations due to variousfactors.
Please refer to page 1 to 14, "1. Summary of Operating Results and Financial Position" for the suppositions that formthe assumptions for earnings forecasts and cautions concerning the use of earnings forecasts.
This financial results report is exempt from audit by certified public accountants or accounting firms.
Weighted average number of shares outstanding during the year 489,089,471483,251,577
Fiscal year ended
482,000,000 488,700,000
December 31, 2018December 31, 2019

Fiscal Year Ended December 31, 2019
1. Summary of Operating Results and Financial Position (1) Summary of Operating Results
Operating Results for the Fiscal Year Ended December 31, 2019
1) Trends in Overall Results for the Fiscal Year Ended December 31, 2019
Amid substantial changes in the social conditions and natural environment in which it operates, the Kao
Group has declared a major shift to ESG management to build a foundation that will enable sustainable
growth. In April 2019, the Kao Group announced the “Kirei* Lifestyle Plan,” its ESG strategy, and activities
kicked into gear.
* Kirei is a Japanese word that represents the concept of cleanliness, beauty, health, purity, and fairness.
The Kao Group will strive to enhance its corporate value as it continues to achieve profitable growth while
contributing to the sustainability of society.
Note: Like-for-like growth rates below exclude the effect of translation of local currencies into Japanese yen.
(Billions of yen, except operating margin and per share amounts)
2019 2018 Growth
Net sales 1,502.2 1,508.0 (0.4)%
Like-for-like: 0.7%
Operating income 211.7 207.7 1.9%
Operating margin (%) 14.1 13.8 -
Income before income taxes 210.6 207.3 1.6%
Net income 150.3 155.3 (3.2)%
Net income attributable to owners of the parent 148.2 153.7 (3.6)%
Basic earnings per share (Yen) 306.70 314.25 (2.4)%
Conditions in the global economy are unclear due to factors including international trade issues, geopolitical
risks in the Middle East and an uncertain economic outlook in Asian countries, and in Japan, economic
recovery has been delayed following the increase in the consumption tax rate in October.
In 2019, the markets for household and personal care products and cosmetics in Japan, which are key
markets for the Kao Group, were in solid condition throughout the year according to retail sales and
consumer purchasing survey data, although there was substantial fluctuation due to factors including
last-minute demand ahead of the consumption tax rate increase and the decline thereafter. In every product
category, the share of the e-commerce channel increased further and average unit prices for household and
personal care products increased by 2 percentage points compared with the previous fiscal year.
Under these circumstances, the Kao Group increased operating income for the tenth consecutive fiscal year
1

Fiscal Year Ended December 31, 2019
and achieved record-high operating income for the seventh consecutive fiscal year.
Net sales decreased 0.4% compared with the previous fiscal year to 1,502.2 billion yen. On a like-for-like
basis, net sales increased 0.7%. Operating income was 211.7 billion yen, an increase of 4.0 billion yen
compared with the previous fiscal year, the operating margin was 14.1% and income before income taxes
was 210.6 billion yen, an increase of 3.4 billion yen. Net income was 150.3 billion yen, a decrease of 5.0
billion yen.
Basic earnings per share were 306.70 yen, a decrease of 7.55 yen, or 2.4%, from 314.25 yen in the previous
fiscal year.
Economic value added (EVA*), which the Kao Group uses as a management indicator, decreased 6.1 billion
yen compared with the previous fiscal year to 87.4 billion yen due to a decrease in net operating profit after
tax (NOPAT).
* EVA is a registered trademark of Stern Stewart & Co.
To improve capital efficiency and further increase shareholder returns, Kao Corporation resolved at a
meeting of its Board of Directors held on April 24, 2019 to repurchase its own shares, and repurchased
shares totaling 50.0 billion yen. Kao Corporation retired 6.7 million treasury shares on July 12, 2019.
The main exchange rates used for translating the financial statement items (income and expenses) of
foreign subsidiaries and associates were as shown below.
First quarter
Jan. – Mar.
Second quarter
Apr. – Jun.
Third quarter
Jul. – Sep.
Fourth quarter
Oct. – Dec.
Yen/U.S. dollar 110.09 (108.44) 109.99 (109.08) 107.32 (111.44) 108.71 (112.82)
Yen/Euro 125.10 (133.23) 123.58 (130.09) 119.39 (129.62) 120.34 (128.76)
Yen/Chinese yuan 16.31 (17.04) 16.13 (17.11) 15.31 (16.39) 15.43 (16.31)
Note: Figures in parentheses represent the exchange rates for the same period of the previous fiscal year.
2

Fiscal Year Ended December 31, 2019
2) Trends by Segment during the Fiscal Year
Summary of Segment Information
Consolidated Results by Segment
3

Fiscal Year Ended December 31, 2019
Consolidated Net Sales Composition
Note: Figures for the Consumer Products Business present sales to external customers and figures for the Chemical Business include sales to the Consumer Products Business in addition to external customers. Sales by geographic region are classified based on the location of the sales recognized.
Net sales to foreign customers were 37.0% of net sales compared with 37.7% for the previous fiscal year.
Consumer Products Business
Sales increased 2.0% compared with the previous fiscal year to 1,257.0 billion yen. On a like-for-like basis,
sales increased 2.9%.
The Kao Group worked for more effective marketing and sales activities, including launching new and
improved products that address the diversification of consumer values and strengthening activities in the
e-commerce channel in line with changes in purchasing behavior.
4
Fiscal Year Ended December 31, 2019
Sales in the Cosmetics Business continued to grow steadily, while growth in the Skin Care and Hair Care
Business was basically unchanged. The Human Health Care Business was affected by a slowdown in the baby
diaper business in the Chinese market. Sales increased in the Fabric and Home Care Business, partly due to
launches of new and improved products.
In Japan, sales increased 1.8% to 899.6 billion yen due to launches of new and improved products, the Kao
Group’s response to the consumption tax rate increase and other factors.
In Asia, sales grew steadily, increasing 3.8% to 206.3 billion yen. On a like-for-like basis, sales increased
6.7%.
In the Americas, sales increased 4.5% to 88.8 billion yen. On a like-for-like basis, sales increased 6.6%. In
Europe, sales decreased 4.6% to 62.2 billion yen. However, on a like-for-like basis, sales increased 0.9%.
Operating income increased 4.2 billion yen compared with the previous fiscal year to 179.9 billion yen.
Note: The Kao Group’s Consumer Products Business consists of the Cosmetics Business, the Skin Care and Hair Care Business, the Human Health Care Business, and the Fabric and Home Care Business.
Cosmetics Business
Sales increased 7.8% compared with the previous fiscal year to 301.5 billion yen. On a like-for-like basis,
sales increased 9.0%.
The growth strategy for the Cosmetics Business proceeded smoothly. Sales remained strong in Asia, and
were on a growth track in Japan. Sales grew strongly for the 11 brands (“G11”) the Kao Group selected for
its global strategy and the eight regional brands (“R8”) it is nurturing, centered on Japan. Amid signs of a
slowdown in inbound demand, G11 brands Curél, a derma care brand, and freeplus, which is hypoallergenic
and contains Japanese and Chinese botanical extracts, performed well in Japan and the Chinese market, and
sales of SUQQU and SOFINA iP grew steadily. To strengthen its high-prestige range, the Kao Group made a
strong start with the rebranding of the super-prestige brand SENSAI in Europe in May. Sales began in Japan
in September. The Kao Group offered the est G.P. line of skin care cosmetics in November and products that
apply Fine Fiber Technology for the formation of layered ultra-thin membranes in December. The Kao Group
also reinforced its activities in the growing e-commerce and travel retail channels and promoted a shift to
digital marketing.
Operating income was 41.4 billion yen, an increase of 13.7 billion yen from the previous fiscal year, due to
the effect of increased sales of strongly performing brands, among other factors.
Skin Care and Hair Care Business
Sales decreased 0.2% compared with the previous fiscal year to 340.8 billion yen. On a like-for-like basis,
sales increased 1.1%.
5

Fiscal Year Ended December 31, 2019
Sales of skin care products increased. In Japan, new body cleanser Bioré u The Body steadily increased sales
and market share, despite the impact of adverse weather conditions in the first half of the fiscal year. Sales
were firm in Asia, but decreased in the Americas due to the impact of stiff competition.
Sales of hair care products were basically unchanged from the previous fiscal year. Sales were strong for hair
color products in Japan and for Oribe, a brand in the Americas for high-end hair salons, and the Kao Group
launched new and improved premium-price shampoos, conditioners and other products in Japan and Europe.
However, overall sales of hair care products were affected by the shrinking mass market.
Operating income increased 0.7 billion yen compared with the previous fiscal year to 49.5 billion yen.
Human Health Care Business
Sales decreased 4.7% compared with the previous fiscal year to 255.2 billion yen. On a like-for-like basis,
sales decreased 3.5%.
Sales of Merries baby diapers decreased. In Japan, demand for the purpose of resale in the Chinese market
fell substantially. Sales in the Chinese market, including cross-border e-commerce, were on a recovery track
but decreased compared with the previous fiscal year. On the other hand, locally manufactured products
targeting the middle-class consumer segment performed strongly in Indonesia. Merries also gained broad
acceptance among consumers in Russia and neighboring countries.
For Laurier sanitary napkins, high-value-added products performed strongly and increased market share in
Japan, while sales by Kao China grew as a result of an increase in new retail outlets, enhanced activities in
the e-commerce channel and other factors. Sales were also strong in Indonesia.
For personal health products, sales increased with steady performance of oral care products and bath
additives.
Operating income decreased 10.7 billion yen compared with the previous fiscal year to 17.2 billion yen due
to the decrease in sales of Merries, fluctuations in exchange rates and other factors.
Fabric and Home Care Business
Sales increased 4.5% compared with the previous fiscal year to 359.5 billion yen. On a like-for-like basis,
sales increased 4.6%. In Japan, sales increased due to the Kao Group’s response to last-minute demand
ahead of the consumption tax rate increase in October, but fell short of its plan because market growth was
lower than expected.
In fabric care products, sales of laundry detergents grew due to the launch in Japan of Attack ZERO, an
innovative new laundry detergent. Sales of fabric softeners were firm given the severely competitive market
environment. In addition, U.S.-based Washing Systems, LLC, which Kao acquired in August 2018,
contributed to sales and income.
6

Fiscal Year Ended December 31, 2019
In home care products, the Kao Group launched the Quickle Joan series of antibacterial household cleaning
products that are gentle on the skin. Dishwashing detergents were impacted by stiff competition, but sales
and market share grew steadily as sales of CuCute remained strong, among other factors.
Operating income increased 0.5 billion yen compared with the previous fiscal year to 71.8 billion yen due to
the effect of increased sales, despite an increase in marketing expenses for new product launches.
Chemical Business
Sales decreased 8.6% compared with the previous fiscal year to 285.9 billion yen. On a like-for-like basis,
sales decreased 6.6%.
Sales of oleo chemicals decreased due to the substantial impact of selling price adjustments associated with
a decline in prices for natural fats and oils, in addition to a trend toward declining demand for some products.
Sales of performance chemicals and specialty chemicals decreased due to the impact of sluggish demand
associated with slowing economic growth, especially outside Japan.
Operating income increased 0.2 billion yen compared with the previous fiscal year to 30.8 billion yen due to
promotion of high-value-added products, including among oleo chemical products outside Japan.
(Remainder of page intentionally left blank.)
7

Fiscal Year Ended December 31, 2019
Forecast for the Fiscal Year Ending December 31, 2020
(Billions of yen, except operating margin and per share amounts)
2020 2019 Growth
Net sales 1,510.0-1,530.0 1,502.2 0.5-1.8%1
Like-for-like2: 2.3-3.6%
Operating income 220.0-230.0 211.7 3.9-8.6%
Operating margin (%) 14.6-15.0 14.1 -
Income before income taxes 220.0-230.0 210.6 4.4-9.2%
Net income attributable to owners of the parent 154.0-161.0 148.2 3.9-8.6%
Basic earnings per share (Yen) 320.22-334.78 306.70 4.4-9.2% 1. As of the fiscal year ending December 31, 2020, the Company plans to change its method of recognizing
sales for some transactions from the gross amount to the net amount. Applying the same method to the forecast of consolidated operating results for the previous fiscal year would have increased net sales between 2.8% and 4.2%.
2. In this table and hereinafter, like-for-like growth rates exclude changes due to the abovementioned
method of recognizing sales and the effect of translation of local currencies into Japanese yen.
1) Forecast of Overall Business Results for the Fiscal Year Ending December 31, 2020
Fiscal 2020 is the final year of the Kao Group Mid-term Plan 2020 (K20) covering the four years from 2017
to 2020. All Kao Group employees will resolutely take on this challenge as they maintain the “Integrity*” to
strive for the enrichment of the lives of people globally and to contribute to the sustainability of the world as
set forth in the Kao Way, the Group’s corporate philosophy, and endeavor to meet its targets while continuing
to achieve profitable growth and returns to stakeholders.
* Integrity is one of the values of the Kao Way, the corporate philosophy of the Kao Group.
Specifically, the Kao Group will promote technology innovations that will have a substantial impact on people,
society, and the planet. In addition, the Kao Group will work to further expand its growth businesses such as
cosmetics and to revitalize the baby diaper business. The Kao Group will also proactively conduct launches
of new and improved products and various marketing activities to respond to travelers coming to Japan to
attend the Tokyo Olympics and Paralympics and for other reasons, and to address the fierce heat expected
in Japan. Moreover, as a specific action of the “Kirei Lifestyle Plan,” its ESG strategy, the Kao Group will
integrate the first phase of its “Kirei Innovation-focused Actions” with its business strategy.
However, the operating environment is expected to remain uncertain due to unpredictable risks worldwide,
including international trade issues, geopolitical risks in the Middle East and the impact of the threat of
contagion from the new strain of coronavirus on inbound demand. For this reason, the Kao Group announces
its forecast of consolidated business results within certain ranges.
The Kao Group forecasts that net sales for fiscal 2020 will increase between 0.5% and 1.8% year on year to
between 1,510.0 billion yen and 1,530.0 billion yen, respectively. On a like-for-like basis, the Kao Group
forecasts that net sales will increase between 2.3% and 3.6%.
8

Fiscal Year Ended December 31, 2019
With regard to raw material prices, prices for natural fats and oils have been increasing since the second half
of fiscal 2019 and the Kao Group forecasts that prices for raw material overall will rise slightly compared with
2019, but it will continue to conduct Total Cost Reduction (TCR) activities, reforms of its marketing and sales
activities, and other measures to support sustainable growth.
Based on these assumptions, the Kao Group forecasts an increase of between 3.9% and 8.6% in operating
income to between 220.0 billion yen and 230.0 billion yen, respectively, an operating margin of between
14.6% and 15.0%, an increase of between 4.4% and 9.2% in income before income taxes to between 220.0
billion yen and 230.0 billion yen, respectively, an increase of between 3.9% and 8.6% in net income
attributable to owners of the parent to between 154.0 billion yen and 161.0 billion yen, respectively, and an
increase of between 4.4% and 9.2% in basic earnings per share to between 320.22 yen and 334.78 yen,
respectively.
The Kao Group will increase economic value added (EVA) by making full use of its assets to manage invested
capital more efficiently, together with an increase in net operating profit after tax (NOPAT).
2) Forecast by Segment for the Fiscal Year Ending December 31, 2020
In the Cosmetics Business, the Kao Group will further enhance its “G11” global strategy brands and “R8”
regional strategy brands. Among the “G11” brands, in addition to launching athletia, a lifestyle brand that
takes an environmentally conscious, ethical approach, the Kao Group will work to create high-value-added
products that leverage its original technologies and conduct a rebranding of KANEBO and cultivate the est
G.P. line as well as roll out the super-prestige brand SENSAI in the Chinese market. In addition, the Kao
Group will reinforce initiatives in the growing e-commerce and travel retail channels and work to further step
up its operations in Asia as it makes greater progress in its structural reforms in Japan.
As a result, the Kao Group forecasts that sales in this business will increase 5.1% year on year on a
like-for-like basis to 319.0 billion yen. Over the medium term to 2025, the Kao Group aims to achieve sales
of 400.0 billion yen and an operating margin of 15%.
In the Skin Care and Hair Care Business, the Kao Group will work to revitalize the market by assessing
changes in consumer values and lifestyle habits as it adds greater value to products and offering its own
original and appealing proposals. The Kao Group will also respond to market segmentation and proactively
take on challenges in new areas and categories. In skin care products, the Kao Group will expand sales in
Japan and Asia by nurturing UV care and other products that deal with environmental stress on the skin, and
the cleansing products that are the foundation of the business. The Kao Group will also launch new and
improved products to respond to travelers coming to Japan to attend the Tokyo Olympics and Paralympics
and for other reasons, and to address the fierce heat expected in Japan. In hair care products, the Kao Group
intends to expand sales by working to increase brand value and revitalize the market with distinctive product
offerings while balancing mass brands and premium brands.
9

Fiscal Year Ended December 31, 2019
As a result, the Kao Group forecasts that sales in this business will increase 2.8% year on year on a
like-for-like basis to 317.0 billion yen.
Please note that the Company plans to change its method of recognizing sales for some transactions from
the gross amount to the net amount.
The Human Health Care Business will promote product development focused on health care for both body
and mind. The Kao Group aims to create sanitary products that are gentle on skin and that offer greater
comfort and a sense of confidence. The Kao Group will strengthen the brand power of Merries baby diapers
with measures to cultivate pants-type diapers, which are a growing category in the Chinese market, where
competition is intensifying. In Indonesia, the Kao Group expects growth exceeding market growth from
further promotion of educational and awareness-raising activities. For Laurier sanitary napkins, which are
performing well, the Kao Group will expand the business by further promoting high-value-added products in
Japan and elsewhere in Asia. The Kao Group will work to further raise the brand value of its personal health
products by offering products that address rising health awareness and diversifying needs. In beverage
products, the Kao Group will forefront the unique appeal of Healthya functional drinks in helping to reduce
visceral fat and work to develop its brands.
As a result, the Kao Group forecasts that sales in this business will increase 2.7% year on year on a
like-for-like basis to 264.0 billion yen.
In the Fabric and Home Care Business, the Kao Group will develop products with high added value for
consumers based on insights into changing consumer lifestyles to realize cleanliness, comfort and
enjoyment in various everyday situations. The Kao Group will also work to reduce the amount of plastic it
uses by shifting to refill products and large-capacity pouches. In fabric care products, the Kao Group will
further strengthen Attack ZERO, a laundry detergent launched in 2019, and offer products tailored to
various consumer needs. For home care products, the Kao Group will focus on changes in family composition
and saving time on housework in continuing to offer products that substantially reduce the burden of
housekeeping.
As a result, the Kao Group forecasts that sales in this business will increase 2.6% year on year on a
like-for-like basis to 369.0 billion yen.
In the Chemical Business, the Kao Group will promote global supply of distinctive chemical products that
meet the diverse needs of a wide range of industries. In response to rising concern about the global
environment, the Kao Group will endeavor to augment its lineup of eco-chemical products that reduce
environmental impact, and continue to work to develop high-value-added products that are not affected by
fluctuations in raw material prices.
As a result, the Kao Group forecasts that sales in this business will increase 7.1% year on year on a
10

Fiscal Year Ended December 31, 2019
like-for-like basis to 309.0 billion yen.
Sales for each of the above businesses have been calculated based on net sales of 1,530.0 billion yen as
stated in the forecast of consolidated operating results for the fiscal year ending December 31, 2020.
3) Underlying Assumptions of the Forecast for the Fiscal Year Ending December 31, 2020
The above forecast was made assuming translation rates of one U.S. dollar to 110 yen, one euro to 125 yen
and one Chinese yuan to 16 yen.
Please note that although there is potential for volatility in prices of natural fats and oils and petrochemicals,
assumptions for prices are based on information currently available to the Kao Group.
(Remainder of page intentionally left blank.)
11

Fiscal Year Ended December 31, 2019
(2) Summary of Financial Position
Summary of Assets, Liabilities, Equity and Cash Flows
1) Summary of Assets, Liabilities, Equity and Cash Flows for the Fiscal Year Ended December 31,
2019
Consolidated Financial Position
(Billions of yen, except per share amounts)
December 31,
2019
December 31,
2018 Incr./(Dcr.)
Total assets 1,653.9 1,461.0 192.9
Total liabilities 782.5 625.5 157.0
Total equity 871.4 835.5 35.9
Ratio of equity attributable to owners of the parent to
total assets 51.9% 56.3% -
Equity attributable to owners of the parent per share
(Yen) 1,783.46 1,689.82 93.64
Bonds and borrowings 127.1 120.8 6.3
Consolidated Cash Flows (Billions of yen)
2019 2018 Incr./(Dcr.)
Net cash flows from operating activities 244.5 195.6 48.9
Net cash flows from investing activities (94.3) (157.9) 63.6
Net cash flows from financing activities (126.2) (108.6) (17.6)
Total assets increased 192.9 billion yen from December 31, 2018 to 1,653.9 billion yen. The principal
increases in assets were a 164.8 billion yen increase in right-of-use assets due to the application of IFRS 16,
a 23.7 billion yen increase in cash and cash equivalents, and a 17.9 billion yen increase in property, plant and
equipment. The principal decrease in assets was a 14.3 billion yen decrease in trade and other receivables.
Total liabilities increased 157.0 billion yen from December 31, 2018 to 782.5 billion yen. The principal
increase in liabilities was a 161.1 billion yen increase in lease liabilities due to the application of IFRS 16.
Total equity increased 35.9 billion yen from December 31, 2018 to 871.4 billion yen. The principal increase
in equity was net income totaling 150.3 billion yen. The principal decreases in equity were dividends totaling
61.7 billion yen and purchase of treasury shares from the market totaling 50.0 billion yen. In addition, the
Company retired 6.7 million treasury shares on July 12, 2019.
The ratio of equity attributable to owners of the parent to total assets was 51.9% compared with 56.3% at
December 31, 2018. The Kao Group maintained return on equity at the high level of 17.6%.
Net cash flows from operating activities totaled 244.5 billion yen. The principal increases in net cash were
12
Fiscal Year Ended December 31, 2019
income before income taxes of 210.6 billion yen, depreciation and amortization of 83.4 billion yen and
decrease in trade and other receivables of 12.9 billion yen. The principal decrease in net cash was income
taxes paid of 56.7 billion yen.
Net cash flows from investing activities totaled negative 94.3 billion yen. This primarily consisted of
purchase of property, plant and equipment of 84.0 billion yen for capacity expansion at production bases in
Japan and proactive capital investments in Asia, where growth is notable.
Net cash flows from financing activities totaled negative 126.2 billion yen. The Company emphasizes steady
and continuous dividends and flexibly repurchases and retires treasury shares to improve capital efficiency
from the perspective of EVA. During fiscal 2019, this primarily consisted of 61.8 billion yen for dividends paid
to owners of the parent and non-controlling interests and 50.0 billion yen for purchase of treasury shares.
Free cash flow, the sum of net cash flows from operating activities and net cash flows from investing
activities adjusted for depreciation of right-of-use assets and other expenses, was 128.5 billion yen.
The balance of cash and cash equivalents at December 31, 2019 increased 23.7 billion yen compared with
December 31, 2018 to 289.7 billion yen, including the effect of exchange rate changes.
2) Forecast of Assets, Liabilities, Equity and Cash Flows for the Fiscal Year Ending December 31,
2020
Net cash flows from operating activities are forecast to be approximately 250.0 billion yen, due in part to an
increase in income. This amount includes the effect of the adoption of IFRS 16 “Leases” in fiscal 2019.
Excluding this factor, net cash flows from operating activities are expected to be approximately 230.0 billion
yen.
Net cash flows from investing activities are forecast to be approximately 90.0 billion yen due to scheduled
proactive investments for further growth encompassing enhancement and rationalization of production
capacity, greater distribution efficiency and other purposes.
In net cash flows from financing activities, the Kao Group expects to pay cash dividends and to make other
expenditures.
As a result of the above, the balance of cash and cash equivalents as of December 31, 2020 is forecast to be
approximately 360.0 billion yen, an increase of approximately 70.0 billion yen from a year earlier.
(3) Basic Policies regarding Distribution of Profits and Dividends for the Fiscal Years Ended
December 31, 2019 and Ending December 31, 2020
The Kao Group uses economic value added (EVA) as its principal management metric and clearly sets the
uses of its steadily generated cash flow as shown below from that viewpoint. Shareholder returns are one
such use, and they are implemented after considering future demand for funds and the situation in financial
13

Fiscal Year Ended December 31, 2019
markets.
Use of cash flow:
■ Investment for future growth (capital expenditures, M&A, etc.)
■ Steady and continuous dividends (40% payout ratio target)
■ Share repurchases and early repayment of interest-bearing debt including borrowings
In accordance with these policies, the Company plans to pay a year-end dividend for fiscal 2019 of 65 yen
per share, an increase of 5 yen per share compared with the previous fiscal year. Consequently, annual cash
dividends will increase 10 yen per share compared with the previous fiscal year, resulting in a total of 130
yen per share. The consolidated payout ratio will be 42.4%.
For fiscal 2020, the Company plans to pay total cash dividends of 140 yen per share (41.8% payout ratio),
an increase of 10 yen per share compared with the previous fiscal year. This plan is in accordance with the
Company’s basic policies regarding distribution of profits, and free cash flow and other factors have also
been taken into consideration. As a result, the Company is aiming for its 31st consecutive fiscal year of
increases in dividends.
The figures presented above in section 2) Forecast of Assets, Liabilities, Equity and Cash Flows for the Fiscal
Year Ending December 31, 2020 under (2) Summary of Financial Position and in (3) Basic Policies regarding
Distribution of Profits and Dividends for the Fiscal Years Ended December 31, 2019 and Ending December 31,
2020 have been calculated based on operating income of 230.0 billion yen as stated in the forecast of
consolidated operating results for the fiscal year ending December 31, 2020.
14

Fiscal Year Ended December 31, 2019
2. Management Policies
1) Basic Management Policies of the Kao Group
The Kao Group’s mission is to strive for the wholehearted satisfaction and enrichment of the lives of people
globally and to contribute to the sustainability of the world, with products and brands of excellent value that
are created from the consumer’s and customer’s perspective.
All members of the Kao Group share the Kao Way, which is our corporate philosophy, and have been putting
it into practice every day as the foundation of our approaches and actions. Moreover, to continue our
profitable growth, in recent years we have created a post-deflation growth model and have been
implementing governance reforms aimed at achieving a compact, highly diverse Board of Directors, among
other measures, and we have endeavored to contribute to consumers, customers and society by providing
products that facilitate clean, beautiful and healthy living, as well as industrial-use products that contribute
to the development of industry.
However, social conditions and the natural environment are changing significantly and globally at a rapid
pace, and people’s values are diversifying accordingly. To deal with this situation, we consider it important
not only to respond promptly to change, but also to take initiatives that anticipate change. The key point is
ESG. We have announced a major shift to ESG-driven management. By contributing to people, society and
the planet while continuing our profitable growth, we aim to enhance our corporate value at a higher level.
2) Medium-to-long-term Management Strategies of the Kao Group and Management Metric Used
as a Target
(1) Long-term Management Strategy
In December 2016, the Kao Group set forth “making Kao a company with a global presence” as its vision to
be achieved by 2030 by realizing sustained profitable growth while contributing to the sustainability of the
world. To achieve this vision, it will be important to reinforce existing businesses based on “Yoki-Monozukuri1”
from an ESG perspective and to create new businesses and expand business fields from an ESG perspective.
Through activities under the slogan “Transforming Ourselves to Drive Change,” rather than a continuation of
what it has been doing, the Kao Group aims to become a company with a global presence.
Make the Kao Group a company with a global presence
■ A distinctive corporate image
■ A high-profit global consumer goods company that exceeds:
- 2.5 trillion yen in net sales (1.0 trillion yen outside Japan)
- 17% operating margin
- 20% ROE 1 The Kao Group defines Yoki-Monozukuri as a strong commitment by all members to provide products and brands of
excellent value for consumer satisfaction. In Japanese, Yoki literally means “good/excellent,” and Monozukuri means “development/manufacturing of products.”
15

Fiscal Year Ended December 31, 2019
■ A high level of returns to stakeholders
(2) Mid-term Business Plan
Fiscal 2020 is the final year of the Kao Group Mid-term Plan 2020 (K20), the four-year business plan from
fiscal 2017. It is a crucial year that will be a linchpin for realizing the Kao Group’s vision for 2030. Among the
three goals of K20, the Kao Group will steadily implement “fostering a distinctive corporate image” through
innovation while linking the “Kirei2 Lifestyle Plan,” the ESG strategy it announced in 2019, with its business
strategy. For the goal of “returns to stakeholders,” the Kao Group will continue to provide a high level of
returns to its many stakeholders, including consumers, customers, employees, business partners and
shareholders. In the rapidly changing business environment, the Kao Group aims to achieve the goal of
“profitable growth” by raising the level of its “Yoki-Monozukuri” and fully communicating product value.
Regarding its commitment to profitable growth, taking into account factors including the current status of
the Chemical Business, the progress of businesses with issues, and the possibility of a decrease in inbound
demand, the Kao Group has revised its target for net sales CAGR3 on a like-for-like4 basis to +3% from
+5%. The Kao Group aims for an operating margin of 15%, as planned.
K20 Goals – Three Commitments
■ Commitment to fostering a distinctive corporate image
■ Commitment to profitable growth
- Continue to set new record highs for profits
- Aim for like-for-like net sales CAGR of +3%, operating margin of 15%
- Three 100 billion yen brands (Merries baby diapers, Attack laundry detergents, Bioré skin care products)
■ Commitment to returns to stakeholders
- Shareholders: Continuous cash dividend increases (40% payout ratio target)
- Employees: Continuous improvement in compensation, benefits and health support
- Customers: Maximization of win-win relationships
- Society: Advanced measures to address social issues
(3) Management Metric Used as a Target
As its principal management metric, the Kao Group uses EVA, which measures true profit by factoring in the
cost of invested capital. This essentially takes the perspective of shareholders and other asset owners to
deploy capital efficiently and generate profits. The Kao Group believes that continuously increasing EVA will
lead to increases in corporate value and thus corresponds with long-term benefits, not only for shareholders,
but for all stakeholders. The target of the Kao Group’s business activities is to increase EVA while expanding
its business scale. The Kao Group uses this metric to assess its businesses, to make evaluations on
investment in facilities, acquisitions and other items, and to develop performance targets for each fiscal year
and for its compensation system.
2 Kirei is a Japanese word that represents the concept of cleanliness, beauty, health, purity, and fairness. 3 CAGR: Compound annual growth rate 4 Like-for-like: Excluding the effect of currency translation, change of sales system, etc.
16

Fiscal Year Ended December 31, 2019
3) Issues for Management
With intensifying market competition, changing market structure and volatility in raw material market
conditions and currency exchange rates, the operating environment remains uncertain. Changes in the
attitudes of consumers regarding the environment, health and other matters and associated changes in their
purchasing attitudes, as well as the aging society, hygiene and other social issues, are growing in
significance. Moreover, amid the global expansion of business and the progress of structural changes in
various fields, companies must deal with changes in the risks entailed in their businesses. The Kao Group will
therefore address and deal appropriately with the following issues.
■ To respond to changes in risks pertaining to its business, the Kao Group defines risks that have a
particularly large impact on management and for which it must augment its response as corporate risks,
and will work to prevent damage to the corporate value of the Group as a whole by further reinforcing
its management system.
■ Given the current rapid progress of factors such as the diversification of consumer values associated
with technology innovation and the accompanying changes in purchasing behavior and the structure of
retailing, our business model targeting the mass market, which could formerly be conducted efficiently,
must be reviewed from all aspects, including research and development, production, logistics, sales and
marketing. To resolve these issues, the Kao Group will proactively promote the enhancement of
Essential Research5 and the use of artificial intelligence, the Internet of Things, robotics and other
cutting-edge technologies.
■ To promote an ESG strategy unique to Kao, the Kirei Lifestyle Plan, all members of the Kao Group must
have a proper understanding of its purpose and content, and fulfill their respective roles and
responsibilities. To that end, the Kao Group will step up its awareness-raising activities to implement the
Kirei Lifestyle Plan at the global level. It will also be necessary to go through the PDCA (plan, do, check,
act) cycle under a sound governance system. In addition to creating standards and evaluation
mechanisms for the smooth progress of the Kirei Lifestyle Plan, the Kao Group will step up its activities
even further by making use of the Board of Directors and third-party checks and opinions from External
ESG Advisory Board to make sure it does not become complacent.
3. Basic Approach to Selection of Accounting Standards
Having decided that unifying accounting standards within the Kao Group will contribute to improving the
quality of its business management, the Kao Group has voluntarily adopted International Financial Reporting
Standards (IFRS) from fiscal 2016. This will enable management based on standardized procedures and
information for each Group company and business, and the Kao Group intends to reinforce its management
foundation in order to enhance its corporate value as a global company. The Kao Group also believes that the
application of IFRS will facilitate the international comparability of its financial statements in capital markets. 5 Research that pursues the essence of things for both humans and materials from a scientific standpoint
17

Fiscal Year Ended December 31, 2019
Consolidated Statement of Financial Position(Millions of yen)
December 31, 2019 December 31, 2018 Change
AssetsCurrent assets
Cash and cash equivalents 289,681 265,978 23,703 Trade and other receivables 208,839 223,102 (14,263)Inventories 199,672 197,571 2,101 Other financial assets 13,788 15,146 (1,358)Income tax receivables 2,440 2,066 374 Other current assets 22,606 22,449 157 Total current assets 737,026 726,312 10,714
Non-current assetsProperty, plant and equipment 436,831 418,935 17,896 Right-of-use assets 164,822 - 164,822 Goodwill 179,707 180,286 (579)Intangible assets 47,770 46,549 1,221
8,287 7,931 356 Other financial assets 26,104 23,540 2,564 Deferred tax assets 47,876 49,158 (1,282)Other non-current assets 5,496 8,275 (2,779)Total non-current assets 916,893 734,674 182,219
Total assets 1,653,919 1,460,986 192,933
Investments accounted for using the equity method
18

Fiscal Year Ended December 31, 2019
(Millions of yen)
December 31, 2019 December 31, 2018 Change
Liabilities and equityLiabilities
Current liabilitiesTrade and other payables 222,314 225,560 (3,246)Bonds and borrowings 25,505 40,488 (14,983)Lease liabilities 19,653 - 19,653 Other financial liabilities 6,766 6,880 (114)Income tax payables 36,208 34,198 2,010 Provisions 2,054 2,873 (819)Contract liabilities 20,616 18,387 2,229 Other current liabilities 99,411 102,452 (3,041)Total current liabilities 432,527 430,838 1,689
Non-current liabilitiesBonds and borrowings 101,636 80,339 21,297 Lease liabilities 141,438 - 141,438 Other financial liabilities 7,527 9,506 (1,979)Retirement benefit liabilities 80,579 84,552 (3,973)Provisions 10,122 12,175 (2,053)Deferred tax liabilities 3,747 2,864 883 Other non-current liabilities 4,922 5,203 (281)Total non-current liabilities 349,971 194,639 155,332
Total liabilities 782,498 625,477 157,021
EquityShare capital 85,424 85,424 - Capital surplus 108,715 108,245 470 Treasury shares (4,309) (11,282) 6,973 Other components of equity (32,974) (30,029) (2,945)Retained earnings 700,839 670,002 30,837 Equity attributable to owners of the parent 857,695 822,360 35,335 Non-controlling interests 13,726 13,149 577 Total equity 871,421 835,509 35,912
Total liabilities and equity 1,653,919 1,460,986 192,933
19

Fiscal Year Ended December 31, 2019
Consolidated Statement of Income(Millions of yen)
Fiscal year ended Fiscal year ended December 31, 2019 December 31, 2018 Change
Net sales 1 1,502,241 1,508,007 (5,766)Cost of sales (848,723) (853,989) 5,266Gross profit 653,518 654,018 (500)
Selling, general and administrative expenses 2 (442,912) (444,845) 1,933Other operating income 15,192 14,288 904Other operating expenses (14,075) (15,758) 1,683Operating income 1 211,723 207,703 4,020
Financial income 2,027 1,717 310Financial expenses (5,231) (4,251) (980)
2,126 2,082 44Income before income taxes 210,645 207,251 3,394
Income taxes (60,296) (51,920) (8,376)Net income 150,349 155,331 (4,982)
Attributable to:Owners of the parent 148,213 153,698 (5,485)Non-controlling interests 2,136 1,633 503Net income 150,349 155,331 (4,982)
Earnings per shareBasic (Yen) 3 306.70 314.25 Diluted (Yen) 3 306.63 314.12
Notes
Share of profit in investments accounted for using the equity method
20

Fiscal Year Ended December 31, 2019
Consolidated Statement of Comprehensive Income(Millions of yen)
Fiscal year ended Fiscal year ended December 31, 2019 December 31, 2018 Change
Net income 150,349 155,331 (4,982)
Other comprehensive income
Items that will not be reclassified to profit or loss:
(6) (2) (4)(1,180) (15,524) 14,344
(17) (345) 328 Total of items that will not be reclassified to profit or loss (1,203) (15,871) 14,668
Items that may be reclassified subsequently to profit or loss:Exchange differences on translation of foreign operations (2,489) (16,140) 13,651
(36) (73) 37
(2,525) (16,213) 13,688
Other comprehensive income, net of taxes (3,728) (32,084) 28,356 Comprehensive income 146,621 123,247 23,374
Attributable to:Owners of the parent 144,508 122,324 22,184 Non-controlling interests 2,113 923 1,190 Comprehensive income 146,621 123,247 23,374
Share of other comprehensive income of investments accounted for using the equity methodTotal of items that may be reclassified subsequently to profit or loss
Net gain (loss) on revaluation of financial assets measured at fair value through other comprehensive income Remeasurements of defined benefit plans Share of other comprehensive income of investments accounted for using the equity method
21

Fiscal Year Ended December 31, 2019
Consolidated Statement of Changes in Equity(Millions of yen)
Sharecapital
Capitalsurplus
Treasuryshares
Subscriptionrights toshares
Exchangedifferences
ontranslationof foreignoperations
Net gain(loss) on
derivativesdesignated
as cash flowhedges
Net gain(loss) on
revaluationof financial
assetsmeasured at
fair valuethroughother
compre-hensiveincome
Remeasure-ments ofdefined
benefit plans
Total
85,424 108,245 (11,282) 546 (37,032) (1) 6,458 - (30,029) 670,002 822,360 13,149 835,509
- - - - - - - - - 740 740 - 740
85,424 108,245 (11,282) 546 (37,032) (1) 6,458 - (30,029) 670,742 823,100 13,149 836,249
Net income - - - - - - - - - 148,213 148,213 2,136 150,349
Other comprehensive income - - - - (2,598) 1 (23) (1,085) (3,705) - (3,705) (23) (3,728)
Comprehensive income - - - - (2,598) 1 (23) (1,085) (3,705) 148,213 144,508 2,113 146,621
Disposal of treasury shares - (108) 57,006 (98) - - - - (98) (56,799) 1 - 1
Purchase of treasury shares - - (50,033) - - - - - - - (50,033) - (50,033)
Share-based payment transactions - 337 - - - - - - - - 337 - 337
Dividends - - - - - - - - - (60,459) (60,459) (1,290) (61,749)
- 241 - - - - - - - - 241 (246) (5)
- - - - - - (227) 1,085 858 (858) - - - Total transactions with the owners - 470 6,973 (98) - - (227) 1,085 760 (118,116) (109,913) (1,536) (111,449)
December 31, 2019 85,424 108,715 (4,309) 448 (39,630) - 6,208 - (32,974) 700,839 857,695 13,726 871,421
Note:
January 1, 2018 85,424 107,980 (9,593) 731 (21,540) 4 8,490 - (12,315) 634,885 806,381 12,983 819,364
Net income - - - - - - - - - 153,698 153,698 1,633 155,331
Other comprehensive income - - - - (15,492) (5) (338) (15,539) (31,374) - (31,374) (710) (32,084)
Comprehensive income - - - - (15,492) (5) (338) (15,539) (31,374) 153,698 122,324 923 123,247
Disposal of treasury shares - (99) 48,345 (167) - - - - (167) (47,961) 118 - 118
Purchase of treasury shares - - (50,034) - - - - - - - (50,034) - (50,034)
Share-based payment transactions - 364 - - - - - - - - 364 - 364
Dividends - - - - - - - - - (56,793) (56,793) (746) (57,539)
- -
- (18) - - (1,694) 15,539 13,827 (13,827) - - -
Other increase (decrease) - - - - - - - - - - - (11) (11)
Total transactions with the owners - 265 (1,689) (185) - - (1,694) 15,539 13,660 (118,581) (106,345) (757) (107,102)
December 31, 2018 85,424 108,245 (11,282) 546 (37,032) (1) 6,458 - (30,029) 670,002 822,360 13,149 835,509
Changes in the ownership interest in subsidiariesTransfer from other components of equity to retained earnings
Transfer from other components of equity to retained earnings
Total equity
Equity attributable to owners of the parent
Other components of equity
Non-controllinginterests
Retainedearnings Total
January 1, 2019 (as previously reported)
Changes in accounting policy1
January 1, 2019 (after adjustment)
1. The adoption of IFRS 16 "Leases"
22

Fiscal Year Ended December 31, 2019
Consolidated Statement of Cash Flows(Millions of yen)
Fiscal year ended Fiscal year ended December 31, 2019 December 31, 2018
Cash flows from operating activitiesIncome before income taxes 210,645 207,251 Depreciation and amortization 83,369 60,662 Interest and dividend income (1,885) (1,578)Interest expense 2,840 1,256
(2,126) (2,082)
3,323 4,531 (Increase) decrease in trade and other receivables 12,862 (12,591)(Increase) decrease in inventories (2,848) (15,677)Increase (decrease) in trade and other payables 696 3,951 Increase (decrease) in retirement benefit liabilities (3,788) 20,740 Other (2,936) (21,437)
Subtotal 300,152 245,026 Interest received 1,711 1,273 Dividends received 2,146 2,312 Interest paid (2,806) (1,293)Income taxes paid (56,680) (51,708)Net cash flows from operating activities 244,523 195,610
Cash flows from investing activitiesPayments into time deposits (35,188) (26,768)Proceeds from withdrawal of time deposits 36,660 26,987 Purchase of property, plant and equipment (83,959) (80,295)Purchase of intangible assets (9,819) (7,703)Payments for business combinations (195) (73,915)Other (1,765) 3,799 Net cash flows from investing activities (94,266) (157,895)
Cash flows from financing activitiesIncrease (decrease) in short-term borrowings 19 230 Proceeds from long-term borrowings 46,220 - Repayments of long-term borrowings (40,054) (67)Proceeds from issuance of bonds - 25,060 Redemption of bonds (12) (24,939)Repayments of lease liabilities (20,565) - Purchase of treasury shares (50,033) (50,035)Dividends paid to owners of the parent (60,512) (56,838)Dividends paid to non-controlling interests (1,287) (745)Other 58 (1,245)Net cash flows from financing activities (126,166) (108,579)
Net increase (decrease) in cash and cash equivalents 24,091 (70,864)Cash and cash equivalents at the beginning of the year 265,978 343,076 Effect of exchange rate changes on cash and cash equivalents (388) (6,234)Cash and cash equivalents at the end of the year 289,681 265,978
Share of profit in investments accounted for using the equity method(Gains) losses on sale and disposal of property, plant and equipment, and intangible assets
23
Fiscal Year Ended December 31, 2019
Notes to Consolidated Financial Statements
Changes in Accounting Policies
Adoption of IFRS 16 “Leases"
The Kao Group adopted IFRS 16 “Leases” (issued in January 2016; hereafter, “IFRS 16”) in the fiscal year
ended December 31, 2019. As a transitional measure upon the adoption of IFRS 16, the Kao Group applies
this Standard retrospectively with the cumulative effect of initially applying this Standard recognized at the
date of initial application.
In transitioning to IFRS 16, the Kao Group has chosen the practical expedient detailed in IFRS 16 paragraph
C3 and grandfathered its assessments of whether contracts contain leases based on IAS 17 “Leases”
(hereafter, “IAS 17”) and IFRIC 4 “Determining whether an Arrangement contains a Lease.” From the date
of application, this assessment is determined based on the provisions of IFRS 16.
For leases that the Kao Group as lessee previously classified as operating leases applying IAS 17,
right-of-use assets and lease liabilities are recognized at the date of initial application. These lease liabilities
have been measured at the present value of the remaining lease payments discounted using the lessee’s
incremental borrowing rate at the date of initial application. The weighted average of the lessee’s
incremental borrowing rates is 1.0%. Right-of-use assets are initially measured at the initial measurement
amount of the lease liability adjusted for the prepaid lease payments and other factors.
For leases that the Kao Group as lessee previously classified as finance leases applying IAS 17, the carrying
amounts of right-of-use assets and lease liabilities at the date of initial application are the carrying amounts
of lease assets and lease liabilities, respectively, immediately before that date measured applying IAS 17.
The following is a reconciliation of non-cancellable operating lease contracts applying IAS 17 as of December
31, 2018 and lease liabilities recognized in the consolidated statement of financial position at the date of
initial application.
(Millions of yen) Non-cancellable operating lease contracts as of December 31, 2018 Finance lease liabilities as of December 31, 2018 Cancellable operating lease contracts, etc.
Lease liabilities as of January 1, 2019
25,018 2,419
139,998 167,435
Right-of-use assets recognized at the date of initial application in the consolidated statement of
financial position were 171,890 million yen.
The following practical expedients are used in the application of IFRS 16.
● A single discount rate is applied to portfolios of leases with reasonably similar characteristics.
● As an alternative to performing an impairment review, the Kao Group relies on its assessment of
whether leases are onerous applying IAS 37 “Provisions, Contingent Liabilities and Contingent Assets”
immediately before the date of initial application.
● Initial direct costs are excluded from the measurement of right-of-use assets at the date of initial
application.
24
Fiscal Year Ended December 31, 2019
1. Segment Information
(1) Summary of reportable segments
The Kao Group’s reportable segments are the components of the Kao Group for which discrete financial
information is available and which are regularly reviewed by the Board of Directors in deciding how to
allocate resources and in assessing their performance. Net sales and operating income are the key
measures used by the Board of Directors to evaluate the performance of each segment.
The Kao Group is an organization comprising five main businesses – the Cosmetics Business, the Skin
Care and Hair Care Business, the Human Health Care Business, the Fabric and Home Care Business
(collectively, the “Consumer Products Business”) and the Chemical Business. In each business, the Kao
Group plans comprehensive strategies and carries out activities on a global basis.
Therefore, the Kao Group has five reportable segments: the Cosmetics Business, the Skin Care and Hair
Care Business, the Human Health Care Business, the Fabric and Home Care Business and the Chemical
Business.
Information on principal customers is omitted, because no transactions with a single external customer account for 10% or more of the Kao Group’s net sales.
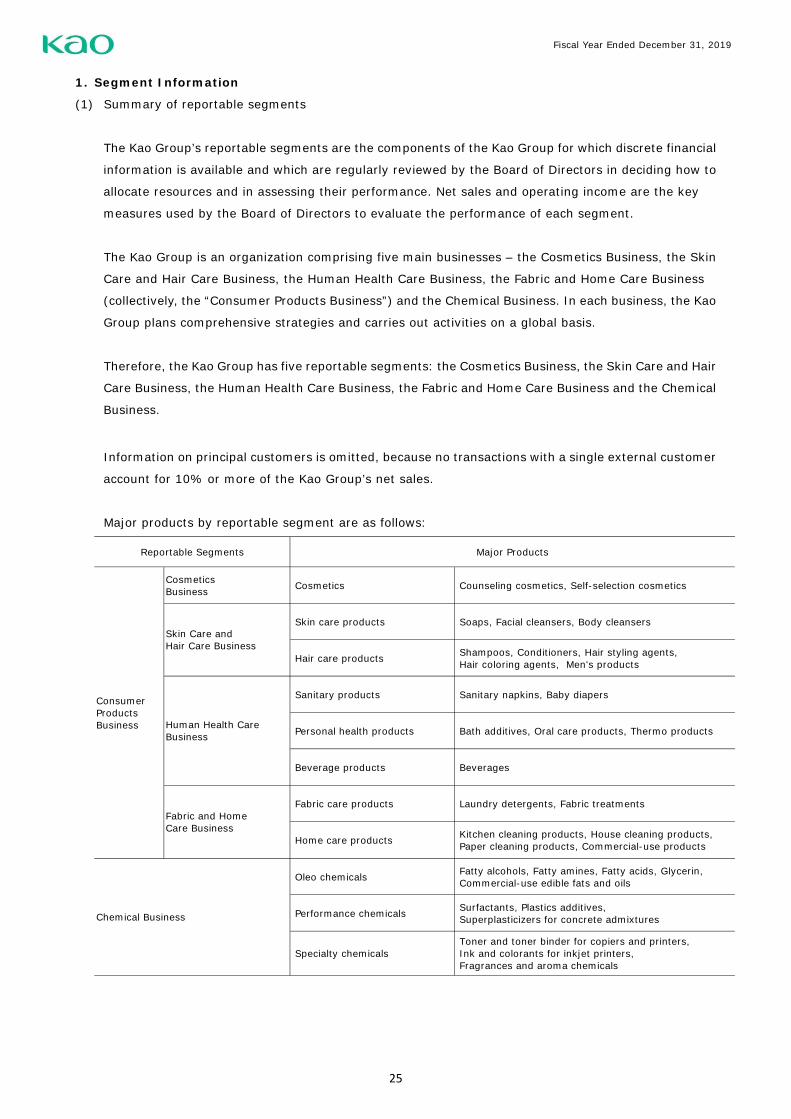
Major products by reportable segment are as follows:
CosmeticsBusiness Cosmetics Counseling cosmetics, Self-selection cosmetics
Skin care products Soaps, Facial cleansers, Body cleansers
Hair care products Shampoos, Conditioners, Hair styling agents, Hair coloring agents, Men's products
Sanitary products Sanitary napkins, Baby diapers
Personal health products Bath additives, Oral care products, Thermo products
Beverage products Beverages
Fabric care products Laundry detergents, Fabric treatments
Home care products Kitchen cleaning products, House cleaning products, Paper cleaning products, Commercial-use products
Oleo chemicals Fatty alcohols, Fatty amines, Fatty acids, Glycerin, Commercial-use edible fats and oils
Performance chemicals Surfactants, Plastics additives, Superplasticizers for concrete admixtures
Specialty chemicals Toner and toner binder for copiers and printers, Ink and colorants for inkjet printers, Fragrances and aroma chemicals
Chemical Business
Reportable Segments Major Products
ConsumerProductsBusiness Human Health Care
Business
Fabric and HomeCare Business
Skin Care andHair Care Business
25

Fiscal Year Ended December 31, 2019
(2) Sales and results of reportable segments (Millions of yen)
Fiscal year ended December 31, 2019
CosmeticsBusiness
Skin Care andHair CareBuiness
Human HealthCare Business
Fabric andHome CareBusiness
Subtotal
Net salesSales to customers 301,547 340,757 255,224 359,507 1,257,035 245,206 1,502,241 - 1,502,241 Intersegment sales and transfers2 - - - - - 40,729 40,729 (40,729) - Total net sales 301,547 340,757 255,224 359,507 1,257,035 285,935 1,542,970 (40,729) 1,502,241
Operating income 41,398 49,524 17,166 71,774 179,862 30,839 210,701 1,022 211,723 % of net sales 13.7 14.5 6.7 20.0 14.3 10.8 - - 14.1 Financial income 2,027 Financial expenses (5,231)Share of profit in investments accounted for using the equity method
2,126
Income before income taxes 210,645
Depreciation and amortization 14,865 13,814 21,627 17,899 68,205 14,205 82,410 959 83,369 Capital expenditure3 17,962 18,389 27,314 22,139 85,804 24,189 109,993 3,394 113,387
Notes:1. The operating income reconciliation of 1,022 million yen includes corporate expenses not allocated to reportable segments, as well as elimination of intersegment inventory transactions.2. Intersegment sales and transfers are mainly calculated based on market price and manufacturing cost.3. Capital expenditures include investments in property, plant and equipment, right-of-use assets and intangible assets.
(Millions of yen)Fiscal year ended December 31, 2018
CosmeticsBusiness
Skin Care andHair CareBuiness
Human HealthCare Business
Fabric andHome CareBusiness
Subtotal
Net salesSales to customers 279,635 341,419 267,702 344,105 1,232,861 275,146 1,508,007 - 1,508,007 Intersegment sales and transfers2 - - - - - 37,661 37,661 (37,661) - Total net sales 279,635 341,419 267,702 344,105 1,232,861 312,807 1,545,668 (37,661) 1,508,007
Operating income 27,710 48,827 27,907 71,249 175,693 30,631 206,324 1,379 207,703 % of net sales 9.9 14.3 10.4 20.7 14.3 9.8 - - 13.8 Financial income 1,717 Financial expenses (4,251)Share of profit in investments accounted for using the equity method
2,082
Income before income taxes 207,251
Depreciation and amortization 10,908 9,593 17,602 10,299 48,402 12,000 60,402 260 60,662 Capital expenditure3 11,597 17,021 19,259 18,107 65,984 23,032 89,016 81 89,097
Notes:1. The operating income reconciliation of 1,379 million yen includes corporate expenses not allocated to reportable segments, as well as elimination of intersegment inventory transactions.2. Intersegment sales and transfers are mainly calculated based on market price and manufacturing cost.3. Capital expenditures include investments in property, plant and equipment and intangible assets.
Consolidated
Reportable SegmentsConsumer Products Business
ChemicalBusiness Total Reconciliations1 Consolidated
Reportable SegmentsConsumer Products Business
ChemicalBusiness Total Reconciliations1
26
Fiscal Year Ended December 31, 2019
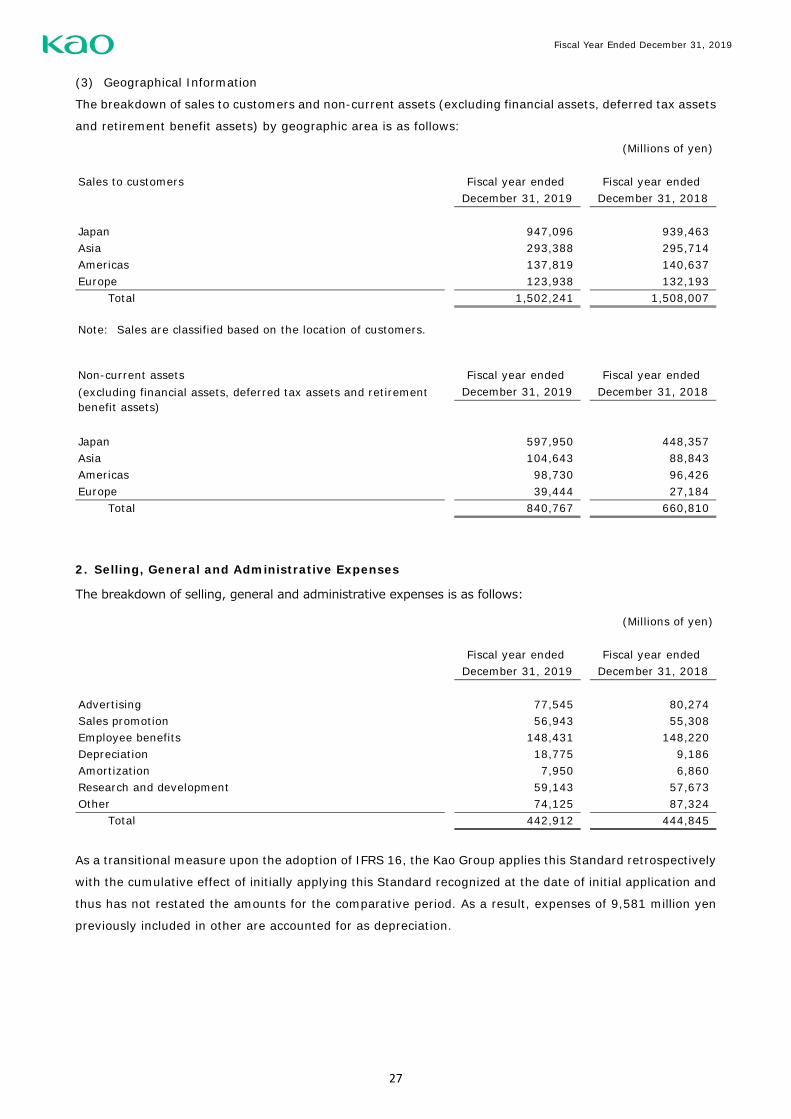
(3) Geographical Information
The breakdown of sales to customers and non-current assets (excluding financial assets, deferred tax assets
and retirement benefit assets) by geographic area is as follows:
2. Selling, General and Administrative Expenses
The breakdown of selling, general and administrative expenses is as follows:
As a transitional measure upon the adoption of IFRS 16, the Kao Group applies this Standard retrospectively
with the cumulative effect of initially applying this Standard recognized at the date of initial application and
thus has not restated the amounts for the comparative period. As a result, expenses of 9,581 million yen
previously included in other are accounted for as depreciation.
(Millions of yen)
Sales to customers Fiscal year ended Fiscal year ended December 31, 2019 December 31, 2018
Japan 947,096 939,463 Asia 293,388 295,714 Americas 137,819 140,637 Europe 123,938 132,193
Total 1,502,241 1,508,007
Note: Sales are classified based on the location of customers.
Non-current assets Fiscal year ended Fiscal year ended December 31, 2019 December 31, 2018
Japan 597,950 448,357 Asia 104,643 88,843 Americas 98,730 96,426 Europe 39,444 27,184
Total 840,767 660,810
(excluding financial assets, deferred tax assets and retirementbenefit assets)
(Millions of yen)
Fiscal year ended Fiscal year ended December 31, 2019 December 31, 2018
Advertising 77,545 80,274 Sales promotion 56,943 55,308 Employee benefits 148,431 148,220 Depreciation 18,775 9,186 Amortization 7,950 6,860 Research and development 59,143 57,673 Other 74,125 87,324
Total 442,912 444,845
27
Fiscal Year Ended December 31, 2019
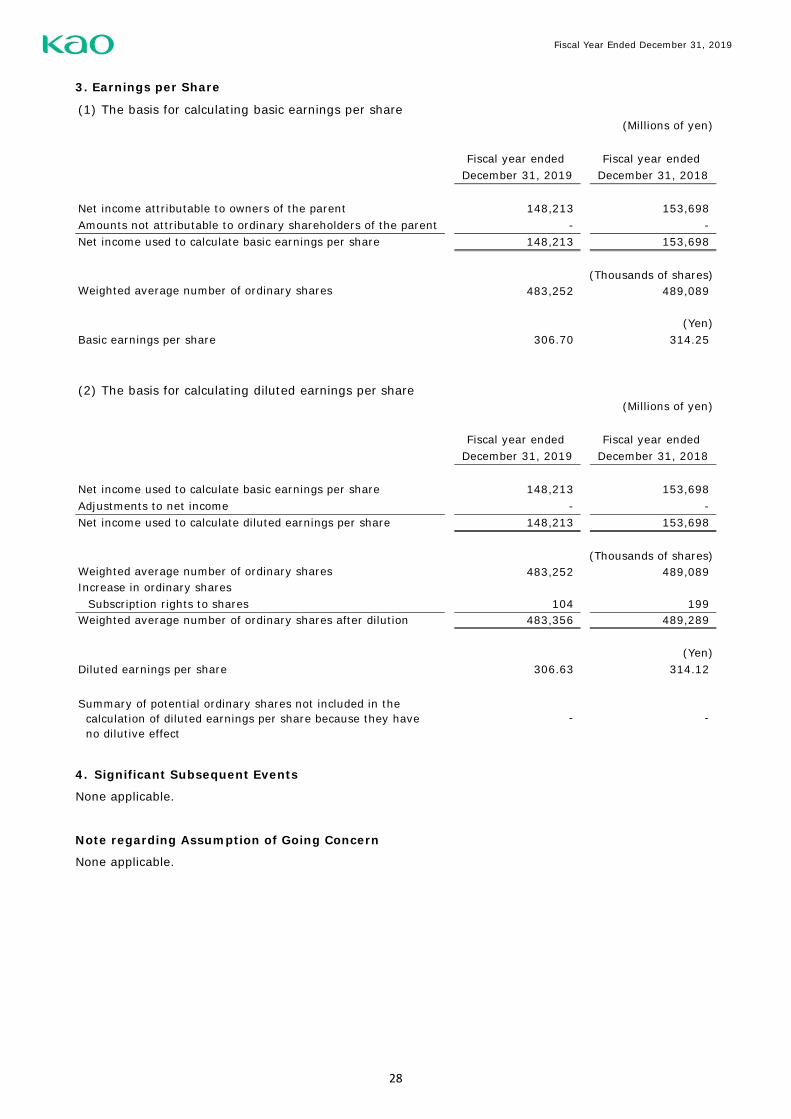
3. Earnings per Share
4. Significant Subsequent Events
None applicable.
Note regarding Assumption of Going Concern
None applicable.
(1) The basis for calculating basic earnings per share(Millions of yen)
Fiscal year ended Fiscal year ended December 31, 2019 December 31, 2018
Net income attributable to owners of the parent 148,213 153,698 Amounts not attributable to ordinary shareholders of the parent - -
148,213 153,698
(Thousands of shares)483,252 489,089
(Yen)Basic earnings per share 306.70 314.25
(2) The basis for calculating diluted earnings per share(Millions of yen)
Fiscal year ended Fiscal year ended December 31, 2019 December 31, 2018
148,213 153,698 Adjustments to net income - -
148,213 153,698
(Thousands of shares)483,252 489,089
Increase in ordinary sharesSubscription rights to shares 104 199
483,356 489,289
(Yen)Diluted earnings per share 306.63 314.12
- -
Net income used to calculate basic earnings per share
Weighted average number of ordinary shares
Net income used to calculate basic earnings per share
Net income used to calculate diluted earnings per share
Weighted average number of ordinary shares
Weighted average number of ordinary shares after dilution
Summary of potential ordinary shares not included in the calculation of diluted earnings per share because they have no dilutive effect
28