Embed Size (px)
Citation preview

Consumer Cash Usage: A Cross-CountryComparison with Payment Diary Survey Data∗
John Bagnall,a David Bounie,b Kim P. Huynh,c
Anneke Kosse,d Tobias Schmidt,e Scott Schuh,f
and Helmut Stixg
aReserve Bank of AustraliabTelecom ParisTech
cBank of CanadadDe Nederlandsche BankeDeutsche Bundesbank
fFederal Reserve Bank of BostongOesterreichische Nationalbank
We measure consumers’ use of cash by harmonizing pay-ment diary surveys from seven countries. The seven diarysurveys were conducted in 2009 (Canada), 2010 (Australia),2011 (Austria, France, Germany, and the Netherlands), and2012 (the United States). Our paper finds cross-countrydifferences—for example, the level of cash usage differs acrosscountries. Cash has not disappeared as a payment instrument,especially for low-value transactions. We also find that the useof cash is strongly correlated with transaction size, demograph-ics, and point-of-sale characteristics such as merchant cardacceptance and venue.
JEL Codes: E41, D12, E58.
∗The figures and tables are derived from payment diary survey data and maydiffer from previous published work from each respective country. We thank theEditor, Loretta Mester, and two anonymous referees for their constructive com-ments and suggestions. Special thanks to Angelika Welte for constructing theprograms and routines to create many of the tables and figures in this paper. Wethank Tamas Briglevics, Sean Connolly, Chris Henry, Lola Hernandez, VikramJambulapati, William Murdock III, and David Zhang for providing excellentresearch assistance. We thank Nicole Jonker for her input in the early stagesof the project; David Emery and Clare Noone for providing assistance with theAustralia results; Claire Greene and Glen Keenleyside for editorial assistance;and participants of various conferences and seminars for their comments and
1
2 International Journal of Central Banking December 2016
1. Introduction
During the past several decades, payment systems worldwide havebecome increasingly electronic, transformed by innovations in finan-cial markets and information technology—even in less-developedcountries that rely heavily on mobile phones; see Jack, Suri, andTownsend (2010) for a discussion of Kenya. Now, these electronicinnovations have spread to private virtual currencies, such as Bit-coin; see European Central Bank (2012) and Velde (2013). Duringthis breathtaking transformation, relatively little research has beendone comparing payment systems in different countries since theseminal work of Humphrey, Pulley, and Vesala (1996). In the rareinstances where comprehensive data are available for comparison,usually cash is excluded; see the studies by Bolt, Humphrey, andUittenbogaard (2008) and the Federal Reserve System (2013). How-ever, new research is revealing an emerging consensus that during thetransformation of payments from paper to electronics, cash holdingand use have not disappeared.1
Figure 1 depicts the surprising resilience of cash in the twenty-first century for a select group of industrial countries. In most of
suggestions. Finally, we thank Eugenie Foster of the International Associationof Currency Affairs (IACA) for arranging the 2010 IACA meetings in BuenosAires, Argentina. This venue facilitated early discussions of an international cashcomparison. The views expressed are solely those of the authors and not thoseof the Bank of Canada, De Nederlandsche Bank, the Deutsche Bundesbank, theFederal Reserve Bank of Boston or the Federal Reserve System, the Groupementdes Cartes Bancaires, the Oesterreichische Nationalbank, Reserve Bank of Aus-tralia, or the Eurosystem. Author contact: Bagnall: Reserve Bank of Australia,65 Martin Place, Sydney NSW 2000, Australia; Tel.: +61 2 9551 8794; E-mail:[email protected]. Bounie: Telecom ParisTech. 46, rue Barrault Paris Cedex13, F-75634, France; Tel.: +33 1 45 81 73 32; E-mail: [email protected]. Huynh: Bank of Canada, 234 Wellington St., Ottawa, ON K1A0G9, Canada; Tel.: +1 (613) 782 8698; E-mail: [email protected]. Kosse:De Nederlandsche Bank, P.O. Box 98 1000, AB Amsterdam, The Netherlands;Tel.: +31-(0)20-5242827; E-mail: [email protected]. Schmidt: Deutsche Bun-desbank, Wilhelm-Epstein-Str. 14, 60431 Frankfurt am Main, Germany; Tel.:+49 (0) 69 9566 3730; E-mail: [email protected]. Schuh: FederalReserve Bank of Boston, 600 Atlantic Avenue, Boston, MA 02210-2204, USA;Tel.: +1 617-973-3941; E-mail: [email protected]. Stix: OesterreichischeNationalbank, POB 61, 1011 Vienna, Austria; Tel.: +43 (0)1 40420 7211; E-mail:[email protected].
1Examples include Amromin and Chakravorti (2009), Lippi and Secchi (2009),and Evans et al. (2013).

Vol. 12 No. 4 Consumer Cash Usage 3
Figure 1. Ratios of Currency in Circulationto Nominal GDP
0.0
5.1
.15
1960 1970 1980 1990 2000 2010year
Euro US US (Domestic) AU CAAT DE FR NL
Sources: Haver Analytics, International Financial Statistics, and authors’ cal-culations.
these countries, the ratios of currency in circulation (CIC) relativeto nominal GDP generally declined at least through the 1980s oreven early 1990s. Since then, however, these ratios have stayed flator even increased. Likely, the CIC ratios for the United States (US)and the euro area (euro) have increased considerably because ofstrong foreign demand for the dollar and the euro; see Fischer,Kohler, and Seitz (2004) and Judson (2012). However, even the esti-mated domestic U.S. currency ratio has increased since 2000 and itsbehavior is similar to that of the ratios in the other non-euro coun-tries.2 The econometric evidence in Briglevics and Schuh (2013b)suggests that some of the recent U.S. increase may be the resultof a decline in short-term interest rates to nearly zero. Neverthe-less, persistent holding and use of cash in these industrial countriesduring the spread of electronic alternatives highlights a dire need for
2The domestic currency ratio could still be driven by domestic hoarding. Oneindicator of transaction demand is given by the ratio of medium-denominationbank notes to nominal GDP. Judson (2012) shows that the respective ratio for$20 decreased by half for the United States and Canada since the 1970s but hasremained fairly stable over the past ten years.

4 International Journal of Central Banking December 2016
an updated comparative study of payments that includes the use ofcash. Furthermore, evidence on consumer holding and use of cash iseven rarer.3
This paper attempts to fill this gap in the literature by comparingthe payment choices of consumers in the seven industrial countriesportrayed in figure 1 using a unique and growing data source.4 Thedata are collected from large-scale payment diary surveys conductedin Australia (AU), Austria (AT), Canada (CA), France (FR), Ger-many (DE), the Netherlands (NL), and the United States (US).5
Consumer payment diaries, which trace back at least to Boeschotenand Fase (1989) and Boeschoten (1992), feature rich information onindividual payments collected over a fixed number of days pairedwith information on the detailed characteristics of individual con-sumers.6 Payment diaries require consumers to record their trans-actions, so they should provide more accurate data than surveys,which rely on consumer recall.
The current paper offers two contributions relative to previ-ous work: (i) a careful, thorough harmonization and analysis ofthese international diary data; and (ii) an econometric analysis ofconsumers’ use of cash versus non-cash payment instruments thatemploys the microeconomic data from the payment diaries.
As with most international data, harmonization is essential to beable to make valid and useful cross-country comparisons.7 Althoughthe diary surveys are similar across countries, direct comparisonsof their respective statistics cannot be made without meticulous
3An early U.S. example is the Survey of Currency and Transactions AccountUsage described in Avery et al. (1986).
4Jonker, Kosse, and Hernandez (2012) and Arango et al. (2013) provide com-plementary comparisons of subsets of these seven countries.
5The payment diaries from these seven countries do not form an exhaustivelist of international sources of consumer payments data. Other sources includeTakacs (2011), Danish National Bank (2013), and UK Payments Council (2013).
6The Austrian National Bank has the longest history of successive diaries in1995, 2000, 2005, and 2011 starting with Mooslechner and Wehinger (1997).
7The efforts to harmonize consumer payment diaries were inspired by inter-national initiatives such as the Penn World Tables (Summers and Heston 1991),International Trade and Foreign Direct Investment (Feenstra et al. 2010), and theEuropean Central Bank’s wealth survey project (Eurosystem Household Financeand Consumption Network 2009).

Vol. 12 No. 4 Consumer Cash Usage 5
analysis and adjustment of the technical details of the diary surveydesign and concept definitions. Seemingly minor details, such as theinclusion (or exclusion) of recurring bill payments, can have substan-tial effects on the resulting statistics. Therefore, we have harmonizedthe underlying data sources and results from the seven individualcountry diaries so that the reported figures are comparable. In addi-tion, we have harmonized the definition of sociodemographic vari-ables, perceptions, and point-of-sale (POS) characteristics (e.g., cardacceptance and the spending location), which permits a disaggre-gated view of payment behavior. As a result, the statistics reportedin this paper may not coincide exactly with analogous data fromnational statistics. One factor that cannot be harmonized, however,is the supply of services and providers across the national paymentsystems. For example, paper checks still are relatively common inFrance and the United States but not in the other countries. Pri-marily for this reason, we do not attempt to model specific non-cashpayment instruments in each country.
Using the harmonized data, we shed light on two empirical issues.First, we demonstrate the extent of consumer cash holding and usein each of the seven economies. Second, the micro data allow us todiscover who uses cash, for which purchases, at which locations, andfor what value of payment. These data may help us determine whycash is used and whether or not it is likely to continue to be used inthe future.
Our econometric analysis of consumer cash use follows in thetradition of the recent literature that seeks to understand the deter-minants of consumer payment behavior more broadly. This literatureextends back at least to Stavins (2002), who estimated the effectsof consumer characteristics such as age, education, and income onconsumer use of payment instruments and certain banking practices.More recent papers on this subject, such as Borzekowski, Kiser, andShaista (2008), Ching and Hayashi (2010), Schuh and Stavins (2010),von Kalckreuth, Schmidt, and Stix (2014b), or Arango, Huynh, andSabetti (2015), inter alia, add a variety of other explanatory variablesto such regressions. Unlike most studies, which use data usually fromone country or only a few countries, this harmonized diary databasemakes it possible to assess the extent to which the determinants

6 International Journal of Central Banking December 2016
of payment choice are specific to a particular country or are moregeneral in nature.8
Our econometric analysis is a first step toward what ultimatelycan be done with the diary data and generates a few notable results.In the logit estimation of cash versus non-cash use, we find a sur-prising degree of similarity in the significant marginal effects ofdeterminants of payment use across countries, both qualitativelyand quantitatively. Not surprisingly, the similarity is stronger forconsumer payments made at grocery stores, which presumably arerelatively homogeneous payment opportunities across countries interms of goods, transaction sizes, and merchant acceptance of pay-ments. Much more econometric modeling could be done with thisharmonized diary database.
Using comprehensive, cross-country information on cash usage todevelop a more refined understanding of consumer payment choicesis important for policymakers and academics alike. In recent years,regulation of credit card and debit card interchange fees has cometo the forefront in a number of countries. Better insight into con-sumer behavior is essential for the determination and evaluation ofthese regulations. The study of cash demand and management alsois important for evaluation of the cost of payments,9 seigniorage rev-enue, central bank management of currency stocks, and the welfarecosts of inflation. The use of payment instruments to access bankaccounts is important for understanding bank supervision and reg-ulation, and may provide insights into consumer welfare associatedwith liquid asset management. The breadth and importance of all ofthese topics underscore the puzzling deficiency of statistical evidenceon cash use by consumers, and the importance of payment diariesas a resource for future research.
8We do not attempt to estimate models of consumer demand for cash, whichis the subject of another closely related branch of the literature including Danielsand Murphy (1994), Mulligan and Sala-i-Martin (2000), Attanasio, Guiso, andJappelli (2002), Bounie and Francois (2008), Lippi and Secchi (2009), and Brigle-vics and Schuh (2013b). These studies rely on consumer surveys, rather thandiaries, to collect cash-related data on consumers, and generally do not attemptto estimate consumer demand for other payment instruments.
9Schmiedel, Kostova, and Ruttenberg (2013) provide a summary of the ECBcost study.

Vol. 12 No. 4 Consumer Cash Usage 7
The paper is organized as follows. Section 2 presents salientaggregate results regarding the payment behavior in the seven coun-tries, which provide a foundation for the subsequent analysis. Section3 describes the payment diaries and steps taken to harmonize thedatabase. Section 4 presents the consumer expenditure patternsacross countries. Section 5 discusses the various factors that mayaffect the levels of cash usage across countries. Section 6 presentsthe estimation results for the econometric models of consumer choicebetween the use of cash versus non-cash payment instruments andprovides robustness analyses. Section 7 provides a discussion oncross-country differences, and section 8 concludes.
2. Salient Results
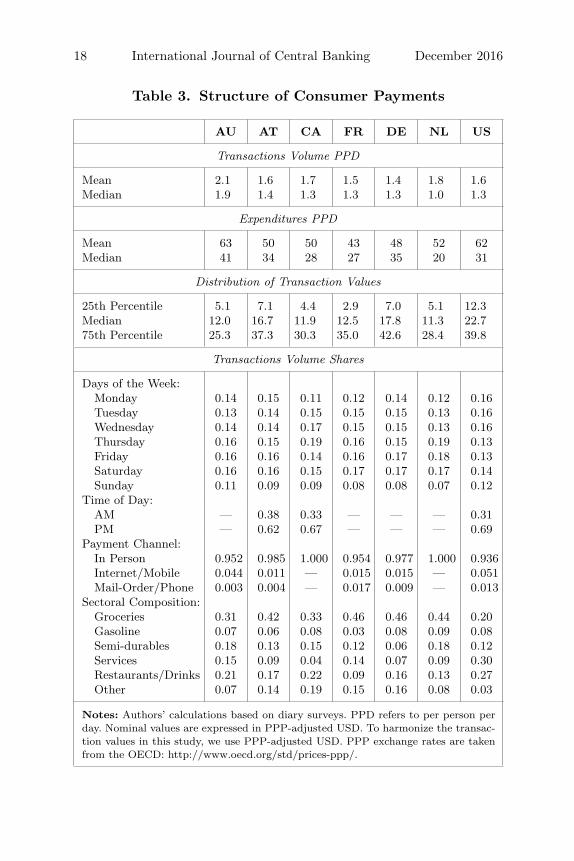
Table 1 distills our findings concerning the payment structure ineach of the seven countries. Although the harmonization of the datasources will be discussed in more detail in section 3, at this pointwe note that the presented figures include basically all personal pay-ments of respondents made either at a POS, for remote purchases, orin person to other persons. Recurrent transactions (e.g., rent, utilitybills) are excluded. Our main findings follow:
• Between 46 percent and 82 percent of the number of all pay-ment transactions are conducted by cash.
• In value terms, differences across countries are stark. AT andDE are cash-intensive countries with a value share of morethan 50 percent; in CA, FR, and US, cash payments accountfor only about one-fourth of the value of transactions.
• The composition of non-cash payments varies substantiallyacross countries. Credit cards are used more frequently in AU,CA, and US than in European countries. Across all countriesconsidered, debit cards are used more frequently than creditcards, with particularly high use in NL. FR and US have alarge share in the other category. Checks constitute a non-trivial portion in both countries, while prepaid cards are afactor in the US.
• The overwhelming fraction of payments is conducted with onlya few payment instruments: the accumulated cash, debit, and

8 International Journal of Central Banking December 2016
Table 1. Salient Results
AU AT CA FR DE NL US
Payment Share by Volume
Cash 0.65 0.82 0.53 0.56 0.82 0.52 0.46Debit 0.22 0.14 0.25 0.31 0.13 0.41 0.26Credit 0.09 0.02 0.19 0.01 0.02 0.01 0.19Total 0.96 0.98 0.97 0.88 0.97 0.95 0.91Other Most Important — — — 0.09a — — —
Payment Instrument(Share > 5%)
Payment Share by Value
Cash 0.32 0.65 0.23 0.15 0.53 0.34 0.23Debit 0.32 0.25 0.30 0.43 0.28 0.60 0.27Credit 0.18 0.05 0.41 0.03 0.07 0.04 0.28Total 0.82 0.95 0.94 0.60 0.89 0.97 0.78Other Most Important 0.12b — — 0.30a — — 0.14a
Payment Instrument(Share > 5%)
Ownership of Payment Cards
Debit Share 0.93 0.85 0.97 0.83 0.94 0.99 0.76Credit Share 0.47 0.24 0.81 0.36 0.33 0.62 0.67
Average Transaction Values
Cash 15.2 24.7 12.9 10.9 25.0 17.4 17.8Debit 43.3 55.6 37.6 56.6 75.7 39.1 37.3Credit 60.0 85.9 64.7 92.5 160.5 95.6 56.4
Acceptance of Alternatives to Cashc
Share — 0.63 0.73 — 0.57 — —
Average Cash Balances in Wallet
Mean 59 148 64 70 123 51 74Median 32 114 38 30 94 28 37
Notes: Authors’ calculations based on questionnaire and diary surveys. Nominalvalues are expressed in PPP-adjusted USD. PPP exchange rates are taken from theOECD: http://www.oecd.org/std/prices-ppp/.aChecks.bInternet/telephone banking.cAcceptance as perceived by consumers.

Vol. 12 No. 4 Consumer Cash Usage 9
credit share is greater than 95 percent for AU, AT, CA, DE,and NL, and greater than 88 percent for FR and US.
The major question that emerges from these findings is how thelevels of cash use in the various countries can be explained. As a firstattempt, table 1 summarizes information on three indicators aboutmarket structure. The results show the following:
• Payment card ownership (especially debit card ownership) ishigh in all countries. However, there are large cross-countrydifferences with respect to the dissemination of credit cards.This suggests that the use of cash may be correlated with thelevel of card ownership.
• Another indication about market structure can be obtainedfrom average transaction values. In all seven countries, theaverage value of cash transactions is lower than the averagevalue of card transactions. This result is consistent with preva-lent transaction-size models (i.e., Whitesell 1989; Bouhdaouiand Bounie 2012). Notably, in countries where cash is usedrelatively more frequently, the average card transaction valueis higher than it is in countries where there is more intensiveuse of cards.
• The acceptance of payment cards by merchants differs acrosscountries. There is limited evidence from the surveys, butavailable evidence for AT, CA, and DE indicates there is acorrelation with cash usage.
• Survey responses suggest that cash balances are substantiallyhigher for AT and DE than for the other countries. This resultcorresponds with the importance of cash for payments in thesecountries. This correlation may not be causal and there maybe a simultaneity in cash management and payment behav-ior. For example, the level of cash balances might affect con-sumers’ use of cash, but similarly, the use of cash may also bea determinant of the amount of cash consumers carry.
We will use the above findings to delve deeper into the levels incash use across countries. To get a better grasp, we will also analyzecash use by looking at (i) the expenditure structure in the various

10 International Journal of Central Banking December 2016
countries, (ii) whether cash usage differs across transaction types andPOS characteristics (transaction value, type of expenditure, accep-tance), and (iii) whether the use of cash varies across sociodemo-graphic factors. Similarly, we further assess the interrelation betweencash holdings and payment behavior by delving deeper into cashmanagement practices of consumers. As a case in point, table 1 high-lights that all “non-cash-intensive” countries have a rather similarmedian cash balance of about 30 purchasing power parity (PPP)-USD. This suggests that consumers behave rather similarly in dif-ferent countries. We will further exemplify and analyze this issueby looking at withdrawals and other aspects of cash managementbehavior.
3. Consumer Payment Diaries—Validity andHarmonization
This section provides a short overview of the methodological fea-tures and key survey outcomes of the payment diaries included inthe cross-country comparison. We will start with a more generaldiscussion about the value of payment diary data, by contrastingdiary studies with classical ways of collecting information, such asquestionnaire surveys or macro data analyses. The section concludeswith a few remarks on the harmonization steps necessary to createcomparable data sets.
3.1 Consumer Payment Diaries
Several types of data can be used to assess consumers’ use of pay-ment instruments. First, official transaction records of banks, cardprocessors, or retailers can be employed. The advantage of thesedata is that they are based on observed behavior and they providea good basis for examining aggregate changes in payment use overtime. However, often such data do not allow for an in-depth analy-sis of behavior at the consumer level. Some data are proprietary, soindividual behavior cannot be tracked. Scanner data do not usuallyprovide information about the consumer and are focused on only acertain portion of consumer behavior (e.g., grocery purchases); seeCohen and Rysman (2013).

Vol. 12 No. 4 Consumer Cash Usage 11
Therefore, payment studies often have recourse to consumer sur-vey data. Here a distinction can be made between data collectedthrough consumer questionnaires versus data collected through con-sumer payment diaries. The advantage of questionnaires is that theburden on the respondent is limited to the time needed for com-pleting the questionnaire at one moment in time; diaries, in con-trast, require respondents to report information over a number ofdays. While the consumer questionnaire generates data that allowfor thorough analyses of general behavioral patterns as well as theunderlying drivers, it is less suitable for analyzing the specificitiesof individual payments. For example, surveys may serve as a valu-able tool for measuring the adoption of payment instruments byconsumers, while diaries are better for assessing their actual use.10
Collecting payment data through diaries has thus become pop-ular in recent years.11 The main benefits of using diary data—inparticular, in combination with questionnaire data—are obvious.Foremost, as consumers are stimulated to record with a minimumof delay after each particular transaction, the probability of trans-actions being omitted or erroneously reported is lower than forquestionnaire surveys. Payment diaries also allow for the collec-tion of many details of individual transactions, such as the paymentamount, the payment location, the acceptance of non-cash payments,and surcharging, which enable better understanding of the factorsthat drive consumer heterogeneity in payment behavior.
Insofar as payment diaries record cash balances over time, theyalso allow for an examination of the interaction between paymentchoice and cash management. When conducted for several days, atemporal sequence of actual payments and cash withdrawals can becreated, which is useful for understanding within-consumer hetero-geneities in payment instruments usage.
10In particular, when asking about individual payments, questionnaires maysuffer from “recall bias” or under-reporting of payments due to incomplete recall.Frequent and low-value payments are especially sensitive to being omitted; seeJonker and Kosse (2013).
11Collecting data using diaries has a long history in official statistics on expen-diture; see McWhinney and Champion (1974). Earlier general surveys about pay-ments were conducted by Avery et al. (1986) and Boeschoten (1992). Mooslechnerand Wehinger (1997) conducted a payment diary in Austria in 1996.

12 International Journal of Central Banking December 2016
3.2 Validity of Seven Payment Diaries
Our study uses payment diaries that were conducted independentlyin each country and hence were not harmonized. Differences pertainto the number of recorded days (from one to eight days), the modeof data collection (paper versus online), the scope of transactionscovered (e.g., recurrent and remote transactions), and the level ofdetail regarding transaction characteristics (table 2).12 To accountfor these differences, we put a lot of effort into the harmonizationof the variables and concepts, and we are confident that the level ofcomparability is high enough to conduct our cross-country analysis.The next subsections discuss similarities and differences as well asthe harmonization steps undertaken.
Despite the advantages of diary surveys described above, thequestion arises as to the representativeness of recorded transactions.Under-reporting is one issue, as illegal transactions and transac-tions in the realm of the shadow economy will likely not be cov-ered. But even for everyday expenditures, we do not know how wellrespondents record their transactions.
To ensure the efficacy of the seven payment diaries, we comparethe diary outcomes to aggregate expenditure data from nationalaccounts statistics. For this reason, we extrapolate the survey out-comes by multiplying the average daily diary expenditure by 365 toobtain an annual figure. This value is compared with the averageannual value of expenses as reported by the Organisation for Eco-nomic Co-operation and Development (OECD), deducting expensesfor housing, water, electricity, and gas.13
The results of this exercise are reported in the last row of the toppanel of table 2. For all diaries, the ratio of the extrapolated diaryoutcomes to the aggregate OECD POS consumption figures rangesfrom 0.72 to 1.16. Note that certain deviations are to be expected,as both the diary data and the data provided by the OECD are
12The literature has shown that the specific design of a diary may affect thequality of the collected data; e.g., Sudman and Ferber (1971), Crossley andWinter (2012), and Jonker and Kosse (2013).
13We focus on the average annual expenses by the adult population only, sincethe samples used in the diary surveys also only targeted residents aged betweeneighteen and seventy-five years.

Vol. 12 No. 4 Consumer Cash Usage 13
Tab
le2.
Surv
eyD
esig
nSum
mar
y
AU
AT
CA
FR
DE
NL
US
Yea
r20
1020
1120
0920
1120
1120
1120
12M
onth
(s)
Oct
–Nov
Oct
–Nov
Nov
Oct
–Nov
Sep–
Nov
Sep
Oct
Dat
aC
olle
ctio
nPap
erPap
erO
nlin
ePap
erPap
erO
nlin
eO
nlin
ePap
erP
hone
Pap
erSa
mpl
ing
Fram
e18
+15
+18
–75
18+
18+
18+
18+
Dia
ryLen
gth
(Day
s)7
73
87
13
Res
pond
ents
1,24
01,
165
3,28
31,
106
2,09
87,
175
2,46
8Tot
alTra
nsac
tion
s18
,110
12,9
7015
,832
10,7
5919
,601
11,8
7713
,942
Dia
ry-t
o-A
ggre
gate
-1.
110.
920.
990.
880.
971.
160.
72E
xpen
ditu
reR
atio
Mac
roec
onom
icAgg
rega
tes
Shor
t-Ter
mN
omin
al5.
01.
50.
41.
51.
51.
60.
2In
tere
stR
ate
Cor
eIn
flati
on2.
52.
41.
11.
21.
01.
91.
9R
ealG
DP
Gro
wth
2.5
1.3
–1.4
1.5
2.5
1.1
2.0
Out
put
Gap
–1.1
–0.6
–3.0
–0.8
0.3
–0.5
–3.4
Une
mpl
oym
ent
Gap
–0.1
–0.1
1.0
0.2
–0.9
0.6
2.0
Note
s:Fo
rth
ese
diar
y-to
-agg
rega
te-e
xpen
ditu
rera
tios
,w
eca
lcul
ate
the
tota
lan
nual
per
-per
son
expen
ditu
rein
loca
lcu
rren
cy,
bym
ulti
plyi
ngth
eav
erag
eper
-per
son
per
-day
expen
ditu
refig
ure
from
each
diar
yw
ith
365
days
.W
eco
mpa
reth
ises
tim
ated
annu
alco
nsum
ptio
nfig
ure
wit
hna
tion
alac
coun
tsda
tafr
omth
eO
EC
Dw
ebsi
te.
We
star
tw
ith
the
tim
ese
ries
label
ed“P
31N
C:
Fin
alco
nsum
ptio
nex
pen
d.of
res.
hous
ehol
dson
the
terr
itor
yan
dab
road
”an
dsu
btra
ct“P
33:
Fin
alco
nsum
ptio
nex
pen
ditu
reof
resi
dent
hous
ehol
dsab
road
.”W
eal
sosu
btra
ct“P
31C
P04
0:H
ousi
ng,
wat
er,
elec
tric
ity,
gas
and
othe
rfu
els”
toar
rive
ata
conc
ept
ofco
nsum
ptio
nex
pen
ditu
rem
ore
com
para
ble
tow
hat
we
have
inth
edi
arie
s.T
hedi
arie
sdo
not
cove
rre
curr
ent
pay-
men
ts,
and
mos
tof
the
paym
ents
for
hous
ing
and
utili
ties
are
recu
rrin
g.Fin
ally
,w
edi
vide
the
calc
ulat
edco
nsum
ptio
nex
pen
-di
ture
byth
eto
tal
adul
tpop
ulat
ion,
impl
ying
that
we
assu
me
that
the
resp
onse
sto
our
diar
ies
dono
tin
clud
eco
nsum
ptio
nex
pen
ditu
refo
rm
inor
s.To
harm
oniz
eth
etr
ansa
ctio
nva
lues
inth
isst
udy,
we
use
PP
P-a
djus
ted
USD
.P
PP
exch
ange
rate
sar
eta
ken
from
the
OE
CD
:ht
tp:/
/ww
w.o
ecd.
org/
std/
pric
es-p
pp/.
Mac
roec
onom
icag
greg
ates
are
take
nfr
omth
efo
llow
ing
OE
CD
Stat
Ext
ract
s:Sh
ort-
term
inte
rest
rate
:ht
tp:/
/ww
w.o
ecd.
org/
std/
.C
ore
infla
tion
:ht
tp:/
/sta
ts.o
ecd.
org/
inde
x.as
px?q
uery
id=
2666
1.O
ut-
put
gap:
OEC
DEco
nom
icO
utlo
ok,
Vol
ume
2014
,Is
sue
1,A
nnex
Tab
le10
.Lat
est
vers
ions
avai
labl
eat
http
://w
ww
.oec
d.or
g/ec
o/ou
tloo
k/ec
onom
ic-o
utlo
ok-a
nnex
-tab
les.
htm
.G
DP
grow
th:
http
://s
tats
.oec
d.or
g/in
dex.
aspx
?que
ryid
=26
674.
Une
mpl
oym
ent:
http
://s
tats
.oec
d.or
g/in
dex.
aspx
?que
ryid
=36
324.
NA
IRU
:ht
tp:/
/sta
ts.o
ecd.
org/
Inde
x.as
px?D
ataS
etC
ode=
EO
95IN
TE
RN
ET
.
14 International Journal of Central Banking December 2016
based on sampling-based survey estimates, and, hence, are subjectto a certain degree of error. Also, due to differences in classifications,the diaries and national account figures are likely to differ regardingthe sectors and types of payment included.
Therefore, we interpret the ratios, which all vary around 1.00,as evidence that all individual surveys perform rather well in cap-turing the actual expenses made in these countries. Moreover, allcountries undertook a number of plausibility checks. These com-prised either comparison with population figures (if available; e.g.,the average number and value of debit card payments or automatedteller machine (ATM) withdrawals) or with other sources (such asother market research reports). Some countries could refer to earlierpayment diary or questionnaire studies and check their stability overtime.
One factor that may adversely affect our efforts to harmonizethe diaries is cross-country variation in the state of business-cycleconditions.14 The lower panel of table 2 summarizes these conditionsby reporting standard macroeconomic aggregates for each countryat the time its diary was fielded (between 2009 and 2012). Short-term nominal interest rates were relatively low, in the range of 0.2percent (US) to 1.6 percent (NL) with the exception of AU, whichwas 5.0 percent. All of the countries had reasonably low core infla-tion, ranging from 1.0 percent (DE) to 2.5 percent (AU). Mostcountries were growing in terms of real GDP except for Canada,which declined 1.4 percent and had a –3.0 percent output gap. TheUnited States, though expanding (2.0 percent real GDP growth),also had a large negative output gap (3.4 percent). Not much isknown yet about the cyclical properties of consumer payment choicebecause of a general lack of time-series data. Following the finan-cial crisis, U.S. consumers significantly increased their use of cashand decreased their use of credit cards (Schuh and Stavins 2014),suggesting there may be some cyclical variation, but we do nothave enough data or business cycles to formally adjust the diaryresponses. The reader may wish to bear in mind that the results foreach country may be influenced by the macroeconomic conditions
14We thank an anonymous referee for pointing out this observation to us.

Vol. 12 No. 4 Consumer Cash Usage 15
prevailing at the time of the survey—for example, the output gapsin CA and US.
3.3 Similarities
The seven diary surveys share a number of similarities (see table 2).First, all seven diaries collect data on POS transactions. Each diaryattempts to record non-business-related personal expenditures of therespondent (whether for the respondent or for other people). Second,the information collected for each transaction is similar. All respon-dents were asked to record (i) the date (and sometimes even thetime), (ii) the transaction value, (iii) the payment instrument used,and (iv) the merchant’s sector where the purchase occurred. AT, CA,DE, and NL respondents were asked to assess whether the purchasecould have been paid using payment instruments other than the oneactually used. For cash withdrawals, all diaries collected informa-tion on the location (and in some cases the timing) as well as on theamount of the withdrawal. Each diary furthermore contained ques-tions on consumers’ cash balances either before the first recordedtransaction or for their typical average cash holdings.
Third, the seven diary studies are similar in that they wereall conducted at the end of the year, i.e., between September andNovember. The fieldwork was conducted in 2009 (CA), 2010 (AU),2011 (AT, FR, DE, and NL), and 2012 (US).
Fourth, the seven diaries are similar with respect to the pop-ulation being surveyed. Most targeted residents were between theages of eighteen and seventy-five years, although some diaries werealso distributed among children and people over seventy-five yearsof age. However, as discussed above in the expenditure ratio, all theanalyses presented in this paper focus only on the payments made byadults. Finally, all diary surveys yielded data sets containing morethan 10,000 transactions.
3.4 Differences
Several differences among the diaries should be kept in mind wheninterpreting the results. First, some diaries asked respondents to fillout the diary using paper and pencil (AU, AT, DE, and FR). US

16 International Journal of Central Banking December 2016
and CA relied on a mix of paper and online questionnaires. For NL,information was collected via an online tool or by phone, if desired.Also, a difference relates to the selection of respondents. Most coun-tries used random stratified or clustered sampling techniques, butthey differed with respect to the frame from which the respondentswere selected. For CA, NL, and US, for instance, respondents wererandomly selected from an existing panel of consumers who regularlyparticipate in surveys.
Online data-collection methods and online panels may be sensi-tive to biases when particular population groups are excluded fromparticipation because of not having access to the Internet, and whenthe persons who do participate behave differently than those who donot; see Bethlehem (2008). Yet, given the high Internet penetrationfor CA, NL, and US, the potential biases caused by the use of onlinemethods and online panels can be expected to be limited. Jonker andKosse (2013) demonstrate for NL that drawing respondents from anonline panel does not introduce pro-electronic biases reflected in anover-estimation of card usage. Moreover, in order to prevent anysuch biases, all panelists for US were provided with a computer orwith Internet access.
Second, differences exist with respect to the length of the diaries,as follows: one day (NL), three days (CA, US), seven days (AT, AU,and DE), and eight days (FR). Research by McWhinney and Cham-pion (1974), Ahmed, Brzozowski, and Crossley (2006), Jonker andKosse (2013), and Schmidt (2014) investigate the possibility thatlonger diaries may lead to survey fatigue (i.e., under-reporting ofexpenditures), especially for small-value transactions. Despite thesedifferences and their potential consequences, we believe that, due totheir richness, the seven data sets are well suited for answering themain questions of this paper. Moreover, as will be discussed below,we conducted some robustness checks that confirmed that the dif-ferences in diary length do not sizably affect our overall findings andconclusions.
3.5 Harmonization
We undertook the following harmonization steps to create seven datasets that are mutually comparable. In particular:

Vol. 12 No. 4 Consumer Cash Usage 17
• We distilled all payments from persons aged eighteen yearsand older.
• We only consider the payments made at the POS; paymentsfor remote purchases via mail order, the telephone, or theInternet; and in-person person-to-person payments. Recurrenttransactions (e.g., rents, utility bills) are excluded.
Also, we conducted a number of harmonization steps with respectto the reported results on card acceptance at the POS, consumerpreferences, and type of purchases made. The results with respectto the type of purchases, however, should only be taken as a roughindicator, due to the large national differences in the number and sizeof categories used.15 Finally, we harmonized the definitions and cat-egories of the various sociodemographic characteristics (e.g., income,education).
4. Expenditure Patterns
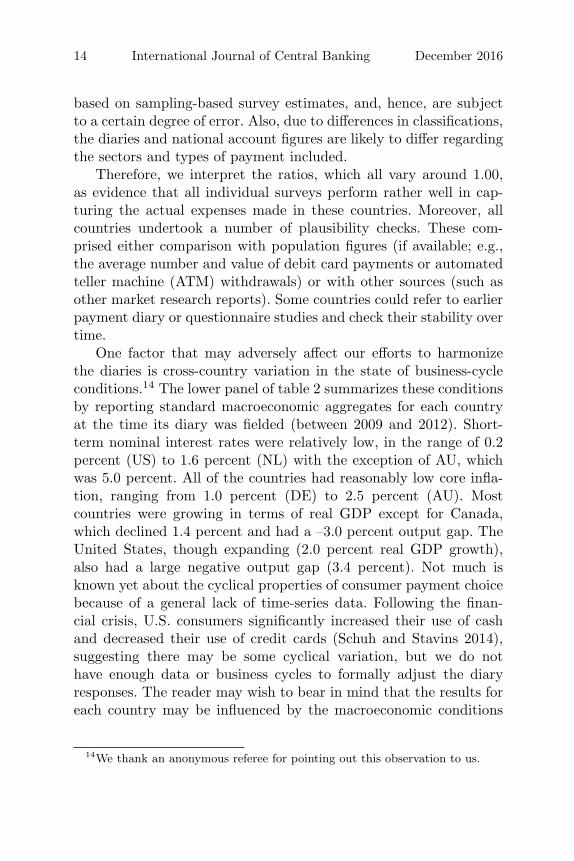
Table 3 reports summary statistics of the total structure of recordedpayments and thereby of expenditures of consumers.16 It showsthat the structure of payments is very similar across countries withrespect to the day of the week, time of day, and payment channel. Asexpected, Sunday is the day with the lowest share of transactions,although some cross-country differences are discernible. For exam-ple, the Sunday share is slightly higher for AU and US, which isreasonable given cultural differences in store opening hours. Aboutone-third of transactions are conducted before noon, and two-thirds
15Harmonization difficulties arose mainly because of (i) national differences inhow the information was collected (from only a few broad categories of sectorsin some countries to very detailed lists in other countries); (ii) differences inthe categorization of expenditures (e.g., some countries recorded expenditures inrestaurants and hotels in one category; other countries recorded hotel expendi-tures with other services), and (iii) differences in the structure of retail shops(e.g., in some countries newspapers and tobacco can be bought in grocery shops;other countries have small special shops for these expenditures).
16Note that these are consumer expenditures and not consumption.
18 International Journal of Central Banking December 2016
Table 3. Structure of Consumer Payments
AU AT CA FR DE NL US
Transactions Volume PPD
Mean 2.1 1.6 1.7 1.5 1.4 1.8 1.6Median 1.9 1.4 1.3 1.3 1.3 1.0 1.3
Expenditures PPD
Mean 63 50 50 43 48 52 62Median 41 34 28 27 35 20 31
Distribution of Transaction Values
25th Percentile 5.1 7.1 4.4 2.9 7.0 5.1 12.3Median 12.0 16.7 11.9 12.5 17.8 11.3 22.775th Percentile 25.3 37.3 30.3 35.0 42.6 28.4 39.8
Transactions Volume Shares
Days of the Week:Monday 0.14 0.15 0.11 0.12 0.14 0.12 0.16Tuesday 0.13 0.14 0.15 0.15 0.15 0.13 0.16Wednesday 0.14 0.14 0.17 0.15 0.15 0.13 0.16Thursday 0.16 0.15 0.19 0.16 0.15 0.19 0.13Friday 0.16 0.16 0.14 0.16 0.17 0.18 0.13Saturday 0.16 0.16 0.15 0.17 0.17 0.17 0.14Sunday 0.11 0.09 0.09 0.08 0.08 0.07 0.12
Time of Day:AM — 0.38 0.33 — — — 0.31PM — 0.62 0.67 — — — 0.69
Payment Channel:In Person 0.952 0.985 1.000 0.954 0.977 1.000 0.936Internet/Mobile 0.044 0.011 — 0.015 0.015 — 0.051Mail-Order/Phone 0.003 0.004 — 0.017 0.009 — 0.013
Sectoral Composition:Groceries 0.31 0.42 0.33 0.46 0.46 0.44 0.20Gasoline 0.07 0.06 0.08 0.03 0.08 0.09 0.08Semi-durables 0.18 0.13 0.15 0.12 0.06 0.18 0.12Services 0.15 0.09 0.04 0.14 0.07 0.09 0.30Restaurants/Drinks 0.21 0.17 0.22 0.09 0.16 0.13 0.27Other 0.07 0.14 0.19 0.15 0.16 0.08 0.03
Notes: Authors’ calculations based on diary surveys. PPD refers to per person perday. Nominal values are expressed in PPP-adjusted USD. To harmonize the transac-tion values in this study, we use PPP-adjusted USD. PPP exchange rates are takenfrom the OECD: http://www.oecd.org/std/prices-ppp/.

Vol. 12 No. 4 Consumer Cash Usage 19
after. Finally, in-person transactions make up the vast majority ofpayments.17
With respect to the type of purchase or the sectoral composi-tion, keeping the harmonization difficulties in mind, we find thatgroceries account for the majority of transactions in all countries(except for US). The share of grocery expenditures is quite similarfor AT, FR, DE, and NL. Also, the gas station expenditure share,which arguably constitutes the most homogeneous type of expen-diture, is similar across countries. These results provide evidencethat some aggregate shopping patterns are similar across the sevencountries examined.
More importantly, the diaries are also informative regardingother payment characteristics about which relatively little is known,at least in a comparative perspective. This brings us to our first fact:
Fact 1. The structure of consumer payments is generally similaracross most of the countries with respect to the number and the valueof transactions: (i) Consumers conduct only a few payment trans-actions per day and (ii) most consumer expenditures are relativelysmall in value.
The mean number of transactions per person per day (PPD)varies from 1.4 to 2.1 transactions across countries. The medianperson, who arguably is more robust to outliers, conducts only 1.3transactions for CA, FR, DE, and US, and 1.4 transactions for AT.The median amount spent PPD varies across countries, ranging from20 to 41 PPP-USD.
Analyzing individual transactions provides another angle fromwhich to view the data. Table 3 reports the quartiles of transactionvalues. This analysis shows that the median transaction amountis around 12 PPP-USD for AU, CA, FR, and NL. For AT, DE,and US, the value is higher, at 17 to 22 PPP-USD. We also findthat 75 percent of all recorded transactions are lower than 25 to 40PPP-USD.
17For AU and US, Internet/mobile payments at the POS account for a vol-ume share that is higher than 4 percent, while in all other countries it is almostnegligible.
20 International Journal of Central Banking December 2016
5. Cash Usage: Descriptive Evidence
Table 1 documented the outstanding importance of cash in all coun-tries. In this section, we focus on the use of cash in terms of transac-tion size, cash balances, sociodemographics (income, education, age,and consumer preferences), cash card ownership, and POS character-istics (acceptance of payment cards and type of economic activity).The selection of these factors rests on previous literature that hasmostly been confined to the analysis of single countries.18 Note thatthe descriptive statistics presented in this section provide only a firstindication of the potential correlation with cash usage, disregardingall other factors. A final answer on the role of each of the selected fac-tors in explaining consumers’ cash usage can only be provided aftercontrolling for the other variables using multivariate econometricestimations. These estimates are completed in section 6.
5.1 Transaction Size
Numerous previous papers have shown that transaction size is highlycorrelated with the choice of payment instruments (e.g., Klee 2008;Bouhdaoui and Bounie 2012; von Kalckreuth, Schmidt, and Stix2014a; Arango, Huynh, and Sabetti 2015). Our analysis substanti-ates these findings.
Fact 2. The use of cash decreases with transaction size. In all coun-tries, cash is predominant for the smallest 50 percent of transac-tions. For the largest 25 percent of transactions, the use of paymentinstruments is very heterogeneous across countries.
Figure 2 depicts the payment instrument shares for cash, debit,credit, and other payment instruments for each transaction valuequartile. This figure confirms the dominance of cash for low trans-action values in all countries. In the first transaction value quartile,debit plays only a minor role for CA, NL, and US, while credit is
18One shortcoming of our analysis is that our data cannot establish the causallink between payment choice and card pricing (e.g., Borzekowski, Kiser, andShaista 2008; Simon, Smith, and West 2010). Moreover, whenever we analyzePOS characteristics, we assume that these are fixed.

Vol. 12 No. 4 Consumer Cash Usage 21
Figure 2. Value Share of Cash by TransactionValue Quartiles
0.2
.4.6
.81
AU AT CA FR DE NL US
TV Q1
0.2
.4.6
.81
AU AT CA FR DE NL US
TV Q2
0.2
.4.6
.81
AU AT CA FR DE NL US
TV Q30
.2.4
.6.8
1
AU AT CA FR DE NL US
TV Q4
Cash Debit Credit Other
Source: Authors’ calculations based on diary surveys.
used only materially for CA (share of 3 percent) and US (shareof 6 percent). Other payment instruments have a notable share forlow-value transactions only for NL (14) and US (6 percent). For allcountries, we find that the cash share is higher than 50 percent up tothe median transaction value. In the third quartile, the dominanceof cash fades. In this transaction value range, however, cash has amaterially higher share than debit or credit in three countries anda share that is about equal to the share of debit for CA, FR, NL,and US. In the fourth quartile, the full heterogeneity across coun-tries becomes evident: (i) the importance of credit card paymentsfor AU, CA, and US relative to other countries, (ii) the importanceof checks for FR and US, and (iii) the relative importance of debitversus credit in all European countries.

22 International Journal of Central Banking December 2016
5.2 Cash Balances
Withdrawal innovations such as ATM terminals have affected thedemand for cash. For instance, Alvarez and Lippi (2013) show thatfree and random withdrawal opportunities can give rise to a pre-cautionary motive for holding cash, meaning that agents withdrawcash even if they have some cash on hand. Several empirical stud-ies suggest that higher cash holdings are correlated with higher useof cash in payments; see Bouhdaoui and Bounie (2012), Arango etal. (2013), Eschelbach and Schmidt (2013), and Arango, Huynh,and Sabetti (2015). Our findings provide support for a relationshipbetween cash usage and cash balances.
Fact 3. Austria and Germany, relative to other countries, are cashintensive, with large cash balances and large average withdrawalamounts.
Table 4 reports statistics on individuals’ cash management pat-terns. The average cash balances (M) for AT (148 PPD-USD) andDE (123 PPD-USD) are two times greater than those in other coun-tries (from 51 for NL to 74 PPD-USD for US). These statistics arein line with the greater use of cash in payments for AT and DE,where the share of cash by volume exceeds 80 percent. It reaches amaximum of just 65 percent in other countries. As a consequence,the mean of the ratio M/e, where e denotes daily expenditure, variesfrom 1.5 for AU to 4.8 for AT. The gaps between countries persisteven if we abstract from extreme values: the median equals 0.6 forUS, while it reaches 3.4 for AT. The extent to which the suggestedrelationship between cash balances and cash usage is causal remainsunclear. That is, the level of cash balances might affect consumers’use of cash, but, similarly, the use of cash may determine the amountof cash that consumers carry. Hence, it is not clear whether cashmanagement causes cash usage or vice versa.
Cash is obtained from ATMs, bank tellers, and other sources(family, retail stores’ cashback, etc.). Except for US, the main sourceof cash is the ATM; the share of people withdrawing at least oncea month from ATMs exceeds 70 percent in all countries. However,the mean number of monthly ATM withdrawals greatly varies across

Vol. 12 No. 4 Consumer Cash Usage 23
Tab
le4.
Cas
hM
anag
emen
t
AU
AT
CA
FR
DE
NL
US
Cas
hBal
ance
s
Inth
eW
alle
t(M
)59
a14
864
7012
351
a74
Mea
nM
/e1.
484.
784.
384.
134.
152.
872.
44M
edia
nM
/e0.
693.
361.
011.
302.
611.
000.
62
Withd
rawal
s(N
umbe
rpe
rM
onth
)
AT
M—
3.48
4.98
3.70
3.08
2.45
1.31
Tel
ler
—1.
071.
832.
210.
990.
020.
65O
ther
Sour
ces
—1.
314.
052.
090.
700.
403.
29
Shar
eof
Res
pond
ents
Withd
rawin
g
AT
M(a
tLea
ston
cea
Mon
th)
—0.
790.
730.
950.
85—
0.69
Tel
ler
(at
Lea
stO
nce
aM
onth
)—
0.28
0.41
0.70
0.22
—0.
41O
ther
Sour
ce(a
tLea
stO
nce
aM
onth
)—
0.11
0.56
0.71
0.03
—0.
92
Ave
rage
Withd
rawal
Am
ount
AT
M(W
)13
822
486
8925
610
210
3Tel
ler
668
511
225
224
539
7521
9O
ther
Sour
ces
5155
952
122
125
5395
W/M
5.80
3.86
3.77
6.25
15.9
68.
7114
.05
Med
ian
W/M
2.33
1.42
1.67
1.72
2.11
2.50
2.31
Pre
caut
iona
ryBal
ance
s
Cas
hB
alan
cebe
fore
Wit
hdra
wal
(M)
—58
22—
43—
67M
ean
M/M
—0.
840.
46—
1.66
—2.
29M
edia
nM
/M—
0.25
0.20
—0.
32—
0.73
Note
s:A
utho
rs’
calc
ulat
ions
are
base
don
ques
tion
nair
ean
ddi
ary
surv
eys.
M/e
isth
era
tio
ofca
shba
lanc
esto
daily
expen
di-
ture
sfr
omth
edi
ary.
All
valu
esre
pres
ent
mea
ns,
unle
ssot
herw
ise
indi
cate
d.N
omin
alva
lues
are
expr
esse
din
PP
P-a
djus
ted
USD
.To
harm
oniz
eth
etr
ansa
ctio
nva
lues
inth
isst
udy,
we
use
PP
P-a
djus
ted
USD
.P
PP
exch
ange
rate
sar
eta
ken
from
the
OE
CD
:ht
tp:/
/ww
w.o
ecd.
org/
std/
pric
es-p
pp/.
aV
alue
sfo
rA
Uan
dN
Lar
efr
omth
equ
esti
onna
ire
(“ty
pica
l”av
erag
eca
shba
lanc
e);al
lot
hers
are
from
the
diar
y.
24 International Journal of Central Banking December 2016
countries, from 1.3 for US to 5 for CA. These withdrawal patternsseem to be directly correlated with the typical cash withdrawalamounts at ATMs.19
5.2.1 Implications for Inventory Models of Money Demand
The overall picture that emerges from these figures is that respon-dents in cash-intensive economies do not economize on cash balancesby withdrawing more often. Instead, it seems that they prefer tohold higher cash balances. There are several possible reasons forthis behavior. One is that AT and DE respondents hold larger cashbalances because of the risk that lumpy purchases can only be con-ducted in cash (Alvarez and Lippi 2013). This would imply thatprecautionary balances are higher in these two countries than inother countries. However, the evidence is not conclusive. Cash bal-ances at withdrawals are larger for AT and DE than for CA but notlarger than for US.
These descriptive statistics can be further exploited to examinethe empirical performance of the deterministic inventory theoreticalmodel proposed by Baumol (1952) and Tobin (1956). We focus ourdiscussion on two statistics. The first is the ratio between cash hold-ings at the time of a withdrawal (M) and average/median currencyholdings (M). This statistic provides a measure of precautionarybalances: the higher M/M , the more precautionary the consumersare. This ratio is zero in the Baumol-Tobin model, as consumerswithdraw only when they have depleted their stock of cash. Wenotice in table 4 that the median of this ratio ranges from 0.20for CA to 0.73 for US. The data are thus more in line with thedynamic model of cash management suggested by Alvarez and Lippi(2009), who extend the Baumol-Tobin model to a dynamic environ-ment in which consumers face not only costly ATM withdrawals butalso random and free ATM cash withdrawal opportunities. Moreprecisely, the model predicts that consumers withdraw cash when
19As previously outlined, US stands out in this respect: the share of peopleobtaining cash from other sources at least once a month (90 percent) is abovethat of ATMs and tellers (70 percent and 40 percent, respectively), and the with-drawal frequency at these other sources is far above that for ATMs and tellers(3.3 compared with 1.3 for ATMs and 0.7 for tellers).

Vol. 12 No. 4 Consumer Cash Usage 25
facing free withdrawal opportunities even if they have some cash onhand, resulting in a positive ratio of M/M (with values between zeroand one).
The second interesting statistic (W/M) is the ratio betweenthe average withdrawal amount at the ATM (W ) and the averagecurrency holdings (M), which is also related to the precautionarymotive (M/M). Since withdrawals only happen when cash balancesreach zero, in the Baumol-Tobin model W/M is equal to 2. Withrandom free withdrawals, Alvarez and Lippi (2009) show that thisratio will be below 2. The higher the number of free cash withdrawalsrelative to the overall number of withdrawals, the higher M/M andthe lower W/M—consumers take advantage of the free random with-drawals regardless of their cash balances, which decreases the levelof cash withdrawals. As free withdrawal opportunities relative tothe overall number of withdrawals increase, M/M becomes greaterthan 0 (and lower than 1) while W/M tends from 2 to 0, implyinga negative correlation between these ratios.
In the data, we find that the median of this ratio lies between1.42 for AT and 2.31 for US. The data are in line with the predic-tion of Alvarez and Lippi (2009) regarding the level of W/M in threecountries where W/M is found to be lower than 2 (AT, CA, FR).However, the finding of ratios above 2 for four countries is neithercompatible with Baumol-Tobin nor with Alvarez and Lippi (2009).Also, if we analyze the values across countries, no negative correla-tion between these two ratios is discernible. Overall, these findings,if taken at face value, would question deterministic and dynamicmodels of demand for cash.
However, we treat the results merely as indicative because workwhich goes beyond the scope of this paper would be necessary toobtain a valid structural comparison across countries. First, con-sumers have several withdrawal sources, and it is neither obvioushow an average withdrawal amount should be computed if severalwithdrawal sources are used nor how much we can rely on sur-vey information on withdrawal sources that are only rarely usedon average, i.e., cashback in Germany or via teller in Netherlands.In the face of this difficulty, we have opted for a pragmatic approachand have used the average withdrawal amount at the ATM as ourmeasure of W . Second, the model of Alvarez and Lippi (2009) makes

26 International Journal of Central Banking December 2016
predictions about the cross-sectional variation across households,while we extend this to a comparison across countries. Institutional,regulatory, and market differences (e.g., density of ATMs, pricing,daily withdrawal limits, etc.) might confound our results. Finally,the dynamic model of cash demand abstracts from precautionarystrategies related to consumers’ long-term cash management thatcould induce a ratio W/M greater than 2. One needs to make surethat these considerations do not play a role.
5.3 Sociodemographic Characteristics
This section presents evidence on cash usage along sociodemograph-ics characteristics, and we inquire into consumers’ preferences byanalyzing survey evidence on perceptions of cash.
5.3.1 Age, Income, and Education
Fact 4. Cash usage decreases with education and income, but variesacross age categories.
The role of age is of interest because one could argue that theenduring importance of cash could be due to habit persistence.Indeed, previous literature indicates that older people hold and usemore cash, while young consumers are more likely to use new pay-ment technologies (e.g., Daniels and Murphy 1994; Boeschoten 1998;Carow and Staten 1999; Stavins 2002; Hayashi and Klee 2003).
Our results in figure 3 reveal that older people use significantlymore cash than younger people except for US, where younger indi-viduals use more cash than older individuals. These figures regardingage do not control for differences in expenditure patterns or otherpersonal characteristics; for example, younger consumers may buydifferent products and/or services and at different venues than olderindividuals. Therefore, a final answer on the role of age can only begiven with estimations that control for these other variables, whichwill be the focus of the next section.20
20Von Kalckreuth, Schmidt, and Stix (2014a) find no evidence in favor of stronghabit persistence. Instead, they attribute higher cash usage of older people to theirdifferential characteristics (e.g., lower opportunity costs of time or lower income).

Vol. 12 No. 4 Consumer Cash Usage 27
Figure 3. Value Share of Cash by Age, Income,and Education
0.2
.4.6
.8
AU AT CA FR DE NL US
Age
age 18-35 age 36-60 age 60+
0.2
.4.6
.8
AU AT CA FR DE NL US
Income
inc. low inc. medium inc. high
0.2
.4.6
.8
AU AT CA FR DE NL US
Education
edu. low edu. medium edu. high
Notes: The graphs depict the shares of cash (in value terms) in percentage forthe respective subgroup. Authors’ calculations are based on harmonized diarysurveys.
Income and education have been cited in the literature as impor-tant factors, with cash usage declining with higher income and edu-cation (e.g., Arango, Huynh, and Sabetti 2015 for CA; von Kalck-reuth, Schmidt, and Stix 2014b for DE; and Schuh and Stavins 2010and Cohen and Rysman 2013 for US). Figure 3 confirms differencesalong income terciles, with less cash usage by higher-income respon-dents. Even stronger differences are found along education. Notably,these differences pertain to all analyzed countries: for DE and CA,the difference in the value share of cash between low educationand high education is more than 26 percentage points, while in theremaining countries this difference ranges from 9 to 18 percentagepoints.21
21In many respects, these findings mirror the pattern observed for cardownership, which tends to vary along the same sociodemographic lines

28 International Journal of Central Banking December 2016
Recent work by von Kalckreuth, Schmidt, and Stix (2014a) findsthat cash is used to monitor expenditures. In particular, their pre-diction is that cash will be used for this purpose by individuals whoface financial constraints and who have difficulties with other mon-itoring techniques (such as online accounts). The pattern of resultsobtained for income and education is in line with this proposition.22
5.3.2 Consumer Preferences
One could argue that consumers are using cash because they have nochoice; e.g., because payment cards are not accepted or for reasons ofcosts, safety, or convenience. We can analyze this issue by looking atconsumers’ ratings of certain payment instrument attributes, whichcan be viewed as broad proxies for consumer preferences and whichhave been found to affect payment choice (e.g., Borzekowski, Kiser,and Shaista 2008; Ching and Hayashi 2010; Schuh and Stavins 2010;Arango, Huynh, and Sabetti 2015).
To a varying degree, the seven diaries contain information onpreferences that we have attempted to harmonize. The harmoniza-tion was difficult because the different diary surveys described andasked about preferences in different ways. Moreover, responses weremeasured in different ways, with some countries using Likert scalesand others binary responses. In the face of these obstacles, we wereable to successfully harmonize only responses concerning the rela-tive perceived acceptance, cost, and ease of use of cash. Figure 4shows a normalized comparison of consumers’ ratings of cash versusdebit.23 The depicted measures are scale free, with a positive (nega-tive) value implying that cash is rated better (worse) than debit (avalue of zero means that cash is rated the same as debit). Similarly,we show results of a comparison of cash with credit and of debitwith credit.
(table 6). However, the case of NL, where debit card ownership does not varyacross income or education while the cash shares do, suggests that income andeducation exert an autonomous effect on cash usage that is independent of cardownership.
22The role of debit cards for spending restraint has been recently analyzed byFusaro (2013).
23See Jonker (2007) and Arango, Huynh, and Sabetti (2015) for a descriptionof the normalization. Variables are defined in table 13 in the appendix.

Vol. 12 No. 4 Consumer Cash Usage 29
Figure 4. Perceptions of Cash-.
2.2
.4.6
acceptance cost ease
Cash vs. Debit
-.2
.2.4
.6
acceptance cost ease
Cash vs. Credit
-.2
.2.4
.6
acceptance cost ease
Debit vs. Credit
AT CA FR DE NL US
Notes: The figure shows normalized perceptions of cash relative to debit andcredit. A positive (negative) value indicates that cash is perceived better (worse)than the respective payment card. Due to differences in the wording of surveyquestions, the harmonization is only approximate. Values for acdeptance andcosts are not available for FR. For DE, values are taken from the 2008 paymentdiary. Authors’ calculations are based on questionnaire and diary surveys.
Fact 5. Cash is generally valued highly by consumers for its per-ceived acceptance, costs, and ease of use.
Concerning consumer perceptions of acceptance, we can com-pare results from five countries. For AT, CA, and DE, cash is ratedhigher than debit. For US, cash is rated the same as debit, and forNL, cash is rated worse than debit. For CA and US, we find thatresults concerning cash versus debit and cash versus credit are verysimilar, mirroring that both cards are perceived to have a similaracceptance. In the other countries, credit cards are seen as worsethan debit cards, corresponding with the authors’ perception of theacceptance of credit cards in countries such as AT, DE, and NL.

30 International Journal of Central Banking December 2016
With respect to perceived cost, we find that cash is rated betterthan debit for AT, CA, DE, and US, and for NL it is rated similarly.Again, the difference is more pronounced in favor of cash when itcomes to a comparison of cash to credit. Finally, regarding the easeof use, debit is rated higher for AT, CA, and DE, while it is ratedlower than cash for FR, NL, and US.
Overall, this evidence suggests that cash usage by consumers isnot the sole result of a lack of alternatives. To the contrary, cash isvalued by consumers because it is perceived more positively than,or as positively as, credit and debit cards with respect to cost. Also,the assessment shows that in particular in countries with relativelyhigh cash use, ease of use may be an important driver.
5.4 Card Ownership
Cash usage may be influenced by differences in the disseminationand use of payment cards.
Fact 6. Whereas the levels of card ownership differ across coun-tries, overall card ownership is rather high. Consumers only use afew payment instruments alongside cash.
Table 5 shows that in each country the vast majority of con-sumers hold payment cards: For AT, with its high cash share, weobserve the lowest card dissemination share of 86 percent. For NL,virtually all consumers are in possession of a payment card.
The most striking difference in card ownership can be seen inthe dissemination of credit cards. Table 6 presents disaggregatedevidence on card ownership by sociodemographics, showing that dif-ferences in credit card ownership prevail along all age, income, andeducational groups. These differences suggest that there are factorsrelated to the market structure that affect credit card dissemination.
There are significant differences in the number of cards owned orused (multi-homing).24 CA and US consumers possess, on average,
24Rysman (2007) discusses the issue of multi-homing (that is, respondents’practice of holding or using more than one payment card). In our analysis, wefocus on card use on the extensive margin (number of cards), not the intensivemargin (how much the card is used).

Vol. 12 No. 4 Consumer Cash Usage 31
Table 5. Card Ownership and Multi-homing
AU AT CA FR DE NL US
Share of Respondents With:
Payment Card 0.95 0.86 0.99 0.92 0.94 1.00 0.88Debit Card 0.93 0.85 0.97 0.90 0.94 0.99 0.76Credit Card 0.47 0.24 0.81 0.31 0.33 0.62 0.67
Number of Payment Cards in Possession
Mean 1.93 1.77 3.51 1.61 1.85 1.63 4.23Median 2.00 1.00 3.00 1.00 1.00 2.00 3.00
Number of Payment Instruments Used in Diary
Mean 2.23 1.75 1.79 2.37 1.88 1.56 2.28Median 2.00 2.00 2.00 2.00 2.00 1.00 2.00
Share of Respondents Who Revolve or Overdraft
Revolvers 0.29 — 0.26 — — — 0.33Overdraft — 0.33 — — — — 0.28
Notes: “Payment Card” is defined as those persons with either a debit or a creditcard. Authors’ calculations are based on questionnaire and diary surveys. “Revolvers”are those who do not pay off their total credit card balances each month and incurinterest/finance charges. “Overdraft” refers to persons who at least sometimes over-draw their checking account.
3.5 and 4.2 payment cards. For all other countries, the respectivevalue is below 2. The median number of payment cards is 3 for CAand US, 2 for AU and NL and only 1 for AT, DE, and FR.
Table 5 also presents evidence on the number of payment instru-ments used in the diary period. Our findings indicate that themedian consumer uses two payment instruments (including cash)over the diary recording period.25 Although these results are influ-enced by the length of the diary period, it suggests that the medianconsumer uses only a few payment instruments alongside cash, which
25For NL the median is one payment instrument, which is explained by thefact that respondents only recorded their payments for one day.

32 International Journal of Central Banking December 2016
Table 6. Card Ownership by Sociodemographics
AU AT CA FR DE NL US
Debit Card Ownership by Sociodemographics
Age:18–35 0.96 0.95 0.97 0.91 0.96 1.00 0.7736–60 0.94 0.89 0.98 0.91 0.95 0.99 0.7960+ 0.88 0.69 0.94 0.86 0.91 0.99 0.69
Education:Low 0.94 0.79 0.89 0.81 0.86 0.99 0.71Medium 0.86 0.91 0.98 0.90 0.98 0.99 0.86High 0.91 0.96 0.97 0.96 0.99 0.99 0.80
Income:Low 0.88 0.78 0.96 0.83 0.89 0.98 0.62Medium 0.95 0.90 0.97 0.93 0.96 0.99 0.82High 0.94 0.93 0.97 0.96 0.97 0.99 0.82
Credit Card Ownership by Sociodemographics
Age:18–35 0.33 0.21 0.76 0.25 0.31 0.60 0.5236–60 0.57 0.28 0.84 0.36 0.43 0.62 0.6960+ 0.46 0.20 0.83 0.29 0.24 0.62 0.84
Education:Low 0.48 0.13 0.62 0.22 0.16 0.44 0.56Medium 0.41 0.31 0.77 0.31 0.39 0.55 0.81High 0.45 0.42 0.91 0.36 0.68 0.75 0.92
Income:Low 0.27 0.11 0.64 0.23 0.20 0.36 0.36Medium 0.53 0.20 0.84 0.32 0.27 0.60 0.75High 0.54 0.42 0.95 0.52 0.54 0.86 0.91
Notes: Payment card is defined as either a debit or credit card. Authors’ calculationsare based on diary and questionnaire surveys.
is in line with the results of Cohen and Rysman (2013) using a dataset that follows consumers over a much longer period of time.26
26Table 5 provides evidence on how certain consumers use their cards, i.e., itcompares the share of revolvers in US, AU, and CA with the share of persons withoverdrafts on their checking accounts for US and AT. Interestingly, all shares are

Vol. 12 No. 4 Consumer Cash Usage 33
Table 7. Perceived Acceptance by Transaction Value
AT CA DE
Quartile 1 0.48 0.53 0.28Quartile 2 0.63 0.71 0.48Quartile 3 0.68 0.80 0.69Quartile 4 0.75 0.89 0.87
Overall 0.63 0.73 0.57
Note: The table shows the share of transactions in a given transaction value quartilefor which respondents answered that cards were accepted.
5.5 POS Characteristics
Finally, we discuss two types of POS characteristics: (i) card accep-tance at the POS, and (ii) the type of economic activity in whichtransactions occur.
5.5.1 Card Acceptance
Fact 7. Higher usage of cash is associated with lower levels of cardacceptance at the POS.
The role of card acceptance at the POS can be approached byusing direct survey evidence for AT, CA, and DE. In particular,the respective payment diaries recorded whether a transaction couldhave been made in cashless form. On the basis of this information,we can analyze whether high cash usage is attributable to insuffi-cient payment card acceptance. When interpreting results, however,it should be kept in mind that they are based on the subjectiveassessment of respondents.
Table 7, which tabulates the consumer’s self-stated acceptance ofcards at the POS by transaction values, confirms that the acceptance
roughly around 30 percent, even in AT with little credit card use (disregardingmeasurement difficulties). This result implies that AT consumers use the over-draft facility on their checking account to obtain credit, whereas consumers inthe English-speaking countries use their credit cards. Short-term credit couldalso be obtained with deferred debit cards. However, we do not have comparableinformation on these types of cards.

34 International Journal of Central Banking December 2016
of payment cards is much lower for small-value amounts than forlarge-value amounts. For transaction values in the first quartile, DEstands out with low acceptance. Furthermore, a comparison acrosscountries indicates that (i) CA has the highest acceptance values ineach quartile, and (ii) the difference, interestingly, is not strong forhigher transaction amounts relative to AT and DE. This evidence isroughly consistent with cash usage. Note again that these descriptivestatistics assume all other factors to be fixed. Therefore, to analyzethe real effect of card acceptance, econometric analyses will be usedin section 6 to account for all other potential factors.
5.5.2 Type of Purchase
Fact 8. Cash usage varies across types of purchases and venues.
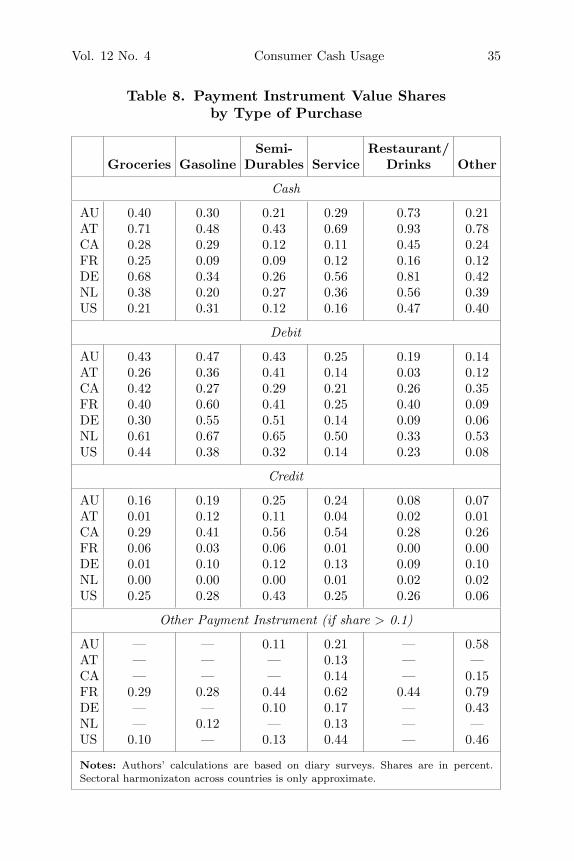
The diaries allow the analysis of cash usage in different sec-tors/for different types of expenditures. We have calculated paymentinstrument shares for cash, debit, and credit for all sectors, summa-rized in table 8. Given country-specific differences in industry sectordefinitions, we stress that harmonization is incomplete, particularlyfor services and “other sectors,” so results should be taken withcaution.
Cross-country differences in payment patterns across differ-ent sectors could be driven by differences in transaction values,card acceptance, or behavioral patterns, or by cultural differences.Accordingly, figure 5 depicts three sectors that we consider interest-ing with regard to these factors.27
First, we suspect that card acceptance at gas stations is almostuniversal, or at least high in all countries. At the same time, thetypical expenditure value is roughly equal in size across countries.This implies that an analysis of cash usage at gas stations shouldgive an indication of the role of acceptance and transaction sizesin explaining the levels of cash usage. That is, if acceptance andtransaction sizes were the only factors driving payment behavior, wewould expect to find fairly equal levels of cash usage in gas stations
27Note that the FR share does not add up to 1 since checks have a non-trivialshare.
Vol. 12 No. 4 Consumer Cash Usage 35
Table 8. Payment Instrument Value Sharesby Type of Purchase
Semi- Restaurant/Groceries Gasoline Durables Service Drinks Other
Cash
AU 0.40 0.30 0.21 0.29 0.73 0.21AT 0.71 0.48 0.43 0.69 0.93 0.78CA 0.28 0.29 0.12 0.11 0.45 0.24FR 0.25 0.09 0.09 0.12 0.16 0.12DE 0.68 0.34 0.26 0.56 0.81 0.42NL 0.38 0.20 0.27 0.36 0.56 0.39US 0.21 0.31 0.12 0.16 0.47 0.40
Debit
AU 0.43 0.47 0.43 0.25 0.19 0.14AT 0.26 0.36 0.41 0.14 0.03 0.12CA 0.42 0.27 0.29 0.21 0.26 0.35FR 0.40 0.60 0.41 0.25 0.40 0.09DE 0.30 0.55 0.51 0.14 0.09 0.06NL 0.61 0.67 0.65 0.50 0.33 0.53US 0.44 0.38 0.32 0.14 0.23 0.08
Credit
AU 0.16 0.19 0.25 0.24 0.08 0.07AT 0.01 0.12 0.11 0.04 0.02 0.01CA 0.29 0.41 0.56 0.54 0.28 0.26FR 0.06 0.03 0.06 0.01 0.00 0.00DE 0.01 0.10 0.12 0.13 0.09 0.10NL 0.00 0.00 0.00 0.01 0.02 0.02US 0.25 0.28 0.43 0.25 0.26 0.06
Other Payment Instrument (if share > 0.1)
AU — — 0.11 0.21 — 0.58AT — — — 0.13 — —CA — — — 0.14 — 0.15FR 0.29 0.28 0.44 0.62 0.44 0.79DE — — 0.10 0.17 — 0.43NL — 0.12 — 0.13 — —US 0.10 — 0.13 0.44 — 0.46
Notes: Authors’ calculations are based on diary surveys. Shares are in percent.Sectoral harmonizaton across countries is only approximate.

36 International Journal of Central Banking December 2016
Figure 5. Value Share of Cash by Location/Activity
0
.2
.4
.6
.8
1
Sha
re (
%)
Cash Debit Credit
AU AT CA FR DE NL US
Gas stations
0
.2
.4
.6
.8
1
Sha
re (
%)
Cash Debit Credit
AU AT CA FR DE NL US
Restaurants/Drinks
0
.2
.4
.6
.8
1
Sha
re (
%)
Cash Debit Credit
AU AT CA FR DE NL US
Groceries
Notes: Sectoral harmonization across countries is only approximate. The shadedarea shows the shares for the respective location/activity. The transparent bardepicts the shares for all consumer expenditures.
across all countries. Indeed, our results suggest that cross-countrydifferences in cash usage are significantly smaller at gas stationsthan for all expenditures. In particular, we find that the cash shareat gas stations for AT and DE drops significantly relative to theoverall cash share.28 This provides a strong indication of the effectsof acceptance and transaction sizes. Despite this finding, we notethat sizable differences across countries still prevail, showing thatacceptance and sizes are not the only factors driving cash usage.
Second, expenditures at bars and fast food restaurants couldbe cash intensive due to convenience. Indeed, the descriptive results
28Huynh, Schmidt-Dengler, and Stix (2014) find that higher acceptance is cor-related with a lower cash share for AT and CA, especially in venues such as gasstations.
Vol. 12 No. 4 Consumer Cash Usage 37
show that the cash share for these transactions is substantially higherthan the overall cash share for all countries except FR, where checksaccount for more than 40 percent of the expenditure value share inthis sector. It is notable that this can also be observed in countriesthat have a high card acceptance rate. Again, this result is an indi-cation that consumers differ in their payment behavior dependingon the spending location, which is not only to be explained by levelsof card acceptance and transaction sizes.
Third, for the grocery sector the cash expenditure share is higherthan the average for all countries except US. Interestingly, the debitshare is higher for all countries except FR, which has a slight increasein credit cards. We conjecture that this fact is associated with conve-nience and/or the market structure of the grocery sector. Regardingthe first issue, cash could be considered a convenient and fast wayto pay for purchases at (small) grocery stores. It might also be cor-related with the size of the location and card acceptance. In mostEuropean countries, grocery stores are smaller than they are in AU,CA, and US. The grocery sector, often having low margins, mightfocus on the cost of payments, which could explain the higher usageof debit.
6. Choosing Cash vs. Non-Cash
Ideally, we would like to use the diary data to estimate econo-metric models to test at least the traditional theoretical models ofmoney demand discussed in section 5, such as the Baumol-Tobinmodel. In particular, merging the diary micro data would provide aninternational database that could allow us to quantify internationaldifferences in consumer behavior. However, institutional and datalimitations prevent us from doing so. Perhaps the most importantlimitation is the lack of individual-level data on basic core variables,such as interest rates on bank account balances or other liquid assetsto proxy for the opportunity cost of cash, which none of the diariesinclude.29
29Briglevics and Schuh (2013a) provide an example of the difficulties withobtaining and constructing individual-specific interest rates for use in aneconometric Baumol-Tobin model. Huynh, Schmidt-Dengler, and Stix (2014) also

38 International Journal of Central Banking December 2016
Therefore, this section investigates the choice of using cash ver-sus non-cash in a multivariate setting. We estimate the probabilityof choosing cash versus non-cash alternatives (either debit or credit)at the POS using the following logit model:
U∗j = Xjβ + εj , where j = Cash, Non-Cash, (1)
where U∗j is the utility of choice j as a function of observables Xj
and a logit error εj . The variables, Xj , used in the regression are (i)transaction size, (ii) cash balances, (iii) sociodemographic character-istics (age, income, education), (iv) consumer perceptions of ease ofuse, acceptance, and cost, and (v) POS transaction characteristics(card acceptance and type of purchase). We attempt to harmonizevariables for all countries, but there are some differences. Please referto table 13 in the appendix for the exact list. The sample contains allindividuals (also those without payment cards) and all transactionsthat are conducted using cash, debit, or credit.
The goal of these estimations is twofold. First, we would liketo quantify which factors exert an impact on consumers’ choiceof whether or not to pay in cash, even when controlling for otherpotential factors. Second, we would like to study whether the use ofcross-country data reveals patterns that are common to all countries.
6.1 Results of Logit Regressions
Table 9 reports the marginal effects on the probability of using cash.Our baseline demographic profile is a person aged thirty-five or lessthat is married, with low education and low income. Overall, thefindings are fairly consistent and highlight that demographics playa major role across countries. Even when controlling for transactionsize and other characteristics, we find that higher income and highereducation are associated with lower cash use.
Regarding age, we find that persons older than thirty-six use sig-nificantly more cash than persons younger than thirty-five. Also, the
estimate a Baumol-Tobin model that exploits perceived acceptance of cards atthe POS and uses imperfect proxies such as risk of theft and whether respondentsrevolve on credit card debt.

Vol. 12 No. 4 Consumer Cash Usage 39Tab
le9.
Cas
hve
rsus
Non
-Cas
hPay
men
tC
hoi
ce(m
argi
nal
effec
ts)
AU
AT
CA
FR
DE
NL
US
Med
ium
Inco
me
−0.
031
−0.
068∗
∗0.
021
−0.
046∗
∗−
0.00
50.
006
−0.
119∗
∗∗
(0.0
17)
(0.0
24)
(0.0
21)
(0.0
17)
(0.0
11)
(0.0
16)
(0.0
2)H
igh
Inco
me
−0.
035
−0.
067∗
∗0.
014
−0.
071∗
−0.
013
−0.
009
−0.
119∗
∗∗
(0.0
19)
(0.0
25)
(0.0
27)
(0.0
31)
(0.0
12)
(0.0
16)
(0.0
25)
Age
d36
to59
0.07
1∗∗∗
0.02
20.
041∗
0.05
1∗∗
0.02
4∗0.
043∗
∗0.
091∗
∗∗
(0.0
17)
(0.0
18)
(0.0
19)
(0.0
17)
(0.0
1)(0
.016
)(0
.023
)A
ged
Ove
r60
0.11
2∗∗∗
0.05
7∗0.
026
0.04
20.
047∗
∗0.
061∗
∗0.
073∗
(0.0
27)
(0.0
24)
(0.0
31)
(0.0
28)
(0.0
18)
(0.0
2)(0
.029
)M
ediu
mE
duca
tion
−0.
04∗
0.04
7−
0.10
6∗∗
−0.
045∗
−0.
034∗
∗∗0.
005
−0.
126∗
∗
(0.0
2)(0
.029
)(0
.039
)(0
.022
)(0
.01)
(0.0
16)
(0.0
47)
Hig
hE
duca
tion
−0.
08∗∗
∗0.
011
−0.
134∗
∗∗−
0.09
7∗∗∗
−0.
085∗
∗∗−
0.03
7∗∗
−0.
194∗
∗∗
(0.0
15)
(0.0
22)
(0.0
4)(0
.027
)(0
.014
)(0
.014
)(0
.046
)N
otH
omeo
wne
r0.
012
0.02
70.
01(0
.014
)(0
.022
)(0
.021
)
Per
cept
ions
of:
Eas
e0.
123∗
∗∗0.
17∗∗
∗0.
212∗
∗∗
(0.0
37)
(0.0
45)
(0.0
35)
Cos
t−
0.04
60.
082
0.03
7(0
.025
)(0
.043
)(0
.045
)Se
curi
ty0.
082∗
∗∗−
0.05
4∗∗
0.06
4∗∗∗
(0.0
16)
(0.0
20)
(0.0
14)
Acc
epta
nce
−0.
023
−0.
080.
054
(0.0
42)
(0.0
45)
(0.0
45)
Car
dA
ccep
tanc
e−
0.10
4∗∗∗
−0.
48∗∗
∗−
0.10
5∗∗∗
−0.
546∗
∗∗
Shar
eat
the
PO
S(0
.025
)(0
.033
)(0
.016
)(0
.041
(con
tinu
ed)

40 International Journal of Central Banking December 2016Tab
le9.
(Con
tinued
)
AU
AT
CA
FR
DE
NL
US
Cas
hon
Han
d0.
002
0.03
8∗∗∗
0.00
5∗∗∗
0.00
1∗∗∗
0.00
2∗∗∗
0.00
6∗∗∗
0.00
3∗∗∗
(0.0
01)
(0.0
1)(0
.001
)(0
)(0
.001
)(0
.001
)(0
.001
)G
asol
ine
−0.
071∗
∗∗−
0.05
6∗∗∗
−0.
008
−0.
161∗
∗∗−
0.09
8∗∗∗
−0.
046∗
0.02
(0.0
14)
(0.0
15)
(0.0
28)
(0.0
27)
(0.0
07)
(0.0
22)
(0.0
19)
Sem
i-du
rabl
es−
0.04
7∗∗∗
−0.
039∗
∗−
0.03
6∗−
0.09
8∗∗∗
−0.
082∗
∗∗0.
06∗∗
∗−
0.06
∗∗
(0.0
12)
(0.0
12)
(0.0
17)
(0.0
16)
(0.0
08)
(0.0
14)
(0.0
19)
Serv
ices
0.08
∗∗0.
053∗
∗∗0.
031
−0.
029∗
0.04
8∗∗∗
0.05
4∗0.
138∗
∗∗
(0.0
25)
(0.0
12)
(0.0
29)
(0.0
14)
(0.0
11)
(0.0
27)
(0.0
19)
Ent
erta
inm
ent
0.16
7∗∗∗
0.15
6∗∗∗
0.10
9∗∗∗
−0.
098∗
∗∗0.
081∗
∗∗0.
269∗
∗∗0.
09∗∗
∗
(0.0
21)
(0.0
12)
(0.0
17)
(0.0
18)
(0.0
12)
(0.0
17)
(0.0
16)
Oth
er(N
otG
roce
ries
)0.
075∗
∗∗0.
122∗
∗∗0.
084∗
∗∗0.
04∗∗
0.06
1∗∗∗
0.16
1∗∗∗
0.40
9∗∗∗
(0.0
17)
(0.0
23)
(0.0
18)
(0.0
15)
(0.0
1)(0
.022
)(0
.04)
TV
Q2
−0.
168∗
∗∗−
0.24
8∗∗∗
−0.
254∗
∗∗−
0.24
1∗∗∗
−0.
117∗
∗∗−
0.11
∗∗∗
−0.
178∗
∗∗
(0.0
22)
(0.0
15)
(0.0
16)
(0.0
35)
(0.0
21)
(0.0
16)
(0.0
16)
TV
Q3
−0.
263∗
∗∗−
0.37
2∗∗∗
−0.
397∗
∗∗−
0.45
4∗∗∗
−0.
243∗
∗∗−
0.26
4∗∗∗
−0.
305∗
∗∗
(0.0
23)
(0.0
15)
(0.0
15)
(0.0
33)
(0.0
2)(0
.015
)(0
.015
)T
VQ
4−
0.36
4∗∗∗
−0.
541∗
∗∗−
0.54
9∗∗∗
−0.
629∗
∗∗−
0.37
3∗∗∗
−0.
417∗
∗∗−
0.46
2∗∗∗
(0.0
23)
(0.0
13)
(0.0
15)
(0.0
28)
(0.0
2)(0
.016
)(0
.017
)O
bser
vati
ons
7,84
117
,303
12,6
527,
549
18,6
768,
233
10,6
71
Note
s:T
hede
pen
dent
vari
able
take
sa
valu
eof
1if
apa
ymen
tis
mad
eby
cash
and
0if
itis
mad
eby
debi
tor
cred
it.R
esul
tsfo
rlo
cati
on(u
rban
/rur
al),
mar
ital
stat
us,ge
nder
,em
ploy
men
tst
atus
,an
dfa
mily
size
are
not
show
n.V
aria
bles
are
defin
edin
tabl
e13
inth
eap
pen
dix.
TV
Q2,
TV
Q3,
and
TV
Q4
deno
teth
ese
cond
tofo
urth
quar
tile
oftr
ansa
ctio
nva
lues
.W
ecl
uste
rst
anda
rder
rors
atth
eper
son
leve
l.St
anda
rder
rors
are
inpa
rent
hese
san
dth
e1,
5,an
d10
per
cent
leve
lsof
sign
ifica
nce
are
deno
ted
by**
*,**
,an
d*,
resp
ecti
vely
.

Vol. 12 No. 4 Consumer Cash Usage 41
results provide support for a certain habit persistence in some coun-tries (AT, AU, DE, NL), where cash use increases homogeneouslywith age: people aged sixty and older are more likely to use cashthan people between the ages of thirty-six and fifty-nine.
For three countries that collected data on consumer perceptionsregarding payment instruments (AT, CA, and US), the perceivedease of using cash was highly significant and positive. This showsthat consumers who rate cash high with regard to ease of use conductmore cash transactions. The perceptions regarding security were dif-ferent, positive versus negative, between AT and CA. The otherperceptions with respect to cost and overall acceptance were not sig-nificant. These results are in line with previous research; see Schuhand Stavins (2010), von Kalckreuth, Schmidt, and Stix (2014b), andArango, Huynh, and Sabetti (2015).
The strongest effect on consumers’ choice between cash andnon-cash was obtained for transaction values, where the estimationresults confirm that the probability of using cash decreases homoge-neously with the transaction value quartile. These results hold acrossall countries. In the fourth transaction value quartile, the probabil-ity of using cash is lower by 42 (NL) to 63 percentage points (FR)relative to the first transaction value quartile.
The results also confirm an independent effect of purchase loca-tion/type of purchase. The baseline category is a durable purchasein the lowest transaction value category. For expenditures at gas sta-tions and for purchases of semi-durables, the marginal effects wereuniversally negative (with the exception of NL), while for services,entertainment, and groceries they were positive. These results con-firm previous results that were based on data from single countries(e.g., Klee 2008; Cohen and Rysman 2013).
Another finding of the logit model is that people who hold highercash balances on average use cash more often than people with lowercash balances. Note, however, that we treat this as indicative onlybecause of the likely presence of reverse causality.30 Although we
30Applying an instrumental-variable approach that is common to all countrieswas impossible, because the survey questionnaires differed too much across coun-tries. Omitting cash balances from the regressions, however, does not affect theother findings.

42 International Journal of Central Banking December 2016
tried to alleviate this issue by using average cash balances of indi-viduals and not cash balances before each transaction, we are awarethat this does not completely solve the problem. For deeper analysesof this issue, we refer to Bouhdaoui and Bounie (2012), Arango et al.(2013), and Eschelbach and Schmidt (2013), who arrive at similarfindings even when accounting for the possible endogeneity of cashbalances.
Several results from our descriptive analysis indicate that cardacceptance is likely to be important in consumers’ choice betweencash and non-cash. This result is reported in table 9, which showsthat the rate of acceptance of cards at the POS has a significantnegative effect on the probability of using cash (results are onlyavailable for AT, CA, DE, and, with limitations, NL). In order tounderstand the quantitative impact of this factor and to study howmuch it contributes to the level of cash usage across countries, weconduct a scenario analysis. In particular, we compare the baselineprobabilities—i.e., the observed frequencies from the data—with thehypothetical values obtained by assigning each person the maximumgroup acceptance observed in the sample. Note that this does notnecessarily mean that acceptance is raised to 1, because this wouldimply a far stretch from reality. Thus, the question we ask is by howmuch cash usage would decline if acceptance were as high as it is forthe income/age group that reports the highest rate of acceptance.31
Figure 6 summarizes the results for the first and fourth transac-tion value (TV) quartile. For TV Q1, the effect on payment choiceis trivial for AT, DE, and NL, while for CA it is significant. There isan almost 10-percentage-point increase in card usage for low-valuetransactions if payment cards were universally accepted. However,at TV Q4 the effect is similar across countries, as the probability ofcard payment increases relative to cash. This would imply that Cana-dians are more likely to pay with cards at all transactions if cardsare universally accepted. High acceptance of cards will only increasecard use for AT and DE when the transaction values are high. ForNL, the effect would be minimal, which indicates that current levels
31This also implies that we do not expect country differences to vanish, as themaximum rate of acceptance can still differ across countries. All other variablesare evaluated at their means.

Vol. 12 No. 4 Consumer Cash Usage 43
Figure 6. Scenario Analysis: High Acceptance0
.2.4
.6.8
1
Card Cash Card Cash Card Cash Card Cash
TV Q1
0.2
.4.6
.81
Card Cash Card Cash Card Cash Card Cash
AT CA DE NL
TV Q4
Notes: The figure compares the unconditional predicted probabilities of cash use(transparent bars) with a scenario in which acceptance is set to the maximumobserved group acceptance (and all other explanatory variables evaluated at themean). The upper (lower) panel refers to transaction values in the first (fourth)quartile.
of acceptance are already relatively high at all transaction quartiles.These results highlight that country differences remain substantial.
6.2 Robustness Analyses
As one important robustness check, we focus on transactions com-pleted at grocery stores and gas stations only. This exercise isinspired by the work of Klee (2008), who uses scanner data from gro-cery stores, and Cohen and Rysman (2013), who use scanner datafrom grocery stores and gas stations.32 The results are reported in
32Klee (2008) focuses mainly on the value of time while controlling forcensus-tract averaged demographics. Her analysis does not have individual
44 International Journal of Central Banking December 2016
table 10. Focusing on these sectors reduces the sample by aboutone-half to two-thirds. The results again confirm the roles of demo-graphics and transaction value. These results are consistent with thefindings of Klee (2008) and Cohen and Rysman (2013). In addition,we find that the results for the other variables do not change; westill find an independent effect for preferences, cash on hand, andpayment location/type of product.
Finally, we perform a few additional robustness checks to ensurethat difference in survey design does not drive the results. One,we estimate a logit using the transactions conducted on the firstday of each diary to compare with the Dutch payment diary, whichonly collected data per respondent for one day. Two, we also gener-ate estimates using only the first three days for AU, AT, DE, andFR that are comparable to those for CA and US. Neither of thesemodifications affects the main results. Three, we estimate the logitconditioning on the sample of respondents who owned a paymentcard (either debit or credit). The results for all sectors and the gasand groceries were quantitatively similar. These robustness checksare available in a supplementary appendix on the IJCB website(http://www.ijcb.org).
7. Reasons for Cross-Country Differences in Cash Usage
The estimation results provide a set of factors that are correlatedwith cash use. To understand why the cash share is higher in AT andDE compared with the other countries, we provide a brief discussionof the following six potential reasons for cross-country differences:(i) payment card acceptance at the POS, (ii) structure of purchases,(iii) shoe-leather costs and opportunity costs, (iv) financial and non-financial incentives, (v) behavioral aspects of payment choice, and(vi) the size of the shadow economy.33
demographics, perceptions, or acceptance of cards. Cohen and Rysman (2013)analyze rich data on grocery purchases and are able to follow consumers over alonger time period. Their paper highlights the role of the transaction size.
33A deeper discussion of these factors is available in a supplementary appendixon the IJCB website (http://www.ijcb.org).

Vol. 12 No. 4 Consumer Cash Usage 45
Tab
le10
.C
ash
vers
us
Non
-Cas
hPay
men
tC
hoi
ceat
Gas
and
Gro
ceri
es(m
argi
nal
effec
ts)
AU
AT
CA
FR
DE
NL
US
Med
ium
Inco
me
−0.
025
−0.
072∗
0.04
2−
0.04
6∗∗
−0.
009
0.00
7−
0.13
3∗∗∗
(0.0
24)
(0.0
33)
(0.0
29)
(0.0
17)
(0.0
14)
(0.0
17)
(0.0
27)
Hig
hIn
com
e−
0.03
9−
0.08
∗0.
002
−0.
073∗
−0.
012
−0.
023
−0.
162∗
∗∗
(0.0
29)
(0.0
34)
(0.0
37)
(0.0
32)
(0.0
15)
(0.0
18)
(0.0
38)
Age
d36
to59
0.08
6∗∗∗
0.01
70.
077∗
∗0.
056∗
∗0.
026
0.02
50.
105∗
∗∗
(0.0
23)
(0.0
26)
(0.0
24)
(0.0
17)
(0.0
14)
(0.0
17)
(0.0
32)
Age
dO
ver
600.
127∗
∗∗0.
040.
080.
042
0.06
9∗∗
0.01
90.
059
(0.0
39)
(0.0
36)
(0.0
43)
(0.0
27)
(0.0
22)
(0.0
21)
(0.0
4)M
ediu
mE
duca
tion
−0.
069∗
0.05
6−
0.07
3−
0.05
3∗−
0.04
3∗∗∗
−0.
005
−0.
138∗
(0.0
28)
(0.0
45)
(0.0
51)
(0.0
23)
(0.0
13)
(0.0
16)
(0.0
61)
Hig
hE
duca
tion
−0.
102∗
∗∗0.
004
−0.
123∗
−0.
106∗
∗∗−
0.11
8∗∗∗
−0.
03∗
−0.
21∗∗
∗
(0.0
21)
(0.0
37)
(0.0
52)
(0.0
28)
(0.0
19)
(0.0
15)
(0.0
6)N
otH
omeo
wne
r0.
035
0.04
60.
053
(0.0
2)(0
.029
)(0
.029
)
(con
tinu
ed)

46 International Journal of Central Banking December 2016Tab
le10
.(C
ontinued
)
AU
AT
CA
FR
DE
NL
US
Per
cept
ions
of:
Eas
e0.
212∗
∗∗0.
161∗
∗0.
24∗∗
∗
(0.0
55)
(0.0
55)
(0.0
48)
Cos
t−
0.07
7∗0.
108
0(0
.037
)(0
.061
)(0
.061
)Se
curi
ty0.
114∗
∗∗−
0.05
5∗0.
045∗
(0.0
24)
(0.0
26)
(0.0
2)A
ccep
tanc
e−
0.13
4∗−
0.05
1−
0.00
8(0
.056
)(0
.076
)(0
.057
)C
ard
Acc
epta
nce
−0.
178∗
∗∗−
0.56
1∗∗∗
−0.
08∗∗
∗−
0.56
5∗∗∗
Shar
eat
the
PO
S(0
.032
)(0
.036
)(0
.018
)(0
.04)
Cas
hon
Han
d0.
003∗
0.05
3∗∗
0.00
6∗∗∗
0.00
1∗∗∗
0.00
3∗∗∗
0.00
6∗∗∗
0.00
2∗∗
(0.0
01)
(0.0
17)
(0.0
01)
(0.0
00)
(0.0
01)
(0.0
01)
(0.0
01)
Gas
olin
e−
0.08
8∗∗∗
−0.
071∗
∗∗−
0.01
1−
0.11
4∗∗∗
−0.
036
0.02
4(0
.017
)(0
.017
)(0
.028
)(0
.008
)(0
.02)
(0.0
2)T
VQ
2−
0.20
1∗∗∗
−0.
273∗
∗∗−
0.26
1∗∗∗
−0.
189∗
∗∗−
0.09
4∗∗∗
−0.
176∗
∗∗
(0.0
29)
(0.0
25)
(0.0
36)
(0.0
28)
(0.0
18)
(0.0
27)
TV
Q3
−0.
302∗
∗∗−
0.40
9∗∗∗
−0.
495∗
∗∗−
0.34
∗∗∗
−0.
207∗
∗∗−
0.33
6∗∗∗
(0.0
3)(0
.023
)(0
.034
)(0
.028
)(0
.018
)(0
.024
)T
VQ
4−
0.42
∗∗∗
−0.
586∗
∗∗−
0.67
7∗∗∗
−0.
481∗
∗∗−
0.31
6∗∗∗
−0.
466∗
∗∗
(0.0
29)
(0.0
21)
(0.0
29)
(0.0
27)
(0.0
21)
(0.0
24)
Obs
erva
tion
s3,
875
6,56
95,
079
7,09
810
,364
4,18
43,
688
Note
s:T
hede
pen
dent
vari
able
take
sa
valu
eof
1if
apa
ymen
tis
mad
eby
cash
and
0if
itis
mad
eby
debi
tor
cred
it.R
esul
tsfo
rlo
cati
on(u
rban
/rur
al),
mar
ital
stat
us,ge
nder
,em
ploy
men
tst
atus
,an
dfa
mily
size
are
not
show
n.V
aria
bles
are
defin
edin
tabl
e13
inth
eap
pen
dix.
TV
Q2,
TV
Q3,
and
TV
Q4
deno
teth
ese
cond
tofo
urth
quar
tile
oftr
ansa
ctio
nva
lues
.W
ecl
uste
rst
anda
rder
rors
atth
eper
son
leve
l.St
anda
rder
rors
are
inpa
rent
hese
san
dth
e1,
5,an
d10
per
cent
leve
lsof
sign
ifica
nce
are
deno
ted
by**
*,**
,an
d*,
resp
ecti
vely
.

Vol. 12 No. 4 Consumer Cash Usage 47
7.1 Card Acceptance at the POS
Tables 4 and 7 illustrate a correlation between card acceptance andcash usage. Table 7 shows that the share of purchases where cardsare accepted is strictly smaller in DE and AT in comparison to CA;no such data are available for the other countries. This pattern canbe observed for all transaction value ranges, but the difference isweaker for the transaction values above the median. This finding,which refers to survey respondents’ subjective perceptions, is con-firmed by the aggregate network data. The first column of table 11,showing the number of POS terminals per 1 million inhabitants,indicates that the POS density is by far the lowest in DE and AT.However, at the same time, we note that the POS density is notmuch higher in NL than it is in AT but there is a much lower cashshare in NL. Yet, Huynh, Schmidt-Dengler, and Stix (2014) showthat card acceptance exerts a strong impact on average cash bal-ances, and table 4 confirms that cash balances are indeed higherin AT and DE. Further, Eschelbach and Schmidt (2013) utilize theGerman diary data to show that higher cash balances correlate withhigher cash usage at the POS.
7.2 Structure of Purchases
The aggregate cash share for a given country could be influenced bythe composition of expenditures, e.g., higher expenditure shares forfood (FR) or for services (US). Additionally, the market structureof retailers could affect the cash share, e.g., if retailers are small orvery large. While the effect of the latter channel is controlled for viacard acceptance, the evidence we have presented in table 8 about thesectoral composition of expenditures does display some differences.We analyze the potential size of this compositional effect by comput-ing a hypothetical cash share that assumes that all countries havethe expenditure structure of Germany utilizing sectoral cash sharesof table 8. These results suggest only minor differences—at most, 2percentage points—in comparison to unadjusted cash shares. Thissuggests that the differences in cash usage are weakly correlated withdifferences in expenditure patterns.

48 International Journal of Central Banking December 2016
Table 11. Number of ATMs and POS Terminals,Incidence of Robbery
POS Density ATM Density Robberies
Australia 32,008 1,362 16.9Austria 12,754 969 48.2Canada 21,045 1,728 86.4Germany 7,221 947 57.9France 19,537 820 190.3Netherlands 15,525 475 92.4United States 17,019 1,385 112.6
Notes: Columns 1 and 2 show “Terminals located in the country: number of respec-tive terminals per million inhabitants.” Source: BIZ “CPSS Red Book statisticalupdate” (Table 11b) and ECB Statistical Data Warehouse, values from 2011. Col-umn 3 shows the number of robbery cases per 100,000 inhabitants. According to theUnited Nations Office on Drugs and Crime (UNODC) definition, “robbery” meansthe theft of property from a person, overcoming resistance by force or threat of force.Where possible, the category “Robbery” should include muggings (bag snatching)and theft with violence, but should exclude pickpocketing and extortion. Source:UNODC, values from 2011.
7.3 Shoe-Leather Costs and Opportunity Costs
Shoe-leather and opportunity costs, such as ATM density, risk oftheft, and interest rate differentials, have been used to explain thedifference in cash use. First, table 11 shows that the lowest ATMdensity is in FR and NL, which have a low share of cash usage andlow cash balances. AT and DE are in the mid-range of observedvalues, while the highest ATM density is found in AU, CA, andUS. This provides mixed evidence as to whether having high ATMdensity is negatively correlated with low cash share.
Second, table 11 summarizes the number of robberies per 100,000inhabitants. Again the figures only provide partial support for thehigh cash share in AT and DE. These two countries have a lowercrime rate than CA, US, FR, and NL. However, AU has the lowestrobbery density. Hence, high cash balances and high cash use couldbe due to low crime rates in AT and DE.
Third, interest rate differentials are unlikely to explain much ofthe cross-country differences in cash use. Given the average size of

Vol. 12 No. 4 Consumer Cash Usage 49
cash balances, forgone interest income is small in absolute termsand cross-country interest differentials are small; see table 2 for asummary of interest rates.
7.4 Payment Steering through Financial andNon-financial Incentives
Table 12 summarizes the various financial and non-financial incen-tives for consumers to use payment methods. In CA and FR, theusage of surcharges is forbidden by the contractual rules of the pay-ment schemes. In AU, AT, DE, NL, and in most US states, retailersare legally allowed to surcharge, but, as in CA and FR, the inci-dence of surcharging for POS payments is still rather low.34 In allseven countries, retailers seem to sometimes provide discounts oncash payments, but for most consumer payments, cash discounts arenot usual. Hence, the large cash usage in AT and DE does not seemto stem from differences in terms of surcharges and discounts appliedby retailers.
Similarly, the larger use of cash in AT and DE does not seem tostem from differences in non-financial incentives used by merchants.In FR and NL, retailers have started various initiatives to stimu-late card payments as opposed to cash payments, i.e., using stick-ers, special “card-only” registers, and explicitly asking consumersto pay by card. In the other five countries too, retailers use var-ious methods to steer customers’ payment behavior. However, inmost cases, this involves steering consumers away from using high-cost payment cards to less expensive card alternatives, or from usingcards for small transactions. Hence, there is no clear pattern of retail-ers steering clients away from cash in the countries where cash usageis significantly lower than in AT and DE.
The countries considered in this study differ in terms of initiativestaken by banks and card schemes to stimulate the use of paymentcards. In AU, CA, FR, and US, consumers may receive rewardswhen using (particular) payment cards. However, in AT and DE,
34For instance, in AU, the incidence of surcharges being paid was estimated bya payment diary study conducted in November 2013 at around 4 percent of cardtransactions; see Ossolinski, Lam, and Emery (2014).

50 International Journal of Central Banking December 2016Tab
le12
.O
verv
iew
ofPay
men
tM
arke
tStr
uct
ure
AU
AT
CA
FR
DE
NL
US
Issu
rcha
rgin
gal
low
ed?
Yes
Yes
No
No
Yes
Yes
Yes
Do
reta
ilers
surc
harg
epa
rtic
ular
met
hods
?Y
esN
oY
esN
oY
esY
esY
es
Do
reta
ilers
prov
ide
disc
ount
sof
cash
?Y
esY
esY
esY
esY
esY
esY
es
Do
reta
ilers
use
othe
r,no
n-fin
anci
alin
cent
ives
tost
eer
cons
umer
s(e
.g.,
stic
kers
,po
ster
sat
the
PO
S)?
Yes
No
Yes
Yes
Yes
Yes
Yes
Are
reta
ilers
allo
wed
tono
tac
cept
part
icul
arca
shde
nom
inat
ions
?Y
esY
esY
esN
oY
esY
esY
es
Hav
eba
nks
and
othe
ror
gani
zati
ons
laun
ched
init
iati
ves
tost
imul
ate
part
icul
arpa
ymen
tbe
havi
or(e
.g.,
nati
onal
cam
paig
ns)?
Yes
Yes
Yes
Yes
No
Yes
No
Wer
eth
ese
init
iati
ves
take
nby
each
orga
niza
tion
join
tly?
Yes
No
No
Yes
—Y
es—
Do
cons
umer
sge
tre
war
dsfo
rus
ing
card
s?Y
esN
oY
esY
esY
esN
oY
es
Do
cons
umer
sne
edto
pay
whe
nw
ithd
raw
ing
cash
from
anA
TM
ofth
eir
own
bank
?
No
No
Yes
No
No
No
No
Do
cons
umer
sne
edto
pay
whe
nw
ithd
raw
ing
cash
from
anA
TM
ofan
othe
rba
nk?
Yes
No
Yes
Yes
Yes
No
Yes
Note
s:T
his
tabl
eis
colle
cted
from
anin
form
alsu
rvey
ofth
eco
-aut
hors
from
each
resp
ecti
veco
untr
y.Fo
rbr
evity,
we
deno
teth
ere
spon
sew
ith
eith
erY
esor
No.
How
ever
,th
ere
are
som
enu
ance
sto
each
ofth
equ
esti
ons,
and
ade
taile
dta
ble
isav
aila
ble
upon
requ
est.

Vol. 12 No. 4 Consumer Cash Usage 51
card rewards are only minor. This may partly explain the relativelylow card usage in AT and DE. In addition, in AU, CA, FR, and NL,nationwide campaigns have been used by card schemes, banks, andin some cases retail organizations, to promote the use and accep-tance of payment cards and contactless payments among consumersand retailers. In AT, DE, and US, by contrast, promotional activi-ties of banks and card schemes to stimulate (contactless) card usageare mainly limited to basic marketing activities. So, overall, the useof rewards and/or promotion campaigns for card payments in AU,CA, FR, NL, and US may have affected consumers’ preferences andfinally explain the relatively low usage of cash, as opposed to ATand DE, where both the use of rewards and promotion campaignsare limited.
Finally, differences in pricing of ATM withdrawals may affectconsumers’ payment choices. However, it is difficult to tell to whatextent this may explain the differences across our seven countries. InAT, consumers can withdraw money at no cost at either an ATM oftheir own bank or another bank’s ATM. However, the same is truein the NL. In all other countries, consumers may be faced with afee, depending on the ATM they visit or the banking packages theyhave. Hence, there is no clear one-on-one relationship between ATMfees and cash usage.
7.5 Behavioral Aspects
There have been several behavioral explanations offered to explainpayment choice. For example, von Kalckreuth, Schmidt, and Stix(2014b) show that cash is used by some consumers because it helpsto monitor expenditures. However, Hernandez, Jonker, and Kosse(2016) argue that cards may be used for the same purpose too.Budgeting features (e.g., frequency, actuality, and level of detail ofaccount statements) of payment instruments may differ across coun-tries. Therefore, someone who aims to keep track of their expensescould be a heavy cash user in DE, but in US or FR, for example,they could be a check user or a person who keeps a written recordof their expenses.
The inter-war and post-World War II experience of very highinflation in AT and DE is sometimes cited as a reason for a preference

52 International Journal of Central Banking December 2016
for cash.35 Although difficult to prove, we are skeptical about the rel-evance of this line of reasoning to explain payment behavior. First,one would suspect that the direct effect of previous high inflationhistory would be to use less (and not more) cash. Second, even ifone recognizes that it is debt aversion that matters, according towhich Germans and Austrians could use cash because they dislikedebt, then one would presume that AT and DE use fewer creditcards and more debit cards (which is confirmed by our results), butnot necessarily more cash. Third, in figure 3 we have documentedthat cash use by young AT and DE cohorts, which were not affectedby any crisis, is also much higher than in the other countries.
A more relevant explanation for cash preference arises if a coun-try has a history of banking crisis, which often coincides with highinflation and may affect trust in banks; see Stix (2013). However, thiseffect has been shown only for emerging economies, and we considerit unlikely that people in AT or DE trust their banks less than peoplefrom other developed countries. For AT, Knell and Stix (2015) showthat trust in banks is very high. Moreover, evidence suggests thatmemories of a banking crisis fade after about twenty years; see Osiliand Paulson (2014). Other behavioral aspects of payment behaviorare similarly hard to investigate. Anonymity and security concernsare sometimes cited as influencing people’s payment behavior. How-ever, the level of anonymity and security people require when makingpayments is difficult to measure empirically.
7.6 Size of the Shadow Economy
The size of the shadow economy may have an impact on currency incirculation and hence on average cash balances. Therefore, it mayalso affect cash use for “official” transactions that are observed indiaries. In fact, a comparison of twenty-seven European Union coun-tries reveals a strong negative correlation between the size of theshadow economy and the use of electronic payments; see figure 9 ofAT Kearney (2013). Internationally comparable figures for the sizeof the gray economy are provided by Schneider and Buehn (2012)
35“Why Germans Pay Cash for Almost Everything,” http://qz.com/262595/why-germans-pay-cash-for-almost-everything (accessed November 28, 2014).

Vol. 12 No. 4 Consumer Cash Usage 53
and reveal that US has the lowest gray economy share with 9.1 per-cent of official GDP, and CA, FR, and DE have the highest share,with about 15 percent. AT has the second lowest share (11 percent).In other words, we find little evidence for a correlation between thesize of the shadow economy and the use of cash for payments in oursample countries.
8. Conclusions
Many have predicted and espoused the view that cash is increas-ingly disappearing as a payment instrument; see Wolman (2012).However, to paraphrase Mark Twain, we would say that the reportsof the death of cash have been greatly exaggerated. This paper showsthat in all seven countries considered, cash is still used extensively—particularly for low-value transactions. In some European countriessuch as Austria and Germany, cash even dominates consumer pay-ment choices for all transaction values.
This paper demonstrates that, apart from transaction sizes andconsumer preferences for ease of use, the use of cash is strongly corre-lated with demographics and POS characteristics such as merchantcard acceptance and venue. This largely confirms the results of ear-lier studies that were based on data from only one or a small numberof countries. Our finding that these results can be observed for allseven countries assures us that these are universal factors drivingcash use.
Our paper signals the importance of cross-country differences.First, the level of cash usage differs across the various countries.Second, differences can be found in the type of alternatives usedfor cash. Some countries often use credit cards as a substitute; inother countries, mainly debit cards are used. One explanation forthese cross-country differences could be found in differences in cardacceptance and the pricing and stimulation policies of retail pay-ments banks, payment schemes, and retailers. Rysman (2009), forinstance, highlights how market structure affects payments, or viceversa. Third, we point to an important correlation between cash useand the amount of cash balances consumers carry. The direction ofthe correlation remains unclear.

54 International Journal of Central Banking December 2016
This paper has provided a comprehensive harmonization of pay-ment diaries so as to understand cross-country differences. We havehighlighted substantial cross-country differences that remain unex-plained, and, given the remaining questions on the role and effect ofcash balances, further work is required to more fully ascertain theunderlying drivers of consumers’ use of cash and alternative pay-ment methods. Further, we provide a comprehensive review of workcompleted and outline possibilities for future research.36
Appendix
Table 13. Definition of Payment Variables
Income Three dummy variables; 1 if income is in thehighest income tercile (High Income), lowestincome tercile (Low Income), or the middleincome tercile (Medium Income), and 0otherwise.
Age Three dummy variables; 1 if age of respondents isabove 60 (Aged over 60), between 36 and 59(Aged 36 to 59), or between 18 and 35 (Agedunder 36), and 0 otherwise.
Education Three dummy variables: low education, middleeducation, and high education. Although theexact definitions depend on the country, thedefinitions are based on whether a respondenthas finished mandatory schooling, secondaryschooling, and some post-secondary education.
Not Homeowner Dummy variable; 1 if respondent does not own hisplace of residence.
Perceptions The analysis employs perceptions on ease of use,cost, security, and acceptance. These arederived from the question as to how much cashfulfills the listed attributes. The values are
(continued)
36The supplementary appendix on the IJCB website contains a discussion ofthe current research conducted and an overview of new potential research avenuesusing payment diaries.

Vol. 12 No. 4 Consumer Cash Usage 55
Table 13. (Continued)
normalized by results for other methods ofpayment, such that a positive (negative) valueimplies that cash is valued better (worse) thancase or credit. The normalization is described inArango, Huynh, and Sabetti (2015).
Cash on Hand Defined as the usual (average) cash holdings of aperson. Values for AU and NL are from thequestionnaire (“typical” average cash balance);all other values are from the diary. We drop allobservations above the 99.5 percent mark andnormalize this variable. As a consequence,“Cash on Hand” is a unitless scalar.
Type of Purchase Several dummy variables; 1 if purchase is classifiedas grocery, gas station, semi-durable, services,or entertainment, and 0 otherwise.
Transaction ValueQuartiles
Quartiles are formed from all observed transactionvalues. Four dummy variables, which are 1 if atransaction falls in trasaction value quartile 1 to4 (TV Q1 to TV Q4), and 0 otherwise.
Card AcceptanceShare
Respondents indicate whether a transaction couldhave been conducted by card. From theseobservations, we calculate the share oftransactions with card acceptance for eachindividual. To avoid endogeneity, we thencalculate the mean of individual card acceptanceshares for nine pre-specified population groupsthat are formed from three income and threeage groups. “Acceptance Group” thus reflectsthe mean acceptance of the income/educationpopulation group that a respondent belongs to.
References
Ahmed, N., M. Brzozowski, and T. Crossley. 2006. “MeasurementErrors in Recall Food Consumption Data.” Working Paper No.W06/21, Institute for Fiscal Studies.
Alvarez, F., and F. Lippi. 2009. “Financial Innovation and the Trans-actions Demand for Cash.” Econometrica 77 (2): 363–402.

56 International Journal of Central Banking December 2016
———. 2013. “The Demand of Liquid Assets with UncertainLumpy Expenditures.” Available at http://dx.doi.org/10.1016/j.jmoneco.2013.05.008.
Amromin, G., and S. Chakravorti. 2009. “Whither Loose Change?The Diminishing Demand for Small-Denomination Currency.”Journal of Money, Credit and Banking 41 (2–3): 315–35.
Arango, C., Y. Bouhdaoui, D. Bounie, M. Eschelbach, and L.Hernandez. 2013. “Cash Management and Payment Choices:A Simulation Model with International Comparisons.” WorkingPaper No. 2013-53, Bank of Canada.
Arango, C., K. Huynh, and L. Sabetti. 2015. “Consumer PaymentChoice: Merchant Card Acceptance versus Pricing Incentives.”Journal of Banking and Finance 55 (June): 130–41.
AT Kearney. 2013. “The Shadow Economy in Europe, 2013.” Dis-cussion Paper. Available at http://goo.gl/yBRMZO.
Attanasio, O. R., L. Guiso, and T. Jappelli. 2002. “The Demandfor Money, Financial Innovation, and the Welfare Cost of Infla-tion: An Analysis with Household Data.” Journal of PoliticalEconomy 110 (2): 317–51.
Avery, R. B., G. E. Elliehausen, A. B. Kennickell, and P. A. Spindt.1986. “The Use of Cash and Transaction Accounts by AmericanFamilies.” Federal Reserve Bulletin (Feb): 87–108.
Baumol, W. 1952. “The Transactions Demand for Cash: An Inven-tory Theoretic Approach.” Quarterly Journal of Economics 66(4): 545–56.
Bethlehem, J. 2008. “Representativity of Web Surveys — An Illu-sion?” In Access Panels and Online Research, Panacea or Pit-fall? ed. I. Stoop and M. Wittenberg, 19–44. (Proceedings ofthe DANS Symposium, Amsterdam, October 12.) Amsterdam:Uitgerverij Aksant.
Boeschoten, W. C. 1992. Currency Use and Payment Patterns.Kluwer Academic Publishers.
———. 1998. “Cash Management, Payment Patterns and theDemand for Money.” De Economist 146 (1): 117–42.
Boeschoten, W. C., and M. M. G. Fase. 1989. “The Way We Paywith Money.” Journal of Business and Economic Statistics 7 (3):319–26.
Bolt, W., D. Humphrey, and R. Uittenbogaard. 2008. “Trans-action Pricing and the Adoption of Electronic Payments: A

Vol. 12 No. 4 Consumer Cash Usage 57
Cross-Country Comparison.” International Journal of CentralBanking 4 (1): 89–123.
Borzekowski, R., E. K. Kiser, and A. Shaista. 2008. “Consumers’Use of Debit Cards: Patterns, Preferences, and Price Response.”Journal of Money, Credit and Banking 40 (1): 149–72.
Bouhdaoui, Y., and D. Bounie. 2012. “Modeling the Share of CashPayments in the Economy: An Application to France.” Interna-tional Journal of Central Banking 8 (4): 175–95.
Bounie, D., and A. Francois. 2008. “Is Baumol’s ‘Square Root Law’Still Relevant? Evidence from Micro-Level Data.” Applied Finan-cial Economics 18 (13): 1091–98.
Briglevics, T., and S. Schuh. 2013a. “This Is What’s in Your Wallet. . . and How You Use It.” Mimeo.
———. 2013b. “U.S. Consumer Demand for Cash in the Era of LowInterest Rates and Electronic Payments.” Working Paper No.13-23, Federal Reserve Bank of Boston.
Carow, K. A., and M. E. Staten. 1999. “Debit, Credit, or Cash: Sur-vey Evidence on Gasoline Purchases.” Journal of Economics andBusiness 51 (5): 409–21.
Ching, A. T., and F. Hayashi. 2010. “Payment Card Rewards Pro-grams and Consumer Payment Choice.” Journal of Banking andFinance 34 (8): 1773–87.
Cohen, M., and M. Rysman. 2013. “Payment Choice with Con-sumer Panel Data.” Available at http://dx.doi.org/10.2139/ssrn.2308121.
Crossley, T. F., and J. K. Winter. 2012. “Asking Households aboutExpenditures: What Have We Learned?” In Improving the Meas-urement of Consumer Expenditures, ed. C. D. Carroll, T. F.Crossley, and J. Sabelhaus. University of Chicago Press andNational Bureau of Economic Research.
Daniels, K. N., and N. B. Murphy. 1994. “The Impact of Technologi-cal Change on the Currency Behavior of Households: An Empiri-cal Cross-Section Study.” Journal of Money, Credit and Banking26 (4): 867–74.
Danish National Bank. 2013. “Rapport om nye betalingsl øsninger.”Available at http://goo.gl/ruzBdq.
Eschelbach, M., and T. Schmidt. 2013. “Precautionary Motives inShort-Term Cash Management: Evidence from German POS

58 International Journal of Central Banking December 2016
Transactions.” Discussion Paper No. 38/2013, Deutsche Bundes-bank, Research Centre.
European Central Bank. 2012. “Virtual Currency Schemes.”Available at http://www.ecb.europa.eu/pub/pdf/other/virtualcurrencyschemes201210en.pdf.
Eurosystem Household Finance and Consumption Network. 2009.“Survey Data on Household Finance and Consumption: ResearchSummary and Policy Use.” ECB Occasional Paper No. 100.
Evans, D. S., K. Webster, G. K. Colgan, and S. R. Murray. 2013.“Paying with Cash: A Multi-Country Analysis of the Past andFuture of the Use of Cash for Payments by Consumers.” Avail-able at http://dx.doi.org/10.2139/ssrn.2273192.
Federal Reserve System. 2013. “The 2013 Federal Reserve PaymentsStudy: Recent and Long-Term Payment Trends in the UnitedStates: 2003–2012.” Available at http://goo.gl/qOnIkJ.
Feenstra, R. C., R. E. Lipsey, L. G. Branstetter, C. F. Foley, J. Har-rigan, J. B. Jensen, L. Kletzer, C. Mann, P. K. Schott, and G.C. Wright. 2010. “Report on the State of Available Data for theStudy of International Trade and Foreign Direct Investment.”NBER Working Paper No. 16254.
Fischer, B., P. Kohler, and F. Seitz. 2004. “The Demand for EuroArea Currencies: Past, Present and Future.” ECB Working PaperNo. 330.
Fusaro, M. A. 2013. “Why Do People Use Debit Cards: Evi-dence from Checking Accounts.” Economic Inquiry 51 (4):1986–2001.
Hayashi, F., and E. Klee. 2003. “Technology Adoption and Con-sumer Payments: Evidence from Survey Data.” Review of Net-work Economics 2 (2): 175–90.
Hernandez, L., N. Jonker, and A. Kosse. 2016. “Cash versus DebitCard: The Role of Budget Control.” Journal of ConsumerAffairs. doi: 10.1111/joca12112.
Humphrey, D. B., L. B. Pulley, and J. M. Vesala. 1996. “Cash, Paper,and Electronic Payments: A Cross-Country Analysis.” Journal ofMoney, Credit and Banking 28 (4): 914–39.
Huynh, K., P. Schmidt-Dengler, and H. Stix. 2014. “The Role ofCard Acceptance in the Transaction Demand for Money.” Work-ing Paper No. 14-44, Bank of Canada.

Vol. 12 No. 4 Consumer Cash Usage 59
Jack, W., T. Suri, and R. Townsend. 2010. “Monetary Theory andElectronic Money: Reflections on the Kenyan Experience.” Eco-nomic Quarterly (Federal Reserve Bank of Richmond) (1Q):83–122.
Jonker, N. 2007. “Payment Instruments as Perceived by Consumers— Results from a Household Survey.” De Economist 155 (3):271–303.
Jonker, N., and A. Kosse. 2013. “Estimating Cash Usage: TheImpact of Survey Design on Research Outcomes.” De Economist161 (1): 19–44.
Jonker, N., A. Kosse, and L. Hernandez. 2012. “Cash Usage in theNetherlands: How Much, Where, When, Who and Whenever OneWants?” Occasional Studies (De Nederlandsche Bank) 10 (2).
Judson, R. 2012. “Crisis and Calm: Demand for U.S. Currency atHome and Abroad from the Fall of the Berlin Wall to 2011.”International Finance Discussion Paper No. 1058, Board of Gov-ernors of the Federal Reserve System.
Klee, E. 2008. “How People Pay: Evidence from Grocery StoreData.” Journal of Monetary Economics 55 (3): 526–41.
Knell, M., and H. Stix. 2015. “Trust in Banks during Normal andCrisis Times—Evidence from Survey Data.” Economica 82 (Sup-plement 1): 995–1020.
Lippi, F., and A. Secchi. 2009. “Technological Change and theHouseholds’ Demand for Currency.” Journal of Monetary Eco-nomics 56 (2): 222–30.
McWhinney, I., and H. E. Champion. 1974. “The Canadian Experi-ence with Recall and Diary Methods in Consumer ExpenditureSurveys.” Annals of Economic and Social Measurement 3 (2):411–35.
Mooslechner, P., and G. Wehinger. 1997. “Aspekte des Zahlungsver-haltens privater Haushalte in Osterreich.” Berichte und Studien4: 44–65.
Mulligan, C. B., and X. Sala-i-Martin. 2000. “Extensive Marginsand the Demand for Money at Low Interest Rates.” Journal ofPolitical Economy 108 (5): 961–91.
Osili, U. O., and A. Paulson. 2014. “Crises and Confidence: SystemicBanking Crises and Depositor Behavior.” Journal of FinancialEconomics 111 (3): 646–60.

60 International Journal of Central Banking December 2016
Ossolinski, C., T. Lam, and D. Emery. 2014. “The Changing WayWe Pay: Trends in Consumer Payments.” Research DiscussionPaper No. 2014-05, Reserve Bank of Australia.
Rysman, M. 2007. “An Empirical Analysis of Payment Card Usage.”Journal of Industrial Economics 55 (1): 1–36.
———. 2009. “The Economics of Two-Sided Markets.” Journal ofEconomic Perspectives 23 (3): 125–43.
Schmidt, T. 2014. “Consumers’ Recording Behaviour in PaymentDiaries—Empirical Evidence from Germany.” Survey Methods:Insights from the Field (August). Peer-reviewed online journalavailable at http://surveyinsights.org.
Schmiedel, H., G. Kostova, and W. Ruttenberg. 2013. “The Socialand Private Costs of Retail Payment Instruments: A Euro-pean Perspective.” Journal of Financial Market Infrastructures2 (1).
Schneider, F., and A. Buehn. 2012. “Shadow Economies in HighlyDeveloped OECD Countries: What Are the Driving Forces?”Discussion Paper No. 6891, Institute for the Study of Labor(IZA).
Schuh, S., and J. Stavins. 2010. “Why Are (Some) Consumers(Finally) Writing Fewer Checks? The Role of Payment Char-acteristics.” Journal of Banking and Finance 34 (8): 1745–58.
———. 2014. “The 2011 and 2012 Surveys of Consumer PaymentChoice.” Research Data Report No. 14-01, Federal Reserve Bankof Boston.
Simon, J., K. Smith, and T. West. 2010. “Price Incentives and Con-sumer Payment Behaviour.” Journal of Banking and Finance 34(8): 1759–72.
Stavins, J. 2002. “Effect of Consumer Characteristics on the Useof Payment Instruments.” New England Economic Review (Q3):19–31.
Stix, H. 2013. “Why Do People Save in Cash? Distrust, Memories ofBanking Crises, Weak Institutions and Dollarization.” Journalof Banking and Finance 37 (11): 4087–4106.
Sudman, S., and R. Ferber. 1971. “Experiments in Obtaining Con-sumer Expenditures by Diary Methods.” Journal of the Ameri-can Statistical Association 66 (336): 725–35.

Vol. 12 No. 4 Consumer Cash Usage 61
Summers, R., and A. Heston. 1991. “The Penn World Table (Mark5): An Expanded Set of International Comparisons, 1950-1988.”Quarterly Journal of Economics 106 (2): 327–68.
Takacs, K. 2011. “A magyar ha´ztarta´sok fizete´si szoka´sai [Pay-ment Habits of Hungarian Households].” Occasional Paper No.98-2011, Magyar Nemzeti Bank. Available only in Hungarian.
Tobin, J. 1956. “The Interest-Elasticity of Transactions Demand forCash.” Review of Economics and Statistics 38 (3): 241–47.
UK Payments Council. 2013. “Trends in Consumer Holdingsand the Use of Different Payment Methods.” Available athttp://www.paymentscouncil.org.uk.
Velde, F. 2013. “Bitcoin: A Primer.” Chicago Fed Letter 317 (Decem-ber).
von Kalckreuth, U., T. Schmidt, and H. Stix. 2014a. “Choosing andUsing Payment Instruments: Evidence from German Microdata.”Empirical Economics 46 (3): 1019–55.
———. 2014b. “Using Cash to Monitor Expenditures: Implicationsfor Payments, Currency Demand, and Withdrawal Behavior.”Journal of Money, Credit and Banking 46 (8): 1753–86.
Whitesell, W. C. 1989. “The Demand for Currency versus DebitableAccounts: A Note.” Journal of Money, Credit and Banking 21(2): 246–57.
Wolman, D. 2012. The End of Money: Counterfeiters, Preachers,Techies, Dreamers—and the Coming Cashless Society. First edi-tion. Da Capo Press.


![WORKERS’ BENEFITS - Federation of Filipino Chinese ... · WORKERS’ BENEFITS . FOR RETAIL & SERVICE ESTABLISHMENTS ... [Article 95 of the labor Code] Usage/Commutation to Cash:](https://img.pdfslide.net/doc/110x75/5b9ec59109d3f2d7748d0542/workers-benefits-federation-of-filipino-chinese-workers-benefits.jpg)