Embed Size (px)
Citation preview

CONVERSION OF THE BAND DIAGRAM PROGRAM:
A LOOK AT PORTABILITY, EFFICIENCY AND EASE
OF USE.
by
Michael Lavern Baker
A project
submitted in partial fulfillment
of the requirements for the degree of
Master of Science in Computer Science
Boise State University
October 2010

c© 2010Michael Lavern Baker
ALL RIGHTS RESERVED

BOISE STATE UNIVERSITY GRADUATE COLLEGE
DEFENSE COMMITTEE AND FINAL READING APPROVALS
of the project submitted by
Michael Lavern Baker
Thesis Title: Conversion of the Band Diagram Program: A Look at Portability,Efficiency and Ease of Use.
Date of Final Oral Examination: 08 October 2010
The following individuals read and discussed the thesis submitted by student MichaelLavern Baker, and they evaluated his presentation and response to questions dur-ing the final oral examination. They found that the student passed the final oralexamination.
Amit Jain, Ph.D. Chair, Supervisory Committee
William Knowlton, Ph.D. Member, Supervisory Committee
Teresa Cole, Ph.D. Member, Supervisory Committee
The final reading approval of the thesis was granted by Amit Jain, Ph.D., Chair,Supervisory Committee. The thesis was approved for the Graduate College by JohnR. Pelton, Ph.D., Dean of the Graduate College.
ACKNOWLEDGMENTS
I would like to first and foremost express gratitude to my wife for her support and
understanding during this project. Without her this would not have been possible.
I would like to thank my children for their understanding during the time it has
taken to complete this project.
I would also like to thank Amit Jain, Bill Knowlton and Teresa Cole for their
invaluable work as advisors and committee members on this project.
Lastly, I would like to thank Richard Southwick III for his work on the original
Band Diagram program and his help and insight during the conversion process.
iv
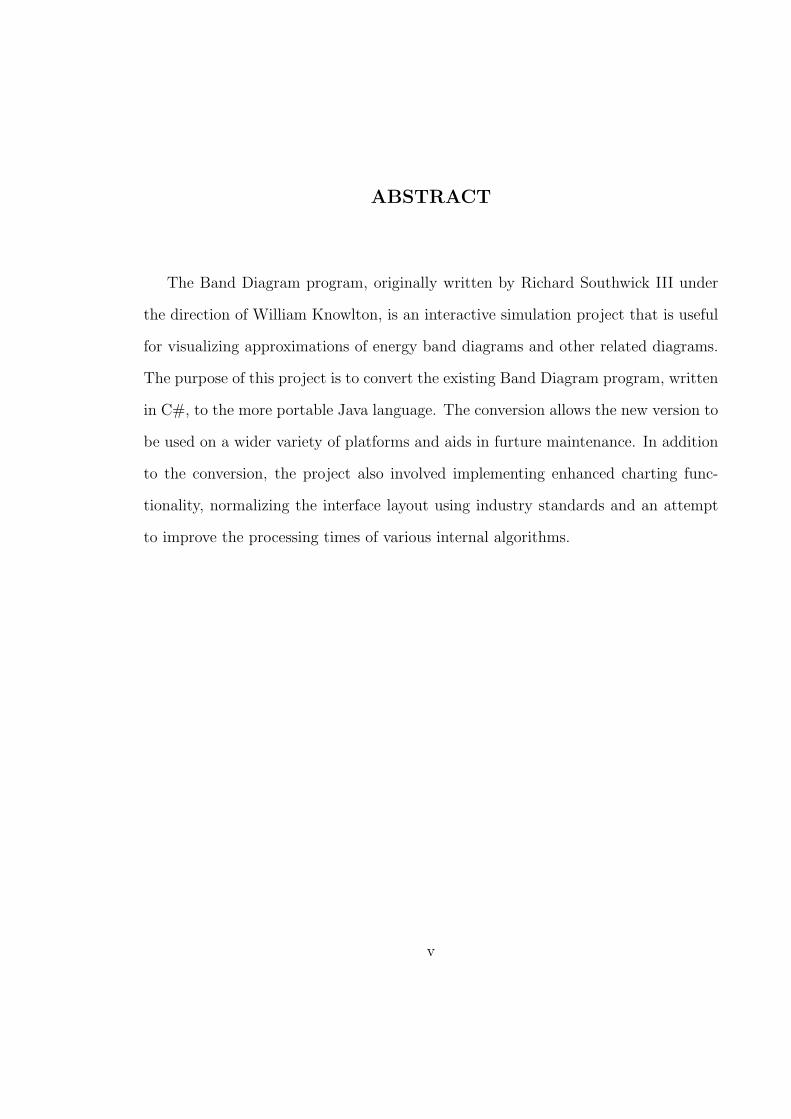
ABSTRACT
The Band Diagram program, originally written by Richard Southwick III under
the direction of William Knowlton, is an interactive simulation project that is useful
for visualizing approximations of energy band diagrams and other related diagrams.
The purpose of this project is to convert the existing Band Diagram program, written
in C#, to the more portable Java language. The conversion allows the new version to
be used on a wider variety of platforms and aids in furture maintenance. In addition
to the conversion, the project also involved implementing enhanced charting func-
tionality, normalizing the interface layout using industry standards and an attempt
to improve the processing times of various internal algorithms.
v
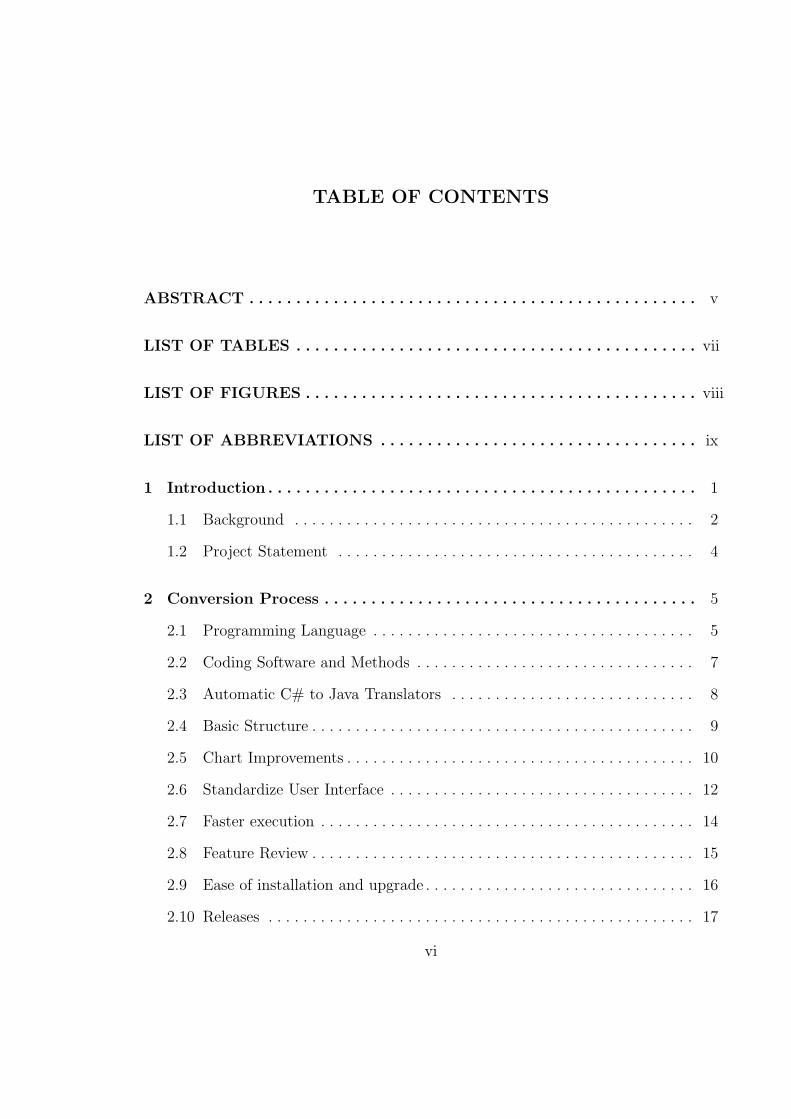
TABLE OF CONTENTS
ABSTRACT . . . . . . . . . . . . . . . . . . . . . . . . . . . . . . . . . . . . . . . . . . . . . . . . v
LIST OF TABLES . . . . . . . . . . . . . . . . . . . . . . . . . . . . . . . . . . . . . . . . . . . vii
LIST OF FIGURES . . . . . . . . . . . . . . . . . . . . . . . . . . . . . . . . . . . . . . . . . . viii
LIST OF ABBREVIATIONS . . . . . . . . . . . . . . . . . . . . . . . . . . . . . . . . . . ix
1 Introduction . . . . . . . . . . . . . . . . . . . . . . . . . . . . . . . . . . . . . . . . . . . . . . 1
1.1 Background . . . . . . . . . . . . . . . . . . . . . . . . . . . . . . . . . . . . . . . . . . . . . . 2
1.2 Project Statement . . . . . . . . . . . . . . . . . . . . . . . . . . . . . . . . . . . . . . . . . 4
2 Conversion Process . . . . . . . . . . . . . . . . . . . . . . . . . . . . . . . . . . . . . . . . 5
2.1 Programming Language . . . . . . . . . . . . . . . . . . . . . . . . . . . . . . . . . . . . . 5
2.2 Coding Software and Methods . . . . . . . . . . . . . . . . . . . . . . . . . . . . . . . . 7
2.3 Automatic C# to Java Translators . . . . . . . . . . . . . . . . . . . . . . . . . . . . 8
2.4 Basic Structure . . . . . . . . . . . . . . . . . . . . . . . . . . . . . . . . . . . . . . . . . . . . 9
2.5 Chart Improvements . . . . . . . . . . . . . . . . . . . . . . . . . . . . . . . . . . . . . . . . 10
2.6 Standardize User Interface . . . . . . . . . . . . . . . . . . . . . . . . . . . . . . . . . . . 12
2.7 Faster execution . . . . . . . . . . . . . . . . . . . . . . . . . . . . . . . . . . . . . . . . . . . 14
2.8 Feature Review . . . . . . . . . . . . . . . . . . . . . . . . . . . . . . . . . . . . . . . . . . . . 15
2.9 Ease of installation and upgrade . . . . . . . . . . . . . . . . . . . . . . . . . . . . . . . 16
2.10 Releases . . . . . . . . . . . . . . . . . . . . . . . . . . . . . . . . . . . . . . . . . . . . . . . . . 17
vi
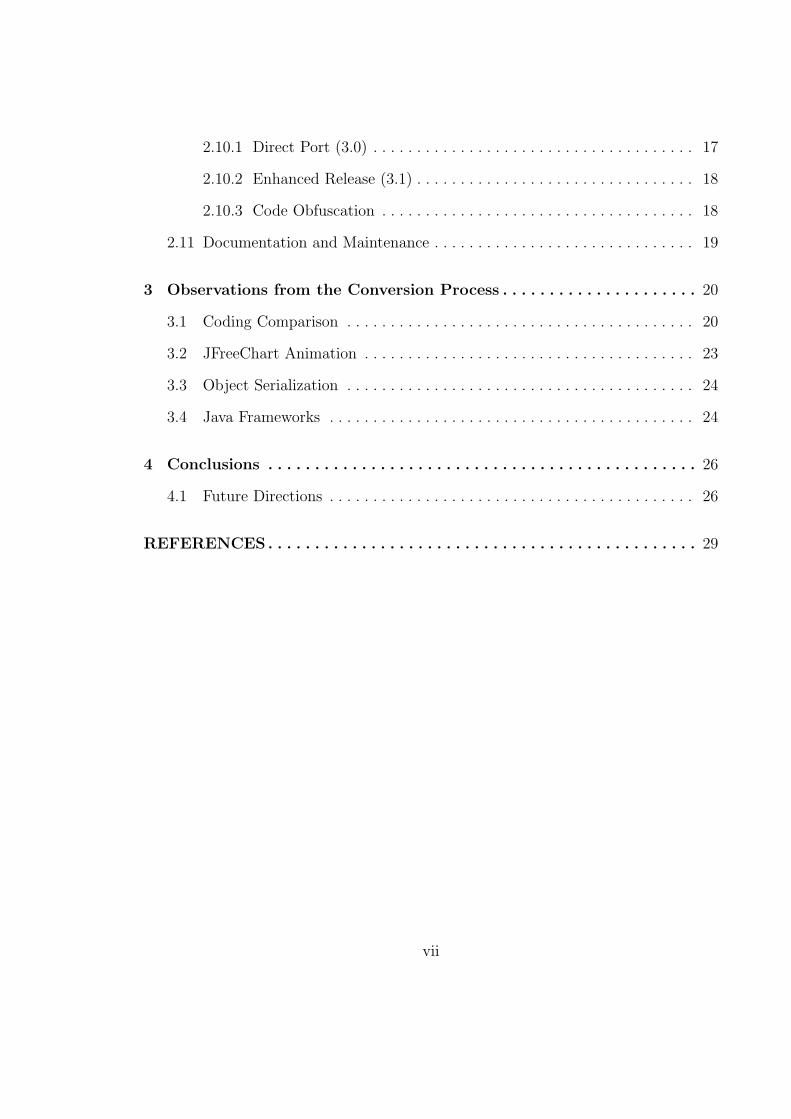
2.10.1 Direct Port (3.0) . . . . . . . . . . . . . . . . . . . . . . . . . . . . . . . . . . . . . 17
2.10.2 Enhanced Release (3.1) . . . . . . . . . . . . . . . . . . . . . . . . . . . . . . . . 18
2.10.3 Code Obfuscation . . . . . . . . . . . . . . . . . . . . . . . . . . . . . . . . . . . . 18
2.11 Documentation and Maintenance . . . . . . . . . . . . . . . . . . . . . . . . . . . . . . 19
3 Observations from the Conversion Process . . . . . . . . . . . . . . . . . . . . . 20
3.1 Coding Comparison . . . . . . . . . . . . . . . . . . . . . . . . . . . . . . . . . . . . . . . . 20
3.2 JFreeChart Animation . . . . . . . . . . . . . . . . . . . . . . . . . . . . . . . . . . . . . . 23
3.3 Object Serialization . . . . . . . . . . . . . . . . . . . . . . . . . . . . . . . . . . . . . . . . 24
3.4 Java Frameworks . . . . . . . . . . . . . . . . . . . . . . . . . . . . . . . . . . . . . . . . . . 24
4 Conclusions . . . . . . . . . . . . . . . . . . . . . . . . . . . . . . . . . . . . . . . . . . . . . . 26
4.1 Future Directions . . . . . . . . . . . . . . . . . . . . . . . . . . . . . . . . . . . . . . . . . . 26
REFERENCES . . . . . . . . . . . . . . . . . . . . . . . . . . . . . . . . . . . . . . . . . . . . . . 29
vii
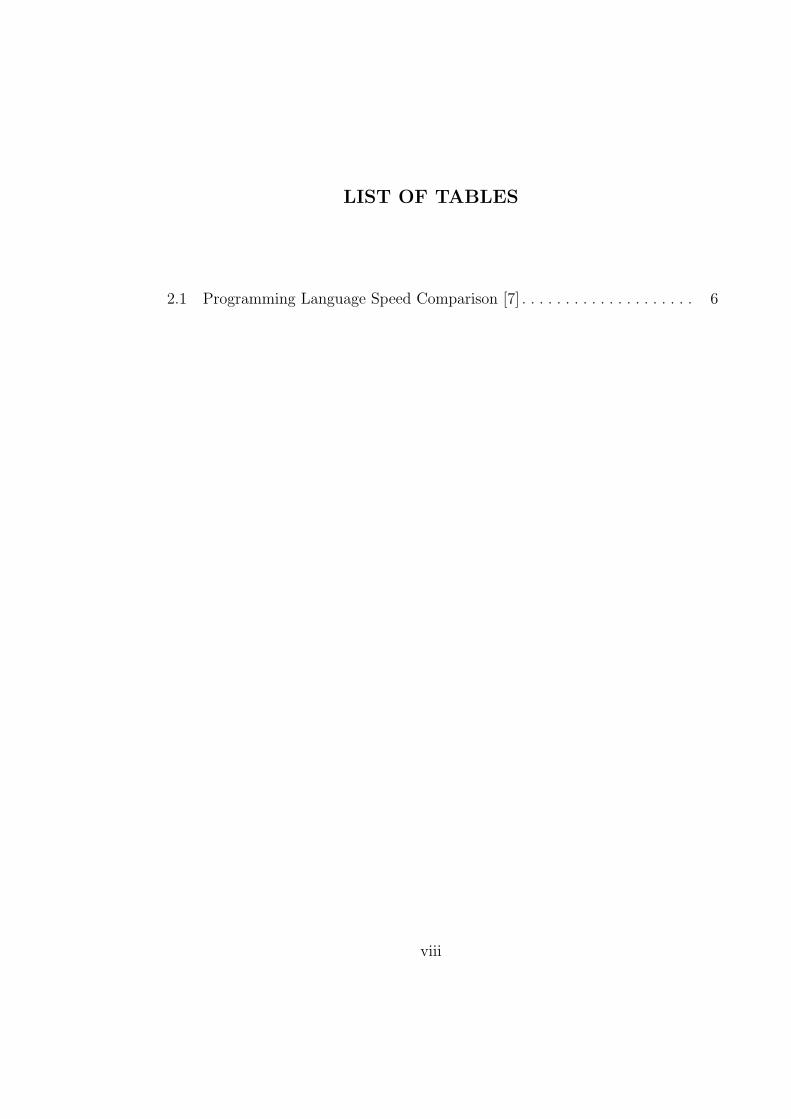
LIST OF TABLES
2.1 Programming Language Speed Comparison [7] . . . . . . . . . . . . . . . . . . . . 6
viii
LIST OF FIGURES
1.1 Original Dual-oxide Band Diagram program . . . . . . . . . . . . . . . . . . . . . 2
2.1 Original Band Diagram Movie Parameters Form . . . . . . . . . . . . . . . . . . 12
4.1 Examples of additional JFreeChart chart types . . . . . . . . . . . . . . . . . . . 28
ix

LIST OF ABBREVIATIONS
CUDA – Compute Unified Device Architecture
GPL – GNU General Public License
GPU – Graphics Processing Unit
GUI – Graphical User Interface
HTML – HyperText Markup Language
IDE – Integrated Development Environment
JNLP – Java Network Launching Protocol
JPEG – Joint Photographic Experts Group
JRE – Java Runtime Environment
JWS – Java Web Start
OS – Operating System
PNG – Portable Network Graphics
XML – eXtensible Markup Language
x
1
CHAPTER 1
INTRODUCTION
The Band Diagram program is an “interactive simulation project that is useful for
visualizing approximations of energy band diagrams.” [1] The Band Diagram program
was originally written by Richard Southwick III, under the direction of William
Knowlton, in the C# programming language. After the initial creation of the Band
Diagram program and then the release of the enhanced second version, the software
has gained popularity among industry and research professionals.
With this popularity came the desire from users to be able to run the software
on Linux and Macintosh operating systems, as well as Microsoft Windows. An
initial attempt was made to use the Mono project, “an open source, cross-platform
implementation of C# and the Common Language Runtime that is binary compatible
with Microsoft.NET” [2], to achieve this goal. However, execution was very unpre-
dictable, especially under the Macintosh operating system. Frequent crashes and slow
development (and thus limited functionality), of the Mono project have eliminated
this solution. This project involves finding and implementing a cross-platform solution
for the Band Diagram Program.
2
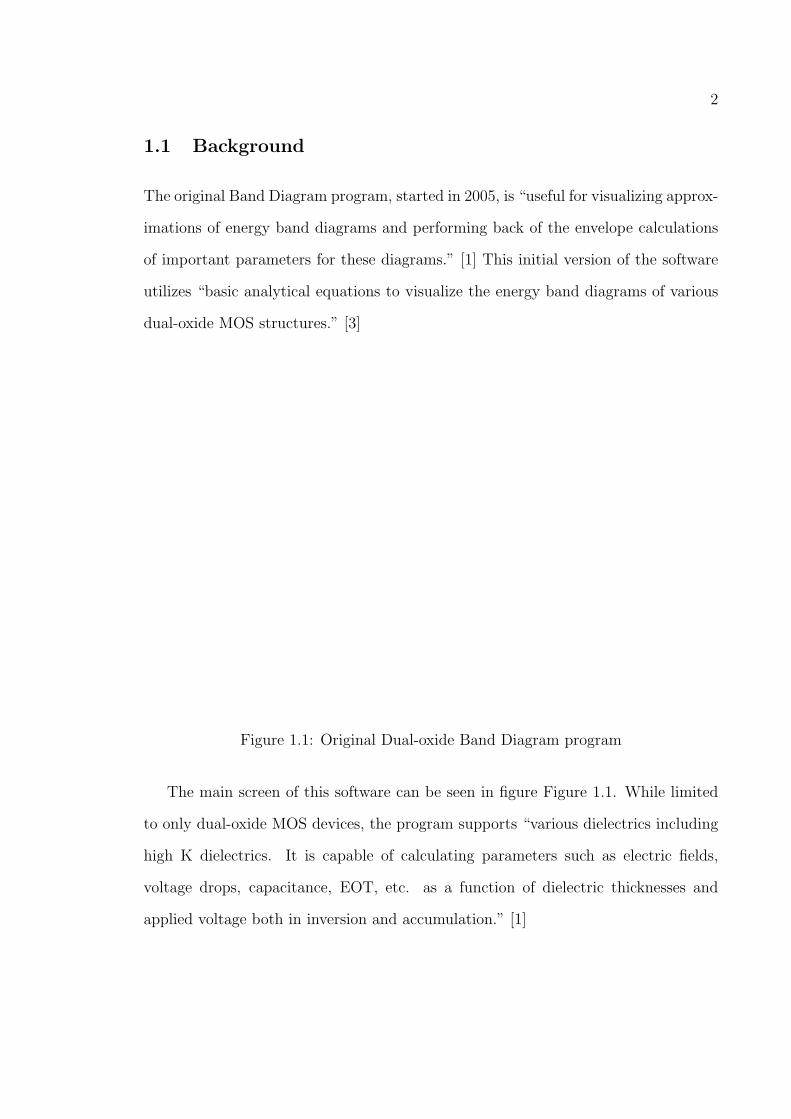
1.1 Background
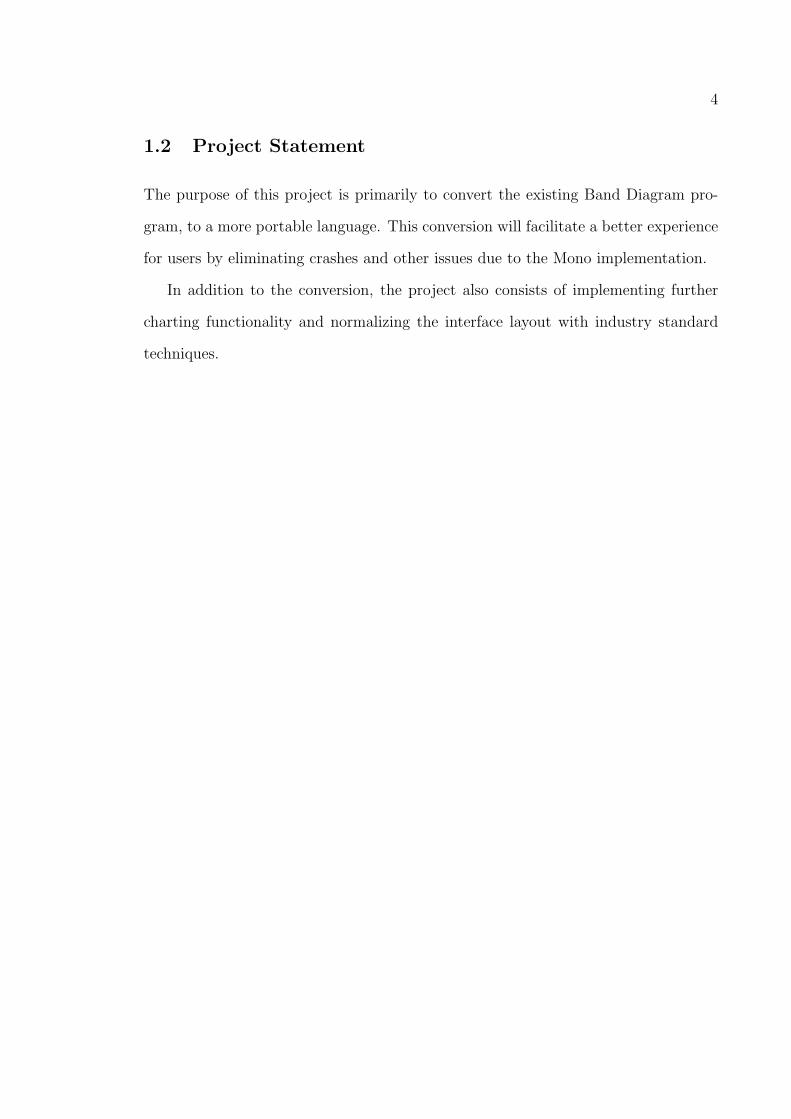
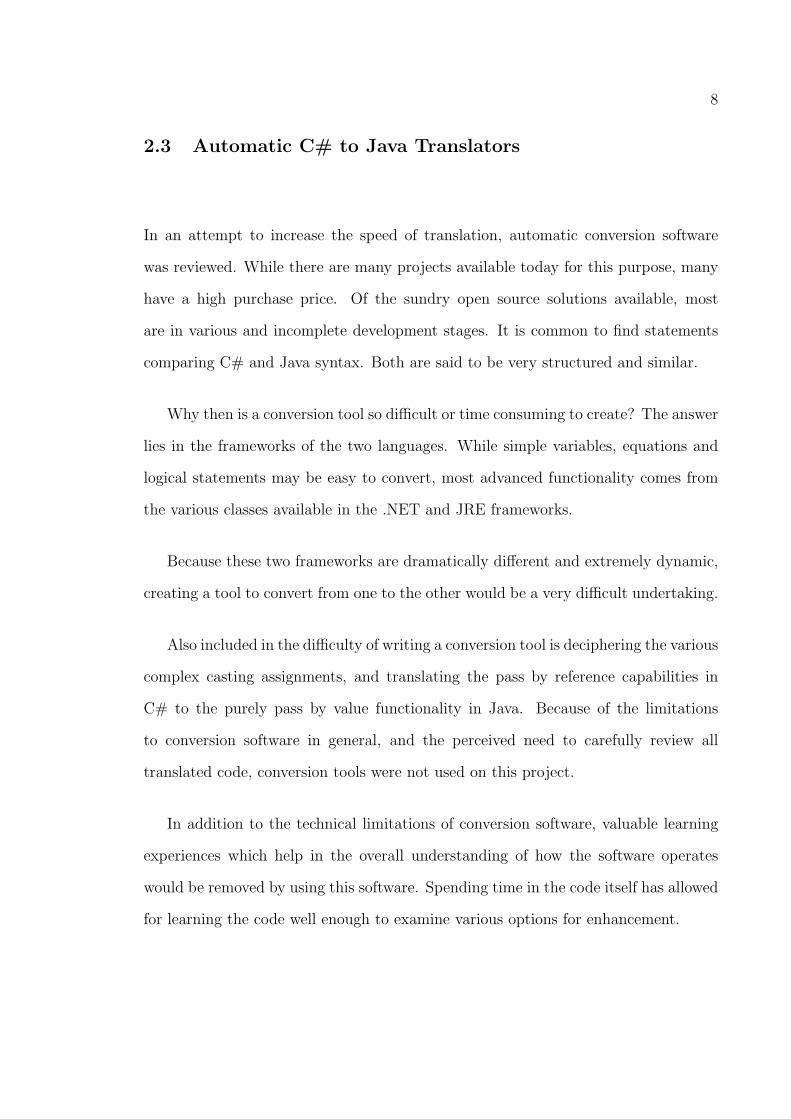
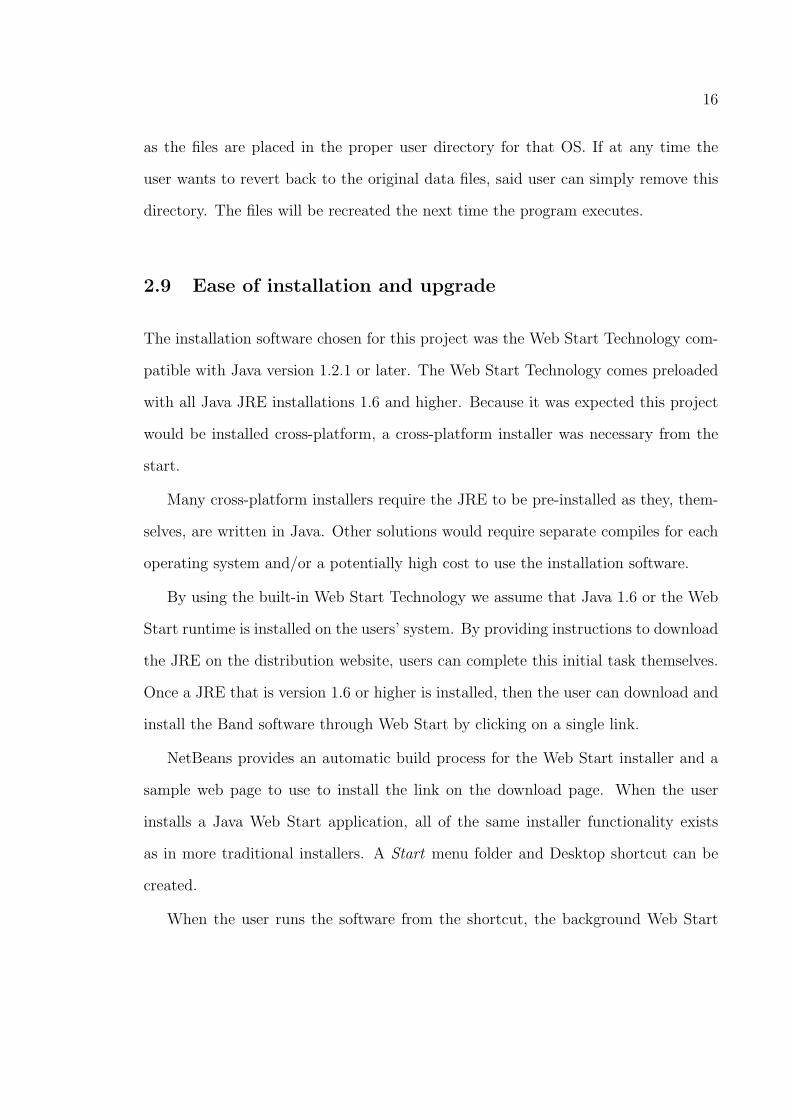
The original Band Diagram program, started in 2005, is “useful for visualizing approx-
imations of energy band diagrams and performing back of the envelope calculations
of important parameters for these diagrams.” [1] This initial version of the software
utilizes “basic analytical equations to visualize the energy band diagrams of various
dual-oxide MOS structures.” [3]
Figure 1.1: Original Dual-oxide Band Diagram program
The main screen of this software can be seen in figure Figure 1.1. While limited
to only dual-oxide MOS devices, the program supports “various dielectrics including
high K dielectrics. It is capable of calculating parameters such as electric fields,
voltage drops, capacitance, EOT, etc. as a function of dielectric thicknesses and
applied voltage both in inversion and accumulation.” [1]
3
From 2005 to 2007 the software went through many updates for the following
purposes:
1. To allow saving image files,
2. To support exporting data in comma delimited format,
3. To add a variety of dielectric materials, and
4. To improve the algorithms used to increase the accuracy of the software.
While this version was useful, it presented limitations as research progressed.
With the limit of only dual-oxide MOS devices, more complex devices could not
be explored. Because of these limitations, the newer Multi-Dielectric Energy Band
Diagram software was written to resolve these issues[4]. This new version, written
and maintained from 2007 to the present, allowed for an arbitrary number of metals
and dielectrics to be used.
It also supports inserting fixed charges into the dielectrics as well as allowing
the user to define band gap and intrinsic carrier concentrations as a function of
temperature. In addition to these functional changes, more chart views and stack
calculations were made available. The adding and editing of stored materials and
their constants was also made available to the users of this newer version.
While very functional for the Microsoft Windows family of operating systems,
the software was not reliably compatible with other OSes as previously mentioned.
Because of the importance of cross-platform capability in the areas of education and
research, these incompatibility issues have necessitated this project.
4
1.2 Project Statement
The purpose of this project is primarily to convert the existing Band Diagram pro-
gram, to a more portable language. This conversion will facilitate a better experience
for users by eliminating crashes and other issues due to the Mono implementation.
In addition to the conversion, the project also consists of implementing further
charting functionality and normalizing the interface layout with industry standard
techniques.
5
CHAPTER 2
CONVERSION PROCESS
This section discusses the conversion process used for the Band Diagram program.
This section covers design and implementation decisions and their rational as well as
release and testing methods used.
2.1 Programming Language
As previously stated, the primary objective of this project is to convert the Band
Diagram program from C# into a more portable language. Through the release of pre-
vious versions of the Band Diagram software it was found that many researchers that
could potentially utilize the software use Mac OS and cannot benefit from a Microsoft
Windows version. Conversion to the Java programming language has many benefits,
the strongest of which are related to the language’s cross-platform capabilities. The
target for the Band Diagram software is for it to run on Microsoft Windows, Linux
and Mac OSs. The most efficient way to accomplish this is to use a cross-platform
language that natively supports running the same code on all three operating systems.
Java provides this functionality and is currently commercially supported yet free
software. This support will help to ensure that the cross-platform compatibilities
and potentially new OS support can be maintained and added throughout the Java
programming language life-cycle.
6
An alternative to Java would be to use an OS and processor specific language
like C++. This would create a need for three distinct code bases and machines
with each OS to compile releases. However, it could provide a slight improvement in
performance due to the code being optimized for a specific architecture at compile
time and having all the compiling completed before execution time. While attempts
are made to standardize C++ across different platforms, in reality many of the
frameworks and other third party libraries are not available on all platforms. Also,
many C++ compilers require specific differences in the code to compile correctly such
as access to various OS level functions.
Due to these limitations with C++ and other languages which are compiled to a
specific system, these languages were eliminated from consideration.
Another option would be to use scripting languages such as Perl or Python. These
languages have great support for multiple platforms and many freely available libraries
that are also cross-platform to enhance the software[6]. Scripting languages, like those
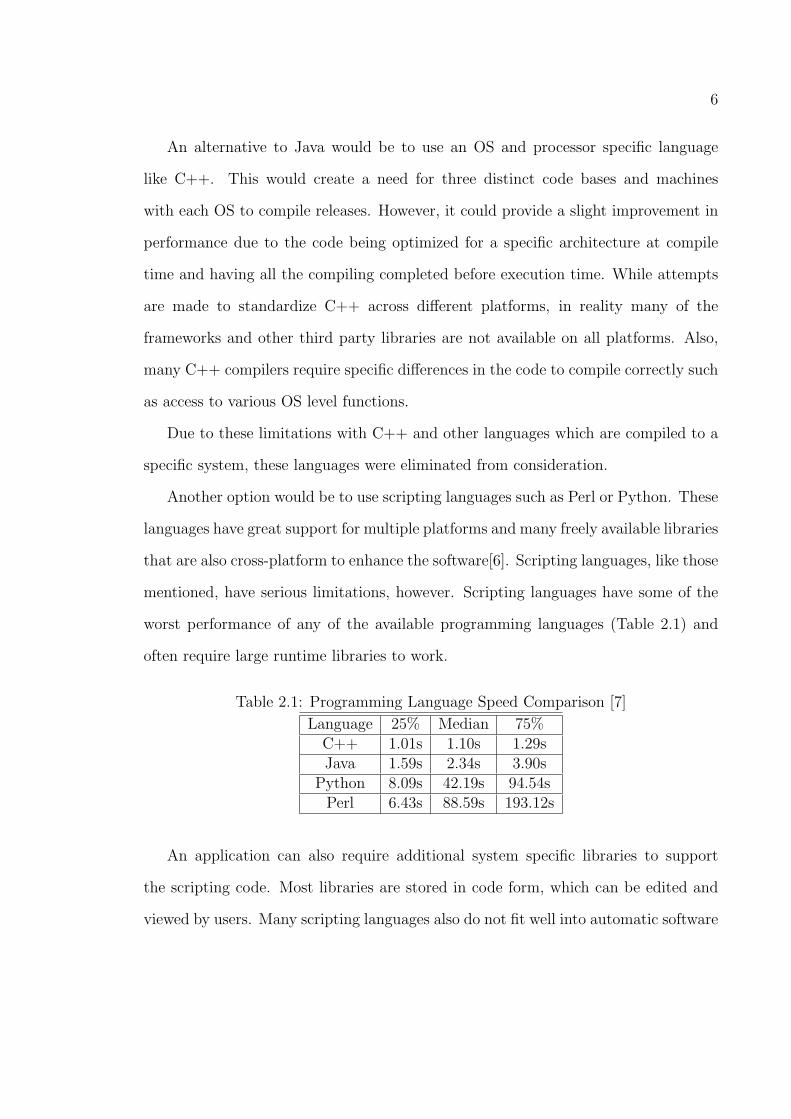
mentioned, have serious limitations, however. Scripting languages have some of the
worst performance of any of the available programming languages (Table 2.1) and
often require large runtime libraries to work.
Table 2.1: Programming Language Speed Comparison [7]
Language 25% Median 75%C++ 1.01s 1.10s 1.29sJava 1.59s 2.34s 3.90s
Python 8.09s 42.19s 94.54sPerl 6.43s 88.59s 193.12s
An application can also require additional system specific libraries to support
the scripting code. Most libraries are stored in code form, which can be edited and
viewed by users. Many scripting languages also do not fit well into automatic software
7
installation systems common to desktop applications. It is also common in scripting
languages for backward compatibility to take second place to framework redesign
and feature enhancements. This can cause frustration when more than one scripting
language version is necessary to run programs with different source versions.
For these reasons Java was chosen as the target translation language. Java
provides the best of both worlds by providing excellent cross-platform support, yet
optimizing speed by using operating system specific compiler improvements for the
systems the runtime is available for.
Another benefit of using a truly cross-platform language like Java is the availability
of many third party code libraries which can simplify the conversion process and also
allow for easier enhancement of the current feature set.
Finally, Java provides a structured but simple syntax that can be maintained and
improved without advanced knowledge of the language mechanics.
2.2 Coding Software and Methods
There are a few automated methods for converting code from one language to another.
Various conversion tools were explored as a possible way to increase the speed of the
conversion process. The NetBeans IDE was used to improve general coding speed
and simplify form development by providing easy to use access to the Matisse Swing
GUI Builder for Java. The JFreeCharts charting package for Java was used as a basis
for the charts in the new Band Diagram Program. JFreeCharts provides significant
improvement over the hand-coded charts in the current C# version of the program
including additional chart types, multiple series support, auto-scaling, pan and zoom
support and support for multiple layout effects[5].
8
2.3 Automatic C# to Java Translators
In an attempt to increase the speed of translation, automatic conversion software
was reviewed. While there are many projects available today for this purpose, many
have a high purchase price. Of the sundry open source solutions available, most
are in various and incomplete development stages. It is common to find statements
comparing C# and Java syntax. Both are said to be very structured and similar.
Why then is a conversion tool so difficult or time consuming to create? The answer
lies in the frameworks of the two languages. While simple variables, equations and
logical statements may be easy to convert, most advanced functionality comes from
the various classes available in the .NET and JRE frameworks.
Because these two frameworks are dramatically different and extremely dynamic,
creating a tool to convert from one to the other would be a very difficult undertaking.
Also included in the difficulty of writing a conversion tool is deciphering the various
complex casting assignments, and translating the pass by reference capabilities in
C# to the purely pass by value functionality in Java. Because of the limitations
to conversion software in general, and the perceived need to carefully review all
translated code, conversion tools were not used on this project.
In addition to the technical limitations of conversion software, valuable learning
experiences which help in the overall understanding of how the software operates
would be removed by using this software. Spending time in the code itself has allowed
for learning the code well enough to examine various options for enhancement.
9
2.4 Basic Structure
At the core of the Band Diagram program there are three object types called Metal,
Dielectric and Semiconductor. These store the attributes of the material they
represent from the available materials, as well as the thickness attribute. In the
case of the Dielectric, various optional charge values for locations internal to the
material are stored. These objects also have a storage area for result data.
All three of these objects are then can be referred to through the parent class
named Material which contains identifying information about the type of object
stored within, and contains a normalized interface to the three types of objects for
use in the charting. After the individual Metal, Dielectric and Semiconductor
objects are created, they are stored as a list of Material objects that represent the
structure.
Once the structure is complete, the list is passed to the Kernel object to be
evaluated using the options selected by the user. As the values are calculated, they
are stored inside the individual objects contained in the Material containers. Once
the calculations are complete, these values can be accessed and displayed in chart or
report form. There are various other objects in the project, but these core objects are
used to represent and calculate the data. These objects have been maintained from
the C# version and carried over to the Java version largely unchanged. While the
frameworks for displaying forms and other user interface controls are different between
the languages, the structure of these core objects could be maintained without much
change. This provided the opportunity to limit testing in these core calculation areas
to only syntax and minor logic bugs without the necessity to redesign the algorithms
used.
10
2.5 Chart Improvements
The original Band Diagram software uses a custom charting solution. This solution
was able to display the basic charts, with multiple colors, using a resizable canvas.
Shapes were available for displaying the banding in the dielectrics while mouse pointer
position information was available to give more exact measurements.
These charts had all the needed functionality and allowed for maximum flexibility
in creating the desired displays. However, said functionality came at the expense of
eliminating extra features and the bug hunting support of a third-party solution.
Because Java was designed from the ground up to be a cross-platform language,
most third-party libraries were also designed to be cross-platform, or at least have a
cross-platform version available for use. Using one of these solutions allowed for
the potential of increased stability and added useful features with no additional
development time.
Realistically, using a third-party solution could result in a greatly reduced cost
due to shorter implementation time and the ability to pass discovered bugs back to
the original development team for that product. The JFreeChart project was selected
due to the open source licensing and the large feature set and charting options. By
utilizing this library we were able to add support for the following:
1. Different series colors,
2. Zooming,
3. Panning, and
4. More traditional hover tips.
11
without spending the time to implement these features directly. Side benefits
include a very well structured code base that allows for easy expansion, adding
different chart types, or customizing existing charts as needed.
By reducing the time necessary to implement the basic functionality of the charts,
more time was made available to improve the functionality in other areas.
In practice the JFreeCharts library was an excellent choice for the static charts
and provided a very quick and feature-rich view into the data. The relative time spent
implementing the chart section of the new Band software compared with the rest of
the project was very small, and assuredly smaller than the time to implement the
basic charting functionality in the original Band software. While there are problems
that can occur when using third-party tools, like bugs or design limitations, the
JFreeChart libraries worked very well for the static charts.
That being said, the JFreeCharts package was not designed to be used for an-
imated charts that require speed. In fact, the JFreeCharts development toolkit
documentation specifically states that results will not be good if a frame rate of
more than one chart per minute is desired! This limitation was due to the package
being designed originally with only static charts in mind. While the event layers
were later added to accommodate detecting and displaying changes in the dataset,
the graphical portion of the code updates the chart drawing by repainting the entire
chart image as if it was just created.
While this possibility was alarming, the estimation proved to be a conservative
view with the implementation in the new Band software. Decent refresh rates were
achieved by breaking the dataset updating code out into a separate thread. Separate
threads would typically run on a separate processor from the main application as
most desktop systems have multiple cores and/or processors today.
12
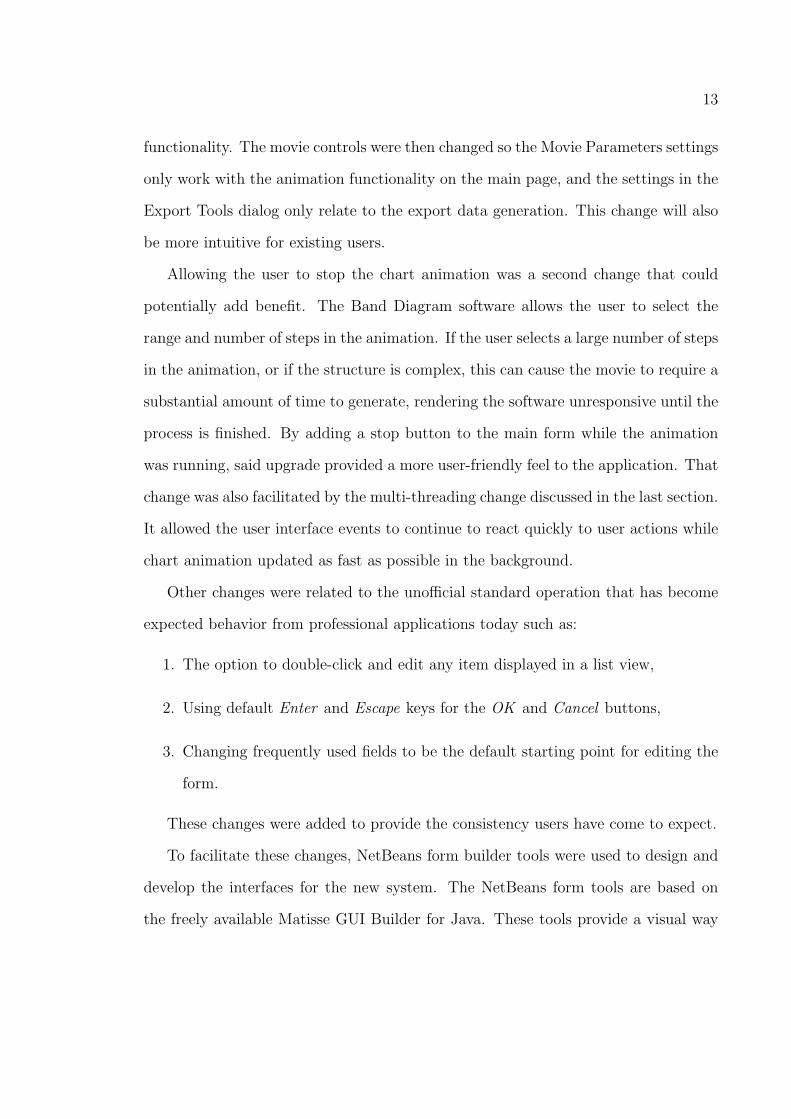
2.6 Standardize User Interface
A few elements of the original Band Diagram program were not created in accor-
dance with current graphical user interface standards. This re-write provided a good
opportunity to fix these issues, making the software easier and more efficient to use.
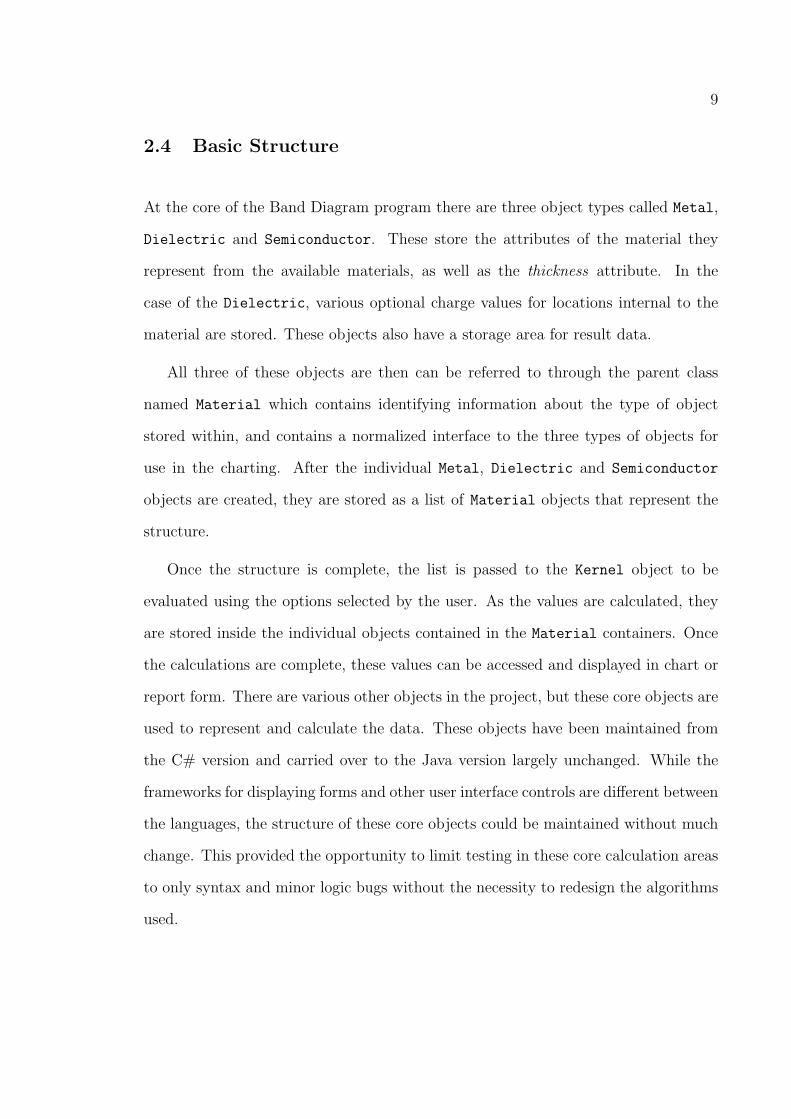
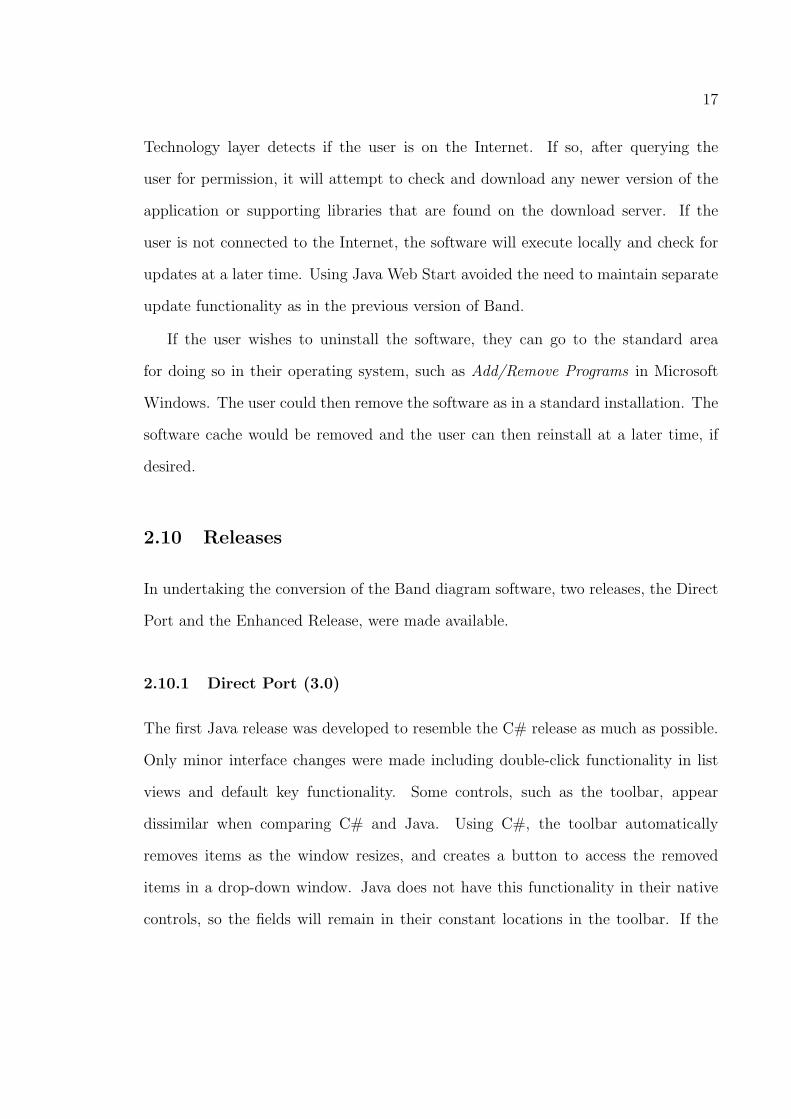
Figure 2.1: Original Band Diagram Movie Parameters Form
The first change was to move the output section of the Movie Parameters dialog
(Figure 2.1) to a new Export Tools dialog. This allows the Output Parameters
subsection to be more easily found by newer users so they can benefit from this
13
functionality. The movie controls were then changed so the Movie Parameters settings
only work with the animation functionality on the main page, and the settings in the
Export Tools dialog only relate to the export data generation. This change will also
be more intuitive for existing users.
Allowing the user to stop the chart animation was a second change that could
potentially add benefit. The Band Diagram software allows the user to select the
range and number of steps in the animation. If the user selects a large number of steps
in the animation, or if the structure is complex, this can cause the movie to require a
substantial amount of time to generate, rendering the software unresponsive until the
process is finished. By adding a stop button to the main form while the animation
was running, said upgrade provided a more user-friendly feel to the application. That
change was also facilitated by the multi-threading change discussed in the last section.
It allowed the user interface events to continue to react quickly to user actions while
chart animation updated as fast as possible in the background.
Other changes were related to the unofficial standard operation that has become
expected behavior from professional applications today such as:
1. The option to double-click and edit any item displayed in a list view,
2. Using default Enter and Escape keys for the OK and Cancel buttons,
3. Changing frequently used fields to be the default starting point for editing the
form.
These changes were added to provide the consistency users have come to expect.
To facilitate these changes, NetBeans form builder tools were used to design and
develop the interfaces for the new system. The NetBeans form tools are based on
the freely available Matisse GUI Builder for Java. These tools provide a visual way
14
to display and manipulate a Swing-based Java GUI without the need to hand-code
each piece. In addition to the visual benefits of this tool, it also provides valuable
integration with the Java Bean Binding technology which allows objects to be directly
connected to and updated from an interface.
A simple example of this technology can be found in the Add/Edit Metal form in
the new Band program. Before this form is displayed, a Metal object is instantiated
with default values and attached to the form using Bean Binding. With this technique,
each field on the form can be linked with a variable in the Metal object by using the
standard getter and setter methods available in that class. Each time the form is
updated the object is also updated. Finally when the form closes, it can determine
whether the newly created object is valid or invalid. If the object is valid, it can
be added to or it can update the user-created structure or the master Metals list by
inserting or replacing the old object with the newly created one. This eliminates the
need for the class calling the form to handle the data coming from the form directly.
2.7 Faster execution
In general, the C# version of Band is fast. However, it can slow down if there are a
large number of materials in the structure. Another source of slow down and long wait
times is the exploration of newer features, such as multiple semiconductor materials
in one structure.
In order to combat these speed issues the data processing algorithms have been
broken out into a separate thread in the Java version of Band.
Future work in this area may be necessary as the software continues to grow with
new, more complex features. It may be necessary to split the processing into multiple
15
threads to allow the user to benefit more fully from a multi-processor system. It
also may be valuable to explore GPU computing options such as nVidia’s CUDA
framework to make use of the video card. Such use could further increase processing
speed.
2.8 Feature Review
Most of the functionality presented in the C# Band version has been represented
in the Java version. The charting features have been greatly enhanced with the
Java version due to the use of the JFreeChart library. Added features include lasso
zoom, scroll wheel zoom, panning, and added material colors for the main charts.
More options are available in the right click menu for each chart to allow the user
to directly print or save the image as JPG or PNG format images. Options are also
available to modify the title, axis descriptions and chart background colors directly
from the right-click menu. Most importantly, the software will now run natively on
any operating system where the JRE is available. Microsoft Windows, Linux and
Mac OS are supported.
A new user data files feature has also been added. When a user runs the applica-
tion for the first time a .Band3 directory is created in their user account. Copies of
the material files are then copied into this directory for use while running the software.
If the user adds, edits or removes any material data the users files will be modified.
This allows multiple people to use the software on the same machine without interfer-
ing with each others data. If a user wants to transfer their customized material files
to another machine they simply need to copy this directory from their user account
on one machine to another. This copy will also work from one OS to another, as long
16
as the files are placed in the proper user directory for that OS. If at any time the
user wants to revert back to the original data files, said user can simply remove this
directory. The files will be recreated the next time the program executes.
2.9 Ease of installation and upgrade
The installation software chosen for this project was the Web Start Technology com-
patible with Java version 1.2.1 or later. The Web Start Technology comes preloaded
with all Java JRE installations 1.6 and higher. Because it was expected this project
would be installed cross-platform, a cross-platform installer was necessary from the
start.
Many cross-platform installers require the JRE to be pre-installed as they, them-
selves, are written in Java. Other solutions would require separate compiles for each
operating system and/or a potentially high cost to use the installation software.
By using the built-in Web Start Technology we assume that Java 1.6 or the Web
Start runtime is installed on the users’ system. By providing instructions to download
the JRE on the distribution website, users can complete this initial task themselves.
Once a JRE that is version 1.6 or higher is installed, then the user can download and
install the Band software through Web Start by clicking on a single link.
NetBeans provides an automatic build process for the Web Start installer and a
sample web page to use to install the link on the download page. When the user
installs a Java Web Start application, all of the same installer functionality exists
as in more traditional installers. A Start menu folder and Desktop shortcut can be
created.
When the user runs the software from the shortcut, the background Web Start
17
Technology layer detects if the user is on the Internet. If so, after querying the
user for permission, it will attempt to check and download any newer version of the
application or supporting libraries that are found on the download server. If the
user is not connected to the Internet, the software will execute locally and check for
updates at a later time. Using Java Web Start avoided the need to maintain separate
update functionality as in the previous version of Band.
If the user wishes to uninstall the software, they can go to the standard area
for doing so in their operating system, such as Add/Remove Programs in Microsoft
Windows. The user could then remove the software as in a standard installation. The
software cache would be removed and the user can then reinstall at a later time, if
desired.
2.10 Releases
In undertaking the conversion of the Band diagram software, two releases, the Direct
Port and the Enhanced Release, were made available.
2.10.1 Direct Port (3.0)
The first Java release was developed to resemble the C# release as much as possible.
Only minor interface changes were made including double-click functionality in list
views and default key functionality. Some controls, such as the toolbar, appear
dissimilar when comparing C# and Java. Using C#, the toolbar automatically
removes items as the window resizes, and creates a button to access the removed
items in a drop-down window. Java does not have this functionality in their native
controls, so the fields will remain in their constant locations in the toolbar. If the
18
form is resized too small, they will be hidden. Because a large screen size is not
needed to support all fields, this change should not create an issue. If problems are
found with this implementation, custom Java controls can be explored to duplicate
the missing functionality.
Owing to the fact that the goal was to have the switch to Java be the only change
the user needed to learn for this version, the first release was designed to allow users
to feel comfortable in the new version. Everything was placed where users would
remember from the previous version, and functionality was matched.
2.10.2 Enhanced Release (3.1)
An enhanced version will be released that will make more dramatic changes to the
user interface and feature set. The release will incorporate the larger interface
changes, such as renaming the Movie/Output Parameters section. Added features
from branched C# versions will be added to this version, and the new forms and
options will be made available.
This could include the dielectric band rounding and the multiple semiconductor
support currently being developed. The multiple semiconductor support will require
additional multi-threading support and options to allow the user to manually weigh
the speed versus accuracy trade-off. Other new interface functionality could also
be explored, such as drag and drop Materials, additional chart types and possible
reporting outputs.
2.10.3 Code Obfuscation
It is important to note that while the software will be released via GPL 2.0, many of
the experimental, newer features have not yet been released to the public. If there
19
is a desire to release these features before a paper can be published on them, code
obfuscation methods can be explored to allow a release of the Java binary files that
cannot be reverse-engineered easily. This will allow users to increase input into the
new features while protecting the interest of the researchers involved. Once the new
features have been properly explored in published works, the features will be released
into the general GPL 2.0 code base and the code obfuscation can be removed.
2.11 Documentation and Maintenance
All code documentation will use the popular documentation tool called javadoc, the
comments can be compiled into an easier-to-read HTML format. That can be viewed
as a document set when reviewing the software.
These comments are also used by the IDE such as NetBeans or Eclipse, to provide
in-line documentation while using the code from the project. This makes future reuse
and expansion much easier. Because this project will likely get passed on to future
students, this element is important to limit the time new programmers will need
to become familiar with the code base. As the software changes and evolves, these
new changes can be made available to easy use and review through future javadoc
comments.

20
CHAPTER 3
OBSERVATIONS FROM THE CONVERSION PROCESS
This section discusses the ”lessons learned” from this project. While some areas are
specific to the Band software, many could be helpful to other conversion projects,
specifically those related to Java and C#.
3.1 Coding Comparison
Java and C# are very similar languages. It is thought by many that C# was
Microsoft’s answer to Java, and incorporated many style choices made in the Java
language by Sun Microsystems.
One of the most notable differences in the languages, however, is the support for
pointers found in C#. Java, in passing everything by value, has no real method of
passing a reference. Because of this difference, code changes were made to certain
interfaces, especially in the Kernel class. Those changes allowed the functions to pass
back the proper object as needed, instead of filling a reference.
While some view this difference as a limitation in Java, the simplicity allows for
increased readability in the Java code base.
Another difference between the two languages is found in string manipulation
methods. C# has more base string manipulation methods found in their String
class than Java.
21
In the case of the Band program, the methods indexOfAny and lastIndexOfAny
were used in the Kernel class. The indexOfAny method tests a set of character values
with a String to see if any of the characters can be found in the string. If one is
found, the String index of the first one found is returned to the caller.
The lastIndexOfAny works similarly to the indexOfAny function. However, it
returns the String index of the last character found. This function, while valuable
in the case of the Band program, does not seem to be common functionality and was
likely left out of the Java String class for the purpose of simplification. In the Java
version of the Band program, equivalent functions were created and placed in the
Kernel class to accomplish the same task.
Most of the forms in the original Band software were coded by hand, meaning
each field was considered a text field. Any entries were converted to their appropriate
type, added to an object of the right type for the form, and then added to either the
structure list or the master list of that type of material.
The Band program consists of many lists of materials created from the List
objects stored. In the original Band program, for each object in the list of materials,
each value was pulled from the object and added to the proper cell to generate the
list view. Then, when a user clicks a row that index is used to retrieve the proper
object for replacement or manipulation.
In Java, many of these functions have been anticipated and methods have been
provided to make them simpler. We have already discussed Bean Binding in rela-
tion to individual fields and objects, but Bean Binding also comes in handy when
displaying a list of objects. By attaching the list view to the list of objects, and then
assigning each column in the list view to a certain field, you can easily display data
for all the objects in a list.
22
Options are available to limit the number of fields that are displayed for each
object, additional options are available that relate to how the lists could possibly be
manipulated to update the objects in the list. When a row in the list is selected,
instead of getting an index to the original list, the object that row represents is
returned for manipulation.
Because the original data structures in Java are not event-aware, wrappers have
been created for use with Java Beans. These wrappers are called Observable Objects.
The Observable Objects fire events whenever an object in them changes, or if the order
or number of objects in the list changes. If one of these lists is used in conjunction
with the list view, the list view will automatically notice an object has been updated
and requery the appropriate objects to update the list view. This method allows
for a much more intuitive, direct relationship between the object and the list view
displaying it.
This same technique can be layered. One example of layering can be seen in the
case with the Dielectric objects in the Band software.
First, it is possible to select a Dielectric object from the list and enter into
the editing screen for that object. Internal to the object is a list of EvalPoint
objects storing the locations for various injected charges. By using this same list view
population method again in the dielectric editing form, we can display the point list
in a similar list view as well.
It is important to note that while this method can be quite useful, the list that
is directly linked to the list view must exist at all times the list view is instantiated,
even if empty. For this reason, when manipulating the Dielectric objects, the object
must be passed to the form before the form is made visible.
23
3.2 JFreeChart Animation
The animation capabilities of the JFreeChart package were also utilized in this project.
However, speed improvements may be necessary to approach a comparable frame rate
to the C# version. Changes in the JFreeChart code may be necessary to enforce
redrawing only affected parts of the chart, instead of the method currently used by
JFreeCharts which consists of repainting the entire chart for each dataset change.
Different methods for this approach are already being explored as patches by other
users in the JFreeChart forums and bug tracking systems.
The frame rates are not as smooth as the original application, there is still room
for improvement with the implementation of the JFreeCharts libraries. Three obvious
possibilities are:
1. Delaying the chart refresh detection until the dataset has completed updating
the dataset to prevent delays from the update detection code.
2. A version of JFreeCharts has been submitted to the bug tracking and patch
section of the web page that has yet to be reviewed. That version will only
refresh the changed portions of the chart when the dataset changes. If this
code is accepted into the main trunk of the project and the new Band software
recompiled with the new library a very noticeable improvement in speed may
be seen. There wasn’t time for deep review of the changes made available in
the patch.
3. Changes could also be implemented directly before they are reviewed by the
JFreeCharts team if increased speed is deemed necessary for the new version
before the patch version is available in production.
24
3.3 Object Serialization
One of the main frustrations while working with the Java Band software was the
design decision to maintain the serialization of objects for saving state. In the original
C# program, and the current Java version, materials are stored into lists and then
serialized to disk for later retrieval and use.
During the early stages of the software development cycle, the serialization was a
very easy way to save information without the requirement to add a lot of code for
this purpose. As the code entered the debugging phase, however, the limitations of
this method were made apparent. Subtle changes to the material objects destroyed
the objects ability to read in old format objects from disk, and populate them back
into new format objects.
It was possible to work around these issues and maintain the serializing version of
the code, however, it would be much more flexible to convert the objects to a standard
text format, such as XML, where the object data can be parsed and placed into a
new object, or written out independently of the actual memory format of the object.
This would both allow for easier future changes, and minor changes to be made to the
object structures by hand since the XML code would be human readable. It would
also allow other programs the opportunity to view and write out data in the Band
format for future use in the Band software without needing to understand the object
structures.
3.4 Java Frameworks
The use of the Swing framework and, in turn, the JFreeCharts charting package were
great successes in this project. Both frameworks are relatively easy to use and are
25
very well structured. It is abundantly apparent that much forethought went into the
design of both frameworks. These frameworks provided a good foundation, and in
the case of the Swing framework, there was no limit of help available online to explain
more advanced implementations.
26
CHAPTER 4
CONCLUSIONS
This project has resulted in a Java version of the Band Diagram software that can
be used on Mac OS and Linux without error while still maintaining the Microsoft
Windows support. The project has added additional charting functionality and better
user file support and removed the need for internal maintenance for the charting and
update functionalities. By using the Java language, this software can easily be passed
on to other students for maintenance as Java is one of the most popular languages in
use today in the software engineering industry.
4.1 Future Directions
Conversion to Java has created broad opportunity for added features. Previous
sections have discussed potential future features such as XML-based configuration
and GPU processing to enhance the application. Along with these features, there are
various other additions that could benefit the users.
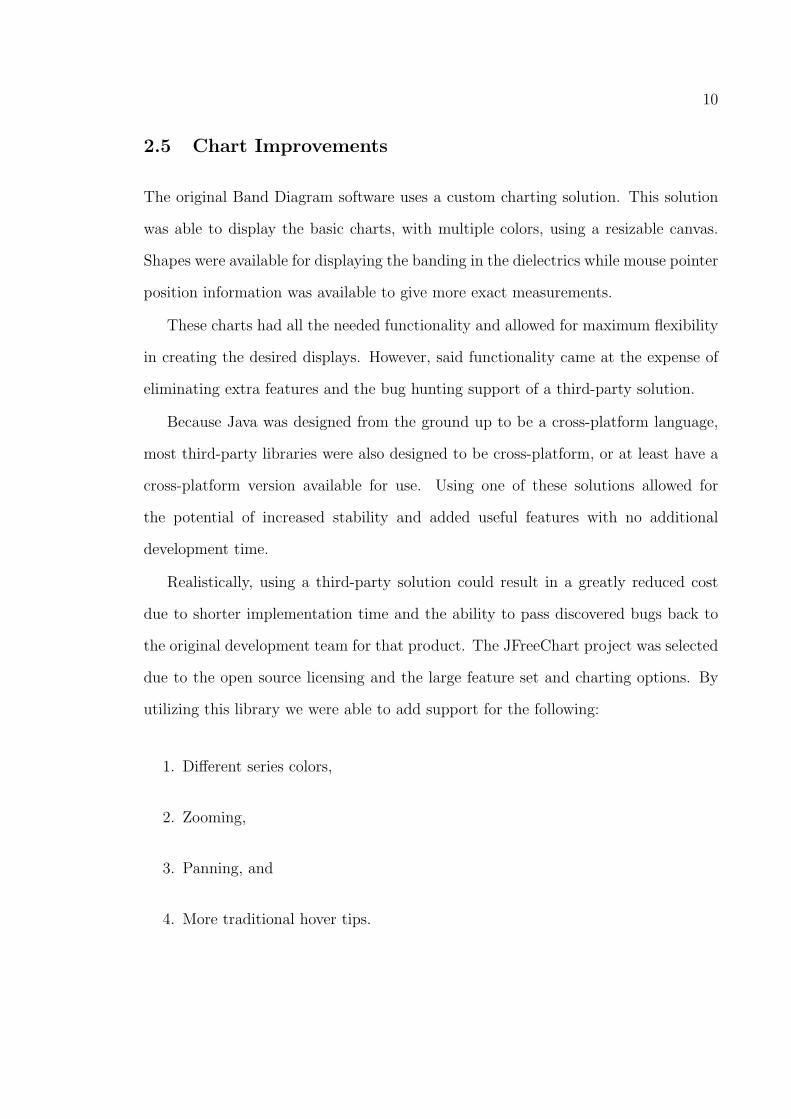
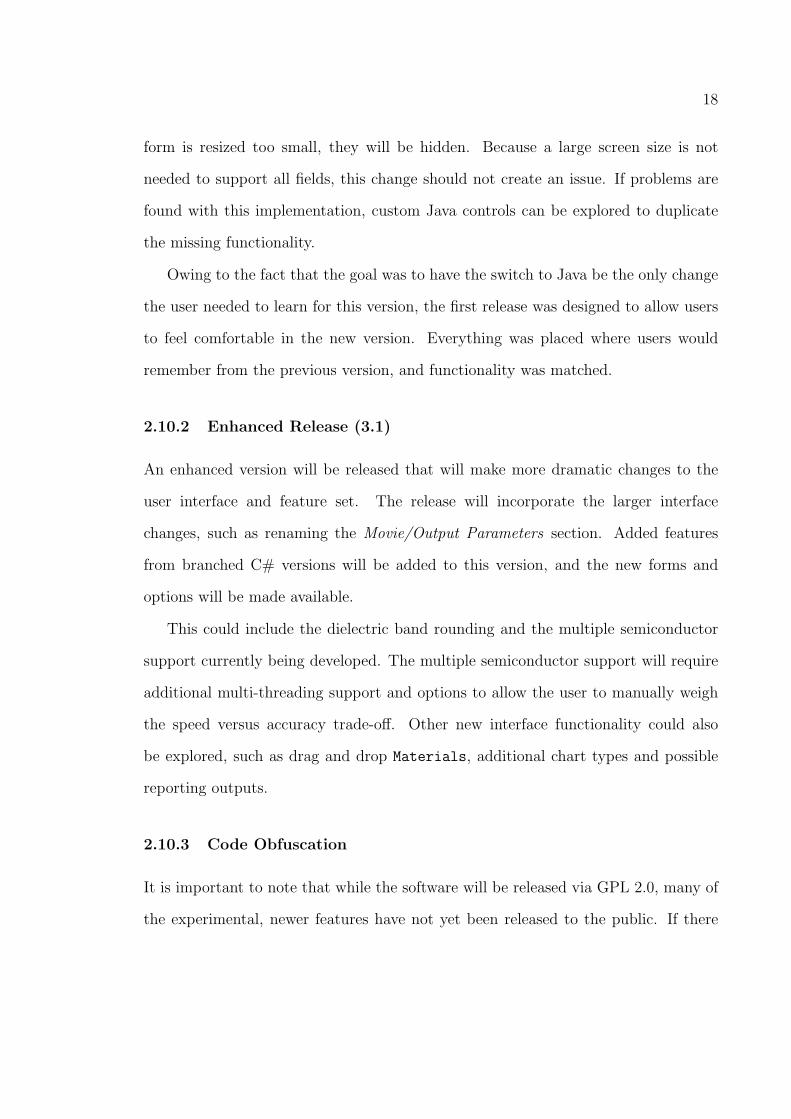
One exciting update would be additional chart types such as those found in
Figure 4.1. Using the JFreeCharts as a base, it would be easy to support displaying
multiple charts at the same time. A multi-chart view, with all four main charts,
would be an ideal feature to allow the user to see everything associated with the
structure at once. It would also lend itself to changing the structure in a separate or
27
side window while viewing the charts, thereby creating more of an experimentation
dashboard. Said dashboard could display the various effects of changes more quickly
than opening and editing through dialogs.
Additional 3D charts, which are currently in an experimental stage in JFreeCharts,
could allow graphing 3 different variables against each other. This may lead to further
discovery through previously unseen correlations between attributes.
Added interface improvements could make the software even easier to use. An
example would be to allow drag and drop functionality while creating a structure. If
the user could:
1. Drag a new material to the structure and automatically get a window to set the
material details,
2. If the user could drag materials up and down the structure list,
it would allow for increased speed while creating structures.
Another beneficial feature could be an option to save the chart animations to a
video format for emailing or future reference outside of the software. An integrated
help system or tutorial could also be useful as users learn how the program works.
Finally, it may be beneficial to recompile the code in an applet format to allow
users to create structures from the web and export their data and images without ever
needing to install the software. This would help users who are not allowed to download
and install the software themselves, due to network or some other restrictions. It
would allow for client-side processing of structure band data in these situations.
28
Figure 4.1: Examples of additional JFreeChart chart types
29
REFERENCES
[1] Knowlton Research Group. Band Diagram Program.http://nano.boisestate.edu/bandDiagramProgram
[2] Mono Project. http://www.mono-project.com
[3] Richard G. Southwick III, and William B. Knowlton, Stacked Dual Oxide MOSEnergy Band Diagram Visual Representation Program, Invited Paper, IEEETransactions on Device and Materials Reliability, 6(2) (2006) p. 136-145.
[4] R. G. Southwick III, A. Sup, A. Jain and W. B. Knowlton. An InteractiveSimulation Tool for Complex Multilayer Dielectric Devices. Manuscript submittedto IEEE Transactions on Electron Devices
[5] JFreeChart. http://www.jfree.org/jfreechart
[6] The Comprehensive Perl Archive Network. http://cpan.perl.org
[7] Computer Language Benchmarks Game. http://shootout.alioth.debian.org


![cikguadura2.files.wordpress.com · Chapter 02 — Structure of Atom ChemQuest 2012 [SPM09-06] Diagram 1 shows the inter-conversion of the states of matter of a substance Stim Diagram](https://img.pdfslide.net/doc/110x75/5e10316d7685256a2f1b2747/chapter-02-a-structure-of-atom-chemquest-2012-spm09-06-diagram-1-shows-the-inter-conversion.jpg)