Embed Size (px)
Citation preview
1
Coolfarming – Lessons from the Beehive to Increase Organizational Creativity
Peter. A Gloor1, Peter Margolis, Michael Seid, George Dellal
Abstract
This paper introduces Collaborative Innovation Networks as an engine for self-
organizing disruptive innovation. It is illustrated by the metaphor of the bee swarm
through four lessons from the beehive: “centralized leadership – rotating leaders –
waggle dance – attraction pheromone” as key principles for managing self-
organizing teams of creators. In combination with applying social network analysis
through knowledge flow optimization, managers get a powerful new tool to radically
increase creativity and performance of their organizations. Among many well-known
examples (LEGO Mindstorms, Apple, Wikipedia), the paper also introduces an
extensive case study in health are, the C3N project which creates Collaborative Care
Networks for patients of chronic diseases.
1. Introduction Wikipedia volunteers spending hours creating articles on topics close to heir heart, LEGO
Mindstorm hackers paying their own tickets to Denmark to teach LEGO their most recent
inventions, and Silicon Valley startup entrepreneurs all collaborate as creative swarms –
they behave strikingly similar to how bees swarm to a new location. We call this process
coolfarming – using the beehive as a metaphor to describe how to tap the creative potential
of communities of innovators. A group of enthusiasts gets together to create something
radically new, and to recruit early adapters to try their innovation, thereby turning it into a
cool trend. Coolfarming describes the genesis of an emergent trend -‐ something new and
fresh, developed by a team of daring individuals who then spread it to the rest of the world.
1 Contact: [email protected], MIT Center for Collective Intelligence
2
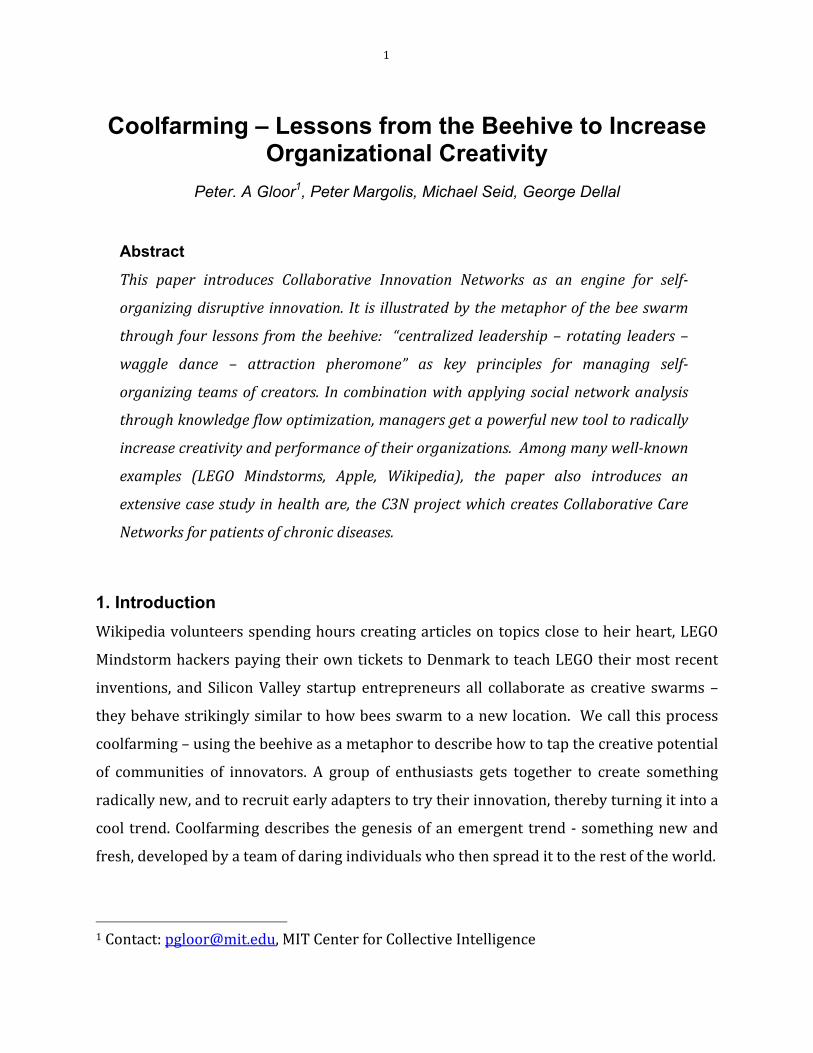
Figure 1. The Coolfarming Process – lessons from the beehive as a metaphor
Coolfarming works by unlocking the creative potential of Collaborative Innovation
Networks (COINs). COINs are made up of groups of self-‐motivated individuals linked by the
idea of something new and exciting and by the common goal of improving existing business
practices, new products or services for which they see a real need. The strength of COINs is
based on their ability to activate creative collaboration and knowledge sharing by
leveraging social networking mechanisms, affecting positively individual capabilities and
organizations’ performance. Swarm creativity gets people to work together in a structure
that enables a fluid creation and exchange of ideas. Patterns of collaborative innovation
frequently follow an identical path, from creator to COIN to Collaborative Learning
Network (CLN) to Collaborative Interest Network (CIN) (see figure 1).
Similarly, in the bee world, the queen, corresponding to the creator shaping the vision of a
new product, recruits a swarm of dedicated bees, which join her in leaving the old hive to
create something radically new. The swarm then sends out the coolhunters, the most
experienced bees, to scout for a new location of the hive. These most committed bees, usually
just a few dozen, dynamically, and in rotating leadership, check out and vote on each other’s
proposed new hive settings. Democratically, they agree on a new location, convincing each
other and their sisters in the swarm by the intensity of their waggle dance. This corresponds
3
to the human COIN, developing a new product, and then recruiting their friends and family to
the Collaborative Learning Network, to fine-tune the product, and recruit the most dedicated
beta-testers as COIN members. Among the bees, once the decision for the new hive location
has been made, the coolhunter bees heat the swarm by increasing their own body
temperature while sitting in the midst of the swarm, until all the bees take off together,
following the coolhunters to the new location. These new location has been previously marked
by the coolhunter bees with attraction pheromone, so that it becomes an irresistible
destination for the swarm. The same metaphor applies to the human COIN members
convincing their friends of the greatness of their new idea or product.
2. The Collaborative Chronic Care Network Case Study We illustrate the coolfarming approach by the example of the community-‐building process
of the Collaborative Chronic Care Network (C3N) Project2. While participants in the health
care system – patients and caregivers, clinicians, researchers -‐ care deeply about improving
health, the system does not currently have ways to harness this motivation and
participants’ collective intelligence, nor is there an infrastructure that participants can use
for this work. The goal of the C3N project, funded by the National Institute of Health, is to
change this by growing a community of patients, clinicians, and researchers with the
ultimate goal of improving the daily lives of patients of chronic diseases. Over the last two
years, a small core team of C3N researchers has built a self-‐organizing, vibrant research
community of over 100 patients, clinicians, and researchers working on improving the lives
of patients with inflammatory bowel disease (IBD). From the beginning of the C3N project,
the co-‐principal investigators (PIs) at Cincinnati Children’s Hospital Medical Center
(CCHMC) decided to employ COINs principles for organizing their project. As a first
indicator of success, the COIN designed and put into prototype testing 14 innovations,
involving the participation of hundreds of people, to better the daily lives of IBD patients
and collect patient data for research. Prototypes included developing a Facebook App for
IBD patients with similar interests, developing a mentoring program, developing software
2 www.c3nproject.org
4
tools for patient activation, and building a mobile phone app for data collection, to name
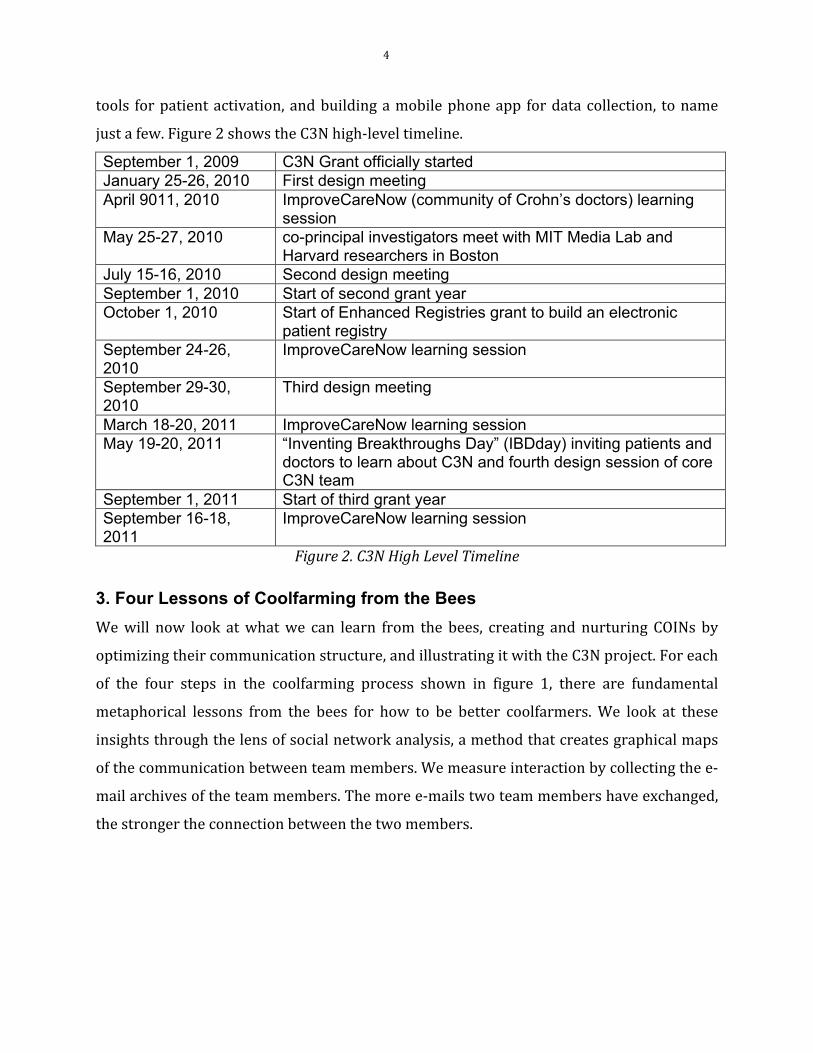
just a few. Figure 2 shows the C3N high-‐level timeline.
September 1, 2009 C3N Grant officially started January 25-26, 2010 First design meeting April 9011, 2010 ImproveCareNow (community of Crohn’s doctors) learning
session May 25-27, 2010 co-principal investigators meet with MIT Media Lab and
Harvard researchers in Boston July 15-16, 2010 Second design meeting September 1, 2010 Start of second grant year October 1, 2010 Start of Enhanced Registries grant to build an electronic
patient registry September 24-26, 2010
ImproveCareNow learning session
September 29-30, 2010
Third design meeting
March 18-20, 2011 ImproveCareNow learning session May 19-20, 2011 “Inventing Breakthroughs Day” (IBDday) inviting patients and
doctors to learn about C3N and fourth design session of core C3N team
September 1, 2011 Start of third grant year September 16-18, 2011
ImproveCareNow learning session
Figure 2. C3N High Level Timeline
3. Four Lessons of Coolfarming from the Bees We will now look at what we can learn from the bees, creating and nurturing COINs by
optimizing their communication structure, and illustrating it with the C3N project. For each
of the four steps in the coolfarming process shown in figure 1, there are fundamental
metaphorical lessons from the bees for how to be better coolfarmers. We look at these
insights through the lens of social network analysis, a method that creates graphical maps
of the communication between team members. We measure interaction by collecting the e-‐
mail archives of the team members. The more e-‐mails two team members have exchanged,
the stronger the connection between the two members.
5
3.1 Creators - Provide Centralized Leadership
In order to lead a swarm of bees, one needs to be a bee. The bee queen does not give any
orders, but she gives her genes to her offspring. She not only passes on her genes, but also her
perfume: bees recognize their sisters from the same hive through the pheromone of the queen.
Creative swarms needs strong leaders. Such leaders lead by example and the trust of their
swarm. Steve Jobs was a co-‐inventor on many of the design patents of Apple. Linus
Torvalds still personally checks all the new features submitted to Linux. The leaders of
Wikipedia are Wikipedia editors themselves. This “be a bee” principle is based on the
concept of homophily, or “birds of a feather flock together” (Christakis & Fowler, 2007, Aral
et. al 2009). This means that both bees and humans like to hang out with others like
themselves.
Similarly to bees, human swarms also work best with strong leaders. Wikipedia editors
deliver the best results in teams that collaborate in a centralized communication structure,
characterized by close interaction among a few trusted collaborators (Nemoto et. al, 2011).
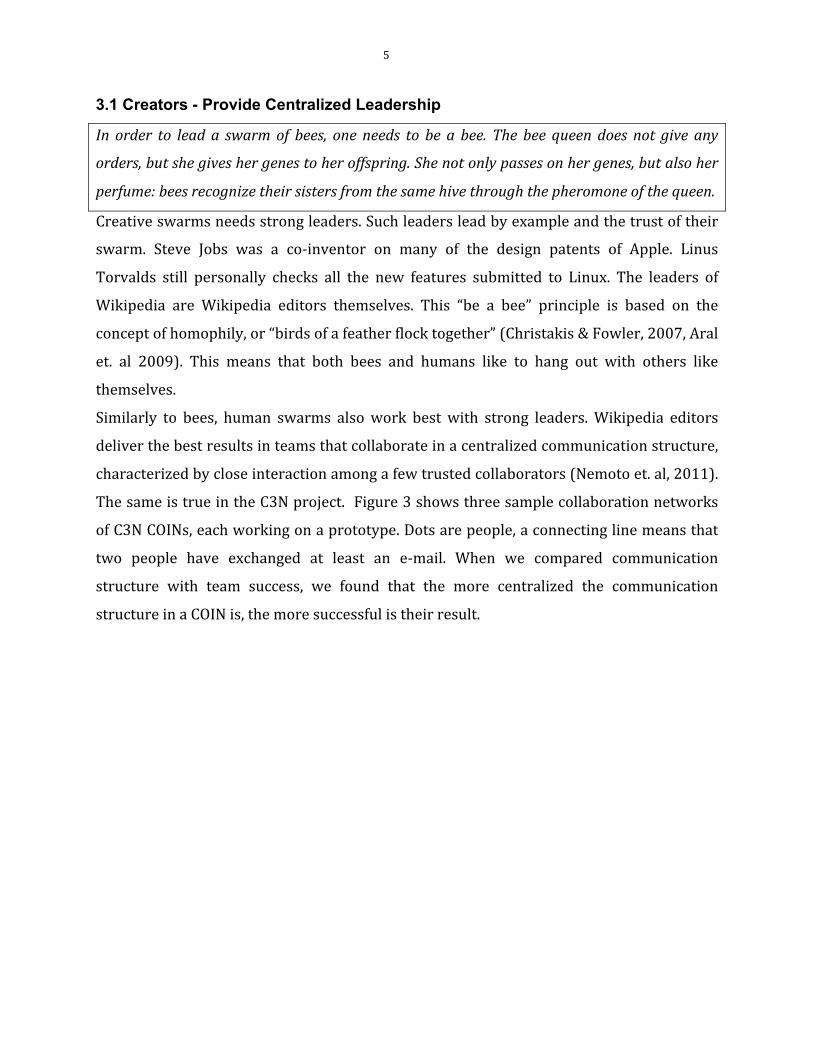
The same is true in the C3N project. Figure 3 shows three sample collaboration networks
of C3N COINs, each working on a prototype. Dots are people, a connecting line means that
two people have exchanged at least an e-‐mail. When we compared communication
structure with team success, we found that the more centralized the communication
structure in a COIN is, the more successful is their result.
6
Figure 3. Different network structures of more and less successful teams in the C3N project
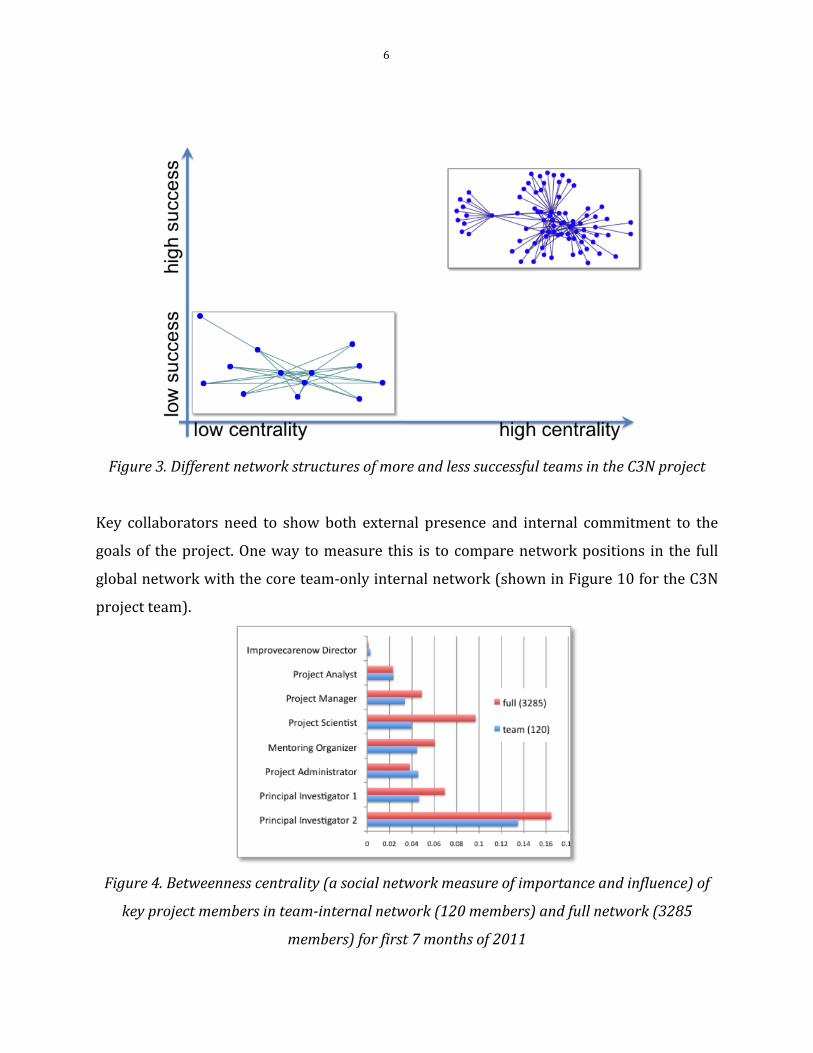
Key collaborators need to show both external presence and internal commitment to the
goals of the project. One way to measure this is to compare network positions in the full
global network with the core team-‐only internal network (shown in Figure 10 for the C3N
project team).
Figure 4. Betweenness centrality (a social network measure of importance and influence) of
key project members in team-internal network (120 members) and full network (3285
members) for first 7 months of 2011
7
Figure 4 illustrates the different perceptions and functions of C3N core team members
within the core team and as seen from the outside in the full network. While both PIs
showed a forceful presence in both the core team network and full network, the project
scientist was the second most active communicator in the full network. The project
administrator, on the other hand, as was to be expected, was more central in the core team
network. The mentoring organizer displayed greater activity externally, working with his
mentees outside of the core team and also coordinating a related external initiative, hence
his external focus. The picture that emerges shows principal investigators, project scientist
and the project manager externally focused, while the project administrator and analyst
cater to the internal needs of the core team.
3.2 COINs - need rotating leaders
Coolhunting bees take turns exploring the merits of potential new homes for their swarm.
When they come back to the swarm, the intensity of their waggle dance will signal to other
bees the desirability of the new location. If another coolhunter bee has found a better location,
she will not only advertise her location by dancing, but she will also keep other coolhunters
from dancing by pushing them with her head and assume a leadership role herself.
Leaders of the swarm need to know when to step back and delegate leadership to
somebody better qualified for a task. Successful swarms show bee-‐like patterns of rotating
leadership. For instance, by comparing the changes in social networking structures with
the creative output of Eclipse programmers, we found that the more the team structure
fluctuated between centralized leadership and a decentralized work style where everybody
communicated with everybody, the more creative the team output was (Kidane & Gloor
2007). These results were later verified in the marketing teams of a German bank where it
was again found that the more teams (and individuals) showed an oscillating
communication pattern between being the star in the center and being part of animated
discussions among equals, the more creative they were (Gloor et al. 2007). The success of
rotating leadership has also been shown in high-‐tech collaborations among different firms
(Davis and Eisenhardt, 2010).
8
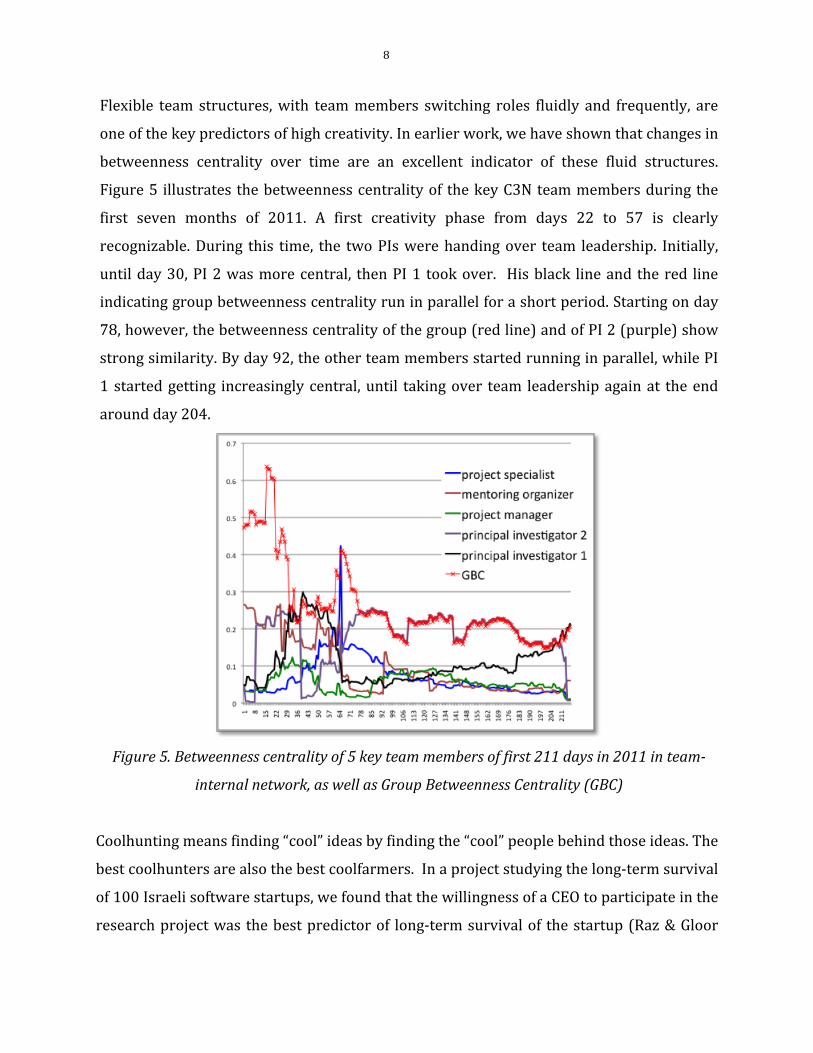
Flexible team structures, with team members switching roles fluidly and frequently, are
one of the key predictors of high creativity. In earlier work, we have shown that changes in
betweenness centrality over time are an excellent indicator of these fluid structures.
Figure 5 illustrates the betweenness centrality of the key C3N team members during the
first seven months of 2011. A first creativity phase from days 22 to 57 is clearly
recognizable. During this time, the two PIs were handing over team leadership. Initially,
until day 30, PI 2 was more central, then PI 1 took over. His black line and the red line
indicating group betweenness centrality run in parallel for a short period. Starting on day
78, however, the betweenness centrality of the group (red line) and of PI 2 (purple) show
strong similarity. By day 92, the other team members started running in parallel, while PI
1 started getting increasingly central, until taking over team leadership again at the end
around day 204.
Figure 5. Betweenness centrality of 5 key team members of first 211 days in 2011 in team-
internal network, as well as Group Betweenness Centrality (GBC)
Coolhunting means finding “cool” ideas by finding the “cool” people behind those ideas. The
best coolhunters are also the best coolfarmers. In a project studying the long-‐term survival
of 100 Israeli software startups, we found that the willingness of a CEO to participate in the
research project was the best predictor of long-‐term survival of the startup (Raz & Gloor
9
2007). In other words, intellectual curiosity of the management, for example, collaborating
on a project outside of their core activities, was the best forecaster of future success. This
means that team members should show high intellectual curiosity, reaching out to others
from outside their core group.
While the first ideas for the prototypes were developed at a brainstorming workshop of all
team members in Cincinnati, C3N core team members did a lot of coolhunting by
collaborating with outside researchers to bring new ideas for prototypes into the C3N
team. For example, interaction with MIT researchers triggered development of smart-‐
phone-‐based tools for automated patient data collection by using the built-‐in sensors of the
smartphone. Another prototype brought in externally was a side-‐product of an analysis of
the Facebook network of IBD patients that identified large structural holes between IBD
patients and led to the development of a Facebook Connector application.
An additional benchmark for success related to rotating leadership is diversity of team
members. Over time, membership in the different C3N prototype teams grew through
voluntary involvement of external participants, who had heard of the project through word
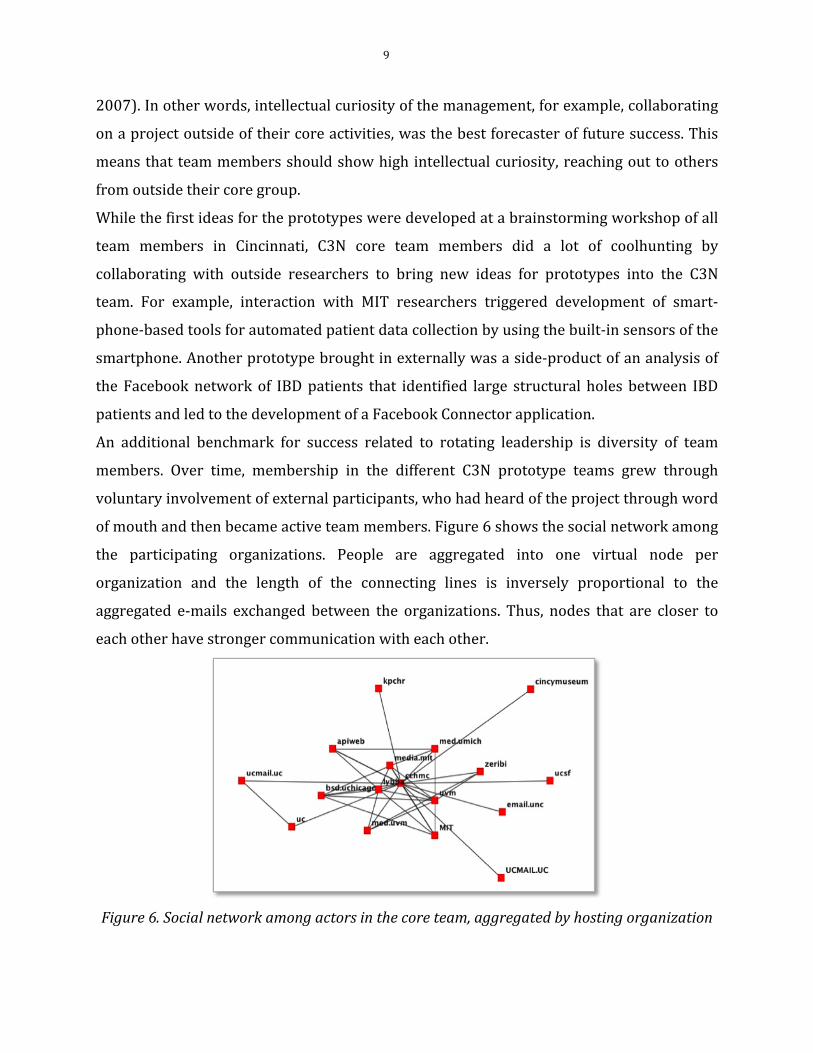
of mouth and then became active team members. Figure 6 shows the social network among
the participating organizations. People are aggregated into one virtual node per
organization and the length of the connecting lines is inversely proportional to the
aggregated e-‐mails exchanged between the organizations. Thus, nodes that are closer to
each other have stronger communication with each other.
Figure 6. Social network among actors in the core team, aggregated by hosting organization
10
While CCHMC naturally is at the core, there is surprisingly high variety among the 83
people involved in C3N at this time represented by the 17 different organizations shown in
figure 6. They come from, among other places, the University of Chicago, MIT, the
University of Vermont, and the University of San Francisco, illustrating the broad spectrum
of backgrounds represented by the core team members in the C3N project.
3.3 Learning Networks - Do a Waggle Dance
Bees convey the location and attractiveness of a new potential home for the swarm through
an elaborate “waggle dance,” the intensity of the dance signals the desirability of the new
location.
Once the COIN has articulated its vision, it is key to recruit new members. The original
members of the COIN conduct their own “waggle dance,” attracting new members to their
cause. This can be measured as communication exchange. The original creators of the
vision – “the queen bees” – try to recruit new members by sending out many e-‐mails. As
mentioned earlier, we compared communication frequency among chief executive officers
(CEOs) of Israeli software start-‐up companies with their long-‐term survival. We found that
the more the CEOs talked with their peers, the more likely their companies were to still be
in business six years later (Raz & Gloor 2007).
Recruitment of new members happens through a combination of identifying suitable
candidates and advertising the goals and previous successes of the project. From the
beginning, the C3N PIs extended feelers to recruit a diverse and highly motivated team,
with members from different fields of medicine, social network analysis, open source
movie production, collective intelligence, and computer science. In addition, patients and
primary care physicians seeing IBD patients were invited to be members of the team. The
team also organized a special event – the “IBDday”, where outside researchers, primary-‐
care doctors, and IBD patients where invited and got a first-‐hand opportunity to try out and
give feedback about the evolving prototypes of the C3N team.
11
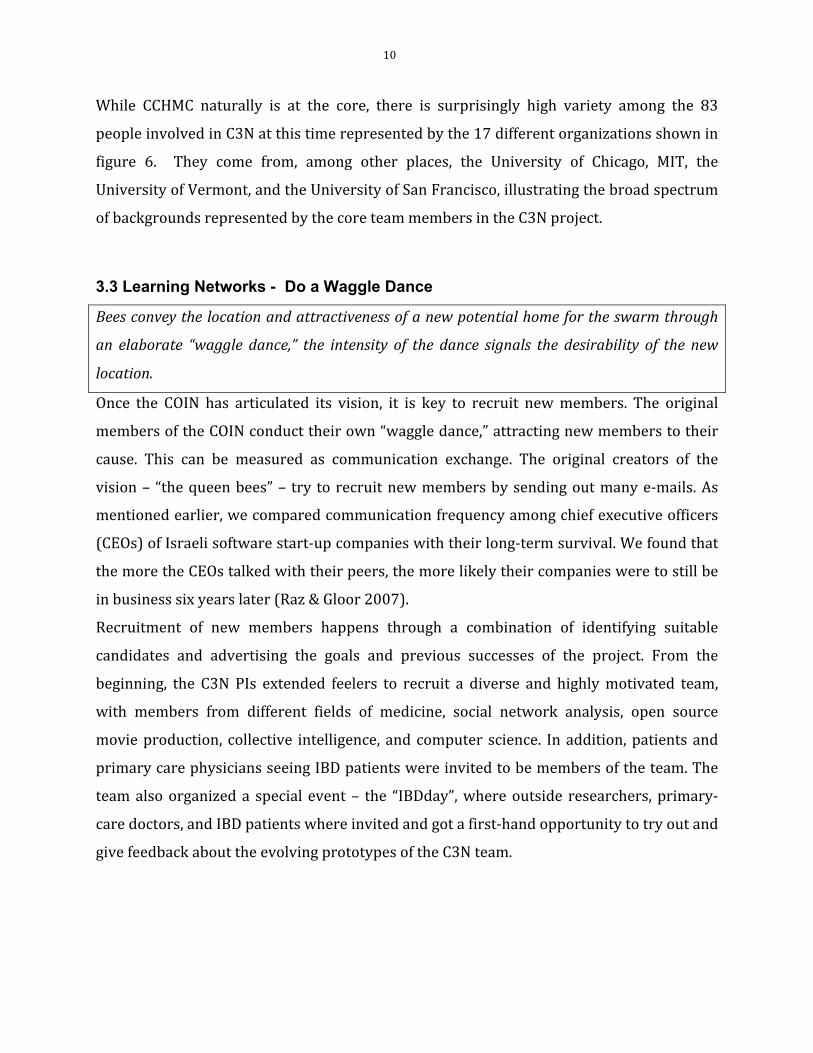
Figure 7. Contribution index of C3N key project members over first seven months of 2011
Figure 7 illustrates the contribution index of the key team members. The contribution
index measures the total amount of e-‐mail or communication activity of a person (x-‐axis)
and the proportion of sent-‐to-‐received messages (y-‐axis). The more messages a person
sends, the higher up she is on the y-‐axis3. The more messages a person only receives, the
farther down they are shown on the y-‐axis. PI 1 was found to be the most active sender,
with a perfectly balanced communication behavior and a contribution index close to zero.
This means not only that he sent and received the most e-‐mails, but also that he sent and
received about the same number of messages. The result was very different for the project
manager, who got a lot of e-‐mails, but, with a contribution index value of -‐0.5, received
twice as many messages as he sent. The mentoring outreach organizer, on the other hand,
an IBD patient himself, had a contribution index of 0.25, meaning he sent much more
messages than he received. The contribution index is a dynamic measure that changes over
time and can be played back in Condor like a movie.
3 The range is from -‐1 to +1. If a person only sends they are a +1 and if they only receive
they are a -‐1. At zero a person equally sends and receives.
12
3.4 Interest Networks – Spread Attraction Pheromone Leading to Trust
Coolhunter bees mark the location of the new hive by spraying it with attraction pheromone,
such that the flying swarm of bees will find their goal irresistible as soon as they get close. At
the same time, the coolhunting bees will direct the flying swarm by rapidly flying back and
forth in the midst of the flying cloud of bees.
Analyzing groups of software developers, and teams of graduate students in doctoral
seminars, we found similar effects of group flow and spraying of attraction pheromone.
While bees build trust through pheromones, humans use more sophisticated means to
develop trust. The more team members trust each other, the more creative is the output of
their work (Gloor et al. 2010). In another study, where members of a jazz band wore
sociometric badges – devices worn around the neck that measure face-‐to-‐face interaction –
during a concert, we found that the more the band members were in flow, that is their
energy levels were oscillating in parallel, the greater was their creative output, measured
by the applause received for the music they were playing. In another stream of work,
looking at Wikipedia editors, we found that the more they used honest language, that is,
mixing praise with constructive criticism, the more productive and effective they were.
What we, thus, found is that getting team members in close physical contact and co-‐located
activities, in combination with using honest language, builds trust, which leads to more
creative teams.
This means that initial trust building is crucial. The fastest way to build trust is through
face-‐to-‐face contact, which is precisely what the C3N team leaders did, inviting a large and
diverse group to the first design meeting in Cincinnati. One of the key ways to build trust is
through honest language. Honest language is, at the same time, very supportive and gives
praise whenever it is well deserved, while also clearly pointing out weaknesses. Honesty
can be measured in the difference between positivity and negativity in the e-‐mail content.
13
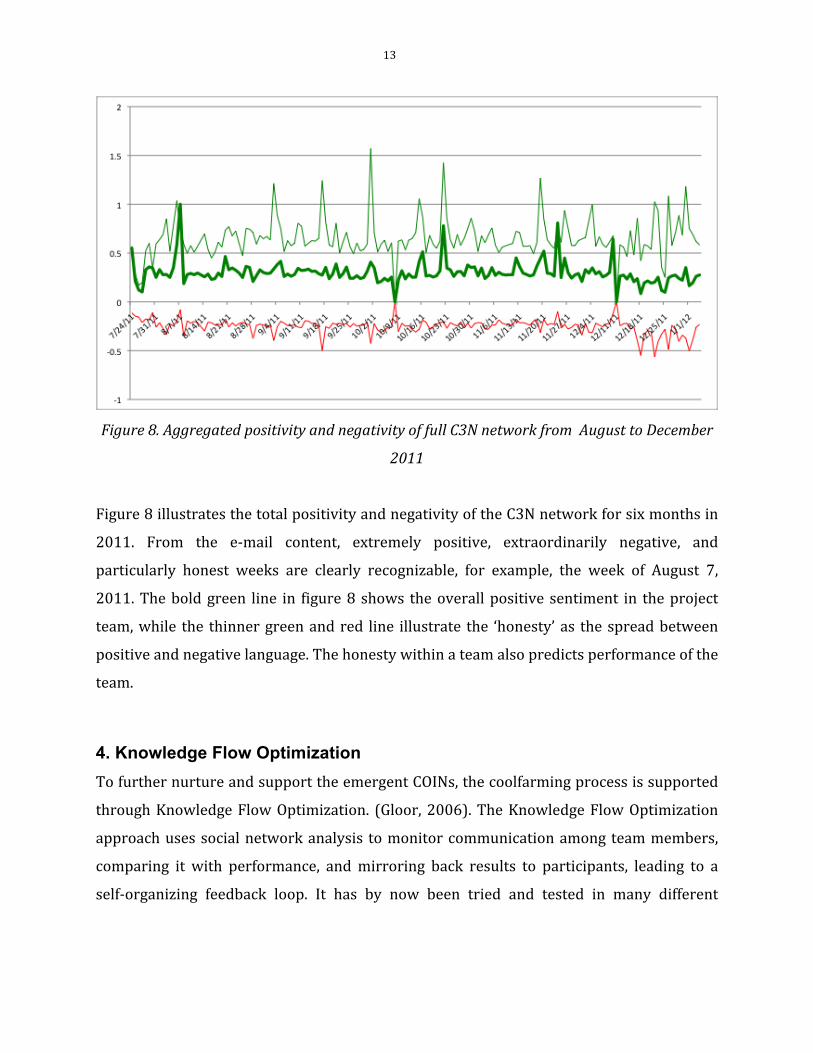
Figure 8. Aggregated positivity and negativity of full C3N network from August to December
2011
Figure 8 illustrates the total positivity and negativity of the C3N network for six months in
2011. From the e-‐mail content, extremely positive, extraordinarily negative, and
particularly honest weeks are clearly recognizable, for example, the week of August 7,
2011. The bold green line in figure 8 shows the overall positive sentiment in the project
team, while the thinner green and red line illustrate the ‘honesty’ as the spread between
positive and negative language. The honesty within a team also predicts performance of the
team.
4. Knowledge Flow Optimization To further nurture and support the emergent COINs, the coolfarming process is supported
through Knowledge Flow Optimization. (Gloor, 2006). The Knowledge Flow Optimization
approach uses social network analysis to monitor communication among team members,
comparing it with performance, and mirroring back results to participants, leading to a
self-‐organizing feedback loop. It has by now been tried and tested in many different
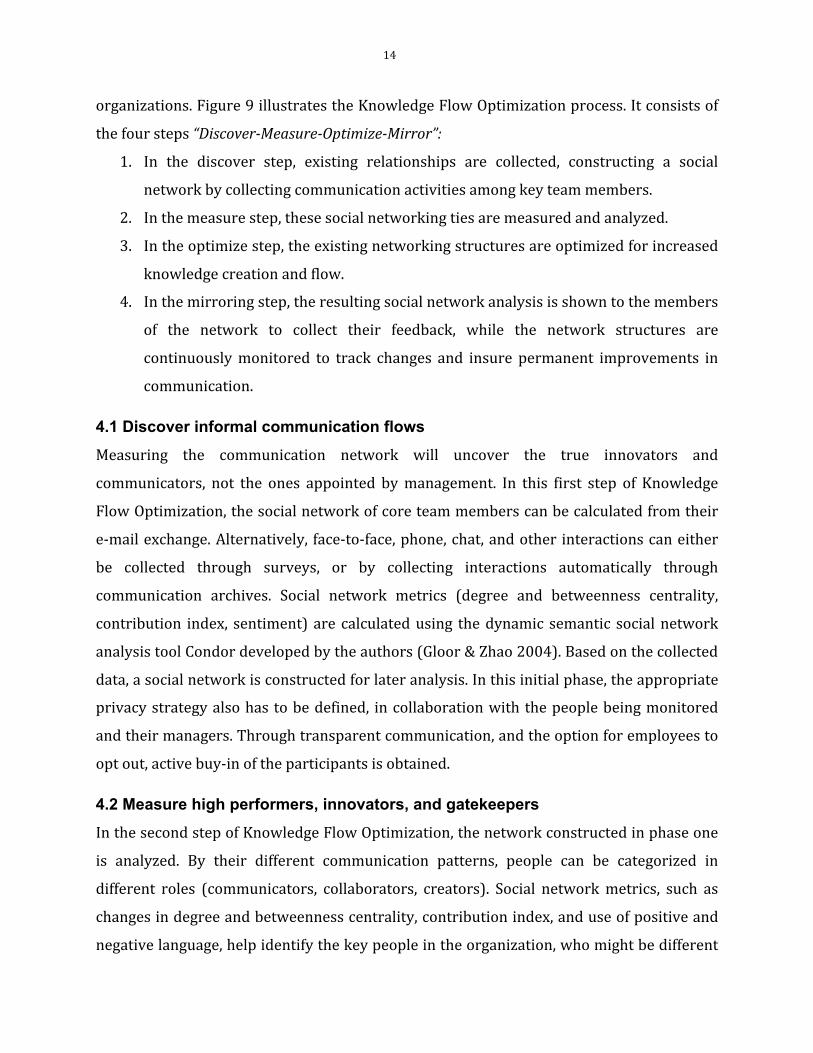
14
organizations. Figure 9 illustrates the Knowledge Flow Optimization process. It consists of
the four steps “Discover-Measure-Optimize-Mirror”:
1. In the discover step, existing relationships are collected, constructing a social
network by collecting communication activities among key team members.
2. In the measure step, these social networking ties are measured and analyzed.
3. In the optimize step, the existing networking structures are optimized for increased
knowledge creation and flow.
4. In the mirroring step, the resulting social network analysis is shown to the members
of the network to collect their feedback, while the network structures are
continuously monitored to track changes and insure permanent improvements in
communication.
4.1 Discover informal communication flows
Measuring the communication network will uncover the true innovators and
communicators, not the ones appointed by management. In this first step of Knowledge
Flow Optimization, the social network of core team members can be calculated from their
e-‐mail exchange. Alternatively, face-‐to-‐face, phone, chat, and other interactions can either
be collected through surveys, or by collecting interactions automatically through
communication archives. Social network metrics (degree and betweenness centrality,
contribution index, sentiment) are calculated using the dynamic semantic social network
analysis tool Condor developed by the authors (Gloor & Zhao 2004). Based on the collected
data, a social network is constructed for later analysis. In this initial phase, the appropriate
privacy strategy also has to be defined, in collaboration with the people being monitored
and their managers. Through transparent communication, and the option for employees to
opt out, active buy-‐in of the participants is obtained.
4.2 Measure high performers, innovators, and gatekeepers
In the second step of Knowledge Flow Optimization, the network constructed in phase one
is analyzed. By their different communication patterns, people can be categorized in
different roles (communicators, collaborators, creators). Social network metrics, such as
changes in degree and betweenness centrality, contribution index, and use of positive and
negative language, help identify the key people in the organization, who might be different
15
from those officially appointed. For example, the contribution index measures the
communication intensity of people as senders and receivers. Comparing these metrics with
known high performers helps to identify the hidden influencers, innovators, and
gatekeepers among different groups. A similar analysis is repeated on the team level,
identifying different teams by their characteristic communication patterns, distinguishing
between high-‐executing, creative, hierarchical, and democratically organized teams.
Benchmarking this structure against known high-‐performing teams will help identify
general recommendations for successful communication in high-‐performing teams.
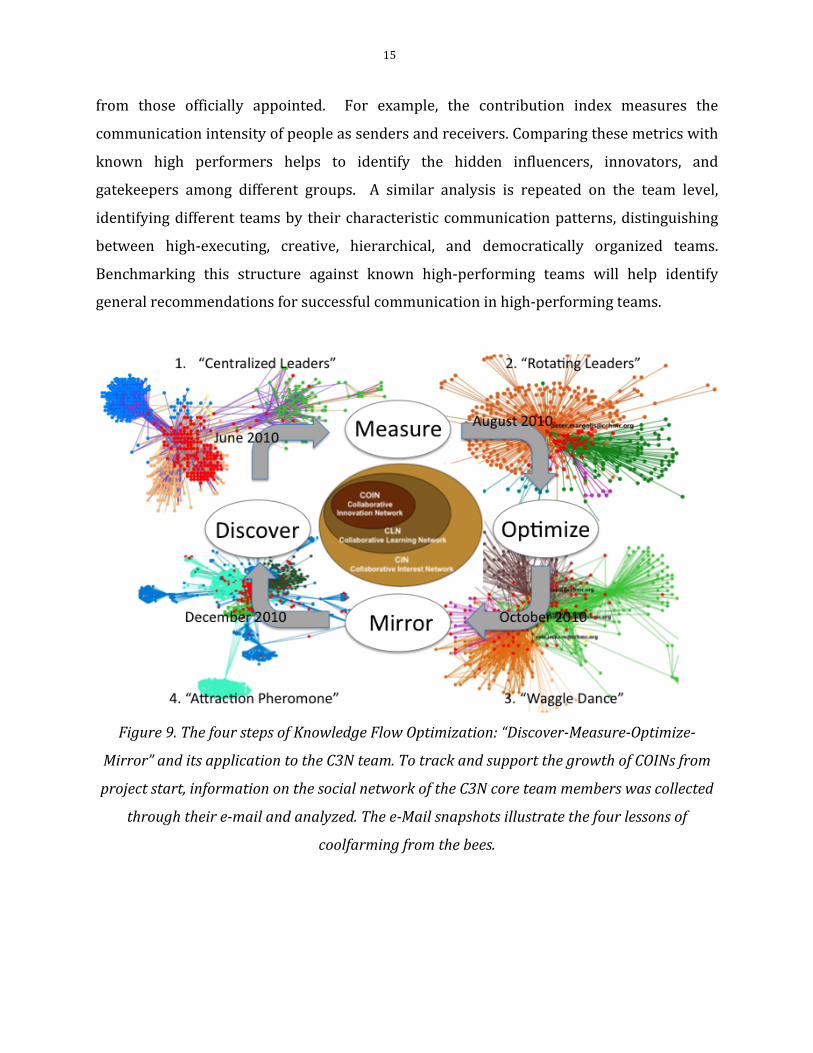
Figure 9. The four steps of Knowledge Flow Optimization: “Discover-Measure-Optimize-
Mirror” and its application to the C3N team. To track and support the growth of COINs from
project start, information on the social network of the C3N core team members was collected
through their e-mail and analyzed. The e-Mail snapshots illustrate the four lessons of
coolfarming from the bees.
16
4.3 Optimize communication structures
Step three of the knowledge flow optimization process consists of nurturing existing COINs,
and creating new ones, to spot gaps in the communication networks and align
communication with business strategy and goals. Optimal communication structures vary
depending on the application area. For example, for call center staff and nurses in a
hospital setting, more hierarchical styles lead to better results (Olguin et al. 2009), while
life sciences researchers deliver better results in decentralized collaboration networks
(Grippa et al. 2011). This optimizing step includes providing support to the hidden leaders
identified in phase two, unburdening overloaded people who might be bottlenecks in their
organization. It also means rewarding and acknowledging subject matter experts and
supporting newly identified COINs. Further actions include strengthening trust in the
community by establishing clear meritocracies and an incentive system (not necessarily of
monetary nature) rewarding initial COIN members.
4.4 Mirror feedback to network participants
Once the communication patterns of individuals and teams have been computed, they are
shown to team members, together with information about communication patterns of the
most successful individuals and teams. This insight is based on the Hawthorne principle:
telling a group of people that they are being monitored and what the desirable
communication patterns are will get them to change their behavior towards the desired
outcome. For example, one pattern of successful communicators is a network that “does
not look like a star, but like a galaxy” (Gloor & Cooper 2007).
Once the infrastructure for measuring the communication among team members has been
set up, it can be continuously monitored. Telling team members how they do compared to
best practices, while constantly showing them changes in their social network, will lead to
continuous improvement. This way, the innovative power of COINs can be converted into
real business value measured through its creative output, such as new papers written,
patents issued, or startups created.
We will now describe how the four-‐step knowledge flow optimization process was applied
to growing the C3N team. Figure 9 shows the four steps in the emergence of the C3N group,
analyzed through the e-‐mail network of C3N key members. In earlier work, it was shown
17
that e-‐mail reflects the real mode of communication. People who talk a lot also exchange
many e-‐mails (Grippa et al. 2006, Zilli et al. 2006). The network pictures in figure 9 were
constructed by combining the e-‐mailboxes of six key members of the core group and
analyzed using Condor, the dynamic social network analysis software introduced above.
Participants who exchanged less than five e-‐mails were removed to include only the
communications of people with a somewhat more intensive involvement. Phase 1, labeled
“barely connected” in figure 9, shows the core team evolving, depicted by the red dots in
the center. However each team member had a large share of activities outside the C3N
team with people mostly connected among themselves, but not with the rest of the C3N
core members. In phase 2, one of the co-‐PIs conducted an elaborate “waggle dance,”
reaching out to other IBD doctors and researchers to help organize a C3N design meeting
and asking a large group of people to gather in Cincinnati to brainstorm different solutions.
Phase 3 shows the ensuing “creative chaos” of oscillating leadership during and after the
design meeting, where new ideas for prototypes were discussed. In phase 4, the emergence
of new COINs assembling around these prototypes is clearly recognizable.
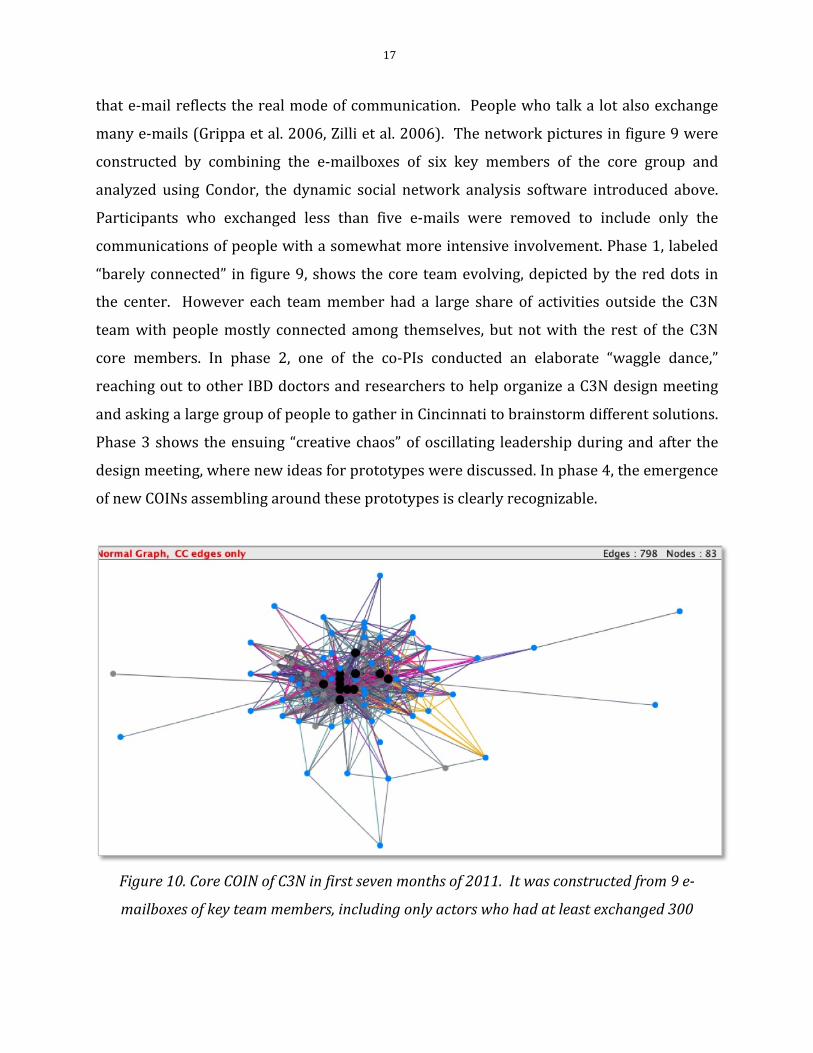
Figure 10. Core COIN of C3N in first seven months of 2011. It was constructed from 9 e-
mailboxes of key team members, including only actors who had at least exchanged 300
18
messages. Blue dots are actors with a CCHMC e-mail address. Black dots are core COIN
members
Figure 10 illustrates communication among the core C3N project member. Its 12 members
are shown as the black dots, automatically calculated by Condor through its
Core/Periphery algorithm, as well as the surrounding 71 members of the Collaborative
Learning Network. The many blue dots in Figure 10 illustrate the quite dominant role of
C3N member from CCHMC.
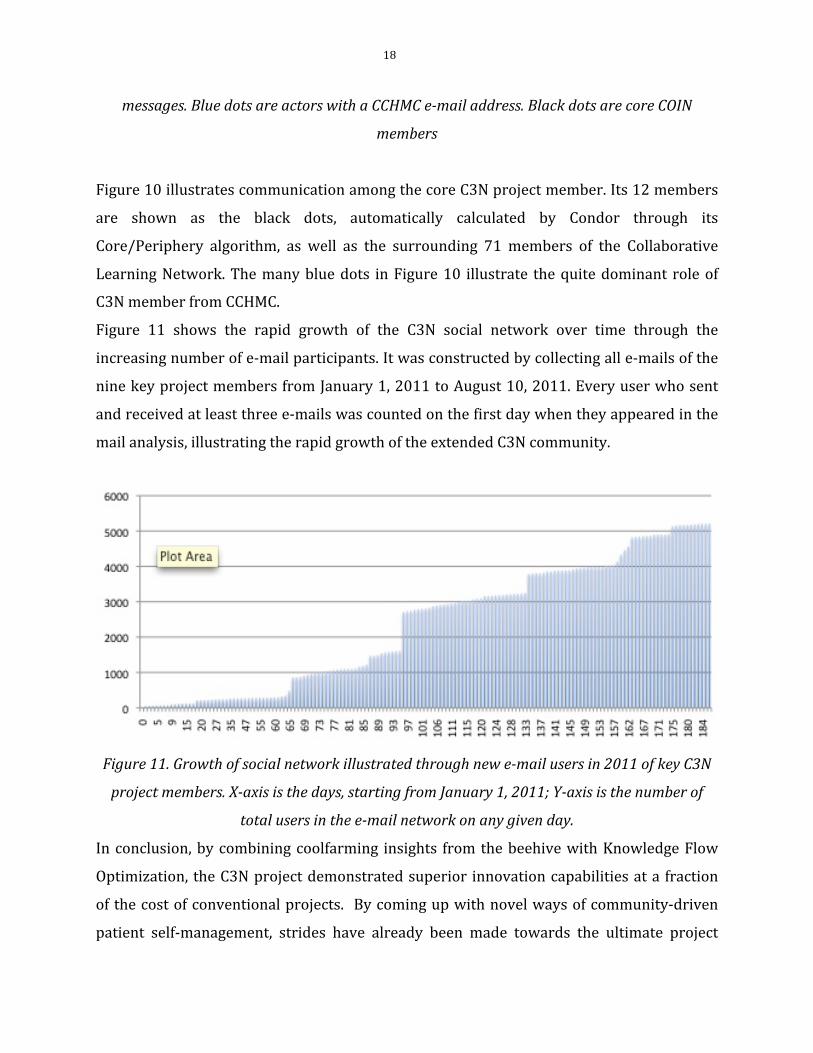
Figure 11 shows the rapid growth of the C3N social network over time through the
increasing number of e-‐mail participants. It was constructed by collecting all e-‐mails of the
nine key project members from January 1, 2011 to August 10, 2011. Every user who sent
and received at least three e-‐mails was counted on the first day when they appeared in the
mail analysis, illustrating the rapid growth of the extended C3N community.
Figure 11. Growth of social network illustrated through new e-mail users in 2011 of key C3N
project members. X-axis is the days, starting from January 1, 2011; Y-axis is the number of
total users in the e-mail network on any given day.
In conclusion, by combining coolfarming insights from the beehive with Knowledge Flow
Optimization, the C3N project demonstrated superior innovation capabilities at a fraction
of the cost of conventional projects. By coming up with novel ways of community-‐driven
patient self-‐management, strides have already been made towards the ultimate project
19
goals, improving the daily lives of patients with IBD. In addition, novel ideas developed in
the prototype projects have already been integrated into three startup companies.
5 The Result: A highly innovative team developing superior results The reason why COINs are so successful is because team members join the project not
because they are paid to do it, but because they are passionate about it. By withholding
initial payment, only people who care primarily about the cause and not about making
money will initially join the project. This might be a slower process at the start, but the
team members will be far more resilient when obstacles arise, and stick with the swarm for
good, until it takes off. In the case of the C3N project, an intrinsically motivated swarm of
researchers, doctors, and patients was empowered to create dozens of radical health care
innovations at a fraction of the cost of conventional projects. After the first two years, the
C3N project has already come a long way towards its ultimate goal, improving the lives of
IBD patients in manifold ways. Just like Apple, Google, LEGO, or Wikipedia, the C3N project
has succeeded in tapping the power of Collaborative Innovation Networks to deliver
disruptive innovations at unprecedented speed.
In sum, insights from the beehive teach managers novel ways how to radically increase
creativity and performance of their organizations. The lesson to the manager is clear:
abolish the hierarchical ways of conventional management, and “become a bee yourself”.
Just like the bees, which do everything for the benefit of their swarm, COIN members,
whether it is Wikipedia editors, LEGO Mindstorm hackers, founders of successful startups,
or C3N team members, do what they do not because they want to get rich, but because they
care about their cause. As Steve Jobs said “Being the richest man in the cemetery doesn’t
matter to me … Going to bed at night saying we’ve done something wonderful… that’s what
matters to me.”
References Aral, S., Van Alstyne, M. (2007). Network Structure & Information Advantage. Proceedings of the Academy of Management Conference, Philadelphia, PA.
Aral, S. Muchnika, L. Sundararajana, A. Distinguishing influence-‐based contagion from homophily-‐driven diffusion in dynamic networks. PNAS December 22, 2009 vol. 106 no. 51 21544-‐21549
20
Christakis, N.A. Fowler, J. H. The Spread of Obesity in a Large Social Network over 32 Years. N Engl J Med 2007; 357:370-‐379. July 26, 2007
Davis, J. P. Eisenhardt, K. M., Rotating Leadership and Collaborative Innovation: Recombination Processes in Symbiotic Relationships (July 19, 2011). Administrative Science Quarterly, December 2010. Available at SSRN: http://ssrn.com/abstract=1889846
Gloor, P. Cooper, S. Coolhunting -‐ Chasing Down The Next Big Thing? AMACOM, NY, 2007
Gloor, P. Fischbach, K. Fuehres, H. Lassenius, C. Niinimäki, T. Olguin Olguin, D. Pentland, A. Piri, A. Putzke, J. Towards “Honest Signals” of Creativity – Identifying Personality Characteristics Through Microscopic Social Network Analysis. Proceedings COINs 2010, Collaborative Innovations Networks Conference, Savannah GA, Oct 7-‐9, 2010
Gloor, P. Oster, D. Putzke, J. Fischbach, K. Schoder, D. Ara, K. Kim, T. Laubacher, R. Mohan, A. Olguin Olguin, D. Pentland, A. Waber, B. Studying Microscopic Peer-‐to-‐Peer Communication Patterns. Proc. AMCIS Americas Conference on Information Systems, Keystone, Colorado, Aug. 9-‐12, 2007
Gloor, P. Swarm Creativity, Competitive Advantage Through Collaborative Innovation Networks. Oxford University Press, 2006
Gloor, P. Coolfarming -‐ Turn Your Great Idea In The Next Big Thing AMACOM, NY, 2010
Gloor, P. Zhao, Y. TeCFlow -‐ A Temporal Communication Flow Visualizer for Social Networks Analysis , ACM CSCW Workshop on Social Networks. ACM CSCW Conference, Chicago, Nov. 6. 2004.
Grippa, F. Zilli, A. Laubacher, R. Gloor, P. E-‐mail May Not Reflect The Social Network, NAACSOS Conference, June 22 -‐ 23, Notre Dame IN, North American Association for Computational Social and Organizational Science, 2006
Grippa, F. Palazzolo, M. Buccuvalas, J. Gloor, P. Monitoring Changes in the Social Network Structure of Clinical Care Teams Resulting from Team Development Efforts. Proceedings 3rd Intl. Conf on Collaborative Innovation Networks COINs 2011, Sept. 8-‐10, Basel, Switzerland
Joo, S. Gloor, P. Schnorf, S. Detection of Power User Patterns Among High School Students in a Mobile Communication Network. Power Users of ICT International Symposium, Costa Rica, Aug.8-‐10, 2005
Kidane, Y. Gloor, P. Correlating temporal communication patterns of the Eclipse open source community with performance and creativity, Computational & Mathematical Organization Theory. Volume 13, Issue 1 (March 2007), ISSN:1381-‐298X, 17 -‐ 27, 2007
Nemoto, K. Gloor, P. Laubacher, R. Social Capital Increases Efficiency of Collaboration among Wikipedia Editors, ACM Hypertext 2011: 22nd ACM Conference on Hypertext and Hypermedia, Eindhoven, NL, June 6-‐9, 2011
Olguin Olguin, D. Gloor, P. Pentland, A. Wearable Sensors for Pervasive Healthcare Management.3rd International Conference on Pervasive Computing Technologies for Healthcare 2009. London, UK. April, 2009.
Raz, O. Gloor, P. Size Really Matters -‐ New Insights for Startup's Survival, Management Science, February 2007
Zilli, A. Grippa, F. Gloor, P. Laubacher, R. One in Four Is Enough – Strategies for Selecting Ego Mailboxes for a Group Network View. Proc. European Conference on Complex Systems ECCS '06, Sept. 25-‐29, Oxford UK, 2006


![An Information System Design for Organizational Creativity ...distinguished [18, 26, 27, 28]: individual creativity support systems (ICSS), group creativity support systems (GCSS),](https://img.pdfslide.net/doc/110x75/5f470999266de9297350ffd9/an-information-system-design-for-organizational-creativity-distinguished-18.jpg)