Embed Size (px)
Citation preview

Copyright © 2011 Pearson Education, Inc. Publishing as Prentice Hall
Ch 6 -1
Chapter 6Strategy Analysis & Choice
Strategic Management: Concepts & Cases
13th Edition
Fred David

Copyright © 2011 Pearson Education, Inc. Publishing as Prentice Hall
Ch 6 -2
Copyright © 2011 Pearson Education, Inc. Publishing as Prentice Hall
Ch 6 -3
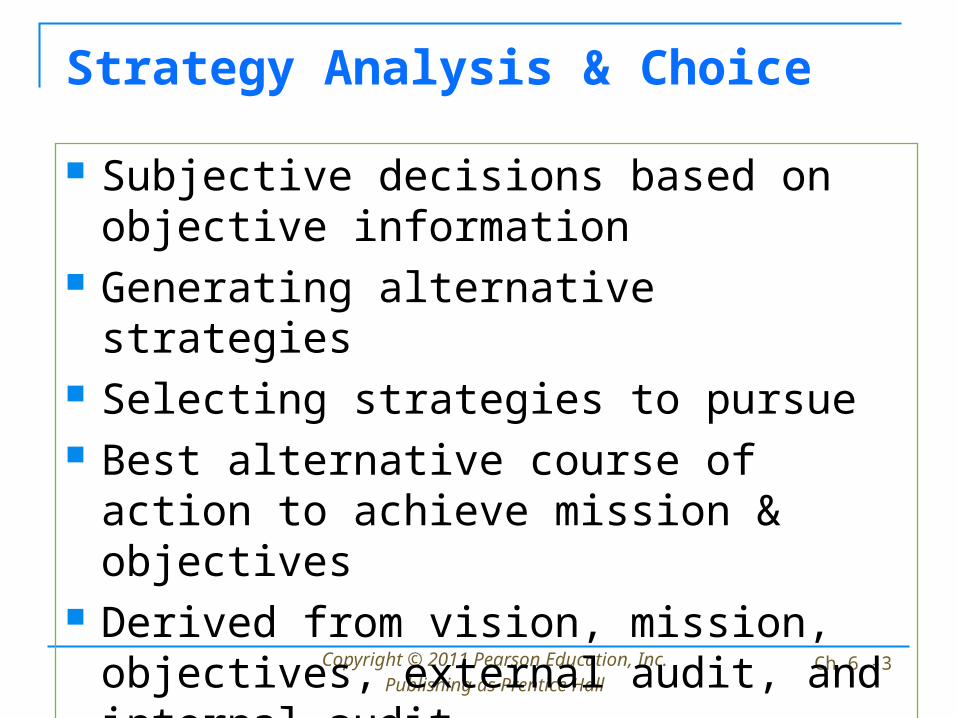
Subjective decisions based on objective information
Generating alternative strategies Selecting strategies to pursue Best alternative course of action to
achieve mission & objectives Derived from vision, mission, objectives,
external audit, and internal audit
Strategy Analysis & Choice

Copyright © 2011 Pearson Education, Inc. Publishing as Prentice Hall
Ch 6 -4
Strategy Analysis & Choice
Generating Alternatives –
Participation in generating alternative strategies should be as broad as possible

Copyright © 2011 Pearson Education, Inc. Publishing as Prentice Hall
Ch 6 -5
Comprehensive Strategy-Formulation Framework Stage 1 - Input Stage
EFE Matrix IFE matrix CPM
Stage 2 - Matching Stage SWOT SPACE matrix BCG matrix IE Matrix Grand strategy matrix
Stage 3 - Decision Stage QSPM

Copyright © 2011 Pearson Education, Inc. Publishing as Prentice Hall
Ch 6 -6
Comprehensive Strategy-Formulation Framework As shown in the previous PowerPoint,
strategy formulation techniques can be integrated into a three-stage decision-making framework. The tools presented in this framework are applicable to all sizes and types of organizations and can help strategists identify, evaluate, and select strategies

Copyright © 2011 Pearson Education, Inc. Publishing as Prentice Hall
Ch 6 -7
The Strategy-Formulation Analytical Framework Stage 1 (Input Stage) summarizes the basic
input information needed to formulate strategies.
Stage 2 (Matching Stage) focuses on generating feasible alternative strategies by aligning key external and internal factors.
Stage 3 (Decision Stage) uses the QSPM to objectively evaluate feasible alternative strategies identified in Stage 2.

Copyright © 2011 Pearson Education, Inc. Publishing as Prentice Hall
Ch 6 -8
Strategy-Formulation Framework
External Factor EvaluationMatrix (EFE)
Internal Factor EvaluationMatrix (IFE)
Competitive Profile Matrix(CPM)
Stage 1:The Input Stage

Copyright © 2011 Pearson Education, Inc. Publishing as Prentice Hall
Ch 6 -9
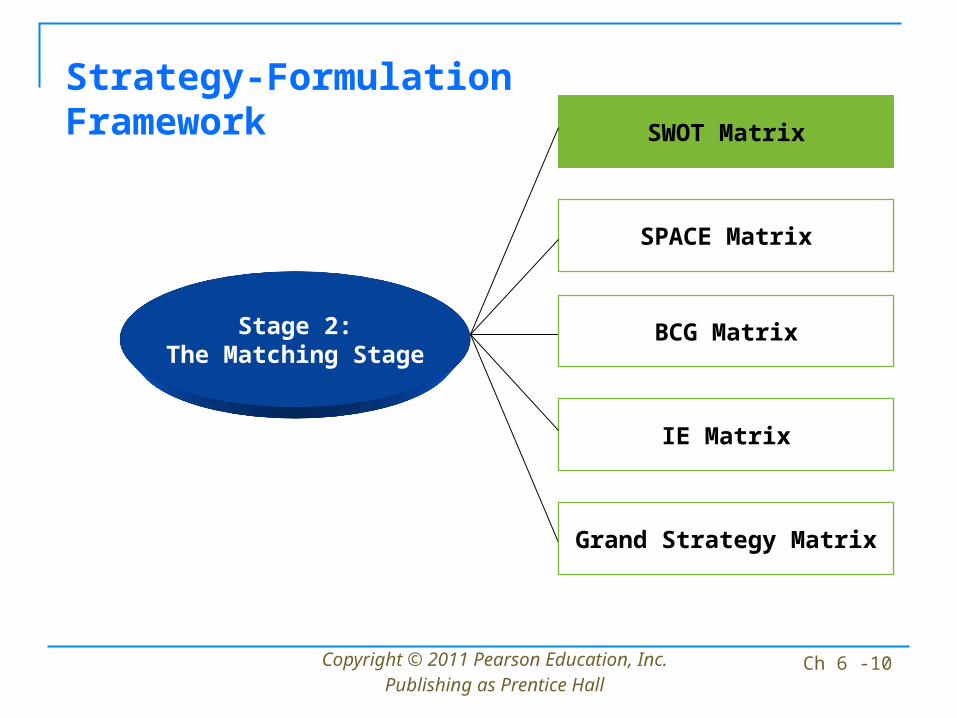
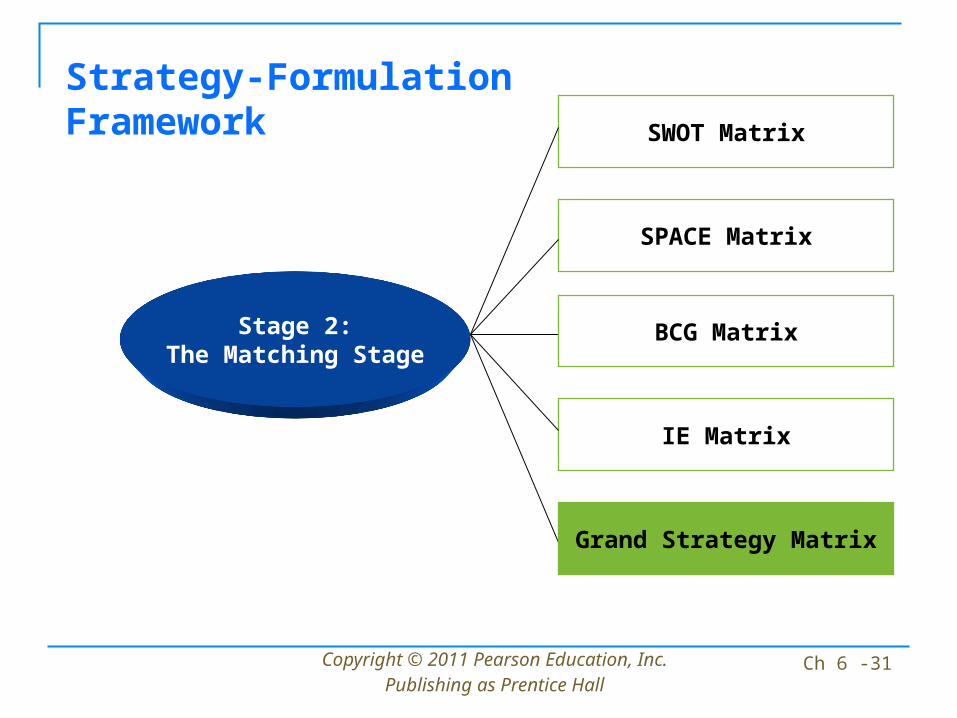
Stage 2: The Matching Stage
Match between organization’s internal resources & skills and the opportunities & risks created by its external factors
Copyright © 2011 Pearson Education, Inc. Publishing as Prentice Hall
Ch 6 -10
Strategy-Formulation FrameworkSWOT Matrix
SPACE Matrix
BCG Matrix
IE Matrix
Grand Strategy Matrix
Stage 2:The Matching Stage

Copyright © 2011 Pearson Education, Inc. Publishing as Prentice Hall
Ch 6 -11
Stage 2: The Matching Stage
Strengths
Weaknesses
Opportunities
Threats
SWOT Matrix

Copyright © 2011 Pearson Education, Inc. Publishing as Prentice Hall
Ch 6 -12
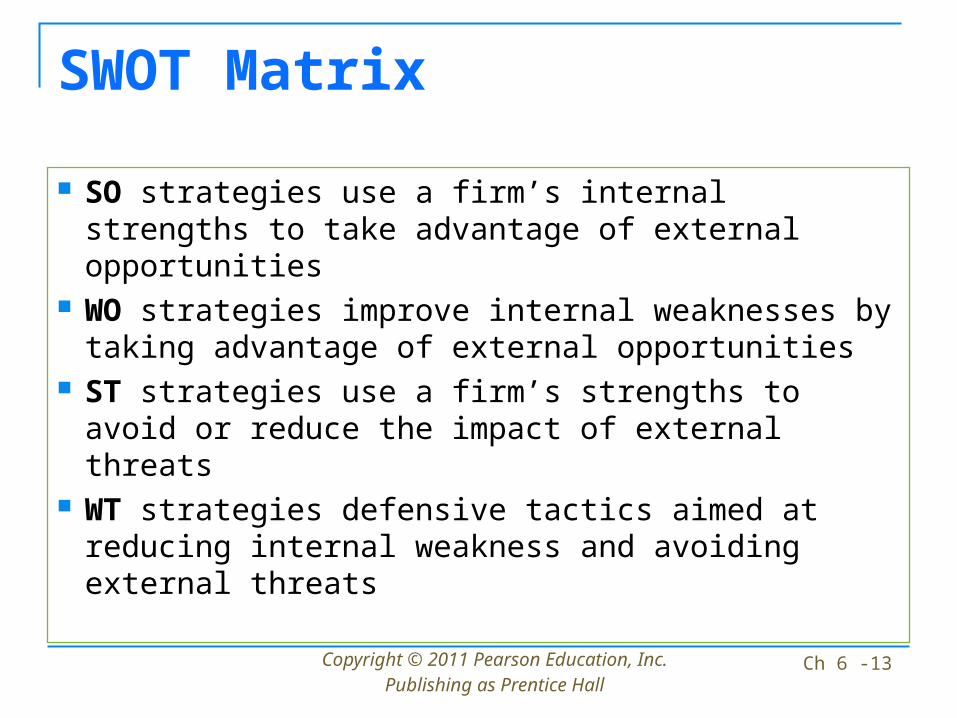
SWOT Matrix
Strengths-Opportunities (SO)
Weaknesses-Opportunities (WO)
Strengths-Threats (ST)
Weaknesses-Threats (WT)
Four Types of Strategies
Copyright © 2011 Pearson Education, Inc. Publishing as Prentice Hall
Ch 6 -13
SWOT Matrix
SO strategies use a firm’s internal strengths to take advantage of external opportunities
WO strategies improve internal weaknesses by taking advantage of external opportunities
ST strategies use a firm’s strengths to avoid or reduce the impact of external threats
WT strategies defensive tactics aimed at reducing internal weakness and avoiding external threats

Copyright © 2011 Pearson Education, Inc. Publishing as Prentice Hall
Ch 6 -14
Strategy-Formulation FrameworkSWOT Matrix
SPACE Matrix
BCG Matrix
IE Matrix
Grand Strategy Matrix
Stage 2:The Matching Stage

Copyright © 2011 Pearson Education, Inc. Publishing as Prentice Hall
Ch 6 -15
Strategic Position and Action Evaluation (SPACE) Matrix The SPACE matrix’s four-quadrant
framework indicates whether aggressive, conservative, defensive, or competitive strategies are most appropriate for a given organization. Its axes represent two internal dimensions (financial strength [FS] and competitive advantage [CA]) and two external dimensions (environmental stability [ES] and industry strength [IS]).

Copyright © 2011 Pearson Education, Inc. Publishing as Prentice Hall
Ch 6 -16
SPACE Matrix
Depending upon the type of organization, numerous variables could make up each of the dimensions represented on the axes of the SPACE matrix. Variables that were included in the firm’s EFE and IFE matrices should be considered in developing a SPACE matrix.

Copyright © 2011 Pearson Education, Inc. Publishing as Prentice Hall
Ch 6 -17
SPACE Matrix
Internal dimensions Financial position (FP) Competitive position (CP)
External dimensions Environmental position (EP) Industry position (IP)

Copyright © 2011 Pearson Education, Inc. Publishing as Prentice Hall
Ch 6 -18
Steps to Developing a SPACE Matrix
1. Select a set of variables to define FS, CA, ES, and IS.
2. Assign a numerical value:1. From +1 to +6 to each FS & IS dimension
2. From -1 to -6 to each ES & CA dimension
3. Compute an average score for each FS, CA, ES, and IS.

Copyright © 2011 Pearson Education, Inc. Publishing as Prentice Hall
Ch 6 -19
Steps to Developing a SPACE Matrix
4. Plot the average score on the appropriate axis.
5. Add the two scores on the x-axis and plot the point. Add the two scores on the y-axis and plot the point. Plot the intersection of the new xy point.
6. Draw a directional vector from the origin through the new intersection point. This vector reveals the type of strategies recommended for the organization.

Copyright © 2011 Pearson Education, Inc. Publishing as Prentice Hall
Ch 6 -20

Copyright © 2011 Pearson Education, Inc. Publishing as Prentice Hall
Ch 6 -21
Strategy-Formulation FrameworkSWOT Matrix
SPACE Matrix
BCG Matrix
IE Matrix
Grand Strategy Matrix
Stage 2:The Matching Stage
Copyright © 2011 Pearson Education, Inc. Publishing as Prentice Hall
Ch 6 -22
BCG Matrix
The BCG matrix helps multi-divisional firms formulate strategies. It graphically portrays differences among divisions in terms of relative market share position and industry growth rate. Relative market share position is defined as the ratio of a division’s own market share (or revenues) in a particular industry to the market share (or revenues) held by the largest rival firm in that industry.
Copyright © 2011 Pearson Education, Inc. Publishing as Prentice Hall
Ch 6 -23
BCG Matrix
Relative market share position is given on the x-axis. The mid-point on the x-axis usually is set at .50, corresponding to a division that has half the market share of the leading firm in the industry. The y-axis represents the industry growth rate in sales, measured in percentage terms. The growth rate percentages on the y-axis could range from -20 to +20%, with 0.0 being the mid-point.

Copyright © 2011 Pearson Education, Inc. Publishing as Prentice Hall
Ch 6 -24
BCG Matrix
An example of a BCG matrix appears in the next Power Point. Each circle represents a separate division. The size of the circle corresponds to the proportion of corporate revenue generated by that business unit, and the pie slice indicates the proportion of corporate profits generated by that division. Divisions located in Quadrant I are called “Question Marks;” Quadrant II, “Stars;” Quadrant III, “Cash Cows;” and Quadrant IV, “Dogs.”

Copyright © 2011 Pearson Education, Inc. Publishing as Prentice Hall
Ch 6 -25

Copyright © 2011 Pearson Education, Inc. Publishing as Prentice Hall
Ch 6 -26
BCG Matrix
Question Marks – low relative market share in a high-growth industry
Stars – high relative market share in a high-growth industry
Cash Cows – high relative market share in a low-growth industry
Dogs – Low relative market share in a slow or no growth industry

Copyright © 2011 Pearson Education, Inc. Publishing as Prentice Hall
Ch 6 -27
Strategy-Formulation FrameworkSWOT Matrix
SPACE Matrix
BCG Matrix
IE Matrix
Grand Strategy Matrix
Stage 2:The Matching Stage

Copyright © 2011 Pearson Education, Inc. Publishing as Prentice Hall
Ch 6 -28
The Internal-External Matrix
Positions an organization’s various divisions in a nine-cell display
Similar to BCG Matrix except the IE Matrix: Requires more information about the divisions Strategic implications of each matrix are different

Copyright © 2011 Pearson Education, Inc. Publishing as Prentice Hall
Ch 6 -29
Copyright © 2011 Pearson Education, Inc. Publishing as Prentice Hall
Ch 6 -30
IE Matrix
Based on two key dimensions The IFE total weighted scores on the x-axis The EFE total weighted scores on the y-axis
Divided into three major regions Grow and build – Cells I, II, or IV Hold and maintain – Cells III, V, or VII Harvest or divest – Cells VI, VIII, or IX
Copyright © 2011 Pearson Education, Inc. Publishing as Prentice Hall
Ch 6 -31
Strategy-Formulation FrameworkSWOT Matrix
SPACE Matrix
BCG Matrix
IE Matrix
Grand Strategy Matrix
Stage 2:The Matching Stage

Copyright © 2011 Pearson Education, Inc. Publishing as Prentice Hall
Ch 6 -32
Grand Strategy Matrix
Tool for formulating alternative strategies
Based on two dimensions Competitive position
Market growth

Copyright © 2011 Pearson Education, Inc. Publishing as Prentice Hall
Ch 6 -33
Quadrant IV
1. Related diversification
2. Unrelated diversification
3. Joint ventures
Quadrant III
1. Retrenchment
2. Related diversification
3. Unrelated diversification
4. Divestiture
5. Liquidation
Quadrant I
1. Market development
2. Market penetration
3. Product development
4. Forward integration
5. Backward integration
6. Horizontal integration
7. Related diversification
Quadrant II
1. Market development
2. Market penetration
3. Product development
4. Horizontal integration
5. Divestiture
6. Liquidation
RAPID MARKET GROWTH
SLOW MARKET GROWTH
WEAK COMPETITIVE
POSITION
STRONGCOMPETITIVE
POSITION

Copyright © 2011 Pearson Education, Inc. Publishing as Prentice Hall
Ch 6 -34
Strategy-Formulation Analytical Framework
Stage 3:The Decision Stage
Quantitative StrategicPlanning Matrix
(QSPM)

Copyright © 2011 Pearson Education, Inc. Publishing as Prentice Hall
Ch 6 -35
QSPM
Technique designed to determine the relative attractiveness of feasible alternative actions
Quantitative Strategic Planning Matrix
Copyright © 2011 Pearson Education, Inc. Publishing as Prentice Hall
Ch 6 -36
Quantitative Strategic Planning Matrix (QSPM) The QSPM is an analytical technique designed to determine the
relative attractiveness of feasible alternative strategies. Information from each of the matrices in Stages 1 and 2 is used to construct the QSPM.
The left column of a QSPM consists of key external and internal factors (from Stage 1), and the top row consists of feasible alternative strategies (from Stage 2). Specifically, the left column consists of information obtained directly from the EFE matrix and the IFE matrix. In the column to the right of the key factors, the respective weights received by each factor in the EFE matrix and IFE matrix are recorded.
Copyright © 2011 Pearson Education, Inc. Publishing as Prentice Hall
Ch 6 -37
Quantitative Strategic Planning Matrix (QSPM)
The top row of a QSPM consists of alternative strategies derived from each matrix in Stage 2. These matching techniques usually generate similar feasible alternatives. However, not every strategy suggested by the matching techniques has to be evaluated in a QSPM. Strategists should use good intuitive judgment in selecting strategies to include in a QSPM.
The basic format of the QSPM is illustrated in the following Power Point.

Copyright © 2011 Pearson Education, Inc. Publishing as Prentice Hall
Ch 6 -38
QSPM
Key Internal Factors
Management
Marketing
Finance/Accounting
Production/Operations
Research and Development
Management Information Systems
Strategy 3Strategy 2Strategy 1WeightKey External Factors
Economy
Political/Legal/Governmental
Social/Cultural/Demographic/Environmental
Technological
Competitive
Strategic Alternatives

Copyright © 2011 Pearson Education, Inc. Publishing as Prentice Hall
Ch 6 -39
Steps to Develop a QSPM
1. Make a list of the firm’s key external opportunities/threats and internal strengths/weaknesses in the left column
2. Assign weights to each key external and internal factor

Copyright © 2011 Pearson Education, Inc. Publishing as Prentice Hall
Ch 6 -40
Steps to Develop a QSPM
3. Examine the Stage 2 (matching) matrices, and identify alternative strategies that the organization should consider implementing
4. Determine the Attractiveness Scores
5. Compute the Total Attractiveness Scores
6. Compute the Sum Total Attractiveness Score