Embed Size (px)
Citation preview

Copyright
by
Mu Li
2017

The Report Committee for Mu Li
Certifies that this is the approved version of the following report:
Professional Stadiums and the City:
An Assessment of Twenty-First Century Urban Sports Facilities in the
United States
APPROVED BY
SUPERVISING COMMITTEE:
Thomas M. Hunt, Supervisor
Tolga Ozyurtcu, Co-Supervisor

Professional Stadiums and the City:
An Assessment of Twenty-First Century Urban Sports Facilities in the
United States
by
Mu Li, B.MGMT.
Report
Presented to the Faculty of the Graduate School of
The University of Texas at Austin
in Partial Fulfillment
of the Requirements
for the Degree of
Master of Science in Kinesiology
The University of Texas at Austin
May 2017

Dedication
To my parents, my wife, my entire family, and friends.
To my past self, sport is more than a game.

v
Acknowledgements
Firstly, I would like to express my sincere gratitude to my advisor Dr. Tolga
Ozyurtcu for the continuous support of my Master study and related research, for his
patience, motivation, and immense knowledge. His door was always open to me
whenever I had problems and questions about my report. I could not have imagined
having a better advisor and mentor for my Master study. Also, I would like to thank Dr.
Thomas Hunt for the guidance through my two years’ study in sports management
program at the University of Texas at Austin. His expertise in sports policy and history
inspired me to write this report. I could not have done this without them.
Besides, my sincere thanks also goes to Dr. Jan Todd, Dr. Matt Bowers and Dr.
Emily Spavero and all Sports Management faculties and classmates, who provided me
the opportunity to acquire knowledge of sports management and American sports culture
and gave me unconditional help in every part of my life in my two years’ study at the
University of Texas at Austin.
Last but not least, I would thank my parents, my wife, my entire family and my
friends for supporting and encouraging me to chase my dream in sports. I would not be
here without any single one of them.

vi
Abstract
Professional Stadiums and the City:
An Assessment of Twenty-First Century Urban Sports Facilities in the
United States
Mu Li, MSKIN
The University of Texas at Austin, 2017
Supervisor: Thomas M. Hunt
Co Supervisor: Tolga Ozyurtcu
This report explores significant developments and trends in the recent history of
professional sports stadiums in the US. In particular, it explores the use of stadium
construction as an urban development and investment strategy in the late twentieth and
early twenty-first centuries. The report begins with an introductory literature review that
traces the history of and debates surrounding the financing and construction of
professional sports stadiums in urban spaces. Special attention is paid to public-private
partnership models and the various approaches employed to subsidize or otherwise
finance these stadiums. The various approaches to measuring economic and non-
economic impacts and benefits of such stadiums are introduced, as are arguments for and

vii
against stadiums as an urban development strategy. Building on the extant literature, the
report offers three case studies of twenty-first century stadiums built using a variety of
public-private funding models. The cases of Minneapolis, Arlington (Texas), and
Orlando analyzed as exemplars of recent trends and issues with the stadium-centered
approach to urban development. A fourth case study considers an upcoming project in
Detroit which aims to resurrect the once-booming metropolis. The conclusion of the
report ties together the lessons of these cases studies and offers directions for future
research in related topics.

viii
Table of Contents
List of Tables ......................................................................................................... ix
List of Figures ..........................................................................................................x
Chapter 1 Introduction .............................................................................................1
Chapter 2 Literature Review ....................................................................................3
Sports as a Downtown Redevelopment Strategy in the US ............................3
Subsidizing Sports Stadiums ..........................................................................6
Impact Measurement .....................................................................................10
Direct Economic Impact ......................................................................10
Intangible Benefits ...............................................................................17
Chapter 3 Examining Recent Cases In US Stadium Construction ........................23
Minneapolis...................................................................................................26
Arlington .......................................................................................................32
Orlando .........................................................................................................37
Detroit ...........................................................................................................43
Chapter 4 Conclusion .............................................................................................51
References ..............................................................................................................57

ix
List of Tables
Table 2.1 Expenditures on New Sports Facilities for Professional Teams by Decade
.............................................................................................................8
Table 2.2 Most Often Used Public Stadium Funding Sources ................................9
Table 2.3 Urban/suburban Stadium Locations in the National Football League ...15
Table 3.1 New Stadiums and Arenas for Four Major Leagues in U.S from 2007 to
2016...................................................................................................24
Table 3.2 Future Stadiums among the Four Major Leagues in U.S ......................25
Table 3.3 The Win-Loss Record/Rankings and Local Revenue Rankings ............26
Table 3.4 Original Budget of Target Field.............................................................28
Table 3.5 Amended Budget of Target Field Project ..............................................28
Table 3.6 Original Budget and Actual Cost of AT&T Stadium (in millions) .......33
Table 3.7 Dallas Cowboys Stadium Announcements Date Description ................34
Table 3.8 The Funding Sources and Uses of Amway Center (in millions) ...........39
Table 3.9 Population Change of Detroit over Decades ..........................................43
Table 3.10 Unemployment Rate in Selected Rust Belt Cities ...............................45
Table 3.11 Number of Violent Crime Incidents in Detroit ....................................48
Table 4.1 Expanded MLS teams from 2010. Source: Major League Soccer. .......55

x
List of Figures
Figure 2.1. The Psychic Income Paradigm. ...........................................................20
Figure 3.1 Minneapolis Total Estimated Market Value by Property Type ............30
Figure 3.2 Estimated Actual Real Property Value of City of Arlington from 2008 to
2016...................................................................................................35
Figure 3.3 Sales Tax Revenue of Arlington, TX from 2008 to 2016 ....................36
Figure 3.4 Illustrative Map of Orlando; Location of Amway center, area of city core
and Parramore neighborhood ............................................................40
Figure 3.5 Tourist Development Tax (TDT) Revenue of Orange County from 2009 to
2015...................................................................................................42
Figure 3.6 Property Value of Detroit, from 2006 to 2015 .....................................44
Figure 3.7 The Illustrative Map of District Detroit Areas .....................................47
Figure 3.8 Employment by industry of Detroit, 2014 ............................................49

1
Chapter 1 Introduction
Over the past several decades, cities across the United States have started building
sports stadiums as a strategy to revitalize their economies. It is claimed that sports
franchises and stadiums can help spur local economic development, create jobs, and
increase governmental revenues, as well as help enhance the city’s image and status.
These often grandiose claims are rebutted by critics who argue that the benefits of such
projects far exceed costs and that positive gains are only realized by a handful of interest
groups and businesses. While the public are often eager to have a major league franchise
in their city’s name, the monopoly nature of sports leagues limits the number of teams
that can play. Cities who want a team usually provide substantial subsidies to build a new
stadium and offer other benefits favorable to teams to lure them in, while cities with
existing teams have to make efforts to provide equally generous amounts of subsidies to
keep them. The fewer teams that exist, the more likely it is the government will offer
substantial incentives to owners (Rosentraub, 1994). Thus, a large amount of government
subsidies have been poured into stadium construction. Meanwhile, since Baade and
Dye’s empirical study in 1988, numerous scholars have used different approaches to
measure how much the sport teams and their stadiums can do for the city. The consensus
opinion was that the direct economic profits of sports stadiums were too small to
significantly benefit a city’s economy. However, some argued that the role of sports
franchises and their stadiums went far beyond the direct economic impacts. Governments

2
were also gaining experience from the pioneers, trying to get the most benefits from their
major league teams.
In the twenty-first century, a new round of stadium mania has heated up. With a
boom in team revenues and skyrocketing construction costs compared to the previous era,
the relationships between governments and teams have changed to a partnership model.
Sports stadiums may not generate huge direct economic profits, but may be used as a
catalyst to develop a city’s economy; different patterns of stadium location have also
been observed from their older comparisons.
The next chapter of this report is a literature review, offering a brief introduction
to the history of cities’ urban redevelopment efforts in the United States and how sports
stadiums emerged as a major participant. In addition, the chapter also examines the
amount of subsidies the government have provided to teams and examines what the
scholars have learned about the impact of sports teams and stadiums on the local
economy. The third chapter takes a closer look at the new trend in stadium strategies in
the last ten years with the four case studies of Minneapolis, Arlington, Orlando, and
Detroit. In the final chapter, this report concludes with a summary of the new trends in
stadium strategy and also offers suggestions for future academic studies in related areas.

3
Chapter 2 Literature Review
This chapter examines the reasons that sports stadiums became a primary focus of
downtown redevelopment strategies in the US and how city governments deal with the
issue of subsidizing stadiums, as well as considering the different kinds of measurements
scholars use to gauge the success of these strategies.
Sports as a Downtown Redevelopment Strategy in the US
The suburbanization of US cities can be dated back to the late nineteenth and
early twentieth centuries (Norton Grubb, 1982; Mills & Price, 1984; Jackson, 1985).
After World War II, the pace of suburbanization increased (Mills& Price, 1984); and
according to Hobbs and Stoops (2002), the proportion of people choosing to live in a
metropolitan area has significantly changed. In fact, while the proportion of people living
in central cities remains steady—around 32% over the past 5 decades—the proportion of
people living in suburbs has increased from 23% to 50% in 2000.This trend, with so
many households moving from central cities to the suburbs, has led to the relocation of
retail centers and businesses, and has further resulted in the shift of entertainment and
cultural centers (Euchner, 1993).
In order to reverse the trends of suburbanization, many city governments have
made various efforts to redevelop their city center’s economy, constructing tourist and
entertainment infrastructures such as museums, convention centers, historic districts and
festival malls. These facilities have been built in city centers in hopes of assisting in the
cities’ revitalization (Judd, 2003).

4
Beginning in 1964, with San Francisco’s Ghirardelli Square, festival marketplaces
emerged as one of the approaches numerous cities attempted (Robertson, 1997), and
became a leading redevelopment strategy during the 1970s and 1980s (Metzger, 2001).
City governments hoped the unique shopping experience created by a festival
marketplace would bring back the shoppers from suburban malls. Despite the efforts, and
some successful examples like Ghirardelli Square and Boston’s Faneuil Hall, most of
these attempts have failed. Rosentraub (2010) identified the lessons learned from the falls
of festival marketplaces, including the lack of convenience of access and parking lots,
insufficient excitement generated by the marketplace, and the fact that the unique
experience created by the market place did not convert into sufficient interest for people
to move into the cities. Clearly, suburban residents still preferred to shop at the retail
centers and malls near them, instead of going to city centers.
Sports events and other major live events offer leverage potential that cannot be
paralleled; as Rosentraub (2010) illustrated, ―the game played by the teams could not
exist simultaneously in the suburbs and downtown area,‖ a concept that also includes
concerts and other live performances. City leaders believed the unique value created by
an event venue would attract residents to move into their city. Keating (1997) also claims
that despite the enormous costs to build sports stadiums and arenas, city leaders have
come to consider these facilities as an essential signifier of ―big league‖ status. In the
following sections, this report will discuss the governments’ subsidies and the
measurement of investment return.

5
In the 1970s, the city of Indianapolis became the first in the nation to create are
development plan with a sports focus (Rosentraub, 1999; Bast, 1998).The RCA Dome
and Market Square Arena established the boundaries of the redevelopment area and
provided a distinct focus for development (Rosentraub, 1999).The Indianapolis city
government poured public funds into partnerships to keep the National Football League
(NFL)’s Colts, the National Basketball Association (NBA)’s Pacers, as well as the
headquarters of the National College Athletics Association, Pan American Games, men’s
college basketball championships, and more in their city (Bast, 1998). Meanwhile, in
Cleveland, the city’s redevelopment plan has involved several initiatives. In addition to
the existing the Jacobs Field (now Progressive Field) and Gund Arena (now Quicken
Loans Arena), a museum district including the Rock & Roll Hall of Fame and the Great
Lakes Science Center was planned near the shores of Lake Erie. This area also included
the Galleria Mall and other shopping and retail complexes and restaurants. These
combined efforts were made in hopes of revitalizing the downtown Cleveland area by
changing recreational patterns within the region (Austrian & Rosentraub, 1997; Keating,
1997). Subsequently, the sports redevelopment strategy was followed by cities across
America, including Baltimore, St. Louis, Columbus and Nashville. By 1995, sports
venues had become the main strategy that governments employed to rebuild their
downtown areas as the heart of a region’s tourism and recreational activities (Judd &
Fainstein, 1999; Rosentraub, 1999). Baade and Matheson (2013) found that from 1990 to
2012, 89% of the stadiums from the five major North American sports leagues (NFL,
NBA, Major League Baseball [MLB], National Hockey League [NHL], and Major

6
League Soccer [MLS] ) had a new stadium either built or significantly refurbished. These
findings illustrate the trend of city governments’ belief in redevelopment of downtowns
with sports stadiums.
Subsidizing Sports Stadiums
The history of subsidizing sports stadiums with public funding can be traced back
to the 1920s. In 1923, the Los Angeles Coliseum was the first stadium built utilizing
public subsidies, commissioned as a memorial to the city’s World War I veterans
(Alakshendra, 2016). However, until the early 1950s, nearly all sports stadiums were
privately funded, with the exception of a few stadiums that were built for specific
purposes, such as veteran memorials, or to lure the Olympics to the city (Siegfried &
Zimbalist, 2000). In 1953, Milwaukee County Stadium became the first publicly funded
stadium to attract a major league sports team from another city. This was the first time a
government invested in the construction of a sports facility to bring economic benefit to
the city (Alakshendra, 2016). Since then, the share of stadiums built using private funds
started shrinking (Long, 2005). Dodgers Stadium in Los Angeles marked the start of the
public-private partnership (P3) model; in this case the public sector contributed 25% of
the construction cost of the stadium. The P3 model is widely used by stadiums today.
Today, only a few stadiums are fully funded by government subsidies, including Tampa’s
Raymond James Stadium built in 1998, Memphis’ FedEx Forum built in 2004, and
Charlotte’s Time Warner Cable Arena built in 2005. Long (2013) compiled an extensive
data set on 225 stadiums built or renovated between 1876 and 2010 and the respective

7
funding mix of all stadiums. According to her statistics, the public contribution toward all
stadiums’ construction costs is near 60%, which amounts to around $30 billion. The
decade-by-decade trend of public funding for newly built sports facilities can be captured
from the table developed by Siegfried and Zimbalist (2000). Table 2.1 presents their
work in 2000, which includes the amount of expenditures on new sports facilities from
1910 to 1999. In the first decade of the twenty-first century, 51 new facilities opened
across the country. Among those, 58% of the costs were publicly funded (Long, 2013).
Weiner (2004) concluded four traditional ways in which governments provide
subsidies for stadiums: first, by publicly financing stadiums and stadium renovations;
second, by offering favorable leases to clubs; third, by offering direct cash payments; and
fourth, by using tax-exempt bonds to finance stadium construction. Most of this funding
relies on taxes and rebates. Alakshendra (2016) concludes that these are the major
resources of public funding, as shown in Table 2.2.

8
Table 2.1 Expenditures on New Sports Facilities for Professional Teams by Decade
Decade
(No.Built)
Millions of Nominal
Dollars
Millions of
Constant 1997
Dollars
Public Share of Total
Spending
1910-1919(7)
Mean $0.46 $7.65
Total $3.22 $53.53 0%
1920-1929(8)
Mean $4.23 $39.58
Total $33.86 $316.65 23.50%
1930-1939(6)
Mean $1.90 $19.06
Total $11.45 $114.39 34.50%
1940-1949(1)
Mean $0.25 $1.72
Total $0.25 $1.72 0%
1950-1959(7)
Mean $3.84 $22.65
Total $26.87 $158.51 100%
1960-1969(21)
(Cont.)
Mean
$24.46 $120.92
Total $513.69 $2,539.39 63.20%
1970-1979(25)
Mean $70.65 $215.76
Total $1,766.15 $5,394.10 94.60%
1980-89(14)
Mean $103.25 $143.77
Total $1,445.50 $2,012.73 78.60%
1990-98(32)
Mean $200.16 $211.73
Total $6,405.10 $6,775.21 55.30%
Note: From ―The Economics of Sports Facilities and Their Communities‖ by John
Siegfried and Andrew Zimbalist, 2000. Journal of Economic Perspectives, 14(3), p.96

9
Table 2.2 Most Often Used Public Stadium Funding Sources
Taxes Other state/city/county/contribution
City sales tax Grants
County sales tax General contribution
Lodging tax Sales of held property
Excise tax (alcohol, tobacco, gasoline, etc.) Sales tax rebate
Car rental tax Income tax rebate
Food/beverage tax Operating subsidy
Property tax/TIF Interest free loans
Income tax Capital fund allocation
Utility tax Infrastructure improvements
Lottery fund/gaming Utility/transit allocation
Ticket/admission tax
Parking tax
Land contributions
Public parking revenue
Source: CBS Minnesota, NFL stadium funding information
Note: From ―How are we funding professional sports stadiums? An overview‖ by
Abhinav Alakshendra, 2016. Managerial Finance, 42(9), P.889.
Over time, funding resources shifted, and new creative funding schemes have
emerged. Alakshendra (2016) provides an example of the funding technique used inthe
Dallas Cowboys’ new stadium:
Public funding of Cowboys Stadium is one of the recent examples of creative mix
of tax and rebate to fund [a] private stadium. To raise $444 million for Cowboys
Stadium, the city of Arlington’s sales tax was raised by a half-cent along with

10
increase in admission tax, car rental taxes, parking tax, and hotel occupancy tax
by 10, 5, 3.5, and 2 percent, respectively.
Impact Measurement
The debate about the impact of sports stadiums and franchises focuses on whether
the sports and their facilities draw enough benefits to the local society to justify the large
subsidies paid by governments and the public. Public investment averaged 78% of the
total cost of the 121 facilities in use during 2010 across Major League Baseball, Major
League Soccer, National Basketball Association, National Football League, and National
Hockey League. The average public commitment to a stadium project exceeds $250
million (Long, 2013). Studies commissioned by government and franchises always claim
that a new stadium would bring huge economic benefits to the host city, but some
scholars have conducted empirical studies that cast doubt on the optimistic estimates
(Baade & Dye, 1988; Baade, 1996; Baade & Dye, 1990; Rosentraub, Swindell,
Przybylski, & Mullins, 1994; Noll & Zimbalist, 1997; Coates & Humphreys, 1999).
Regardless, the measurement of the impact of stadiums and franchises should include not
only the direct economic side of things, but also the intangible and non-pecuniary
benefits generated from them. This section will examine the findings from scholars about
the impact of stadiums and franchises to their host communities.
Direct Economic Impact
There are extensive studies about the economic impact of sports stadiums and
arenas, and most of them find no statistically significant positive relationship between a

11
sports facility and local economic development (Baade & Dye, 1988, 1990; Rosentraub et
al., 1994; Noll & Zimbalist, 1997; Coates & Humphreys, 1999). In an empirical study
conducted by Baade and Dye (1990), the metropolitan area income level of nine
metropolitan areas was examined (Cincinnati, Denver, Detroit, Kansas City, New
Orleans, Pittsburgh, San Diego, Seattle, and Tampa Bay). Including data collected from
1965 to 1983, after reviewing the regression result, they concluded that the impact of a
stadium is insignificant, and they even suggested a possible negative impact on local
development. With regard to a stadium’s contribution to job creation and job value,
studies also show that the presence of franchises and stadiums reduces the per capita
income in a standard metropolitan statistical area (SMSA) (Coates & Humphreys, 1999),
and that the decrease in income can also be found on the county level (Jasina & Rotthoff,
2008). Teams or stadiums do not seem to create jobs for a city (Baade, 1996). In fact,
Baade and Dye (1988) state that stadiums are only directly associated with seasonal,
unskilled, and low-wage jobs. After reviewing redevelopment strategies in Phoenix and
Indianapolis, Rosentraub (2000) points out that a focus on sports will not lead to the
attraction of high-paying jobs to the economy. There is also a study that shows that
stadium announcements would have a negative impact on residential property values in
surrounding areas (Dehring, Depken & Ward, 2007). However, in another empirical
study conducted by Tu (2005), after examining the property value surrounding FedEx
Field, it is argued that, contrary to concerns that a new stadium would adversely affect
property value, the value of single-family homes surrounding FedEx Field actually
increased. In his study, the result indicates that the closer the property is to FedEx Field,

12
the greater the price increase; he also estimates a total $42 million increase in property
value after the completion of FedEx Field. He offers three factors that may contribute to
the increasing value: infrastructure improvements, increased employment opportunities,
and a recreational outlet that local residents have long been hoping for. What causes the
contradictory findings between the two studies may lie in the different contextual factors
in the two researched areas.
Swindell and Rosentraub (1998) summarize the economic impact of sports teams
and stadiums by stating that ―sports teams and the facilities they use produce very limited
economic benefits.‖ In an earlier study, Rosentraub et al. (1994) examined the impact of
Indianapolis’ sports focus strategy, and found that the impact of all city sports would only
account for about 1.1% of the Indianapolis economy, to which they respond, ―a sports
strategy, simply put, is too small to change economic patterns in a region.‖ Siegfried and
Zimbalist (2006) suggest three possible reasons, other than the small impact of sports,
which would explain why sports teams do not promote economic development: the
substitution effect, leakage, and budgetary impact. Substitution effect means that the
sports teams may only rearrange the spending in an urban area, but they may not add to
it. This assumption is also mentioned by other scholars (Baade & Dye, 1988; Baade,
1996; Coates & Humphreys, 2000). For example, a family living in Houston who spend
$200 attending an Astros game at Minute Maid Park on a certain weekend may spend the
same amount of money on other recreational activities if the Houston Astros and Minute
Maid Park never existed. In another scenario, some fans who visit a city do not always
visit solely because of the games. They may visit the city for other reasons, like visiting

13
friends or family, or engaging in other activities, and attending a game is just part of the
plan; that is, if the team never existed, they might arrange other entertainment activities in
the same city. Another reason offered was leakages. In this, they point out that the
majority of added revenue generated by a sports team goes to the players, but in an early
study, the results show that only 29% of NBA players live in the metropolitan area of
their team during the off-season (Siegfried & Zimbalist, 2002). Thus, much of the
earnings leak out of the host community and do not contribute to the local economy. The
third reason falls on the large amount of subsidies spent by governments on stadiums,
which is the budgetary impact. They state that the large budgetary burden placed on the
government for infrastructure maintenance, debt service, and environmental remediation,
will result in the need to cut other government services or increasing the tax rate, further
resulting in slowing down the local economy. This finding is affirmed by Coates and
Humphreys (1999, 2000). Noll and Zimbalist (1997) also suggest a compensating
differential effect that could explain the income decrease, in which those residents of
cities with professional sports teams might be willing to accept lower wages because of
the intangible benefits generated by the team. This report will elaborate on the discussion
of intangible benefits in latter sections. Coates and Humphreys (2000) contend that the
presence of a team may also have a negative effect on productivity; that is, they argue
that the workers in cities with professional teams may spend more work time discussing
the games or similar activities than might workers in cities without sports teams, and this
difference could lead to a lower income per capita.

14
Newsome and Comer (2000) conducted a study about the location pattern of
major league sports venues, and found that after 1985, the trend of sports venue locations
of four major league sports is moving toward downtown and city center locations. This
trend suggests a new generation of stadiums. The trend has been illustrated by Spirou
(2010), as ―from1998–2009, 15 new stadiums were built in the NFL at a cost nearing $5
billion. Eleven of them were developed in downtown or urban areas and only four in
suburban areas.‖ As shown in Table 2.3, more than half of NFL teams are playing in
downtown or urban locations.

15
Table 2.3 Urban/suburban Stadium Locations in the National Football League
Downtown/Urban
Atlanta Falcons: Georgia Dome (1992)
Baltimore Ravens: M & T Bank Stadium (1998)
Carolina Panthers: Bank of America Stadium (1996)
Chicago Bears: Soldier Field (2003)
Cincinnati Bengals: Paul Brown Stadium (2000)
Cleveland Browns: Cleveland Browns Stadium (1999)
Denver Broncos: Invesco Field (2001)
Detroit Lions: Ford Field (2002)
Green Bay Packers: Lambeau Field (1957)
Indianapolis Colts: Lucas Oil Stadium (2008)
Jacksonville Jaguars: Jacksonville Municipal Stadium (1995)
Minnesota Vikings: Metrodome (1982)
New Orleans Saints: Superdome (1975)
Pittsburgh Steelers: Heinz Field (2001)
St. Louis Rams: Edward Jones Dome (1995)
Seattle Seahawks: Quest Field (2002)
Tampa Bay Buccaneers: Raymond James Stadium (1998)
Tennessee Titans: LP Field (1999)
Suburban
Arizona Cardinals: University of Phoenix Stadium (2006)
Buffalo Bills: Ralph Wilson Stadium (1973)
Dallas Cowboys: Texas Stadium (1971)
Houston Texans: Reliant Stadium (2002)
Kansas City Chiefs: Arrowhead Stadium (1968)
Miami Dolphins: Pro Player Stadium (1987)
New England Patriots: Gillette Stadium (1987)
New York Giants/Jets: Giants Stadium (new stadium opened in 2010)
Oakland Raiders: McAfee Coliseum (1966)
Philadelphia Eagles: Lincoln Financial Field (2003)
San Diego Chargers: Qualcomm Stadium (1967)
San Francisco 49ers: Monster Park (1971)
Washington Redskins: FedEx Field (1997)
Note: From Cultural policy and the dynamics of stadium development, by Costas Spirou,
2010, Sport in Society, 13(10), p.1028.

16
Santo (2005) followed the methodology of the study by Baade and Dye (1990),
and conducted a study to examine the effect of downtown stadiums in this new
generation. He used the data collected from the stadiums built or renovated within the
time period from 1984 and 2001. As he explained, it is worthy to reassess the economic
impact of stadiums because in the new generation, stadiums are located in a downtown
and designed to serve as a downtown redevelopment catalyst with tourist appeal, which is
in contrast to the previous generation, in which stadiums were mostly located near
interstate exchanges for faster exit after the game. In his study, he examined the
economic impact of 19 metropolitan statistical areas (MSAs) that either gained or lost an
NFL or MLB team, or that have a new or renovated NFL or MLB stadium. The results
indicate that there is a significant positive correlation between new stadiums and income.
Nelson (2001) also conducted an empirical study using the data of 25 MSAs with major
league stadiums from 1969 to 1994 and found that ―locating major league teams in
suburban areas is not likely to improve economic conditions of the metropolitan area, but
locating teams in the central city and, more specifically, in the downtown may.‖ The
authors of these two studies also suggest that the stadiums located in downtown are more
likely to generate ancillary spending before and after the game, like having a nice meal,
doing some shopping, and visiting other local attractions. The partnership between the
city of San Diego and the San Diego Padres may best illustrate the success of a
downtown redevelopment strategy in this era. Cantor and Rosentraub (2012) conducted a
study to scrutinize the effect of San Diego’s Ballpark District after its eighth year in
existence. In this partnership, the public sector invested $296 million, while the San

17
Diego Padres invested $187.1 million in the construction, and another $487 million in
developing the surrounding neighborhood. The goal for the public sector was to attract
and retain young and highly educated residents, and create a demographically diverse and
economically integrated neighborhood. As a result, they state:
The community at this time appears to be economically and socially integrated,
and prices are stable having survived the worst of the recession with price
changes that were less volatile than those in other parts of the county. While the
success of any public/private partnership depends on the parameters used to
evaluate it, looking at economic integration, the stability of home prices, and the
attraction of educated people to a city’s center, the Ballpark District should be
considered a success.
As Rosentraub (2006) concluded, the success of the San Diego redevelopment indicates
that when private sector investments or commitments are guaranteed, the public sector
could receive the benefits it had anticipated.
Intangible Benefits
The discussion about the benefits brought by sports stadiums and franchises is not
only relevant on an economic level, but also with regard to intangible benefits.
Rosentraub (1996) states, ―Cities establish identities through teams and with their
facilities.‖ The intangible benefits of sports facilities and franchises are also recognized
by other scholars (Crompton, 2004; Groothuis & Rotthoff, 2016; Hamilton & Kahn,
1998; Rappaport & Wilkerson, 2001; Swindell & Rosentraub, 1998; Wassmer, Ong, &

18
Propheter, 2016). Zimmerman (1997) states that one of the benefits for citizens is simply
derived from living in a ―big league‖ town, and these benefits have the potential to be
large in the aggregate because no citizen can be excluded from them. Coates (2007)
discusses the benefits from living in such a ―big league‖ town, or a ―world-class‖ city.
One benefit is that a world-class city would attract businesses that want new or expanded
office locations. The second benefit of world-class status is the increasing national or
international television exposure. The third benefit is that people value sports amenities
the same way they value clean air or good public schools, which would increase the
willingness of people to move into the city, hence increasing property values. However,
as he argues, there is little evidence to support these assumptions.
Howard and Crompton (1995) found that the presence of professional sports can
nurture a sense of civic pride among residents. Swindell and Rosentraub (1998) contend
that the citizens of Indianapolis felt that professional football, basketball and auto racing
brought more national attention to the city than concerts and cultural events. Crompton
(2004) calls this kind of civic pride and national recognition ―psychic income.‖ In his
article, he describes psychic income as ―the emotional and psychological benefit residents
perceive they receive, even though they do not physically attend the sports event, and are
not involved in organizing them.‖ Residents of the community with a major league sports
team may follow their team and talk about their local team with friends even though they
never attend a game. This is different from the example in which a well-known company;
for example, Google, opens a new regional office in the city. With Google moving into
the city, government officials and business leaders may be excited, but the residents do

19
not necessarily get excited because most likely the economic benefits brought in by the
company have little to do with them. However, if a sports team comes to the city, lots of
citizens will identify the team as their ―home team‖ and follow them, which will generate
a certain degree of emotional attachment to the team.
Crompton (2004) further conducted a psychic income paradigm, as shown in
Figure 2.1. According to his paradigm, several factors contribute to citizens’ psychic
income. As he explains, ―the increased community visibility may be a source of pride to
residents who derive satisfaction from their community’s name being widely
disseminated across the nation.‖ In a similar vein, residents who live in the same
community would consider that they are living in a ―major league‖ or ―first tier‖ city.
Other factors contribute to psychic income, including emotional involvement, excitement
quotient from visitors, enhanced collective self-esteem from a winning team, and tangible
focus for social bonding. Some people see the investment in sports stadiums as an effort
to resuscitate a deteriorated area. Rappaport and Wilkerson (2001) also call on the need
to acknowledge the improvement in quality of life brought about by the presence of a
local sports team.

20
Figure 2.1 The Psychic Income Paradigm
Note: Reprint from ―Beyond Economic Impact: An Alternative Rationale for the Public
Subsidy of Major League Sports Facilities‖ by John Crompton, 2004. Journal of Sports
Management, 2004, 18, p.56.
In terms of measuring the intangible benefits, scholars usually use the contingent
valuation method (CVM) to measure the value of consumer surplus associated with
sports teams and stadiums. CVM is a survey-based approach that could estimate the level
of subsidy that individuals would be willing to pay to support a new sports stadium or
sports franchise. Johnson, Groothuis and Whitehead (2001) conducted a survey about the
Pittsburgh Penguins with CVM. In their study, they found that 72% of respondents
identified themselves as Penguins fans, and more than half of the respondents indicated
they would be willing to pay for hockey-related public goods rather than lose them, but
the aggregate value of willingness to pay for this benefit only ranges from about $23.5

21
million to $66 million, which is not nearly enough to cover the cost of building a new
$200 million arena. Other studies show similar results. Fenn and Crooker (2003)
estimated that a willingness by Minneapolis residents to pay for the Minnesota Vikings
equals about $114 million, as compared with a required public subsidy to the Vikings of
$473 million. For the Jacksonville Jaguars, Johnson, Mondello and Whitehead (2007)
estimated that the willingness by Jacksonville residents to pay for the stadium is $55
million, compared to a $167 million actual public subsidy. Santo (2007) examined the
willingness of Portland citizens to support a new baseball team, and the result of their
offerings is estimated at $74 million, while the projected subsidy was estimated to be
$235 million. As Owen (2006) concludes, the ―aggregate willingness-to-pay values are
not enough to cover the costs of sports facilities.‖ However, some scholars have
questioned the reliability of such a method, because there is a concern that hypothetical
questions produce hypothetical answers (Fisher, McClelland & Schulze, 1998). Owen
(2006) also suggests that the willingness of an individual to pay for the professional
teams in the city is highly conditional on that individual’s interest in sports and in
attending sports events. In his study about the willingness by residents in Minneapolis to
pay for the Minnesota Twins, nearly 60% of respondents gave the response of zero
dollars.
In one study about the intangible benefits that the Orioles bring to citizens of the
city of Baltimore, Hamilton and Kahn (1997) make an interesting comparison between
the cost of subsidizing the Orioles and the disutility of a rainy day. They state that the
cost of a subsidy to Camden Yards Ballpark is approximately $14.70 per Baltimore

22
SMSA household per year; meanwhile, the disutility of an extra rainy day is about $72
per household per year. Therefore, if the citizens of Baltimore were faced with a choice
of one additional rainy day per year or losing the Orioles to another city, it seems like
Baltimore citizens would prefer to accept one more rainy day every year. From this
result, it seems like Baltimore citizens get a substantial net surplus from the intangible
benefits of having the Orioles in town.

23
Chapter 3 Examining Recent Cases In US Stadium Construction
The trend of the stadium boom has shown no sign of declining in the last 10
years. From 2007 to 2016, fourteen new stadiums and arenas were built in the four major
leagues across the United States (NFL, NBA, MLB, and NHL). On average, at least one
new stadium opened every season. Table 3.1 shows the newly built stadiums in the last
10 years.
Among the new sports facilities, NFL and MLB have the most new stadiums with
five each, NBA has three, and NHL has two new arenas. Regarding the choice of
location, urban sites account for more than half with eight, which is consistent with the
findings regarding stadium location patterns by Newsome and Comer (2000). However,
no new franchises have been added to leagues in this ten-year span, and there were no
stadiums built due to franchise relocation.
There are also eight new stadiums either under construction or under proposal.
One difference from the trend of the last ten years is that there will be one new expansion
team (Las Vegas Golden Knights of the NHL), and two stadiums involving franchise
relocation (the San Diego Chargers and the St.Louis Rams to Los Angeles, and the
Oakland Raiders to Las Vegas). Table 3.2 shows the future stadiums among the four
leagues.

24
Table 3.1 New Stadiums and Arenas for Four Major Leagues in U.S from 2007 to 2016
Stadium City Tenants Built Location
Lucas Oil Stadium Indianapolis,
Indiana Indiana Colts 2008 Urban
National Park Washington, D.C Washington Nationals 2008 Urban
AT&T Stadium Arlington, Texas Dallas Cowboys 2009 Suburb
Citi Field Queens, New
York New York Mets 2009 Suburb
Yankees Stadium Bronx, New York New York Yankees 2009 Suburb
Amway Center Orlando, Florida Orlando Magic 2010 Urban
MetLife Stadium East Rutherford,
New Jersey
New York Giants,
New York Jets 2010 Suburb
PPG Paints Arena Pittsburgh,
Pennsylvania Pittsburgh Penguins 2010 Urban
Target Field Minneapolis,
Minnesota Minnesota Twins 2010 Urban
Barclays Center Brooklyn, New
York
Brooklyn Nets, New
York Islanders 2012 Urban
Marlins Park Miami, Florida Miami Marlins 2012 Suburb
Levi's Stadium Santa Clara,
California San Francisco 49ers 2014 Suburb
Golden 1 Center Sacramento,
California Sacramento Kings 2016 Urban
U.S Bank Stadium Minneapolis,
Minnesota Minnesota Vikings 2016 Urban

25
Table 3.2 Future Stadiums among the Four Major Leagues in U.S
Stadium City Tenants Opening Location
Little Caesars Arena Detroit, Michigan Detroit Pistons,
Detroit Red Wings 2017 Urban
Mercedes-Benz
Stadium Atlanta, Georgia Atlanta Falcons 2017 Urban
T-Mobile Arena Paradise, Nevada Las Vegas Golden
Knights 2017 Urban
SunTrust Park Cumberland,
Georgia Atlanta Braves 2017 Suburb
Los Angeles
Stadium at
Hollywood Park
Los Angeles,
California
Los Angeles Rams,
Los Angeles Chargers 2018 Suburb
Chase Center San Francisco,
California
Golden State
Warriors 2019 Urban
Las Vegas Stadium Paradise, Nevada Oakland Raiders 2020 Suburb
New Rangers
Ballpark Arlington, Texas Texas Rangers 2020 Suburb
This chapter examines the trend among the new stadiums using three case studies:
newly built stadiums in Minneapolis, Arlington, and Orlando. It examines how the
government funds the stadiums as well as the strategies for developing the cities’
economies through the sports teams and their facilities, and also examines if the sports
stadium strategies have generated enough benefits to the local communities. Finally, this
chapter also examines how a future arena in downtown could change the fate of Detroit.

26
Minneapolis
The search for a new baseball ballpark for the Minnesota Twins began in 1995,
when they concluded that their current home, the Metrodome, did not bring in sufficient
profit for the team. The former owner, Carl Pohlad, almost sold the Twins to North
Carolina businessman Don Beaver in 1997, but the potential move to the Piedmont Triad
area was aborted due to the defeat of a referendum for a stadium in North Carolina.
During the next 10 years, the Twins made several attempts to build a new ballpark, but
none of the proposals were passed by the Minnesota Legislature. During the 2002 to 2004
seasons, despite the three consecutive American League Central Division titles, the
Twins’ local revenues (gate receipts, concessions, suite rentals, advertising and
publications, and parking) were among the lowest in the league. Table 3.3 illustrates the
unevenness between the win-loss record and revenue rankings.
Table 3.3 The Win-Loss Record/Rankings and Local Revenue Rankings
2002 2003 2004
Win/Loss Record 94-67 60-72 92-70
AL Central Division Finish 1st 1st 1st
Local Revenue Sources:
Gate Receipts 25th 25th 25th
In-Park Concessions 22nd 24th 26th
Advertising and Publications 26th 27th 26th
Parking Revenue 26th 28th 27th
Stadium Suite Rentals 30th 27th 30th
Note: Retrieved from Minnesota State Legislature.
https://www.leg.state.mn.us/webcontent/lrl/issues/BaseballStadium/TwinsBallparkSumma
ry.pdf

27
In 2006, The Minnesota Legislature finally approved legislation to fund a new
Minnesota Twins ballpark. Twins spokesman Kevin Smith said the intention was to
escape from their present spot in "the corner of a football field" and to ensure that the
Twins remain a Minnesota franchise for years to come (Mannix, 2009). The Legislature
approved the bill on May 21, 2006, and Minnesota Governor Tim Pawlenty signed the
bill into law five days later. A public body, the Minnesota Ballpark Authority (MBA),
was created by the 2006 Legislature to oversee the construction and operation of the new
ballpark. Under terms of the 2006 legislation, the original budget of this Public Private
Partnership for the new ballpark was $480 million. The public contribution was $350
million: $90 million for infrastructure and $260 million for ballpark construction costs.
The public contribution was financed with Hennepin County issued bonds. The bonds
were repaid from a county-wide 0.15% general sales tax authorized in the legislation.
Under the original agreement, the Minnesota Twins contribution was $130 million for
ballpark construction costs plus any ballpark cost overruns or enhancements. Table 3.4
shows the original budget.
After the legislation was adopted, the Twins contributed an additional $19.5
million for non-land infrastructure expenses and near $45.5 million for additional
ballpark enhancements. That brought the Twins’ total contribution to $195 million for
construction. Another $10 million was contributed from other sources, which included
the Target Corporation, the MBA, and the Minnesota Department of Transportation
(MNDOT). The amended ballpark budget totals $555 million, as shown in Table 3.5
(―Minnesota Ballpark Authority‖, n.d.).

28
Note: Retrieved from Minnesota Ballpark Authority.
http://ballparkauthority.com/about/target-field-budget/
Table 3.5 Amended Budget of Target Field Project
Use Source
Infrastructure $120 million Hennepin County $90 million
Minnesota Twins $20 million
Target Corp $4.5 million
MNDOT $3.5 million
MBA $2 million
Ballpark $435 million Hennepin County $260 million
Minnesota Twins $175 million
Total Budget $555 million $555 million
Note: Retrieved from Minnesota Ballpark Authority.
http://ballparkauthority.com/about/target-field-budget/
Target Field was located in the Historic Warehouse District/North Loop area,
adjacent to the Target Center, home venue of the NBA Minnesota Timberwolves. The
Table 3.4 Original Budget of Target Field
Use Source
Infrastructure $90 million Hennepin County $90 million
Ballpark $390 million Hennepin County $260 million
Minnesota Twins $130 million
Total Budget $480 million $480 million

29
area is home to dozens of bars, restaurants, nightclubs, and other entertainment venues.
Members of the local business community hoped the ballpark would help energize
downtown economically in a way that the Metrodome never really did. A study after the
inaugural year of the Target Field indicated that the millions of fans visiting it produced
state and local sales tax money far ahead of what was generated in the Metrodome’s final
season. The total sales tax amounted to $18.6 million, and the study argued that the
Target Field generated nearly $170 million in economic activity (Kaszuba, 2012). Other
developments followed the opening of the Target Field: in just 15 months after the
ballpark’s opening, $36 million in new construction permits were issued within five
blocks of it and occupancy in downtown Minneapolis hotels around the stadium was up
19.4 percent during the first six months after opening and the use of the light rail to attend
games is up nearly seven percent (Santee, 2012). An article in 2013 showed that five
apartment complexes, including the 185-unit Dock Street Apartments, were under
construction in the North Loop area near the Target Field (Gilyard, 2013). These are part
of a larger development that will include offices, more residential buildings, and retails.
In addition, United Properties, owned by the Pohlad family, invested $40 million for the
renovation of the Ford Center, which is across the street from the Target Field. The
investment was a success: the 1912 built Ford Center, one of the earliest Ford plants, was
99.5% leased after the renovation (Moore, 2012). The development in apartments and
offices is captured in the Comprehensive Annual Financial Report released by City of
Minneapolis. Figure 3.1 shows the estimated market value property type in the city of
Minneapolis through year 2016. The growth of apartments and commercial properties

30
after 2012 is notable. The value of the apartments increased from $3.3 billion in 2010 to
$7.2 billion in 2016, an 118% growth; the value of commercial property also had a $2.2
billion increase with a 35% growth rate.
Figure 3.1 Minneapolis Total Estimated Market Value by Property Type
Note: Retrieved from City of Minneapolis.
http://www.ci.minneapolis.mn.us/www/groups/public/@finance/documents/webcontent/w
cmsp-182660.pdf
Public transit is also under construction; in 2013, Hennepin County Board
announced a sweeping plan to add a park, jumbo display screen, retail stores, and a public
plaza to the $79.3 million rail hub. Twins President Dave St.Peter said, ―The new hub, to
be called Target Field Station, will be Minnesota’s version of New York City’s Grand
Central Terminal when it opens next year.‖ In this deal, the Twins and United Properties
$7.0 $6.3 $6.0 $6.0 $6.2 $6.5 $7.6 $8.5
$1.5 $1.4 $1.3 $1.3 $1.3 $1.3$1.2 $1.2
$24.6$23.5 $22.6 $21.5 $21.6
$23.5$23.6
$25.4
$3.6$3.3
$3.3$3.4 $3.7
$4.7$6.1
$7.2
$0.0
$5.0
$10.0
$15.0
$20.0
$25.0
$30.0
$35.0
$40.0
$45.0
2009 2010 2011 2012 2013 2014 2015 2016
Minneapolis Total Estimated Market Value by Property Type
(in billions)
Apartment
Residential
Industrial
Commercial
Source:
Hennepin County
Assessor's Office

31
paid $3.7 million to the county for the cost of the project; the project was not only tightly
connected to the home games of Minnesota Twins, but also helped the North Loop
Neighborhood to connect with its roots. As Hennepin County Commissioner Peter
McLaughlin said, ―The addition of Target Field extended downtown Minneapolis west
past Interstate 394. And this project,‖ he continued, ―will extend the urban core even
farther.‖ (Olson, 2014)
These combined efforts are certainly working well for the development of the
local economy. One positive result is that the debt of Target Field could be paid off a
decade early. According to Smith (2017), the excess revenue from the ballpark sales tax,
plus lower interest rates, has helped the county save money. The early payoff on the debt
would mean an early end of the 0.15% sales tax which is used for covering the payment
on the ballpark, and this would save 3 cents on every $20 spent for taxpayers. The
success of Target Field also attracted future development; United Properties is planning a
new mixed-use entertainment venue on the north side of the ballpark. United Properties
will submit plans to the city by the second quarter of the year and hopes to break ground
in 2017 (Norfleet, 2017). The infrastructure improvement, the new railway transit hub,
the new luxury apartments, retails and offices, and of course the arrival of Twins baseball
games also marks the improvement in the quality of life of the North Loop area residents;
however, as many scholars have argued, these intangible benefits are hard to measure.

32
Arlington
In April 2001, the Dallas Cowboys announced that they were interested in
building a new publicly subsidized stadium to replace the old Texas Stadium. Built in
1972, the original Texas Stadium lacked many of the modern revenue generating tools of
new stadiums, such as modern luxury suites and a retractable roof. The Dallas Cowboys
have been known as America’s Team; their popularity and the success in the 1990s made
the team a very valuable asset for the local region. Once the announcement was made,
team owner Jerry Jones received initial proposals from a number of cities in the Dallas-
Fort Worth Metroplex, including Irving, Grapevine, Arlington, Grand Prairie, and Dallas.
Because of the small size of population and tax base, the original home city Irving could
not afford to finance the new stadium, as was the case with the other similarly sized
cities. In March 2004, Fair Park at downtown Dallas emerged as the leading proposal to
land the Dallas Cowboys; however, the city of Dallas was already committed to building
the $410 million American Airlines Arena (home of the Dallas Mavericks and Dallas
Stars) with tax dollars and it was impossible to raise enough funds to build another
stadium. The proposal was then abandoned. On July 17, 2004, the mayor of Arlington
announced that he had been in negotiations with the team about the potential of building
a new stadium in Arlington. Arlington has a population around 360,000, which is the
third largest city in north Texas, and it was the home to another major league team, the
Texas Rangers of MLB. In 2001, the city had reduced its local tax rate by one half of 1%
because of the early debt pay off of the baseball stadium. Therefore, the city was able to
raise funds for the new stadium (Dehring et al., 2007). In November of 2004, residents in

33
Arlington, Texas, passed a referendum to authorize the city to provide $325 million
public money for planning, acquisition, construction, and financing the Cowboys
Stadium with 55% voting in favor. The funding source consisted of a 0.5% sales tax
increase, a 2% hotel occupation tax increase, and a 5% rental-car tax increment. The total
original budget was $650 million; Jerry Jones would cover the rest of the funding and the
overruns. The final figure increased as the Cowboys added more signs, furniture, ribbon
boards, and fixtures to the stadium; the actual cost of the stadium went up to nearly $1.2
billion. The amount and proportion of public and private sector funding is shown in Table
3.6
Table 3.6 Original Budget and Actual Cost of AT&T Stadium (in millions)
Original Budget Actual Cost
Public sector $325 50% $444 37%
Private sector $325 50% $750 63%
Total $650 $1,194
Note: Retrieved from
https://cbsminnesota.files.wordpress.com/2011/12/nfl-funding-summary-12-2-11.pdf
The construction of the stadium was completed in 2009. Proponents predicted that
the new stadium would add to the Globe Life Park in Arlington, the Texas Rangers’
home ballpark, to build an entertainment focused industry that would attract people to
visit and live in Arlington. The cost-benefit study commissioned by Arlington city
officials reported that Arlington stands to add $238 million a year to its economy and
$416 million a year to Tarrant County.
Dehring et al. (2007) conducted a study about the impact of stadium
announcements on residential property values in the Dallas-Fort Worth Metroplex. In the

34
study, they investigated the impact of five separate stadium announcements, two of which
concern Dallas and three of which concern Arlington. The announcement date and
description are shown in Table 3.7.
Table 3.7 Dallas Cowboys Stadium Announcements Date Description
Announcement 1 April 30, 2004 Proposal to build a stadium at Fair Park in
downtown Dallas. The proposed stadium would
replace the aging Cotton Bowl, and the public
contribution to construction costs would be
financed by a half cent sales tax throughout Dallas
County. Ultimately, the city of Dallas would not
contribute to this additional tax because of
contractual obligations to retire its debt for the
American Airlines Arena
Announcement 2 June 6, 2004 The Fair Park proposal officially abandoned.
Announcement 3 July 7, 2004 Arlington’s mayor announces that he has been in
secret negotiations with the team about building a
new publicly subsidized stadium near the existing
baseball stadium in Arlington.
Announcement 4 August 17,
2004
Arlington’s city council approves a stadium ballot
initiative for the November 2004 general election.
The ballot initiative asks voters to approve up to
$325 million toward land acquisition and
construction costs for a new stadium located near
the existing baseball stadium in Arlington. The
ballot initiative also includes a one-half cent sales
tax in Arlington as well as additional hotel and car
rental taxes.
Announcement 5 November 3,
2004
Arlington voters approve ballot initiative on
November 3, 2004, and the additional taxes are
instituted on April 1, 2005.
Note: From ―The Impact of Stadium Announcements on Residential Property Values:
Evidence From a Natural Experiments in Dallas-Fort Worth‖ by Dehring, Depken &
Ward (2007), Contemporary Economic Policy, 25(4), p.632.
They found out that the initial announcement that the Cowboys might relocate to
Fair Park corresponded with an increase in property values in Dallas City, but the values

35
of properties returned to the status quo ante when the Fair Park proposal was abandoned.
However, the results from the Arlington sample suggest that the aggregated expected city
amenity effect and local sales tax burden associated with the proposal to build a publicly
subsidized stadium for the Dallas Cowboys in Arlington, Texas, reduced residential
property values. However, the numbers from the City of Arlington Comprehensive
Annual Financial Report (2016) suggest that, since 2012, the real property value of the
City of Arlington has steadily increased, as shown in Figure 3.2.
Figure 3.2 Estimated Actual Real Property Value of City of Arlington from 2008 to 2016
Note: Retrieved from City of Arlington.
http://www.arlington-tx.gov/finance/wp-content/uploads/sites/24/2014/06/2016-
Comprehensive-Annual-Financial-Report-YE-9-30-16.pdf
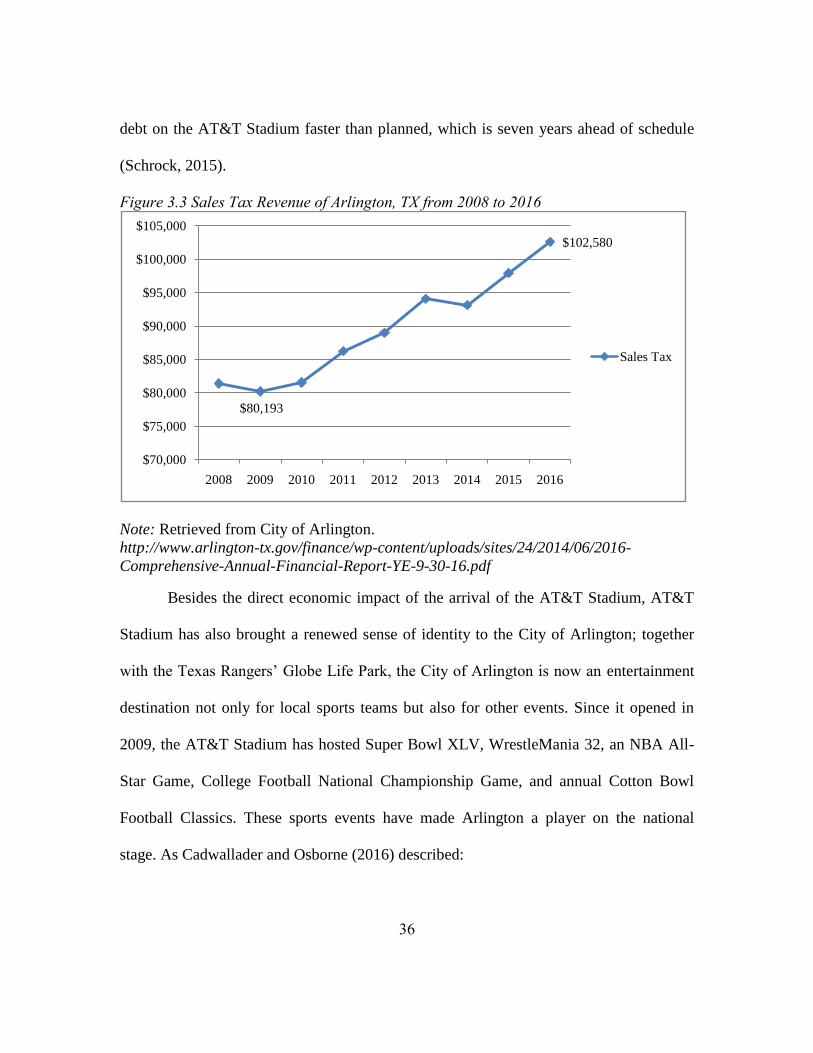
Since the AT&T Stadium opened in 2009, the sales tax revenue of the City of
Arlington has also seen a steady increase, as shown in Figure 3.2; these are good
indicators of the direct economic impact of the AT&T Stadium to the local economy. It is
reported that because of the higher-than-expected tax revenue, the city is paying down its
$14,785,924
$16,580,450
$13,500,000
$14,000,000
$14,500,000
$15,000,000
$15,500,000
$16,000,000
$16,500,000
$17,000,000
2008 2009 2010 2011 2012 2013 2014 2015 2016
Real Property Value
36
debt on the AT&T Stadium faster than planned, which is seven years ahead of schedule
(Schrock, 2015).
Figure 3.3 Sales Tax Revenue of Arlington, TX from 2008 to 2016
Note: Retrieved from City of Arlington.
http://www.arlington-tx.gov/finance/wp-content/uploads/sites/24/2014/06/2016-
Comprehensive-Annual-Financial-Report-YE-9-30-16.pdf
Besides the direct economic impact of the arrival of the AT&T Stadium, AT&T
Stadium has also brought a renewed sense of identity to the City of Arlington; together
with the Texas Rangers’ Globe Life Park, the City of Arlington is now an entertainment
destination not only for local sports teams but also for other events. Since it opened in
2009, the AT&T Stadium has hosted Super Bowl XLV, WrestleMania 32, an NBA All-
Star Game, College Football National Championship Game, and annual Cotton Bowl
Football Classics. These sports events have made Arlington a player on the national
stage. As Cadwallader and Osborne (2016) described:
$80,193
$102,580
$70,000
$75,000
$80,000
$85,000
$90,000
$95,000
$100,000
$105,000
2008 2009 2010 2011 2012 2013 2014 2015 2016
Sales Tax

37
While some NFL stadiums only host eight to 10 games a year, the roofed AT&T
Stadium keeps busy year-round. It hosted or is scheduled to host 495 non-NFL
events in 2015 and 2016, including 56 high school football games, eight college
football games, nine concerts and 139 corporate events, according to the
Cowboys.
One of the major drawbacks in the following years for the development of the
area has been the lack of retail development. The AT&T Stadium is surrounded by a
large area of parking lots, and is adjacent to another big sports stadium, the Globe Life
Ballpark at Arlington. The layout of the sports complex has limited the opportunity to
generate ancillary spending from visitors. However, the City of Arlington is aiming to
build an entertainment center in the area. In 2015, Texas Rangers announced the building
of a 200,000-square-foot entertainment space ―Texas Live!‖ in the area (Mosier, 2015).
In the following year, it was announced that the Rangers and the City of Arlington have
reached an agreement for a new ballpark to be opened in 2020 (Sullivan, 2016). These
future developments reflect the positive outcome that the AT&T Stadium and the City of
Arlington’s entertainment strategy have brought to the area. For further development,
however, the City of Arlington should consider integrating residents and retail
development into their development plan.
Orlando
The City of Orlando has long been known as an entertainment destination. With a
nickname of ―The Theme Park Capital of the World,‖ the city is most famous for theme

38
parks like Walt Disney World in its southwestern area; however, until the late 1990s, the
downtown of Orlando was relatively small compared to other cities of a similar size.
Meanwhile, the owner of Orlando Magic had been pressing the City of Orlando for a new
arena for many years. The Orlando Magic had previously played at the Amway Arena,
which was built in 1989; by 2006 it was the seventh oldest facility in the NBA and not as
technologically advanced as most other NBA facilities. In 2006, Orlando and Orange
County officials announced a deal to build a new arena in downtown Orlando. The
project was part of the city’s Downtown Master Plan, along with a Performance Arts
Center, and the renovation of the Citrus Bowl. The goal of the Master Plan was to
increase the quality of life for Orlando and Central Florida; to strengthen economic
development opportunities for the region; and support the continued revitalization of
Downtown Florida (City of Florida, 2007).
The total cost of the Amway Center was $480 million. In this deal, the Orlando
Magic contributed $50 million upfront cash for construction, and the government
provided the rest of the funds with a Tourist Development Tax, covenant bonds, state
sales tax revenue bonds, proceeds from other developments, and investment earnings;
$380 million of the cost was for construction, with an additional $100 million for land
and infrastructure. The Orlando Magic would collect all Magic event revenue, including
suite sales; the City of Orlando would collect 100% of revenues for all non-Magic events
held at Amway Center, including concessions, merchandise, ticket sales, and parking
revenues. The funding source and use detail is shown in Table 3.8.

39
Table 3.8 The Funding Sources and Uses of Amway Center (in millions)
Sources Uses
Orlando Magic $50 Construction $380
Tourist Development Tax $270 Land Acquisition $40
Covenant Bonds $49 Infrastructure $60
State Sales Tax $31
Proceeds from redevelopment $62
Investment Earning $18
Total $480 $480
Note: Retrieved from City of Orlando.
http://www.cityoforlando.net/obfs/wp-content/uploads/sites/23/2014/03/cafr2008.pdf
The location of the Amway Center is to the west of Interstate 4 Highway, and the
north of State Road 408. The two expressways set the physical boundaries between
neighborhoods. Since I-4 was built, development has been uneven for the two sides of the
road. In order to develop the west of I-4, a number of public investments have been made
since the 1970s, which include The Orlando Police Department, the Federal Courthouse,
and the State Office Building. The city also invested in renovating the Tinker Field and
the Citrus Bowl and built the Amway Arena in 1989; all the efforts were aimed at
developing the west I-4 region (City of Orlando, 2006). As shown in Figure 3.4, the
Amway Center sits in the Parramore neighborhood, which is an underdeveloped area
west of I-4 and the city core.

40
Figure 3.4 Illustrative Map of Orlando; Location of Amway center, area of city core and
Parramore neighborhood
Note: Retrieved from http://maps.google.com
The short-term plan of the Amway Center was focused on the development of the
surrounding public infrastructure, including parking facilities, transit expansions, and
streetscape improvement. The long-term plan included the development of retail, hotels,
and restaurants around the Amway Center, as well as developing the existing Parramore
Village residential area further, growing it into a larger downtown community; another
long-term goal was to build the Amway Center area into a downtown attraction. The
Master Plan was projected to generate $9.9 billion of benefits to the community (City of
Orlando, 2007). The operations of the Amway Center were estimated to generate

41
approximately $298.1 million in annual total output and would create 2,900 full and part-
time jobs (City of Orlando, 2006).
The Amway Center was opened in 2010. As well as the home to the NBA’s
Orlando Magic, the venue was also the home to the American Football League team
Orlando Predators from 2011 to 2016, and the Orlando Solar Bears of the East Coast
Hockey League. The Amway Center also hosted numerous sports and entertainment
events, including the 2012 NBA All-star Game and NCAA Basketball Tournament from
2014 to 2017. It was reported that just six months after opening, more than 20 new
businesses had opened in the surrounding area (―Pumping Energy into Downtown‖, n.d).
However, since 2010, despite more than 2500 apartment/residential units being built or
planned in the downtown area (City of Orlando, 2013, 2014, 2015, 2016); none were
built near the Amway Center, west of I-4. In 2015, according to city-data.com, the
median household income of Parramore was $17,955, which was much lower than the
Orlando median household income at $44,804. The economic development for the local
area was not impressive on paper. On the county level, the increase in the Tourist
Development Tax of Orange County since the completion of the Amway Center in 2010
can be clearly observed in Figure 3.5; the Orange County also set a new all-time record
for the US travel industry in 2014 with more than 62 million people visiting the region in
a year (Wooten & Spiegel, 2015). But it was hard to find conclusive evidence of how
many of these tourists contributed by visiting the Amway Center. It would be easy to
argue that the Orange County region is also home to various famous theme parks, such as
Walt Disney World, which is visited by tens of thousands of visitors every day

42
(Reikofski, 2015). It is hard to identify the contribution of the Amway Center and all the
venues in the Master Plan to tourism.
Figure 3.5 Tourist Development Tax (TDT) Revenue of Orange County from 2009 to
2015
Note: Retrieved From
http://www.occompt.com/download/Comprehensive%20Annual%20Financial%20Report
s/CAFR_2015.pdf
The City of Orlando is still looking to develop the area through sports venues. In
2013, Orange County Mayor Teresa Jacobs and Orlando Mayor Buddy Dyer reached an
agreement on a deal to provide financial support for a variety of Orlando projects
including a soccer stadium for the new MLS team Orlando City SC (Kennedy, 2013).
However, the stadium was eventually private funded by the owner of the team (Tenorio,
2015). The Orlando City Stadium was opened in February 2017. A study suggested the
new stadium would generate new revenues of $1.2 billion over the next 30 years. The
Orlando City Stadium, which is only a quarter mile west of the Amway Center, may
create a new sports village for the local area. The city officials might be wise to put the
$142,209,730
$226,178,591
$120,000,000
$140,000,000
$160,000,000
$180,000,000
$200,000,000
$220,000,000
$240,000,000
2009 2010 2011 2012 2013 2014 2015
Tourist Development Tax (TDT) Revenue of Orange County
TDT

43
two sports venues into a full developmental plan, involving new retail centers and
apartment/residential plans, to create more vigorous economic activities for the area.
Detroit
The city of Detroit has gone through a major economic and demographic decline
in recent decades. Deindustrialization caused a series of problems for the city, including
urban decay, population decline, financial crisis, and many social issues such as a high
unemployment and crime rate. As a matter of fact, the city has lost over 60% of its
population since 1950; the decline of its population over the decades is shown in Table
3.9.
Table 3.9 Population Change of Detroit over Decades
Year Population Change
1950 1,849,568 ---
1960 1,670,144 -9.7%
1970 1,514,063 -9.3%
1980 1,203,368 -20.5%
1990 1,027,974 -14.6%
2000 951,270 -7.5%
2010 713,777 -25.0%
Note: Source: United States Census Bureau.
The loss of population and businesses resulted in many abandoned houses and
vacant offices, caused not only by the loss in taxes revenue, but also the decrease in
property value. The city government had to take on a huge debt to maintain the operation,
which eventually lead to city bankruptcy in 2013. It is the largest municipal bankruptcy

44
filing in US history by debt, estimated at $18–20 billion (Davey &Walsh, 2013). The city
also has a bad reputation in terms of the crime and unemployment rate. In 2011, the city’s
average unemployment rate was as high as 24.4% (City of Detroit, 2012). Forbes ranked
Detroit as the ―most dangerous city in the US‖ in 2012 (Fisher, 2012).
In recent years, city officials have made various efforts to save and revitalize the
city, including overhauling the city’s infrastructure, renovating the old downtown
buildings, and the redevelopment of blighted Detroit residential areas. The government
hopes to create a safe, walkable environment to bring back businesses and residents to
town. Despite the efforts, the property value of Detroit has still slumped in recent years,
as shown in Figure 3.6.
Figure 3.6 Property Value of Detroit, from 2006 to 2015
Note: Retrieved from City of Detroit
http://www.detroitmi.gov/Portals/0/docs/finance/cafr/City of Detroit 2015 CAFR
Updated Print Version 6-24-2016_2.pdf
$9,063,123
$3,335,506$3,000,000
$4,000,000
$5,000,000
$6,000,000
$7,000,000
$8,000,000
$9,000,000
$10,000,000
Property value of Detroit (in thousands)
Property value

45
The unemployment rate has also dropped in recent years. However, the numbers
were still high compared to other Rust Belt cities. Table 3.10 shows Detroit’s
unemployment rate in comparison with them.
Table 3.10 Unemployment Rate in Selected Rust Belt Cities
Detroit St. Louis Cincinnati Cleveland Pittsburgh
2011 24.4% 7.8% 7.5% 10.0% 6.6%
2012 18.3% 7.4% 7.8% 8.5% 7.7%
2013 18.6% 7.2% 7.4% 9.3% 6.7%
2014 16.4% 5.7% 5.6% 7.8% 4.6%
2015 13.1% 5.0% 4.6% 5.2% 4.3%
Note: Source: Comprehensive Annual Financial Report from city of Detroit, St.Louis,
Cincinnati, Cleveland, Pittsburgh
In 2014, Olympia Development announced a three-year development plan for a
project called District Detroit. The centerpiece of the plan is the construction of the Little
Caesars Arena, which will be the home venue of the Detroit Red Wings of the NHL and
the Detroit Pistons of the NBA beginning in the 2017/18 season. The initial budget for
building the arena and ancillary development was $650 million, with $285 million in
public funding. The public funding will be backed by property taxes already raised by the
Downtown Development Authority and no extra general fund taxes being spent on the
area. However, the cost eventually rose to $733 million (Aguilar, 2016). The cost of the
whole district, including retail, residential housing, offices, and hotels, has reached $1.2
billion (Gallagher and Reindl, 2016). The goal of this 50-block sports and entertainment

46
district is to connect downtown Detroit with Midtown to create a contiguous walkable,
livable experience. As Steve Marquardt, vice president of Olympia Development of
Michigan said,
The District Detroit will be a vibrant, world-class sports and entertainment
destination, and it will also bring significant new retail, residential and office
spaces to the heart of Detroit. We’re focusing on creating a uniquely Detroit
experience featuring a mix of local and national entrepreneurs, chefs, restaurants
and retail concepts (―Olympia Development Launches Retail‖, 2016).
The impact study shows that the project will create more than 8,300 construction
and construction related jobs, and 1,100 permanent jobs. The study also estimates that
The District Detroit will bring $210 million a year for Detroit, and will have a $1.8
billion total impact on the state of Michigan. As Mark S. Rosentarub, Professor at the
University of Michigan says, ―We are not only talking about jobs, but about attracting
new residents and businesses to Detroit that will contribute to a much-needed tax base
and revenue stream flowing into the city.‖ (―New District Will Help Transform‖, 2014).
The move-in of the Detroit Red Wings and the Detroit Pistons to Little Caesars
Arena, together with the MLB Detroit Tigers at Comerica Park and the NFL franchise
Detroit Lions at Ford Field, will create a unique sports community in downtown Detroit
(The illustrative map of The District Detroit is shown in Figure 3.7). This will mark the
first time since 1974 that all four major sports teams have played in the city limits of
Detroit. It will be a unique asset for the city, because among all the cities in the US, only
thirteen of them have at least one team from each of the four major leagues in their

47
metropolitan area. Detroit will be the only city with all four teams playing in city
downtown adjacent to each other. The three facilities will host at least 171 home games
per year of the 4 teams (41 NBA games, 41 NHL games, 81 MLB games, and 8 NFL
games), which means, on average, there will be almost one game on every alternate day
to every three days in The District Detroit area. The combination will be an ace for the
local economy. As is shown in Figure 3.7, the five neighborhoods of The District Detroit
plan are centered on the sports facilities.
Figure 3.7 The Illustrative Map of District Detroit Areas
Note: Retrieved from http://www.districtdetroit.com/
The venues and games are sure to attract numerous visitors and spectators to The
District Detroit area on game days and create lots of ancillary spending on foods,

48
shopping, and other entertainment activities. Thus, the quality and quantity of retail and
other entertainment developments surrounding the stadiums are vital; retailers should not
only be part of the ancillary spending of the sports events, they should also build their
own identity. In this way, instead of coming to the area solely for a game and having a
short stay at retailers or bars, people may combine attending a sports event with a whole
weekend family plan with shopping and having a good meal. Another key element to
Detroit’s comeback effort is whether The District Detroit could attract residents to live in
the area. The historical crime rate of Detroit has been the highest amongst all US cities,
although the number has fallen in recent years, it was still among the highest in the US.
The high crime rate was one of the reasons people fled from Detroit to other cities. With
the higher volume of people coming to the area daily for retail, games, and jobs, and the
higher governmental budget on security, the city’s crime rate may fall further in the
future. Thus, it could optimistically be true that the problem of crime will not be part of
Detroit’s reputation anymore. (For Detroit’s violent crime incidents, please see Table
3.11).
Table 3.11 Number of Violent Crime Incidents in Detroit
Year Incidents Rate per 100,000
2012 15,011 2122.9
2013 14,504 2072.3
2014 13,616 1988.6
2015 11,846 1759.6
Note: Source: Federal Bureau of Investigation

49
The last key element to success is whether they can attract businesses to fill
offices. The city has made efforts to shift their major industry away from manufacturing.
As shown in figure 3.8, in 2014, manufacturing only accounted for 12% of the city’s
employment. It is important that the city can find a new identity in the twenty-first
century. If the transformation is successful and young talent decides to reside in the area,
then we may see a new nickname being given to it to replace ―Motor City‖.
Figure 3.8 Employment by industry of Detroit, 2014
Note: Reprint from: Detroit Regional Chamber, State of the Region, 2014.
There is a strong possibility that, with numerous visitors in town and more
residents moving in, along with the transformation of the industries, the tax revenues and

50
property values will be increased and other development and investment will come to
Detroit in the future. District Detroit may well become the key to Detroit’s comeback
story.

51
Chapter 4 Conclusion
After three decades of building sports stadiums with the claim that they could
promote the local economy, cities now have a more clear idea of how to make this
happen. Because the sport offering itself is generally too small to make an impact on a
city’s economy (Rosentraub et al., 1994; Siegfried & Zimbalist, 2006), building a
stadium alone could not generate the expected profit for the city. It is therefore important
to find the correct way to employ stadium construction as a catalyst to spur development.
The lessons of the case studies analyzed in the previous chapter offer some insights for
teams and municipalities hoping to pursue a stadium construction venture in the twenty-
first century.
In the case of Minneapolis, the partnership between governments and team
ownership has worked well; the Twins not only took around 35% of the total construction
cost, but also invested more to develop surrounding areas to facilitate the redevelopment
of the North Loop area, and significantly more offices and apartments have been built
since the open of Target Field. The continuous commitment of the Pohlad family to the
surrounding area’s development means the future of the project looks promising. The
clear lesson for government officials in other cities is that the level of involvement of
private partners is vital for the success of area development and economic profits. Similar
conclusions can also be found in the case of city of San Diego (Cantor & Rosentraub,
2012).

52
In Arlington, the government was looking to establish the city’s identity with the
arrival of the Dallas Cowboys. Together with the existing Texas Rangers (MLB), the city
of Arlington is building a reputation as the premier sports-entertainment city in Texas.
The arrival of Dallas Cowboys and AT&T Stadium did not only bring economic profit
for the city, but also created a level of intangible benefits that is hard to match with
comparable levels of investment. Because of the Dallas Cowboys and Texas Rangers, and
with the aggressive efforts to host a portfolio of diverse sports and entertainment events,
the city of Arlington is now on the map as a major league city and national travel
destination. However, because of the lack of surrounding retail development, it is hard to
keep fans and tourists for longer stays and incentivize more spending. Additionally, when
the city is not hosting games or events, the attractiveness of the area drops dramatically,
and relatively few visitors travel to the area. With the groundbreaking of the new ―Texas
Live!‖ attraction, the footprint of the sports complex will be further expanded. It is time
for the government to further exploit the benefits from their major league assets, by
attracting more investment to build around the sports stadium complexes and make the
area a more dynamic economic environment, potentially materializing greater intangible
benefits. The city of Arlington sets a good example to other suburban cities of a similar
size that aim to develop through an investment in major league stadiums, and followers
are on the way, like Cumberland, GA, who just landed the Atlanta Braves with newly
built SunTrust Park. If success can also be found in Cumberland, it is foreseeable that in
the future there will be more suburban cities to follow the blueprint of Arlington.

53
In Orlando, the Amway Center was a part of the city’s master plan with a
convention center and the renovation of the Citrus Bowl to balance the unevenness in
economic development between the two sides of the highway; however, the lack of
ancillary developments such as residential areas and offices hindered progress. In the
case of Orlando, despite the city’s various efforts to revive the area west of I-4, progress
was slower than expected. It may be concluded that simply building attractions and
government buildings is not enough to break the physical boundary set by highways.
Orlando is not the only city with such trouble in urban developments and city
governments with similar situations need to think deeper for better developmental plans.
Similar to Minneapolis, if the city could secure more investment from private partners in
building surrounding area to attract visitors to the area for other activities, the
development would likely be more successful. In this decade, urban site stadiums are
prevailing; sports facilities are no longer only for sports events and sports fans, they are
becoming city landmarks and representing civic pride. Thus, what governments can
ultimately learn from this example is that it is important to have a complete
developmental plan before building and solid private partners to share the costs for the
development of the surrounding area. Infrastructure, retail, restaurants and bars,
apartments, and offices should be all included in a portfolio to go alongside the sports
stadium.
Finally, there are many areas that future studies could explore. The first is the case
of Las Vegas. Numerous scholars have argued about the intangible benefits that new
sports franchises and stadiums bring to a city (Hamilton & Kahn, 1997; Rosentraub &

54
Swindell, 2005; Howard & Crompton, 1995; Owen, 2006; Crompton, 2004). It is
important to note that, since 2000, despite a few relocation cases among major leagues,
not a single team has moved to a city that has never had a major league franchise before.
Thus, there are few studies concerning the economic impact on a city acquiring its first
major league sports franchise, especially in the twenty-first century. With the NHL
expansion team Las Vegas Golden Knights and the relocation of the NFL team Las
Vegas Raiders, Las Vegas will have their first two major league franchises in the city’s
history. Las Vegas bears the nickname of ―the entertainment capital of the world‖; it is
intriguing to see what these two new sports franchises and new world-class sports
facilities can add to the city’s entertainment scene. The city and its residents have long
been hoping to have their first major league franchise, so important questions include
what the two teams will bring to the city’s identity and if they will change the quality of
people’s lives in Las Vegas. Furthermore, it remains to be seen if they will attract more
people to reside in the metropolitan area, or if they will eventually attract businesses from
other industries to locate in Las Vegas to push the transformation of the city’s economy.
The impact of the rise of Major League Soccer is another development that
requires further investigation. Soccer is the world’s number one sport, though not in the
United States. However, the MLS has developed quickly over the past few years. Since
2010, there have been eight expansion teams, six of them in the United States, and there
will be one more expansion team to play in 2018; among the seven new teams, five of
them are either currently playing or will play in a soccer specific stadium. This fast
expansion and the development of soccer specific stadiums may well reflect the

55
increasing popularity of soccer in the United States. It is worth studying whether soccer
will bring different groups of fans and different sports cultures to the local community.
Furthermore, it will be interesting to see what ancillary developments are best suited for
the surrounding area of soccer specific stadiums.
Table 4.1 Expanded MLS teams from 2010
Team Venue First year Soccer Specific
Stadium?
Philadelphia Union Talen Energy Stadium 2010 Yes
Portland Timbers Providence Park 2011 No
Orlando City SC Orlando City Stadium 2015 Yes
New York City FC Yankees Stadium 2015 No, plan to move to
Minnesota United
FC TCF Bank Stadium 2017 No, plan to move to
Atlanta United FC Bobby Dodd Stadium 2017 No
Los Angeles FC Banc of California
Stadium 2018 Yes
A third future area of study could focus on the relationship between the surge in
major leagues’ TV contract revenue and the opulence of the new stadiums. In 2014, the
NBA announced a nine-year TV contract with ESPN and Turner Broadcasting for $24
billion, which is nearly three times as much as the previous deal (Prada, 2014). Similarly,
the new television deal between MLB and multiple broadcasters is worth $12.4 billion,
which is more than double the previous deal (Settimi, 2012). The huge increase in
television revenues will increase the teams’ funding for stadium construction, resulting in
enhancing the stadium opulence and utilizing more advanced technologies in stadiums.
The increasing revenue may also lead to an increase in the frequency of teams building a

56
new stadium. Evidence for this can be found with the Texas Rangers: the Rangers opened
their current home venue the Globe Life Park in Arlington in 1994; it took only 22 years
for them to announce a new ballpark to be built in 2016. Future studies can examine how
this revenue boost might change the sports society and stadium construction, and
eventually how these enhancements in stadiums will affect local economic development.

57
References
Aguilar, L. (2016, November 7). Cost to build Little Caesars Arena rises $150M. The
Detroit News. Retrieved from http://www.detroitnews.com
Alakshendra, A. (2016). How are we funding professional sports stadiums? An overview.
Managerial Finance, 42(9), 885 – 890.
Austrian, Z., & Rosentraub, M. S. (1997). Cleveland’s Gateway to the future. In R.G.
Noll & A. Zimbalist (Eds.), Sports, jobs, and taxes. (pp. 355-384). Washington,
DC: Brooking Institution.
Baade, R. A. (1996). Professional sports as catalysts for metropolitan economic
development. Journal of Urban Affairs, 18(1), 1-17.
Baade, R. A., & Dye, R. F (1988). Sports stadiums and area development: A critical
review. Economic Development Quarterly, 2(3), 265-275.
Baade, R. A., & Dye, R. F. (1990). The impact of stadiums and professional sports on
metropolitan area development. Growth and Change, 21(2), 1-14.
Baade, R. A., & Matheson, V. A. (2013). Financing professional sports facilities. In S.B.
White and Z.Z. Kotval (Eds.), Financing economic development in the 21st
century, 2nd Ed. (pp. 323-342). Armonk, NY: M.E. Sharpe.
Bast, J. L. (1998). Sports Stadium Madness: Why it started, how to stop it. Heartland
Policy Study no.86. Retrieved from https://www.heartland.org

58
Cadwallader, R., & Osborne, R. (2016, July 22). Arlington Sports stadiums give city
identity, bring in cash. Star-Telegram. Retrieved from http://www.star-
telegram.com
Cantor, M. B., & Rosentraub, M. S. (2012). A ballpark and neighborhood change:
Economic integration, a recession, and the altered demography of San Diego’s
Ballpark District after eight years. City, Culture and Society, 3(3), 219-226.
City of Arlington. (2016). City of Arlington comprehensive annual financial report: Year
ended September 30, 2016. Retrieved from http://www.arlington-
tx.gov/finance/wp-content/uploads/sites/24/2014/06/2016-Comprehensive-
Annual-Financial-Report-YE-9-30-16.pdf
City of Detroit. (2012). Comprehensive annual financial report for the fiscal year ended
September 30, 2011. Retrieved from
http://www.detroitmi.gov/Portals/0/docs/finance/CAFR/2011%20Detroit%20CAF
R%20Final.pdf
City of Orlando. (2006). Downtown Orlando Community Venues Master Plan. Retrieved
from http://www.cityoforlando.net/venues/wp-
content/uploads/sites/2/2014/02/Master-Plan-Phase-23.pdf
City of Orlando. (2007). Community VenuesDevelopment and Operation. Retrieved from
http://www.cityoforlando.net/wp-
content/uploads/sites/2/2014/07/DevelopmentOperations.pdf

59
City of Orlando. (2013). Comprehensive annual financial report for the fiscal year ended
September 30, 2012. Retrieved from http://www.cityoforlando.net/obfs/wp-
content/uploads/sites/23/2014/03/cafr2012.pdf
City of Orlando. (2014). Comprehensive annual financial report for the fiscal year ended
September 30, 2013. Retrieved from http://www.cityoforlando.net/obfs/wp-
content/uploads/sites/23/2014/03/2013CAFR.pdf
City of Orlando. (2015). Comprehensive annual financial report for the fiscal year ended
September 30, 2014. Retrieved from http://www.cityoforlando.net/obfs/wp-
content/uploads/sites/23/2015/04/CAFR-2014.pdf
City of Orlando. (2016). Comprehensive annual financial report for the fiscal year ended
September 30, 2015. Retrieved from
http://www.cityoforlando.net/Archive2016/2015-CAFR-Final-2.compressed.pdf
Coates, D. (2007). Stadiums and arenas: Economic development or economic
redistribution? Contemporary Economic Policy, 25(4), 565-577.
Coates, D., & Humphreys, B. R. (1999). The growth effects of sports franchise, stadia,
and arenas. Journal of Policy Analysis and Management, 18(4), 601-624.
Coates, D., & Humphreys, B. R. (2000). The stadium gambit and local economic
development. Regulation, 32(2), 15-20.
Crompton, J. (2004). Beyond economic impact: An alternative rationale for the public
subsidy of major league sports facilities. Journal of Sport Management, 18, 40-
58.

60
Davey, M., & Walsh, M. W. (2013, July 18). Billions in debt, Detroit tumbles into
insolvency. The New York Times. Retrieved from http://www.nytimes.com
Dehring, C. A., Depken, C. A., & Ward, M. R. (2007). The impact of stadium
announcements on residential property values: Evidence from a natural
experiment in Dallas-Fort Worth. Contemporary Economic Policy, 25(4), 627-
638.
Euchner, C. C. (1993). Playing the field: Why sports teams move and cities fight to keep
them. Baltimore: John Hopkins University Press.
Fenn, A. J., & Crooker, J. R. (2003, July). The willingness to pay fora new Vikings
stadium under threat of relocation or sale. Paperpresented at the Western
Economics Association Meetings, Denver, CO.
Fisher, A., McClelland, G. H., & Schulze, W. D. (1988). Measures of willingness to pay
versus willingness to accept: Evidence, explanations, and potential reconciliation.
In G.L. Peterson, B.L. Driver & R. Gregory (Eds.). Amenity resource valuation:
Integrating economics with other disciplines (pp. 127-134). State College, PA:
Venture Publishing.
Fisher, D. (2012, October 18). Detroit Tops The 2012 List Of America's Most Dangerous
Cities. Forbes. Retrieved from https://www.forbes.com
Gallagher, J., & Reindl, J. (2016, January 31). Ilitches: Investment in arena area hitting
$1.2 billion. Detroit Free Press. Retrieved from http://www.freep.com
Gilyard, B. (2013, October 2). What's driving the Twin Cities' apartment mania?
Minnpost. Retrieved from https://www.minnpost.com

61
Groothuis, P. A., & Rotthoff, K. W. (2016). The economic impact and civic pride effects
of sports teams and mega-events: Do the public and the professionals agree?
Economic Affairs, 36(1), 21-32.
Hamilton, B., & Kahn, P. (1997). Baltimore’s Camden Yards ballparks. In R.G. Noll &
A. Zimbalist (Eds.), Sports, jobs and taxes (pp. 245-281). Washington, DC:
Brookings Institution.
Hobbs, F., & Stoops, N. (2002). Demographic trends in the 20th century: Census 2000
special reports. Bureau of the Census.
Howard, D. R., & Crompton, J. L. (1995). Financing sport. Morgantown, VA: Fitness
Information Technology.
Jackson, K. T. (1985). Crabgrass frontier: The suburbanization of the United States.
New York, NY: Oxford University Press.
Jasina, J., & Rotthoff, K. W. (2008). The impact of a professional sports franchise on
county employment and wages. International Journal of Sport Finance, 3(4),
210-227.
Johnson, B. K., Groothuis, P. A., & Whitehead, J. C. (2001). The value of public goods
generated by a major league sports team. Journal of Sports Economics, 2(1), 6-21.
Johnson, B. K., Mondello, M., & Whitehead, J. C. (2007). The value of public goods
generated by a National Football League team. Journal of Sport Management,
21(1), 123-136.
Judd, D. R. (2003). The infrastructure of play: Building the tourist city. Armonk, NY:
M.E. Sharpe.

62
Judd, D. R., & Fainstein, S. S. (1999). The tourist city. New Haven, CT: Yale University
Press.
Kaszuba, M. (2012, June 25). Economic punch of Target Field tailing off. Startribune.
Retrieved from http://www.startribune.com
Keating, W.D. (1997). The ―comeback‖ city: The politics of redevelopment and sports
stadiums amidst urban decline. In M. Lauria (Ed.), Reconstructing urban regime
theory: Regulating urban politics in a global economy (pp. 189-205). Thousand
Oaks, CA: Sage.
Kennedy, P. (2013, August 9). Mayors line up behind Orlando stadium deal. Soccer
America. Retrieved from https://www.socceramerica.com
Long, J. G. (2005). Full count: The real cost of public funding for major league sports
facilities. Journal of Sports Economics, 6(2), 119-143.
Long, J. G. (2013). Public/Private Partnership for Major League Sports Facilities. New
York, NY: Routledge.
Mannix, A. (2009, March 2). Twins: Target Field. Minnpost. Retrieved from
https://www.minnpost.com
Metzger, J. T. (2001). The failed promise of a festival marketplace: South Street Seaport
in lower Manhattan. Planning Perspectives, 16(1), 25-46.
Mills, E. S., & Price, R. (1984). Metropolitan suburbanization and central city problems,
Journal of Urban Economics, 15, 1-17.
Minnesota Ballpark Authority. (n.d.). Retrieved from http://www.ballparkauthority.com/

63
Moore, J. (2012, November 5). Ford Center nearly totally leased. Star Tribune. Retrieved
from http://www.startribune.com
Mosier, J. (2015, December 16). Texas Live! Announced as name for Arlington
development next to Rangers’ Globe Life Park. Dallas News. Retrieved from
https://www.dallasnews.com
Nelson, A. C. (2001). Locating major league stadiums where they can make a difference:
Empirical analysis with implications for all major public venues. Public Works
Management & Policy, 7(2), 98-114.
Newsome, T. H., & Comer, J. C. (2000). Changing intra-urban location patterns of major
league sports facilities. Professional Geographer, 52(1), 105-120.
New district will help transform Detroit’s economic future. (2014, September 24). The
District Detroit. Retrieved from http://www.districtdetroit.com
Noll, R. G., & Zimbalist, A. (1997). Sports, Jobs, & Taxes. Washington, DC: Brookings
Institution.
Norfleet, N. (2017, January 11). United Properties looking at building new venue near
Target Field. Star Tribune. Retrieved from http://www.startribune.com
Norton Grubb, W. (1982). The flight to the suburbs of population and employment, 1960-
1970. Journal of Urban Economics, 11, 348-367.
Olson, R. (2014, April 8). Hennepin County, Twins reach deal on Target Field Station
transit hub. Star Tribune. Retrieved from http://www.startribune.com

64
Olympia Development launches retail, office space developments in the District Detroit’s
Woodward Square neighborhood (2016 January 31). The District Detroit.
Retrieved from http://www.districtdetroit.com
Owen, J. G. (2006). The intangible benefits of sports teams. Public Finance and
Management, 6(3), 321-345.
Prada, M. (2014, October 5). NBA to announce 9-year, $24 billion deal with ESPN,
Turner. SBNation. Retrieved from http://www.sbnation.com
Pumping energy into downtown (n.d.). Populous. Retrieved from http://populous.com
Rappaport, J., & Wilkerson, C. (2001). What are the benefits of hosting a major league
sports franchise? Economic Review – Federal Reserve Bank of Kansas City,
86(1), 55-91.
Reikofski, P. (2016, May 25). How many people go to Disney World every day – 2015
edition. Temporary Tourist. Retrieved from http://temporarytourist.com
Robertson, K. A. (1997). Downtown retail revitalization: A review of American
development strategies. Planning Perspectives, 12(4), 383-401.
Rosentraub, M. S. (1996). Does the emperor have new clothes? A reply to Robert J.
Baade. Journal of Urban Affairs, 18(1), 23-31.
Rosentraub, M. S. (1999). Major league losers: The real costs of sports and who’s paying
for it. Revised edition. New York, NY: Basic Books.
Rosentraub, M. S. (2000). Sports facilities, redevelopment, and the centrality of
downtown areas: Observations and lessons from experiences in a Rustbelt and
Sunbelt city. Marquette Sports Law Review, 10(2), 219-235.

65
Rosentraub, M. S. (2006). Sports facilities and urban redevelopment: Private and public
benefits and a prescription for healthier future. International Journal of Sports
Finance, 1(4), 212-226.
Rosentraub, M. S. (2010). Major league winners: Using sports and cultural centers as
tools for economic development. Boca Raton, FL: CRC Press.
Rosentraub, M. S., & Swindell, D. (2005). The value of the Indianapolis Colts to Indiana
residents and their willingness to pay for a new stadium. Retrieved from
http://images.ibsys.com/
Rosentraub, M. S., Swindell, D., Przybylski M., & Mullins, D. R. (1994). Sport and
downtown development strategy: If you build it, will jobs come? Journal of
Urban Affairs, 16(3), 221-239.
Santee, E. (2012, November 28). Stadiums That Shape Downtowns: The Impact of
Stadiums on Urban Redevelopment. Populous. Retrieved from
http://populous.com
Santo, C. A. (2005). The economic impact of sports stadiums: Recasting the analysis in
context. Journal of Urban Affairs, 27(2), 177-191.
Santo, C. A. (2007). Beyond the economic catalyst debate: Can public consumption
benefits justify a municipal stadium investment? Journal of Urban Affairs, 29(5),
455-479.
Schrock, S. (2015, February 20). Arlington blitzing through its stadium debt faster than
expected. Star-Telegram. Retrieved from http://www.star-telegram.com

66
Settimi, C. (2012, October 2). Baseball Scores $12 Billion In Television Deals. Forbes.
Retrieved from https://www.forbes.com
Siegfried, J., & Zimbalist, A. (2000). The economics of sports facilities and their
communities. The Journal of Economic Perspectives. 14(3), 95-114.
Siegfried, J., & Zimbalist, A. (2002). A note on the local impact of sports expenditures.
Journal of Sports Economics, 3(4), 361-366.
Siegfried, J., & Zimbalist, A. (2006). The economic impact of sports facilities, teams and
mega-events. The Australian Economic Review, 39(4), 420-427.
Smith, K. (2017, January 14). Hennepin County to pay off Target Field debt a decade
early. Star Tribune. Retrieved from http://www.startribune.com
Spirou, C. (2010). Cultural policy and the dynamics of stadium development. Sport in
Society, 13(10), 1423-1437.
Sullivan, T. R. (2016, November 8). Raise the roof: Rangers' new ballpark approved.
Mlb.com. Retrieved from http://m.mlb.com
Swindell, D., & Rosentraub, M. S. (1998). Who benefits from the presence of
professional sports teams? The impact of public funding of stadiums and arenas.
Public Administration Review, 58(1), 11-20.
Tenorio, P. (2015, May 29). Orlando City to privately finance soccer stadium, pay back
city. Orlando Sentinel. Retrieved from http://www.orlandosentinel.com
Tu, C. C. (2005). How does a new sports stadium affect housing values? The case of
FedEx Field. Land Economics, 81(3), 379-395.

67
Wassmer, R. W., Ong, R. S., & Propheter, G. (2016) Suggestion for the needed
standardization of determining the local economic impact of professional sports.
Economic Development Quarterly, 30(3), 252-266.
Weiner, R. D. (2004). Financing techniques and stadium subsidies in the United States.
Journal of Urban Technology, 11(2), 41–59.
Wooten, K., & Spiegel, D. (2015 April 9). Orlando becomes first destination to surpass
60 million visitors, sets new record for U.S tourism industry. Orange county
Government. Retrieved from https://www.orangecountyfl.net/
Zimmerman, D. (1997). Subsidizing stadiums: Who benefits, who pays? In R.G. Noll &
A. Zimbalist (Eds.), Sports, jobs, and taxes. (pp. 119-145). Washington, DC:
Brookings Institution.


![SummaryMap ward2 [Converted] · 2019-10-01 · MU-2 MU-6 MU-16 MU-14 MU-6 MU-2 MU-20 MU-9 MU-4 MU-13 MU-15 MU-13 MU-16 MU-18 MU-22 MU-19 MU-16 MU-27 MU-4 MU-3A MU-17 MU-13 MU-4](https://img.pdfslide.net/doc/110x75/5f5e4f591750d150e9633369/summarymap-ward2-converted-2019-10-01-mu-2-mu-6-mu-16-mu-14-mu-6-mu-2-mu-20.jpg)