Embed Size (px)
Citation preview

[m] Technical Report CHL-97-4I 1 March 1997ls~ll
US Army Corpsof EngineersWaterways ExperimentStation
CORE-LOC Concrete
by Jeffrey A. Me/by, George
Armor Units
F. Turk
Approved For Public Release; Distribution Is Unlimited
Prepared for Headquarters, U.S. Army Corps of Engineers

The contentsof thk reportarenot to be usedfor advertising,publication,orpromotionalpurposes. Citation of tradenamesdoes not constitute an official endorsementor approvalof theuseof such commercialproducts.
The findings of this report are not to be construedas anofficial Departmentof the Army position, unless so desig-nated by other authorized documents.
@PRINTED ON RECYCLED PAPER

Technical Report CHL-97-4March 1997
CORE-LOC Concrete Armor Units
by Jeffrey A. Melby, George F. Turk
U.S. Army Corps of EngineersWaterways Experiment Station3909 Halls Ferry RoadVicksburg, MS 39180-6199
Finalreport
Apprwed for public refeasq distributionis unlimited
Prepared for U.S. Army Corps of EngineersWashington, DC 20314-1000
-
[m]I II*QII
US Army Corpsof EngineersWaterwaysExperimentStation
foR lfWORMAllON CONTACTPUSUCAFWURS OFFICEU.S. ARMY ENGINEERWAHAYS EXPERIMENT STATION3909 NAUS~ROADVICKSBURG, MISSISSIPPI 39160.6199PHON& (601) 634-2602
Waterways Experiment Station Cataloging-in-Publication Data
Melby, Jeffrey A.CORE-LOC concrete armor units/by Jeflkey A. Melby, George F. Turk; prepared for
U.S. Army Corps of Engineers.55p. : ill.; 28 cm. - (Technical report; CHL-97-4)Includes bibliographic references.1. Shore protection. 2. Breakwaters. I. Turk George F. II. United States. Army. Corps
of Engineers. III. U.S. Army Engineer Waterways Experiment Station. IV. Coastal andHydraulics LaboratoV (U.S. Army Engineer Waterways Experiment Station) V. Title. VI.Series: Technical report (U.S. Army Engineer Waterways Experiment Station) ; CHL-97-4.TA7 W34 no.CHL-97-4
Contents
Preface . . . . . . . . . . . . . . . . . . . . . . . . . . . . . . . . . . . . . . . . . .
l—Introduction . . . . . . . . . . . . . . . . . . . . . . . . . . . . . . . . . . . . .
2-Core-Loc Characteristics . . . . . . . . . . . . . . . . . . . . . . . . . . . . .
3-Core-Loc Structural Response . . . . . . . . . . . . . . . . . . . . . . . . . .
4-Core-Loc Hydraulic Stability. . . . . . . . . . . . . . . . . . . . . . . . ---
Initial Two-Dimensional Tests.. . . . . . . . . . . . . . . . . . . . . . . . .Other Two-Dimensional Tests.. . . . . . . . . . . . . . . . . . . . . . . . .Noyo, CA, Site-Specific Stability Tests . . . . . . . . . . . . . . . . . . . .
5-Core-Loc Repair ofDolosLayers . . . . . . . . . . . . . . . . . . . . . . . .
6-Armor Volume Comparison. . . . . . . . . . . . . . . . . . . . . . . . . . .
7-Conclusions . . . . . . . . . . . . . . . . . . . . . . . . . . . . . . . . . . . . .
References . . . . . . . . . . . . . . . . . . . . . . . . . . . . . . . . . . . . . . . .
v
1
5
8
14
141820
23
25
30
32
Appendix A: Initial Core-Loc Hydraulic Stability Results . . . . . . . . . . Al
SF298
List of Figures
Figure 1. Various concrete armor shapes . . . . . . . . . . . . . . . . . . . . 2
Figure 2. Core-loc schematic . . . . . . . . . . . . . . . . . . . . . ..- . . . 6
Figure 3.
Figure 4.
Figure 5.
Figure 6.
Figure 7.
Figure 8.
Figure 9.
Figure 10.
Loading and boundary conditions for torsionalstress comparison . . . . . . . . . . . . . . . . . . . . . . . . . . . . 9
Loading and boundary conditions for other load cases . . . . . . 10
Tensile stress contours from FEM static torsional loading . . . . 11
Comparison of maximum tensile stresses from FEM analysis . 13
Structure layout . . . . . . . . . . . . . . . . . . . . . . . . . . . ..16
Profile viewofstructure as tested . . . . . . . . . . . . . . . . . . 16
Flume layout . . . . . . . . . . . . . . . . . . . . . . . . . . . . ...17
Required armor layer volumes relative to core-loc forbr&king waves on lV: 1.5H sloped structure heads . . . . . . . . 29
List of Tables
Table 1.
Table 2.
Table 3.
Table 4.
Table 5.
Table 6.
Table 7.
Table 8.
Table Al.
Engineering Characteristics of Core-Lot . . . . . . . . . . . . . . 7
FEMStatic Stress Comparison . . . . . . . . . . . . . . . . . ...12
Froude Scaling Model Parameters . . . . . . . . . . . . . . . ...14
Model Core-Loc Specification . . . . . . . . . . . . . . . . . ...15
Summary of Test Data for Maximum Wave Conditions . . . . . 17
Armor Unit Stability Coefficients . . . . . . . . . . . . . . . . ...27
Volume Correction Factors . . . . . . . . . . . . . . . . . . . ...28
Armor Volume Comparison for Breaking Waves . . . . . . . . . 29
Initial Stability Test Data . . . . . . . . . . . . . . . . . . . . . . . Al
iv

Preface
Funding for CORE-LOC development, as discussed in this report, wasprovided by the Coastal Engineering Research Program (CERP), and theRepair, Evaluation, Maintenance, and Rehabilitation (REMR) ResearchProgram, which are both part of the Civil Works Research and DevelopmentProgram, Headquarters, U.S. Army Corps of Engineers (HQUSACE).CORE-LOC was developed under CERP Work Unit 32536, “Concrete ArmorUnit Design” and REMR Work Unit 32662, “Breakwater Concrete ArmorUnits for Repair” at the Coastal Engineering Research Center (CERC) of theU.S. Army Engineer (USAE) Waterways Experiment Station (WES). CERCand the WES Hydraulics Laboratory were merged in October 1996 to formthe WES Coastal and Hydraulics Laboratory (CHL). Dr. James R. Houstonis the Director of the CHL and Messrs. Richard A. Sager and Charles C.Calhoun, Jr., are Assistant Directors. Many of the twodimensional stabilitytests reported herein were conducted under CERP Work Unit 32534,“Breakwater Stability: A New Design Approach. ”
Mr. David Mathis, HQUSACE, was the CERP Coordinator and Mr.William N. Rushing, HQUSACE, was the REMR Coordinator, both of theDirectorate of Research and Development. Members of the REMR OverviewCommittee were Mr. James E. Crews, Chairman, and Dr. Tony C. Liu,HQUSACE. Messrs. John J. Lockhart, Jr., Barry Holliday, and CharlesChesnutt served as HQUSACE Technical Monitors. Ms. Carolyn Holmes,CHL, was the CERP Program Manager and Mr. William F. McCleese, WESStructures Laboratory, was the REMR Program Manager. Mr. D. D.Davidson, CHL, was the REMR Coastal Problem Area Leader. Mr. JeffreyA. Melby, CHL, was the Principal Investigator of research Work Units 32536and 32662. Mr. Robert Carver, CHL, was the Principal Investigator ofresearch Work Unit 32534.
CORE-LOC was developed from July 1992 through September 1994 byMr. Melby and Mr. George F. Turk, Research Hydraulic Engineers, CHL.Much of the twodimensional stability testing was done by Mr. Carver andMs. Brenda Wright, CHL, beginning in June of 1993 and continuing throughthe present. The studies were done under the general supervision of Dr.Houston and Mr. Calhoun, and under the direct supervision of Mr. C. GeneChatham, Chief, Wave Dynamics Division, and Mr. D. D. Davidson, Chief,Wave Research Branch, CHL. Mr. Davidson and Dr. Steven A. Hughes,CHL, provided technical review of this report.
v
Authorization and funding for the Noyo Stability Study, also discussedherein, were provided by the USAE District, San Francisco (SPN). TheCORE-LOC stability tests on the Noyo breakwater were carried out betweenAugust and September of 1994. Mr. Ernest R. Smith, CHL, was the ProjectEngineer on the Noyo Study. Periodic consultation was provided by SPNengineers.
At the time of publication of this report, Director of WES was Dr. RobertW. Whalin. Commander was COL Bruce K. Howard, EN.
lhe cotuam of thisrepon are not w be usedfor advetaising,publication,or promotionalpurposes. ~tation oJuade namesdoes not comtituteanofia”al endcmsementor approvalof the use of such commercialproducLs
vi

1 Introduction
Concrete armor units are commonly used to protect coastal rubble stmctures.The units are individually placed on the breakwater in a regular pattern or quasi-random matrix. Concrete armor units come in a variety of shapes and sizes, andsome have several recommended placement configurations. Concrete armorunits are used on structures when stone of a sufficient size to resist wave actionis not available or is uneconomical.
In the past, the choice of armor unit shape and method of application haverelied in large part on engineering judgement, partly because no optimal armorunit existed. All of the existing armor units had some distinct weakness in theform of low stability, high structural stresses, low on-slope porosity or rough-ness, and/or complex and sometimes impossible specified construction tech-niques. Some units have overly specific placement requirements and are nearlyimpossible to construct in low visibility or deep water. In addition, some armorshapes are simply inefficient, producing layers requiring excessive amounts ofconcrete. As a result of these weaknesses, concrete armor units have historicallyperformed poorly, from both engineering and economic perspectives. Typicalarmor units, as shown in Figure 1, include the dolos, tribar, tetrapod,ACCROPODE@ (hereafter refereed to as accropode), and block. These unitshave a range of stability and structural capacity characteristics. Most existingarmor units require rather shallow structure slopes to maintain hydraulic stabil-ity. None of the units shown are specifically designed to be used as repair unitsfor existing dissimilar armor slopes. Some of these units can be stacked to mini-mize casting yard space while othem cannot.
The Coastal Engineering Research Center at the U.S. Army Engineer (USAE)Waterways Experiment Station (wES) has an ongoing research effort to developimproved concrete armor unit shapes for both new coastal construction and re-pair of existing coastal concrete-armored rubble structures. This developmentrequires incorporating all of the best engineering features from the various exist-ing armor shapes into a single unit while eliminating the major weaknesses.
Chapter 1 Introduction

Figure 1. Various concrete armor unit shapes
Optimal armor engineering characteristics are summarized as follows:
a.
b.
c.
d.
e.
$
g.
h.
i.
j.
k.
1.
High hydraulic stability when placed in a single-unit-thickness layer atany slope angle.
Reserve stability for wave conditions that exceed the design event.
No tendency for units to rock on slope.
Continued stability when broken or following renesting resulting fromlocal instability.
Efficient combination of porosity and slope roughness to dissipate themaximum wave energy.
Maximum performance with a minimum concrete armor layer volume.
Hydraulically stable when placed as a repair with other shapes.
Low internal stresses, so no reinforcement required.
Easy to cast.
Easily constructed armor layer, even in low visibility water.
Uses minimal casting yard or barge space.
Utilizes conventional construction materials and techniques.
2
Most existing armor units have been successfully applied, but all haveweaknesses in one or more of these engineering performance characteristics.For instance, block shapes are often uneconomical because the armor layers
Chapter 1 Introduction
require larger units and more concrete than layers of slender armor. Pattem-placed blocks such as Shed and Cob (Wilkenson and Allsop 1983), Haro (deRouck et al. 1994), and Seabee (Brown 1983), have improved economies oversolid blocks, but require idyllic construction conditions to assure the armor layertransitions will not be mobile. Pattern-placement of any shape, particularlywithout interlocking, will always be subject to unraveling if any single unit isremoved from the layer (weakest link analogy). Also, hollow block shapes canbe structurally fragile and generally require reinforcement. Slender interlockingunits, such as the dolos, gassho, and tribar, have long legs and slender centralsections producing very high stresses in the central region. Requiring reinforce-ment makes these units too expensive and breakage of unreinforced units hasbeen a recurring problem (Melby and Turk 1995). The accropode shape pro-duces a more economical armor layer than most units but could be improved bymodifying the shape to increase layer porosity and stability.
A new series of coastal rubble structure concrete armor units called CORE-LOCTM,hereafter referred to as core-lot, has been developed that attempts toincorporate all of the features shown in the above list. While several differentcore-loc shapes have been developed,, this report discusses preliminary hydrau-lic stability tests of only one shape. This is the middle aspect ratio and is ex-pected to be the most widely used unit.
Core-lot units have been designed to be placed in a single-unit-thicknesslayer on steep or shallow slopes. Steep armor layer slopes typically are between3V:4H and lV: 1.5H. The core-loc shape has been optimized to maximize hy-draulic stability, unreinforced strength, and residual stability, but minimize cast-ing yard space.
The primary intent of the shape optimization is to produce a very stable ar-mor layer and yet have stresses low enough that regular strength unreinforcedconcrete can be used with little or no armor breakage occuming during the life ofthe structure. Many breakwater concrete armor layers built between 1950 and1985 in the United States have lasted less than 10 years between rehabilitations,primarily due to armor breakage (Melby and Turk 1995). The core-loc strengthhas been maximized, through optimization of the unit shape, to minimize armorunit breakage. During the last few years of research on the structural response ofdolos units it was found that very high flexural and torsional stresses occurred inthe slender central cross sections on the dolos units (Melby and Howell 1989,Melby and Turk 1992). Field inspections and finite element analyses haveshown a similar response in tribar units. Because of the contiguous shape of thedolos and close proximity of the highly stressed central regions and the slenderouter regions, it is nearly equally likely to have very high stresses in the outersections. The core-loc units were designed to eliminate the slender central sec-tions by requiring that the dimensions of any centrally cut section be no less thantwo-thirds of the maximum dimension of the unit. This is accomplished bychamfering all intersecting internal angles. Chamfering also decreases thestresses in the outer portions of the unit. Although the chamfered core-loc has aslender appearance, it is actually quite robust with large central-section modulii,as will be shown in the following structural analyses. The multitude of symmet-
Chapter 1 Introduction 3

ncally tapered appendages promotes wedging and assures good interlockingbetween units.
The core-loc unit was specifically designed to interlock well with dolosse sothat it could be used as a repair unit. Dolosse are usually designed with a waistratio of 0.32. This is the ratio of the maximum unit dimension, the fluke length,to the depth of the central shank. The most commonly used core-loc shape wasdesigned such that the separation and taper of its flukes are approximately thesame as that of a dolos with a waist ratio of 0.32.
Chapter 1 Introduction

2 Core-Lot Characteristics
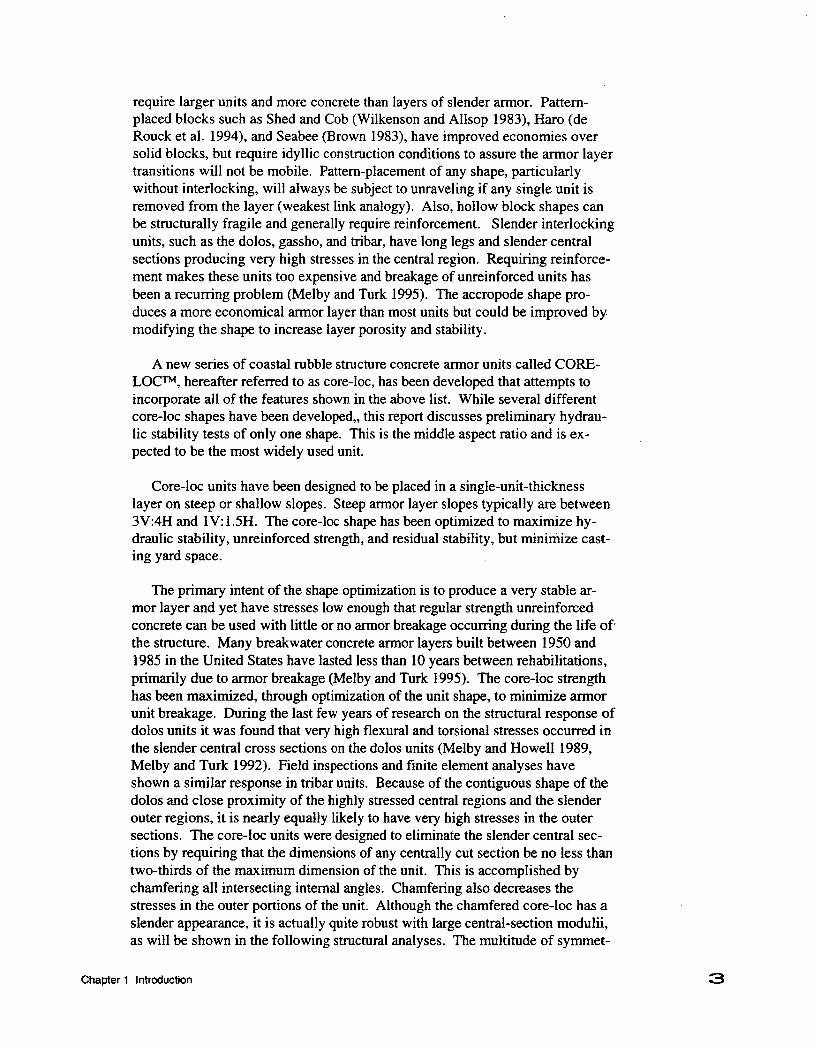
Figure 2 shows schematicised dimensions of commonly used chamferedcore-loc. Table 1 summarizes engineering characteristics of core-loc units andcore-loc layers. The table includes the range of values measured for model core-Iocs with and without chamfers and typically recommended values for a proto-type design using smaller core-loc. The table also includes similar values for thedolos unit for comparison. Engineering characteristics herein are defined as perChapter 7 of the Shore Protection Manuul (SPM 1984). The outer dimension,sometimes called the fluke length, of both units is denoted as C. Dolos calcula-tions are done for the usual dolos application with waist ratio 0.32. The numberof units per unit area can be determined using the equations
N,~ . (#)v-~3 (1)
[)$=nkA I--& (2)
whereN, =A=v=
0=n =
P=k~ =r =
w=
Y, =
[1w lDr=nkA—
Yr
number of units in a given onslope areaonslope areaarmor unit volumepacking density coefficientnumber of layersporositylayer coefficient’layer thicknessarmor unit weightspecific weight of the concrete
(3)
Chapter 2 Core-Lot Characteristics
S124-+12.4+
TOP WEW
t—13-l
FRONT MEW RIGHTSIDE YIW
C=l .0E=0.248
A= O.179 F= O.175B= O.360 G= O.500D=O.640 J= O.320
Figure 2. Core-lot schematic
The packing density coefficient for core-lots has not been defined with accuracyyet. Simple box tests yield a packing density coefficient from 0.54 to 0.67. Thehigher coefficients are achieved by carefully placking the units and may not beachievable in the prototype. The lower coefficients are loose and will likelyexhibit unwanted downslope packing in the prototype. Actual packing on astructure will vary due to bends at the toe and crest. Therefore, a short stmcturewill exhibit different packing density coefficients than a tall structure, even if theonslope unit-to-unit spacing is similar. Tests to-date show that, on completedthree dimensional physical models, packing density coefficients generally varyfrom 0.58 to 0.64, and porosity from 0.54 to 0.67. Estimates of these values isdifficult and will vary from three to five percent due to the subjectiveness inestimating the surface area perimeter. Moreover, the prototype units will not
6Chapter 2 Core-Loe Characteristics

pack as tight as model units because the frictional force is believed to be rela-tively higher in the prototype and crane maneuverability less than that achievedby hand placement. This difficulty in handling large units will also lead tosmaller prototype units packing tighter than larger units.
For a single thickness of armor, a higher packing density will usually producea more reliable armor layer with respect to stability, particularly if the toe canmove. Therefore it is reasonable to use the highest packing density coefficientthat can be resonably achieved, within the funding and construction constraintsof the project. Also, underestimation of the number of units required can causeserious contractual and logistical problems during the final period of armor layerconstruction. But an attempt to over-pack the layer can result in bridging of theunits, which can lead to settlement problems. Packing density coefficient andporosity are given for a smaller unit in Table 1, but prototype experience bySogreah (1997) indicates the packing density coefficient should be reduced asthe unit size increases. Consult the Core-Lot Technical Guidelines (Turk andMelby 1997) for selection of design values for a particular case.
Table 1Engineering Characteristics of Core-Lot
Nondimen- PackingNondimen- Typical sional Layer Densitysional Number of Layer coeffi- coef- TypicelVolume Layers Thickness cient Porosity ficient Slope
Unit VIC3 n r/C kfi Pas “h * cot a
Uncham-ferad ModelCore-Lot 0.2240 1 1.00 1.60 66 0.54 1.33-2.0
ChamferedModelCore-Lot 0.2234 1 0.85-1.10 1.39-1.77 54-67 0.58-0.64 1.33-2.0
Example:5 t PrototypeCore-Lot 0.2234 1 0.92 1.51 60 0.60 1.33-2.0
Dolos 0.1561 2 1.02 0.94 56 0.83 2.0
Chapter 2 Core-Lot Characteristics 7
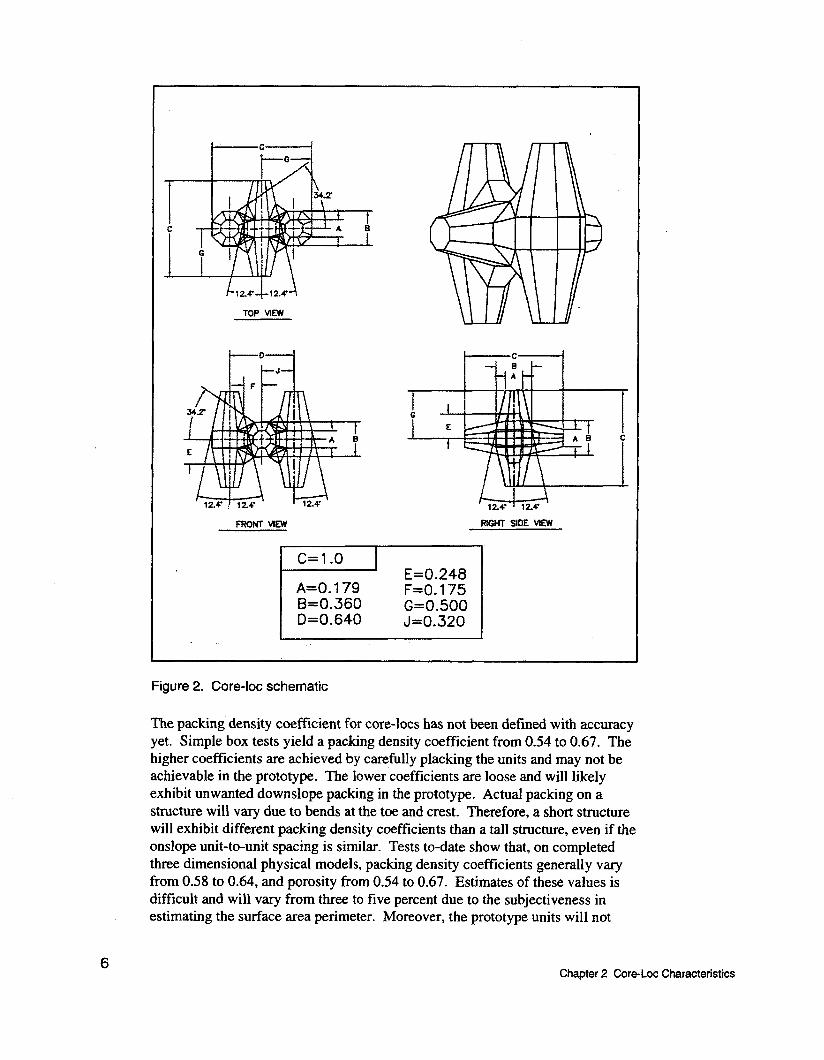
3 Core=Loc StructuralResponse
Finite element method (FEM) structural analyses were performed by Jaycor,Inc. of Vicksburg, MS, to compare the structural response of dolosse, tribar, andaccropodes with core-lots for several stat?c loading modes. For the FEManalysis, the armor weight was 9 tonnes (10 tons), modulus of elasticity was3.5* 104Mpa (5.1*106 psi), Poisson’s ratio was 0.21, and specific gravity was2.32 relative to fresh water. The FEM grids for the four units are shown inFigure 3. An example loading, shown in Figure 3, imposed the worst casetorsional condition with four 4.5-tonne (5-ton) loads applied to the four fluke tipends to generate the maximum twisting force on the unit. The unit was pinned atthe center for this case. Another loading condition imposed a 9-tonne ( 10-ton)flexural load on one fluke tip with the opposing fluke fixed rigidly along theoutside surface (Figure 4a). This condition generated the maximum flexuralstresses at the internal intersection on the unit. Another pure flexural loadingand a combined torsion and flexural loading also were analyzed (Figures 4b and4c, respectively). For the other pure flexure load condition, the load of 9 tonnes(10 tons) was applied transversely at the center of the fluke while the opposingfluke was held rigid. For the combined loading case, two 9-tonne (lO-ton) loadsimposing torsion and flexure were applied to one fluke end while the opposingfluke was held rigid along its entire length.
Figure 5 shows tensile stress contour plots for the pure torsional loadingcondition for the four units. The plots show that even though the maximumtensile stress in the accropode is larger than that in the core-lot, the averagestress over the highly stressed chamfer region is less. A closer inspection ofFigure 5 shows that the stress varies by over a factor of two near the chamferedge. The discontinuity at the chamfer leads to a much higher stress gradientthan would be present if no chamfer existed. Therefore, for all four units, usingfillets rather than chamfers would reduce the maximum tensile stressessignificantly. For core-loc and accropode units, however, this generally is notrequired as the design stresses are far less than dolos and tribar, and the latterunits have performed reasonably well on all Corps stmctures. The only projectsthat have proved less than satisfactory are dolos layers where the units wereundersized with respect to stability. Note that on Figure 5 the highly stressed
8Chspter 3 Core-Lot Structural Response

regions near the ends of the flukes are point stresses due to the loads and are notof interest.
CORE-LOC
Figure 3. Loading and boundary conditions for torsional stress comparison
Chapter3 Core-Lot Structural Response

load
load
flexure
Figure 4. Loading and boundary conditions for other load cases
10Chapter 3 Core-Lot Structural Response


Maximum tensile stresses from the FEM analyses are summarized in Table 2.All load cases were analyzed for the dolos and core-loc but only the pure torsionand pure flexure with tip load were analyzed for the accropode and tribar. Themaximum tensile stresses for each unit for torsion and fluke-tip flexure areillustrated in Figure 6. As shown in Table 2 and in Figure 6, for equivalentweight units, the core-loc maximum tensile stress for static loads ranges from 46percent to 62 percent that of dolos. The maximum core-loc tensile stress is 74percent for torsion and 74 percent for flexure that of accropode, and 38 percentfor torsion and 33 percent for flexure that of tribar.
Table 2FEM Static Stress Comparison
IStress, o,, Mpa (psi)
Load Case Core-Lot Dolos Accropode Tribar
Torsion 1.12 (162) 2.08 (302) 1.52 (220) 2.98 (432)
Flexure - fluke tip load 1.12(162) 2.41 (350) 1.52 (220) 3.36 (487)
Flexure - fluke center 2.10 (305) 3.42 (496) NIAload
N/A
Combined flexure and 1.91 (277) 3.83 (556) NIA N/Atorsion
For Crescent City 38-tonne dolosse, the design stress level corresponding to a2 percent exceedance was approximately 4.8 Mpa (696 psi). This structure isperforming reasonably well with 2 percent breakage since the 1986rehabilitation. The core-loc design stress, estimated at 62 percent of this value,would be approximately 3.0 Mpa (435 psi). This stress is below the 28-daysplitting tensile strength met on all Corps concrete armor projects. Further,recent concrete armor 28-day strengths have ranged from 4.5 (650) to 5.0 (720)
lMPa. Thus, core-loc maximum stresses should be well below design strengths,even for large unreinforced units.
12Chapter 3 Core-Lot Structural Response

3.5 -1
0Core-lot Accropode Dolos Tribar
Figure 6. Comparison of maximum tensile stresses from FEM analysis
Chapter 3 Core-Lot Structural Response 13
4 Core-Lot HydraulicStability
Initial Two-Dimensional Tests
Experimental setup
Preliminary hydraulic stability tests were conducted using core-loc to test thefeasibility of the unit. These tests were kept very simple and were only intendedto provide an initial estimate of the core-loc stability relative to other commonlyused armor units. Test results were to be used to determine whether or not toproceed with development of engineering guidance for the core-loc.
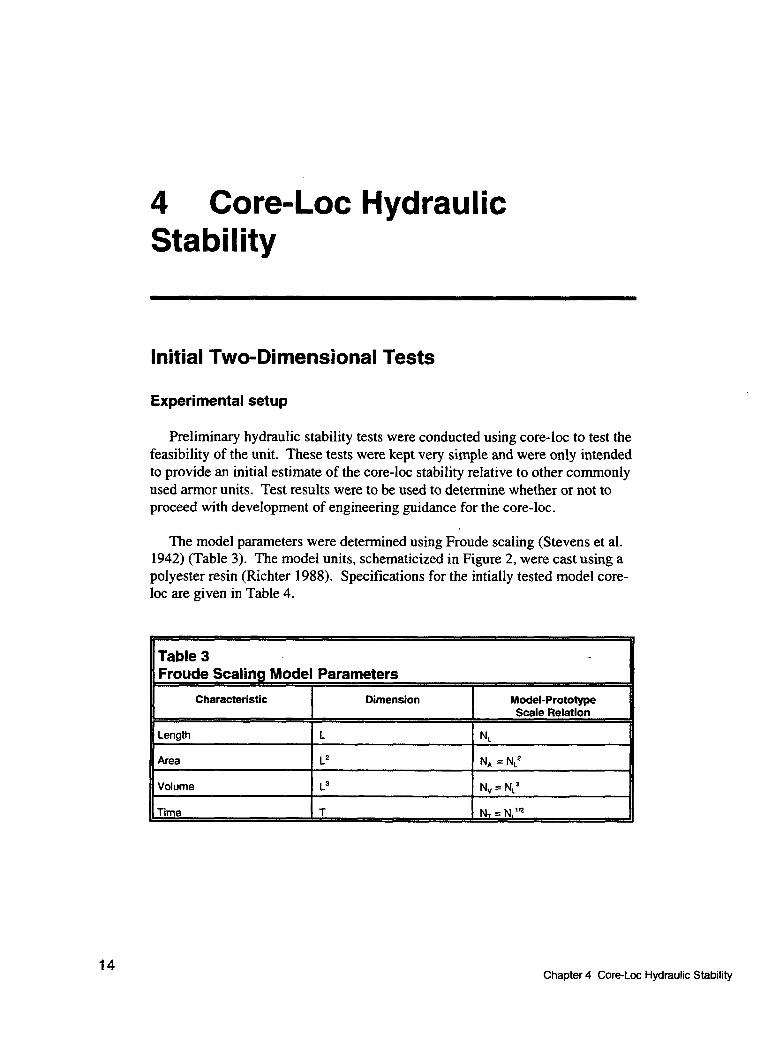
The model parameters were determined using Froude scaling (Stevens et al.1942) (Table 3). The model units, schematicized in Figure 2, were cast using apolyester resin (Richter 1988). Specifications for the intially tested model core-10Care given in Table 4.
Table 3Froude Scaling Model Parameters
I ICharacteristic I Dtmension I Model-Prototype
Length L N~I I
Area L* NA = N~2
Volume L3 Nv = N~3r
14Chapter 4 Core-Lot Hydraulic Stability

ITable 4~Model Core-Lot S~ecifications
c I B I J I A Mass Volume Specific
cm (in.)Gravity
gram (lb) cms(in.s)
8.0 220 (0.49)(:::3)
93.2 2.35(::L) (3.15) (:::9) (5.69)
Dimensions are defined in Figure 2. Note that these initial model units were not chamfered andhad slightly different dimensional relationships than those shown in Figure 2.
The structure layout schematic is shown in Figure 7 and a profile view photo-graph of the structure is shown in Figure 8. The core material was sized at thelower end of that recommended by the SPM to achieve a nearly impermeablestructure, which increases the back pressures and is conservative for armorstability. Using the SPM recommendation for randomly placed armor, theunderlayer mean weight was one-fifth of the armor weight with a gradation of&30 percent by weight.
The tests were conducted in a 61 cm (24 in) wide, 45.7 m (150 ft) long, 1.4 m(4.5 ft) deep flume. Figure 9 shows the flume layout. Four electrical-capacitance wave gages were used to measure the water surface oscillations inthe flume. A single wave gage was placed near the wave generator while threegages were placed in an array near the structure. Incident and reflected waveswere resolved using the method of Goda and Suzuki (1976). Waves weregenerated by an electro-hydraulic powered, computer-controlled, bottom-hingedpaddle.
Experimental results
Table 5 summarizes the initial stability tests accomplished for the core-locunit. Only the maximum wave heights tested for each wave period-water levelcombination are shown in Table 5. The full list of tests is shown in Appefidix A,Table Al. All tests utilized monochromatic waves.
The only test condition that showed any instability during the hydraulicstability tests is the first entry in Table 5; a wave 36 cm (14 in.) high with aperiod of 1.4 sec in a water depth of 46 cm (18 in.). For this case, the entirelayer slumped downslope due to the long slope length and extraordinarily largewaves.
Chapter 4 Core-Lot Hydraulic Stability 15

COVER LAYER: Number/A = 8 units/sq. ft.Layer Thick = 3.1”
‘ FIRST FILTER LAYER:
/“’”
Gradation = A 30% by weightLayer Thick = 2.75”
CORE: Seive = 4mm ~ 1 seive size
I /
\
T’— A
depth at toe wc=2g
>
/
L 1V:20H flat /
Figure 7. Structure layout
Figure 8. Profile view of structure as tested
16Chapter 4 Core-Lot Hydraulic Stability

3-gage Goda array:
Paddle
50’~ - 22’
Ill\
c flat 6t fla*
kl1:33.3 J 1:20
1:16
4’
Figure 9, Flume layout
Table 5Summary of Test Data for Maximum Wave Conditions
Gain Depth at Wave Incident Reflee- Move- StabilityToe Period at Wave tion ment Coeffcm Gage Height Coeff K.(in.) (sac) cm (in.)
64 46 (18.1) 1.38 36 (14.2) 0.23 reeking 159
68 46 (18.1) 1.78 32 (12.6) 0.51 none 111’
94 38 (15.0) 1.26 45 (17.7) 0.27 none 321’
94 38 (15.0) 1.58 36 (14.2) 0.38 none 163’
94 38 (15.0), 1.96 31 (12.2) 0.51 none 102’
90 38 (15.1) 2.09 18(7.1) 0.61 none 21’
1 Wave generation capacity limited, no instability.
Chapter 4 Core-Lee Hydraulic Stability 17

The Hudson stability equation is as follows:
w=y, H3
KD(S, -1)3cots(4)
wherew= stable armor weight
Y, = armor specific weightH= wave heightsr = armor specific weight relative to the specific weight of water in
which it is placed, i.e. S,= yJyW, where yWis the specific weightof water
a= structure slopeK~ = Hudson stability coefficient
This equation can be used to compare core-loc stability with other randomlyplaced armor units. However, it is likely that this equation will not adequatelydescribe the response of core-loc units. For instance, stability may increase withstructure slope rather than decrease. Table 5 lists K~ for the maximum waveconditions. It can be seen that the stable K~ are significantly greater than anydocumented stability tests of other randomly placed concrete armor shapes.
Other Two-Dimensional Stability Tests
A comprehensive series of two-dimensional hydraulic stability tests of thecore-loc has also been carried out (Carver and Wright 1994). These tests weredone in a 0.9-m-wide (3-ft-wide) section of a 3.4-m-wide (1 l-ft-wide) flumewhich was 75 m (245 ft) long. The remainder of the flume width was left clearfor waves to be dissipated on a rock wave absorber on the rear wall of the flume.Monochromatic and irregular waves were generated by an electro-hydraulicpowered, computer-controlled, horizontal-displacement paddle. For theirregular waves, the spectra were of the Texel, Marsen, and Arsloe (TMA) type.Incident and reflected waves were resolved from water surface measurementsmade with two sets of three electrical capacitance wave gages using the methodsof Goda and Suzuki (1976). The structure slopes tested included 3V:4H andIV: 1.5H. The approach slope was at lV: 100H for 6 m (20 ft) seaward of thestructure, 1V:75H for 34 m (112 ft), and flat for 15.2 m (50 ft) to the generatorpit. The deep and shallow wave gage arrays were positioned near the wavegenerator and 3.4 m(11 ft) from the structure toe, respectively. For the irregularwave tests, approximately 1,000 waves were generated per test. The waterdepths at the structure toe were 36 cm (14.2 in.) and 61 cm (24 in.). Theincident wave height HmOat the shallow water gage array ranged from 4.6 cm(1.8 in.) to 39 cm (15.4 in.) and the peak wave period TPfrom 1.5 to 4.7 sec. Thearmor layer was composed of 2 19-g (0.48-lb) core-lots with a stone underlayermean mass of 45 g (O.10 lb) and a stone core mean mass of 1 g (2.OE-3 lb). As
18Chapter 4 Core-Lot Hydraulic Stabiiity
in the previous tests, this core had a very low permeability and was also morecritical to armor stability. The structure was 0.9 m (2.95 ft) tall and 2.7 m (8.86ft) wide at the base. For these tests, several parameters of relative measure werecalculated including the relative depth aYLO,the wave steepness H~OLLO,and thesurf similarity parameter or Irribarren number
tanac=/-HJLO(5)
wherea = structure front slope angleH.O = incident wave height at the shallow gage arrayLO = 2rc/gTP2 = deep water wave length computed from the peak
period at the shallow gage arrayTP = peak periodd= structure toe depth
g = acceleration of gravity
The range of ~ tested was 2.13 to 15.9, the range of relative depths was 0.012 to0.175, and the range of wave steepnesses was 0.001 to 0.098.
These early tests showed that the core-loc armor layer was two-dimensionallystable for wave heights far exceeding those causing damage to most other armorshapes. No-damage Hudson coefficients were consistently over 150. En-massesliding of the armor layer was observed for the largest waves due to the longslope length and the high rundown velocities. As long as the prototype toe isreasonably stable, this would not be of concern because a conservativelydesigned armor layer would never be subjected to these extreme waveconditions. A conservative design would never specify armor weights usingvery high stability coefficients, such that the non-interlocked armor stability wassignificantly different from the interlocked stability, because of the risk ofcatastrophic failure. Therefore, based on 2-D testing reported herein, aconservative K~ of 16 is recommended for core-loc used on a breakwater trunk.It is clear from these tests there should be considerable reserve stability beyondthe design wave or when repeatedly subjected to the design wave.
Researchers made note of the fact that the units showed almost no movementon the slope, including in-place rocking, It seems likely that the units wouldtherefore have a very low probability of experiencing impact stresses. Also,reflection coefficients from the core-loc slope ranged from the same to no morethan 5 percent less than those of dolosse, indicating that existing dolos reflectionand runup design information could be used for preliminary estimation ofreflection and runup on core-loc slopes.
Chapter 4 Core-Lot Hydraulic Stability 19

Noyo, CA, Site-Specific Stability Tests
Smith et al. (1994) earned out three-dimensional stability tests of a core-locarmor layer for a site-specific test of the offshore Noyo, California, Harborbreakwater. This site is subjected to depth-limited 7-to 9-m (23-to 30-ft) wavesrepeatedly each winter and the breakwater is subjected to very high flowvelocities due to wave focussing from several surface-piercing pinnacles just offthe seaward toe. Noyo therefore provided a very severe test of core-loc stability.
Three-dimensional stability tests of the Noyo breakwater were carried out ata geometrically undistorted scale of 1:50 with molded bathymetry usingirregular waves. The model offshore breakwater was scaled from prototypedimensions of 122 m (400 ft) length between two round head centers and initialcrown widths of 29 m (95 ft) on the large head, 20 m (66 ft) on the small head,and 7 m (23 ft) between the heads. The initial armoring was 20-tonne (22-ton)accropodes on the small, more landward head and 33-tonne (37-ton) accropodeson the larger, more seaward head. The slope of the breakwater was lV: 1.5H andprototype specific gravity was 2.34. The initial storm series consisted of 17 testsof 15 min each with a succession of 13-, 17-, and 20-sec peak period waves ofincreasing significant wave heights from 3.4 to 8.4 m (11 ft to 28 ft) (Storm I).The maximum wave height was depth-limited and the shallow-water spectrawere full y saturated.
The accropode toe repeatedly failed due to erosion of the toe apron at higherwave heights in the design storm series. Upon further testing of higher waves,the main armor would fail. Various toe apron configurations were tried but noneprovided toe stability for the entire storm series. The armor was stable with nodamage if the toe was firmly scotched with a metal strip around the entirestructure. The structure was stable when additionally subjected to the 10 highestwave height tests in the Storm I series (Storm IA).
Since the original breakwater layout prescribed would not meet the requiredeconomic benefit-to-cost ratio, the breakwater footprint was reduced to a-rninimum with a 9-m (29-ft) crown width on the large head and a 6-m (20-ft)crown width over the remainder of the breakwater. A toe apron configurationwas found that was stable for at least two successive storm events with this newconfiguration. In addition to the accropode sizes tested previously, core-lots atweights of 28 and 16 tonnes (31 and 18 tons) were also tested. These units hadapproximately 15 percent less volume per unit than the accropode previouslytested and the core-loc armor layer had approximately 19 percent less totalvolume than the accropode layer.
20
Although the accropodes were placed by hand according to the techniqueprescribed by Sogreah, Inc. representatives, several placement techniques weretested for the core-lots. These included selective hand placement, non-selectivehand placement, and slinging the units with a small string or cable. Theselective hand placement technique proved to be more stable because the unitorientations were optimized. But it is doubtful that quality control measures
Chapter 4 Core-Lot Hydraulic Stability

could ever be employed to match this placement in the field. Dynamicplacement, where the units were dropped from a small height in order topromote wedging, was tried. This method is probably more effective withhigher friction prototype concrete units. With the plastic model units noadvantage to using this method could be observed. The two techniques used forthe majority of the tests were non-selective hand placement and sling placement.For these methods, if a unit was mistakenly dropped or if it rolled during release,it was left in place. By placing each unit with a small string in a slingingfashion, to simulate crane placement, a more realistic representation ofprototype placement was realized. No discemable difference in the performanceof the armor layer was noted for these two methods.
Both accropodes and core-lots were stable for two successive Storm IA waveseries. Both required rehabilitation after being subjected to an additional threeStorm IB series, each consisting of the highest three waves in Storm I. In otherwords, neither armor was stable when subjected to the five successive storms. Itappeared that the primary damage was instigated by toe instability, althoughlesser unraveling did occur in areas of wave focussing. The Hudson stabilitycoefficient corresponding to the larger core-loc was 28 for the highest HI,10in theseries and 13 for the highest H~. The corresponding accropode stabilitycoefficients were 23 and 11, respectively. During the tests it was noted that thecore-loc toe scoured less than the accropode toe. This was due to the muchhigher wave energy dissipation and therefore reduced runup and overtoppingvelocities on the core-loc layer.
Accropode armor weight was increased to 48 tonnes (53 tons) for the largehead. This armor layer lost several units but was considered stable for asuccession of five Storm IB series. The stability coefficients for this largeraccropode were 16 for H1,10and 8 for H~.
The design waves tested above were considered to be quite conservative, so asomewhat more realistic wave condition also was tested. The final storm seriesconsisted of a five-Stmm-IB sequence, except that the 20-see, 8.4-m (28-ft) testwas omitted from the middle three series. The 28- and 16-tonne (31- and 18-ton) core-lots were stable for this sequence of storms, with four units or 0.4percent displaced.
In summary, both core-lots and accropodes were stable for high stabilitycoefficients when subjected to the repeated attack of very high energy designstorm events. However, the final stable core-loc structure had 19 percent lessconcrete than the stable accropode armor layer. The core-loc structure also metthe required economic benefit-to-cost ratio and therefore was accepted as thefinal design.
As a final comment, no evidence of massive failure of the “single layer” core-10Cunits was evident in these tests. After the toe apron eroded and the toe armorbecame mobile, the armor layer would begin to loosen gradually. Even aftersignificant instability of the units, the slope destabilization rate was gradual.Rapid failure of other single layer armor has been noted on other studies but
Chapter 4 Core-Lot Hydraulic Stability 21

22
only at wave heights greatly exceeding the non-interlocked stability threshold(van der Meer 1988). The Noyo tests confirmed that, for high stability units,such as the core-lot, the failure rate is a function of armor interlocking ratherthan the layer thickness and significant darnage occurs only at high stabilitycoefficients.
Chapter 4 Core-Lot Hydraulic Stability
5 Core-Lot Repair of DolosLayers
A short series of two-dimensional stability tests was conducted to determinethe comparative stability between dolos, core-lot, and a dolos slope repairedwith core-lots. The tests were performed in shallow water with a 1.5-m-wide(5-ft-wide) fronting reef in a 0.6-m-wide (2-ft-wide) flume. The structure was17 cm (6.7 in.) high with a front slope of lV: 1.5H. Monochromatic waves weregenerated, producing a maximum incident wave height of 22 cm (8,7 in.) andperiod of 3.75 see in a depth of 17 cm (6.7 in.) at the structure. A very highwave height-to-depth ratio occurred at the structure because the fronting reefwas narrow relative to the wavelength; therefore, wave height was not stabilizingbefore it hit the structure. Approximately 180 waves were generated per run.The number of wave cases and complexity of this experiment were kept to aminimum for this proof-of-concept test.
The first series of tests utilized 82 core-lots placed at a packing density of0.54. The armor unit mass was 104 g (0.23 lb). For these tests, only a singleunit was displaced more than one characteristic armor length, even though theincident waves were very severe. The no-damage Hudson stability coefficientfor this monochromatic wave case was approximately 72.
The second series of tests utilized 97 dolosse placed at a packing density of0.83. The armor unit mass was 125 g (0.27 lb). For these tests, 15 units weredisplaced and most of the dolosse were mobile during the tests. The Hudsonstability coefficient for this case was approximately 61, but representedexcessive damage (15 percent displacement).
For the third series of tests, the damaged dolos slope was repaired with
15 core-lots. The repair units were 145 g (0.32 lb) and were placed ratherhaphazardly along the toe and in two pockets on the slope. The remaining
dolosse were not touched. This is not a recommended repair procedure butrepresents a worst-case emergency spot repair. For this test series, three core-10CSwere displaced off the slope and three additional dolosse were displaced. Itwas noted that, where placed in groups, the core-lots had interlocked and
stabilized the original darnaged regions on the slope. The displaced units werelone repair units placed near the cap and were never interlocked. For an actual
Chapter 5 Core-Lot Repair of Dolos Layers 23

24
repair, the existing armor near the repair region would be removed from theslope so the core-lots could be interlocked with these units as they were placed.It is expected that this more carefid repair procedure would have resulted in amuch more stable armor layer.
Although very brief, these tests showed that the core-loc-repaired areas werequalitatively more stable than the original dolos slope, and the higher structuralstrength of the core-loc further justify its use as a repair unit for dolos slopes.More extensive tests are being done to systematically quantify the stability of acore-loc-repaired dolos slope and to determine the most effective repairmethods.
Chapter 5 Core-Lot Repair of Dolos Layers
6 Armor Volume Comparison
The cost of an armor layer, for a given structure, depends primarily on thevolume of concrete on the slope, number of units, unit material cost, and the unitconstruction costs. The unit construction costs include casting yard, transport,and placement costs. Yard costs include construction of forms; unit pouring,storage, and handling; and the cost of equipment necessary to handle the units.Per unit yard costs will increase with unit size but decrease with the number ofunits, due to economies of scale. Per unit transport costs are due to costsassociated with trucking the units and, sometimes, barging the units to the site,and are a function of the unit size. Unit placement costs include rental of craneand are primarily a function of the time required to place each unit. Obviously,larger units will cost more to place than smaller units. For a given constmctiontechnique and armor type, the construction costs are primarily a function of thesize and number of armor units.
The cost optimization can be fine-tuned by adjusting the armor unit size. Thetotal volume of armor material onslope is proportional to V1’3while the numberof units is proportional to V-2’3.Using these relationships, the total cost of anarmor layer can be minimized for a given small range of armor sizes, where theconstruction equipment required and the handling time per unit do not varysubstantially. The question of whether to go with more smaller units or lesslarger units is complex depending on the type of equipment available, number ofunits, handling time per unit, material cost, and the construction process. Theseconstruction cost items are site specific and not within the scope of this report.
But the total armor material volume dominates the armor layer cost andtherefore should be minimized by maximizing the porosity and minimizing thearmor layer thickness. Of course, if the crest height is to be maintained, then asthe armor layer thickness is reduced the core height must be increased. On theother hand, if we assume that the core height and underlayer thickness are fixed,then the armor layer runup performance becomes very important. In thefollowing analysis, we assume that the core and underplayerheights are constantso that we can focus on the armor volume comparison. This is reasonable forcomparing other armor to a core-be layer because the core-loc layer hasexcellent wave energy dissipation characteristics, similar to that of a dolos layer.But for design, the effects of variation in crest height between armor layers mustbe considered.
Chapter 6 Armor Volume Comparison 25

The text that follows gives the gross cost minimization for various armorunits based on total armor layer volume for a given slope area. This informationshould be helpful in comparing the various types of armor shapes. Values forHudson stability coefficients (K~s) and packing densities in Table 6 are per the1984 SPM for dolosse, tetrapods, tribars, and stone; for accropodes,recommended values from Sogreah informational reports are used; and Core-lotK~’sare conservatively taken from both 2-D and 3-D physical model studies asdiscussed previously in this report. K~’s listed in Table 6 are for breaking wavesthat occur on the appropriate structure slopes. Please note the comments foreach armor type.
For the onslope concrete volume comparison, several “correction ratios” arecalculated in order to find the ratio between the total volume of concrete for agiven type of armor unit to that of the core-loc. For this comparison core-locplaced on a IV: 1.5H slope will be used to “normalize” the ratios to bedeveloped. To develop a relationship for total volume required, the Hudsonequation is expressed in terms of volume instead of weight. This gives thevolume of a stable armor unit. The volume of concrete in the armor layer canthen be expressed in terms of unit volume by multiplying the number of units Nby the individual unit volume VUni,. Also, by inserting the proper slopecorrection ratio Sumi\Sc.~all volumes can be related to the lV: 1.5H core-loc layerby
(6)
For the concrete armor units listed in Table 6, the individual parametercorrection factors in Equation 6 are provided in Table 7. Using Equation 6 andthe correction factors of Table 7, a rational comparative approximation of thetotal volume of concrete needed to construct a particular armor section ascompared to a section constructed of core-lots built on a IV: 1.5H slope can bemade. These calculations are summarized in Table 8 and graphically illustratedin Figure 10.
26Chspter 6 Armor Volume Comparison

Table 6Armor Unit Stability Coefficients (K~a)
Breaking Waves
Armor Unit Structure Slope Packingcots Density K KDTJ
4 He% Trunk
Core-Lot 1.5 0.580 i 13C 16d
Core-Lot 2 0.580t 13 “e 16 “e
Tribar-ub 2 0.599 7e 12e
Tnbar-ub 5 0.599 7.5 e 12
Tribar 1.5 0.938 8.3 e 9e
Tribar 2 0.938 7.8 e 9e
Tnbar 3 0.938 6 9’
Dolos 1.5 “f 0.827 7e,f
16 ‘“f
Dolos 2 0.827 8e 15.8
Dolos 3 0.827 7e 16a
Accropode 1.5 0.650 ,09 ,09
Accropode 2 0.650 log ,09
Tetrapod 1.5 1.040 59 7
Tetrapod 2 1.040 4.5’ 7
Tetrapod 3 1.040 3.5e 7’
Stone h 2 1.260 1.6e 2
Stone h 3 1.260 1.3 2e
COMMENTS:a) Values are based on no-damage criteria (c5% displacement) and minor overtopping (SPM1984).b) U designates uniform, laid-up placement. All other units are random placament.c) These values were exceeded in the site-specific Noyo, CA, model study.d) Conservatively based on over 500 2-D tests where ~ ranged from 200 to 400 (<1%displacement, no rocking).e) Unsupported by model testa and are only provided for preliminary design purposes (SPM1984).f) Stabilityof dolosseon slopessteeper that 1V:2H shouldbe substantiatedby site-specific modeltests (SPM 1984).g) These values are from Sogreah informational brochure but no delineation is provided forvarious slope angles.h) Rough angular stone
i) Packing density coefficient adlusted to meet mid-ranae armor size.
Chapter 6 Armor Volume Comparison 27
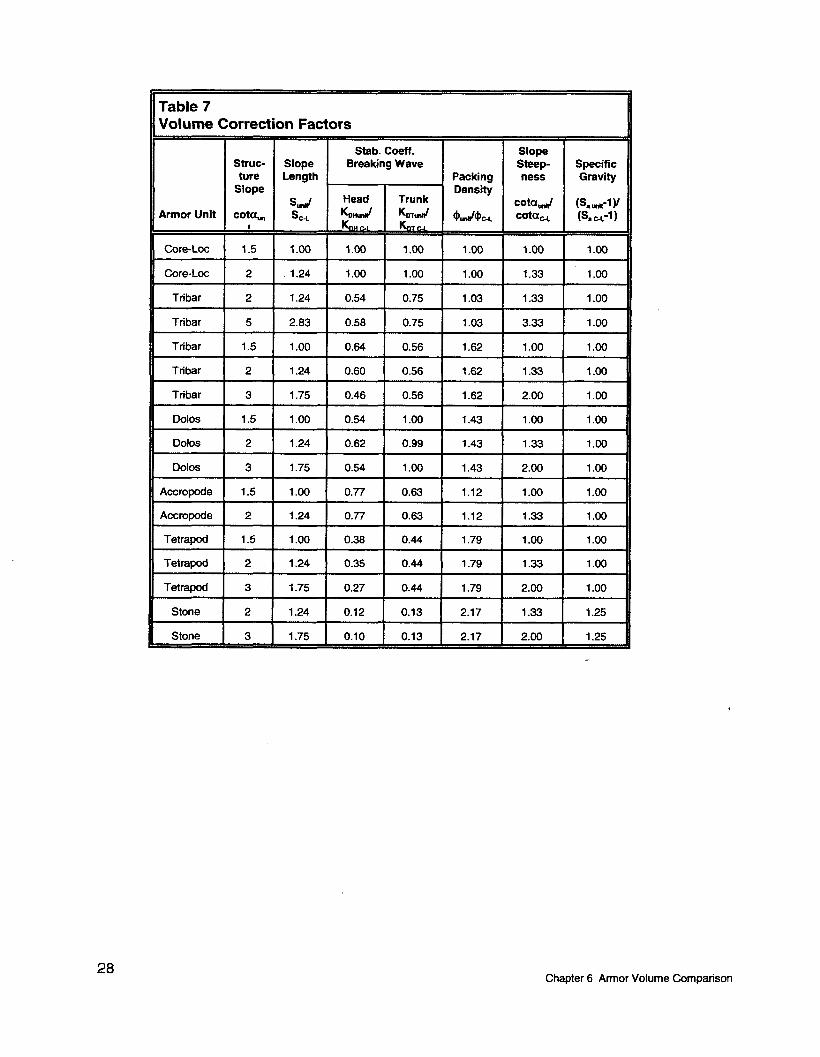
Table 7Volume Correction Factors
Stab. Coeff. slopestruc- Slope Breaking Wave steep- Specifictura Length Packing ness Gravity
Slope Densitys~ Head Trunk
KO~ Kw~cota~ (sa*-l )/
Armor Unit colam s= @d@GL cotatiI K.. ~
(Sa.+-l)b,,.
Core-Lot 1.5 1.00 1.00 1.00 1.00 1.00 1.00
Core-Lot 2 1.24 1.00 1.00 1.00 1.33 1.00
Tribar 2 1.24 0.54 0.75 1.03 1.33 1.00
Tnbar 5 2.83 0.58 0.75 1.03 3.33 1.00
Tribar 1.5 1.00 0.64 0.56 1.62 1.00 1.00
Tnbar 2 1.24 0.60 0.56 1.62 1.33 1.00
Tribar 3 1.75 0.46 0.56 1.62 2.00 1.00
Dolos 1.5 1.00 0.54 1.00 1.43 1.00 1.00
Dolos 2 1.24 0.62 0.99 1.43 1.33 1.00
Doios 3 1.75 0.54 1.00 1.43 2.00 1.00
Accropode 1.5 1.00 0.77 0.63 1.12 1.00 1.00
Accropode 2 1.24 0.77 0.63 1.12 1.33 1.00
Tetrapod 1.5 1.00 0.38 0.44 1.79 1.00 1.00
Tetrapod 2 1.24 0.35 0.44 1.79 1.33 1.00
Tetrepod 3 1.75 0.27 0.44 1.79 2.00 1.00
Stone 2 1.24 0.12 0.13 2.17 1.33 1.25
Stone 3 1.75 0.10 0.13 2.17 2.00 1.25
28Chapter 6 ArmorVolume Comparison

Table 8Armor Volume Comparison for Breaking Waves
Structure Slope Head Volume Ratio Trunk Volume RatioArmor Unit cotati ‘H uIflT C-1. VTU#r c<
Core-Lot 1.5 1.00 1.00
Core-Lot 2 1.13 1.13
Tribar-u 2 1.40 1.28
Tribar-u 5 2.35 2.15
Tnbar 1.5 1.88 1.96
Tnbar 2 2.16 2.21
Tnbar 3 2.91 2.73
Dolos 1.5 ! 1.75 ! 1.43I
Dolos I 2 I 1.89 I 1.61
Dolos 3 2.44 1.99
Accropode 1.5 1.22 1.31
Accropode 2 1.38 1.48
Tetrapod 1.5 2.47 2.36
Tetrapod 121 2.88 I 2.66
TetrapodI 3 I 3.87
I3.29
Stone 121 3.95 I 3.93
Stone I 3 I 572 I d 86
3
2.5
<2
>-0.5
t /0 Head iWTrunk ]
/’... ..............—"-"-"-""""""`""""-"-`--"""""""...................... .............,.
-1
0Core-lot Dolos Tetrapod
Accropode Random Tribar -—.—
Figure 10. Required armor layer volumes relative to core-loc for breaking waveson 1V:l .5H sloped structure heads
Chapter 6 Armor Volume Comparison

7 Conclusions
A new series of coastal rubble structure concrete armor units called core-lochas been developed. The characteristics of the core-loc units can be summarizedas follows:
a. The core-loc units have been designed to be placed randomly in a single-unit-thickness layer on steep or shallow slopes.
b. The core-loc shapes have been optimized to maximize hydraulicstability, porosity, wave energy dissipation, unreinforced strength, andreserve stability, but minimize onslope volume and casting yard space.
c. Core-Lot is designed to interlock well with dolosse so that it can be usedas a repair unit.
d. Finite element studies of core-loc showed maximum flexural tensilestresses to be 46 percent, 74 percent, and 33 percent those of dolos,accropode, and tribar, respectively. Torsional stresses were 54 percent,74 percent and 38 percent those of dolos, accropode, and tribar,respective] y.
e. Initial two-dimensional hydraulic stability tests of the core-loc shapeindicate that the unit is one of the most stable randomly placed armorunits ever tested, withstanding breaking wave heights 5 to 7 times themaximum dimension of the unit on slopes of 3V:4H and 1V:5H. The -no-rocking no-damage Hudson stability coefficients for these testsvaried widely depending on the period and wave generation capabilitiesof the flumes, but were consistently over 150.
J Initial site-specific three-dimensional stability tests of the Noyo, CA,breakwater showed that, under repeated attack of severe breaking-wavestorm events, the core-loc was stable for a Hudson stability coefficientof 13, based on H~and less than 1 percent displacement. The units wereplaced using a technique that simulated placement by a crane in theprototype.
30Chapter 7 Conclusions

g. Initial hydraulic stability tests of dolos armor layers repaired with core-10Cshowed core-loc to be an effective repair unit of dolos slopes from ahydraulic stability point of view, without the inherent structuralweakness of dolosse.
h. Preliminary no-rocking, no-damage design stability coefficients forcore-lots are conservatively suggested to be 16 for trunk sections and 13for head sections, based on H~. No differentiation of stability coefficienthas been made for breaking or nonbreaking waves or other parameters inthe Hudson equation.
i. Finally, it is shown that core-loc layers require significantly lessconcrete than layers composed of other, randmly placed armor units.
Chapter 7 Conclusions 31

References
Brown, C. T. (1983). “Seabees in service.” Proc. Coastal Structures ’83,American Society of Civil Engineers, New York, 235-258.
de Rouck, J., Hyde, P., van Damme, L., and Wens, F. (1994). “Basiccharacteristics of the HARO@,a massive hollow armour unit.” PZANCBulletin 82,5-19.
Goda, T., and Suzuki, Y. (1976). “Estimation of incident and reflected waves inrandom wave experiment .“ Proc. 15fh Coast. Engrg. Con. American Society
of Civil Engineers, 828-848.
Melby, J.A., and Howell, G. L. (1989). “Incorporation of prototype dolos staticresponse in a dolos design procedure. ” Proc., IAHR XXHZ Congress, Ottawa,Canada.
Melby, J.A., and Turk, G.F. ( 1992). “DO1OSdesign using reliability methods.”Proc. 23rd ICCE, American Society of Civil Engineers, New York.
Melby, J.A., and Turk, G.F. (1995). “Concrete armor unit performance in light ofrecent research results.” ASCE/WPC.0 Sem. on Case Histories of Des[gn,Constr., aria’Maint. of Rubble Mound Strw. American Society of CivilEngineers, New York.
Richter, R.J. (1988). “New methods of constructing scale model armor units. ”Contract Repofi CERC-88- 1, U.S. Army Engineer Waterways ExperimentStation, Vicksburg, MS.
Shore protection manual. (1984).4th cd., 2 Vol, U.S. Army Engineer WaterwaysExperiment Station, U.S. Government Printing Office, Washington, DC.
Smith, E.R., Cole, J., Bonigut, T., and Hennington, L. (1995). “Stability tests ofproposed breakwater at Noyo, California.” ASCEYWPCO Sem. on CaseHistories of Design, Constr., and Maint. of Rubble Mound Strut. AmericanSociety of Civil Engineers, New York.
32References

Sogreah (1996). “ACCROPODE.” Informational brochure, Sogreah, Inc.,Grenoble, France.
Stevens, J.C., et al. (1942). “Hydraulic models,” Manuals on Engrg. PracticeNo. 25, American Society of Civil Engineers, New York.
Turk, G.F., and Melby, J.A. (1997). “CORE-LOC concrete armor units:technical guidelines,” Misc. Paper CHL-97-?, in publication, USAEWaterways Experiment Station, Vicksburg, MS.
Van der Meer, J. (1988). “Stability of cubes, tetrapods, and accropode.” Design
of breakwaters. Thomas Telford Limited, London, 71-80.
Wilkenson, A.R., and Allsop, N.W.H. (1983). “Hollow block breakwater arrnourunits. ” Proc. Coastal Structures ’83, American Society of Civil Engineers,New York, 208-221.
References 33

Appendix AInitial Core-Lot HydraulicStability Results
A complete listing of the wave generation and wave height data acquired isprovided in Table Al. Wave height data were acquired from the three-gageGoda array positioned in shallow water. Wave heights were verified by visualinspection of a ruler gage mounted on the flume wall. In the table, wave heightsand depths are in feet and wave periods are in seconds.
Fable Alnitial ~
No. ofRuns
1111111111122
~bility1
Gain
40424446485052565860626466
stDataI I
Depth stToa
h
ft(nl=rr
0.s04s)
1.50
-LWave Wava
Pariod at Pariod atBoard Gage
T 102
sec sac
1.5 1.421.431.441.441.401.381.381.411.391.401.361.38~
IncidentWaveHeight
H,
ft(Ill=fr0.304s)
0.720.750.790.820.850.890.920.980.980.991.121.171.21
LReflection Hudson
coeffi- Stsbilitycient Coaff
R K~
0.29 -0.310.310.320.330.330.320.300.360.380.24 1390.23 1590.23 175
AppendixA Initial Cors-Loc HydraulicStabilityResults Al

rable Alnitial $
543333333333332
111111111111111111111111
111111111
111
ibility 1
404244464850525456586062646668
464850525456586062646670727476788082848688909294
656870747882869094
808894
st Data
1.5C
1.25
1.25
1.25
2.0
1.5
1.75
2.0
1.911.921.911.881.871.871.851.851.831.821.791.801.771.801.78
1.431.451.441.401.371.371.421.391.371.351.351.361.291.301.341.341.301.281.281.281.251.241.261.26
1.561.551.581.671.681.611.521.491.58
1.901.961.96
0.61o.&0.670.7(0.7:o.7f0.7$0.820.8~
0.870.9C0.940.971.011.04
0.780.8C0.840.870.910.940.960.961.001.031.081.181.241.231.221.281.321.331.351.381.381.411.451.48
0.820.870.880.941.021.081.091.121.18
0.891.001.01
0.490.500.500.510.520.520.520.530.530.540.540.520.520.500.51
0.320.340.340.360.370.370.370.370.350.320.300.280.310.340.330.300.310.320.290.280.280.270.270.27
0.500.500.510.500.490.490.520.500.38
0.550.520.51
102111
243260260277302321
139163
102
A2Appendix A Initial Core-Lot Hydraulic Stability Results
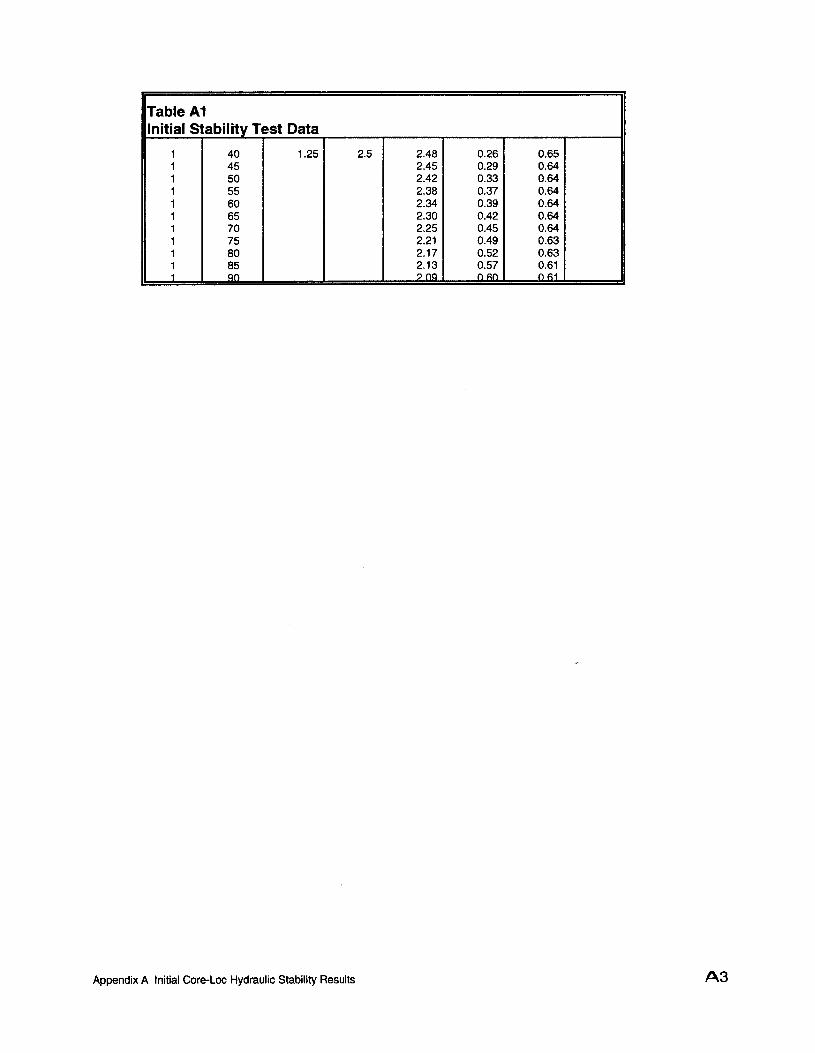
ialStabilityTestData
1 40 1.25 2.5 2.48 0.26 0.651 45 2.45 0.29 0.641 50 2.42 0.33 0.841 55 2.38 0.37 0.641 60 2.34 0.39 0.641 65 2.30 0.42 0.641 70 2.25 0.45 0.841 75 2.21 0.49 0.631 80 2.17 0.52 0.631 85 2.13 0.57 0.61i Qo 709 060 061
Appandix A initial Core-Loc Hydraulic Stability Results
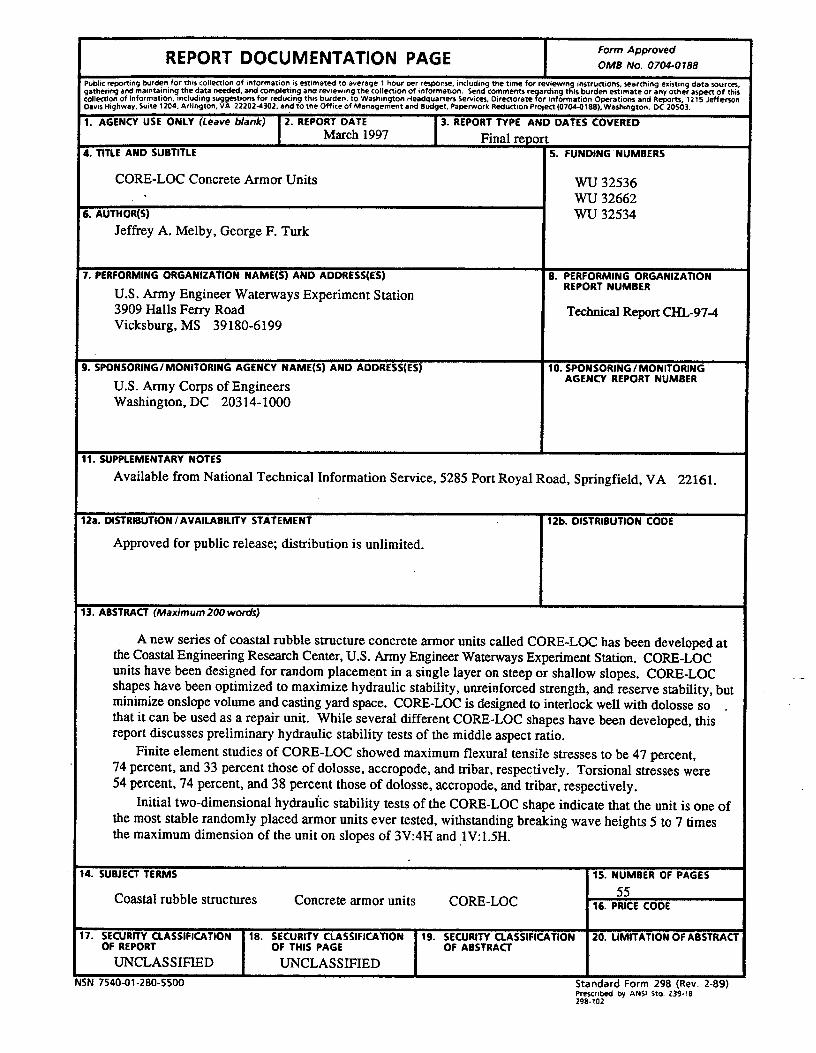
REPORT DOCUMENTATION PAGEForm Approved
OMB No. 0704-0188
Public reporting burden, for this collection of information,,$ .?Wmated to average 1 hour per response, including the time for reviewing instrucoons, searchingemtmgdatasources,gathering and mainta!nmg the data needed: and comdaqng and rwwlng the collecvon of mformatlon. Send comments r arding this burden estimate or any other aspect of this
7collactioo of infwmatlon. mchfdmg suggestmns for reducing this burden. to Washington Headquarters Serwcas, Dwsctofate or Informamon Operations and Reports. 1215 JeffersonDavis Highway. SuNe 1204. Arlington, VA 22202-4302, and to the Office of Management and 9vdget, Paperwork Reduction Project (0704-01 SS), Washington, DC 20S03.
1. AGENCY USE ONLY (Leave blank) 3. REPORT TYPE AND DATES COVERED
& TITLE AND SUBTITLE 5. FUNDING NUMBERS
CORE-LOC Concrete Armor Units WU 32536. WU 32662
& AUTHOR(S) WU 32534
Jeffrey A. Melby, George F. Turk
7. PERFORMING ORGANIZATION NAME(S) AND ADDRESS(ES) 8. PERFORMING ORGANIZATION
U.S. Army Engineer Waterways Experiment StationREPORT NUMBER
3909 Halls Ferry Road Technical Report CHL-97-4Vicksburg, MS 39180-6199
}.SPONSORING/ MONITORING AGENCY NAME(S) AND ADDRESS(ES) 10. SPONSORING / MONITORING
U.S. Army Corps of EngineersAGENCY REPORT NUMBER
Washington, DC 20314-1000
Il. SUPPLEMENTARY NOTES
Available from National Technical Information Service, 5285 Port Royal Road, Springfield, VA 22161.
12a. DISTRIBUTION /AVAILABILITY STATEMENT 12b. DISTRIBUTION CODE
Approved for public releasq distribution is unlimited.
13. ABSTRACT (Maximum200 words)
A new series of coastal rubble structure concrete armor units called CORE-LOC has been developed atthe CoastalEngineering Research Center, U.S. Army EngineerWaterwaysExperiment Station. CORE-LOCunits have been designed for random placement in a single layer on steep or shallow slopes. CORE-LOCshapes have been optimized to maximize hydraulic stability, unreinforced strength, and reserve stability, butminimize onslope volume and casting yard space. CORE-LOC is designed to interlock well with dolosse so .that it can be used as a repair unit. While several different CORE-LOC shapes have been developed, thisreport discusses preliminary hydraulic stability tests of the middle aspect ratio.
Finite element studies of CORE-LOC showed maximum flexural tensile stresses to be 47 percent,74 percent, and 33 percent those of dolosse, accropode, and tribar, respectively. Torsional stresses were54 percent, 74 percent, and 38 percent those of dolosse, accropode, and tribar, respectively.
Initial two-dimensional hydrauiic stability tests of the CORE-LOC shape indicate that the unit is one ofthe most stable randomly placed armor units ever tested, withstanding breaking wave heights 5 to 7 timesthe maximum dimension of the unit on slopes of 3V:4H and ,lV: 1.5H.
14. SUBJECT TERMS 15. NUMBER OF PAGES
Coastal rubble structures Concrete armor units CORE-LOC55
16. PRICE CODE
17. SECURITY CLASSIFICATION 18. SECURITY CLASSIFICATIONOF REPORT
19. SECURITY CLASSIFICATION 20. LIMITATION OF ABSTRACTOF THIS PAGE OF ABSTRACT
UNCLASSIFIED UNCLASSIFIED------- ----- ----3N 154U-U1 -2 UU-5500 Standard Form 298 (Rev. 2-89)
Prescnbad ty ANSI Std, 239.18298-102
![23/04/2020 - BOLLETTINO UFFICIALE DELLA REGIONE LAZIO - N ... · N. % PERDITA DICHIARATA loc,ca loc,ctl loc,ctl loc.cû loc,ctl loc,cr.] PROT. GECO AVVISO PUBBLICO "Sostegno alle](https://img.pdfslide.net/doc/110x75/5f335f564c0d0c752b068808/23042020-bollettino-ufficiale-della-regione-lazio-n-n-perdita-dichiarata.jpg)