Embed Size (px)
Citation preview
©2017 CoreLogic, Inc. All rights reserved. Proprietary.
CoreLogic Wildfire Risk Analysis
Dr. Thomas C. Jeffery, Ph.D.
©2017 CoreLogic, Inc. All rights reserved. Proprietary.
Agenda
Wildfire Risk
Opportunity and Ability
CoreLogic Wildfire Analysis
Determining wildfire risk
What the analysis does and doesn’t do
2
©2017 CoreLogic, Inc. All rights reserved. Proprietary.
Wildfire Risk
All vegetation is fuel but not all fuel is a wildfire risk
Wildfire risk is based on the opportunity and ability of burning fuel
to ignite a structure
Opportunity = will the burning fuel come into contact with the
structure?
Ability = will the burning fuel release enough heat energy to cause
ignition?
3
©2017 CoreLogic, Inc. All rights reserved. Proprietary.
CoreLogic Wildfire Risk Analysis
Evaluates the risk on the property
Evaluates the risk near the property
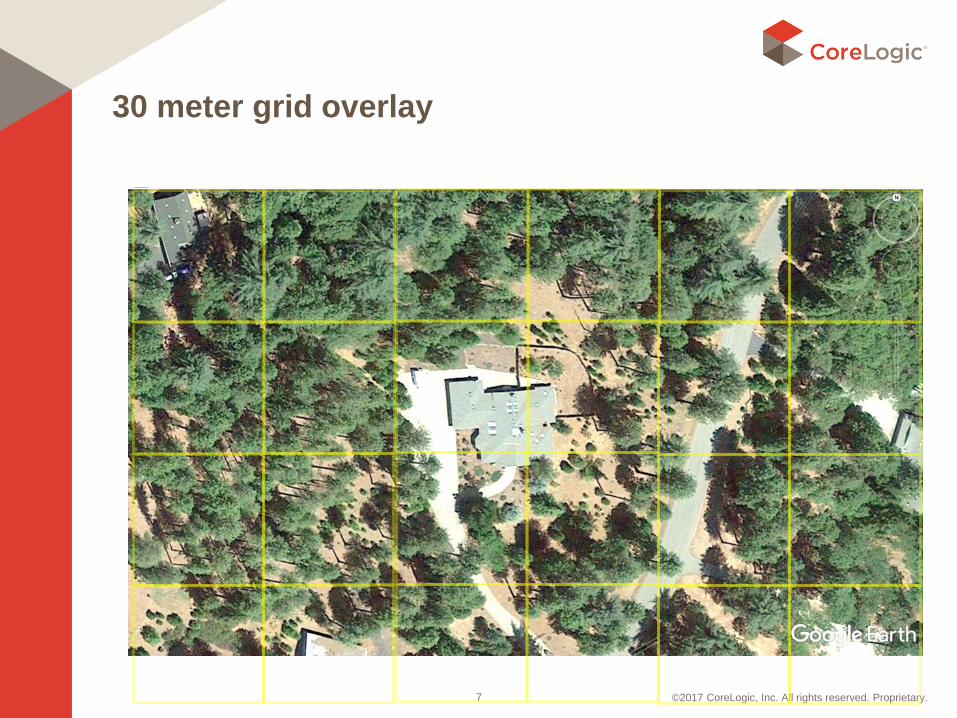
Granularity is a key component to accuracy (30 meter grid)
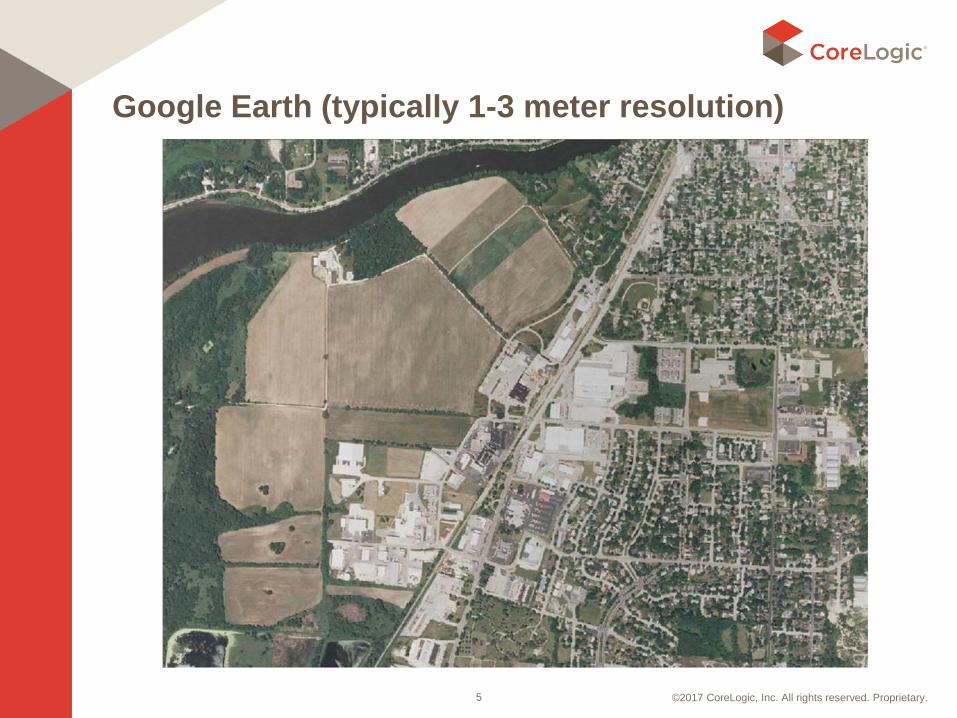
30 meter resolution is not what you see on Google Earth
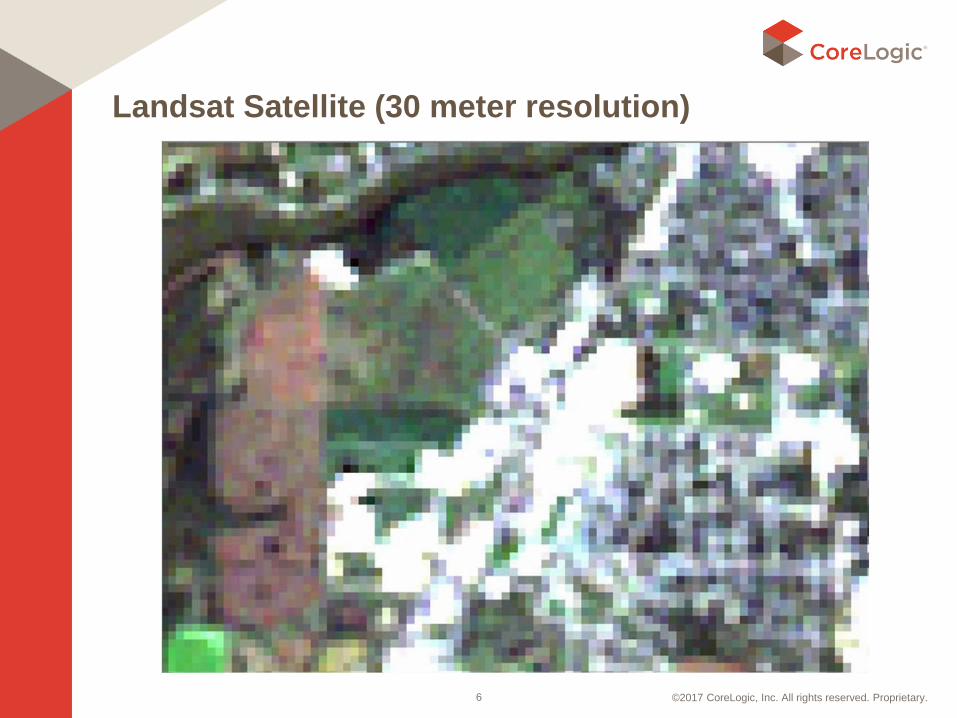
In addition, the Satellite does not “see” under tree canopy
4
©2017 CoreLogic, Inc. All rights reserved. Proprietary.
Google Earth (typically 1-3 meter resolution)
5
©2017 CoreLogic, Inc. All rights reserved. Proprietary.
Landsat Satellite (30 meter resolution)
6
©2017 CoreLogic, Inc. All rights reserved. Proprietary.
30 meter grid overlay
7
©2017 CoreLogic, Inc. All rights reserved. Proprietary.
CoreLogic Wildfire Risk Analysis
Brushfire Categories identify risk at a specific location based upon
Conditions at a single geographic point Terrain (slope & aspect)
Fire history
Fuel
8
©2017 CoreLogic, Inc. All rights reserved. Proprietary.
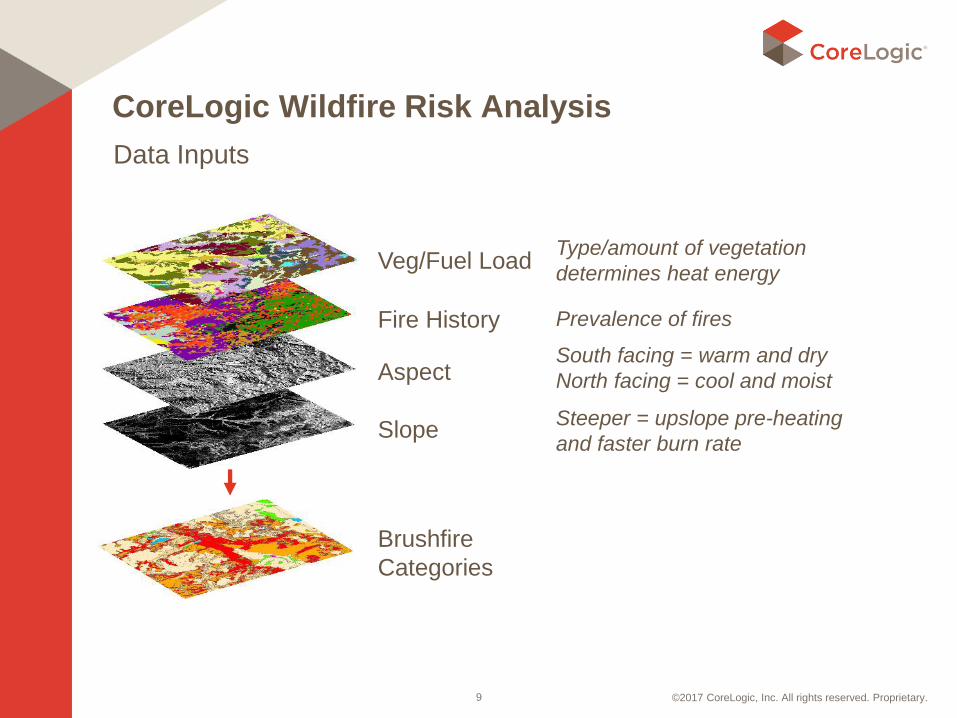
CoreLogic Wildfire Risk Analysis
Data Inputs
9
Type/amount of vegetation
determines heat energy
South facing = warm and dry
North facing = cool and moist
Prevalence of fires
Steeper = upslope pre-heating
and faster burn rate
Fire History
Veg/Fuel Load
Aspect
Slope
Brushfire
Categories
©2017 CoreLogic, Inc. All rights reserved. Proprietary.
CoreLogic Wildfire Risk Analysis
Wildfire Risk Score adds surrounding risk
Combines the Category-based risk + Distance to wildland +
Distance to nearest High risk
10
©2017 CoreLogic, Inc. All rights reserved. Proprietary.
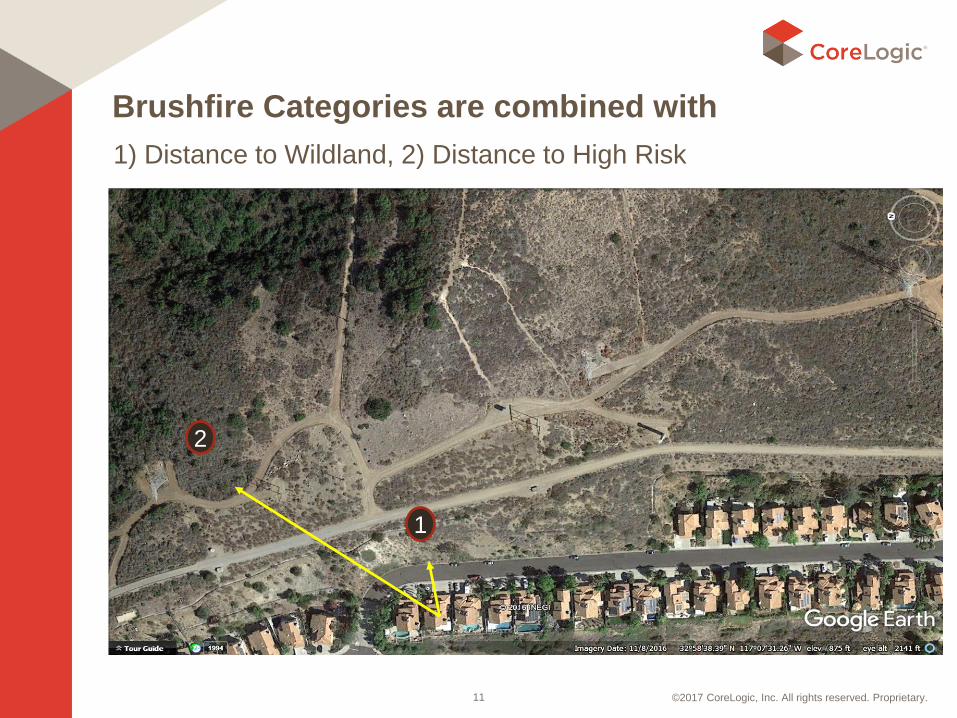
Brushfire Categories are combined with
1) Distance to Wildland, 2) Distance to High Risk
11
1
2
©2017 CoreLogic, Inc. All rights reserved. Proprietary.
What this type of risk analysis does
Identifies risk based on a granular 30 meter (~ 100 foot) grid.
Calculates distance to nearest High risk
Combines on-site risk with nearby risk
Holistic interpretation of direct flame contact, radiant, and ember
Incorporates changes to fuel/vegetation annually
12
©2017 CoreLogic, Inc. All rights reserved. Proprietary.
What it does not do
Does not include meteorology (rain, humidity, temperature)
Does not evaluate structural mitigation
Wire mesh over attic vents
Dead debris on roof or eaves
Siding/roofing material
Does not evaluate small scale changes to fuel/vegetation
Brush clearing immediately around home
Does not include road network
Does not include location of fire stations
Does not determine probability of fire or use fire simulations
13
©2017 CoreLogic, Inc. All rights reserved. Proprietary.
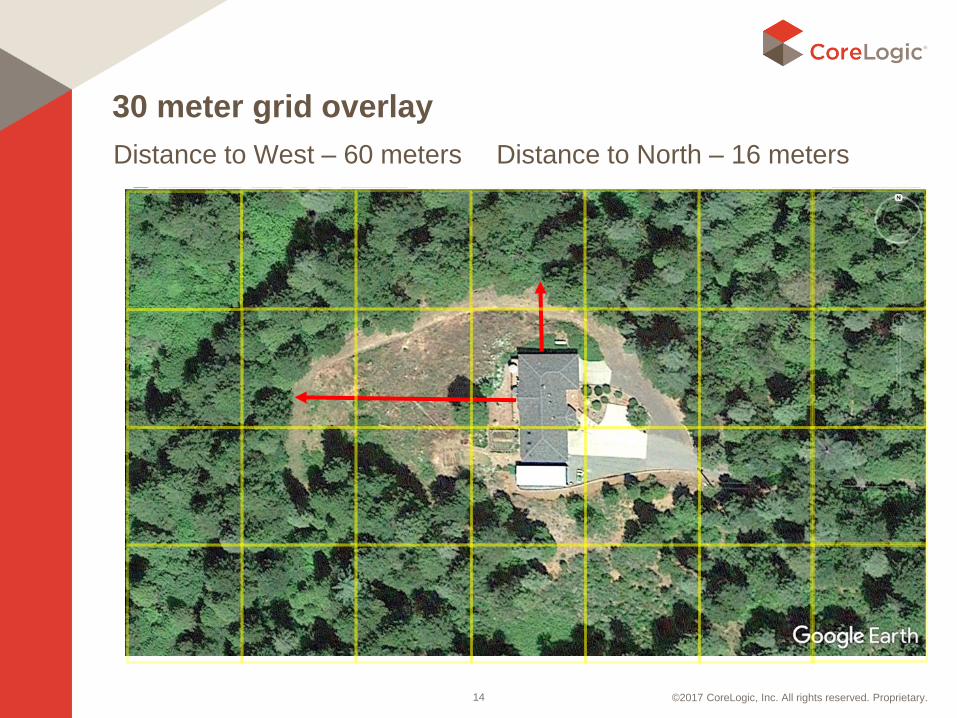
30 meter grid overlay
Distance to West – 60 meters Distance to North – 16 meters
14
©2017 CoreLogic, Inc. All rights reserved. Proprietary.
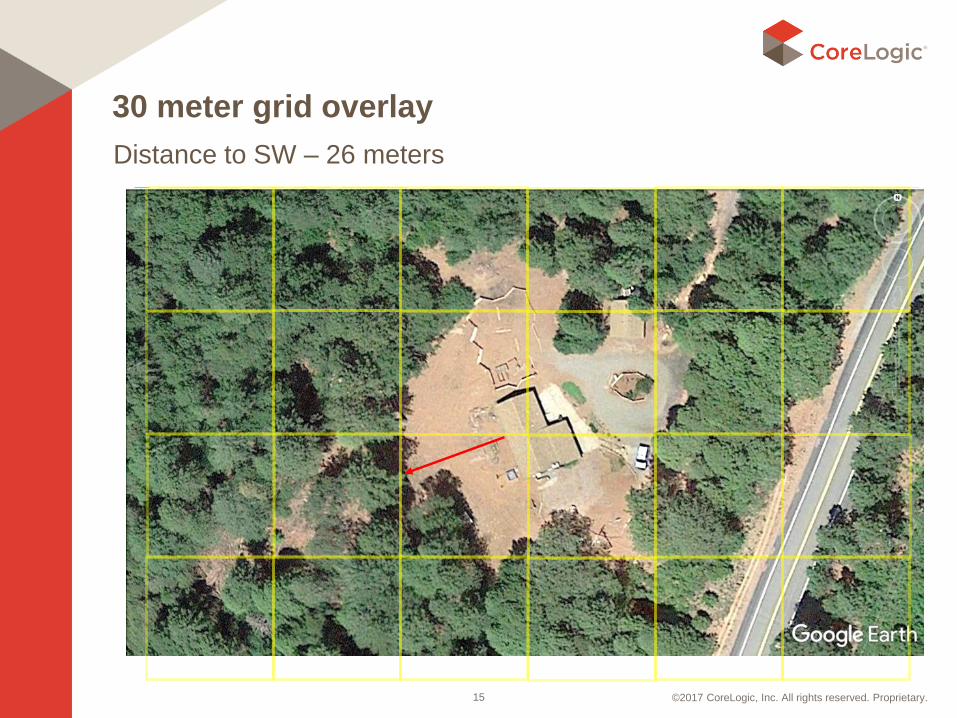
30 meter grid overlay
Distance to SW – 26 meters
15
©2017 CoreLogic, Inc. All rights reserved. Proprietary.16
Thank You