Embed Size (px)
Citation preview

In the format provided by the authors and unedited.
1
Corrupting Cooperation and How Anti-Corruption Strategies May Backfire Supplementary Information
Michael Muthukrishna*1,6, Patrick Francois2,3, Shayan Pourahmadi4 & Joseph Henrich2,3,5,6
1Department of Psychological and Behavioural Science, London School of Economics and Political Science, London WC2A 2AE, UK 2Vancouver School of Economics, University of British Columbia, Vancouver, BC V6T 1L4, Canada 3Canadian Institute for Advanced Research 4Department of Economics, Columbia University, New York, NY 10027, USA 5Department of Psychology, University of British Columbia, Vancouver, BC V6T 1Z4, Canada 6Department of Human Evolutionary Biology, Harvard University, Cambridge, MA 02138, USA
Corrupting cooperation and how anti-corruption strategies may backfire
© 2017 Macmillan Publishers Limited, part of Springer Nature. All rights reserved.
SUPPLEMENTARY INFORMATIONVOLUME: 1 | ARTICLE NUMBER: 0138
NATURE HUMAN BEHAVIOUR | DOI: 10.1038/s41562-017-0138 | www.nature.com/nathumbehav 1

2
Table of Contents Supplementary Methods ................................................................................................................................... 3
Experimental Design .................................................................................................................................... 3
Random Assignment to Treatments ...................................................................................................... 3
Procedure ................................................................................................................................................... 4
Measures Collected ................................................................................................................................... 5
Sampling ................................................................................................................................................... 10
Block Randomization ............................................................................................................................. 10
Screenshots from Experiment ................................................................................................................... 10
Institutional Punishment Public Goods Game .................................................................................. 11
Bribery Game .......................................................................................................................................... 15
Bribery Game with Partial Transparency ............................................................................................ 18
Bribery Game with Full Transparency................................................................................................. 19
Bribery Game with Forced Leader Contribution ............................................................................... 20
Experimental Protocol................................................................................................................................ 21
General Description ............................................................................................................................... 21
Control Treatment .................................................................................................................................. 24
Bribery Game .......................................................................................................................................... 37
Bribery Game with Partial Transparency ............................................................................................ 51
Bribery Game with Full Transparency................................................................................................. 64
Bribery Game with Leader Investment ............................................................................................... 79
Supplementary Results .................................................................................................................................... 92
Data Analyses ............................................................................................................................................... 92
Predictions ............................................................................................................................................... 92
Variables ................................................................................................................................................... 93
Cost of Corruption ...................................................................................................................................... 93
Contributions........................................................................................................................................... 94
Causes of Corruption .................................................................................................................................. 97
Contributions........................................................................................................................................... 97
© 2017 Macmillan Publishers Limited, part of Springer Nature. All rights reserved.
NATURE HUMAN BEHAVIOUR | DOI: 10.1038/s41562-017-0138 | www.nature.com/nathumbehav 2
SUPPLEMENTARY INFORMATION

3
Bribes ..................................................................................................................................................... 101
Punishment ........................................................................................................................................... 105
Leader Decisions .................................................................................................................................. 111
Exposure to Norms ............................................................................................................................. 114
Cures for Corruption ............................................................................................................................... 126
Bayesian ................................................................................................................................................. 126
Frequentist ............................................................................................................................................ 127
Leader Investment ............................................................................................................................... 128
Preferences for characteristics of the game world ............................................................................... 130
Supplementary References ........................................................................................................................... 133
Supplementary Methods Experimental Design
Random Assignment to Treatments Each group of players was randomly assigned to:
1. Version A or B, which determined whether demographics and background questions were administered before or after game play.
2. Low or High economic potential, which was the public goods game marginal per capita return (MPCR).
High Economic Potential: 0.6 MPCR Low Economic Potential: 0.3 MPCR
3. Weak or Strong leader power, which was the punishment multiplier for institutional punishment.
Weak Leader Power: 1 x punishment multiplier Strong Leader Power: 3 x punishment multiplier
4. Four of the five versions of the public goods game (institutional punishment public goods game; control, bribery game, bribery game with partial transparency, bribery game with full transparency, bribery game with leader investment) to be played in a random order. Four rather than five treatments were administered due to time constraints. Economic potential and leader power did not change between games.
© 2017 Macmillan Publishers Limited, part of Springer Nature. All rights reserved.
NATURE HUMAN BEHAVIOUR | DOI: 10.1038/s41562-017-0138 | www.nature.com/nathumbehav 3
SUPPLEMENTARY INFORMATION

4
Random assignment was performed using the Random functions in Excel or Google Sheets. Since the experimenter selected the treatments in the software, they were not blind to the treatment.
In the partial transparency treatment, players could see the leaders contribution to the public pool. This offered leaders an opportunity to reveal a norm through their own actions.
In the full transparency treatment, players could see all leader actions (though anonymized)—the size of contributions, the size of bribes, and the leaders decision in each case. This level of transparency in leader behaviors would be the ultimate goal of many campaigns and can be explored in an experimental setting.
In the leader investment treatment, leaders are forced to maximally contribute to the public pool tying their own payoff to its success. This treatment was inspired by the Singaporean model. In the Singaporean model, a leaders’ salary is determined by (a) the highest paid professionals in the country and (b) the GDP of the country. The goal here is to incentivize leaders to increase average and top-end growth in society. Although it could be that higher salaries rather than the direct incentives reduce corruption in Singapore, recent evidence from Ghana and neighboring countries suggests that increasing police officer salaries actually increases bribe behavior1. Ideally, to fully capture the Singaporean model, we would have included some kind of extra bonus based on the size of the public pool and perhaps the payoff to the highest earning player, but we didn’t want this treatment to be too far out of line with the other treatments. That is, we wanted to test leader investment with minimal changes to the overall game structure. Nevertheless, in its current form, the effect of this treatment has alternative explanations. Most concerning, forcing leaders to maximally contribute, leads to them having large stake in the public goof, a particular problem in smaller groups. For this reason, without further investigation, we should be especially cautious about the degree to which these results will translate to larger populations and we only report the results in the Supplementary Information.
In order to remove reputational effects, for each round, the leader was also randomly selected by the software, with replacement, such that leaders could be leaders for consecutive rounds.
Procedure Participants entered the room and were asked to sit down at a computer. Computers were separated by a barrier so that participants could not see other players’ screens. A consent form, pen and headphones were laid out on each keyboard. Participants were told to put on the headphones and click play on the video. All further instructions were provided via the software and via video to ensure all participants received the same information. Sample screenshots for each treatment are shown in the next section (Screenshots from Experiment) and full scripts with screenshots from the video are shown in the final section (Experimental Protocol). After the instructions for each treatment, participants were administered a quiz via the experimental software. The quiz ensured
© 2017 Macmillan Publishers Limited, part of Springer Nature. All rights reserved.
NATURE HUMAN BEHAVIOUR | DOI: 10.1038/s41562-017-0138 | www.nature.com/nathumbehav 4
SUPPLEMENTARY INFORMATION

5
that participants understood the instructions. Participants had to answer questions correctly to begin the treatment. The quiz questions are also provided in the final section (Experimental Protocol).
Measures Collected In addition to player and leader behavior in the game, we collected the following measures. This is a complete list of all measures collected. No additional measures were collected.
1. Prestige and Dominance Scale [Self-report version]2 2. Right Wing Authoritarianism (RWA) scale3 3. How old are you in age? 4. What is your gender? 5. If you are student, what degree are you studying for (e.g. B Arts, B Sc)? If you are working,
what is your occupation (e.g. Pharmacist)? 6. Major (if degree) What is your major (e.g. Chemistry) or industry (e.g. Health)? 7. Have you lived your entire life in Canada?
8. If no, where else have you lived (please list)? [Note: these countries were used to calculate the Exposure Corruption Score]
9. What suburb do/did you live in for most of your time in Canada?
10. Please specify the ethnic (cultural) group you primarily identify with (e.g. Punjabi,Cantonese Chinese, Mandarin Chinese, Japanese, European, etc.) [Note: these identities were used to calculate the Heritage Corruption Score. Cantonese Chinese were assumed to be from Hong Kong and Mandarin Chinese were assumed to be from China. Ambiguous country of origin, such as Armenian, were not included]
11. What is the native language of your ethnic group?
12. How well do you speak the native language of your ethnic group?
13. Inclusion of Other in the Self Scale4 for ethnic group
14. Inclusion of Other in the Self Scale4 for other Canadians
15. What is your religious background?
16. How important is religion in your daily life?
17. Vancouver Index of Accultaration5
The last 39 groups (194 participants) were also asked the following questions about their preferences for the game:
© 2017 Macmillan Publishers Limited, part of Springer Nature. All rights reserved.
NATURE HUMAN BEHAVIOUR | DOI: 10.1038/s41562-017-0138 | www.nature.com/nathumbehav 5
SUPPLEMENTARY INFORMATION

6
Figure S1. After the experiment had concluded, participants were asked for their preferred
game paramters.
Corruption Perception Scores Below are histograms for distributions of heritage corruption score (the mean of the Corruption Perception Index6 values of players’ countries of ethnic heritage) and a exposure corruption score (the mean of the Corruption Perception Index values of the countries in which they had lived). As discussed in the main text, the heritage corruption score represents the potential influence of vertically transmitted corruption norms (parent to child), whereas the exposure corruption score represents corruption norms to which the participant was directly exposed (i.e., potentially personal experience as well as vertical, horizontal, and oblique transmission).
© 2017 Macmillan Publishers Limited, part of Springer Nature. All rights reserved.
NATURE HUMAN BEHAVIOUR | DOI: 10.1038/s41562-017-0138 | www.nature.com/nathumbehav 6
SUPPLEMENTARY INFORMATION

7
Figure S2. Histogram of Heritage Corruption Scores.
Heritage Corruption Score
Freq
uenc
y
0 20 40 60 80 100
020
4060
80
© 2017 Macmillan Publishers Limited, part of Springer Nature. All rights reserved.
NATURE HUMAN BEHAVIOUR | DOI: 10.1038/s41562-017-0138 | www.nature.com/nathumbehav 7
SUPPLEMENTARY INFORMATION

8
Figure S3. Histogram of Exposure Corruption Score.
Direct Exposure Corruption Score
Freq
uenc
y
20 30 40 50 60
020
4060
© 2017 Macmillan Publishers Limited, part of Springer Nature. All rights reserved.
NATURE HUMAN BEHAVIOUR | DOI: 10.1038/s41562-017-0138 | www.nature.com/nathumbehav 8
SUPPLEMENTARY INFORMATION

9
Figure S4. Histogram of Exposure Corruption Score subtracted from Heritage Corruption Score. This plot illustrates that these scores are not identical and in some cases, have very
different values.
Heritage - Direct Exposure Corruption Score
Freq
uenc
y
-40 -20 0 20 40 60
020
4060
8010
0
© 2017 Macmillan Publishers Limited, part of Springer Nature. All rights reserved.
NATURE HUMAN BEHAVIOUR | DOI: 10.1038/s41562-017-0138 | www.nature.com/nathumbehav 9
SUPPLEMENTARY INFORMATION

10
Sampling Based on a pilot of 50 participants, we expected a fairly large effect size and aimed to have at least 250 participants. All data was included, unless the software crashed (resulting in data loss or less than 10 rounds for that treatment). This happened for 5 of the 224 treatment groups. Incomplete data (and obviously lost data) was discarded prior to any analyses.
Block Randomization We used block randomization so that we could both avoid end game effects where participants played differently in the final periods knowing that the game would end, but also have player data from 10 periods within each treatment. To explain this procedure, here is the description provided to participants via the instructional video:
Interactions with your group will be divided into a series of rounds. Each round has differences from other rounds. The instructions for each round will be provided by video before the round begins. Each round is made up of several periods. The probability of a round ending is 10% for each period. What this means is that on average you will play 10 periods, but you may play many more or many fewer. If a round ends before 10 periods, you will still play through to the 10th period, but only the periods before the ending period will be counted for your payment. You will be informed which period was the last period at the end of the round.
The full script and screenshots from the video are shown in the final section (Experimental Protocol). Sample screenshots for each treatment are shown in the next section (Screenshots from Experiment).
Screenshots from Experiment Below are screenshots for each version of the game illustrating the Player view, Leader view when playing, and Leader view when making decisions regarding other players. All instructions were provided through pre-recorded videos. The script for these videos along with all screenshots can be found in the Experimental Protocol section.
© 2017 Macmillan Publishers Limited, part of Springer Nature. All rights reserved.
NATURE HUMAN BEHAVIOUR | DOI: 10.1038/s41562-017-0138 | www.nature.com/nathumbehav 10
SUPPLEMENTARY INFORMATION

11
Institutional Punishment Public Goods Game
Figure S5. Player screen. The leader’s decision (Do Nothing or Take Away Points) is displayed after “Leader Action”. It is displayed after the leader has made their choice.
© 2017 Macmillan Publishers Limited, part of Springer Nature. All rights reserved.
NATURE HUMAN BEHAVIOUR | DOI: 10.1038/s41562-017-0138 | www.nature.com/nathumbehav 11
SUPPLEMENTARY INFORMATION

12
Figure S6. Leader screen for play. After all players have made their decision, leaders can choose how to react to player choices.
© 2017 Macmillan Publishers Limited, part of Springer Nature. All rights reserved.
NATURE HUMAN BEHAVIOUR | DOI: 10.1038/s41562-017-0138 | www.nature.com/nathumbehav 12
SUPPLEMENTARY INFORMATION

13
Figure S7. Leader screen for decision regarding players. Leaders are shown anonymized player choices and can choose to Take Points Away or Do Nothing.
© 2017 Macmillan Publishers Limited, part of Springer Nature. All rights reserved.
NATURE HUMAN BEHAVIOUR | DOI: 10.1038/s41562-017-0138 | www.nature.com/nathumbehav 13
SUPPLEMENTARY INFORMATION

14
Figure S8. Example of player screen after leader decision. Here the leader has chosen to Take Away Points.
© 2017 Macmillan Publishers Limited, part of Springer Nature. All rights reserved.
NATURE HUMAN BEHAVIOUR | DOI: 10.1038/s41562-017-0138 | www.nature.com/nathumbehav 14
SUPPLEMENTARY INFORMATION

15
Bribery Game
Figure S9. Player screen. Leader action (Do Nothing or Take Away Points) is displayed after the leader has made their decision. The key difference in the Bribery Game is the
additional player choice to Contribute to Leader.
© 2017 Macmillan Publishers Limited, part of Springer Nature. All rights reserved.
NATURE HUMAN BEHAVIOUR | DOI: 10.1038/s41562-017-0138 | www.nature.com/nathumbehav 15
SUPPLEMENTARY INFORMATION

16
Figure S10. Leader screen for play. Note that leaders cannot contribute to themselves. After all players have made their decision, leaders can choose how to react to player choices.
© 2017 Macmillan Publishers Limited, part of Springer Nature. All rights reserved.
NATURE HUMAN BEHAVIOUR | DOI: 10.1038/s41562-017-0138 | www.nature.com/nathumbehav 16
SUPPLEMENTARY INFORMATION

17
Figure S11. Leader screen for decision regarding players. Leaders are shown anonymized player choices and can choose to Take Points Away, Accept Contribution to Leader, or Do
Nothing.
© 2017 Macmillan Publishers Limited, part of Springer Nature. All rights reserved.
NATURE HUMAN BEHAVIOUR | DOI: 10.1038/s41562-017-0138 | www.nature.com/nathumbehav 17
SUPPLEMENTARY INFORMATION

18
Bribery Game with Partial Transparency
Figure S12. Player screen after Leader decision. Note that below Leader Action (Do Nothing, Take Away Points, or Accept Contribution to Leader) is the Leader’s Contribution
to the Pool. All other screens are identical to Bribery Game. Here the Leader has contributed 3 points to the public pool and has chosen to take away points from this player.
© 2017 Macmillan Publishers Limited, part of Springer Nature. All rights reserved.
NATURE HUMAN BEHAVIOUR | DOI: 10.1038/s41562-017-0138 | www.nature.com/nathumbehav 18
SUPPLEMENTARY INFORMATION

19
Bribery Game with Full Transparency
Figure S13. Player screen after Leader decision. Note that below Leader Action (Do Nothing, Take Away Points, or Accept Contribution to Leader) is the Leader’s Contribution
to the Pool, as in Bribery Game with Partial Transparency. However, now all Leader and Player Actions are displayed in a table. All other screens are identical to Bribery Game.
© 2017 Macmillan Publishers Limited, part of Springer Nature. All rights reserved.
NATURE HUMAN BEHAVIOUR | DOI: 10.1038/s41562-017-0138 | www.nature.com/nathumbehav 19
SUPPLEMENTARY INFORMATION
20
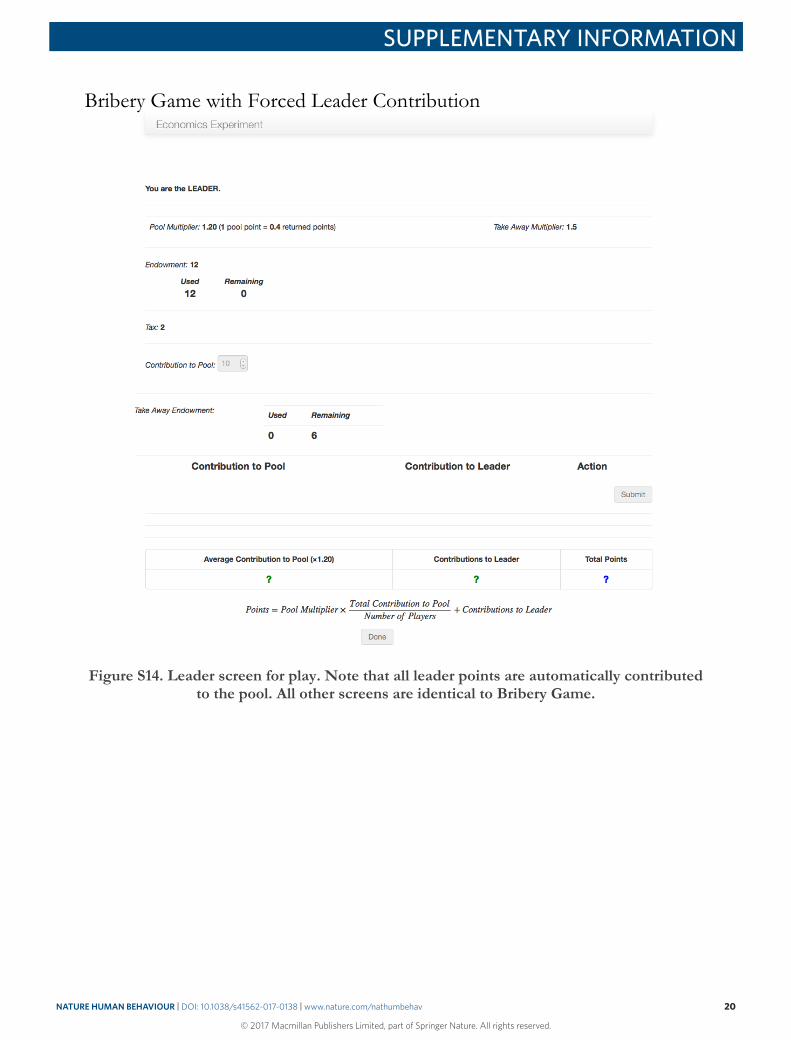
Bribery Game with Forced Leader Contribution
Figure S14. Leader screen for play. Note that all leader points are automatically contributed to the pool. All other screens are identical to Bribery Game.
© 2017 Macmillan Publishers Limited, part of Springer Nature. All rights reserved.
NATURE HUMAN BEHAVIOUR | DOI: 10.1038/s41562-017-0138 | www.nature.com/nathumbehav 20
SUPPLEMENTARY INFORMATION

21
Experimental Protocol The videos were created using Microsoft Powerpoint and exported as a video. For sections of the instructions that were shared between treatments, the same slide and recording were used to ensure there were not even minor differences in aspects as such intonation. The following is a transcript of the experimental video with screenshots. All participants first heard the General Description. They then heard the First Round version of the treatment they received first. All subsequent treatments had the Subquent Round version of the treatment instructions, which highlighted the difference with other treatments. Also included are the quiz questions administered to all participants. These quizzes were used to ensure participants understood the instructions and the differences between treatments. Participants had to answer all questions correctly before they could proceed.
The instructional videos infomed participants that they would receive 10c per point and be paid for 8 random rounds. However, early pilots testing the software suggested that this would not result in adequate conpensation for participants as per <Institution Subject Pools> policies. Rather than record all instructional videos, we instead informed participants that they would actually be paid 15c per point for 10 random rounds rather than 10c per point for 8 random rounds, but that all other aspects of the instructions were correct and unchanged. No participants had questions or complained about this change.
General Description Welcome to the experiment. All instructions will be provided through videos. It is prohibited to communicate with other participants during this experiment, however, please feel free to ask the experimenter any questions.
You are invited to participate in this experiment. When you are ready, please pause the video to read and sign the consent form.
<PAUSE>
If you are happy to continue, we may now begin the study. First, please turn off your mobile phone or other electronic devices.
© 2017 Macmillan Publishers Limited, part of Springer Nature. All rights reserved.
NATURE HUMAN BEHAVIOUR | DOI: 10.1038/s41562-017-0138 | www.nature.com/nathumbehav 21
SUPPLEMENTARY INFORMATION

22
There is no deception in this experiment: all other group members are real people and all monetary amounts are paid precisely as described. If you need further clarification about any aspect of this experiment, please let the experimenter know before we begin.
[VERSION A: You will begin by completing some background questionnaires and measures. You will then engage in a series of interactions with a group of other people via the computer and will be asked to make some decisions.]
[VERSION B: You will engage in a series of interactions with a group of other people via the computer and will be asked to make some decisions.]
Interactions with your group will be divided into a series of rounds. Each round has differences from other rounds. The instructions for each round will be provided by video before the round begins. Each round is made up of several periods. The probability of a round ending is 10% for each period. What this means is that on average you will play 10 periods, but you may play many more or many fewer. If a round ends before 10 periods, you will still play through to the 10th period, but only the periods before the ending period will be counted for your payment. You will be informed which period was the last period at the end of the round.
During this experiment, we will refer to points. Every point is worth 10 cents in today’s experiment. You will be paid for 8 periods randomly selected from across all rounds. Together with your $10
© 2017 Macmillan Publishers Limited, part of Springer Nature. All rights reserved.
NATURE HUMAN BEHAVIOUR | DOI: 10.1038/s41562-017-0138 | www.nature.com/nathumbehav 22
SUPPLEMENTARY INFORMATION

23
show up fee, you could earn over $35 today, but the precise amount depends on your actions and the actions of other group members.
In each period the experiment consists of two stages. At the first stage you have to decide how many points you would like to contribute to a project, refered to as a pool, and to a group member designated as a leader. In the second stage, the group member designated as a leader will make a decision whether to accept points from group members or whether or how much to reduce the earnings of group members from the first stage. The leader is also a group member in the first stage, but does not make a decision about themselves.
At the beginning of each period each participant receives an endowment of points. We call this his or her endowment. Your task is to decide how to use your endowment. You have to decide how many of the points you want to contribute to the pool, how many you want to contribute to the leader, and how many of them to keep for yourself. All your decisions are anonymous.
The income of each group member from the pool is calculated in the same way, this means that each group member receives the same income from the pool, regardless of how much they contributed. Suppose the pool multiplier is 1.5 and the sum of the contributions of all group members is 30 points. In this case each member of the group receives an income from the project of: 1.5 times 30 = 45 divided by the number of group members. So if there are 6 group members, each group member would receive 45 divided by 6, or 7.5 points. If the total contribution to the project is 6 points, then each member of the group receives an income of 1.5 times 6 = 9 divided by the number of group members. So for 6 group members, each group member would receive 9 divided by 6, or 1.5 points.
Each point you keep for yourself remains as 1 point. Any points given to the leader, if accepted are kept by the leader. If not accepted by the leader, these points are returned to you. You will be informed of the number of group members after these instructions.
The instructions for each round will be provided before the round begins. You will be given a quiz after the video, which you must answer correctly to continue, so please pay attention. When you are ready, you may watch the first video. When everyone has watched the video and passed the quiz and there are no further questions, the experiment will begin.
[VERSION B: After all games are completed, you will complete some background questionnaires and measures.]
© 2017 Macmillan Publishers Limited, part of Springer Nature. All rights reserved.
NATURE HUMAN BEHAVIOUR | DOI: 10.1038/s41562-017-0138 | www.nature.com/nathumbehav 23
SUPPLEMENTARY INFORMATION

24
Control Treatment First Round
Welcome to the first round. The screen you see in front of you is the normal screen for play. In each period, one person from the group will be selected at random to play the role of a leader. The leader will have a slightly different screen. Please pay attention to all screens presented in these instructions as the instructions for other other rounds will only highlight the differences between that round and this one.
© 2017 Macmillan Publishers Limited, part of Springer Nature. All rights reserved.
NATURE HUMAN BEHAVIOUR | DOI: 10.1038/s41562-017-0138 | www.nature.com/nathumbehav 24
SUPPLEMENTARY INFORMATION

25
The first thing we’d like to draw your attention to is the pool multiplier. When group members allocate points to the group pool, the total allocated by the group is multipled by this number, the pool multiplier. In this case, it’s 1.2. The new total is then distributed equally among everyone in the group, including the leader. This means that if every group member allocated all their points, all group members would increase their earnings by 20%. If no one allocates to the group pool, there’s nothing to multiply by 1.2, and nothing to divide up. Another way to think about this is to consider how much each point in the pool is worth to each player. This is shown within parantheses to the right of the pool multiplier. In this case, with 3 players, each player gets 0.4 points for every point in the pool, no matter who contributes it. For example, if each player contributed 1 point pool, there would be 3 points in the pool and each player would get back 3 times 0.4 or 1.2 points.
© 2017 Macmillan Publishers Limited, part of Springer Nature. All rights reserved.
NATURE HUMAN BEHAVIOUR | DOI: 10.1038/s41562-017-0138 | www.nature.com/nathumbehav 25
SUPPLEMENTARY INFORMATION

26
Below this, we see your initial endowment of 12 points. 2 points are taxed each period, which can be used by the leader to take points away from group members. This leaves you 10 points to allocate.
Here you see the Take Away multiplier. This is how much each tax point is multiplied by when the leader takes points away from a group member. For example, here, if the leader spent 1 tax point to take points away, 1.5 points would be taken from the targeted group member.
© 2017 Macmillan Publishers Limited, part of Springer Nature. All rights reserved.
NATURE HUMAN BEHAVIOUR | DOI: 10.1038/s41562-017-0138 | www.nature.com/nathumbehav 26
SUPPLEMENTARY INFORMATION

27
Here we see the boxes that are used to allocate your remaining 10 points to the group pool. Any points you do not allocate will be kept for yourself. When you hover your mouse over these boxes you will see an arrow to increase or decrease the amount in 1 point intervals or you may type in a value.
When you have made your decision, click “Submit”. After clicking “Submit”, you will not be able to change your decision.
© 2017 Macmillan Publishers Limited, part of Springer Nature. All rights reserved.
NATURE HUMAN BEHAVIOUR | DOI: 10.1038/s41562-017-0138 | www.nature.com/nathumbehav 27
SUPPLEMENTARY INFORMATION

28
This section will show you the leader’s action. The leader has 2 choices – to take points from you or do nothing. They may only choose one of these options.
Here you see how your points for this period are calculated. Everything in green is added, everything in red is subtracted, and your total points for the period is shown in blue on the right. We will return to this after explaining the leader’s screen.
© 2017 Macmillan Publishers Limited, part of Springer Nature. All rights reserved.
NATURE HUMAN BEHAVIOUR | DOI: 10.1038/s41562-017-0138 | www.nature.com/nathumbehav 28
SUPPLEMENTARY INFORMATION

29
If you are the leader for a period, you will be identified at the top of the screen. Note that all group members, including the leader are anonymous to other group members. Your screen looks very similar to other group members, with a few differences.
Like other group members you pay a tax and choose how much you wish to allocate to the group pool and how much to keep for yourself
© 2017 Macmillan Publishers Limited, part of Springer Nature. All rights reserved.
NATURE HUMAN BEHAVIOUR | DOI: 10.1038/s41562-017-0138 | www.nature.com/nathumbehav 29
SUPPLEMENTARY INFORMATION

30
You also have access to tax points that you may use for taking away points from group members based on the Take Away multiplier.
The actions of group members will appear below this after they make their decision. The Contribution column are the contributions to the group pool.
© 2017 Macmillan Publishers Limited, part of Springer Nature. All rights reserved.
NATURE HUMAN BEHAVIOUR | DOI: 10.1038/s41562-017-0138 | www.nature.com/nathumbehav 30
SUPPLEMENTARY INFORMATION

31
You may…
do nothing…
© 2017 Macmillan Publishers Limited, part of Springer Nature. All rights reserved.
NATURE HUMAN BEHAVIOUR | DOI: 10.1038/s41562-017-0138 | www.nature.com/nathumbehav 31
SUPPLEMENTARY INFORMATION

32
or take points away from any group member. If you take away points, you decide how much to take by allocating tax points to the group member. The total points taken away is calculated for you next to this box.
Any tax points not used for taking away points from group members will be returned to the experimenter. Similarly any points taken away from group members will also be returned to the experimenter.
© 2017 Macmillan Publishers Limited, part of Springer Nature. All rights reserved.
NATURE HUMAN BEHAVIOUR | DOI: 10.1038/s41562-017-0138 | www.nature.com/nathumbehav 32
SUPPLEMENTARY INFORMATION

33
As a leader your earnings for this period are determined by how much you receive from your share of the group pool.
This is your endowment minus your taxes minus your contribution to the pool. The average contribution of group members is shown here – 2.67 points. This is multiplied by the pool multiplier to give the total points for this period – 10.20.
© 2017 Macmillan Publishers Limited, part of Springer Nature. All rights reserved.
NATURE HUMAN BEHAVIOUR | DOI: 10.1038/s41562-017-0138 | www.nature.com/nathumbehav 33
SUPPLEMENTARY INFORMATION

34
After the leader clicks submit, group members will be informed of the leader’s action. The earnings of group members for this period will be calculated from their initial endowment minus their taxes, minus their contribution. Then minus the points taken away by the leader, if any. In the example here, the leader chose to take points away from the group member. Finally, the group members share of the group pool will be added to this amount to calculate the total points for this period. Here the average contribution is shown – 2.67 points. This is multiplied by the pool multiplier and then added to give total points – 7.20 for this group member.
Please click “Done” at the bottom of the screen to move to the next period.
Please click “Continue” when you are ready to begin.
© 2017 Macmillan Publishers Limited, part of Springer Nature. All rights reserved.
NATURE HUMAN BEHAVIOUR | DOI: 10.1038/s41562-017-0138 | www.nature.com/nathumbehav 34
SUPPLEMENTARY INFORMATION

35
Subsequent Round
The difference between this round and previous rounds is that in this round, like other group members, the leader must choose how much to contribute to the group pool and can not accept any points.
In addition, group members only see the leader’s action towards them. They do not see the actions
© 2017 Macmillan Publishers Limited, part of Springer Nature. All rights reserved.
NATURE HUMAN BEHAVIOUR | DOI: 10.1038/s41562-017-0138 | www.nature.com/nathumbehav 35
SUPPLEMENTARY INFORMATION

36
of others group members or the leader’s actions towards other group members. As in all rounds, all participants are completely anonymous.
Please click “Continue” when you are ready to begin.
Quiz Questions (The correct answer is underlined)
1. How many periods will you play? a. 10 periods b. More than 10 periods c. Less than 10 periods d. An average of 10 periods, but possibly more and possibly less
2. If everyone contributes the same amount to the group pool, will you: a. Increase your points from your initial endowment b. Decrease your points from your initial endowment c. Have the same points as your initial endowment d. Might increase your points or might decrease your points
3. How much does the leader contribute to the group pool? a. However much they choose to allocate to the group pool b. 10 points c. Depends on the points given to the leader d. Depends on the group member’s contributions
4. Which of the following can the leader NOT do? a. Nothing b. Accept points from a group member c. Take points away from a group member d. Accept points and take points away from the same group member
5. What actions of other group members can group members (not leader) see? a. Leader’s action towards them b. Leader’s contribution c. Leader’s contribution and all actions d. All group member and leader actions
© 2017 Macmillan Publishers Limited, part of Springer Nature. All rights reserved.
NATURE HUMAN BEHAVIOUR | DOI: 10.1038/s41562-017-0138 | www.nature.com/nathumbehav 36
SUPPLEMENTARY INFORMATION

37
Bribery Game First Round
Welcome to the first round. The screen you see in front of you is the normal screen for play. In each period, one person from the group will be selected at random to play the role of a leader. The leader will have a slightly different screen. Please pay attention to all screens presented in these instructions as the instructions for other other rounds will only highlight the differences between that round and this one.
© 2017 Macmillan Publishers Limited, part of Springer Nature. All rights reserved.
NATURE HUMAN BEHAVIOUR | DOI: 10.1038/s41562-017-0138 | www.nature.com/nathumbehav 37
SUPPLEMENTARY INFORMATION

38
The first thing we’d like to draw your attention to is the pool multiplier. When group members allocate points to the group pool, the total allocated by the group is multipled by this number, the pool multiplier. In this case, it’s 1.2. The new total is then distributed equally among everyone in the group, including the leader. This means that if every group member allocated all their points, all group members would increase their earnings by 20%. If no one allocates to the group pool, there’s nothing to multiply by 1.2, and nothing to divide up. Another way to think about this is to consider how much each point in the pool is worth to each player. This is shown within parantheses to the right of the pool multiplier. In this case, with 3 players, each player gets 0.4 points for every point in the pool, no matter who contributes it. For example, if each player contributed 1 point pool, there would be 3 points in the pool and each player would get back 3 times 0.4 or 1.2 points.
© 2017 Macmillan Publishers Limited, part of Springer Nature. All rights reserved.
NATURE HUMAN BEHAVIOUR | DOI: 10.1038/s41562-017-0138 | www.nature.com/nathumbehav 38
SUPPLEMENTARY INFORMATION

39
Below this, we see your initial endowment of 12 points. 2 points are taxed each period, which can be used by the leader to take points away from group members. This leaves you 10 points to allocate.
Here you see the Take Away multiplier. This is how much each tax point is multiplied by when the leader takes points away from a group member. For example, here, if the leader spent 1 tax point to take points away, 1.5 points would be taken from the targeted group member.
© 2017 Macmillan Publishers Limited, part of Springer Nature. All rights reserved.
NATURE HUMAN BEHAVIOUR | DOI: 10.1038/s41562-017-0138 | www.nature.com/nathumbehav 39
SUPPLEMENTARY INFORMATION

40
Here we see the boxes that are used to allocate your remaining 10 points to either the group pool or to the leader. Any points you do not allocate will be kept for yourself. When you hover your mouse over these boxes you will see an arrow to increase or decrease the amount in 1 point intervals or you may type in a value.
When you have made your decision, click “Submit”. After clicking “Submit”, you will not be able to change your decision.
© 2017 Macmillan Publishers Limited, part of Springer Nature. All rights reserved.
NATURE HUMAN BEHAVIOUR | DOI: 10.1038/s41562-017-0138 | www.nature.com/nathumbehav 40
SUPPLEMENTARY INFORMATION

41
This section will show you the leader’s action. The leader has 3 choices – to take points from you, accept your points, or do nothing. They may only choose one of these options.
Here you see how your points for this period are calculated. Everything in green is added, everything in red is subtracted, and your total points for the period is shown in blue on the right. We will return to this after explaining the leader’s screen.
© 2017 Macmillan Publishers Limited, part of Springer Nature. All rights reserved.
NATURE HUMAN BEHAVIOUR | DOI: 10.1038/s41562-017-0138 | www.nature.com/nathumbehav 41
SUPPLEMENTARY INFORMATION

42
If you are the leader for a period, you will be identified at the top of the screen. Note that all group members, including the leader are anonymous to other group members. Your screen looks very similar to other group members, with a few differences.
Like other group members you pay a tax and choose how much you wish to allocate to the group pool and how much to keep for yourself, but, unlike other group members you do not contribute to the leader, since you are the leader and you would be contributing to yourself.
© 2017 Macmillan Publishers Limited, part of Springer Nature. All rights reserved.
NATURE HUMAN BEHAVIOUR | DOI: 10.1038/s41562-017-0138 | www.nature.com/nathumbehav 42
SUPPLEMENTARY INFORMATION

43
You also have access to tax points that you may use for taking away points from group members based on the Take Away multiplier.
When you have made your decision about how many points to allocate to the group pool, click “Submit”. After clicking “Submit”, you will not be able to change your decision.
© 2017 Macmillan Publishers Limited, part of Springer Nature. All rights reserved.
NATURE HUMAN BEHAVIOUR | DOI: 10.1038/s41562-017-0138 | www.nature.com/nathumbehav 43
SUPPLEMENTARY INFORMATION

44
The actions of group members will appear below this after they make their decision. The Contribution column are the contributions to the group pool and the Payment column shows points given to you, the Leader.
You may do nothing…
© 2017 Macmillan Publishers Limited, part of Springer Nature. All rights reserved.
NATURE HUMAN BEHAVIOUR | DOI: 10.1038/s41562-017-0138 | www.nature.com/nathumbehav 44
SUPPLEMENTARY INFORMATION

45
accept these points…
or take points away from any group member. If you take away points, you decide how much to take by allocating tax points to the group member. The total points taken away is calculated for you next to this box.
© 2017 Macmillan Publishers Limited, part of Springer Nature. All rights reserved.
NATURE HUMAN BEHAVIOUR | DOI: 10.1038/s41562-017-0138 | www.nature.com/nathumbehav 45
SUPPLEMENTARY INFORMATION

46
Any tax points not used for taking away points from group members will be returned to the experimenter. Similarly any points taken away from group members will also be returned to the experimenter.
As a leader your earnings for this period will be calculated from your initial endowment minus your taxes, minus your contribution, plus the average contribution to the pool – 2.67, multiplied by the pool multiplier, plus any points you accepted, giving you a total of 10.2 for this period.
© 2017 Macmillan Publishers Limited, part of Springer Nature. All rights reserved.
NATURE HUMAN BEHAVIOUR | DOI: 10.1038/s41562-017-0138 | www.nature.com/nathumbehav 46
SUPPLEMENTARY INFORMATION

47
After the leader clicks submit, group members will be informed of the leader’s action. The earnings of group members for this period will be calculated from their initial endowment minus their taxes, minus their contribution. Then either minus the points taken away by the leader OR minus the points given to the leader. Any points given to the leader and not accepted will be returned to the group member. In the example here, the leader chose to take points away from the group member. Finally, the group members share of the group pool will be added to this amount to calculate the total points for this period. Here the average contribution is shown – 2.67 points. This is multiplied by the pool multiplier and then added to give total points – 5.7 for this group member.
© 2017 Macmillan Publishers Limited, part of Springer Nature. All rights reserved.
NATURE HUMAN BEHAVIOUR | DOI: 10.1038/s41562-017-0138 | www.nature.com/nathumbehav 47
SUPPLEMENTARY INFORMATION

48
Please click “Done” at the bottom of the screen to move to the next period.
Please click “Continue” when you are ready to begin.
© 2017 Macmillan Publishers Limited, part of Springer Nature. All rights reserved.
NATURE HUMAN BEHAVIOUR | DOI: 10.1038/s41562-017-0138 | www.nature.com/nathumbehav 48
SUPPLEMENTARY INFORMATION

49
Subsequent Round
The difference between this round and previous rounds is that in this round, like other group members, the leader must choose how much to contribute to the group pool. They may also accept points from group members.
In addition, group members only see the leader’s action towards them. They do not see the actions
© 2017 Macmillan Publishers Limited, part of Springer Nature. All rights reserved.
NATURE HUMAN BEHAVIOUR | DOI: 10.1038/s41562-017-0138 | www.nature.com/nathumbehav 49
SUPPLEMENTARY INFORMATION

50
of others group members or the leader’s actions towards other group members. As in all rounds, all participants are completely anonymous.
Please click “Continue” when you are ready to begin.
Quiz Questions 1. How many periods will you play?
a. 10 periods b. More than 10 periods c. Less than 10 periods d. An average of 10 periods, but possibly more and possibly less
2. If everyone contributes the same amount to the group pool, will you: a. Increase your points from your initial endowment b. Decrease your points from your initial endowment c. Have the same points as your initial endowment d. Might increase your points or might decrease your points
3. How much does the leader contribute to the group pool? a. However much they choose to allocate to the group pool b. 10 points c. Depends on the points given to the leader d. Depends on the group member’s contributions
4. Which of the following can the leader NOT do? a. Nothing b. Accept points from a group member c. Take points away from a group member d. Accept points and take points away from the same group member
5. If a leader does not accept points where do these points go? a. Goes to the leader anyway b. Goes back to the group member c. Goes to the experimenter d. Is added to the group pool
6. What actions of other group members can group members (not leader) see? a. Leader’s action towards them b. Leader’s contribution c. Leader’s contribution and all actions d. All group member and leader actions
© 2017 Macmillan Publishers Limited, part of Springer Nature. All rights reserved.
NATURE HUMAN BEHAVIOUR | DOI: 10.1038/s41562-017-0138 | www.nature.com/nathumbehav 50
SUPPLEMENTARY INFORMATION

51
Bribery Game with Partial Transparency First Round
Welcome to the first round. The screen you see in front of you is the normal screen for play. In each period, one person from the group will be selected at random to play the role of a leader. The leader will have a slightly different screen. Please pay attention to all screens presented in these instructions as the instructions for other other rounds will only highlight the differences between that round and this one.
© 2017 Macmillan Publishers Limited, part of Springer Nature. All rights reserved.
NATURE HUMAN BEHAVIOUR | DOI: 10.1038/s41562-017-0138 | www.nature.com/nathumbehav 51
SUPPLEMENTARY INFORMATION

52
The first thing we’d like to draw your attention to is the pool multiplier. When group members allocate points to the group pool, the total allocated by the group is multipled by this number, the pool multiplier. In this case, it’s 1.2. The new total is then distributed equally among everyone in the group, including the leader. This means that if every group member allocated all their points, all group members would increase their earnings by 20%. If no one allocates to the group pool, there’s nothing to multiply by 1.2, and nothing to divide up. Another way to think about this is to consider how much each point in the pool is worth to each player. This is shown within parantheses to the right of the pool multiplier. In this case, with 3 players, each player gets 0.4 points for every point in the pool, no matter who contributes it. For example, if each player contributed 1 point pool, there would be 3 points in the pool and each player would get back 3 times 0.4 or 1.2 points.
© 2017 Macmillan Publishers Limited, part of Springer Nature. All rights reserved.
NATURE HUMAN BEHAVIOUR | DOI: 10.1038/s41562-017-0138 | www.nature.com/nathumbehav 52
SUPPLEMENTARY INFORMATION

53
Below this, we see your initial endowment of 12 points. 2 points are taxed each period, which can be used by the leader to take points away from group members. This leaves you 10 points to allocate.
Here you see the Take Away multiplier. This is how much each tax point is multiplied by when the leader takes points away from a group member. For example, here, if the leader spent 1 tax point to take points away, 1.5 points would be taken from the targeted group member.
© 2017 Macmillan Publishers Limited, part of Springer Nature. All rights reserved.
NATURE HUMAN BEHAVIOUR | DOI: 10.1038/s41562-017-0138 | www.nature.com/nathumbehav 53
SUPPLEMENTARY INFORMATION

54
Here we see the boxes that are used to allocate your remaining 10 points to either the group pool or to the leader. Any points you do not allocate will be kept for yourself. When you hover your mouse over these boxes you will see an arrow to increase or decrease the amount in 1 point intervals or you may type in a value.
When you have made your decision, click “Submit”. After clicking “Submit”, you will not be able to change your decision.
© 2017 Macmillan Publishers Limited, part of Springer Nature. All rights reserved.
NATURE HUMAN BEHAVIOUR | DOI: 10.1038/s41562-017-0138 | www.nature.com/nathumbehav 54
SUPPLEMENTARY INFORMATION

55
This section will show you the leader’s action. The leader has 3 choices – to take points from you, accept your points, or do nothing. They may only choose one of these options.
Here you see how your points for this period are calculated. Everything in green is added, everything in red is subtracted, and your total points for the period is shown in blue on the right. We will return to this after explaining the leader’s screen.
© 2017 Macmillan Publishers Limited, part of Springer Nature. All rights reserved.
NATURE HUMAN BEHAVIOUR | DOI: 10.1038/s41562-017-0138 | www.nature.com/nathumbehav 55
SUPPLEMENTARY INFORMATION

56
If you are the leader for a period, you will be identified at the top of the screen. Note that all group members, including the leader are anonymous to other group members. Your screen looks very similar to other group members, with a few differences.
Like other group members you pay a tax and choose how much you wish to allocate to the group pool and how much to keep for yourself, but, unlike other group members you do not contribute to the leader, since you are the leader and you would be contributing to yourself.
© 2017 Macmillan Publishers Limited, part of Springer Nature. All rights reserved.
NATURE HUMAN BEHAVIOUR | DOI: 10.1038/s41562-017-0138 | www.nature.com/nathumbehav 56
SUPPLEMENTARY INFORMATION

57
You also have access to tax points that you may use for taking away points from group members based on the Take Away multiplier.
When you have made your decision about how many points to allocate to the group pool, click “Submit”. After clicking “Submit”, you will not be able to change your decision.
© 2017 Macmillan Publishers Limited, part of Springer Nature. All rights reserved.
NATURE HUMAN BEHAVIOUR | DOI: 10.1038/s41562-017-0138 | www.nature.com/nathumbehav 57
SUPPLEMENTARY INFORMATION

58
The actions of group members will appear below this after they make their decision. The Contribution column are the contributions to the group pool and the Payment column shows points given to you, the Leader.
You may do nothing…
© 2017 Macmillan Publishers Limited, part of Springer Nature. All rights reserved.
NATURE HUMAN BEHAVIOUR | DOI: 10.1038/s41562-017-0138 | www.nature.com/nathumbehav 58
SUPPLEMENTARY INFORMATION

59
accept these points…
or take points away from any group member. If you take away points, you decide how much to take by allocating tax points to the group member. The total points taken away is calculated for you next to this box.
© 2017 Macmillan Publishers Limited, part of Springer Nature. All rights reserved.
NATURE HUMAN BEHAVIOUR | DOI: 10.1038/s41562-017-0138 | www.nature.com/nathumbehav 59
SUPPLEMENTARY INFORMATION

60
Any tax points not used for taking away points from group members will be returned to the experimenter. Similarly any points taken away from group members will also be returned to the experimenter.
As a leader your earnings for this period will be calculated from your initial endowment minus your taxes, minus your contribution, plus the average contribution to the pool – 2.67, multiplied by the pool multiplier, plus any points you accepted, giving you a total of 10.2 for this period.
© 2017 Macmillan Publishers Limited, part of Springer Nature. All rights reserved.
NATURE HUMAN BEHAVIOUR | DOI: 10.1038/s41562-017-0138 | www.nature.com/nathumbehav 60
SUPPLEMENTARY INFORMATION

61
After the leader clicks submit, group members will be informed of the leader’s action and the leader’s contribution to the pool. The earnings of group members for this period will be calculated from their initial endowment minus their taxes, minus their contribution. Then either minus the points taken away by the leader OR minus the points given to the leader. Any points given to the leader and not accepted will be returned to the group member. In the example here, the leader chose to take points away from the group member. Finally, the group members share of the group pool will be added to this amount to calculate the total points for this period. Here the average contribution is shown – 2.67 points. This is multiplied by the pool multiplier and then added to give total points – 5.7 for this group member.
Please click “Done” at the bottom of the screen to move to the next period.
Please click “Continue” when you are ready to begin.
© 2017 Macmillan Publishers Limited, part of Springer Nature. All rights reserved.
NATURE HUMAN BEHAVIOUR | DOI: 10.1038/s41562-017-0138 | www.nature.com/nathumbehav 61
SUPPLEMENTARY INFORMATION

62
Subsequent Round
The difference between this round and previous rounds is that in this round, like other group members, the leader must choose how much to contribute to the group pool. They may also accept points from group members.
In addition, group members not only see the leader’s action towards them, but also the leader’s
© 2017 Macmillan Publishers Limited, part of Springer Nature. All rights reserved.
NATURE HUMAN BEHAVIOUR | DOI: 10.1038/s41562-017-0138 | www.nature.com/nathumbehav 62
SUPPLEMENTARY INFORMATION

63
contribution to the group pool. They do not see the leader’s actions towards other group members. As in all rounds, all participants are completely anonymous.
Please click “Continue” when you are ready to begin.
Quiz Questions 1. How many periods will you play?
a. 10 periods b. More than 10 periods c. Less than 10 periods d. An average of 10 periods, but possibly more and possibly less
2. If everyone contributes the same amount to the group pool, will you: a. Increase your points from your initial endowment b. Decrease your points from your initial endowment c. Have the same points as your initial endowment d. Might increase your points or might decrease your points
3. How much does the leader contribute to the group pool? a. However much they choose to allocate to the group pool b. 10 points c. Depends on the points given to the leader d. Depends on the group member’s contributions
4. Which of the following can the leader NOT do? a. Nothing b. Accept points from a group member c. Take points away from a group member d. Accept points and take points away from the same group member
5. If a leader does not accept points where do these points go? a. Goes to the leader anyway b. Goes back to the group member c. Goes to the experimenter d. Is added to the group pool
6. What actions of other group members can group members see? a. Leader’s action towards them b. Leader’s contribution c. Leader’s contribution and all actions d. All group member and leader actions
© 2017 Macmillan Publishers Limited, part of Springer Nature. All rights reserved.
NATURE HUMAN BEHAVIOUR | DOI: 10.1038/s41562-017-0138 | www.nature.com/nathumbehav 63
SUPPLEMENTARY INFORMATION

64
Bribery Game with Full Transparency First Round
Welcome to the first round. The screen you see in front of you is the normal screen for play. In each period, one person from the group will be selected at random to play the role of a leader. The leader will have a slightly different screen. Please pay attention to all screens presented in these instructions as the instructions for other other rounds will only highlight the differences between that round and this one.
© 2017 Macmillan Publishers Limited, part of Springer Nature. All rights reserved.
NATURE HUMAN BEHAVIOUR | DOI: 10.1038/s41562-017-0138 | www.nature.com/nathumbehav 64
SUPPLEMENTARY INFORMATION

65
The first thing we’d like to draw your attention to is the pool multiplier. When group members allocate points to the group pool, the total allocated by the group is multipled by this number, the pool multiplier. In this case, it’s 1.2. The new total is then distributed equally among everyone in the group, including the leader. This means that if every group member allocated all their points, all group members would increase their earnings by 20%. If no one allocates to the group pool, there’s nothing to multiply by 1.2, and nothing to divide up. Another way to think about this is to consider how much each point in the pool is worth to each player. This is shown within parantheses to the right of the pool multiplier. In this case, with 3 players, each player gets 0.4 points for every point in the pool, no matter who contributes it. For example, if each player contributed 1 point pool, there would be 3 points in the pool and each player would get back 3 times 0.4 or 1.2 points.
© 2017 Macmillan Publishers Limited, part of Springer Nature. All rights reserved.
NATURE HUMAN BEHAVIOUR | DOI: 10.1038/s41562-017-0138 | www.nature.com/nathumbehav 65
SUPPLEMENTARY INFORMATION

66
Below this, we see your initial endowment of 12 points. 2 points are taxed each period, which can be used by the leader to take points away from group members. This leaves you 10 points to allocate.
Here you see the Take Away multiplier. This is how much each tax point is multiplied by when the leader takes points away from a group member. For example, here, if the leader spent 1 tax point to take points away, 1.5 points would be taken from the targeted group member.
© 2017 Macmillan Publishers Limited, part of Springer Nature. All rights reserved.
NATURE HUMAN BEHAVIOUR | DOI: 10.1038/s41562-017-0138 | www.nature.com/nathumbehav 66
SUPPLEMENTARY INFORMATION

67
Here we see the boxes that are used to allocate your remaining 10 points to either the group pool or to the leader. Any points you do not allocate will be kept for yourself. When you hover your mouse over these boxes you will see an arrow to increase or decrease the amount in 1 point intervals or you may type in a value.
When you have made your decision, click “Submit”. After clicking “Submit”, you will not be able to change your decision.
© 2017 Macmillan Publishers Limited, part of Springer Nature. All rights reserved.
NATURE HUMAN BEHAVIOUR | DOI: 10.1038/s41562-017-0138 | www.nature.com/nathumbehav 67
SUPPLEMENTARY INFORMATION

68
This section will show you the leader’s action. The leader has 3 choices – to take points from you, accept your points, or do nothing. They may only choose one of these options.
Here you see how your points for this period are calculated. Everything in green is added, everything in red is subtracted, and your total points for the period is shown in blue on the right. We will return to this after explaining the leader’s screen.
© 2017 Macmillan Publishers Limited, part of Springer Nature. All rights reserved.
NATURE HUMAN BEHAVIOUR | DOI: 10.1038/s41562-017-0138 | www.nature.com/nathumbehav 68
SUPPLEMENTARY INFORMATION

69
If you are the leader for a period, you will be identified at the top of the screen. Note that all group members, including the leader are anonymous to other group members. Your screen looks very similar to other group members, with a few differences.
Like other group members you pay a tax and choose how much you wish to allocate to the group pool and how much to keep for yourself, but, unlike other group members you do not contribute to the leader, since you are the leader and you would be contributing to yourself.
© 2017 Macmillan Publishers Limited, part of Springer Nature. All rights reserved.
NATURE HUMAN BEHAVIOUR | DOI: 10.1038/s41562-017-0138 | www.nature.com/nathumbehav 69
SUPPLEMENTARY INFORMATION

70
You also have access to tax points that you may use for taking away points from group members based on the Take Away multiplier.
When you have made your decision about how many points to allocate to the group pool, click “Submit”. After clicking “Submit”, you will not be able to change your decision.
© 2017 Macmillan Publishers Limited, part of Springer Nature. All rights reserved.
NATURE HUMAN BEHAVIOUR | DOI: 10.1038/s41562-017-0138 | www.nature.com/nathumbehav 70
SUPPLEMENTARY INFORMATION

71
The actions of group members will appear below this after they make their decision. The Contribution column are the contributions to the group pool and the Payment column shows points given to you, the Leader.
You may do nothing…
© 2017 Macmillan Publishers Limited, part of Springer Nature. All rights reserved.
NATURE HUMAN BEHAVIOUR | DOI: 10.1038/s41562-017-0138 | www.nature.com/nathumbehav 71
SUPPLEMENTARY INFORMATION

72
accept these points…
or take points away from any group member. If you take away points, you decide how much to take by allocating tax points to the group member. The total points taken away is calculated for you next to this box.
© 2017 Macmillan Publishers Limited, part of Springer Nature. All rights reserved.
NATURE HUMAN BEHAVIOUR | DOI: 10.1038/s41562-017-0138 | www.nature.com/nathumbehav 72
SUPPLEMENTARY INFORMATION

73
Any tax points not used for taking away points from group members will be returned to the experimenter. Similarly any points taken away from group members will also be returned to the experimenter.
As a leader your earnings for this period will be calculated from your initial endowment minus your taxes, minus your contribution, plus the average contribution to the pool – 2.67, multiplied by the pool multiplier, plus any points you accepted, giving you a total of 10.2 for this period.
© 2017 Macmillan Publishers Limited, part of Springer Nature. All rights reserved.
NATURE HUMAN BEHAVIOUR | DOI: 10.1038/s41562-017-0138 | www.nature.com/nathumbehav 73
SUPPLEMENTARY INFORMATION

74
After the leader clicks submit, group members will be informed of the leader’s action and the leader’s contribution to the pool. The earnings of group members for this period will be calculated from their initial endowment minus their taxes, minus their contribution. Then either minus the points taken away by the leader OR minus the points given to the leader. Any points given to the leader and not accepted will be returned to the group member. In the example here, the leader chose to take points away from the group member. Finally, the group members share of the group pool will be added to this amount to calculate the total points for this period. Here the average contribution is shown – 2.67 points. This is multiplied by the pool multiplier and then added to give total points – 5.7 for this group member.
© 2017 Macmillan Publishers Limited, part of Springer Nature. All rights reserved.
NATURE HUMAN BEHAVIOUR | DOI: 10.1038/s41562-017-0138 | www.nature.com/nathumbehav 74
SUPPLEMENTARY INFORMATION

75
Group members will also be informed of the leader’s decision for each decision made by other group members. Each line shows a group member’s contribution to the pool, contribution to the leader and the leader’s action. Group members themselves remain anonymous.
Please click “Done” at the bottom of the screen to move to the next period.
© 2017 Macmillan Publishers Limited, part of Springer Nature. All rights reserved.
NATURE HUMAN BEHAVIOUR | DOI: 10.1038/s41562-017-0138 | www.nature.com/nathumbehav 75
SUPPLEMENTARY INFORMATION

76
Please click “Continue” when you are ready to begin.
© 2017 Macmillan Publishers Limited, part of Springer Nature. All rights reserved.
NATURE HUMAN BEHAVIOUR | DOI: 10.1038/s41562-017-0138 | www.nature.com/nathumbehav 76
SUPPLEMENTARY INFORMATION

77
Subsequent Round
The difference between this round and previous rounds is that in this round, like other group members, the leader must choose how much to contribute to the group pool. They may also accept points from group members.
In addition, group members not only see the leader’s action towards them, but also the leader’s
© 2017 Macmillan Publishers Limited, part of Springer Nature. All rights reserved.
NATURE HUMAN BEHAVIOUR | DOI: 10.1038/s41562-017-0138 | www.nature.com/nathumbehav 77
SUPPLEMENTARY INFORMATION

78
contribution to the group pool and the leader’s actions towards other group members, including what the other group members contributed to the group pool and to the leader. As in all rounds, all participants are completely anonymous.
Please click “Continue” when you are ready to begin.
Quiz Questions 1. How many periods will you play?
a. 10 periods b. More than 10 periods c. Less than 10 periods d. An average of 10 periods, but possibly more and possibly less
2. If everyone contributes the same amount to the group pool, will you: a. Increase your points from your initial endowment b. Decrease your points from your initial endowment c. Have the same points as your initial endowment d. Might increase your points or might decrease your points
3. How much does the leader contribute to the group pool? a. However much they choose to allocate to the group pool b. 10 points c. Depends on the points given to the leader d. Depends on the group member’s contributions
4. Which of the following can the leader NOT do? a. Nothing b. Accept points from a group member c. Take points away from a group member d. Accept points and take points away from the same group member
5. If a leader does not accept points where do these points go? a. Goes to the leader anyway b. Goes back to the group member c. Goes to the experimenter d. Is added to the group pool
6. What actions of other group members can group members see? a. Leader’s action towards them b. Leader’s contribution c. Leader’s contribution and all actions d. All group member and leader actions
© 2017 Macmillan Publishers Limited, part of Springer Nature. All rights reserved.
NATURE HUMAN BEHAVIOUR | DOI: 10.1038/s41562-017-0138 | www.nature.com/nathumbehav 78
SUPPLEMENTARY INFORMATION

79
Bribery Game with Leader Investment First Round
Welcome to the first round. The screen you see in front of you is the normal screen for play. In each period, one person from the group will be selected at random to play the role of a leader. The leader will have a slightly different screen. Please pay attention to all screens presented in these instructions as the instructions for other other rounds will only highlight the differences between that round and this one.
© 2017 Macmillan Publishers Limited, part of Springer Nature. All rights reserved.
NATURE HUMAN BEHAVIOUR | DOI: 10.1038/s41562-017-0138 | www.nature.com/nathumbehav 79
SUPPLEMENTARY INFORMATION

80
The first thing we’d like to draw your attention to is the pool multiplier. When group members allocate points to the group pool, the total allocated by the group is multipled by this number, the pool multiplier. In this case, it’s 1.2. The new total is then distributed equally among everyone in the group, including the leader. This means that if every group member allocated all their points, all group members would increase their earnings by 20%. If no one allocates to the group pool, there’s nothing to multiply by 1.2, and nothing to divide up. Another way to think about this is to consider how much each point in the pool is worth to each player. This is shown within parantheses to the right of the pool multiplier. In this case, with 3 players, each player gets 0.4 points for every point in the pool, no matter who contributes it. For example, if each player contributed 1 point pool, there would be 3 points in the pool and each player would get back 3 times 0.4 or 1.2 points.
© 2017 Macmillan Publishers Limited, part of Springer Nature. All rights reserved.
NATURE HUMAN BEHAVIOUR | DOI: 10.1038/s41562-017-0138 | www.nature.com/nathumbehav 80
SUPPLEMENTARY INFORMATION

81
Below this, we see your initial endowment of 12 points. 2 points are taxed each period, which can be used by the leader to take points away from group members. This leaves you 10 points to allocate.
Here you see the Take Away multiplier. This is how much each tax point is multiplied by when the leader takes points away from a group member. For example, here, if the leader spent 1 tax point to take points away, 1.5 points would be taken from the targeted group member.
© 2017 Macmillan Publishers Limited, part of Springer Nature. All rights reserved.
NATURE HUMAN BEHAVIOUR | DOI: 10.1038/s41562-017-0138 | www.nature.com/nathumbehav 81
SUPPLEMENTARY INFORMATION

82
Here we see the boxes that are used to allocate your remaining 10 points to either the group pool or to the leader. Any points you do not allocate will be kept for yourself. When you hover your mouse over these boxes you will see an arrow to increase or decrease the amount in 1 point intervals or you may type in a value.
When you have made your decision, click “Submit”. After clicking “Submit”, you will not be able to change your decision.
© 2017 Macmillan Publishers Limited, part of Springer Nature. All rights reserved.
NATURE HUMAN BEHAVIOUR | DOI: 10.1038/s41562-017-0138 | www.nature.com/nathumbehav 82
SUPPLEMENTARY INFORMATION

83
This section will show you the leader’s action. The leader has 3 choices – to take points from you, accept your points, or do nothing. They may only choose one of these options.
Here you see how your points for this period are calculated. Everything in green is added, everything in red is subtracted, and your total points for the period is shown in blue on the right. We will return to this after explaining the leader’s screen.
© 2017 Macmillan Publishers Limited, part of Springer Nature. All rights reserved.
NATURE HUMAN BEHAVIOUR | DOI: 10.1038/s41562-017-0138 | www.nature.com/nathumbehav 83
SUPPLEMENTARY INFORMATION

84
If you are the leader for a period, you will be identified at the top of the screen. Note that all group members, including the leader are anonymous to other group members. Your screen looks very similar to other group members, with a few differences.
Like other group members you pay a tax; but, unlike other group members you automatically contribute the maximum amount to the group pool.
© 2017 Macmillan Publishers Limited, part of Springer Nature. All rights reserved.
NATURE HUMAN BEHAVIOUR | DOI: 10.1038/s41562-017-0138 | www.nature.com/nathumbehav 84
SUPPLEMENTARY INFORMATION

85
You also have access to tax points that you may use for taking away points from group members based on the Take Away multiplier.
The actions of group members will appear below this after they make their decision. The Contribution column are the contributions to the group pool and the Payment column shows points given to you, the Leader.
© 2017 Macmillan Publishers Limited, part of Springer Nature. All rights reserved.
NATURE HUMAN BEHAVIOUR | DOI: 10.1038/s41562-017-0138 | www.nature.com/nathumbehav 85
SUPPLEMENTARY INFORMATION

86
You may do nothing…
accept these points…
© 2017 Macmillan Publishers Limited, part of Springer Nature. All rights reserved.
NATURE HUMAN BEHAVIOUR | DOI: 10.1038/s41562-017-0138 | www.nature.com/nathumbehav 86
SUPPLEMENTARY INFORMATION

87
or take points away from any group member. If you take away points, you decide how much to take by allocating tax points to the group member. The total points taken away is calculated for you next to this box.
Any tax points not used for taking away points from group members will be returned to the experimenter. Similarly any points taken away from group members will also be returned to the experimenter.
© 2017 Macmillan Publishers Limited, part of Springer Nature. All rights reserved.
NATURE HUMAN BEHAVIOUR | DOI: 10.1038/s41562-017-0138 | www.nature.com/nathumbehav 87
SUPPLEMENTARY INFORMATION

88
As a leader your earnings for this period are determined by how much you receive from your share of the group pool and the points you accept from each group member.
The average contribution of group members is shown here – 5 points. This is multiplied by the pool multiplier then added to accepted points to give the total points for this period – 6.
After the leader clicks submit, group members will be informed of the leader’s action. The earnings of group members for this period will be calculated from their initial endowment minus their taxes,
© 2017 Macmillan Publishers Limited, part of Springer Nature. All rights reserved.
NATURE HUMAN BEHAVIOUR | DOI: 10.1038/s41562-017-0138 | www.nature.com/nathumbehav 88
SUPPLEMENTARY INFORMATION

89
minus their contribution. Then either minus the points taken away by the leader OR minus the points given to the leader. Any points given to the leader and not accepted will be returned to the group member. In the example here, the leader chose to take points away from the group member. Finally, the group members share of the group pool will be added to this amount to calculate the total points for this period. Here the average contribution is shown – 5 points. This is multiplied by the pool multiplier and then added to give total points – 8.5 for this group member.
Please click “Done” at the bottom of the screen to move to the next period.
Please click “Continue” when you are ready to begin.
© 2017 Macmillan Publishers Limited, part of Springer Nature. All rights reserved.
NATURE HUMAN BEHAVIOUR | DOI: 10.1038/s41562-017-0138 | www.nature.com/nathumbehav 89
SUPPLEMENTARY INFORMATION

90
Subsequent Round
The difference between this round and previous rounds is that in this round, the leader automatically contributes the maximum amount to the group pool and may accept points from group members.
In addition, group members only see the leader’s action towards them. They do not see the actions
© 2017 Macmillan Publishers Limited, part of Springer Nature. All rights reserved.
NATURE HUMAN BEHAVIOUR | DOI: 10.1038/s41562-017-0138 | www.nature.com/nathumbehav 90
SUPPLEMENTARY INFORMATION

91
of others group members or the leader’s actions towards other group members. As in all rounds, all participants are completely anonymous.
Please click “Continue” when you are ready to begin.
Quiz Questions 1. How many periods will you play?
a. 10 periods b. More than 10 periods c. Less than 10 periods d. An average of 10 periods, but possibly more and possibly less
2. If everyone contributes the same amount to the group pool, will you: a. Increase your points from your initial endowment b. Decrease your points from your initial endowment c. Have the same points as your initial endowment d. Might increase your points or might decrease your points
3. How much does the leader contribute to the group pool? a. However much they choose to allocate to the group pool b. 10 points c. Depends on the points given to the leader d. Depends on the group member’s contributions
4. Which of the following can the leader NOT do? a. Nothing b. Accept points from a group member c. Take points away from a group member d. Accept points and take points away from the same group member
5. If a leader does not accept points where do these points go? a. Goes to the leader anyway b. Goes back to the group member c. Goes to the experimenter d. Is added to the group pool
6. What actions of other group members can group members (not leader) see? a. Leader’s action towards them b. Leader’s contribution c. Leader’s contribution and all actions d. All group member and leader actions
© 2017 Macmillan Publishers Limited, part of Springer Nature. All rights reserved.
NATURE HUMAN BEHAVIOUR | DOI: 10.1038/s41562-017-0138 | www.nature.com/nathumbehav 91
SUPPLEMENTARY INFORMATION

92
Supplementary Results Data Analyses
We analyzed our data using generalized linear mixed models (GLMM), calculating coefficients using a Monte Carlo-Markov Chain (MCMC) implemented by the R package MCMCglmm7. All Bayesian models pass the Gelman and Rubin8 convergence diagnostic, implemented in the gelman.diag function of the coda9 package. Categorical models are rescaled to log odds as per Hadfield10 course notes for MCMCglmm. Confidence intervals (95%) were calculated as Highest Posterior Density (HPD) using the HPDinterval function in the coda package9.
We provide a frequentist equivalent to each analysis (with no substantive difference in interpretation).
In all models, we account for the clustering inherent in the experimental design by including a fixed effect for the number of subjects and random effects for participants within groups.
All data is available at FigShare: https://doi.org/10.6084/m9.figshare.5004956
Predictions Based on the logic that leaders can make more money by using money to extract bribes from every player than by increasing the size of the public good, we predict the following:
1. For the regression on contribution: 𝑐𝑐 = 𝛽𝛽1𝑆𝑆 + 𝛽𝛽2𝑀𝑀 + 𝜖𝜖: a. 𝛽𝛽1 > 0 in IPGG, i.e. stronger leaders result in higher contributions b. 𝛽𝛽1 < 0 if BG, i.e. stronger leaders results in lower contributions c. 𝛽𝛽2 > 0 in IPGG d. 𝛽𝛽2 ≥ 0 in BG (depending on prior contribution preferences)
2. For the regression on bribes: 𝑏𝑏 = 𝛽𝛽1𝑆𝑆 + 𝛽𝛽2𝑀𝑀 + 𝜖𝜖: a. 𝛽𝛽1 > 0, i.e. more bribes offered when leaders more powerful b. 𝛽𝛽2 ≤ 0, i.e. no change in bribes or less bribes offered when economic potential is
higher 3. In the BG, for the regression on punishment: 𝑝𝑝 = 𝛽𝛽1𝑐𝑐 + 𝛽𝛽2𝑏𝑏 + 𝛽𝛽3𝑏𝑏×𝑆𝑆 + 𝛽𝛽4𝑏𝑏×𝑀𝑀 + 𝜖𝜖:
a. 𝛽𝛽3 < 0, i.e. more punishment will be allocated for bribes when leaders are more powerful.
b. 𝛽𝛽4 ≤ 0, i.e. no change in punishment based on economic potential, but if there is a change, it will be less when economic potential is higher.
4. By corollary, for the regression on Leader decisions: 𝐴𝐴𝑐𝑐𝑐𝑐𝐴𝐴𝑝𝑝𝐴𝐴 𝐵𝐵𝐵𝐵𝐵𝐵𝑏𝑏𝐴𝐴 = 𝛽𝛽1𝑆𝑆 + 𝛽𝛽2𝑀𝑀 + 𝜖𝜖: a. 𝛽𝛽1 > 0, i.e. more acceptance of bribes (compared to doing nothing or punishing)
when leaders are more powerful.
© 2017 Macmillan Publishers Limited, part of Springer Nature. All rights reserved.
NATURE HUMAN BEHAVIOUR | DOI: 10.1038/s41562-017-0138 | www.nature.com/nathumbehav 92
SUPPLEMENTARY INFORMATION

93
Variables cContribution Raw, centered contribution to public good zContribution z-score of contribution to public good cBribe Raw, centered bribe to Leader zBribe z-score of bribe to Leader cPunishment Raw, centered punishment zPunishment z-score of punishment cPlayerExposureCorruption Raw, centered player corruption score from
countries they’ve lived in zPlayerExposureCorruption z-score of player corruption score from
countries they’ve lived in cLeaderExposureCorruption Raw, centered leader corruption score from
countries they’ve lived in zLeaderExposureCorruption z-score of leader corruption score from
countries they’ve lived in MPCR Marginal per capita rate of return (0.3 or 0.6) LeaderPower Multiplier on leader punishment (1 or 3) Cond Treatment:
Control=Public Goods Game; BG=Bribery Game; BG_Part_Trans = BG + Partial Transparency BG_Full_Trans = BG + Full Transparency BG_Leader= BG + Leader Investment
Period Period of game – only first 10 were analyzed Version Depending on whether background questions
were given before or after the game Order Each subject played 4 of 5 treatments. Order
specifies the order in which they played that particular treatment
Subjects Number of players in the group Age Age in years Male Gender (Male = 1; Female = 0) PID Participant ID GroupNum Group ID
Cost of Corruption Here we compare behavior in the standard institutional punishment Public Goods Game to behavior in the Bribery Game – identical in all ways, except the additional option of the bribe. Here and in all cases, we show the R code for the model, with the output in a clean table format. The data and R code are available on DataDryad.
© 2017 Macmillan Publishers Limited, part of Springer Nature. All rights reserved.
NATURE HUMAN BEHAVIOUR | DOI: 10.1038/s41562-017-0138 | www.nature.com/nathumbehav 93
SUPPLEMENTARY INFORMATION

94
Contributions Bayesian Model mcmcmodel <- MCMCglmm(cContribution ~ factor(MPCR)+factor(LeaderPower) + factor(Cond) + Period + factor(Version) + Subjects + as.numeric(Order) + scale(age) + male, random=~PID:GroupNum, data=levi[levi$Cond=="BG" | levi$Cond=="Control",]) For the standardized version, zContribution was regressed instead.
Results
Table S1. MCMC GLMM regression on raw, unstandardized contribution.
© 2017 Macmillan Publishers Limited, part of Springer Nature. All rights reserved.
NATURE HUMAN BEHAVIOUR | DOI: 10.1038/s41562-017-0138 | www.nature.com/nathumbehav 94
SUPPLEMENTARY INFORMATION

95
Table S2. MCMC GLMM regression on z-score of contribution to calculate standardized
coefficients.
Frequentist Model model <- lmer(cContribution ~ factor(MPCR)+factor(LeaderPower)+factor(Cond) + Period + factor(Version) + Subjects + Order +age+male+ (1| PID)+ (1 | GroupNum), data= data=levi[levi$Cond=="BG" | levi$Cond=="Control",])
© 2017 Macmillan Publishers Limited, part of Springer Nature. All rights reserved.
NATURE HUMAN BEHAVIOUR | DOI: 10.1038/s41562-017-0138 | www.nature.com/nathumbehav 95
SUPPLEMENTARY INFORMATION

96
Results
Table S3. Multilevel model regressing raw, unstandardized contribution with random effects for participants within groups. The variance explained by both fixed and random factors11,12
is 𝑹𝑹𝟐𝟐 = 𝟎𝟎. 𝟕𝟕𝟕𝟕.
© 2017 Macmillan Publishers Limited, part of Springer Nature. All rights reserved.
NATURE HUMAN BEHAVIOUR | DOI: 10.1038/s41562-017-0138 | www.nature.com/nathumbehav 96
SUPPLEMENTARY INFORMATION

97
Standardized Score
Table S4. Multilevel model regressing z-score of contribution to calculate standardized coefficients, with random effects for participants within groups. The variance explained by
both fixed and random factors11,12 is 𝑹𝑹𝟐𝟐 = 𝟎𝟎. 𝟕𝟕𝟕𝟕.
Causes of Corruption Here we test the predictors of player contributions, bribes, and leader behavior:
Contributions We predict a negative interaction between game (IPGG vs BG) and leader power (𝑆𝑆) and between game and economic potential (𝑀𝑀). That is, stronger leaders will increase contributions in the IPGG, but decrease contributions in BG. And higher economic potential will increase contributions in the IPGG, but will have no effect or a smaller effect in the BG.
© 2017 Macmillan Publishers Limited, part of Springer Nature. All rights reserved.
NATURE HUMAN BEHAVIOUR | DOI: 10.1038/s41562-017-0138 | www.nature.com/nathumbehav 97
SUPPLEMENTARY INFORMATION

98
Bayesian Model zContribution ~ factor(MPCR) * factor(Cond) + factor(LeaderPower) * factor(Cond) + factor(Cond) + Period + factor(Version) + Subjects + as.numeric(Order) + scale(age) + male
Results
Table S5. MCMC GLMM regression on raw, unstandardized contribution.
© 2017 Macmillan Publishers Limited, part of Springer Nature. All rights reserved.
NATURE HUMAN BEHAVIOUR | DOI: 10.1038/s41562-017-0138 | www.nature.com/nathumbehav 98
SUPPLEMENTARY INFORMATION

99
Table S6. MCMC GLMM regression on z-score of contribution to calculate standardized
coefficients.
We can graph these effects:
Figure S15. Comparison of contributions in the IPGG (Control) and BG for weak vs strong leaders by poor vs rich economic potential. Overall contributions are lower in BG in all
© 2017 Macmillan Publishers Limited, part of Springer Nature. All rights reserved.
NATURE HUMAN BEHAVIOUR | DOI: 10.1038/s41562-017-0138 | www.nature.com/nathumbehav 99
SUPPLEMENTARY INFORMATION

100
contexts. Overall contributions are higher in richer economic potential contexts. As predicted, when leaders are stronger, we see a slight increase in contributions in the IPGG, but a decrease in the BG. Also, as predicted, the effect of economic potential on increasing
contributions is weaker in the BG compared to the IPGG.
Summary These results partially support our hypothesis. Stronger leaders barely increase contributions in the IPGG, but clearly decrease contributions in the BG (as predicted). Moreover, the effect of richer economic potential is lower in the BG compared to the IPGG (as predicted).
Next, we test our prediction that stronger leaders increase bribes (rather than contributions) in the BG.
Frequentist Model cContribution ~ factor(MPCR) * factor(Cond) + factor(LeaderPower) * factor(Cond) + factor(Cond) + Period + factor(Version) + Subjects + as.numeric(Order) + scale(age) + male + (1 | PID) + (1 | GroupNum) Data: dat[dat$Cond == "BG" | dat$Cond == "Control", ]
Results
Table S7. Multilevel model regressing raw, unstandardized contribution with random effects for participants within groups. The variance explained by both fixed and random factors11,12
is 𝑹𝑹𝟐𝟐 = 𝟎𝟎. 𝟕𝟕𝟕𝟕.
© 2017 Macmillan Publishers Limited, part of Springer Nature. All rights reserved.
NATURE HUMAN BEHAVIOUR | DOI: 10.1038/s41562-017-0138 | www.nature.com/nathumbehav 100
SUPPLEMENTARY INFORMATION

101
Table S8. Multilevel model regressing z-score of contribution to calculate standardized coefficients, with random effects for participants within groups. The variance explained by
both fixed and random factors11,12 is 𝑹𝑹𝟐𝟐 = 𝟎𝟎. 𝟕𝟕𝟕𝟕.
Bribes We predict a positive effect of leader power (𝑆𝑆) on bribes, but no effect or a negative effect of economic potential (𝑀𝑀). That is, stronger leaders will increase bribes.
Bayesian Model mcmcmodel <- MCMCglmm(zBribe ~ factor(MPCR) + factor(LeaderPower) + Period + factor(Version) + Subjects + as.numeric(Order) + scale(age) + male, random=~PID:GroupNum, data=dat[dat$Cond=="BG",])
© 2017 Macmillan Publishers Limited, part of Springer Nature. All rights reserved.
NATURE HUMAN BEHAVIOUR | DOI: 10.1038/s41562-017-0138 | www.nature.com/nathumbehav 101
SUPPLEMENTARY INFORMATION

102
Results
Table S9. MCMC GLMM regression on raw, unstandardized bribe.
Table S10. MCMC GLMM regression on z-score of bribe to calculate standardized
coefficients.
We can graph these effects:
© 2017 Macmillan Publishers Limited, part of Springer Nature. All rights reserved.
NATURE HUMAN BEHAVIOUR | DOI: 10.1038/s41562-017-0138 | www.nature.com/nathumbehav 102
SUPPLEMENTARY INFORMATION

103
Figure S16. Comparison of bribes in the BG for weak vs strong leaders by poor vs rich economic potential. As predicted, when leaders are stronger, we see an increase in bribes.
Summary As predicted, we find that stronger leaders extract larger bribes. Surprisingly, we find some possible evidence that this effect is stronger in richer economic potential than poorer. If these results generalize, one possible explanation for this is that Leader’s and players have a non-zero norm for prosocial contributions. Leader’s use punishment to achieve this minimum contribution. Since this contribution is more likely to be met in a richer economic potential context, leaders use more of their punitive power to extract bribes.
Next, we look at what predicts when Leaders will punish. If this hypothesis about leader’s expecting a minimum contribution to the pubic good is correct, then we should see contributions predict punishment in the BG (not just bribes).
Frequentist Model model <- lmer(cBribe ~ factor(MPCR) + factor(LeaderPower) + Period + factor(Version) + Subjects + as.numeric(Order) + scale(age) + male + (1|PID) + (1|GroupNum),
© 2017 Macmillan Publishers Limited, part of Springer Nature. All rights reserved.
NATURE HUMAN BEHAVIOUR | DOI: 10.1038/s41562-017-0138 | www.nature.com/nathumbehav 103
SUPPLEMENTARY INFORMATION

104
data=dat[dat$Cond=="BG",])
Results
Table S11. Multilevel model regressing raw, unstandardized bribe with random effects for participants within groups. The variance explained by both fixed and random factors11,12 is
𝑹𝑹𝟐𝟐 = 𝟎𝟎. 𝟕𝟕𝟎𝟎.
© 2017 Macmillan Publishers Limited, part of Springer Nature. All rights reserved.
NATURE HUMAN BEHAVIOUR | DOI: 10.1038/s41562-017-0138 | www.nature.com/nathumbehav 104
SUPPLEMENTARY INFORMATION

105
Table S12. Multilevel model regressing z-score of contribution to calculate standardized coefficients, with random effects for participants within groups. The variance explained by
both fixed and random factors11,12 is 𝑹𝑹𝟐𝟐 = 𝟎𝟎. 𝟕𝟕𝟎𝟎.
Punishment We predict that more punishments will be allocated to bribes and that Leader’s will be less tolerant of small bribes when they have more power (they’ll punish small bribes more).
Bayesian Model model <- lmer(cBribe ~ cPunishment ~ factor(MPCR) * cBribe + factor(LeaderPower) * cBribe + factor(MPCR) * cContribution + factor(LeaderPower) * cContribution + Period + factor(Version) + Subjects + as.numeric(Order) + scale(age) + male, data=dat[dat$Cond=="BG",])
© 2017 Macmillan Publishers Limited, part of Springer Nature. All rights reserved.
NATURE HUMAN BEHAVIOUR | DOI: 10.1038/s41562-017-0138 | www.nature.com/nathumbehav 105
SUPPLEMENTARY INFORMATION

106
Results
Table S13. MCMC GLMM regression on raw, unstandardized punishment.
© 2017 Macmillan Publishers Limited, part of Springer Nature. All rights reserved.
NATURE HUMAN BEHAVIOUR | DOI: 10.1038/s41562-017-0138 | www.nature.com/nathumbehav 106
SUPPLEMENTARY INFORMATION

107
Table S14. MCMC GLMM regression on z-score of punishment to calculate standardized
coefficients.
We can graph contributions and bribes against punishment (this is the actual data, not controlling for effects):
© 2017 Macmillan Publishers Limited, part of Springer Nature. All rights reserved.
NATURE HUMAN BEHAVIOUR | DOI: 10.1038/s41562-017-0138 | www.nature.com/nathumbehav 107
SUPPLEMENTARY INFORMATION

108
(a)
(b)
© 2017 Macmillan Publishers Limited, part of Springer Nature. All rights reserved.
NATURE HUMAN BEHAVIOUR | DOI: 10.1038/s41562-017-0138 | www.nature.com/nathumbehav 108
SUPPLEMENTARY INFORMATION

109
Figure S17. Punishment plotted against (a) Bribes and (b) Contribution. Loess curve to show pattern. High contributions, and certainly high bribes, are rare, but the overall pattern
suggests more punishments allocated for both low contributions and low bribes.
Summary As predicted, we find that more powerful leaders are more punitive towards smaller bribes (though this effect is marginally significant). Surprisingly, even in the BG, more powerful leaders are also more likely to punish smaller contributions. These results suggest that Leader’s possess either a pro-social or anti-corruption norm. Curiously, smaller bribes and contributions both receive smaller punishments when in a richer economic context. It is possible that in this richer economic context, contributions are more in line with Leader expectations, based purely on the norm and economic potential. If this is the case, we should expect that Leaders are more likely to do nothing or to accept bribes when economic potential is greater.
Frequentist Model model <- lmer(zPunishment ~ factor(MPCR)*zBribe + factor(LeaderPower)*zBribe + factor(MPCR)*zContribution + factor(LeaderPower)*zContribution + Period + factor(Version) + Subjects + as.numeric(Order) + scale(age) + male + (1|PID) + (1|GroupNum), data=dat[dat$Cond=="BG",])
© 2017 Macmillan Publishers Limited, part of Springer Nature. All rights reserved.
NATURE HUMAN BEHAVIOUR | DOI: 10.1038/s41562-017-0138 | www.nature.com/nathumbehav 109
SUPPLEMENTARY INFORMATION

110
Results
Table S15. Multilevel model regressing raw, unstandardized punishment with random
effects for participants within groups. The variance explained by both fixed and random factors11,12 is 𝑹𝑹𝟐𝟐 = 𝟎𝟎. 𝟕𝟕𝟕𝟕.
© 2017 Macmillan Publishers Limited, part of Springer Nature. All rights reserved.
NATURE HUMAN BEHAVIOUR | DOI: 10.1038/s41562-017-0138 | www.nature.com/nathumbehav 110
SUPPLEMENTARY INFORMATION

111
Table S16. Multilevel model regressing raw, unstandardized punishment with random effects for participants within groups. The variance explained by both fixed and random
factors11,12 is 𝑹𝑹𝟐𝟐 = 𝟎𝟎. 𝟑𝟑𝟑𝟑.
Leader Decisions We predict that stronger leaders should accept more bribes.
Bayesian Model mcmcmodel.bribe <- MCMCglmm(LeaderDec_Bribe ~ factor(MPCR)+factor(LeaderPower) + Period + factor(Version) + Subjects + as.numeric(Order) + scale(age) + male, random=~PID:GroupNum, data=dat[dat$Cond=="BG",], family = "categorical", burnin=50000,nitt=1000000,thin=5000) mcmcmodel.punish <- MCMCglmm(LeaderDec_Punish ~ factor(MPCR)+factor(LeaderPower) + Period + factor(Version) + Subjects + as.numeric(Order) + scale(age) + male, random=~PID:GroupNum, data=dat[dat$Cond=="BG",], family = "categorical", burnin=50000,nitt=1000000,thin=5000) mcmcmodel.nothing <- MCMCglmm(LeaderDec_Nothing ~ factor(MPCR)+factor(LeaderPower) + Period + factor(Version) + Subjects + as.numeric(Order) + scale(age) + male, random=~PID:GroupNum, data=dat[dat$Cond=="BG",], family = "categorical", burnin=50000,nitt=1000000,thin=5000) mcmcmodel.punish.pgg <- MCMCglmm(LeaderDec_Punish ~ factor(MPCR) + factor(LeaderPower) + Period + factor(Version) + Subjects + as.numeric(Order) + scale(age) + male,
© 2017 Macmillan Publishers Limited, part of Springer Nature. All rights reserved.
NATURE HUMAN BEHAVIOUR | DOI: 10.1038/s41562-017-0138 | www.nature.com/nathumbehav 111
SUPPLEMENTARY INFORMATION

112
random=~PID:GroupNum, data=levi_subset_var[levi_subset_var$Cond=="Control",], family = "categorical", burnin=50000,nitt=1000000,thin=5000)
Results
Table S17. MCMC GLMM categorical regression (equivalent to logistic regression) of each leader decision against the other two decisions.
Table S18. MCMC GLMM categorical regression (equivalent to logistic regression) of doing nothing compared to punishing in Control (IPGG).
Summary In line with our predictions, the only robust effect is that more powerful leaders are almost twice as likely to accept bribes and more than 2.5 times less likely to do nothing.
© 2017 Macmillan Publishers Limited, part of Springer Nature. All rights reserved.
NATURE HUMAN BEHAVIOUR | DOI: 10.1038/s41562-017-0138 | www.nature.com/nathumbehav 112
SUPPLEMENTARY INFORMATION

113
Yet, since leaders are also punishing for low contributions, our results suggest that something other than pure rational behavior as captured by our model is at play. Cultural evolutionary models suggest that people may internalize norms, which then influence their behavior. Next we test the effect of exposure to norms on player and Leader behaviors.
Frequentist Model model.bribe <- multinom(LeaderDec_Bribe ~ factor(MPCR)+factor(LeaderPower) + Period + factor(Version) + Subjects + as.numeric(Order) + scale(age) + male, random=~ 1|LeaderID/GroupNum, data=dat[dat$Cond=="BG",], family = binomial)
Results
Table S19. Multilevel logistic regression of each leader decision against the other two decisions, with random effects for players within groups.
© 2017 Macmillan Publishers Limited, part of Springer Nature. All rights reserved.
NATURE HUMAN BEHAVIOUR | DOI: 10.1038/s41562-017-0138 | www.nature.com/nathumbehav 113
SUPPLEMENTARY INFORMATION
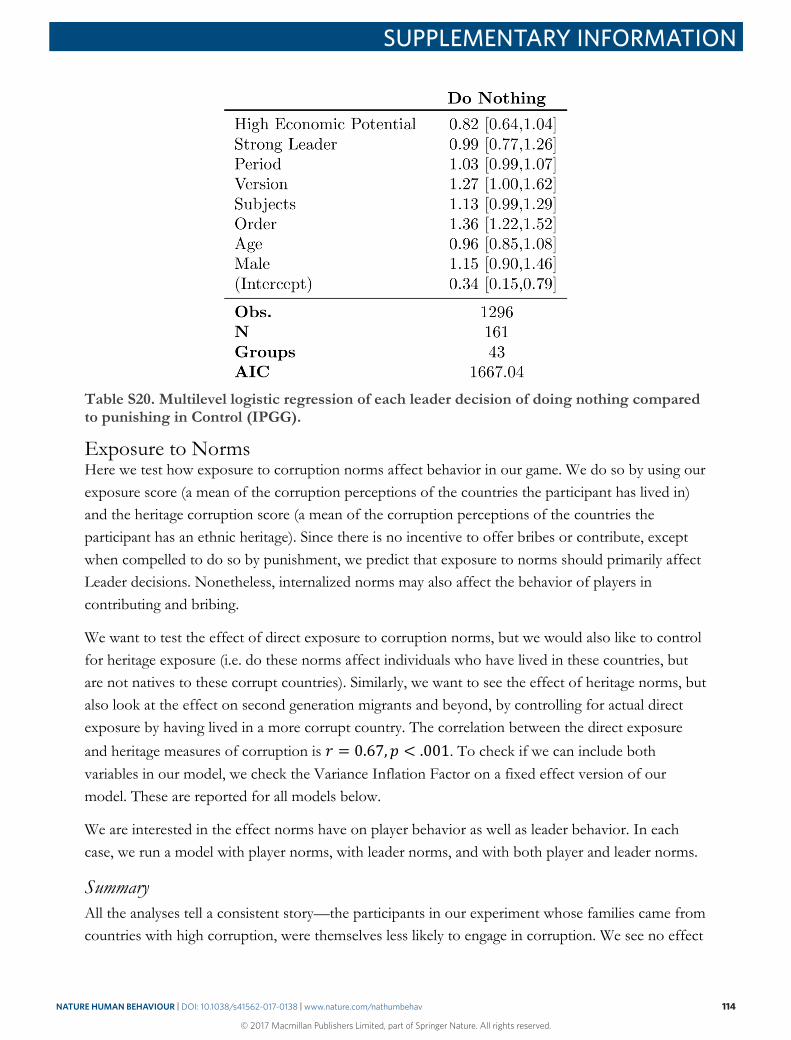
114
Table S20. Multilevel logistic regression of each leader decision of doing nothing compared to punishing in Control (IPGG).
Exposure to Norms Here we test how exposure to corruption norms affect behavior in our game. We do so by using our exposure score (a mean of the corruption perceptions of the countries the participant has lived in) and the heritage corruption score (a mean of the corruption perceptions of the countries the participant has an ethnic heritage). Since there is no incentive to offer bribes or contribute, except when compelled to do so by punishment, we predict that exposure to norms should primarily affect Leader decisions. Nonetheless, internalized norms may also affect the behavior of players in contributing and bribing.
We want to test the effect of direct exposure to corruption norms, but we would also like to control for heritage exposure (i.e. do these norms affect individuals who have lived in these countries, but are not natives to these corrupt countries). Similarly, we want to see the effect of heritage norms, but also look at the effect on second generation migrants and beyond, by controlling for actual direct exposure by having lived in a more corrupt country. The correlation between the direct exposure and heritage measures of corruption is 𝑟𝑟 = 0.67, 𝑝𝑝 < .001. To check if we can include both variables in our model, we check the Variance Inflation Factor on a fixed effect version of our model. These are reported for all models below.
We are interested in the effect norms have on player behavior as well as leader behavior. In each case, we run a model with player norms, with leader norms, and with both player and leader norms.
Summary All the analyses tell a consistent story—the participants in our experiment whose families came from countries with high corruption, were themselves less likely to engage in corruption. We see no effect
© 2017 Macmillan Publishers Limited, part of Springer Nature. All rights reserved.
NATURE HUMAN BEHAVIOUR | DOI: 10.1038/s41562-017-0138 | www.nature.com/nathumbehav 114
SUPPLEMENTARY INFORMATION

115
of direct exposure to corruption, until we control for these individuals. Then we see that direct exposure to corruption norms results in increased corrupt behavior—i.e. in our Canadian sample, those who have lived in corrupt countries from which they do not derive their heritage behave in more corrupt ways. These data are consistent with second generation migrants acculturating to local Canadian norms and also with selection in the previous generation for low corruption—i..e. those who preferred less corruption moved to Canada in the previous generation. Our data do not allow us to distinguish between these explanations, however, assuming no differential selection pressures between generations, the behavior of Canadians with direct exposure to corruption norms suggests this might be a case of acculturation (that is those with direct exposure behave in a more corrupt mannner, suggesting that the parents of those with a heritage that included corrupt nations were also more corrupt, but their children are less corrupt).
Contributions Do corruption norms affect contributions? We look at the effect of corruption norms in the BG.
VIF model <- lm(zContribution ~ factor(MPCR)+ factor(LeaderPower)+ zPlayerExposureCorruption + zPlayerHeritageCorruption + zLeaderExposureCorruption + zLeaderHeritageCorruption + Period + factor(Version) + Subjects + as.numeric(Order) + scale(age) + male, data=dat.norms[dat.norms$Cond=="BG",]) All corruption norm variables have VIF<2.5.
Table S21. VIF Scores for OLS regression on contribution.
© 2017 Macmillan Publishers Limited, part of Springer Nature. All rights reserved.
NATURE HUMAN BEHAVIOUR | DOI: 10.1038/s41562-017-0138 | www.nature.com/nathumbehav 115
SUPPLEMENTARY INFORMATION

116
Bayesian Effect of Norms on Contributions
Table S22. MCMC GLMM regression on z-score of contribution.
We find no evidence that leader corruption norms affect contributions. We find a small effect suggesting that players with a heritage that includes countries with high corruption norms actually contribute more and players with direct exposure to corruption contribute less, but this effect is not significant. Note that leadership is randomly assigned, so the effect of leaders must occur via shaping the norms of the groups they are in. We can test this by checking if mean contributions are higher in groups where heritage corruption scores are higher.
How do corruption norms in groups affect mean of contributions? We calculate the mean contribution within each group and predict this with the mean of corruption norms.
© 2017 Macmillan Publishers Limited, part of Springer Nature. All rights reserved.
NATURE HUMAN BEHAVIOUR | DOI: 10.1038/s41562-017-0138 | www.nature.com/nathumbehav 116
SUPPLEMENTARY INFORMATION

117
Table S23. MCMC GLMM regression of mean of z-score of contributions in each group on
mean corruption scores of players in the group.
No clear patterns emerge at the group level. Next we look at how corruption norms affect bribing behavior.
Frequentist
Table S24. Multilevel model regressing z-score of contribution.
© 2017 Macmillan Publishers Limited, part of Springer Nature. All rights reserved.
NATURE HUMAN BEHAVIOUR | DOI: 10.1038/s41562-017-0138 | www.nature.com/nathumbehav 117
SUPPLEMENTARY INFORMATION

118
Table S25. OLS regression of mean of z-score of contributions in each group on mean corruption scores of players in the group.
Bribes VIF
Table S26. VIF Scores for OLS regression on bribes.
© 2017 Macmillan Publishers Limited, part of Springer Nature. All rights reserved.
NATURE HUMAN BEHAVIOUR | DOI: 10.1038/s41562-017-0138 | www.nature.com/nathumbehav 118
SUPPLEMENTARY INFORMATION

119
Effect of Norms on Bribes
Table S27. MCMC GLMM regression on z-score of bribe.
How do corruption norms in group affect bribe behavior in group
Table S28. MCMC GLMM regression of mean of z-score of bribes in each group on mean
corruption scores of players in the group.
Again, similar to contributions and not statistically significant, we find that direct exposure results in higher bribes, but heritage lower bribes.
© 2017 Macmillan Publishers Limited, part of Springer Nature. All rights reserved.
NATURE HUMAN BEHAVIOUR | DOI: 10.1038/s41562-017-0138 | www.nature.com/nathumbehav 119
SUPPLEMENTARY INFORMATION

120
Frequentist
Table S29. Multilevel model regressing z-score of bribe.
Table S30. OLS regression of mean of z-score of bribes in each group on mean corruption scores of players in the group.
© 2017 Macmillan Publishers Limited, part of Springer Nature. All rights reserved.
NATURE HUMAN BEHAVIOUR | DOI: 10.1038/s41562-017-0138 | www.nature.com/nathumbehav 120
SUPPLEMENTARY INFORMATION

121
Leader Decision Players have no incentive to offer bribes, other than to avoid punishment. If exposure to norms affect bribery, we should expect that leader’s who have been directly exposed to more corrupt norms accept more bribes (rather than punishing or doing nothing).
VIF
Table S31. VIF Scores for logistic regression on leader decision to accept bribe compared to
not accepting bribe.
Table S32. VIF Scores for logistic regression on leader decision to punish compared to not
punishing.
Table S33. VIF Scores for logistic regression on leader decision to do nothing compared to not doing nothing.
© 2017 Macmillan Publishers Limited, part of Springer Nature. All rights reserved.
NATURE HUMAN BEHAVIOUR | DOI: 10.1038/s41562-017-0138 | www.nature.com/nathumbehav 121
SUPPLEMENTARY INFORMATION

122
Bayesian Model mcmcmodel.bribe <- MCMCglmm(LeaderDec_Bribe ~ factor(MPCR)+factor(LeaderPower) + zPlayerExposureCorruption + zPlayerHeritageCorruption + Period + factor(Version) + Subjects + as.numeric(Order) + scale(age) + male, random=~LeaderID:GroupNum, data=dat.norms[dat.norms$Cond=="BG",], family = "categorical", burnin=50000,nitt=1000000,thin=5000) mcmcmodel.bribe <- MCMCglmm(LeaderDec_Punish ~ factor(MPCR)+factor(LeaderPower) + zPlayerExposureCorruption + zPlayerHeritageCorruption + Period + factor(Version) + Subjects + as.numeric(Order) + scale(age) + male, random=~LeaderID:GroupNum, data=dat.norms[dat.norms$Cond=="BG",], family = "categorical", burnin=50000,nitt=1000000,thin=5000) mcmcmodel.bribe <- MCMCglmm(LeaderDec_Nothing ~ factor(MPCR)+factor(LeaderPower) + zPlayerExposureCorruption + zPlayerHeritageCorruption + Period + factor(Version) + Subjects + as.numeric(Order) + scale(age) + male, random=~LeaderID:GroupNum, data=dat.norms[dat.norms$Cond=="BG",], family = "categorical", burnin=50000,nitt=1000000,thin=5000) Results Accept Bribe
Table S34. MCMC GLMM categorical regression (equivalent to logistic regression) for
leader decision to accept bribe compared to not accepting bribes.
© 2017 Macmillan Publishers Limited, part of Springer Nature. All rights reserved.
NATURE HUMAN BEHAVIOUR | DOI: 10.1038/s41562-017-0138 | www.nature.com/nathumbehav 122
SUPPLEMENTARY INFORMATION

123
Punish
Table S35. MCMC GLMM categorical regression (equivalent to logistic regression) for
leader decision to punish compared to not punishing.
Do Nothing
Table S36. MCMC GLMM categorical regression (equivalent to logistic regression) for
leader decision to do nothing compared to not doing nothing.
Frequentist Model model <- multinom(LeaderDec_Bribe ~ factor(MPCR)+factor(LeaderPower) + zPlayerExposureCorruption + zPlayerHeritageCorruption + Period + factor(Version) + Subjects + as.numeric(Order) + scale(age) + male, random=~ 1|LeaderID/GroupNum, data=dat.norms[dat.norms$Cond=="BG",], family = binomial) model <- multinom(LeaderDec_Punish ~ factor(MPCR)+factor(LeaderPower) + zPlayerExposureCorruption + zPlayerHeritageCorruption + Period + factor(Version) + Subjects + as.numeric(Order) + scale(age) + male, random=~ 1|LeaderID/GroupNum,
© 2017 Macmillan Publishers Limited, part of Springer Nature. All rights reserved.
NATURE HUMAN BEHAVIOUR | DOI: 10.1038/s41562-017-0138 | www.nature.com/nathumbehav 123
SUPPLEMENTARY INFORMATION

124
data=dat.norms[dat.norms$Cond=="BG",], family = binomial) model <- multinom(LeaderDec_Nothing ~ factor(MPCR)+factor(LeaderPower) + zPlayerExposureCorruption + zPlayerHeritageCorruption + Period + factor(Version) + Subjects + as.numeric(Order) + scale(age) + male, random=~ 1|LeaderID/GroupNum, data=dat.norms[dat.norms$Cond=="BG",], family = binomial) Results Accept Bribe
Table S37. Multilevel logistic regression of each leader decision to accept bribe compared to
not accepting bribe, with random effects for players within groups.
Punish
Table S38. Multilevel logistic regression of each leader decision to punish compared to not
punishing, with random effects for players within groups.
© 2017 Macmillan Publishers Limited, part of Springer Nature. All rights reserved.
NATURE HUMAN BEHAVIOUR | DOI: 10.1038/s41562-017-0138 | www.nature.com/nathumbehav 124
SUPPLEMENTARY INFORMATION

125
Do Nothing
Table S39. Multilevel logistic regression of each leader decision to do nothing compared to not doing nothing, with random effects for players within groups.
Next, we look at whether anti-corruption measures can return contributions to the levels seen in the IPGG, when bribery is not a option.
© 2017 Macmillan Publishers Limited, part of Springer Nature. All rights reserved.
NATURE HUMAN BEHAVIOUR | DOI: 10.1038/s41562-017-0138 | www.nature.com/nathumbehav 125
SUPPLEMENTARY INFORMATION

126
Cures for Corruption Here we report the full regression discussed in the main text. Partial transparency may work by revealing or establishing contribution norms and full transparency may work by revealing contribution and bribe norms, as well as the leader’s punitive preferences. Leader investment can only work by increasing a leader’s tendency to punish for lack of contributions rather than lack of bribes, but this is only likely to work when economic potential is high.
Bayesian
Table S40. The coefficients in Figure 1 of the main text are derived from this MCMC GLMM regression on the z-score of contribution. The coefficients of interest can be calculated by changing the reference groups, changing the meaning of the “main effects” in the model. For example, the the coefficient of bribery game in this table is the difference between the BG treatment and the IPGG when Economic Potential and Strong Leader are zero.
© 2017 Macmillan Publishers Limited, part of Springer Nature. All rights reserved.
NATURE HUMAN BEHAVIOUR | DOI: 10.1038/s41562-017-0138 | www.nature.com/nathumbehav 126
SUPPLEMENTARY INFORMATION

127
Frequentist
Table S41. Multilevel model regressing z-score of contribution, with random effects for participants within groups. . The variance explained by both fixed and random factors11,12 is
𝑹𝑹𝟐𝟐 = 𝟎𝟎. 𝟔𝟔𝟔𝟔.
© 2017 Macmillan Publishers Limited, part of Springer Nature. All rights reserved.
NATURE HUMAN BEHAVIOUR | DOI: 10.1038/s41562-017-0138 | www.nature.com/nathumbehav 127
SUPPLEMENTARY INFORMATION

128
Leader Investment
Weak Leaders Strong Leaders
Poor
Eco
nom
ic P
oten
tial
Control BG
Control - 0.21**
Bribery Game (BG) -0.21*** -
BG + Partial Transparency -0.31*** -0.10*
BG + Full Transparency -0.20*** -0.01
BG + Leader Investment -0.46*** -0.25***
Control BG
- 0.52***
-0.53*** -
-0.53*** -0.01
-0.06 0.47***
-0.17** 0.36***
Ric
h E
cono
mic
Pot
entia
l
Control BG
Control - 0.39***
Bribery Game (BG) -0.39*** -
BG + Partial Transparency -0.30*** 0.09+
BG + Full Transparency -0.15** 0.24***
BG + Leader Investment -0.15** 0.24***
Control BG
- 0.57***
-0.57*** -
-0.44*** 0.13**
-0.25*** 0.32***
-0.21*** 0.36***
Figure S18. Figure 2 from Main Text with Leader Investment included. Corruption mitigation effectively increases contributions (though not to control levels) when leaders are strong or economic potential is rich. When leaders are weak and economic potential is poor, the apparent corruption mitigation strategy Full Transparency has no effect and Partial Transparency and Leader Investment further decrease contributions.
© 2017 Macmillan Publishers Limited, part of Springer Nature. All rights reserved.
NATURE HUMAN BEHAVIOUR | DOI: 10.1038/s41562-017-0138 | www.nature.com/nathumbehav 128
SUPPLEMENTARY INFORMATION

129
Figure S19. Figure 3 from Main Text with Leader Investment Included.
© 2017 Macmillan Publishers Limited, part of Springer Nature. All rights reserved.
NATURE HUMAN BEHAVIOUR | DOI: 10.1038/s41562-017-0138 | www.nature.com/nathumbehav 129
SUPPLEMENTARY INFORMATION

130
Preferences for characteristics of the game world Questions
We gave participants a survey at the end of the experiment to see what kind of world they would prefer were they allowed to change the parameters. We assume that this is also the kind of world they would migrate to given the opportunity. Looking only at majorities where greater than 50% agreed on something, most people want to live in a world with:
A pool with institutional punishment, but where players can offer bribes and leaders can accept these bribes. Economic potential would be rich (unsurprisingly) and there would be transparency (players expressed strong preference for both transparency types).
There is some disagreement, but a small plurality of people would prefer to choose to contribute rather than be forced to contribute, and would prefer the leader to be less powerful and forced to invest in the public good.
© 2017 Macmillan Publishers Limited, part of Springer Nature. All rights reserved.
NATURE HUMAN BEHAVIOUR | DOI: 10.1038/s41562-017-0138 | www.nature.com/nathumbehav 130
SUPPLEMENTARY INFORMATION

131
Graphs
© 2017 Macmillan Publishers Limited, part of Springer Nature. All rights reserved.
NATURE HUMAN BEHAVIOUR | DOI: 10.1038/s41562-017-0138 | www.nature.com/nathumbehav 131
SUPPLEMENTARY INFORMATION

132
© 2017 Macmillan Publishers Limited, part of Springer Nature. All rights reserved.
NATURE HUMAN BEHAVIOUR | DOI: 10.1038/s41562-017-0138 | www.nature.com/nathumbehav 132
SUPPLEMENTARY INFORMATION

133
Figure S20. Distribution of answers for each end of survey question regarding preferences for the characteristics of the game.
Supplementary References 1 Foltz, J. D. & Opoku-Agyemang, K. A. Do higher salaries lower petty corruption? A policy experiment on West Africa’s highways. Working Paper (2015). 2 Cheng, J. T., Tracy, J. L. & Henrich, J. Pride, personality, and the evolutionary foundations of human social status. Evolution and Human Behavior 31, 334-347 (2010). 3 Altemeyer, B. The Authoritarians. (Lulu Press, 2006). 4 Aron, A., Aron, E. N. & Smollan, D. Inclusion of Other in the Self Scale and the structure of interpersonal closeness. Journal of personality and social psychology 63, 596 (1992). 5 Ryder, A. G., Alden, L. E. & Paulhus, D. L. Is acculturation unidimensional or bidimensional? A head-to-head comparison in the prediction of personality, self-identity, and adjustment. Journal of personality and social psychology 79, 49 (2000). 6 Transparency International. (2014). 7 Hadfield, J. D. MCMC methods for multi-response generalized linear mixed models: the MCMCglmm R package. Journal of Statistical Software 33, 1-22 (2010). 8 Gelman, A. & Rubin, D. B. Inference from iterative simulation using multiple sequences. Statistical science, 457-472 (1992). 9 Plummer, M., Best, N., Cowles, K. & Vines, K. CODA: Convergence diagnosis and output analysis for MCMC. R news 6, 7-11 (2006). 10 Hadfield, J. (2015). 11 Johnson, P. C. D. Extension of Nakagawa & Schielzeth's R2GLMM to random slopes models. Methods in Ecology and Evolution 5, 944-946, doi:10.1111/2041-210X.12225 (2014).
© 2017 Macmillan Publishers Limited, part of Springer Nature. All rights reserved.
NATURE HUMAN BEHAVIOUR | DOI: 10.1038/s41562-017-0138 | www.nature.com/nathumbehav 133
SUPPLEMENTARY INFORMATION

134
12 Nakagawa, S. & Schielzeth, H. A general and simple method for obtaining R2 from generalized linear mixed-effects models. Methods in Ecology and Evolution 4, 133-142, doi:10.1111/j.2041-210x.2012.00261.x (2013).
© 2017 Macmillan Publishers Limited, part of Springer Nature. All rights reserved.
NATURE HUMAN BEHAVIOUR | DOI: 10.1038/s41562-017-0138 | www.nature.com/nathumbehav 134
SUPPLEMENTARY INFORMATION