Embed Size (px)
Citation preview
Arnold Schwarzenegger Governor
COST AND VALUE OF WATER USE AT COMBINED-CYCLE POWER PLANTS
Prepared For: California Energy Commission Public Interest Energy Research Program
Prepared By: John S. Maulbetsch, Consultant Michael N. DiFilippo Consultant
PIER
FIN
AL
PRO
JEC
T R
EPO
RT
April 2006
CEC-500-2006-034
Prepared By: John S. Maulbetsch
Maulbetsch Consulting Menlo Park, California and Michael N. DiFilippo, Consultant Berkeley, California Contract No. 500-02-014 Work Authorization No. 104 Prepared For:
California Energy Commission Public Interest Energy Research (PIER) Program
Joe O’Hagan, Contract Manager Kelly Birkinshaw, Program Area Team Lead Martha Krebs, Ph.D., Deputy Director ENERGY RESEARCH AND DEVELOPMENT
DIVISION B B. Blevins Executive Director
DISCLAIMER This report was prepared as the result of work sponsored by the
California Energy Commission. It does not necessarily represent the views of the Energy Commission, its employees or the State of California. The Energy Commission, the State of California, its employees, contractors and subcontractors make no warrant, express or implied, and assume no legal liability for the information in this report; nor does any party represent that the uses of this information will not infringe upon privately owned rights. This report has not been approved or disapproved by the California Energy Commission nor has the California Energy Commission passed upon the accuracy or adequacy of the information in this report.
i
Acknowledgements
The authors acknowledge the helpful participation of three individuals.
• Joe O’Hagan of the California Energy Commission and Kent Zammit of EPRI, whose interest in and critical review of the analyses resulted in a much improved report;
• Hal Wightman of ThermoFlow, Inc. whose skill with the cycle analysis and plant design capabilities of the GTPro/PEACE software packages was invaluable to the conduct of the study.
Please cite this report as follows: Maulbetsch, J. S., and M. N. DiFilippo. 2006. Cost and Value of Water Use at Combined-Cycle Power Plants. California Energy Commission, PIER Energy-Related Environmental Research. CEC-500-2006-034.

ii
Preface
The Public Interest Energy Research (PIER) Program supports public interest energy research and development that will help improve the quality of life in California by bringing environmentally safe, affordable, and reliable energy services and products to the marketplace.
The PIER Program, managed by the California Energy Commission (Energy Commission) conducts public interest research, development, and demonstration (RD&D) projects to benefit the electricity and natural gas ratepayers in California. The Energy Commission awards up to $62 million annually in electricity-related RD&D, and up to $12 million annually for natural gas RD&D.
The PIER program strives to conduct the most promising public interest energy research by partnering with RD&D organizations, including individuals, businesses, utilities, and public or private research institutions.
PIER funding efforts are focused on the following RD&D program areas:
• Buildings End-Use Energy Efficiency
• Industrial/Agricultural/Water End-Use Energy Efficiency
• Renewable Energy Technologies
• Environmentally Preferred Advanced Generation
• Energy-Related Environmental Research
• Energy Systems Integration
What follows is the final report for the Alternative Cooling Technologies and Strategies project, contract number 500-02-014, work authorization 104, conducted by Maulbetsch Consulting and Michael N. DiFilippo, Consultant. The report is entitled Cost and Value of Water Use at Combined-Cycle Power Plants. This project contributes to the Energy-Related Environmental Research program.
For more information on the PIER Program, please visit the Energy Commission’s Web site at www.energy.ca.gov/pier or contact the Energy Commission at (916) 654-5164.
iii
Table of Contents
Preface ................................................................................................................................................ ii Abstract ............................................................................................................................................... vi Executive Summary........................................................................................................................... 1 1.0 Introduction.......................................................................................................................... 5 2.0 Purpose ................................................................................................................................. 8 3.0 Methodology and Scope..................................................................................................... 9 4.0 Base Cases............................................................................................................................. 11
4.1. Sites .................................................................................................................................. 11 4.2. Site Meteorology............................................................................................................. 11 4.3. Power Plant Types ......................................................................................................... 12 4.4. Water Sources ................................................................................................................. 12
5.0 Design and Calculations..................................................................................................... 13 5.1. Plant Design Points ........................................................................................................ 13
6.0 Scope of Analysis................................................................................................................. 15 6.1. Plant Designs .................................................................................................................. 15 6.2. Capital Cost and Plant Capacity .................................................................................. 19 6.3. Plant Efficiency and Fuel Use....................................................................................... 21 6.4. Hot Day Performance .................................................................................................... 21 6.5. Annual Performance Measures.................................................................................... 25 6.6. Operating Costs .............................................................................................................. 30
7.0 Effect of Plant Water Supply.............................................................................................. 32 7.1. Equivalent Cost of Water .............................................................................................. 34
8.0 Additional Comparisons .................................................................................................... 36 8.1. Simple-cycle Gas Turbine Plants.................................................................................. 36 8.2. Plant Performance with and without Inlet Fogging.................................................. 37 8.3. Steam Cycle Operating Pressure and Plant Optimization Criteria......................... 38
9.0 Conclusions .......................................................................................................................... 41 10.0 References............................................................................................................................. 42 11.0 Glossary ................................................................................................................................ 43
iv
Appendix A. Site Meteorological Data A-1
Appendix B. Design Cost and Performance Data B-1
Appendix C. Off-Design Performance Data C-1
Appendix D. Hourly Operating Data for All Sites, Plants, and Water Sources D-1
Appendix E. Waste Water Treatment Options Summary E-1
List of Figures
Figure 1. Schematic of water uses in a combined-cycle plant.............................................................. 6
Figure 2. Schematic of a dry-cooled plant ............................................................................................ 17
Figure 3. Schematic of a wet-cooled plant ............................................................................................ 18
Figure 4. Plant capital costs at four sites............................................................................................... 19
Figure 5. Comparison of plant design capacity at four sites.............................................................. 20
Figure 6. Comparison of plant heat rates at four sites ........................................................................ 20
Figure 7. Output vs. ambient temperature—wet-cooled plants........................................................ 23
Figure 8. Output vs. ambient temperature—dry-cooled plants........................................................ 23
Figure 9. Hot day plant output comparison......................................................................................... 24
Figure 10. Hot day fuel use comparison ............................................................................................... 24
Figure 11. Hot day water use ................................................................................................................. 25
Figure 12. Gas price variation in past year ........................................................................................... 27
Figure 13. Annual output comparisons ................................................................................................ 27
Figure 14. Annual fuel use comparisons .............................................................................................. 28
Figure 15. Annual water use comparisons ........................................................................................... 28
Figure 16. Effect of pressure and design criteria ................................................................................. 39
v
List of Tables
Table ES-1. Case study design points...................................................................................................... 2
Table ES-2. Source waters at each site..................................................................................................... 2
Table ES-3. Calculated quantities for case studies ................................................................................ 3
Table 1. Average water use at combined-cycle plants.......................................................................... 7
Table 2. Base case design points............................................................................................................. 14
Table 3. Summary of base case results at design conditions.............................................................. 16
Table 4. Comparisons of performance, cost, and heat rate ................................................................ 16
Table 5. Comparative plant efficiency and firing rate ........................................................................ 21
Table 6. Hot day performance comparisons ........................................................................................ 21
Table 7. Water use, output, fuel use, and revenue comparisons....................................................... 26
Table 8. Percent differences between wet- and dry-cooled plants.................................................... 26
Table 9. Economics of cost and revenue differences ........................................................................... 29
Table 10. Comparison of operating power requirements................................................................... 30
Table 11. Effect of water source.............................................................................................................. 35
Table 12. Equivalent cost of water ......................................................................................................... 35
Table 13. Simple- vs. combined-cycle plants........................................................................................ 36
Table 14. Effect of water use for gas turbine inlet fogging................................................................. 37
Table 15. Water requirements for increased capacity from inlet fogging........................................ 38
Table 16. Effect of pressure and design criterion................................................................................. 39
vi
Abstract
This study compared water requirements, plant and cooling system capital and operating costs, and plant output and efficiency between plants equipped with wet and dry cooling. Comparisons were made for 500 megawatt, gas-fired, combined-cycle power plants at four sites, typical of environmental conditions in California.
A plant design was generated for each site/plant/cooling system combination. The total plant costs and selected individual component costs for each design were determined. Researchers calculated performance characteristics—including net plant output, heat rate, water consumption, and operating power requirements.
Results of the analysis include:
• the use of dry cooling reduces plant water requirements by approximately 2,000 to 2,500 acre-feet per year,
• The associated costs are:
− increased plant capital cost of approximately $8 million to $27 million, or about 5% to 15% of the total plant cost,
− potential reduction of energy production by about 13,000–56,000 megawatt hours (MWh) per year (1% to 2% of the total),
− capacity reduction on hot days of 13 to 23 MW (4% to 6% of total), and
− potential annual revenue reduction of about $1.5 to $3.0 million (1% to 2% of total).
1
Executive Summary
Introduction
Water use and conservation at electric power plants are becoming increasingly important siting issues in California and elsewhere. At most plants, the requirement for condensing turbine exhaust steam—generically known as power plant cooling—is the major use of water. Alternative cooling systems exist, including once-through cooling, recirculating wet cooling, dry cooling, and hybrid (wet/dry) cooling. Dry and hybrid systems can reduce cooling water consumption significantly compared to the more traditional wet recirculating or once-through cooling systems. These savings, however, come at a price, including increased plant capital and operating costs, reduced plant efficiency and output, increased fuel consumption, and an associated increase in power plant air emissions.
Purpose
The purpose of this study was to determine optimal power plant cooling options in terms of water savings, capital and operating costs, and operational efficiency for California power plants that operate in a variety of climates and with a variety of cooling water supplies.
Project Objectives
This project’s objectives were to compare water requirements, plant and cooling system capital and operating costs, and power plant operating penalties for alternative cooling systems over a range of plant and site characteristics and source water types representative of the range of conditions found in California.
Scope
Comparisons of water use, costs, and penalties were made between two commonly chosen cooling systems:
• Wet cooling, which is a recirculating system with a steam surface condenser and a mechanical-draft, counterflow wet cooling tower
• Dry cooling, which uses a mechanical, forced-draft air-cooled condenser
All comparisons were made on the basis of a 500 megawatt (MW) (nominal), gas-fired, combined-cycle (2 x 1) power plant, typical of current construction in California.
Four sites, each representing a different meteorology, were selected:
• Desert (very hot, arid)
• Central Valley (hot, moderately humid)
• Coastal (cool, humid)
• Mountain (variable, elevated)
2
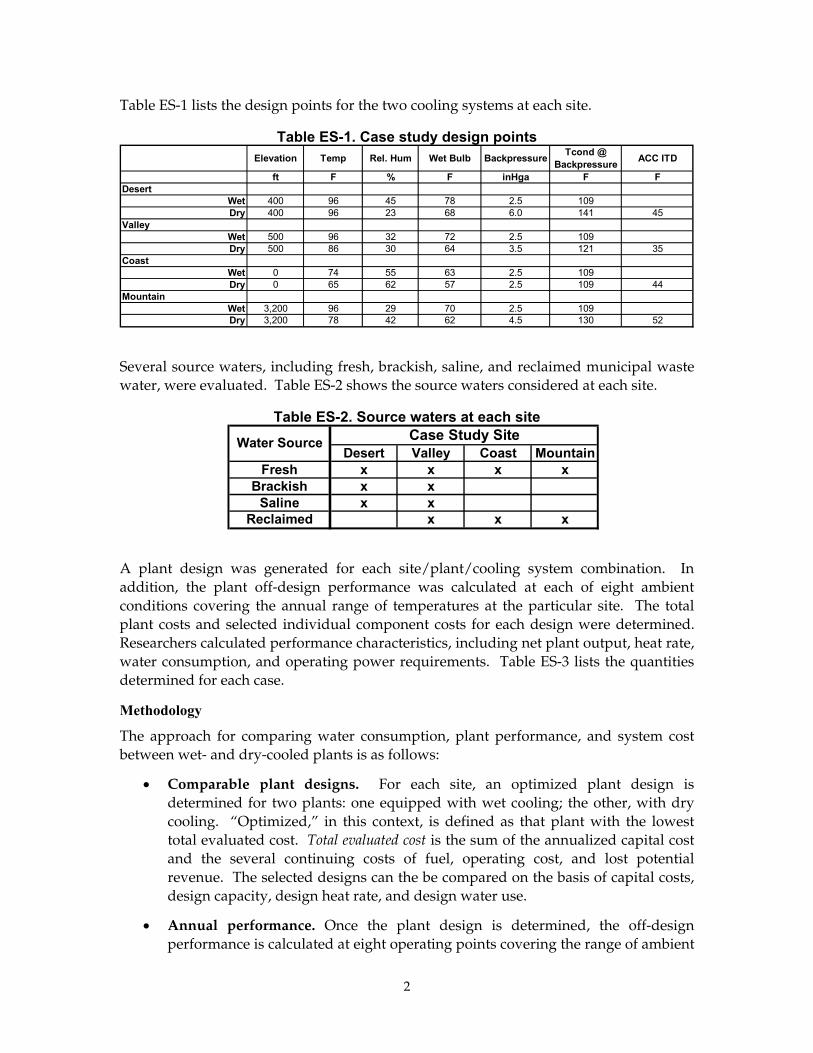
Table ES-1 lists the design points for the two cooling systems at each site.
Table ES-1. Case study design points
Several source waters, including fresh, brackish, saline, and reclaimed municipal waste water, were evaluated. Table ES-2 shows the source waters considered at each site.
Table ES-2. Source waters at each site
A plant design was generated for each site/plant/cooling system combination. In addition, the plant off-design performance was calculated at each of eight ambient conditions covering the annual range of temperatures at the particular site. The total plant costs and selected individual component costs for each design were determined. Researchers calculated performance characteristics, including net plant output, heat rate, water consumption, and operating power requirements. Table ES-3 lists the quantities determined for each case.
Methodology
The approach for comparing water consumption, plant performance, and system cost between wet- and dry-cooled plants is as follows:
• Comparable plant designs. For each site, an optimized plant design is determined for two plants: one equipped with wet cooling; the other, with dry cooling. “Optimized,” in this context, is defined as that plant with the lowest total evaluated cost. Total evaluated cost is the sum of the annualized capital cost and the several continuing costs of fuel, operating cost, and lost potential revenue. The selected designs can the be compared on the basis of capital costs, design capacity, design heat rate, and design water use.
• Annual performance. Once the plant design is determined, the off-design performance is calculated at eight operating points covering the range of ambient
Elevation Temp Rel. Hum Wet Bulb Backpressure Tcond @ Backpressure ACC ITD
ft F % F inHga F FDesert
Wet 400 96 45 78 2.5 109Dry 400 96 23 68 6.0 141 45
ValleyWet 500 96 32 72 2.5 109Dry 500 86 30 64 3.5 121 35
CoastWet 0 74 55 63 2.5 109Dry 0 65 62 57 2.5 109 44
MountainWet 3,200 96 29 70 2.5 109Dry 3,200 78 42 62 4.5 130 52
Desert Valley Coast MountainFresh x x x x
Brackish x xSaline x x
Reclaimed x x x
Case Study SiteWater Source
3
temperatures at the site over the course of a year. These performance values are then integrated over a year of operation using temperature duration curves for the site. This determines the annual net plant output, the annual fuel cost, the annual operating costs, the annual water use, and an annual potential revenue.
• Cost elements. The several cost elements are then combined, using an appropriate annualization factor to put the capital cost on an annual basis, to determine the total annual cost of operation. The difference between the two total costs establishes the total annual cost associated with the choice of cooling system.
• Water use. Water use is summed over the year to determine the annual water requirements for each power plant and the water savings achievable from the use of dry cooling.
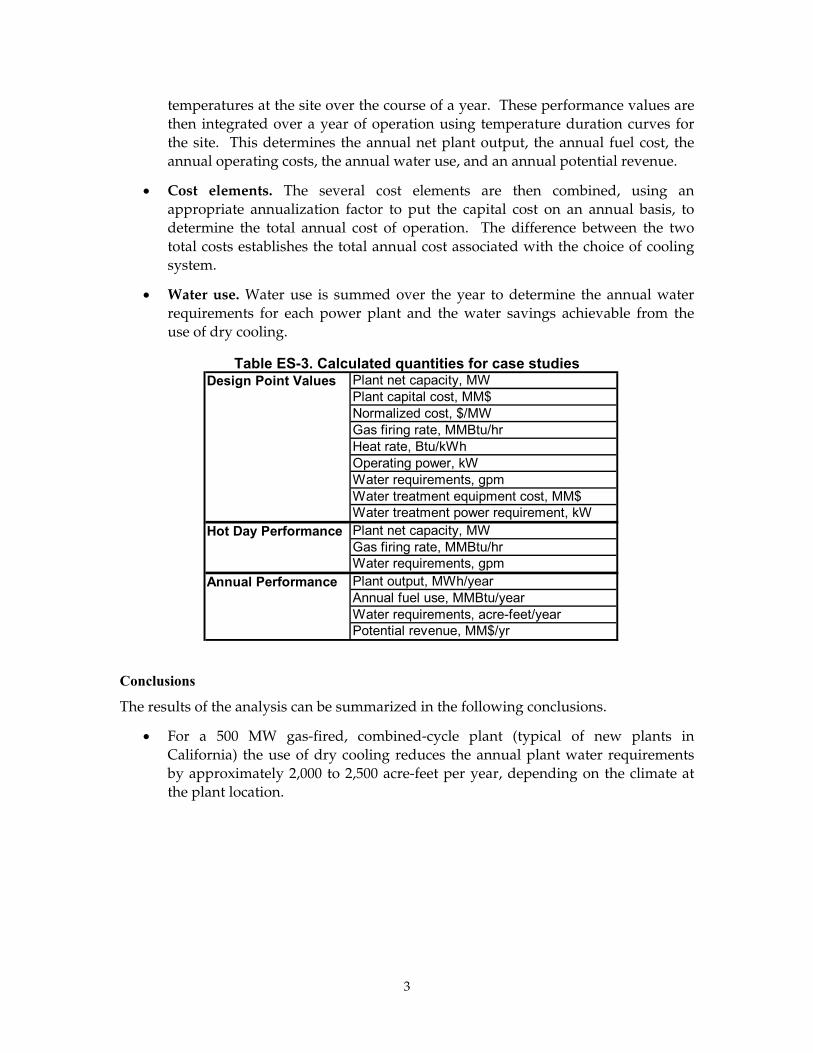
Table ES-3. Calculated quantities for case studies
Conclusions
The results of the analysis can be summarized in the following conclusions.
• For a 500 MW gas-fired, combined-cycle plant (typical of new plants in California) the use of dry cooling reduces the annual plant water requirements by approximately 2,000 to 2,500 acre-feet per year, depending on the climate at the plant location.
Plant net capacity, MWPlant capital cost, MM$Normalized cost, $/MWGas firing rate, MMBtu/hrHeat rate, Btu/kWhOperating power, kWWater requirements, gpmWater treatment equipment cost, MM$Water treatment power requirement, kWPlant net capacity, MWGas firing rate, MMBtu/hrWater requirements, gpmPlant output, MWh/yearAnnual fuel use, MMBtu/yearWater requirements, acre-feet/yearPotential revenue, MM$/yr
Design Point Values
Hot Day Performance
Annual Performance
4
• The associated costs are:
− Increased plant capital cost of approximately $8 million to $27 million, or about 5% to 15% of the total plant cost
− Potential reduction of energy production by about 13,000–56,000 megawatthours (MWh) per year (1% to 2% of the total)
− Capacity reduction on hot days of 13 to 23 MW (4% to 6% of total)
− Potential annual revenue reduction of about $1.5 to $3.0 million (1% to 2% of total)
• The cost of dry cooling can be expressed as the “effective cost” of water. This is defined as the additional cost of using dry cooling expressed on an annualized basis divided by the annual reduction in water requirement achieved through the use of dry cooling. This “effective cost” of saved water ranges from $3.40 to $6.00 per 1,000 gallons. This cost compares to more typical costs for industrial and residential uses, ranging from $1.00 to $2.50 per 1,000 gallons.
It is important to understand that these costs and penalties are calculated for dry cooling systems which were sized using an optimization criterion of minimum total annualized cost based on current estimates of capital, fuel and electricity costs. Other optimization criteria could have been chosen and would have yielded different results. For example, if a very high value were assigned to meeting peak power demands on the hotter days, a larger and more expensive cooing system would have been selected. While the total annualized cost would have been higher, the “hot day capacity reduction” would have been reduced or eliminated.
Recommendations
The quantitative conclusions of this study are dependent on a number of assumptions and estimates including those for the costs of plant construction, the present and future costs of fuel and electricity, and the value assigned to peak power demand. Therefore, it is recommended that the results of the study be reviewed and updated periodically as conditions, costs, and projections change to ensure a sound basis for future decision making.
Benefits to California
The use of the results of this study and related work referenced in the report should assist power project developers, environmental organizations, and groups entrusted with siting decisions to come to informed conclusions regarding trade-offs between water consumption by a proposed power plant and the cost and capacity of that plant. Over time, these decisions will lead to an appropriately balanced approach to resolving conflicting requirements of water conservation and power supply for the citizens of California.
5
1.0 Introduction Water use and conservation at electric power plants have long been important siting issues in California and elsewhere. At most plants, the requirement for condensing exhaust steam from steam turbines—generically known as power plant cooling—is the largest use of water at the plant. A number of alternative cooling systems exist and have been used. These systems include once-through cooling, recirculating wet cooling, dry cooling, and hybrid (wet/dry) cooling. A discussion and comparison of these cooling systems are given in a recent EPRI (2004) report. They are summarized here for convenient reference.
Once-through cooling. In once-through cooling, water is withdrawn from a natural waterbody, passed through the tubes of a surface steam condenser and returned to the waterbody at a higher temperature. This was formerly the common form of cooling at U.S. power plants and is currently in use at over 1200 seam-electric generating units. Withdrawal rates are usually 400 to 600 gallons per minute (gpm) per megawatt (MW) of steam-electric generating capacity, and the retuned water is typically 15°F to 20°F (8°C to 12°C) warmer than the source water from which it was withdrawn. It is seldom, if ever, used for new power plants in the United States today.
Recirculating wet cooling. Recirculating wet cooling is the most common choice of cooling system for current plant construction in the United States. Recirculating wet cooling is similar to once-through cooling in that the steam is condensed in a water-cooled, surface condenser; but different in that the heated cooling water is not returned to the source waterbody. Instead it is pumped to a cooling component, typically a mechanical draft cooling tower and then recirculated to the condenser. In the cooling tower a small faction (typically 1% to 2%) is evaporated in order to cool the remainder. Once the system is filled, the only water withdrawn from the environment is make-up water sufficient to replace that lost to evaporation, blowdown, and drift. This amount is typically 10 to 15 gpm per MW of steam generating capacity.
Dry cooling systems. Dry cooling systems, as used in the United States, are typically the type in which turbine exhaust steam is ducted directly to an air-cooled condenser. Heat rejection to the environment takes place in a single step in which steam is condensed in finned tube bundles, which are cooled by air blown across the exterior finned surfaces.
Hybrid cooling systems. Hybrid cooling systems employ a combination of wet and dry cooling technologies. Most systems in the United States are intended for plume abatement and are essentially all-wet systems with a small amount of dry cooling to heat the tower exhaust plume above saturation conditions during cold, high-humidity periods when the wet tower plume is likely to be visible. Hybrid systems intended for water conservation, on the other hand, are primarily dry systems with a small wet capacity to provide additional cooling during the hottest periods of the year to mitigate hot-day capacity loses associated with all-dry systems. These systems are receiving increasing attention in the United States in recent years, but are still rare in practice. Further discussion of these systems is available in the EPRI (2004) report, but is beyond the scope of this study.
6
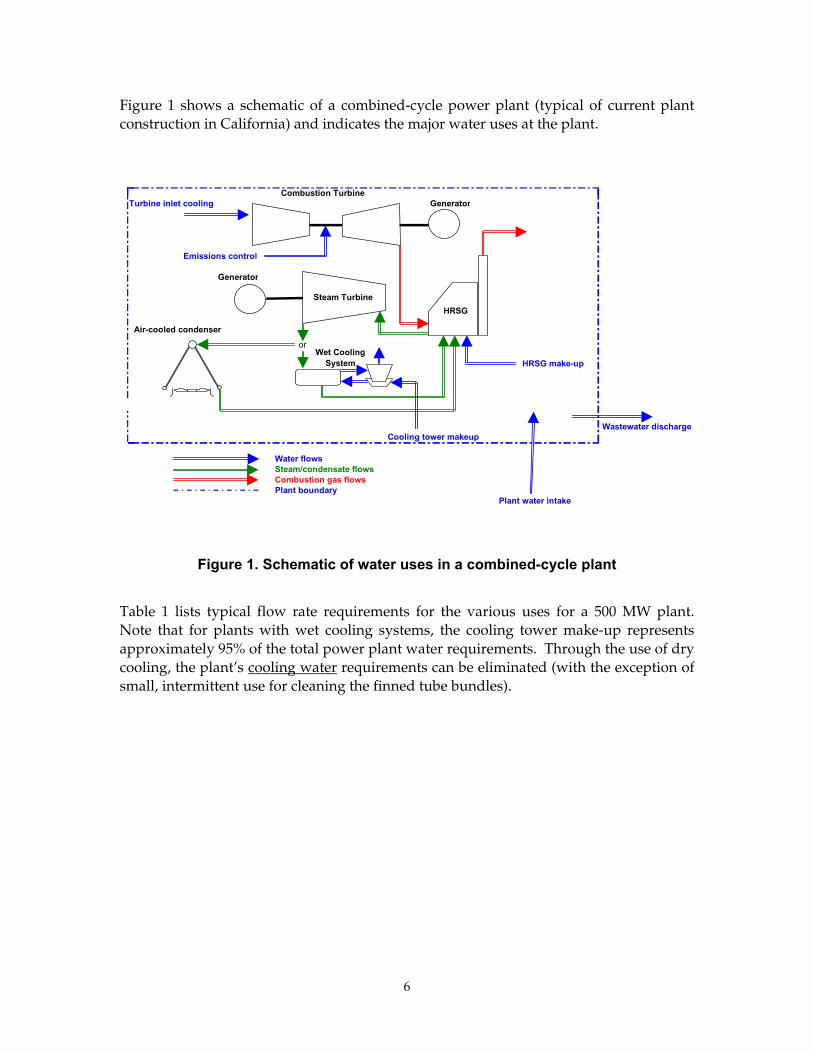
Figure 1 shows a schematic of a combined-cycle power plant (typical of current plant construction in California) and indicates the major water uses at the plant.
Figure 1. Schematic of water uses in a combined-cycle plant
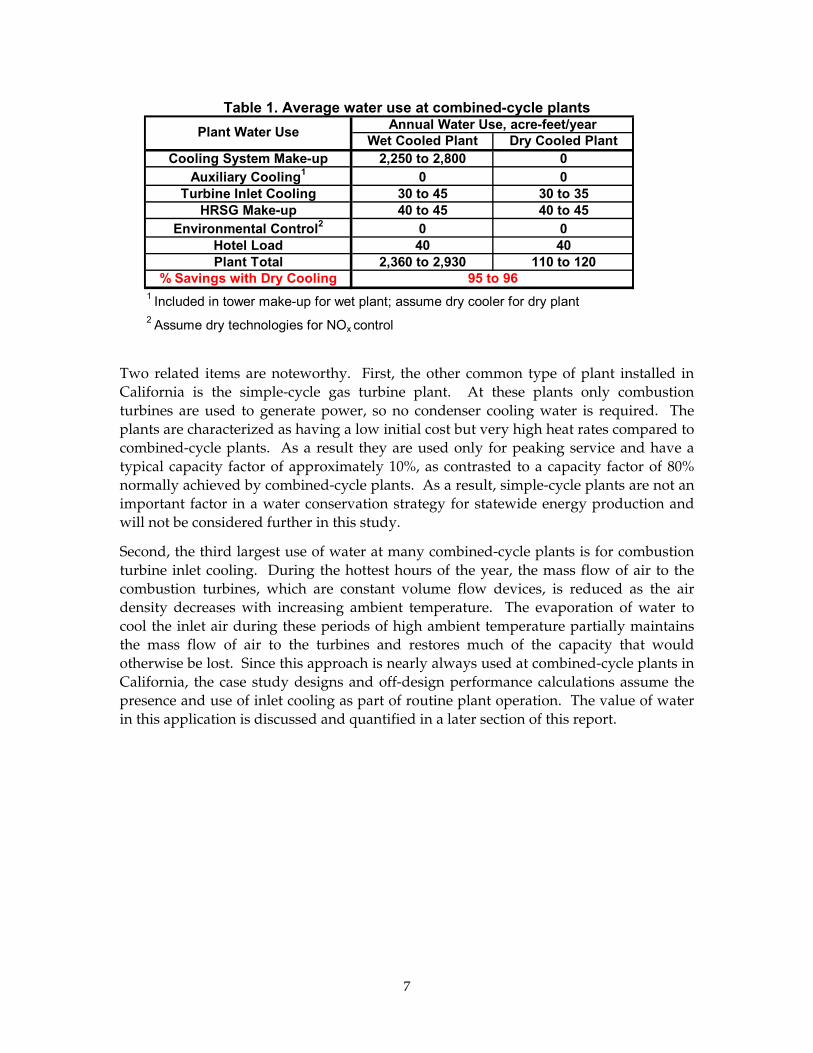
Table 1 lists typical flow rate requirements for the various uses for a 500 MW plant. Note that for plants with wet cooling systems, the cooling tower make-up represents approximately 95% of the total power plant water requirements. Through the use of dry cooling, the plant’s cooling water requirements can be eliminated (with the exception of small, intermittent use for cleaning the finned tube bundles).
Combustion TurbineTurbine inlet cooling Generator
Emissions control
Generator
Air-cooled condenser
HRSG make-up
Cooling tower makeup
Water flowsSteam/condensate flowsCombustion gas flowsPlant boundary
Plant water intake
Wastewater discharge
HRSG
or
Steam Turbine
Wet CoolingSystem
7
Table 1. Average water use at combined-cycle plants
Two related items are noteworthy. First, the other common type of plant installed in California is the simple-cycle gas turbine plant. At these plants only combustion turbines are used to generate power, so no condenser cooling water is required. The plants are characterized as having a low initial cost but very high heat rates compared to combined-cycle plants. As a result they are used only for peaking service and have a typical capacity factor of approximately 10%, as contrasted to a capacity factor of 80% normally achieved by combined-cycle plants. As a result, simple-cycle plants are not an important factor in a water conservation strategy for statewide energy production and will not be considered further in this study.
Second, the third largest use of water at many combined-cycle plants is for combustion turbine inlet cooling. During the hottest hours of the year, the mass flow of air to the combustion turbines, which are constant volume flow devices, is reduced as the air density decreases with increasing ambient temperature. The evaporation of water to cool the inlet air during these periods of high ambient temperature partially maintains the mass flow of air to the turbines and restores much of the capacity that would otherwise be lost. Since this approach is nearly always used at combined-cycle plants in California, the case study designs and off-design performance calculations assume the presence and use of inlet cooling as part of routine plant operation. The value of water in this application is discussed and quantified in a later section of this report.
Wet Cooled Plant Dry Cooled PlantCooling System Make-up 2,250 to 2,800 0
Auxiliary Cooling1 0 0Turbine Inlet Cooling 30 to 45 30 to 35
HRSG Make-up 40 to 45 40 to 45Environmental Control2 0 0
Hotel Load 40 40Plant Total 2,360 to 2,930 110 to 120
% Savings with Dry Cooling1 Included in tower make-up for wet plant; assume dry cooler for dry plant2 Assume dry technologies for NOx control
95 to 96
Annual Water Use, acre-feet/yearPlant Water Use
8
2.0 Purpose Although significant amounts of water can be saved by the use of dry cooling, the savings come at a price in the form of higher plant cost, reduced power production, increased fuel consumption as a result of lower plant efficiency, higher plant operating power requirements, and hence, higher operating costs—all resulting in a reduction in potential revenue from the power generation operation. Conversely, the use of water for wet cooling at the power plant avoids these costs and thus provides value to the plant and its operation. The purpose of this study is to estimate the value of water use at power plants at a variety of sites and using a variety of source waters representative of conditions in California.
9
3.0 Methodology and Scope To achieve this purpose, the study calculates the costs and benefits of water use at four sites with four source water types. The sites and plant types are those developed in a previous study funded by the California Energy Commission’s Public Interest Energy Research (PIER) Program (DiFilippo 2003; Maulbetsch 2002).
The primary emphasis of this study is on the comparative cost, performance, and water use of gas-fired, combined-cycle power plants with dry and wet cooling systems.
In order to develop the costs required for the comparisons, the following quantities are determined for two optimized plants at each site; one using wet cooling, and the other using dry cooling.
• Plant capital cost
• Plant efficiency and fuel cost
• Plant output capacity at summer peak conditions (MW)
• Plant annual output (MWh per year)
• Water used by the plant (acre-feet/year)
A variety of source waters, including saline water, brackish groundwater, and reclaimed municipal waste water (in addition to fresh water) were considered at each site.
All plants were assumed to use water (in addition to cooling tower make-up, at the wet-cooled plants) for inlet air-cooling of the combustion turbines, for steam cycle make-up and for a plant “hotel” load (e.g., water used for cleaning, drinking, sanitary uses). The gas turbine inlet cooling will be done with evaporative cooling (“fogging” of the inlet air). The amount varies from case to case as a function of the site meteorology but ranged from 20 to 60 gpm for both of the two combustion turbines at each 500 MW plant. The hotel load and steam cycle make-up were set at 30 gpm for each case study plant. Although some plants also use water for NOx control and auxiliary cooling, this analysis assumed that those functions are performed with dry technologies, with zero water requirements.
Once the plant design was determined, the off-design performance was calculated at eight operating points covering the range of ambient temperatures at the site over the course of a year. These performance values were then integrated over a year of operation using temperature duration curves for the site. This process determined the annual net plant output, the annual fuel cost, the annual operating costs, the annual water use, and an annual potential revenue.
The several cost elements were then combined, using an appropriate annualization factor to put the capital cost on an annual basis, to determine the total annual cost of operation. The difference between the two total costs establishes the total annual cost associated with the choice of cooling system. Water use was summed over the year to determine the annual water requirements for each power plant and the water savings achievable from the use of dry cooling.
10
For completeness and convenience of reference, a few special comparisons are presented at the end of the report. These are:
• Simple-cycle versus combined-cycle power plants
• Combined-cycle plants with and without combustion turbine inlet cooling
• Combined-cycle plants using different design optimization criteria.
11
4.0 Base Cases
4.1. Sites Four sites were chosen to cover a range of climates representative of conditions in California. These were a desert site, a valley site, a mountain site, and a coastal site.
1. The desert site, with a very hot, arid climate, represents a particularly challenging set of conditions for air-cooled equipment, but also represents the condition under which water is the most scarce.
2. The valley site, while still having high summertime temperatures, represents a more moderate climate than the desert site. At this location, fresh water is highly valued by the agricultural community, but saline groundwater, which is unsuitable for irrigation, is available.
3. The coastal site has much cooler summertime temperatures. Fresh and reclaimed municipal water is available at coastal locations; groundwater in sufficient quantities is usually not. Wet, recirculating cooling using seawater for cooling water make-up is not considered in this analysis.
4. The mountain site has low annual average temperatures, but high summertime temperatures comparable to the desert site. Probable water sources are fresh surface or groundwater or, in some locations near larger cities, reclaimed water. The higher elevation (3,200 feet (975 meters) above sea level) has some effect on the performance of both wet and dry cooling systems.
4.2. Site Meteorology Meteorological design conditions for the four sites are:
1. Desert site (data from Blythe, California) Elevation: 400 ft. (122 meters) (14.5 psia; 28.5 in Hga) Summer average temperature:1 96°F (36°C); coincident wet bulb:
69°F (21°C) (rh = 25.1%) 1% dry-bulb temperature:2 109°F (43°C); coincident wet bulb: 73°F (23°C)
(rh = 17.5%) 1% wet-bulb temperature:3 78°F (26°C); coincident dry bulb: 96°F (36°C)
(rh = 45.4%)
1 Average temperature during months of June through September 2 Dry-bulb temperature exceeded for 1% of the hours during the year (~90 hours) 3 Wet-bulb temperature exceeded for 1% of the hours during the year (~90 hours)
12
2. Valley site (data from Bakersfield, California) Elevation: 500 ft. (26 meters) (14.4 psia; 28.4 in Hga) Summer average temperature: 86°F (30°C); coincident wet bulb: 65°F
(18°C) (rh = 32.1%) 1% dry-bulb temperature: 102°F (39°C); coincident wet bulb: 70°F (21°C)
(rh = 19.7%) 1% wet-bulb temperature: 72°F (22°C); coincident dry bulb: 96°F (36°C)
(rh = 31.1%) 3. Coastal site (data from San Francisco, California) Elevation: Sea level (14.7 psia; 29.9 in Hga) Summer average temperature: 65°F (18°C); coincident wet bulb: 57°F
(14°C) (rh = 61.6%) 1% dry-bulb temperature: 79°F (26°C); coincident wet bulb: 62°F (17°C)
(rh = 37.9%) 1% wet-bulb temperature: 63°F (17°C); coincident dry bulb: 74°F (23°C)
(rh = 54.7%) 4. Mountain site (data from Redding, California) Elevation: 3,200 ft. (975 meters) (13.1 psia; 26.9 in Hga) Summer average temperature: 78°F (26°C); coincident wet bulb: 62°F (17°C)
(rh = 42.2%) 1% dry-bulb temperature: 103°F (39°C); coincident wet bulb: 69°F (21°C)
(rh = 18.6%) 1% wet-bulb temperature: 70°F (21°C); coincident dry bulb: 96°F (36°C)
(rh = 28.8%)
4.3. Power Plant Types The case study plants are all gas-fired, combined-cycle plants in a two combustion turbines and a single steam turbine (2 x 1) configuration, representative of the plants currently being constructed in California. At each site, two plant designs were analyzed; one with dry cooling; the other with wet cooling.
4.4. Water Sources Although the primary comparisons were conducted assuming that an adequate supply of good quality freshwater was available, comparisons were also made for the case where degraded water supplies were used for makeup to the plants. As will be described in a later section, saline, brackish, and reclaimed water supplies were also considered.
13
5.0 Design and Calculations
5.1. Plant Design Points The design points are as follows:
Plant capacity (nominal): 500 MW Configuration: Combined-cycle; 2 x 1 Combustion turbines: GE 7241 FA
175 MW (nominal) @ ISO conditions4 NOx control: Dry low-NOx combustor
The gas turbines are equipped with an inlet fogging system sized to provide sufficient water flow to reduce the inlet air temperature by 75% of the wet-bulb depression (defined as Tamb dry-bulb – Tamb wet-bulb) on the 1% dry-bulb day (the temperature exceeded for 1% of the hours annually).
The base cases assume no duct burning.
The plants were designed and their performance determined with both a wet cooling (a mechanical-draft wet tower) and dry cooling (an air-cooled condenser).
1. Combined-cycle plant with a wet cooling tower. The Heat Recovery Steam Generator (HRSG) and cooling system were designed for a 2.5 in Hga turbine backpressure at the 1% wet-bulb condition and the corresponding mean coincident dry-bulb. In previous studies (Maulbetsch 2002; EPRI 2004) a distinction was made in the selection of wet cooling systems between “lowest capital cost designs” and “lowest evaluated cost designs.” This distinction results from the fact that a prescribed cooling design point can be achieved with a small, less-expensive tower using increased amounts of fan power or a larger, more costly tower using less fan power. The “low capital cost” design has a higher lifetime cost when properly accounting for the increased power requirements for the life of the plant. In this study, the “lowest evaluated cost design” approach is chosen as the correct comparison to an optimized dry cooling system.
2. Combined-cycle plant with an air-cooled condenser. The rigorous establishment of an optimized design point for each site was beyond the scope of this study. Therefore, the design point for the air-cooled condenser (ACC) was set at the summer average temperature and the corresponding mean coincident wet-bulb. The condenser backpressure at the design
4 59°F (15°C); 60% relative humidity; sea level
14
ambient temperature was selected to provide an ITD of around 45°F (25°C). This choice was determined to be close to optimum based on the results of optimization studies conducted as part of a cooling system study performed for the Electric Power Research Institute (2004).
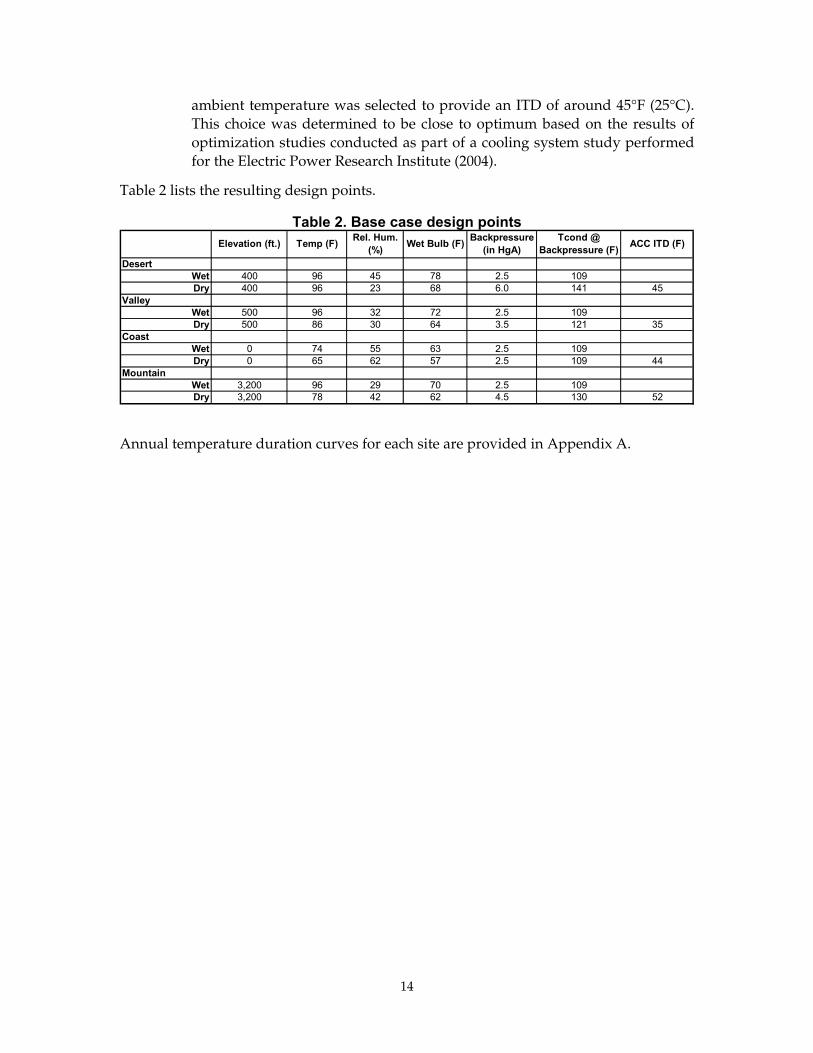
Table 2 lists the resulting design points.
Table 2. Base case design points
Annual temperature duration curves for each site are provided in Appendix A.
DesertWet 400 96 45 78 2.5 109Dry 400 96 23 68 6.0 141 45
ValleyWet 500 96 32 72 2.5 109Dry 500 86 30 64 3.5 121 35
CoastWet 0 74 55 63 2.5 109Dry 0 65 62 57 2.5 109 44
MountainWet 3,200 96 29 70 2.5 109Dry 3,200 78 42 62 4.5 130 52
Wet Bulb (F) Backpressure (in HgA)
Tcond @ Backpressure (F) ACC ITD (F)Elevation (ft.) Temp (F) Rel. Hum.
(%)
15
6.0 Scope of Analysis The researchers generated a plant design for each site/plant/cooling system combination. The plant off-design performance was then run for each of eight ambient temperatures covering the annual range of temperatures at the particular site. Researchers calculated the total plant costs (along with costs of numerous individual components) for each design. The design, performance, and cost information was developed through the use of software from the Thermoflow Software Suite, including GTPro and PEACE (Thermoflow 2004).
The researchers generated performance characteristics—including net plant output, heat rate, water consumption, and peripheral power requirements from the model. Finally, a variety of source waters were assumed for each plant, and the effect of source water quality on plant cost was determined.
Complete tables of the design and performance results are included in the appendices to the report as follows:
Appendix A: Site Meteorological Data
Appendix B: Design Cost and Performance Data
Appendix C: Off-Design Performance Data
Appendix D: Hourly Operating Data for All Sites, Plants, and Water Sources
Appendix E: Waste Water Treatment Options Summary
The following sections review the highlights of the case study results excerpted from tables in the appendices.
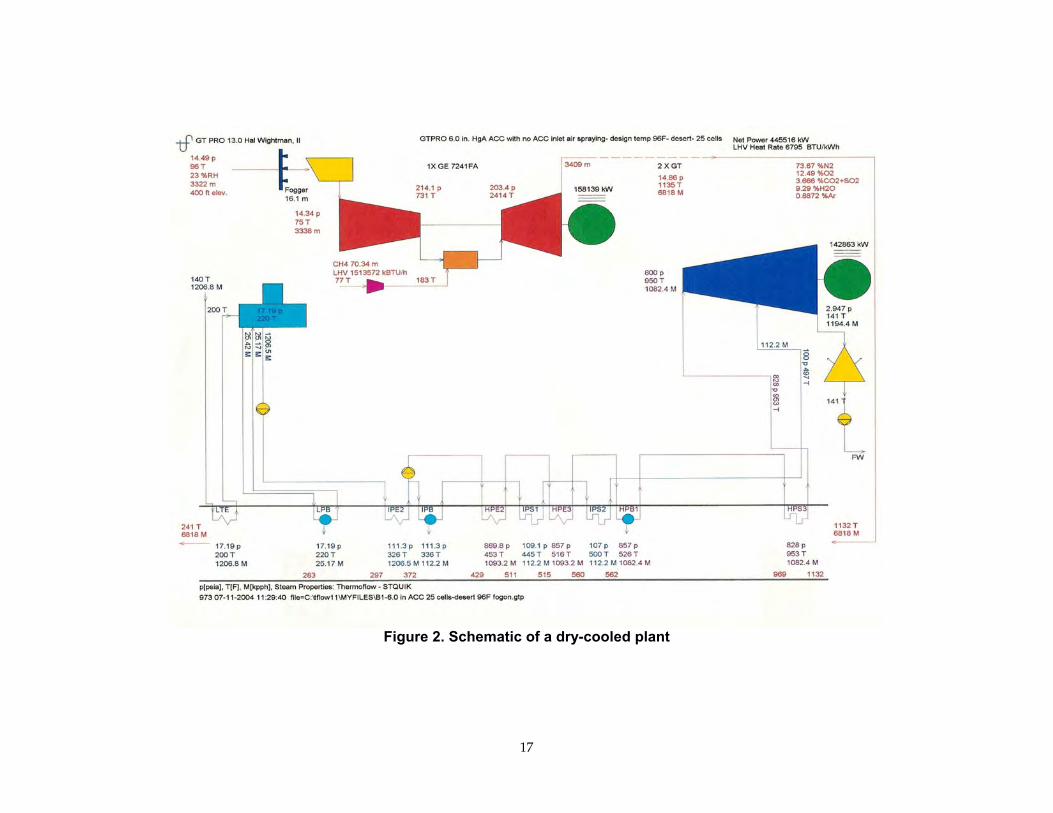
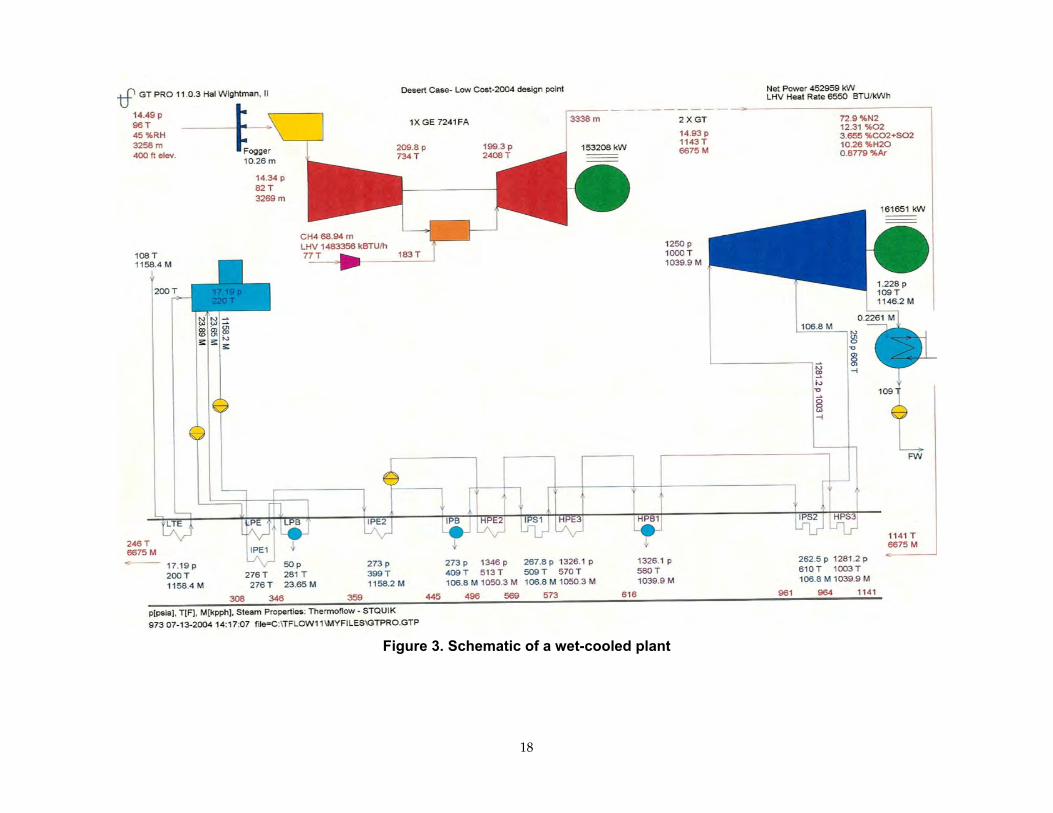
6.1. Plant Designs Figures 2 and 3 are schematics of the plant design layouts for both the wet and dry cooling systems at the desert site. These figures illustrate the plant flow sheets and the level of detail of design information generated by the Thermoflow program (Thermoflow 2004). Appendix B contains the schematics for the base design cases at all four sites. The values for flows, pressures, temperatures, and other variables in Figures 2 and 3 are specifically for the desert site, but the general plant configurations are identical for all sites.
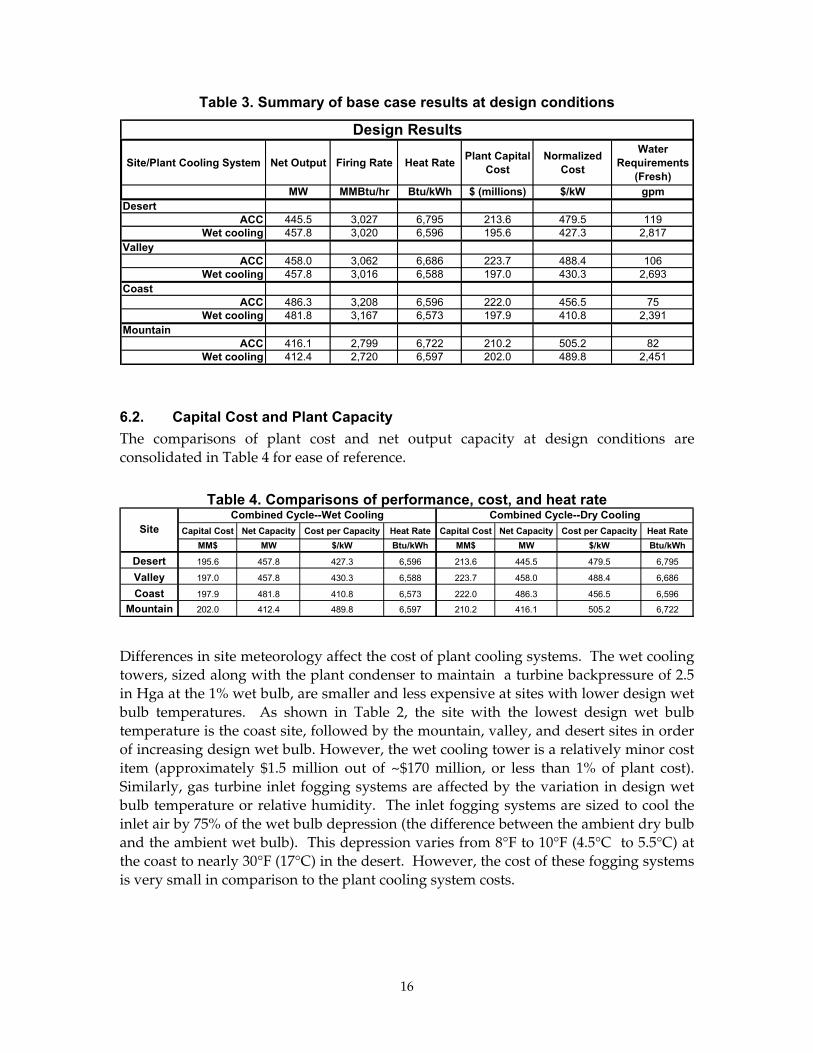
Table 3 lists the following design values for both the wet- and dry-cooled plants at each of the four sites.
• Plant capital cost, $ millions • Water system costs, $ millions • Net output, MW • Normalized cost, $/kW • Gas firing rate, MMBtu/hr • Heat rate, Btu/kWh • Water requirements, gpm
16
Table 3. Summary of base case results at design conditions
6.2. Capital Cost and Plant Capacity The comparisons of plant cost and net output capacity at design conditions are consolidated in Table 4 for ease of reference.
Table 4. Comparisons of performance, cost, and heat rate
Differences in site meteorology affect the cost of plant cooling systems. The wet cooling towers, sized along with the plant condenser to maintain a turbine backpressure of 2.5 in Hga at the 1% wet bulb, are smaller and less expensive at sites with lower design wet bulb temperatures. As shown in Table 2, the site with the lowest design wet bulb temperature is the coast site, followed by the mountain, valley, and desert sites in order of increasing design wet bulb. However, the wet cooling tower is a relatively minor cost item (approximately $1.5 million out of ~$170 million, or less than 1% of plant cost). Similarly, gas turbine inlet fogging systems are affected by the variation in design wet bulb temperature or relative humidity. The inlet fogging systems are sized to cool the inlet air by 75% of the wet bulb depression (the difference between the ambient dry bulb and the ambient wet bulb). This depression varies from 8°F to 10°F (4.5°C to 5.5°C) at the coast to nearly 30°F (17°C) in the desert. However, the cost of these fogging systems is very small in comparison to the plant cooling system costs.
Site/Plant Cooling System Net Output Firing Rate Heat Rate Plant Capital Cost
Normalized Cost
Water Requirements
(Fresh)MW MMBtu/hr Btu/kWh $ (millions) $/kW gpm
DesertACC 445.5 3,027 6,795 213.6 479.5 119
Wet cooling 457.8 3,020 6,596 195.6 427.3 2,817Valley
ACC 458.0 3,062 6,686 223.7 488.4 106Wet cooling 457.8 3,016 6,588 197.0 430.3 2,693
CoastACC 486.3 3,208 6,596 222.0 456.5 75
Wet cooling 481.8 3,167 6,573 197.9 410.8 2,391Mountain
ACC 416.1 2,799 6,722 210.2 505.2 82Wet cooling 412.4 2,720 6,597 202.0 489.8 2,451
Design Results
Capital Cost Net Capacity Cost per Capacity Heat Rate Capital Cost Net Capacity Cost per Capacity Heat RateMM$ MW $/kW Btu/kWh MM$ MW $/kW Btu/kWh
Desert 195.6 457.8 427.3 6,596 213.6 445.5 479.5 6,795
Valley 197.0 457.8 430.3 6,588 223.7 458.0 488.4 6,686
Coast 197.9 481.8 410.8 6,573 222.0 486.3 456.5 6,596
Mountain 202.0 412.4 489.8 6,597 210.2 416.1 505.2 6,722
Combined Cycle--Dry CoolingCombined Cycle--Wet CoolingSite
17
Figure 2. Schematic of a dry-cooled plant
18
Figure 3. Schematic of a wet-cooled plant
19
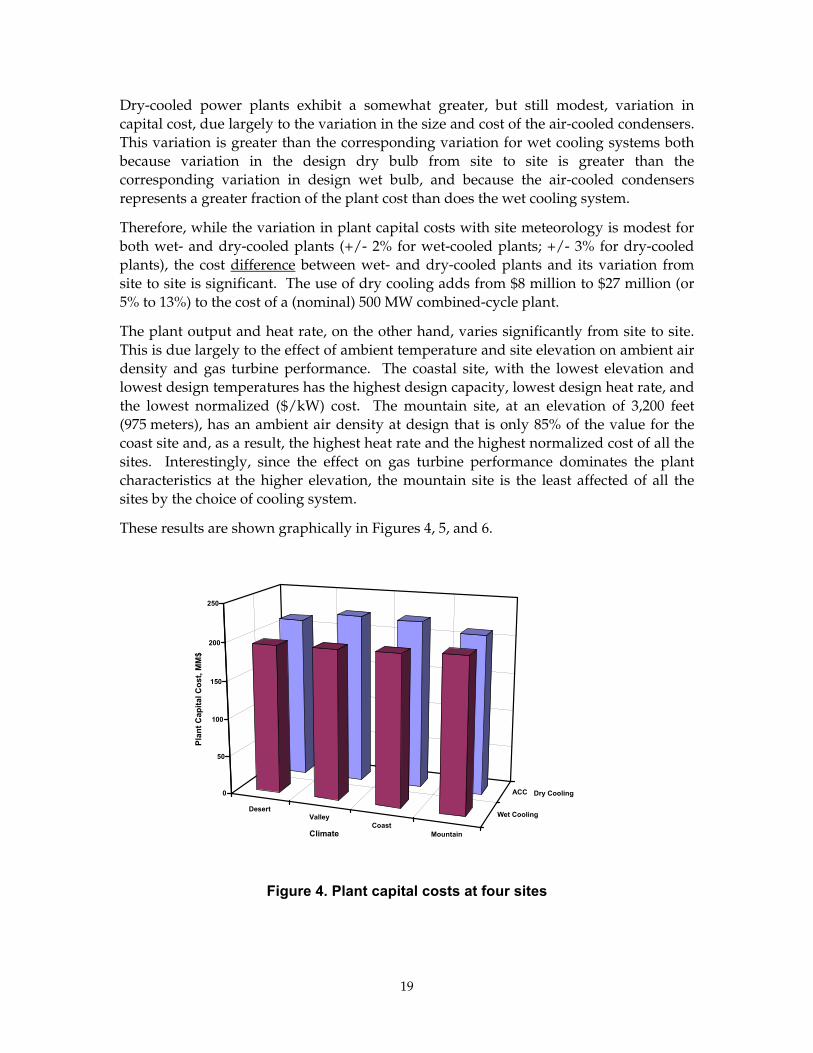
Dry-cooled power plants exhibit a somewhat greater, but still modest, variation in capital cost, due largely to the variation in the size and cost of the air-cooled condensers. This variation is greater than the corresponding variation for wet cooling systems both because variation in the design dry bulb from site to site is greater than the corresponding variation in design wet bulb, and because the air-cooled condensers represents a greater fraction of the plant cost than does the wet cooling system.
Therefore, while the variation in plant capital costs with site meteorology is modest for both wet- and dry-cooled plants (+/- 2% for wet-cooled plants; +/- 3% for dry-cooled plants), the cost difference between wet- and dry-cooled plants and its variation from site to site is significant. The use of dry cooling adds from $8 million to $27 million (or 5% to 13%) to the cost of a (nominal) 500 MW combined-cycle plant.
The plant output and heat rate, on the other hand, varies significantly from site to site. This is due largely to the effect of ambient temperature and site elevation on ambient air density and gas turbine performance. The coastal site, with the lowest elevation and lowest design temperatures has the highest design capacity, lowest design heat rate, and the lowest normalized ($/kW) cost. The mountain site, at an elevation of 3,200 feet (975 meters), has an ambient air density at design that is only 85% of the value for the coast site and, as a result, the highest heat rate and the highest normalized cost of all the sites. Interestingly, since the effect on gas turbine performance dominates the plant characteristics at the higher elevation, the mountain site is the least affected of all the sites by the choice of cooling system.
These results are shown graphically in Figures 4, 5, and 6.
Figure 4. Plant capital costs at four sites
DesertValley
CoastMountain
Wet Cooling
ACC0
50
100
150
200
250
Plan
t Cap
ital C
ost,
MM
$
Climate
Dry Cooling
20
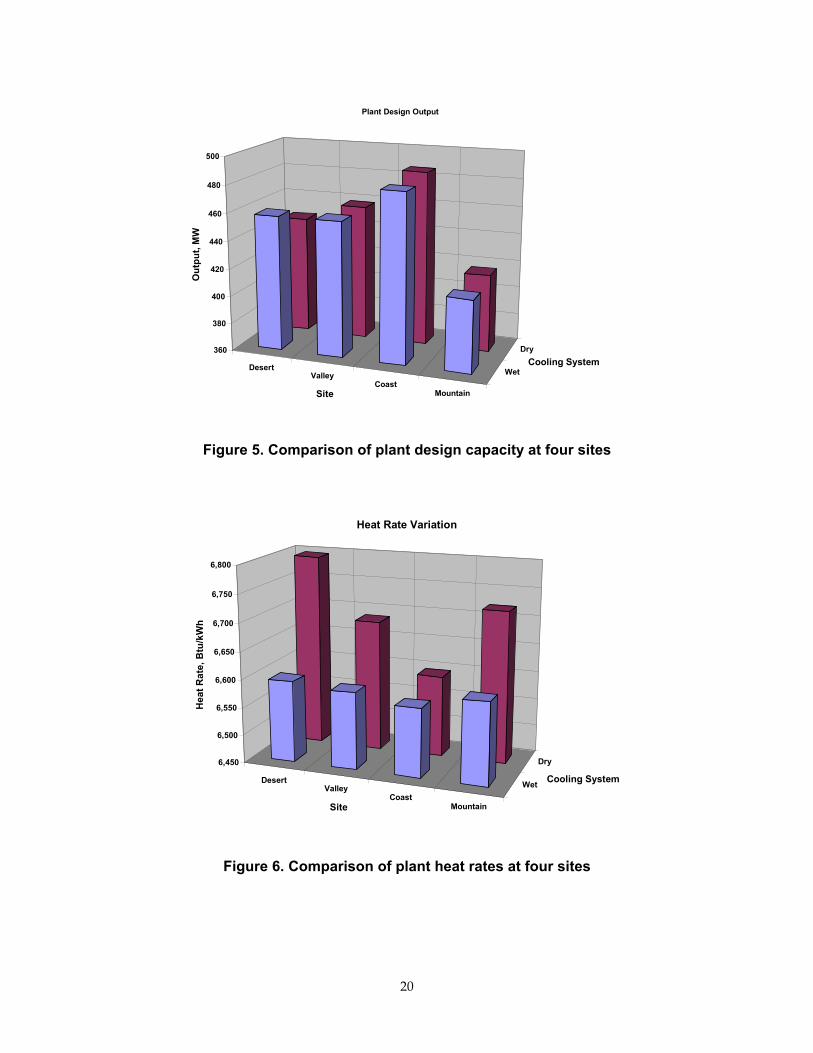
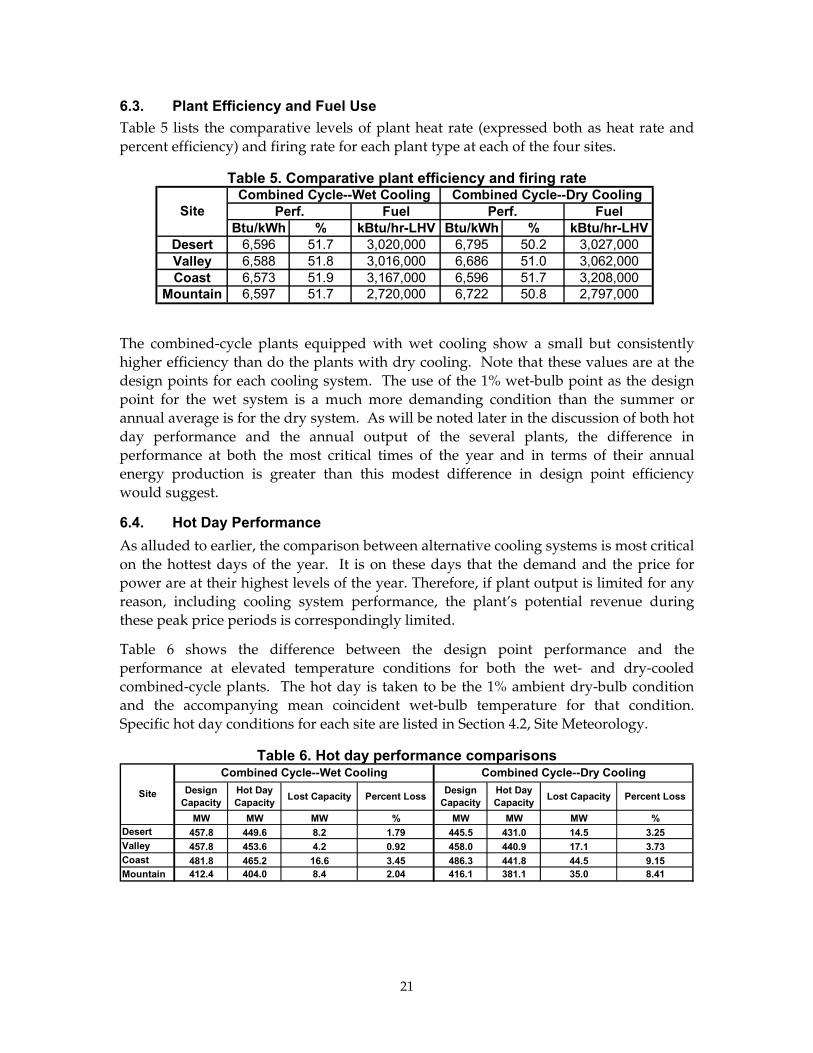
Figure 5. Comparison of plant design capacity at four sites
Figure 6. Comparison of plant heat rates at four sites
DesertValley
CoastMountain
Wet
Dry6,450
6,500
6,550
6,600
6,650
6,700
6,750
6,800
Hea
t Rat
e, B
tu/k
Wh
Site
Cooling System
Heat Rate Variation
DesertValley
CoastMountain
Wet
Dry360
380
400
420
440
460
480
500
Out
put,
MW
Site
Cooling System
Plant Design Output
21
6.3. Plant Efficiency and Fuel Use Table 5 lists the comparative levels of plant heat rate (expressed both as heat rate and percent efficiency) and firing rate for each plant type at each of the four sites.
Table 5. Comparative plant efficiency and firing rate
The combined-cycle plants equipped with wet cooling show a small but consistently higher efficiency than do the plants with dry cooling. Note that these values are at the design points for each cooling system. The use of the 1% wet-bulb point as the design point for the wet system is a much more demanding condition than the summer or annual average is for the dry system. As will be noted later in the discussion of both hot day performance and the annual output of the several plants, the difference in performance at both the most critical times of the year and in terms of their annual energy production is greater than this modest difference in design point efficiency would suggest.
6.4. Hot Day Performance As alluded to earlier, the comparison between alternative cooling systems is most critical on the hottest days of the year. It is on these days that the demand and the price for power are at their highest levels of the year. Therefore, if plant output is limited for any reason, including cooling system performance, the plant’s potential revenue during these peak price periods is correspondingly limited.
Table 6 shows the difference between the design point performance and the performance at elevated temperature conditions for both the wet- and dry-cooled combined-cycle plants. The hot day is taken to be the 1% ambient dry-bulb condition and the accompanying mean coincident wet-bulb temperature for that condition. Specific hot day conditions for each site are listed in Section 4.2, Site Meteorology.
Table 6. Hot day performance comparisons
Fuel FuelBtu/kWh % kBtu/hr-LHV Btu/kWh % kBtu/hr-LHV
Desert 6,596 51.7 3,020,000 6,795 50.2 3,027,000Valley 6,588 51.8 3,016,000 6,686 51.0 3,062,000Coast 6,573 51.9 3,167,000 6,596 51.7 3,208,000
Mountain 6,597 51.7 2,720,000 6,722 50.8 2,797,000
Combined Cycle--Dry CoolingPerf.Perf.
Combined Cycle--Wet CoolingSite
Design Capacity
Hot Day Capacity Lost Capacity Percent Loss Design
CapacityHot Day Capacity Lost Capacity Percent Loss
MW MW MW % MW MW MW %Desert 457.8 449.6 8.2 1.79 445.5 431.0 14.5 3.25Valley 457.8 453.6 4.2 0.92 458.0 440.9 17.1 3.73Coast 481.8 465.2 16.6 3.45 486.3 441.8 44.5 9.15Mountain 412.4 404.0 8.4 2.04 416.1 381.1 35.0 8.41
Combined Cycle--Wet Cooling Combined Cycle--Dry Cooling
Site
22
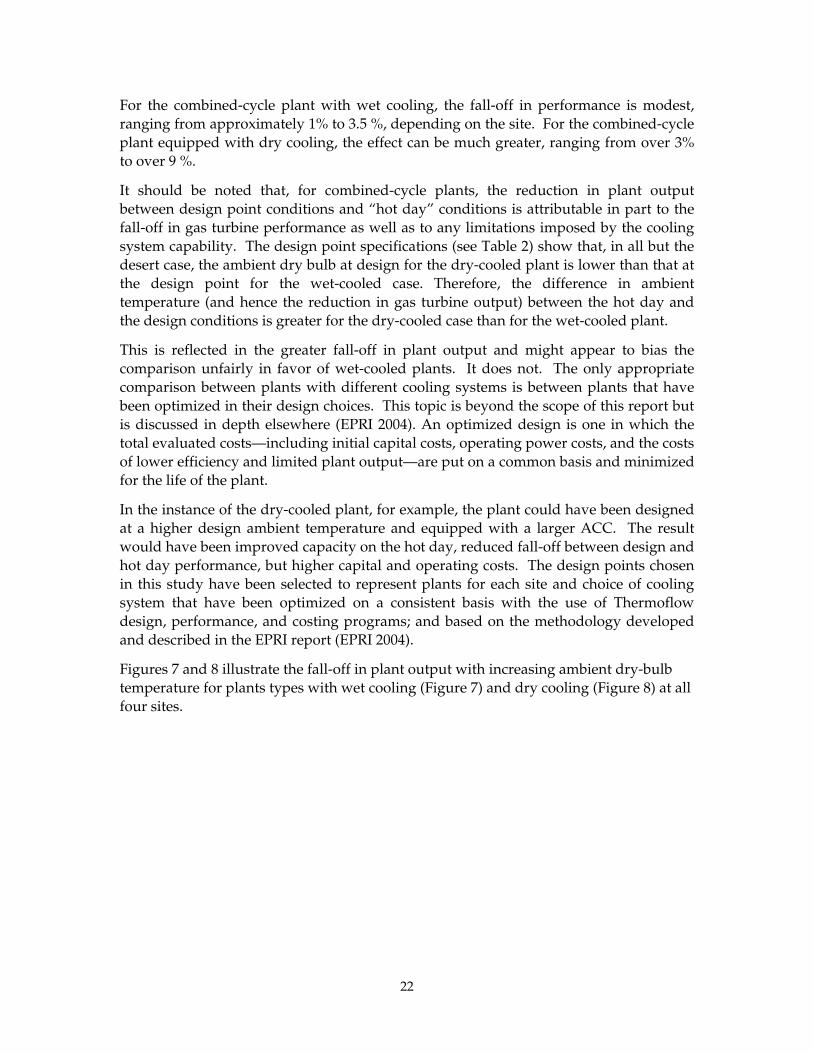
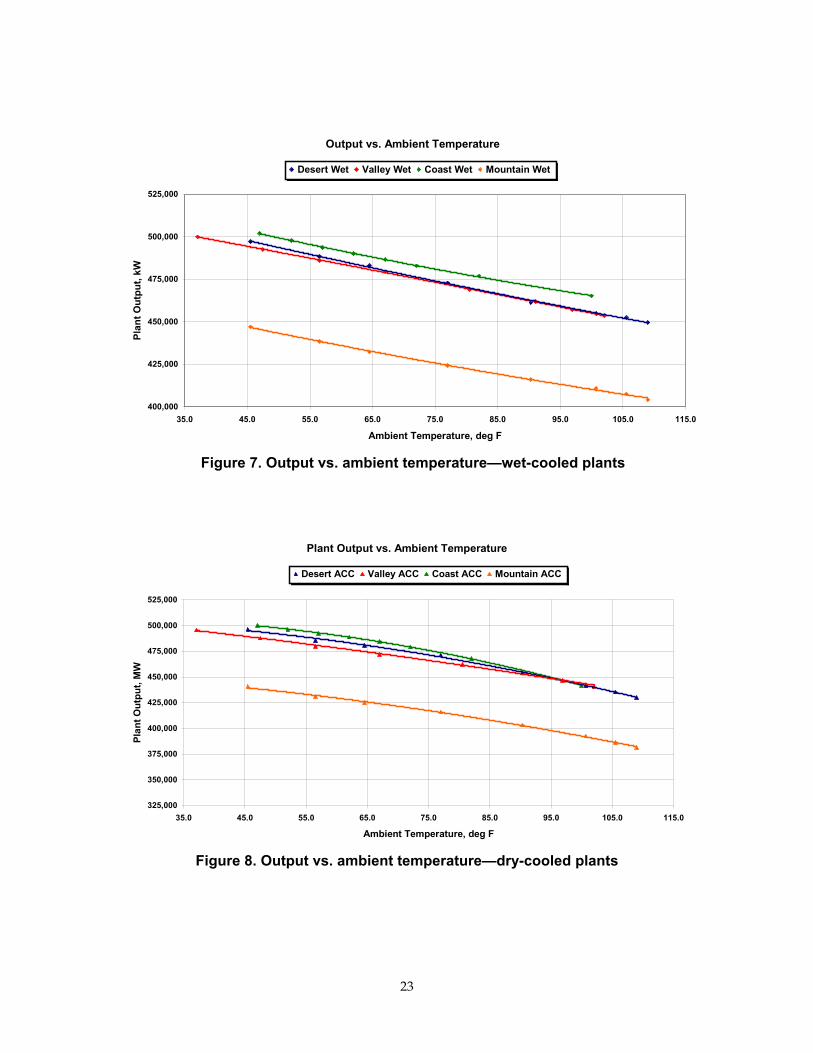
For the combined-cycle plant with wet cooling, the fall-off in performance is modest, ranging from approximately 1% to 3.5 %, depending on the site. For the combined-cycle plant equipped with dry cooling, the effect can be much greater, ranging from over 3% to over 9 %.
It should be noted that, for combined-cycle plants, the reduction in plant output between design point conditions and “hot day” conditions is attributable in part to the fall-off in gas turbine performance as well as to any limitations imposed by the cooling system capability. The design point specifications (see Table 2) show that, in all but the desert case, the ambient dry bulb at design for the dry-cooled plant is lower than that at the design point for the wet-cooled case. Therefore, the difference in ambient temperature (and hence the reduction in gas turbine output) between the hot day and the design conditions is greater for the dry-cooled case than for the wet-cooled plant.
This is reflected in the greater fall-off in plant output and might appear to bias the comparison unfairly in favor of wet-cooled plants. It does not. The only appropriate comparison between plants with different cooling systems is between plants that have been optimized in their design choices. This topic is beyond the scope of this report but is discussed in depth elsewhere (EPRI 2004). An optimized design is one in which the total evaluated costs—including initial capital costs, operating power costs, and the costs of lower efficiency and limited plant output—are put on a common basis and minimized for the life of the plant.
In the instance of the dry-cooled plant, for example, the plant could have been designed at a higher design ambient temperature and equipped with a larger ACC. The result would have been improved capacity on the hot day, reduced fall-off between design and hot day performance, but higher capital and operating costs. The design points chosen in this study have been selected to represent plants for each site and choice of cooling system that have been optimized on a consistent basis with the use of Thermoflow design, performance, and costing programs; and based on the methodology developed and described in the EPRI report (EPRI 2004).
Figures 7 and 8 illustrate the fall-off in plant output with increasing ambient dry-bulb temperature for plants types with wet cooling (Figure 7) and dry cooling (Figure 8) at all four sites.
23
Figure 7. Output vs. ambient temperature—wet-cooled plants
Figure 8. Output vs. ambient temperature—dry-cooled plants
Output vs. Ambient Temperature
400,000
425,000
450,000
475,000
500,000
525,000
35.0 45.0 55.0 65.0 75.0 85.0 95.0 105.0 115.0
Ambient Temperature, deg F
Plan
t Out
put,
kW
Desert Wet Valley Wet Coast Wet Mountain Wet
Plant Output vs. Ambient Temperature
325,000
350,000
375,000
400,000
425,000
450,000
475,000
500,000
525,000
35.0 45.0 55.0 65.0 75.0 85.0 95.0 105.0 115.0
Ambient Temperature, deg F
Plan
t Out
put,
MW
Desert ACC Valley ACC Coast ACC Mountain ACC
24
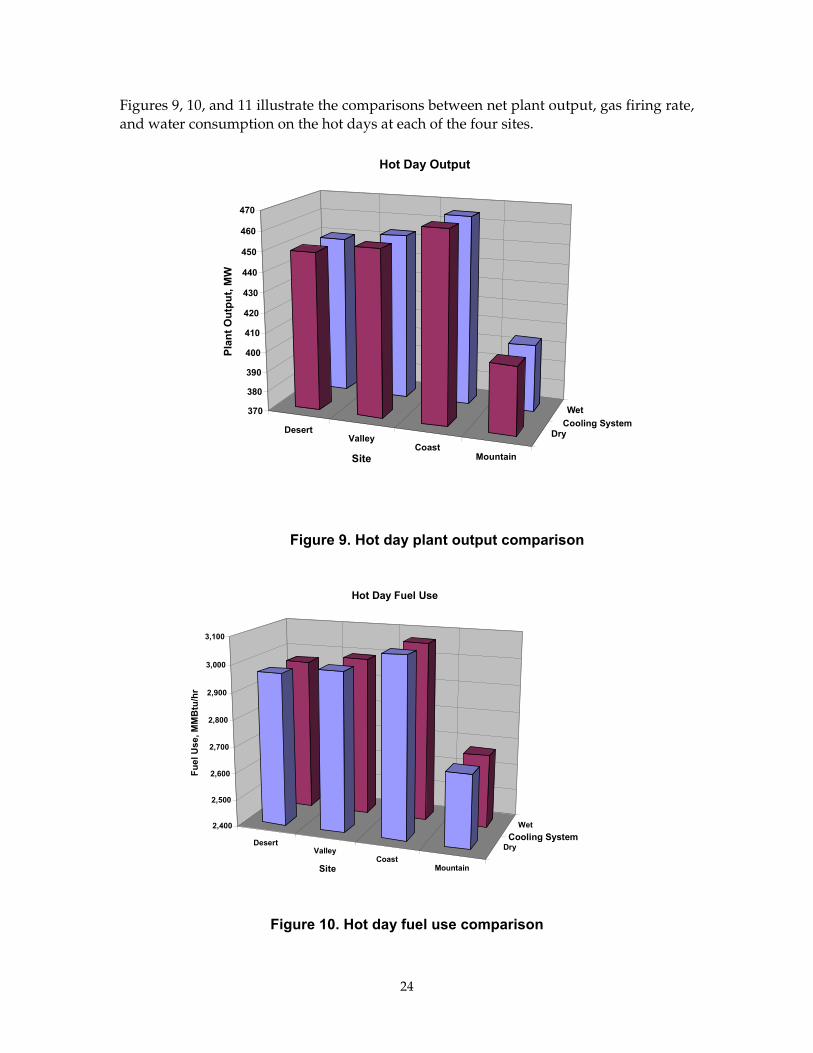
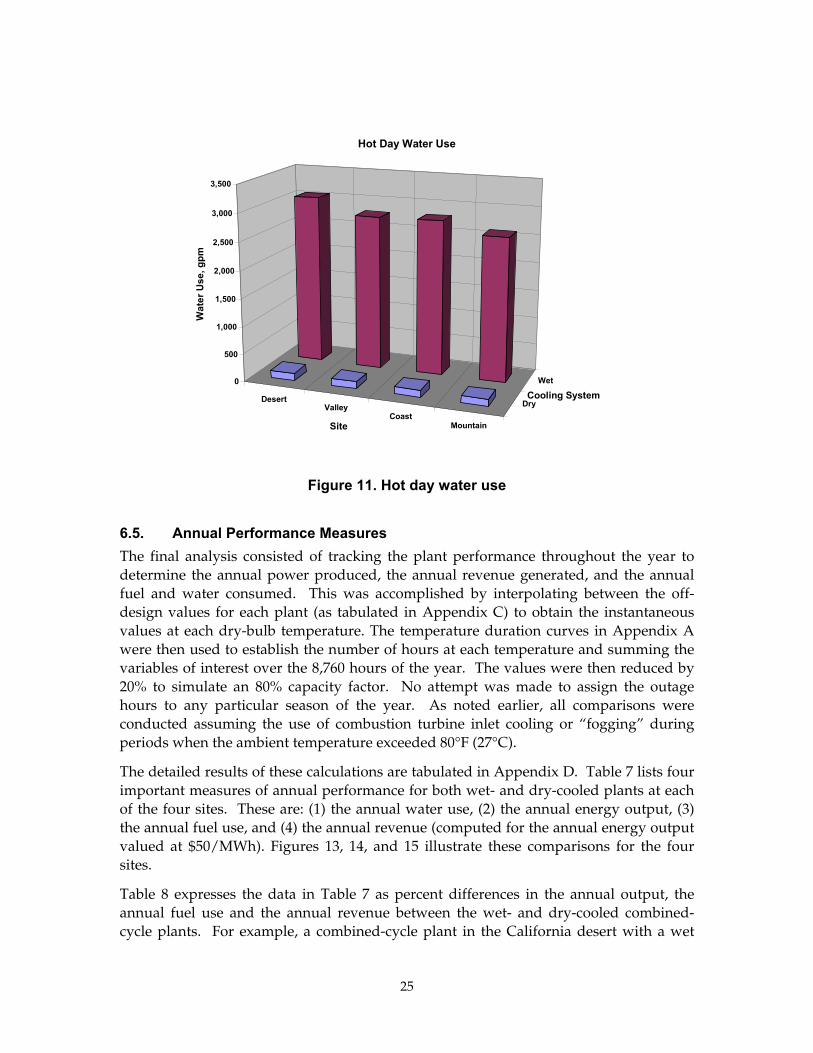
Figures 9, 10, and 11 illustrate the comparisons between net plant output, gas firing rate, and water consumption on the hot days at each of the four sites.
Figure 9. Hot day plant output comparison
Figure 10. Hot day fuel use comparison
DesertValley
CoastMountain
Dry
Wet2,400
2,500
2,600
2,700
2,800
2,900
3,000
3,100
Fuel
Use
, MM
Btu
/hr
Site
Cooling System
Hot Day Fuel Use
DesertValley
CoastMountain
Dry
Wet370
380
390
400
410
420
430
440
450
460
470
Plan
t Out
put,
MW
Site
Cooling System
Hot Day Output
25
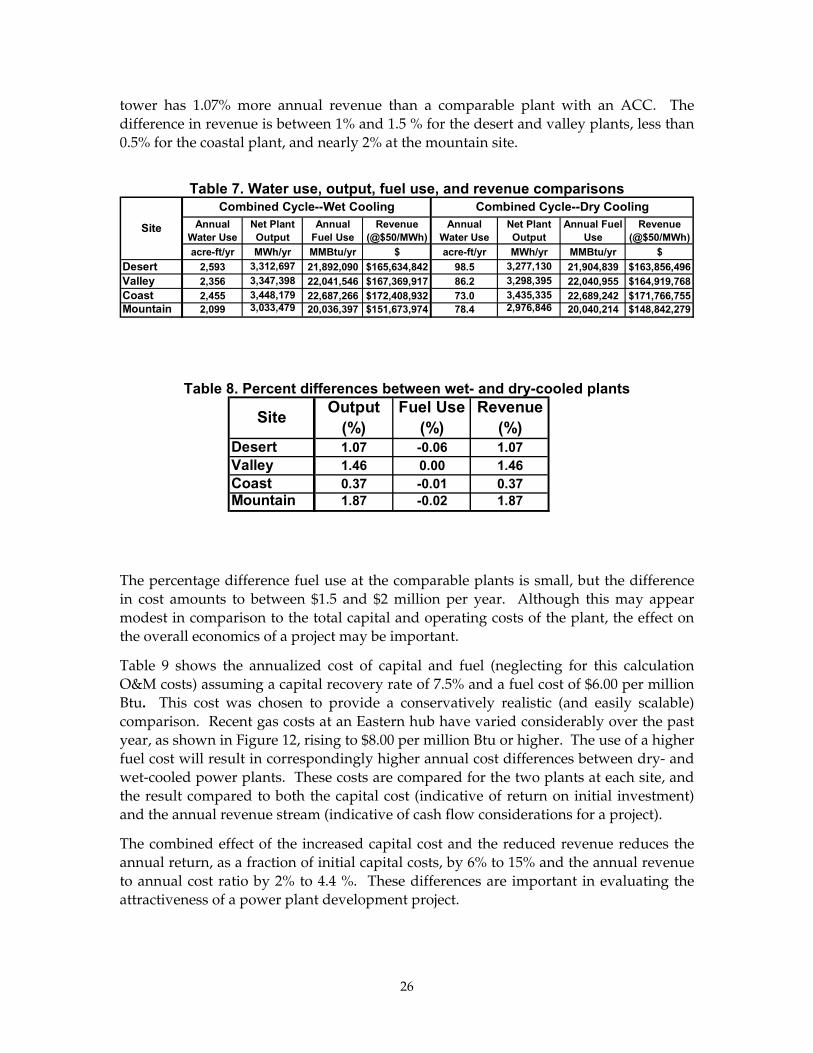
Figure 11. Hot day water use
6.5. Annual Performance Measures The final analysis consisted of tracking the plant performance throughout the year to determine the annual power produced, the annual revenue generated, and the annual fuel and water consumed. This was accomplished by interpolating between the off-design values for each plant (as tabulated in Appendix C) to obtain the instantaneous values at each dry-bulb temperature. The temperature duration curves in Appendix A were then used to establish the number of hours at each temperature and summing the variables of interest over the 8,760 hours of the year. The values were then reduced by 20% to simulate an 80% capacity factor. No attempt was made to assign the outage hours to any particular season of the year. As noted earlier, all comparisons were conducted assuming the use of combustion turbine inlet cooling or “fogging” during periods when the ambient temperature exceeded 80°F (27°C).
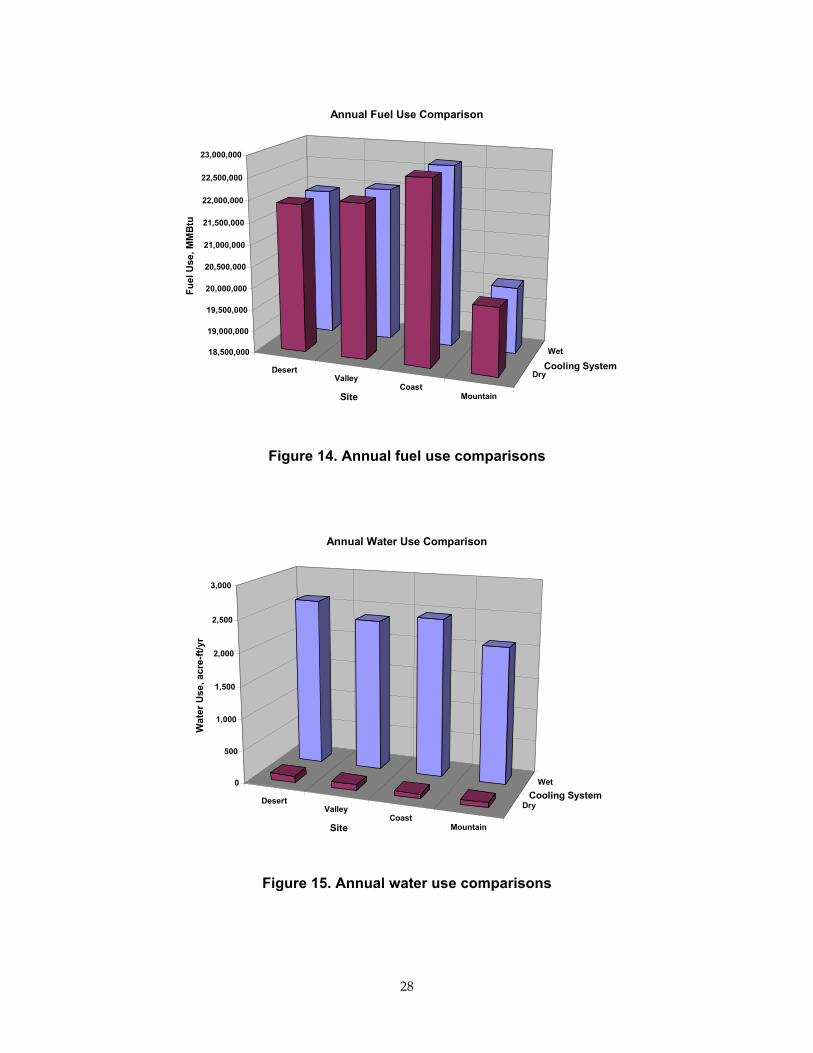
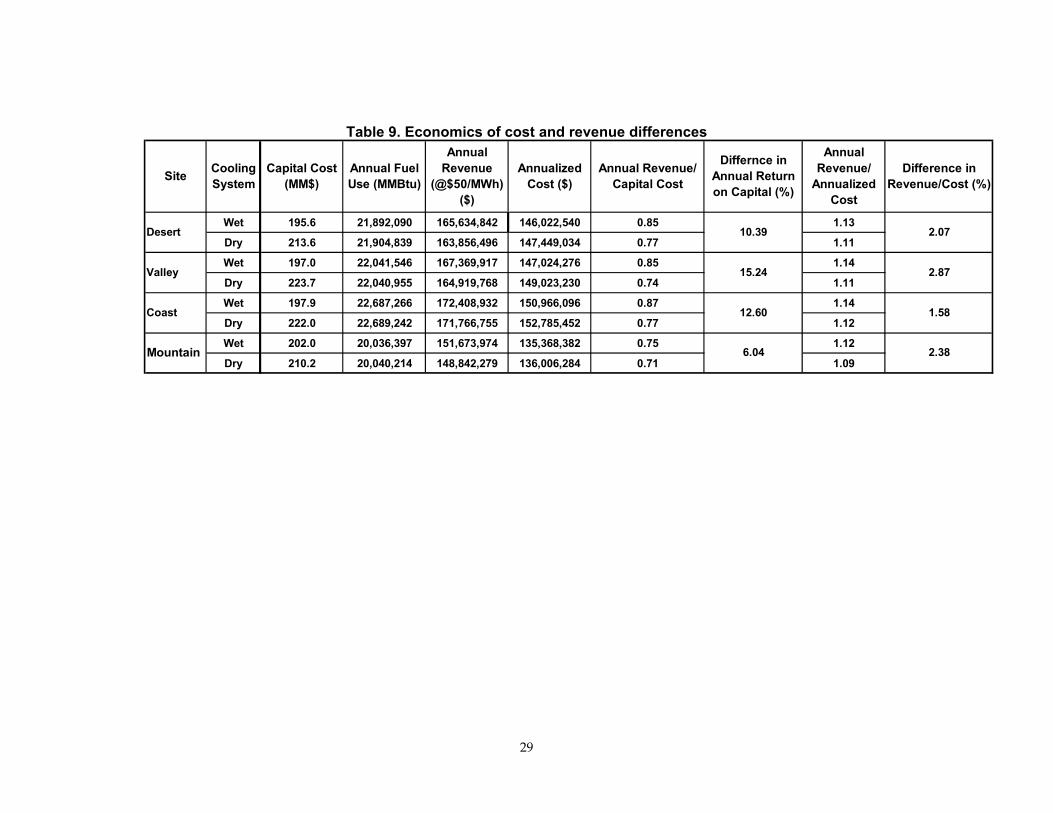
The detailed results of these calculations are tabulated in Appendix D. Table 7 lists four important measures of annual performance for both wet- and dry-cooled plants at each of the four sites. These are: (1) the annual water use, (2) the annual energy output, (3) the annual fuel use, and (4) the annual revenue (computed for the annual energy output valued at $50/MWh). Figures 13, 14, and 15 illustrate these comparisons for the four sites.
Table 8 expresses the data in Table 7 as percent differences in the annual output, the annual fuel use and the annual revenue between the wet- and dry-cooled combined-cycle plants. For example, a combined-cycle plant in the California desert with a wet
DesertValley
CoastMountain
Dry
Wet0
500
1,000
1,500
2,000
2,500
3,000
3,500
Wat
er U
se, g
pm
Site
Cooling System
Hot Day Water Use
26
tower has 1.07% more annual revenue than a comparable plant with an ACC. The difference in revenue is between 1% and 1.5 % for the desert and valley plants, less than 0.5% for the coastal plant, and nearly 2% at the mountain site.
Table 7. Water use, output, fuel use, and revenue comparisons
Table 8. Percent differences between wet- and dry-cooled plants
The percentage difference fuel use at the comparable plants is small, but the difference in cost amounts to between $1.5 and $2 million per year. Although this may appear modest in comparison to the total capital and operating costs of the plant, the effect on the overall economics of a project may be important.
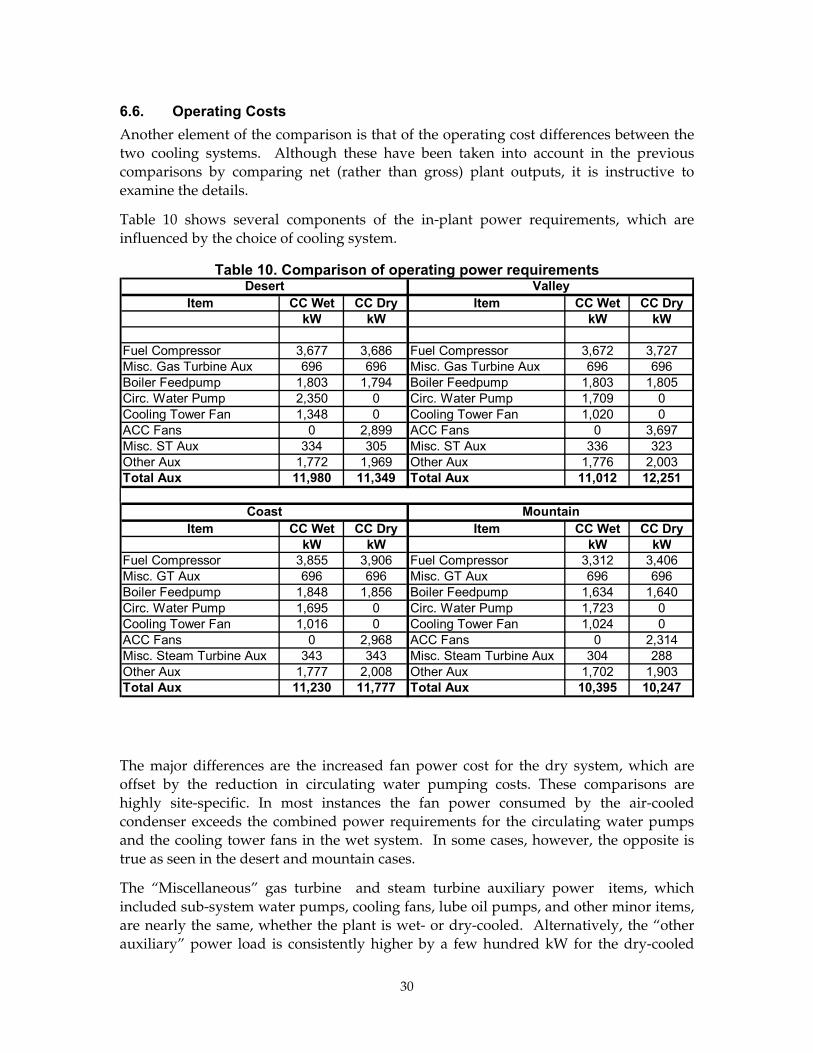
Table 9 shows the annualized cost of capital and fuel (neglecting for this calculation O&M costs) assuming a capital recovery rate of 7.5% and a fuel cost of $6.00 per million Btu. This cost was chosen to provide a conservatively realistic (and easily scalable) comparison. Recent gas costs at an Eastern hub have varied considerably over the past year, as shown in Figure 12, rising to $8.00 per million Btu or higher. The use of a higher fuel cost will result in correspondingly higher annual cost differences between dry- and wet-cooled power plants. These costs are compared for the two plants at each site, and the result compared to both the capital cost (indicative of return on initial investment) and the annual revenue stream (indicative of cash flow considerations for a project).
The combined effect of the increased capital cost and the reduced revenue reduces the annual return, as a fraction of initial capital costs, by 6% to 15% and the annual revenue to annual cost ratio by 2% to 4.4 %. These differences are important in evaluating the attractiveness of a power plant development project.
Annual Water Use
Net Plant Output
Annual Fuel Use
Revenue (@$50/MWh)
Annual Water Use
Net Plant Output
Annual Fuel Use
Revenue (@$50/MWh)
acre-ft/yr MWh/yr MMBtu/yr $ acre-ft/yr MWh/yr MMBtu/yr $Desert 2,593 3,312,697 21,892,090 $165,634,842 98.5 3,277,130 21,904,839 $163,856,496Valley 2,356 3,347,398 22,041,546 $167,369,917 86.2 3,298,395 22,040,955 $164,919,768Coast 2,455 3,448,179 22,687,266 $172,408,932 73.0 3,435,335 22,689,242 $171,766,755Mountain 2,099 3,033,479 20,036,397 $151,673,974 78.4 2,976,846 20,040,214 $148,842,279
Combined Cycle--Wet Cooling Combined Cycle--Dry CoolingSite
Desert 1.07 -0.06 1.07Valley 1.46 0.00 1.46Coast 0.37 -0.01 0.37Mountain 1.87 -0.02 1.87
Site Output (%)
Fuel Use (%)
Revenue (%)
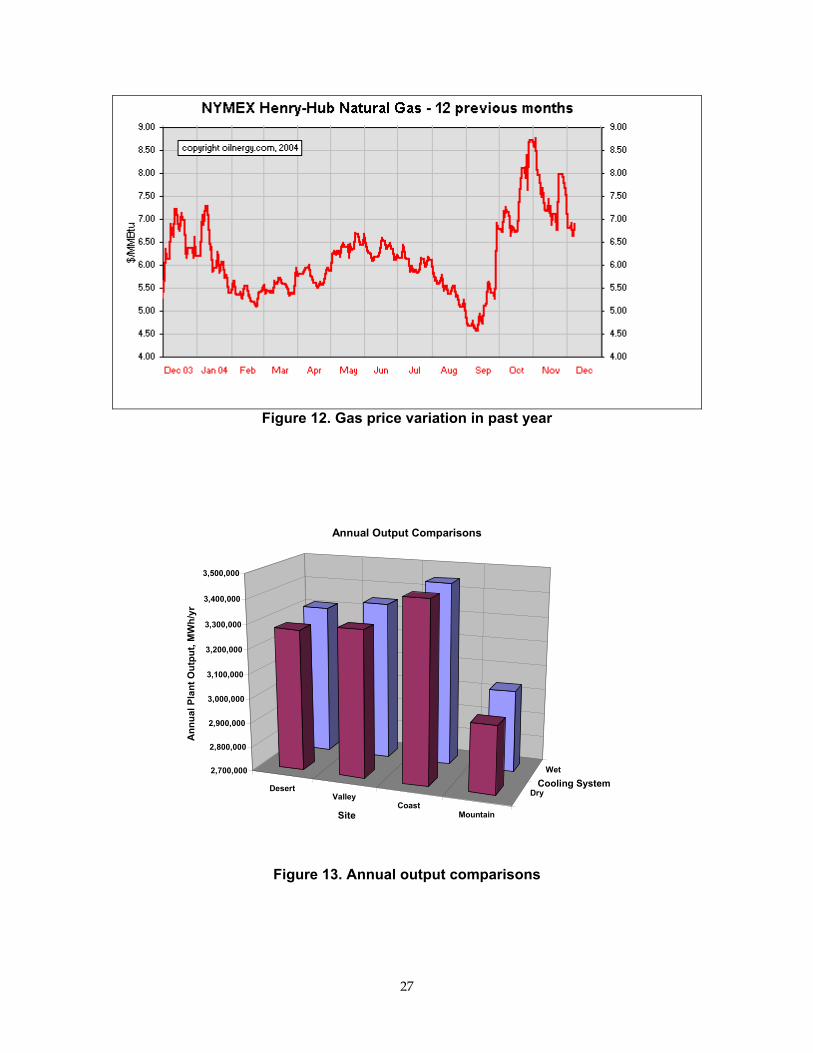
27
Figure 12. Gas price variation in past year
Figure 13. Annual output comparisons
DesertValley
CoastMountain
Dry
Wet2,700,000
2,800,000
2,900,000
3,000,000
3,100,000
3,200,000
3,300,000
3,400,000
3,500,000
Ann
ual P
lant
Out
put,
MW
h/yr
Site
Cooling System
Annual Output Comparisons
28
Figure 14. Annual fuel use comparisons
Figure 15. Annual water use comparisons
DesertValley
CoastMountain
Dry
Wet18,500,000
19,000,000
19,500,000
20,000,000
20,500,000
21,000,000
21,500,000
22,000,000
22,500,000
23,000,000
Fuel
Use
, MM
Btu
Site
Cooling System
Annual Fuel Use Comparison
DesertValley
CoastMountain
Dry
Wet0
500
1,000
1,500
2,000
2,500
3,000
Wat
er U
se, a
cre-
ft/yr
Site
Cooling System
Annual Water Use Comparison
29
Table 9. Economics of cost and revenue differences
Wet 195.6 21,892,090 165,634,842 146,022,540 0.85 1.13
Dry 213.6 21,904,839 163,856,496 147,449,034 0.77 1.11
Wet 197.0 22,041,546 167,369,917 147,024,276 0.85 1.14
Dry 223.7 22,040,955 164,919,768 149,023,230 0.74 1.11
Wet 197.9 22,687,266 172,408,932 150,966,096 0.87 1.14
Dry 222.0 22,689,242 171,766,755 152,785,452 0.77 1.12
Wet 202.0 20,036,397 151,673,974 135,368,382 0.75 1.12
Dry 210.2 20,040,214 148,842,279 136,006,284 0.71 1.09
Annual Revenue/ Capital Cost
Differnce in Annual Return on Capital (%)
Annual Revenue/
Annualized Cost
Difference in Revenue/Cost (%)
Capital Cost (MM$)
Annual Fuel Use (MMBtu)
Annual Revenue
(@$50/MWh) ($)
Annualized Cost ($)
2.07
2.87
1.58
2.38
10.39
15.24
12.60
6.04Mountain
Desert
Valley
Coast
Site Cooling System
30
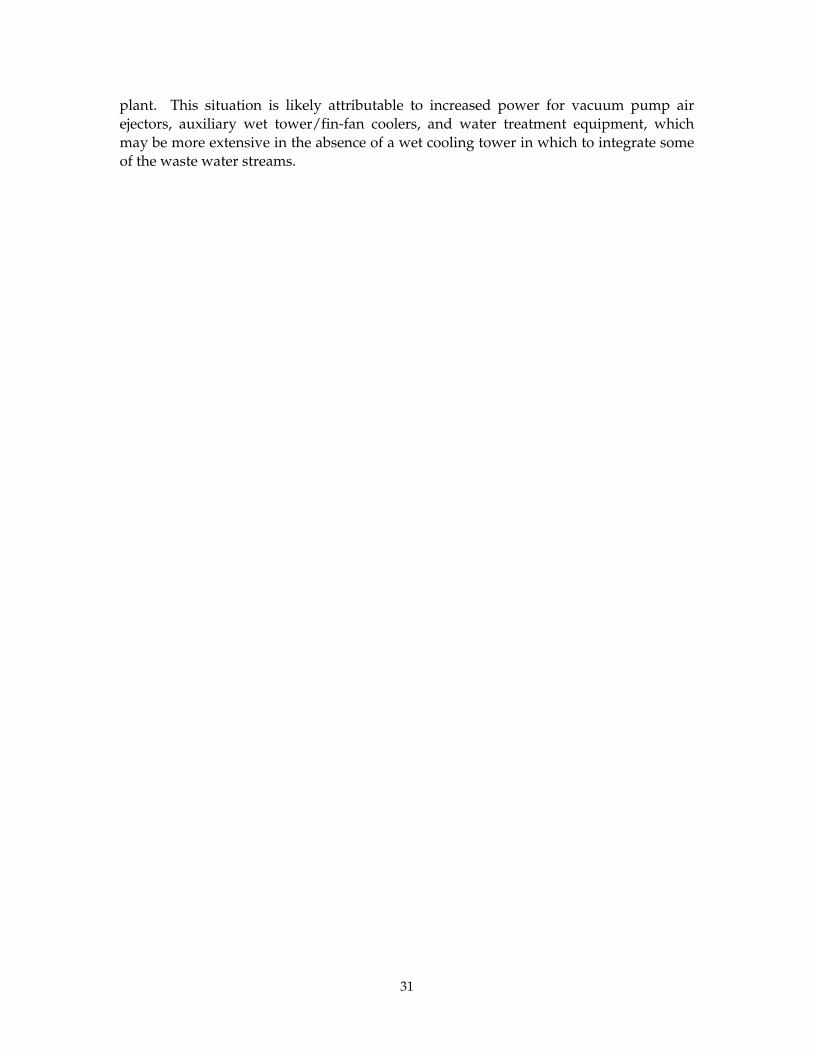
6.6. Operating Costs Another element of the comparison is that of the operating cost differences between the two cooling systems. Although these have been taken into account in the previous comparisons by comparing net (rather than gross) plant outputs, it is instructive to examine the details.
Table 10 shows several components of the in-plant power requirements, which are influenced by the choice of cooling system.
Table 10. Comparison of operating power requirements
The major differences are the increased fan power cost for the dry system, which are offset by the reduction in circulating water pumping costs. These comparisons are highly site-specific. In most instances the fan power consumed by the air-cooled condenser exceeds the combined power requirements for the circulating water pumps and the cooling tower fans in the wet system. In some cases, however, the opposite is true as seen in the desert and mountain cases.
The “Miscellaneous” gas turbine and steam turbine auxiliary power items, which included sub-system water pumps, cooling fans, lube oil pumps, and other minor items, are nearly the same, whether the plant is wet- or dry-cooled. Alternatively, the “other auxiliary” power load is consistently higher by a few hundred kW for the dry-cooled
Item CC Wet CC Dry Item CC Wet CC DrykW kW kW kW
Fuel Compressor 3,677 3,686 Fuel Compressor 3,672 3,727Misc. Gas Turbine Aux 696 696 Misc. Gas Turbine Aux 696 696Boiler Feedpump 1,803 1,794 Boiler Feedpump 1,803 1,805Circ. Water Pump 2,350 0 Circ. Water Pump 1,709 0Cooling Tower Fan 1,348 0 Cooling Tower Fan 1,020 0ACC Fans 0 2,899 ACC Fans 0 3,697Misc. ST Aux 334 305 Misc. ST Aux 336 323Other Aux 1,772 1,969 Other Aux 1,776 2,003Total Aux 11,980 11,349 Total Aux 11,012 12,251
Item CC Wet CC Dry Item CC Wet CC DrykW kW kW kW
Fuel Compressor 3,855 3,906 Fuel Compressor 3,312 3,406Misc. GT Aux 696 696 Misc. GT Aux 696 696Boiler Feedpump 1,848 1,856 Boiler Feedpump 1,634 1,640Circ. Water Pump 1,695 0 Circ. Water Pump 1,723 0Cooling Tower Fan 1,016 0 Cooling Tower Fan 1,024 0ACC Fans 0 2,968 ACC Fans 0 2,314Misc. Steam Turbine Aux 343 343 Misc. Steam Turbine Aux 304 288Other Aux 1,777 2,008 Other Aux 1,702 1,903Total Aux 11,230 11,777 Total Aux 10,395 10,247
Desert Valley
Coast Mountain
31
plant. This situation is likely attributable to increased power for vacuum pump air ejectors, auxiliary wet tower/fin-fan coolers, and water treatment equipment, which may be more extensive in the absence of a wet cooling tower in which to integrate some of the waste water streams.
32
7.0 Effect of Plant Water Supply The foregoing comparisons have all been conducted under the assumption that an adequate supply of fresh water was available. Additional comparisons were made for situations where other water supplies were used. Specifically, reclaimed, brackish, and saline water were considered for some of the sites.
1. Fresh water (potable groundwater or surface water): Fresh water was assumed to be available in all four settings: desert, valley, coastal, and mountain power plants. It was also assumed that 10 cycles of concentration were achievable with fresh water.
2. Reclaimed water (treated municipal effluent): Treated municipal effluent was only considered for valley, coastal, and mountain areas because it is generated in sufficient quantities in dense population areas—that is, in California coastal areas, and to a lesser extent, in the valley (e.g., Fresno) and mountain (e.g., Redding) sites. Five cycles of concentration were assumed to be achievable for treated effluent and that the cooling tower blowdown could be discharged back to the municipal water treatment plant or to receiving waters. At inland sites, cooling tower blowdown would be treated with evaporator/crystallizers and operated at 10 to 12 cycles of concentration. There would be no final liquid waste and, therefore, no requirement for evaporation ponds. It should be noted that reclaimed water generates less wastewater for combined-cycle plants with zero liquid discharge (ZLD) than other types of water. This is because the chemical analysis used for the reclaimed water had very low silica content relative to the others; therefore, those cases were capable of higher cycles of concentration in the cooling tower. This illustrates the sensitivity that one chemical constituent can have on a source water comparison analysis.
3. Brackish water (Low-total dissolved solids (TDS) agricultural return or high-TDS groundwater or low-TDS oil-field produced water; TDS range of 2,000 to 5,000 milligrams per liter (mg/l)): The agricultural return water is generated in significant quantities in the Central Valley. Produced water is also generated in large quantities in certain areas of the Central Valley. Brackish water was assumed to be available for the valley and desert plants. Achievable cycles of concentration were assumed to be 5 to 10 for these saline sources of water with cooling tower blowdown being treated by high-efficiency reverse osmosis (HERO) and crystallizers. There would be no final liquid waste.
4. Saline water (high-TDS agricultural return or high-TDS oil-field produced water; TDS greater than 5,000 mg/l): As stated previously, agricultural return water and produced water are generated in large quantities in certain areas of the Central Valley. Depending on the location, there could be sources of agricultural return water or possible saline ground water available for power plant cooling in desert locations. Saline groundwater was assumed to be available for the valley and desert power plants. Achievable cycles of concentration were assumed to be 5 to 8 for these saline sources of water with
33
cooling tower blowdown being treated by high-efficiency reverse osmosis (HERO) and crystallizers. There would be no final liquid waste.
In all cases, blowdown from the HRSG and miscellaneous plant wastes (such as washdown water) were assumed to be reused in the cooling tower at plants equipped with wet cooling.
The amount of wastewater generated was determined for each case, as were the costs for the required water treatment equipment and the associated operational power requirements. These quantities are shown for the combined-cycle plant with wet cooling for each of the four sites.
The water treatment options, chosen as appropriate for each site, are described below.
HERO-Crystallizer is a combination of two treatment technologies. High efficiency reverse osmosis (HERO) is being utilized at many plants in lieu of evaporators (depending on water chemistry and treatment economics). HERO is standard reverse osmosis technology but operated at a high pH. In reverse osmosis, water is applied to a membrane surface under pressure. Water passes through the membrane, leaving the ions behind. Depending on the water, HERO feed pressure can range from 200 to 600 psi. HERO is operated at a high pH, which allows it to operate at high recoveries —up to 90% in some cases. Treated water (permeate) is of fairly high quality, i.e., less than 100 to 500 mg/l TDS. HERO permeate can be further treated for HRSG feedwater or fed directly to the cooling tower. Pretreatment for the HERO process is critical and consists of hardness removal, filtration and pH adjustment. HERO pretreatment can be configured for reuse/treatment of all liquid waste streams. The waste stream from the HERO (reject) is fed to a crystallizer where it is highly concentrated. Crystallizers can concentrate wastewater to 35% to 65% solids (depending on solids handling equipment). Crystallizer distillate is usually less than 10 mg/l TDS. Crystallizers require 200 to 300 kWh to evaporate 1,000 gallons (3,785 liters) of HERO reject.
Evaporator-Crystallizer is also a combination of two treatment technologies. Evaporators (also known as brine concentrators) are extensively utilized to treat wastewater generated by power plants. Preheated wastewater is fed to the evaporator where it is recirculated as a falling film through vertical tubes. As the water films and falls through the tubes, a small fraction is evaporated. The vapor is passed through a compressor (and elevated to a higher energy level) and allowed pass over the outside of the vertical tubes, thus providing a heat source for evaporation. Depending on wastewater quality, the evaporator can recover 90% to 99% of the wastewater as a high-quality effluent, i.e., less than 10 mg/l TDS. Evaporator distillate can be further treated for HRSG feedwater or fed directly to the cooling tower. The brine generated from the evaporator can be 10 to 100 times as concentrated as the wastewater. Evaporators require 85 to 95 kWh to evaporate 1,000 gallons of wastewater. Evaporator brine is fed to the crystallizer where it is highly concentrated. Crystallizers can concentrate wastewater to 35% to 65% solids (depending on solids handling equipment). Crystallizer and evaporator distillates
34
are of similar quality. Crystallizers require 200 to 300 kWh to evaporate 1,000 gallons of brine.
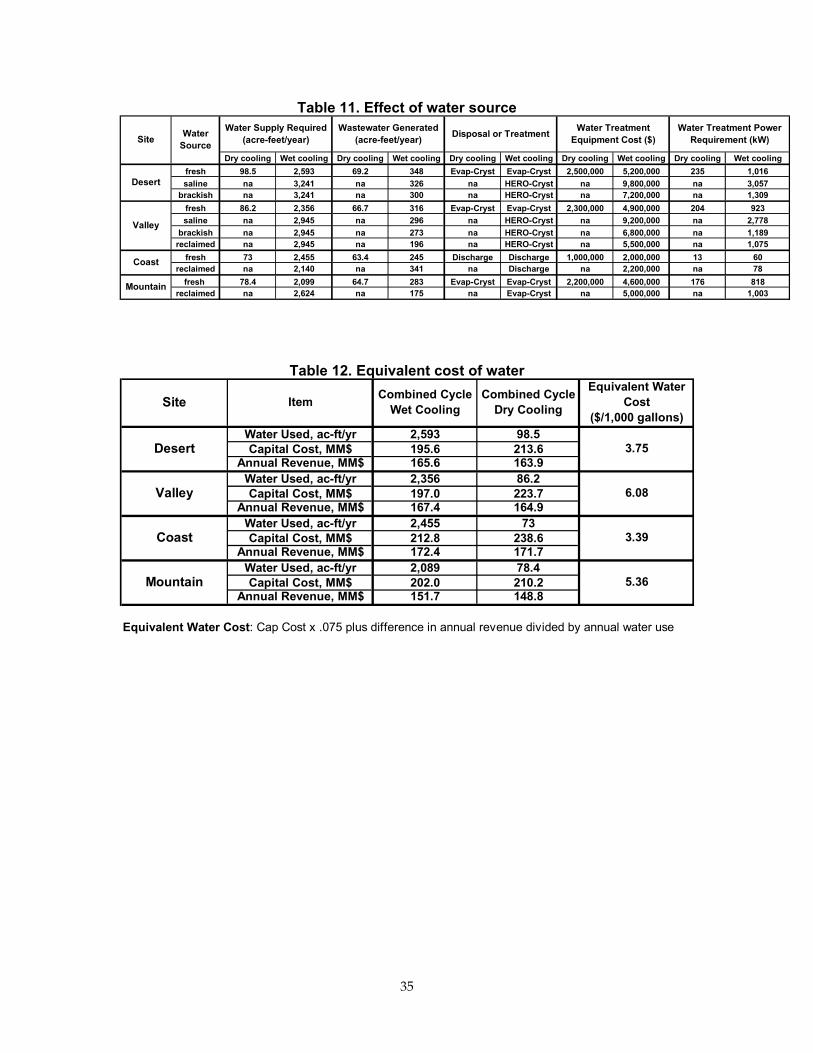
A table of alternative water and waste water management systems for different source waters is given in Appendix E and summarized in Table 11. The additional costs for the water treatment equipment, while substantial, do not have a significant effect of the previous conclusions comparing the wet- and dry-cooled plants.
7.1. Equivalent Cost of Water A final comparison is to estimate what the breakeven cost of water would have to be in order to make the costs of wet cooling equal to that of dry cooling for the cases studied.
Two approaches were taken for this assessment: (1) installing water wells at the power plant site, and (2) purchasing water from a municipality, water district, or wholesaler. There are several examples of power plants in California that installed new wells or rehabilitated existing wells to provide water for the plant. This option is site specific. First, groundwater must be at a reasonable depth beneath the surface to install a well extraction system. Second, the water must be free to use, i.e., no one else has exclusive rights to use it. The investment cost for water delivery for well water is the installation of a well field or the cost to rehabilitate existing wells. Operating costs would include the power to bring it to the surface and occasional well maintenance. Operating costs in this delivery scenario are a fraction of the cost to purchased water.
Water for power generation in California is usually purchased from a municipality, water district, or wholesaler. This approach also applies to purchasing reclaimed water. In this case, the investment cost for water delivery would include money for a pipeline, charging pumps, a booster station, and other items. Operating costs would include the cost of the water, power to operate the pipeline, and occasional pipeline maintenance. The cost of water usually far exceeds the cost to pump it to the station. So in this scenario, the cost of water is an operating cost and the difference in the annualized capital and operating costs divided by the difference in annual water requirements give an equivalent water cost (typically expressed in $/1,000 gallons).
Table 12 shows the equivalent cost of water, calculated in these two different ways, for each of the four sites.
Water purchase costs of $3 to $5.50 per 1,000 gallons are high for most regions but have been approached in some arid regions of the country.
35
Table 11. Effect of water source
Table 12. Equivalent cost of water
Water Used, ac-ft/yr 2,593 98.5Capital Cost, MM$ 195.6 213.6
Annual Revenue, MM$ 165.6 163.9Water Used, ac-ft/yr 2,356 86.2Capital Cost, MM$ 197.0 223.7
Annual Revenue, MM$ 167.4 164.9Water Used, ac-ft/yr 2,455 73Capital Cost, MM$ 212.8 238.6
Annual Revenue, MM$ 172.4 171.7Water Used, ac-ft/yr 2,089 78.4Capital Cost, MM$ 202.0 210.2
Annual Revenue, MM$ 151.7 148.8
Equivalent Water Cost: Cap Cost x .075 plus difference in annual revenue divided by annual water use
Combined Cycle Wet Cooling
Combined Cycle Dry Cooling
3.75
6.08
Equivalent Water Cost
($/1,000 gallons)
Mountain
Coast 3.39
5.36
Site Item
Desert
Valley
Dry cooling Wet cooling Dry cooling Wet cooling Dry cooling Wet cooling Dry cooling Wet cooling Dry cooling Wet coolingfresh 98.5 2,593 69.2 348 Evap-Cryst Evap-Cryst 2,500,000 5,200,000 235 1,016saline na 3,241 na 326 na HERO-Cryst na 9,800,000 na 3,057
brackish na 3,241 na 300 na HERO-Cryst na 7,200,000 na 1,309fresh 86.2 2,356 66.7 316 Evap-Cryst Evap-Cryst 2,300,000 4,900,000 204 923saline na 2,945 na 296 na HERO-Cryst na 9,200,000 na 2,778
brackish na 2,945 na 273 na HERO-Cryst na 6,800,000 na 1,189reclaimed na 2,945 na 196 na HERO-Cryst na 5,500,000 na 1,075
fresh 73 2,455 63.4 245 Discharge Discharge 1,000,000 2,000,000 13 60reclaimed na 2,140 na 341 na Discharge na 2,200,000 na 78
fresh 78.4 2,099 64.7 283 Evap-Cryst Evap-Cryst 2,200,000 4,600,000 176 818reclaimed na 2,624 na 175 na Evap-Cryst na 5,000,000 na 1,003
Valley
Coast
Mountain
Water SourceSite
Desert
Water Treatment Power Requirement (kW)
Water Supply Required (acre-feet/year)
Wastewater Generated (acre-feet/year) Disposal or Treatment Water Treatment
Equipment Cost ($)
36
8.0 Additional Comparisons
8.1. Simple-cycle Gas Turbine Plants Simple-cycle gas turbine plants are common in California for limited use as peaking plants with low capacity factors. They consist of one or more “stand-alone” combustion turbines. Unlike combined-cycle plants, there is no recovery of heat from the combustion turbine exhaust gas and, hence, no steam cycle equipment such as the HRSG or steam turbine or condenser cooling system.
Simple-cycle plants are characterized by low capital costs but high heat rates, in comparison to combined cycles. The only essential use of water is for the plant “hotel” load. At some plants, additional water is used for turbine inlet air cooling and for NOx control. However, both of these functions can be performed with dry technologies such as chillers for turbine inlet air cooling and DLN (dry low NOx) combustors for NOx control.
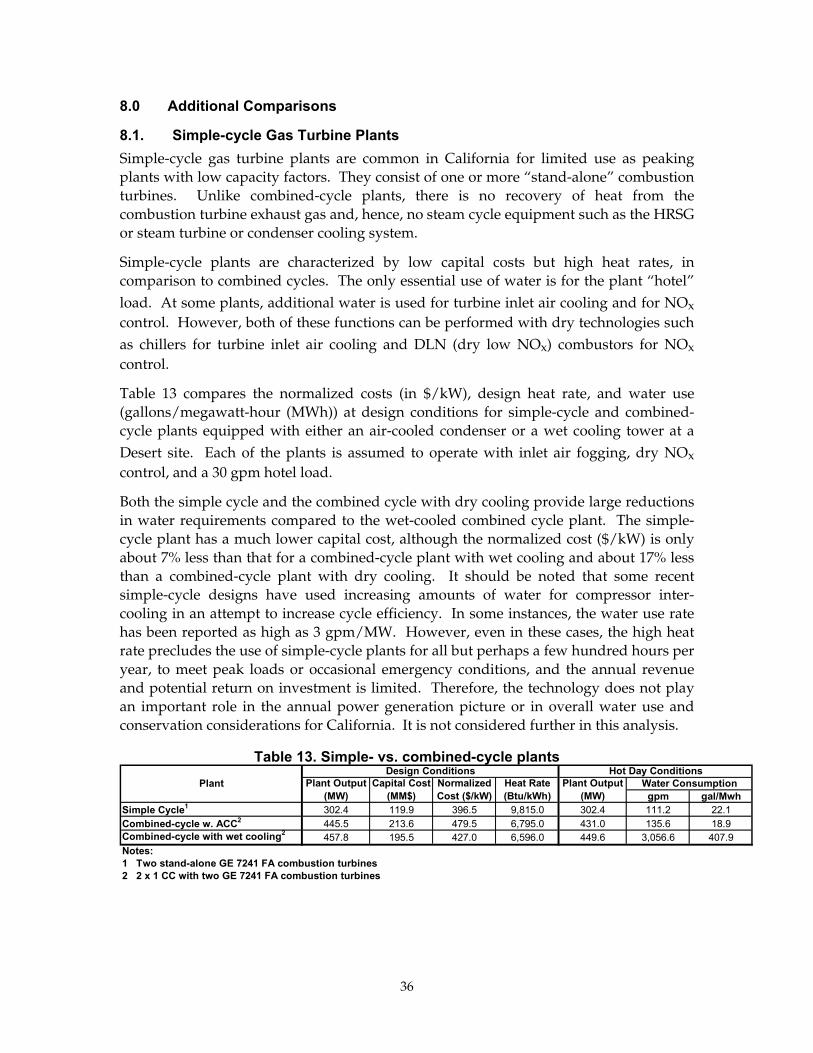
Table 13 compares the normalized costs (in $/kW), design heat rate, and water use (gallons/megawatt-hour (MWh)) at design conditions for simple-cycle and combined-cycle plants equipped with either an air-cooled condenser or a wet cooling tower at a Desert site. Each of the plants is assumed to operate with inlet air fogging, dry NOx control, and a 30 gpm hotel load.
Both the simple cycle and the combined cycle with dry cooling provide large reductions in water requirements compared to the wet-cooled combined cycle plant. The simple-cycle plant has a much lower capital cost, although the normalized cost ($/kW) is only about 7% less than that for a combined-cycle plant with wet cooling and about 17% less than a combined-cycle plant with dry cooling. It should be noted that some recent simple-cycle designs have used increasing amounts of water for compressor inter-cooling in an attempt to increase cycle efficiency. In some instances, the water use rate has been reported as high as 3 gpm/MW. However, even in these cases, the high heat rate precludes the use of simple-cycle plants for all but perhaps a few hundred hours per year, to meet peak loads or occasional emergency conditions, and the annual revenue and potential return on investment is limited. Therefore, the technology does not play an important role in the annual power generation picture or in overall water use and conservation considerations for California. It is not considered further in this analysis.
Table 13. Simple- vs. combined-cycle plants
gpm gal/MwhSimple Cycle1 302.4 119.9 396.5 9,815.0 302.4 111.2 22.1Combined-cycle w. ACC2 445.5 213.6 479.5 6,795.0 431.0 135.6 18.9Combined-cycle with wet cooling2 457.8 195.5 427.0 6,596.0 449.6 3,056.6 407.9Notes:1 Two stand-alone GE 7241 FA combustion turbines2 2 x 1 CC with two GE 7241 FA combustion turbines
Plant Output (MW)
Design Conditions Hot Day ConditionsWater ConsumptionPlant Plant Output
(MW)Capital Cost
(MM$)Normalized Cost ($/kW)
Heat Rate (Btu/kWh)
37
8.2. Plant Performance With and Without Inlet Fogging All of the comparative cases in this study assumed the use of turbine inlet air cooling by spraying water into the inlet air stream, which is often referred to as “fogging.” This is commonly done at both simple- and combined-cycle plants because gas turbines suffer a loss in capacity with increasing temperature. This loss occurs because they are essentially constant volume flow machines. As the ambient temperature rises and the air density decreases, the mass flow of gas flowing through the turbine and the resulting power output of the turbine decreases. Inlet air cooling maintains a mass flow consistent with the lowered temperature and restores the lost power output.
Although this can be accomplished without the evaporative use of water by installing active refrigeration units on the inlet air stream, evaporative systems are more commonly used because of their much lower capital cost. Fogging systems, in addition to maintaining the mass flow of air through the turbine, also provide a small amount of additional power output from the mass flow of fogging water that passes through the turbines.
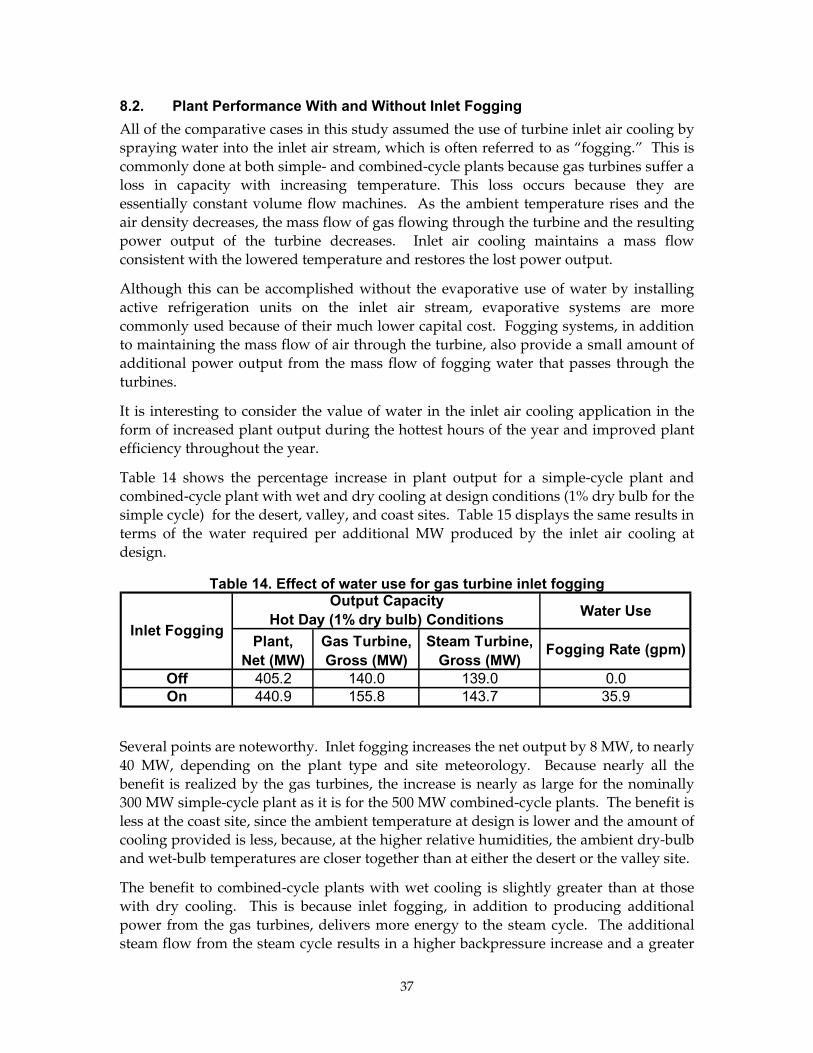
It is interesting to consider the value of water in the inlet air cooling application in the form of increased plant output during the hottest hours of the year and improved plant efficiency throughout the year.
Table 14 shows the percentage increase in plant output for a simple-cycle plant and combined-cycle plant with wet and dry cooling at design conditions (1% dry bulb for the simple cycle) for the desert, valley, and coast sites. Table 15 displays the same results in terms of the water required per additional MW produced by the inlet air cooling at design.
Table 14. Effect of water use for gas turbine inlet fogging
Several points are noteworthy. Inlet fogging increases the net output by 8 MW, to nearly 40 MW, depending on the plant type and site meteorology. Because nearly all the benefit is realized by the gas turbines, the increase is nearly as large for the nominally 300 MW simple-cycle plant as it is for the 500 MW combined-cycle plants. The benefit is less at the coast site, since the ambient temperature at design is lower and the amount of cooling provided is less, because, at the higher relative humidities, the ambient dry-bulb and wet-bulb temperatures are closer together than at either the desert or the valley site.
The benefit to combined-cycle plants with wet cooling is slightly greater than at those with dry cooling. This is because inlet fogging, in addition to producing additional power from the gas turbines, delivers more energy to the steam cycle. The additional steam flow from the steam cycle results in a higher backpressure increase and a greater
Water Use
Plant, Net (MW)
Gas Turbine, Gross (MW)
Steam Turbine, Gross (MW)
Fogging Rate (gpm)
Off 405.2 140.0 139.0 0.0On 440.9 155.8 143.7 35.9
Output Capacity Hot Day (1% dry bulb) Conditions
Inlet Fogging
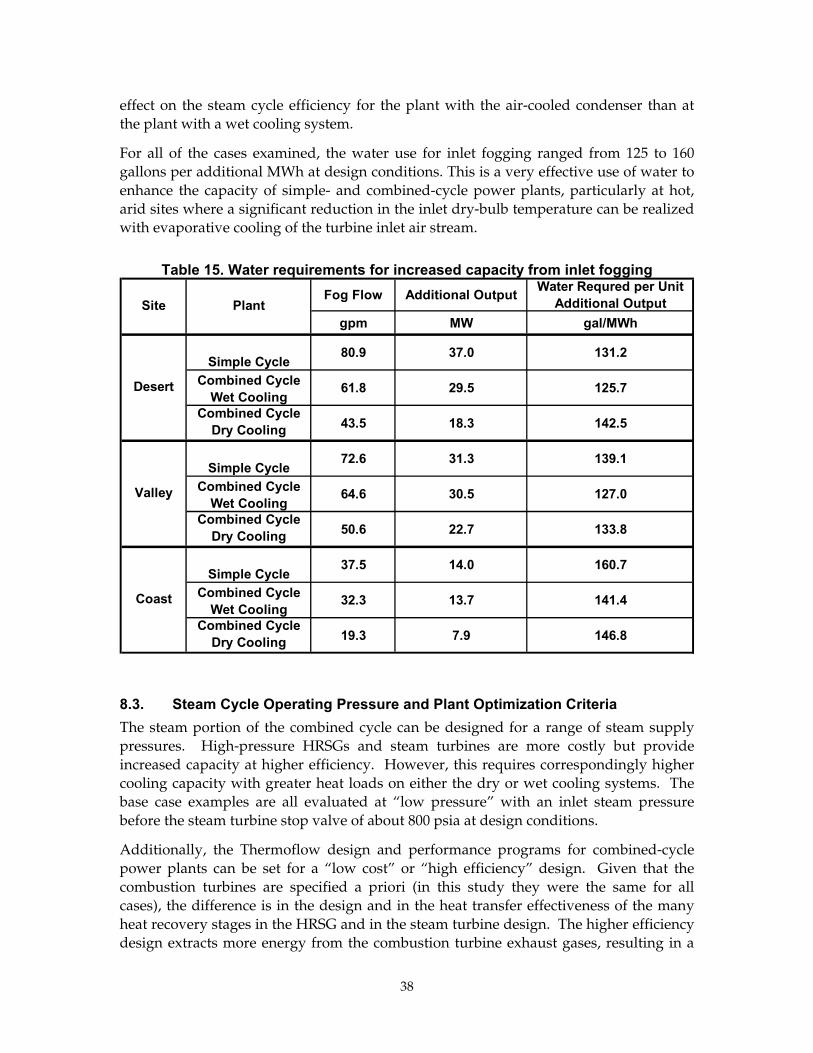
38
effect on the steam cycle efficiency for the plant with the air-cooled condenser than at the plant with a wet cooling system.
For all of the cases examined, the water use for inlet fogging ranged from 125 to 160 gallons per additional MWh at design conditions. This is a very effective use of water to enhance the capacity of simple- and combined-cycle power plants, particularly at hot, arid sites where a significant reduction in the inlet dry-bulb temperature can be realized with evaporative cooling of the turbine inlet air stream.
Table 15. Water requirements for increased capacity from inlet fogging
8.3. Steam Cycle Operating Pressure and Plant Optimization Criteria The steam portion of the combined cycle can be designed for a range of steam supply pressures. High-pressure HRSGs and steam turbines are more costly but provide increased capacity at higher efficiency. However, this requires correspondingly higher cooling capacity with greater heat loads on either the dry or wet cooling systems. The base case examples are all evaluated at “low pressure” with an inlet steam pressure before the steam turbine stop valve of about 800 psia at design conditions.
Additionally, the Thermoflow design and performance programs for combined-cycle power plants can be set for a “low cost” or “high efficiency” design. Given that the combustion turbines are specified a priori (in this study they were the same for all cases), the difference is in the design and in the heat transfer effectiveness of the many heat recovery stages in the HRSG and in the steam turbine design. The higher efficiency design extracts more energy from the combustion turbine exhaust gases, resulting in a
Fog Flow Additional Output Water Requred per Unit Additional Output
gpm MW gal/MWh
Simple Cycle80.9 37.0 131.2
Combined Cycle Wet Cooling
61.8 29.5 125.7
Combined Cycle Dry Cooling 43.5 18.3 142.5
Simple Cycle72.6 31.3 139.1
Combined Cycle Wet Cooling
64.6 30.5 127.0
Combined Cycle Dry Cooling 50.6 22.7 133.8
Simple Cycle37.5 14.0 160.7
Combined Cycle Wet Cooling
32.3 13.7 141.4
Combined Cycle Dry Cooling 19.3 7.9 146.8
Coast
Site Plant
Desert
Valley
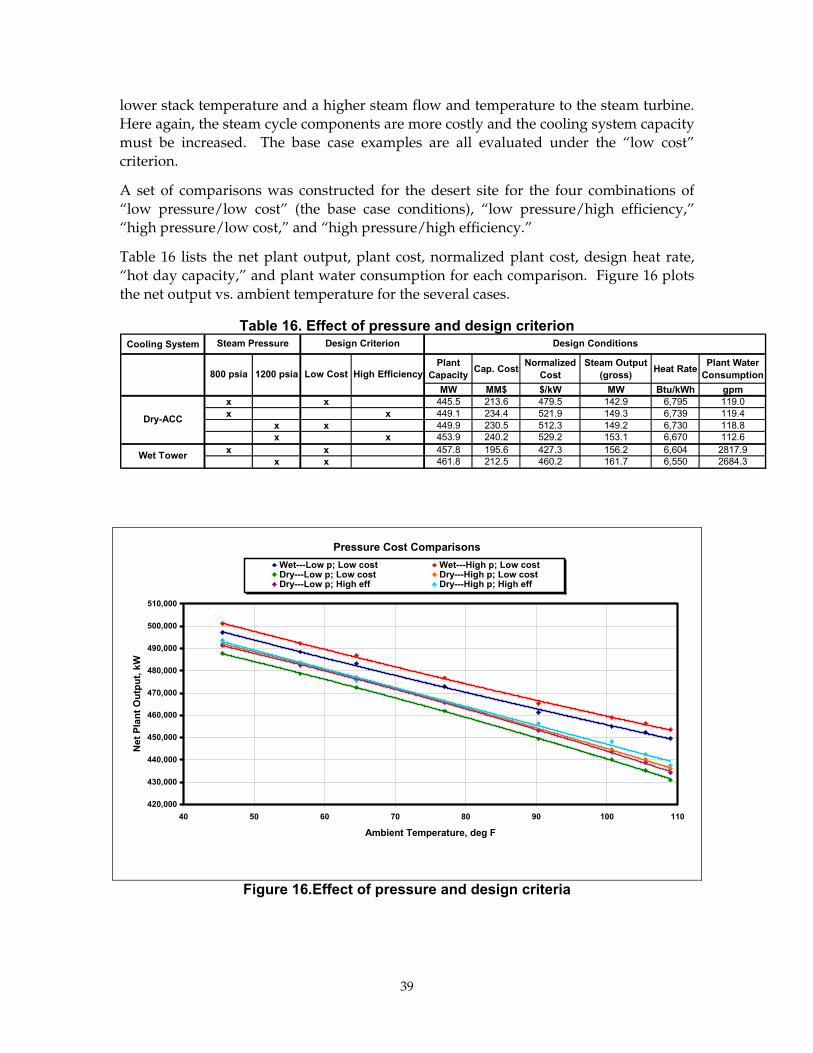
39
lower stack temperature and a higher steam flow and temperature to the steam turbine. Here again, the steam cycle components are more costly and the cooling system capacity must be increased. The base case examples are all evaluated under the “low cost” criterion.
A set of comparisons was constructed for the desert site for the four combinations of “low pressure/low cost” (the base case conditions), “low pressure/high efficiency,” “high pressure/low cost,” and “high pressure/high efficiency.”
Table 16 lists the net plant output, plant cost, normalized plant cost, design heat rate, “hot day capacity,” and plant water consumption for each comparison. Figure 16 plots the net output vs. ambient temperature for the several cases.
Table 16. Effect of pressure and design criterion
Figure 16.Effect of pressure and design criteria
Cooling System
Plant Capacity Cap. Cost Normalized
CostSteam Output
(gross) Heat Rate Plant Water Consumption
MW MM$ $/kW MW Btu/kWh gpmx x 445.5 213.6 479.5 142.9 6,795 119.0x x 449.1 234.4 521.9 149.3 6,739 119.4
x x 449.9 230.5 512.3 149.2 6,730 118.8x x 453.9 240.2 529.2 153.1 6,670 112.6
x x 457.8 195.6 427.3 156.2 6,604 2817.9x x 461.8 212.5 460.2 161.7 6,550 2684.3
Design Conditions
Dry-ACC
800 psia 1200 psia Low Cost High Efficiency
Wet Tower
Steam Pressure Design Criterion
Pressure Cost Comparisons
420,000
430,000
440,000
450,000
460,000
470,000
480,000
490,000
500,000
510,000
40 50 60 70 80 90 100 110
Ambient Temperature, deg F
Net
Pla
nt O
utpu
t, kW
Wet---Low p; Low cost Wet---High p; Low costDry---Low p; Low cost Dry---High p; Low costDry---Low p; High eff Dry---High p; High eff
40
The higher pressure or the “high efficiency” (versus low cost) designs provide higher capacity and lower water use rates; however, the capital costs and the normalized costs are also higher. The differences between wet- and dry-cooled plants by any of the above measures are minimally affected by the choice of design criteria. Therefore, the base case comparisons of the study, which were all done for “low pressure/low cost” design criteria, give a fair representation of the wet-cooled versus dry-cooled comparisons, even for situations with somewhat different design criteria.
41
9.0 Conclusions The results of the analysis can be summarized in the following conclusions.
• For a 500 MW gas-fired, combined-cycle plant (typical of new plants in California) the use of dry cooling reduces the annual plant water requirements by approximately 2,000 to 2,500 acre-feet per year depending on the climate at the plant location.
• The associated costs are:
− Increased plant capital cost of approximately $8 million to $27 million, or about 5% to 15% of the total plant cost
− Potential reduction of energy production by about 13,000 to 56,000 MWh per year (1% to 2% of the total)
− Capacity reduction on hot days of 13 to 23 MW (4% to 6% of total)
− Potential annual revenue reduction of about $1.5 to $3.0 million (1% to 2% of total)
• The cost of dry cooling can be expressed an “effective cost” of water. This is defined as the additional cost of using dry cooling expressed on an annualized basis, divided by the annual reduction in water requirement achieved through the use of dry cooling. This “effective cost” of saved water ranges from $3.40 to $6.00 per 1,000 gallons. This compares to more typical costs for industrial and residential uses ranging from $1.00 to $2.50 per 1,000 gallons.
• The water savings achieved from the use of dry cooling vary from site to site and depend on the choice of source water. The site to site differences are due primarily to the differences in the water requirements for the wet cooling system and vary from 2,495 acre-feet per year at the desert site to 2,021 acre-feet per year at the mountain site.
Water requirements for alternate water sources are higher than for fresh water for two reasons. First, the wet cooling tower can be operated at higher cycles of concentration with fresh water make-up, thus reducing the blowdown flow. In addition, the alternate water sources must be treated prior to use and a wastewater discharge stream is created, which adds to the make-up requirements. The water saving with the alternate water sources vary from 3,143 acre-feet per year at the desert site to 2,546 acre-feet per year at the mountain site. It is important to understand that these costs and penalties are calculated for dry cooling systems which were sized using an optimization criterion of minimum total annualized cost based on current estimates of capital, fuel, and electricity costs. Other optimization criteria could have been chosen and would have yielded different results. For example, if a very high value were assigned to meeting peak power demands on the hotter days, a larger and more expensive cooling system would have been selected. While the total annualized cost would have been higher, the “hot day capacity reduction” would have been reduced or eliminated.
42
10.0 References DiFilippo, M. October 2003. Use of Degraded Water Sources as Cooling Water in Power Plants. California Energy Commission and EPRI. P500-03-110.
EPRI. 2004. Comparison of Alternate Cooling Technologies for U. S. Power Plants: Economic, Environmental and Other Tradeoffs. EPRI: Palo Alto, California. 1005358.
Maulbetsch, J. S. 2002. Comparison of Alternate Cooling Technologies for California Power Plants: Economic, Environmental and Other Tradeoffs. 500-02-079F. California Energy Commission.
Thermoflow Software Suite. 2004. Edited by Thermoflow. Thermoflow, Inc.: Sudbury, Massachusetts.
43
11.0 Glossary
ACC air-cooled condenser CHP combined heat and power DLN dry low NOx gpm gallons per minute HERO high-efficiency reverse osmosis Hga inches of mercury absolute HHV higher heating value HPT high-pressure turbine HRSG heat recovery steam generator IP intermediate pressure ITD inlet temperature difference kpph thousand pounds per hour kUSD thousands of U.S. dollars kW kilowatt kWh kilowatthour LHV lower heating value LPB low-pressure boiler LPT low-pressure turbine MM$ million dollars MMBtu million British thermal units MW megawatt PIER Public Interest Energy Research psia pounds per square inch absolute PURPA Public Utility Regulatory Policies Act of 1978 rh relative humidity ST steam turbine TDS total dissolved solids O&M operation and maintenance ZLD zero liquid discharge
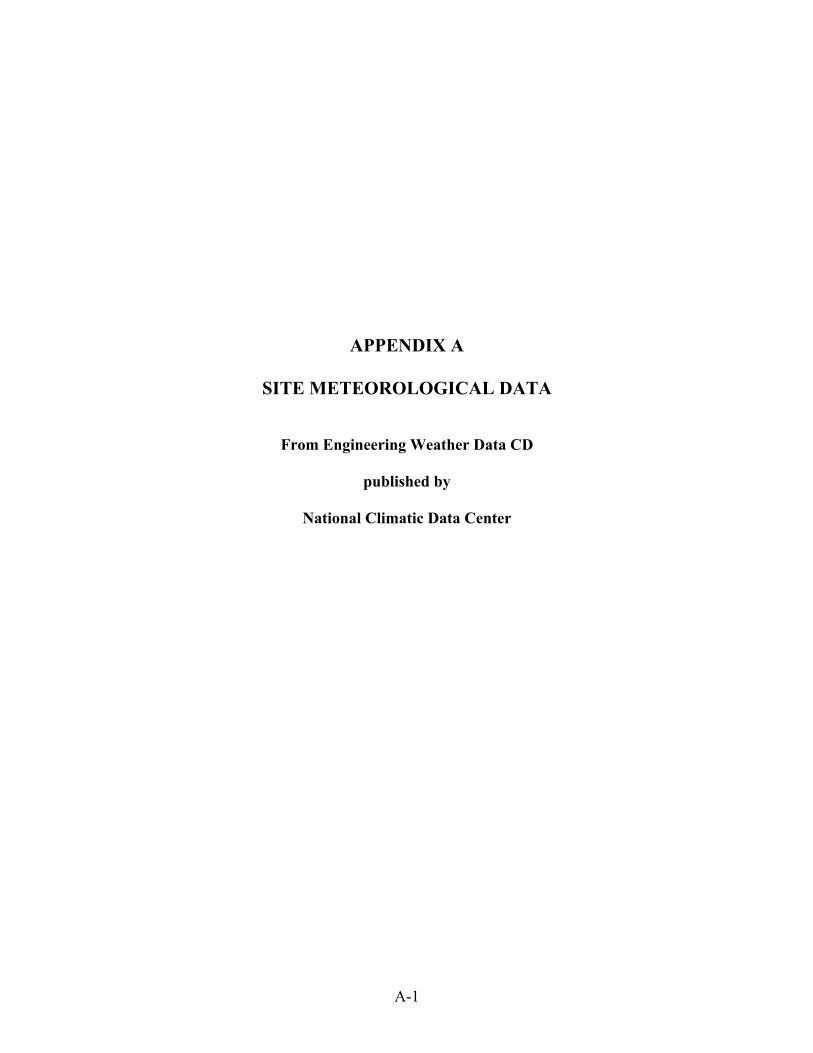
A-1
APPENDIX A
SITE METEOROLOGICAL DATA
From Engineering Weather Data CD
published by
National Climatic Data Center
A-2
Figure A-1
Figure A-2
Temperature Duration Curves
0
20
40
60
80
100
120
140
0 1000 2000 3000 4000 5000 6000 7000 8000 9000
Hours Above Temperature, hrs
Am
bien
t Tem
pera
ture
, deg
F
Desert Site Central Valley SiteCoastal Site Mountain Site
Mean Coincident Wet Bulb vs. Dry Bulb
0
10
20
30
40
50
60
70
80
0 20 40 60 80 100 120 140
Ambient Dry Bulb, deg F
Mea
n C
oinc
iden
t Wet
Bul
b, d
eg F
Desert Central Valley Coastal Mountain
B-1
APPENDIX B
DESIGN COST AND PERFORMANCE DATA
B.1 Desert Site B.2 Valley Site B.3 Coast Site B.4 Mountain Site
B-2
B.1 Desert Site Design Information
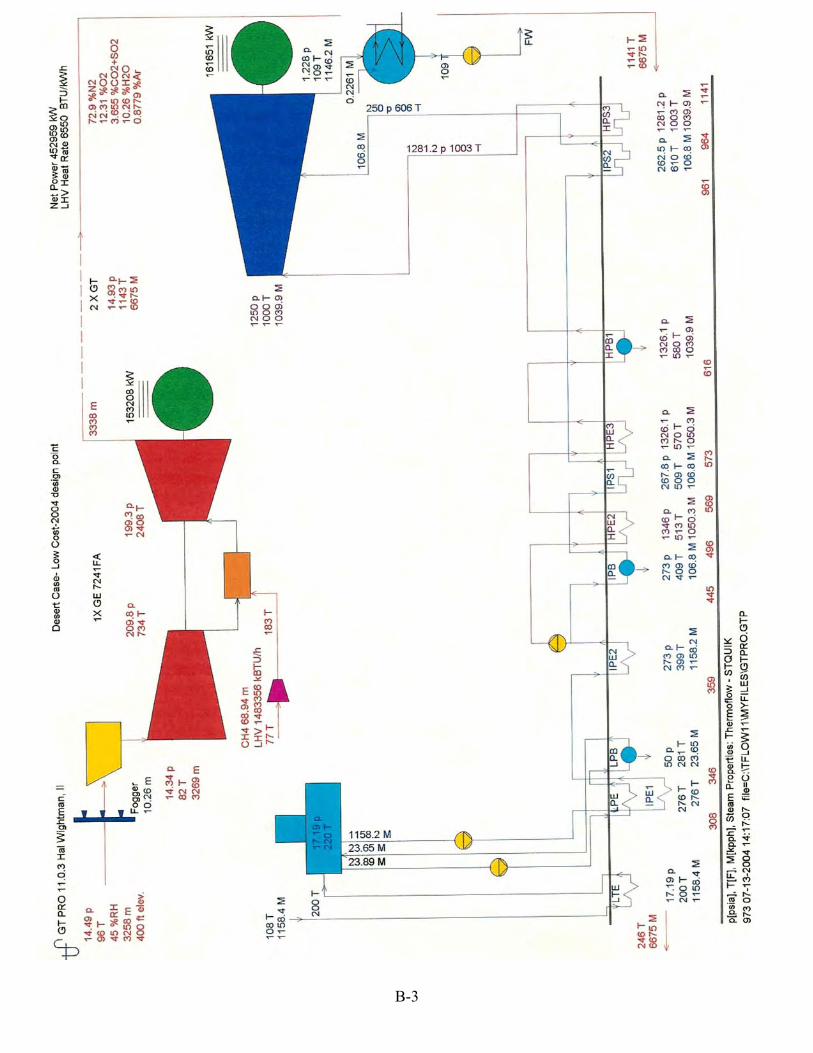
B-3
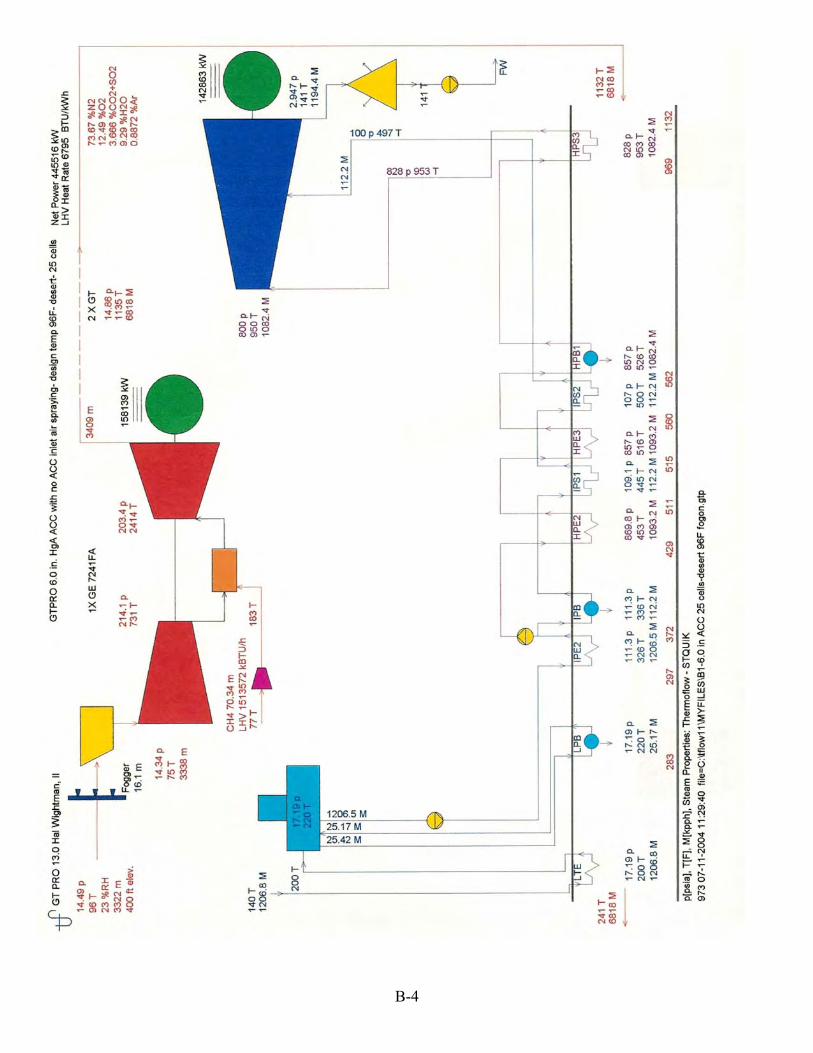
B-4
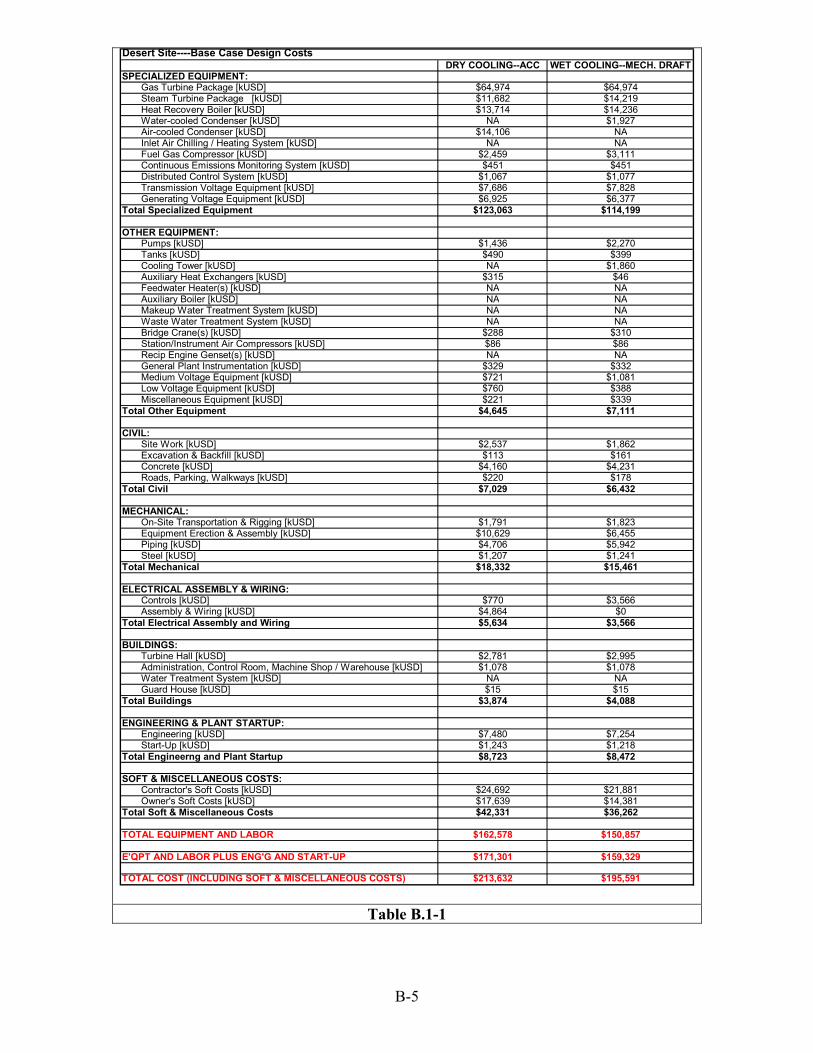
B-5
Table B.1-1
Desert Site----Base Case Design CostsDRY COOLING--ACC WET COOLING--MECH. DRAFT
SPECIALIZED EQUIPMENT: Gas Turbine Package [kUSD] $64,974 $64,974 Steam Turbine Package [kUSD] $11,682 $14,219 Heat Recovery Boiler [kUSD] $13,714 $14,236 Water-cooled Condenser [kUSD] NA $1,927 Air-cooled Condenser [kUSD] $14,106 NA Inlet Air Chilling / Heating System [kUSD] NA NA Fuel Gas Compressor [kUSD] $2,459 $3,111 Continuous Emissions Monitoring System [kUSD] $451 $451 Distributed Control System [kUSD] $1,067 $1,077 Transmission Voltage Equipment [kUSD] $7,686 $7,828 Generating Voltage Equipment [kUSD] $6,925 $6,377Total Specialized Equipment $123,063 $114,199
OTHER EQUIPMENT: Pumps [kUSD] $1,436 $2,270 Tanks [kUSD] $490 $399 Cooling Tower [kUSD] NA $1,860 Auxiliary Heat Exchangers [kUSD] $315 $46 Feedwater Heater(s) [kUSD] NA NA Auxiliary Boiler [kUSD] NA NA Makeup Water Treatment System [kUSD] NA NA Waste Water Treatment System [kUSD] NA NA Bridge Crane(s) [kUSD] $288 $310 Station/Instrument Air Compressors [kUSD] $86 $86 Recip Engine Genset(s) [kUSD] NA NA General Plant Instrumentation [kUSD] $329 $332 Medium Voltage Equipment [kUSD] $721 $1,081 Low Voltage Equipment [kUSD] $760 $388 Miscellaneous Equipment [kUSD] $221 $339Total Other Equipment $4,645 $7,111
CIVIL: Site Work [kUSD] $2,537 $1,862 Excavation & Backfill [kUSD] $113 $161 Concrete [kUSD] $4,160 $4,231 Roads, Parking, Walkways [kUSD] $220 $178Total Civil $7,029 $6,432
MECHANICAL: On-Site Transportation & Rigging [kUSD] $1,791 $1,823 Equipment Erection & Assembly [kUSD] $10,629 $6,455 Piping [kUSD] $4,706 $5,942 Steel [kUSD] $1,207 $1,241Total Mechanical $18,332 $15,461
ELECTRICAL ASSEMBLY & WIRING: Controls [kUSD] $770 $3,566 Assembly & Wiring [kUSD] $4,864 $0Total Electrical Assembly and Wiring $5,634 $3,566
BUILDINGS: Turbine Hall [kUSD] $2,781 $2,995 Administration, Control Room, Machine Shop / Warehouse [kUSD] $1,078 $1,078 Water Treatment System [kUSD] NA NA Guard House [kUSD] $15 $15Total Buildings $3,874 $4,088
ENGINEERING & PLANT STARTUP: Engineering [kUSD] $7,480 $7,254 Start-Up [kUSD] $1,243 $1,218Total Engineerng and Plant Startup $8,723 $8,472
SOFT & MISCELLANEOUS COSTS: Contractor's Soft Costs [kUSD] $24,692 $21,881 Owner's Soft Costs [kUSD] $17,639 $14,381Total Soft & Miscellaneous Costs $42,331 $36,262
TOTAL EQUIPMENT AND LABOR $162,578 $150,857
E'QPT AND LABOR PLUS ENG'G AND START-UP $171,301 $159,329
TOTAL COST (INCLUDING SOFT & MISCELLANEOUS COSTS) $213,632 $195,591
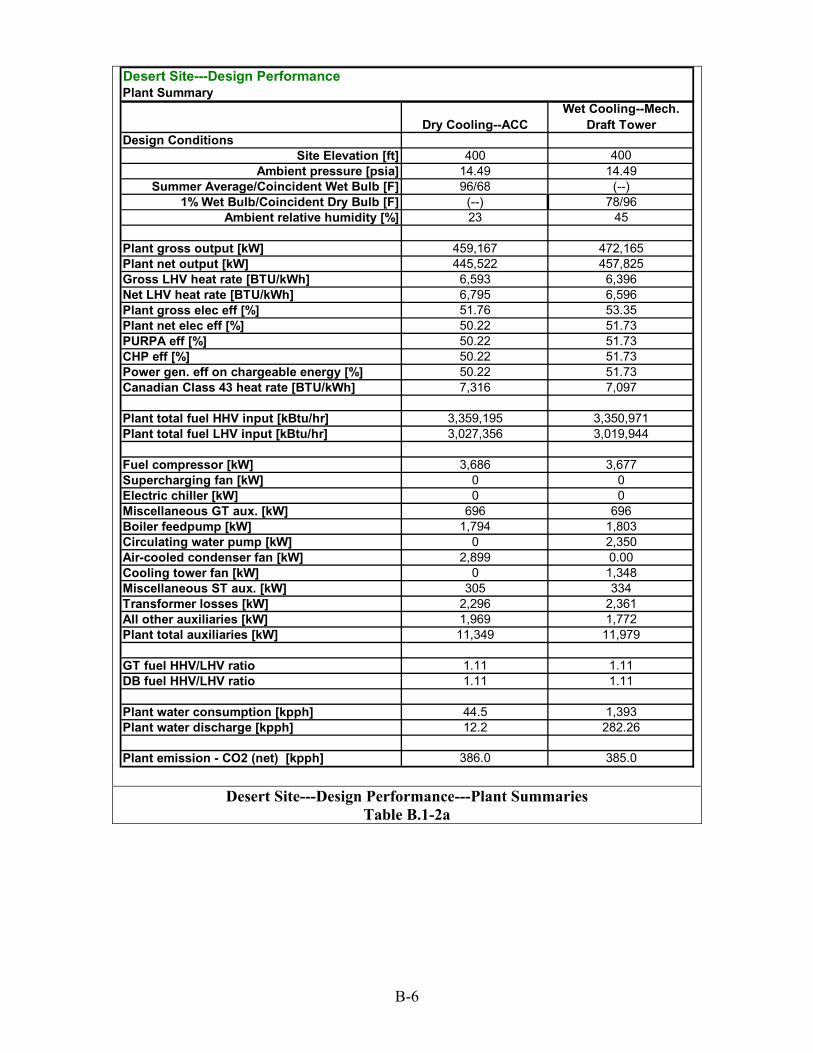
B-6
Desert Site---Design Performance---Plant Summaries
Table B.1-2a
Desert Site---Design PerformancePlant Summary
Dry Cooling--ACCWet Cooling--Mech.
Draft TowerDesign Conditions
Site Elevation [ft] 400 400Ambient pressure [psia] 14.49 14.49
Summer Average/Coincident Wet Bulb [F] 96/68 (--)1% Wet Bulb/Coincident Dry Bulb [F] (--) 78/96
Ambient relative humidity [%] 23 45
Plant gross output [kW] 459,167 472,165Plant net output [kW] 445,522 457,825Gross LHV heat rate [BTU/kWh] 6,593 6,396Net LHV heat rate [BTU/kWh] 6,795 6,596Plant gross elec eff [%] 51.76 53.35Plant net elec eff [%] 50.22 51.73PURPA eff [%] 50.22 51.73CHP eff [%] 50.22 51.73Power gen. eff on chargeable energy [%] 50.22 51.73Canadian Class 43 heat rate [BTU/kWh] 7,316 7,097
Plant total fuel HHV input [kBtu/hr] 3,359,195 3,350,971Plant total fuel LHV input [kBtu/hr] 3,027,356 3,019,944
Fuel compressor [kW] 3,686 3,677Supercharging fan [kW] 0 0Electric chiller [kW] 0 0Miscellaneous GT aux. [kW] 696 696Boiler feedpump [kW] 1,794 1,803Circulating water pump [kW] 0 2,350Air-cooled condenser fan [kW] 2,899 0.00Cooling tower fan [kW] 0 1,348Miscellaneous ST aux. [kW] 305 334Transformer losses [kW] 2,296 2,361All other auxiliaries [kW] 1,969 1,772Plant total auxiliaries [kW] 11,349 11,979
GT fuel HHV/LHV ratio 1.11 1.11DB fuel HHV/LHV ratio 1.11 1.11
Plant water consumption [kpph] 44.5 1,393Plant water discharge [kpph] 12.2 282.26
Plant emission - CO2 (net) [kpph] 386.0 385.0

B-7
Desert Site---Design Performance---Gas Turbine Summaries
Table B.1-2b
Desert Site---Design PerformanceGas Turbine Summary
Dry Cooling--ACCWet Cooling--Mech.
Draft TowerDesign Conditions
Site Elevation [ft] 400 400Ambient pressure [psia] 14.49 14.49
Summer Average/Coincident Wet Bulb [F] 96/68 (--)1% Wet Bulb/Coincident Dry Bulb [F] (--) 78/96
Ambient relative humidity [%] 23 45
GT gross power [kW] 158,160 157,549GT gross LHV eff [%] 35.65 35.60GT LHV gross heat rate [BTU/kWh] 9,571 9,585
Compressor inlet mass flow [kpph] 3,339 3,331Compressor inlet temperature [F] 75 76Turbine inlet mass flow [kpph] 2,939 2,933Turbine inlet temperature [F] 2,414 2,413Turbine exhaust mass flow [kpph] 3,409 3,402Turbine exhaust temperature [F] 1,135 1,136
GT fuel HHV input [kBtu/hr] 1,679,598 1,675,485GT fuel LHV input [kBtu/hr] 1,513,678 1,509,972Exhaust gas molecular weight 28.28 28.27Exhaust gas N2+Ar mole percentage [%] 74.56 74.48Exhaust gas O2 mole percentage [%] 12.49 12.48Exhaust gas CO2 mole percentage [%] 3.67 3.66Exhaust gas H2O mole percentage [%] 9.29 9.38GT fuel flow [kpph] 70.35 70.17Combustor steam injection [kpph] 0.00 0.00Combustor water injection [kpph] 0.00 0.00Inlet filter pressure loss [inch H2O] 4.00 4.10Total exhaust pressure loss [inch H2O] 10.40 10.75
Fogging water mass flow [kpph] 16.11 15.49Number of chillers in plant 0 0

B-8
Desert Site---Design Performance---Steam Summaries
Table B.1-2c
Desert Site---Design PerformanceSteam Summary
Dry Cooling--ACCWet Cooling--Mech.
Draft TowerDesign Conditions
Site Elevation [ft] 400 400Ambient pressure [psia] 14.49 14.49
Summer Average/Coincident Wet Bulb [F] 96/68 (--)1% Wet Bulb/Coincident Dry Bulb [F] (--) 78/96
Ambient relative humidity [%] 23 45
Gas temperature reaching HRSG [F] 1,132 1,133Stack temperature [F] 241 217Stack mass flow per HRSG [kpph] 3,409 3,402Plant total ST gross output [kW] 142,847 157,066Steam cycle gross eff [%] 25.80 28.39Net process heat output [kBtu/hr] 0 0.00HRSG eff [%] 85.75 88.03
Plant duct burner fuel flow [kpph] 0 0Plant fuel HHV to duct burner(s) [kBtu/hr] 0 0Plant fuel LHV to duct burner(s) [kBtu/hr] 0 0
HPT pressure before stop valve [psia] 800.2 803.2HPT temperature before stop valve [F] 950 946.2Plant HPT mass flow before stop valve [kpph] 1082.8 1,084.6HP superheater steam pressure [psia] 828.3 831.4HP superheater steam temperature [F] 954.6 949.6HP superheater steam mass flow per HRSG [kpph] 541.1 542.3HPB pinch temperature difference [F] 36.2 36.7
IP superheater steam pressure [psia] 106.9 107.5IP superheater steam temperature [F] 501.2 500.8IP superheater steam mass flow per HRSG [kpph] 55.7 54.3IPB pinch temperature difference [F] 35.9 36.3LPB steam production rate per HRSG [kpph] 12.6 13.0LPB pinch temperature difference [F] 63.1 64.7Deaerator pressure [psia] 17.4 16.2Deaerator temperature [F] 220.7 217.0
Condenser pressure [psia] 2.95 1.05Condenser saturation temp [F] 140.8 103.4Plant LPT exhaust mass flow [kpph] 1193.9 1,193.0Condenser coolant supply temp [F] 96.0 82.3Condenser coolant discharge temp [F] 126.3 99.5Condenser coolant mass flow [kpph] 152,338 64,903
Stack gas molecular weight 28.3 28.3Stack gas N2+Ar mole percentage [%] 74.6 74.5Stack gas O2 mole percentage [%] 12.5 12.5Stack gas CO2 mole percentage [%] 3.7 3.7Stack gas H2O mole percentage [%] 9.3 9.4
Duct burner exit temperature [F] 1131.9 1,132.7Exhaust DT across main duct burner [F] 0 0Exhaust DT across HPB2 burner [F] 0 0

B-9
B.2 Valley Site Design Information
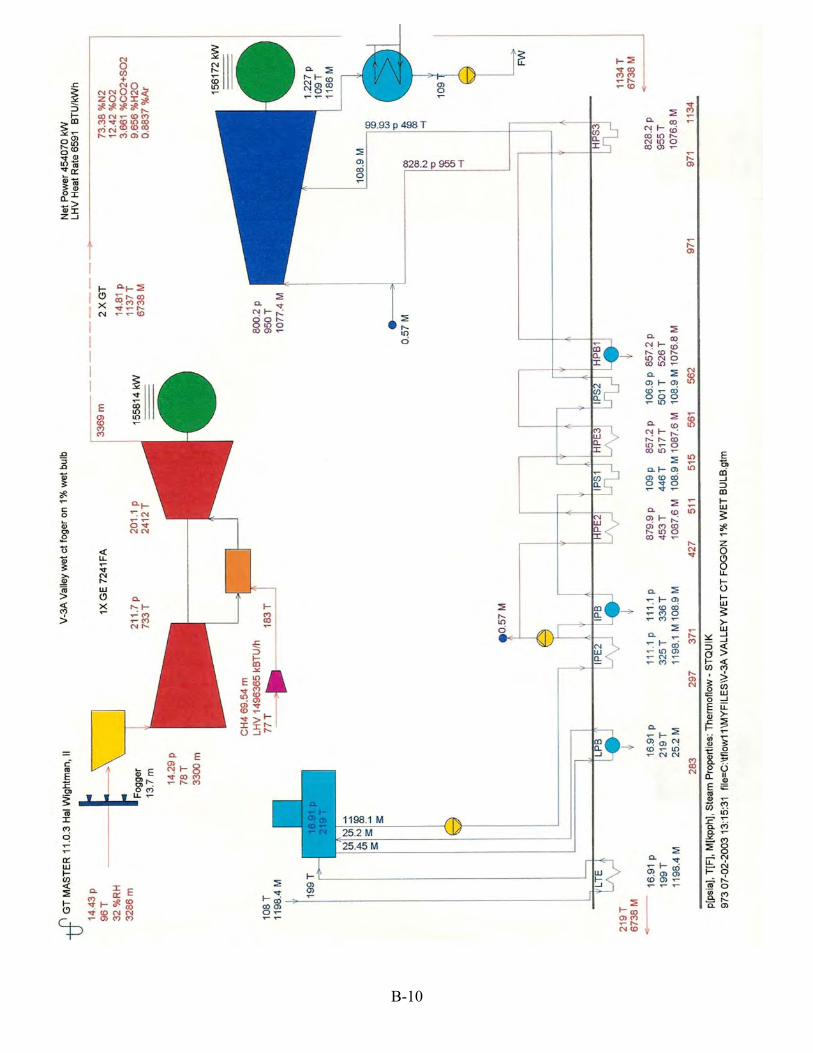
B-10
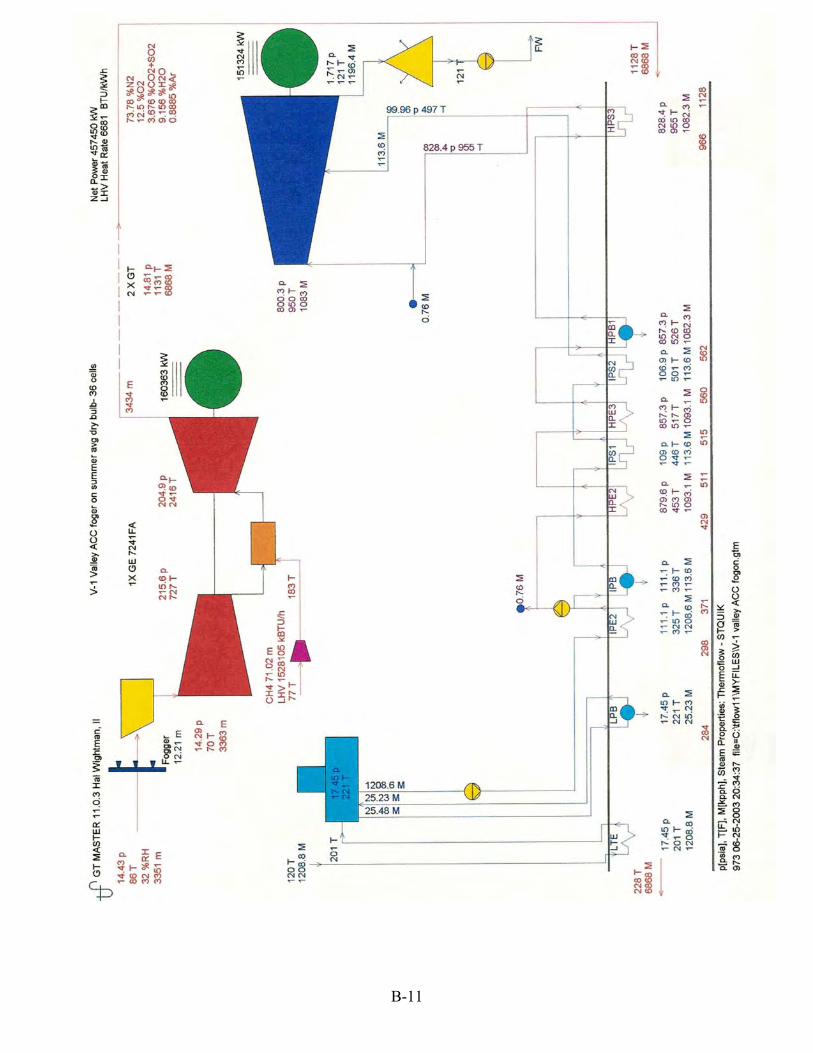
B-11
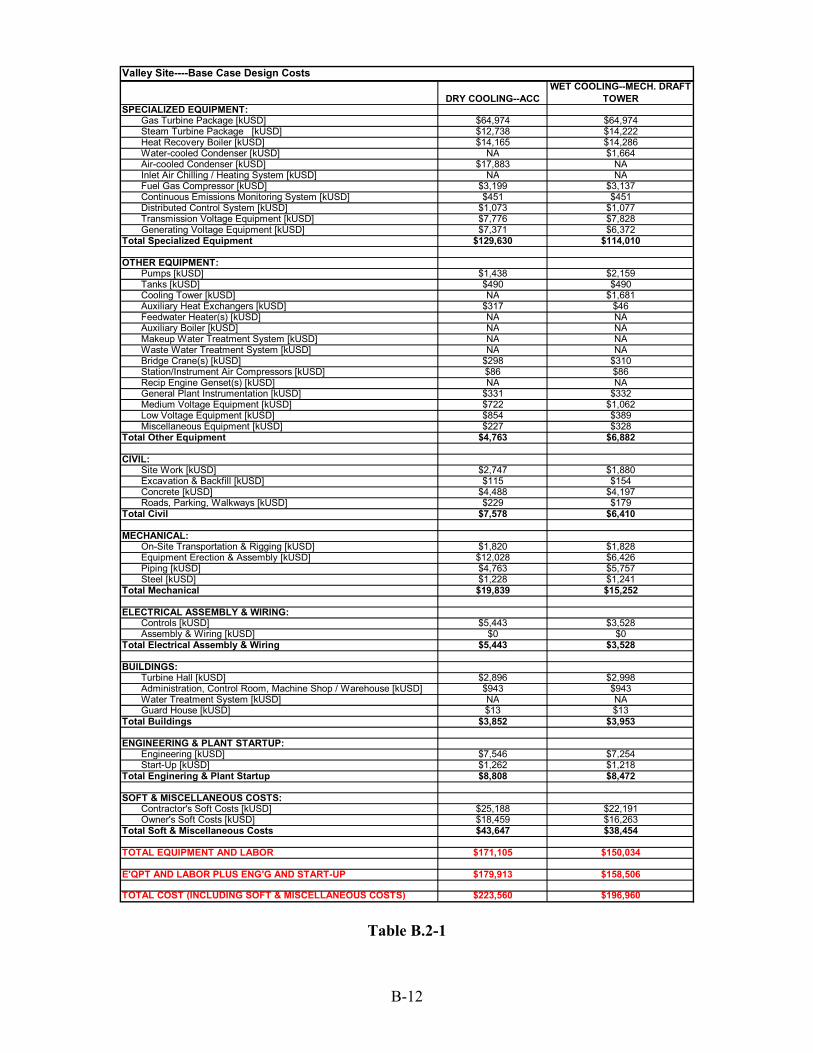
B-12
Table B.2-1
DRY COOLING--ACCWET COOLING--MECH. DRAFT
TOWERSPECIALIZED EQUIPMENT: Gas Turbine Package [kUSD] $64,974 $64,974 Steam Turbine Package [kUSD] $12,738 $14,222 Heat Recovery Boiler [kUSD] $14,165 $14,286 Water-cooled Condenser [kUSD] NA $1,664 Air-cooled Condenser [kUSD] $17,883 NA Inlet Air Chilling / Heating System [kUSD] NA NA Fuel Gas Compressor [kUSD] $3,199 $3,137 Continuous Emissions Monitoring System [kUSD] $451 $451 Distributed Control System [kUSD] $1,073 $1,077 Transmission Voltage Equipment [kUSD] $7,776 $7,828 Generating Voltage Equipment [kUSD] $7,371 $6,372Total Specialized Equipment $129,630 $114,010
OTHER EQUIPMENT: Pumps [kUSD] $1,438 $2,159 Tanks [kUSD] $490 $490 Cooling Tower [kUSD] NA $1,681 Auxiliary Heat Exchangers [kUSD] $317 $46 Feedwater Heater(s) [kUSD] NA NA Auxiliary Boiler [kUSD] NA NA Makeup Water Treatment System [kUSD] NA NA Waste Water Treatment System [kUSD] NA NA Bridge Crane(s) [kUSD] $298 $310 Station/Instrument Air Compressors [kUSD] $86 $86 Recip Engine Genset(s) [kUSD] NA NA General Plant Instrumentation [kUSD] $331 $332 Medium Voltage Equipment [kUSD] $722 $1,062 Low Voltage Equipment [kUSD] $854 $389 Miscellaneous Equipment [kUSD] $227 $328Total Other Equipment $4,763 $6,882
CIVIL: Site Work [kUSD] $2,747 $1,880 Excavation & Backfill [kUSD] $115 $154 Concrete [kUSD] $4,488 $4,197 Roads, Parking, Walkways [kUSD] $229 $179Total Civil $7,578 $6,410
MECHANICAL: On-Site Transportation & Rigging [kUSD] $1,820 $1,828 Equipment Erection & Assembly [kUSD] $12,028 $6,426 Piping [kUSD] $4,763 $5,757 Steel [kUSD] $1,228 $1,241Total Mechanical $19,839 $15,252
ELECTRICAL ASSEMBLY & WIRING: Controls [kUSD] $5,443 $3,528 Assembly & Wiring [kUSD] $0 $0Total Electrical Assembly & Wiring $5,443 $3,528
BUILDINGS: Turbine Hall [kUSD] $2,896 $2,998 Administration, Control Room, Machine Shop / Warehouse [kUSD] $943 $943 Water Treatment System [kUSD] NA NA Guard House [kUSD] $13 $13Total Buildings $3,852 $3,953
ENGINEERING & PLANT STARTUP: Engineering [kUSD] $7,546 $7,254 Start-Up [kUSD] $1,262 $1,218Total Enginering & Plant Startup $8,808 $8,472
SOFT & MISCELLANEOUS COSTS: Contractor's Soft Costs [kUSD] $25,188 $22,191 Owner's Soft Costs [kUSD] $18,459 $16,263Total Soft & Miscellaneous Costs $43,647 $38,454
TOTAL EQUIPMENT AND LABOR $171,105 $150,034
E'QPT AND LABOR PLUS ENG'G AND START-UP $179,913 $158,506
TOTAL COST (INCLUDING SOFT & MISCELLANEOUS COSTS) $223,560 $196,960
Valley Site----Base Case Design Costs
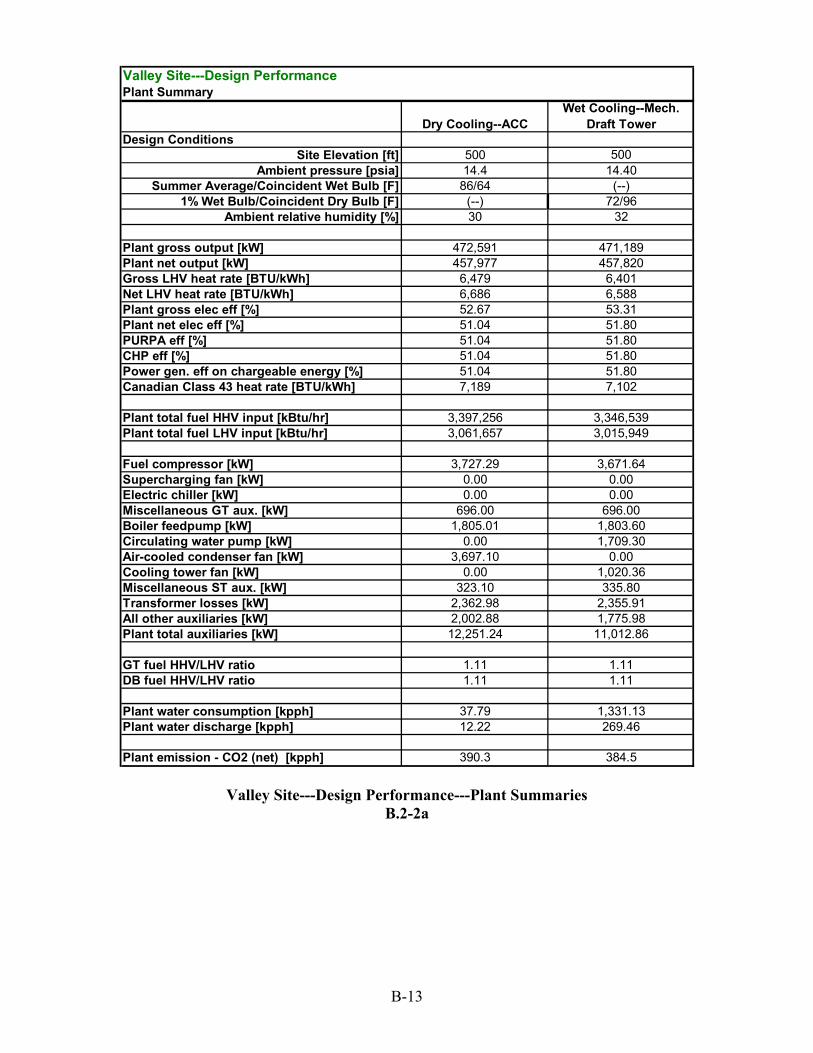
B-13
Valley Site---Design Performance---Plant Summaries
B.2-2a
Valley Site---Design PerformancePlant Summary
Dry Cooling--ACCWet Cooling--Mech.
Draft TowerDesign Conditions
Site Elevation [ft] 500 500Ambient pressure [psia] 14.4 14.40
Summer Average/Coincident Wet Bulb [F] 86/64 (--)1% Wet Bulb/Coincident Dry Bulb [F] (--) 72/96
Ambient relative humidity [%] 30 32
Plant gross output [kW] 472,591 471,189Plant net output [kW] 457,977 457,820Gross LHV heat rate [BTU/kWh] 6,479 6,401Net LHV heat rate [BTU/kWh] 6,686 6,588Plant gross elec eff [%] 52.67 53.31Plant net elec eff [%] 51.04 51.80PURPA eff [%] 51.04 51.80CHP eff [%] 51.04 51.80Power gen. eff on chargeable energy [%] 51.04 51.80Canadian Class 43 heat rate [BTU/kWh] 7,189 7,102
Plant total fuel HHV input [kBtu/hr] 3,397,256 3,346,539Plant total fuel LHV input [kBtu/hr] 3,061,657 3,015,949
Fuel compressor [kW] 3,727.29 3,671.64Supercharging fan [kW] 0.00 0.00Electric chiller [kW] 0.00 0.00Miscellaneous GT aux. [kW] 696.00 696.00Boiler feedpump [kW] 1,805.01 1,803.60Circulating water pump [kW] 0.00 1,709.30Air-cooled condenser fan [kW] 3,697.10 0.00Cooling tower fan [kW] 0.00 1,020.36Miscellaneous ST aux. [kW] 323.10 335.80Transformer losses [kW] 2,362.98 2,355.91All other auxiliaries [kW] 2,002.88 1,775.98Plant total auxiliaries [kW] 12,251.24 11,012.86
GT fuel HHV/LHV ratio 1.11 1.11DB fuel HHV/LHV ratio 1.11 1.11
Plant water consumption [kpph] 37.79 1,331.13Plant water discharge [kpph] 12.22 269.46
Plant emission - CO2 (net) [kpph] 390.3 384.5

B-14
Valley Site---Design Performance---Gas Turbine Summaries
B.2-2b
Valley Site---Design PerformanceGas Turbine Summary
Dry Cooling--ACCWet Cooling--Mech.
Draft TowerDesign Conditions
Site Elevation [ft] 500 500Ambient pressure [psia] 14.4 14.40
Summer Average/Coincident Wet Bulb [F] 86/64 (--)1% Wet Bulb/Coincident Dry Bulb [F] (--) 72/96
Ambient relative humidity [%] 30 32
GT gross power [kW] 160,756 157,562GT gross LHV eff [%] 35.8 35.6GT LHV gross heat rate [BTU/kWh] 9,523 9,571
Compressor inlet mass flow [kpph] 3,369.10 3,325.58Compressor inlet temperature [F] 69.42 74.88Turbine inlet mass flow [kpph] 2,966.29 2,927.64Turbine inlet temperature [F] 2,416.02 2,414.21Turbine exhaust mass flow [kpph] 3,440.57 3,395.73Turbine exhaust temperature [F] 1,130.84 1,135.06
GT fuel HHV input [kBtu/hr] 1,698,628 1,673,270GT fuel LHV input [kBtu/hr] 1,530,828 1,507,975Exhaust gas molecular weight 28.30 28.27Exhaust gas N2+Ar mole percentage [%] 74.72 74.54Exhaust gas O2 mole percentage [%] 12.51 12.48Exhaust gas CO2 mole percentage [%] 3.67 3.67Exhaust gas H2O mole percentage [%] 9.09 9.30GT fuel flow [kpph] 71.14 70.08Combustor steam injection [kpph] 0.00 0.00Combustor water injection [kpph] 0.00 0.00Inlet filter pressure loss [inch H2O] 4.01 4.06Total exhaust pressure loss [inch H2O] 10.44 10.23
Fogging water mass flow [kpph] 12.73 16.01Number of chillers in plant 0.00 0.00
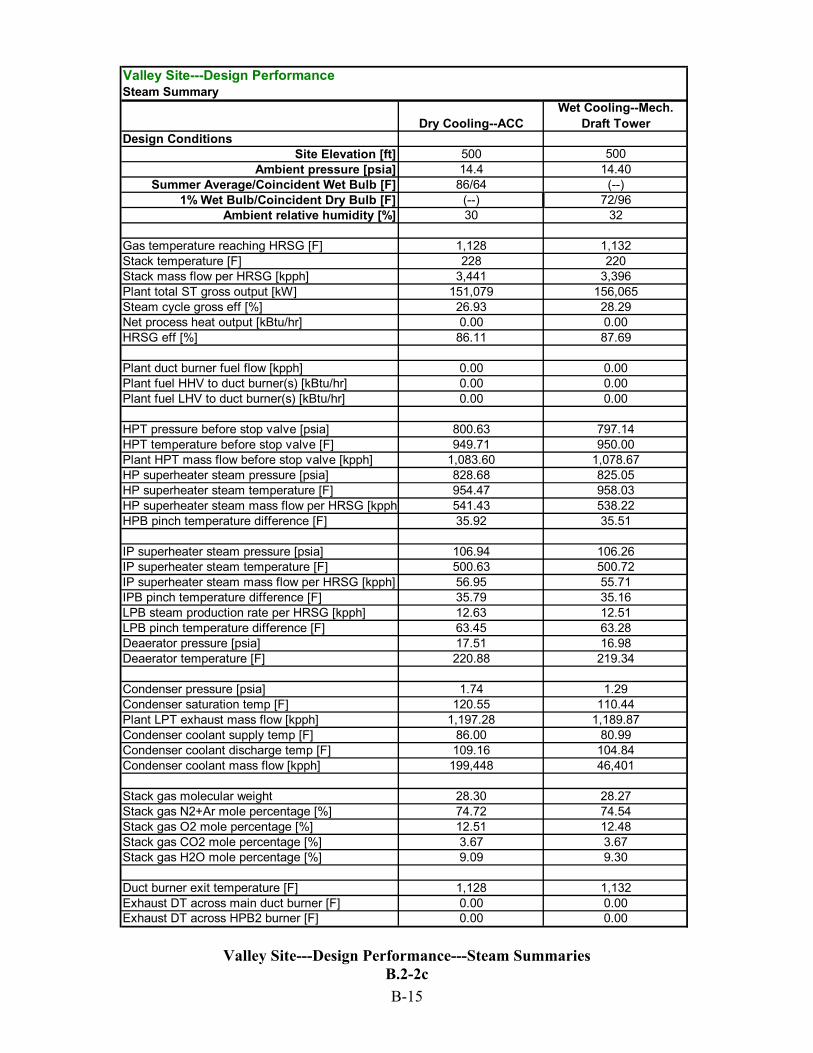
B-15
Valley Site---Design Performance---Steam Summaries
B.2-2c
Valley Site---Design PerformanceSteam Summary
Dry Cooling--ACCWet Cooling--Mech.
Draft TowerDesign Conditions
Site Elevation [ft] 500 500Ambient pressure [psia] 14.4 14.40
Summer Average/Coincident Wet Bulb [F] 86/64 (--)1% Wet Bulb/Coincident Dry Bulb [F] (--) 72/96
Ambient relative humidity [%] 30 32
Gas temperature reaching HRSG [F] 1,128 1,132Stack temperature [F] 228 220Stack mass flow per HRSG [kpph] 3,441 3,396Plant total ST gross output [kW] 151,079 156,065Steam cycle gross eff [%] 26.93 28.29Net process heat output [kBtu/hr] 0.00 0.00HRSG eff [%] 86.11 87.69
Plant duct burner fuel flow [kpph] 0.00 0.00Plant fuel HHV to duct burner(s) [kBtu/hr] 0.00 0.00Plant fuel LHV to duct burner(s) [kBtu/hr] 0.00 0.00
HPT pressure before stop valve [psia] 800.63 797.14HPT temperature before stop valve [F] 949.71 950.00Plant HPT mass flow before stop valve [kpph] 1,083.60 1,078.67HP superheater steam pressure [psia] 828.68 825.05HP superheater steam temperature [F] 954.47 958.03HP superheater steam mass flow per HRSG [kpph] 541.43 538.22HPB pinch temperature difference [F] 35.92 35.51
IP superheater steam pressure [psia] 106.94 106.26IP superheater steam temperature [F] 500.63 500.72IP superheater steam mass flow per HRSG [kpph] 56.95 55.71IPB pinch temperature difference [F] 35.79 35.16LPB steam production rate per HRSG [kpph] 12.63 12.51LPB pinch temperature difference [F] 63.45 63.28Deaerator pressure [psia] 17.51 16.98Deaerator temperature [F] 220.88 219.34
Condenser pressure [psia] 1.74 1.29Condenser saturation temp [F] 120.55 110.44Plant LPT exhaust mass flow [kpph] 1,197.28 1,189.87Condenser coolant supply temp [F] 86.00 80.99Condenser coolant discharge temp [F] 109.16 104.84Condenser coolant mass flow [kpph] 199,448 46,401
Stack gas molecular weight 28.30 28.27Stack gas N2+Ar mole percentage [%] 74.72 74.54Stack gas O2 mole percentage [%] 12.51 12.48Stack gas CO2 mole percentage [%] 3.67 3.67Stack gas H2O mole percentage [%] 9.09 9.30
Duct burner exit temperature [F] 1,128 1,132Exhaust DT across main duct burner [F] 0.00 0.00Exhaust DT across HPB2 burner [F] 0.00 0.00

B-16
B.3 Coast Site Design Information
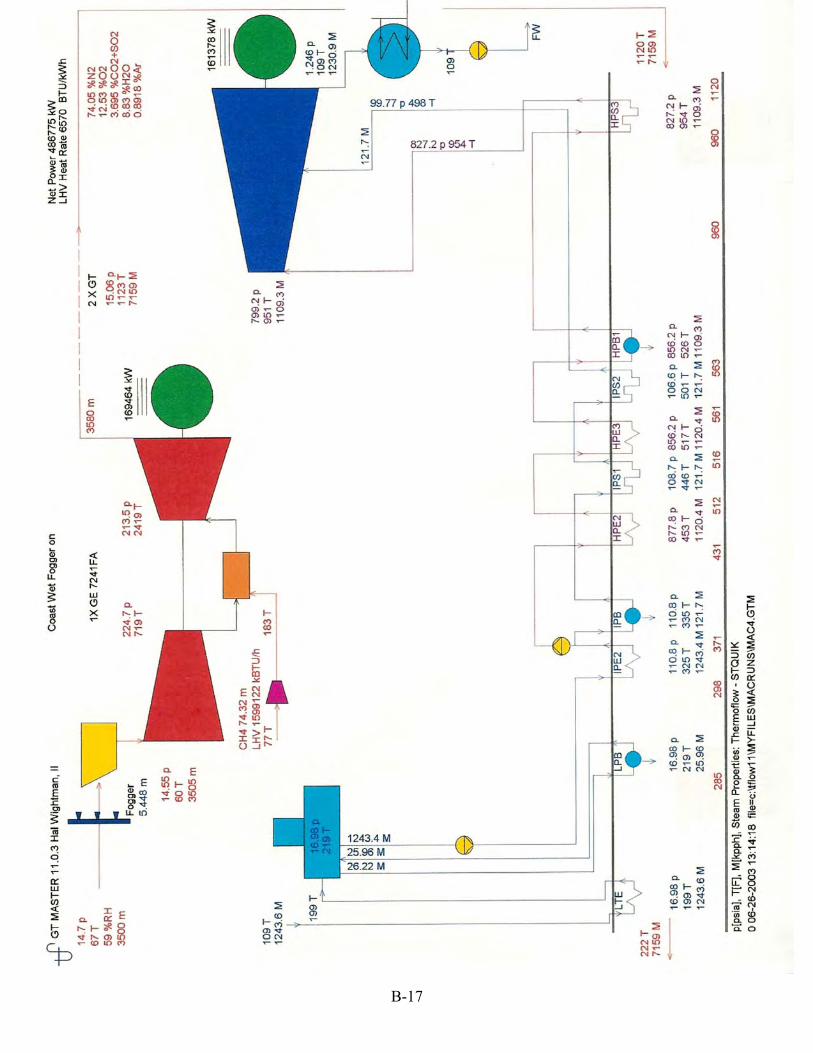
B-17
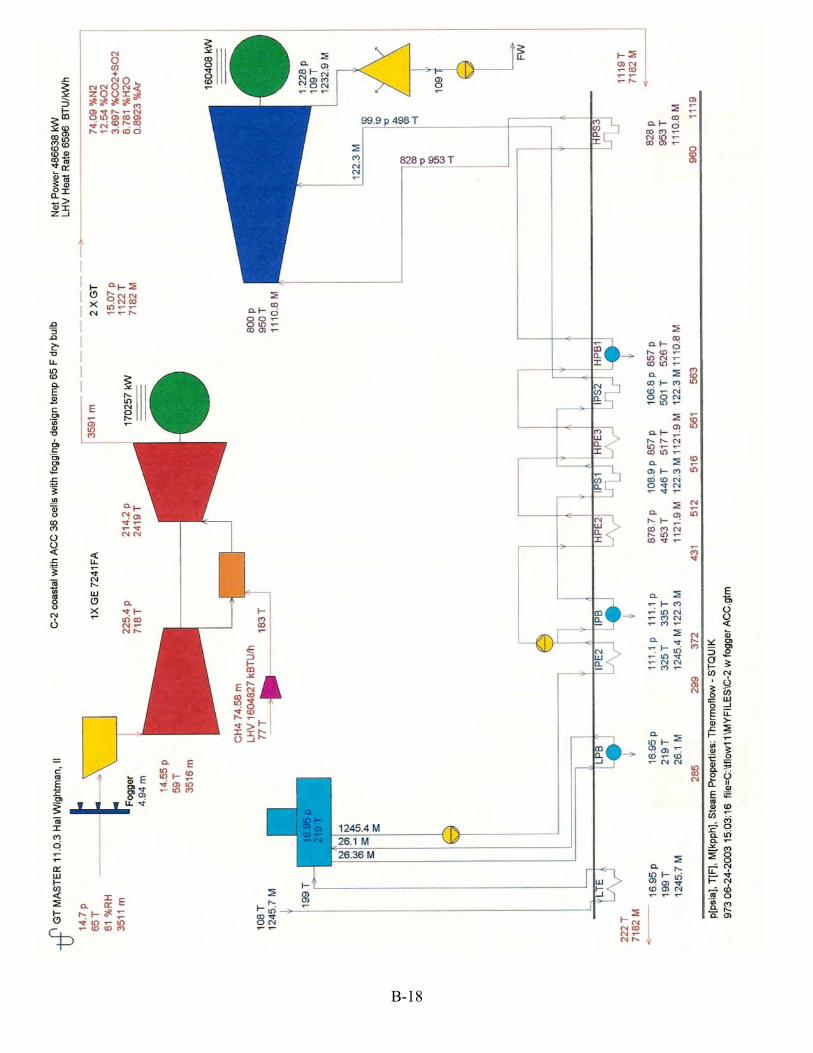
B-18
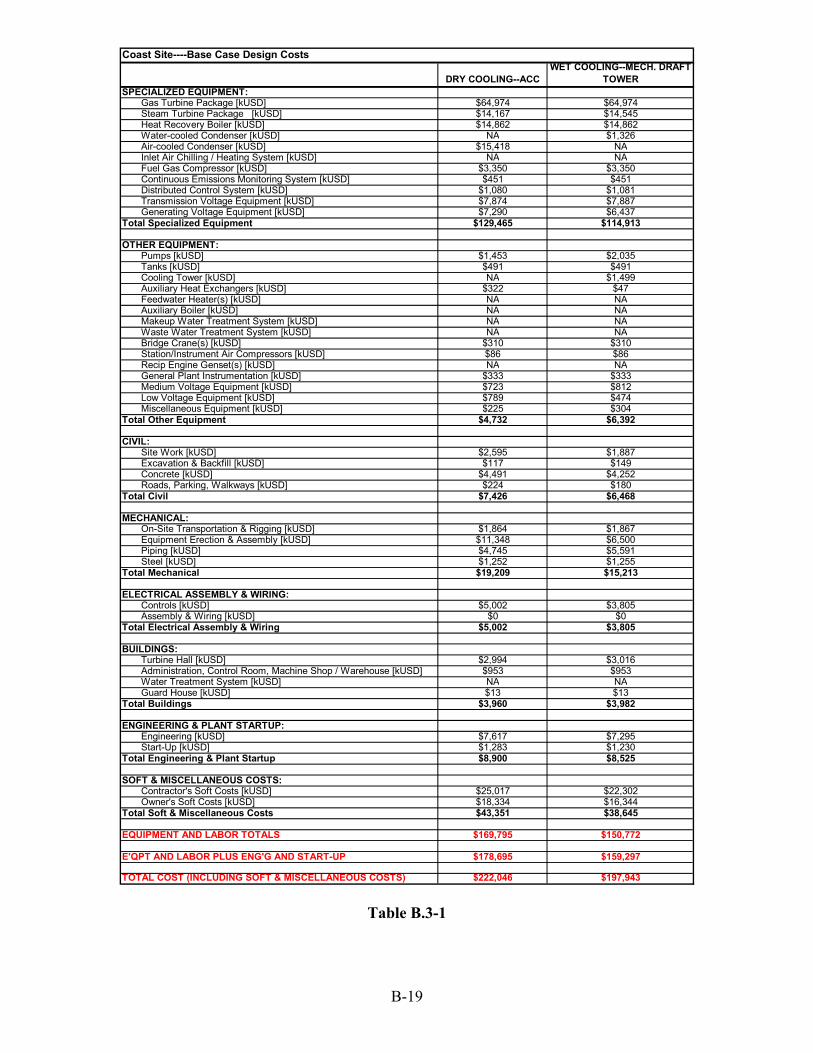
B-19
Table B.3-1
DRY COOLING--ACCWET COOLING--MECH. DRAFT
TOWERSPECIALIZED EQUIPMENT: Gas Turbine Package [kUSD] $64,974 $64,974 Steam Turbine Package [kUSD] $14,167 $14,545 Heat Recovery Boiler [kUSD] $14,862 $14,862 Water-cooled Condenser [kUSD] NA $1,326 Air-cooled Condenser [kUSD] $15,418 NA Inlet Air Chilling / Heating System [kUSD] NA NA Fuel Gas Compressor [kUSD] $3,350 $3,350 Continuous Emissions Monitoring System [kUSD] $451 $451 Distributed Control System [kUSD] $1,080 $1,081 Transmission Voltage Equipment [kUSD] $7,874 $7,887 Generating Voltage Equipment [kUSD] $7,290 $6,437Total Specialized Equipment $129,465 $114,913
OTHER EQUIPMENT: Pumps [kUSD] $1,453 $2,035 Tanks [kUSD] $491 $491 Cooling Tower [kUSD] NA $1,499 Auxiliary Heat Exchangers [kUSD] $322 $47 Feedwater Heater(s) [kUSD] NA NA Auxiliary Boiler [kUSD] NA NA Makeup Water Treatment System [kUSD] NA NA Waste Water Treatment System [kUSD] NA NA Bridge Crane(s) [kUSD] $310 $310 Station/Instrument Air Compressors [kUSD] $86 $86 Recip Engine Genset(s) [kUSD] NA NA General Plant Instrumentation [kUSD] $333 $333 Medium Voltage Equipment [kUSD] $723 $812 Low Voltage Equipment [kUSD] $789 $474 Miscellaneous Equipment [kUSD] $225 $304Total Other Equipment $4,732 $6,392
CIVIL: Site Work [kUSD] $2,595 $1,887 Excavation & Backfill [kUSD] $117 $149 Concrete [kUSD] $4,491 $4,252 Roads, Parking, Walkways [kUSD] $224 $180Total Civil $7,426 $6,468
MECHANICAL: On-Site Transportation & Rigging [kUSD] $1,864 $1,867 Equipment Erection & Assembly [kUSD] $11,348 $6,500 Piping [kUSD] $4,745 $5,591 Steel [kUSD] $1,252 $1,255Total Mechanical $19,209 $15,213
ELECTRICAL ASSEMBLY & WIRING: Controls [kUSD] $5,002 $3,805 Assembly & Wiring [kUSD] $0 $0Total Electrical Assembly & Wiring $5,002 $3,805
BUILDINGS: Turbine Hall [kUSD] $2,994 $3,016 Administration, Control Room, Machine Shop / Warehouse [kUSD] $953 $953 Water Treatment System [kUSD] NA NA Guard House [kUSD] $13 $13Total Buildings $3,960 $3,982
ENGINEERING & PLANT STARTUP: Engineering [kUSD] $7,617 $7,295 Start-Up [kUSD] $1,283 $1,230Total Engineering & Plant Startup $8,900 $8,525
SOFT & MISCELLANEOUS COSTS: Contractor's Soft Costs [kUSD] $25,017 $22,302 Owner's Soft Costs [kUSD] $18,334 $16,344Total Soft & Miscellaneous Costs $43,351 $38,645
EQUIPMENT AND LABOR TOTALS $169,795 $150,772
E'QPT AND LABOR PLUS ENG'G AND START-UP $178,695 $159,297
TOTAL COST (INCLUDING SOFT & MISCELLANEOUS COSTS) $222,046 $197,943
Coast Site----Base Case Design Costs

B-20
Coast Site---Design Performance---Plant Summaries
B.3-2a
Coast Site---Design PerformancePlant Summary
Dry Cooling--ACCWet Cooling--Mech.
Draft TowerDesign Conditions
Site Elevation [ft] 0 0Ambient pressure [psia] 14.7 14.70
Summer Average/Coincident Wet Bulb [F] 65/57 (--)1% Wet Bulb/Coincident Dry Bulb [F] (--) 63/74
Ambient relative humidity [%] 62 55
Plant gross output [kW] 500,576 495,476Plant net output [kW] 486,297 481,768Gross LHV heat rate [BTU/kWh] 6,409 6,391Net LHV heat rate [BTU/kWh] 6,596 6,573Plant gross elec eff [%] 53.24 53.39Plant net elec eff [%] 51.73 51.92PURPA eff [%] 51.73 51.92CHP eff [%] 51.73 51.92Power gen. eff on chargeable energy [%] 51.73 51.92Canadian Class 43 heat rate [BTU/kWh] 7,111 7,091
Plant total fuel HHV input [kBtu/hr] 3,559,611 3,513,717Plant total fuel LHV input [kBtu/hr] 3,207,974 3,166,613
Fuel compressor [kW] 3,906 3,855Supercharging fan [kW] 0 0Electric chiller [kW] 0 0Miscellaneous GT aux. [kW] 696 696Boiler feedpump [kW] 1,856 1,848Circulating water pump [kW] 0 1,695Air-cooled condenser fan [kW] 2,968 0.00Cooling tower fan [kW] 0 1,016Miscellaneous ST aux. [kW] 343 343Transformer losses [kW] 2,503 2,477All other auxiliaries [kW] 2,008 1,777Plant total auxiliaries [kW] 11,776 11,231
GT fuel HHV/LHV ratio 1.11 1.11DB fuel HHV/LHV ratio 1.11 1.11
Plant water consumption [kpph] 22.4 1,179.9Plant water discharge [kpph] 12.6 242.7
Plant emission - CO2 (net) [kpph] 409.04 403.74
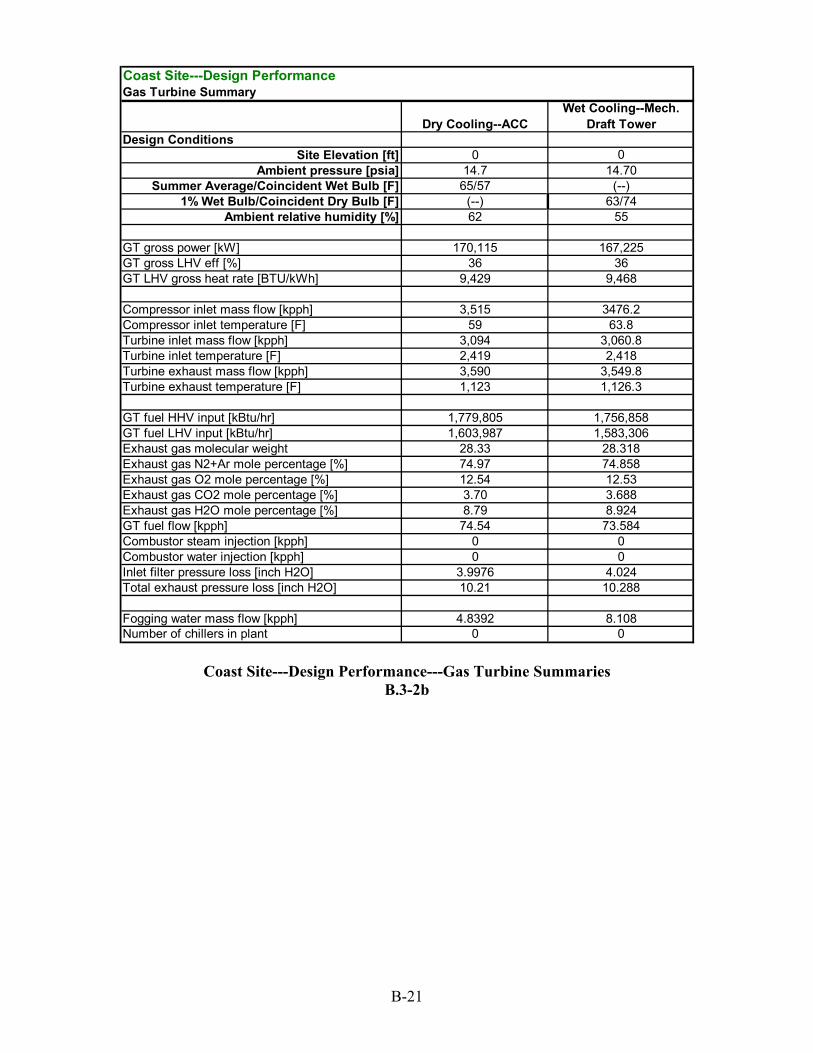
B-21
Coast Site---Design Performance---Gas Turbine Summaries
B.3-2b
Coast Site---Design PerformanceGas Turbine Summary
Dry Cooling--ACCWet Cooling--Mech.
Draft TowerDesign Conditions
Site Elevation [ft] 0 0Ambient pressure [psia] 14.7 14.70
Summer Average/Coincident Wet Bulb [F] 65/57 (--)1% Wet Bulb/Coincident Dry Bulb [F] (--) 63/74
Ambient relative humidity [%] 62 55
GT gross power [kW] 170,115 167,225GT gross LHV eff [%] 36 36GT LHV gross heat rate [BTU/kWh] 9,429 9,468
Compressor inlet mass flow [kpph] 3,515 3476.2Compressor inlet temperature [F] 59 63.8Turbine inlet mass flow [kpph] 3,094 3,060.8Turbine inlet temperature [F] 2,419 2,418Turbine exhaust mass flow [kpph] 3,590 3,549.8Turbine exhaust temperature [F] 1,123 1,126.3
GT fuel HHV input [kBtu/hr] 1,779,805 1,756,858GT fuel LHV input [kBtu/hr] 1,603,987 1,583,306Exhaust gas molecular weight 28.33 28.318Exhaust gas N2+Ar mole percentage [%] 74.97 74.858Exhaust gas O2 mole percentage [%] 12.54 12.53Exhaust gas CO2 mole percentage [%] 3.70 3.688Exhaust gas H2O mole percentage [%] 8.79 8.924GT fuel flow [kpph] 74.54 73.584Combustor steam injection [kpph] 0 0Combustor water injection [kpph] 0 0Inlet filter pressure loss [inch H2O] 3.9976 4.024Total exhaust pressure loss [inch H2O] 10.21 10.288
Fogging water mass flow [kpph] 4.8392 8.108Number of chillers in plant 0 0
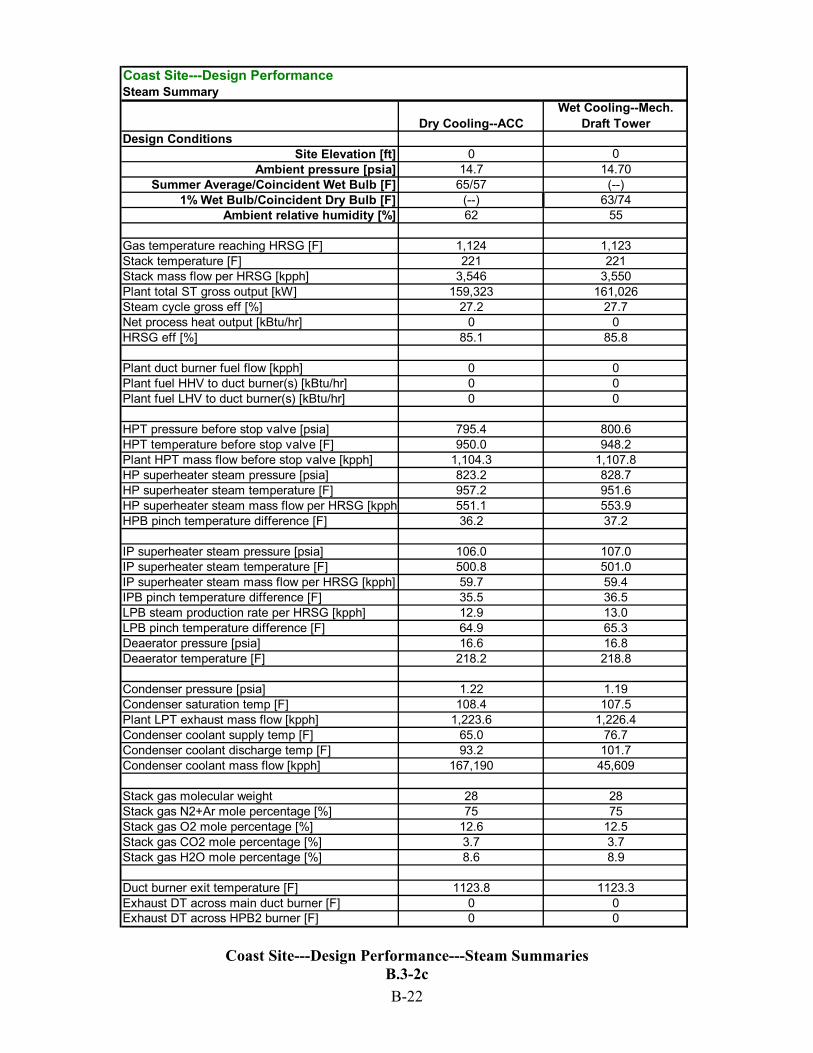
B-22
Coast Site---Design Performance---Steam Summaries
B.3-2c
Coast Site---Design PerformanceSteam Summary
Dry Cooling--ACCWet Cooling--Mech.
Draft TowerDesign Conditions
Site Elevation [ft] 0 0Ambient pressure [psia] 14.7 14.70
Summer Average/Coincident Wet Bulb [F] 65/57 (--)1% Wet Bulb/Coincident Dry Bulb [F] (--) 63/74
Ambient relative humidity [%] 62 55
Gas temperature reaching HRSG [F] 1,124 1,123Stack temperature [F] 221 221Stack mass flow per HRSG [kpph] 3,546 3,550Plant total ST gross output [kW] 159,323 161,026Steam cycle gross eff [%] 27.2 27.7Net process heat output [kBtu/hr] 0 0HRSG eff [%] 85.1 85.8
Plant duct burner fuel flow [kpph] 0 0Plant fuel HHV to duct burner(s) [kBtu/hr] 0 0Plant fuel LHV to duct burner(s) [kBtu/hr] 0 0
HPT pressure before stop valve [psia] 795.4 800.6HPT temperature before stop valve [F] 950.0 948.2Plant HPT mass flow before stop valve [kpph] 1,104.3 1,107.8HP superheater steam pressure [psia] 823.2 828.7HP superheater steam temperature [F] 957.2 951.6HP superheater steam mass flow per HRSG [kpph] 551.1 553.9HPB pinch temperature difference [F] 36.2 37.2
IP superheater steam pressure [psia] 106.0 107.0IP superheater steam temperature [F] 500.8 501.0IP superheater steam mass flow per HRSG [kpph] 59.7 59.4IPB pinch temperature difference [F] 35.5 36.5LPB steam production rate per HRSG [kpph] 12.9 13.0LPB pinch temperature difference [F] 64.9 65.3Deaerator pressure [psia] 16.6 16.8Deaerator temperature [F] 218.2 218.8
Condenser pressure [psia] 1.22 1.19Condenser saturation temp [F] 108.4 107.5Plant LPT exhaust mass flow [kpph] 1,223.6 1,226.4Condenser coolant supply temp [F] 65.0 76.7Condenser coolant discharge temp [F] 93.2 101.7Condenser coolant mass flow [kpph] 167,190 45,609
Stack gas molecular weight 28 28Stack gas N2+Ar mole percentage [%] 75 75Stack gas O2 mole percentage [%] 12.6 12.5Stack gas CO2 mole percentage [%] 3.7 3.7Stack gas H2O mole percentage [%] 8.6 8.9
Duct burner exit temperature [F] 1123.8 1123.3Exhaust DT across main duct burner [F] 0 0Exhaust DT across HPB2 burner [F] 0 0

B-23
B.4 Mountain Site Design Information
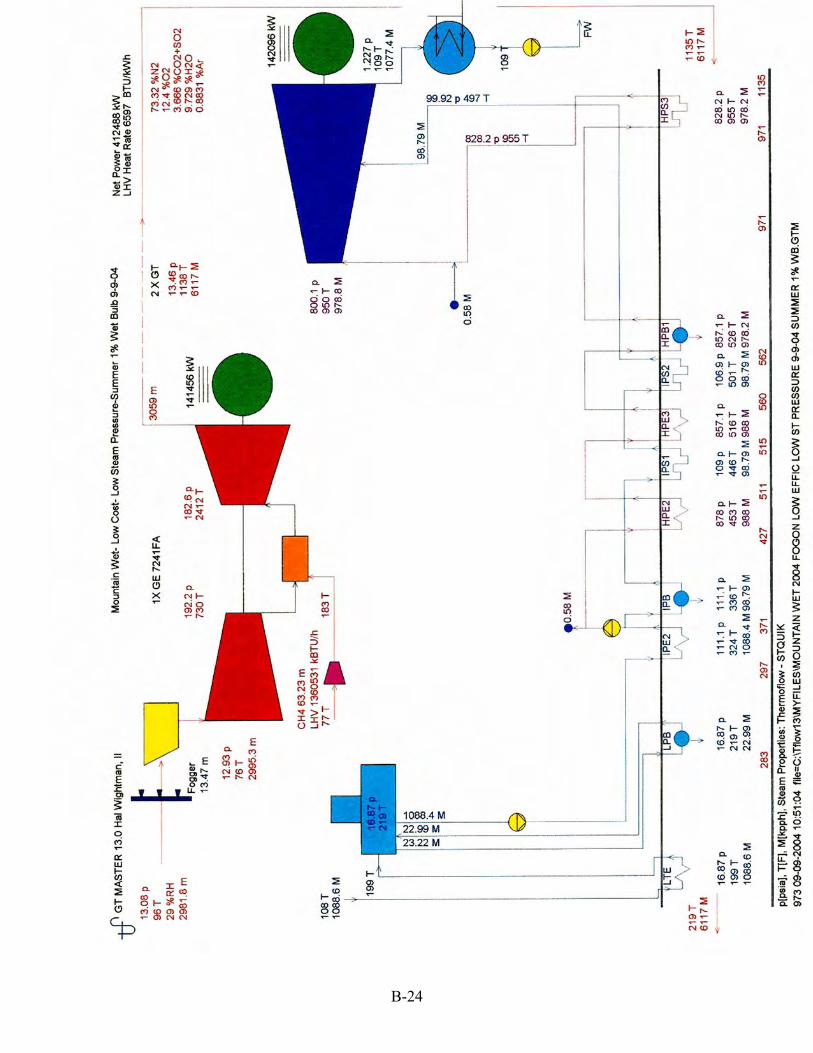
B-24
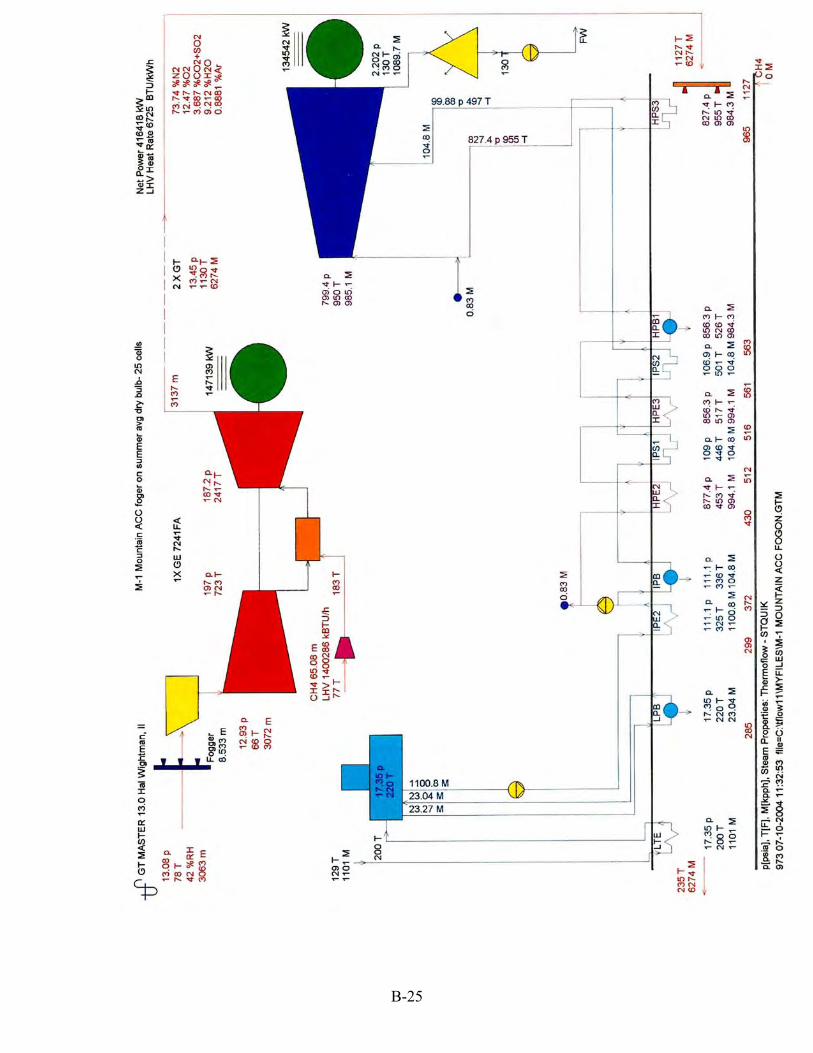
B-25

B-26
Table B.4-1
DRY COOLING--ACCWET COOLING--MECH. DRAFT
TOWERSPECIALIZED EQUIPMENT: Gas Turbine Package [kUSD] $64,974 $64,974 Steam Turbine Package [kUSD] $11,680 $13,613 Heat Recovery Boiler [kUSD] $14,657 $13,510 Water-cooled Condenser [kUSD] NA $1,483 Air-cooled Condenser [kUSD] $12,100 NA Inlet Air Chilling / Heating System [kUSD] NA NA Fuel Gas Compressor [kUSD] $2,431 $2,595 Continuous Emissions Monitoring System [kUSD] $451 $451 Distributed Control System [kUSD] $1,060 $1,066 Transmission Voltage Equipment [kUSD] $7,600 $7,679 Generating Voltage Equipment [kUSD] $6,682 $6,196Total Specialized Equipment $121,635 $111,567
OTHER EQUIPMENT: Pumps [kUSD] $1,393 $2,031 Tanks [kUSD] $488 $397 Cooling Tower [kUSD] $0 $1,490 Auxiliary Heat Exchangers [kUSD] $308 $45 Feedwater Heater(s) [kUSD] NA NA Auxiliary Boiler [kUSD] NA NA Makeup Water Treatment System [kUSD] NA NA Waste Water Treatment System [kUSD] NA NA Bridge Crane(s) [kUSD] $288 $310 Station/Instrument Air Compressors [kUSD] $86 $86 Recip Engine Genset(s) [kUSD] NA NA General Plant Instrumentation [kUSD] $327 $329 Medium Voltage Equipment [kUSD] $704 $983 Low Voltage Equipment [kUSD] $670 $371 Miscellaneous Equipment [kUSD] $213 $302Total Other Equipment $4,477 $6,344
CIVIL: Site Work [kUSD] $2,428 $2,172 Excavation & Backfill [kUSD] $113 $165 Concrete [kUSD] $4,099 $5,180 Roads, Parking, Walkways [kUSD] $216 $196Total Civil $6,856 $7,713
MECHANICAL: On-Site Transportation & Rigging [kUSD] $1,783 $2,113 Equipment Erection & Assembly [kUSD] $9,931 $8,151 Piping [kUSD] $4,862 $6,282 Steel [kUSD] $1,186 $1,375Total Mechanical $17,762 $17,920
ELECTRICAL ASSEMBLY & WIRING: Controls [kUSD] $735 $724 Assembly & Wiring [kUSD] $4,624 $4,153Total Electrical Assembly & Wiring $5,359 $4,877
BUILDINGS: Turbine Hall [kUSD] $2,869 $3,541 Administration, Control Room, Machine Shop / Warehouse [kUSD] $927 $1,275 Water Treatment System [kUSD] NA NA Guard House [kUSD] $13 $18Total Buildings $3,809 $4,834
ENGINEERING & PLANT STARTUP: Engineering [kUSD] $7,545 $7,149 Start-Up [kUSD] $1,245 $1,187Total Engineering & Startup $8,790 $8,336
SOFT & MISCELLANEOUS COSTS: Contractor's Soft Costs [kUSD] $24,174 $23,694 Owner's Soft Costs [kUSD] $17,356 $16,676Total Soft & Miscellaneoous Costs $41,530 $40,370
EQUIPMENT AND LABOR TOTALS $159,898 $153,254
E'QPT AND LABOR PLUS ENG'G AND START-UP $168,688 $161,590
TOTAL COST (INCLUDING SOFT & MISCELLANEOUS COSTS) $210,218 $201,960
Mountain Site----Base Case Design Costs
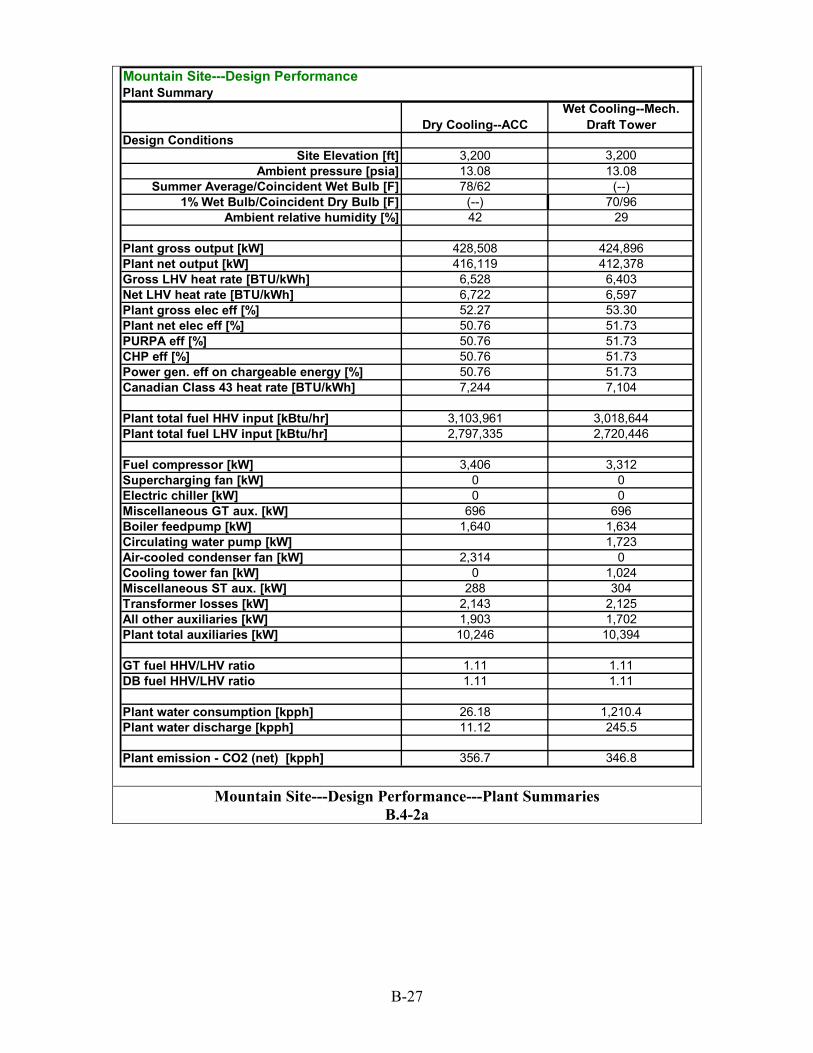
B-27
Mountain Site---Design Performance---Plant Summaries
B.4-2a
Mountain Site---Design PerformancePlant Summary
Dry Cooling--ACCWet Cooling--Mech.
Draft TowerDesign Conditions
Site Elevation [ft] 3,200 3,200Ambient pressure [psia] 13.08 13.08
Summer Average/Coincident Wet Bulb [F] 78/62 (--)1% Wet Bulb/Coincident Dry Bulb [F] (--) 70/96
Ambient relative humidity [%] 42 29
Plant gross output [kW] 428,508 424,896Plant net output [kW] 416,119 412,378Gross LHV heat rate [BTU/kWh] 6,528 6,403Net LHV heat rate [BTU/kWh] 6,722 6,597Plant gross elec eff [%] 52.27 53.30Plant net elec eff [%] 50.76 51.73PURPA eff [%] 50.76 51.73CHP eff [%] 50.76 51.73Power gen. eff on chargeable energy [%] 50.76 51.73Canadian Class 43 heat rate [BTU/kWh] 7,244 7,104
Plant total fuel HHV input [kBtu/hr] 3,103,961 3,018,644Plant total fuel LHV input [kBtu/hr] 2,797,335 2,720,446
Fuel compressor [kW] 3,406 3,312Supercharging fan [kW] 0 0Electric chiller [kW] 0 0Miscellaneous GT aux. [kW] 696 696Boiler feedpump [kW] 1,640 1,634Circulating water pump [kW] 1,723Air-cooled condenser fan [kW] 2,314 0Cooling tower fan [kW] 0 1,024Miscellaneous ST aux. [kW] 288 304Transformer losses [kW] 2,143 2,125All other auxiliaries [kW] 1,903 1,702Plant total auxiliaries [kW] 10,246 10,394
GT fuel HHV/LHV ratio 1.11 1.11DB fuel HHV/LHV ratio 1.11 1.11
Plant water consumption [kpph] 26.18 1,210.4Plant water discharge [kpph] 11.12 245.5
Plant emission - CO2 (net) [kpph] 356.7 346.8

B-28
Mountain Site---Design Performance—Gas Turbine Summaries
B.4-2b
Mountain Site---Design PerformanceGas Turbine Summary
Dry Cooling--ACCWet Cooling--Mech.
Draft TowerDesign Conditions
Site Elevation [ft] 3,200 3,200Ambient pressure [psia] 13.08 13.08
Summer Average/Coincident Wet Bulb [F] 78/62 (--)1% Wet Bulb/Coincident Dry Bulb [F] (--) 70/96
Ambient relative humidity [%] 42 29
GT gross power [kW] 146,894 141,412GT gross LHV eff [%] 35.84 35.47GT LHV gross heat rate [BTU/kWh] 9,522 9,619
Compressor inlet mass flow [kpph] 3,067 2,995Compressor inlet temperature [F] 66 76.42Turbine inlet mass flow [kpph] 2,701 2,636.5Turbine inlet temperature [F] 2,416 2,411.9Turbine exhaust mass flow [kpph] 3,132 3,058Turbine exhaust temperature [F] 1,130 1,137.8
GT fuel HHV input [kBtu/hr] 1,551,980 1,509,322GT fuel LHV input [kBtu/hr] 1,398,668 1,360,223Exhaust gas molecular weight 28.28 28.23Exhaust gas N2+Ar mole percentage [%] 74.56 74.2Exhaust gas O2 mole percentage [%] 12.45 12.4Exhaust gas CO2 mole percentage [%] 3.69 3.67Exhaust gas H2O mole percentage [%] 9.30 9.74GT fuel flow [kpph] 65.00 63.21Combustor steam injection [kpph] 0 0Combustor water injection [kpph] 0 0Inlet filter pressure loss [inch H2O] 3.981 3.999Total exhaust pressure loss [inch H2O] 10.33 10.55
Fogging water mass flow [kpph] 7.481 13.4Number of chillers in plant 0 0
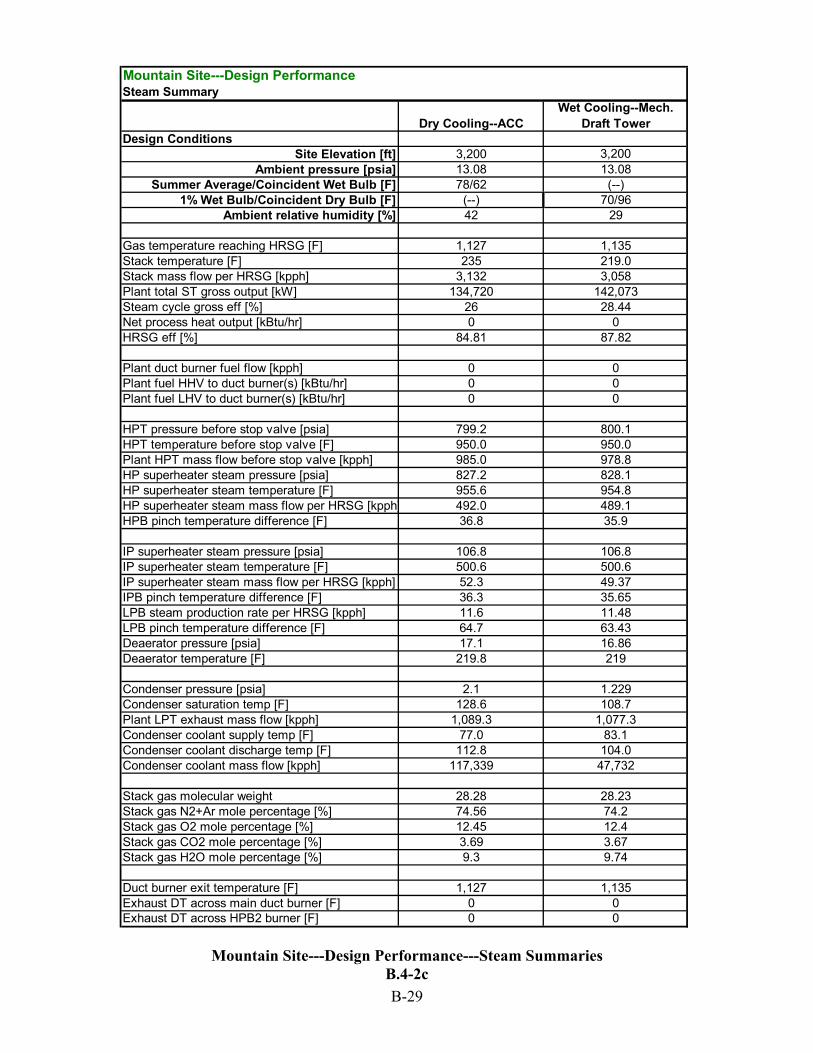
B-29
Mountain Site---Design Performance---Steam Summaries
B.4-2c
Mountain Site---Design PerformanceSteam Summary
Dry Cooling--ACCWet Cooling--Mech.
Draft TowerDesign Conditions
Site Elevation [ft] 3,200 3,200Ambient pressure [psia] 13.08 13.08
Summer Average/Coincident Wet Bulb [F] 78/62 (--)1% Wet Bulb/Coincident Dry Bulb [F] (--) 70/96
Ambient relative humidity [%] 42 29
Gas temperature reaching HRSG [F] 1,127 1,135Stack temperature [F] 235 219.0Stack mass flow per HRSG [kpph] 3,132 3,058Plant total ST gross output [kW] 134,720 142,073Steam cycle gross eff [%] 26 28.44Net process heat output [kBtu/hr] 0 0HRSG eff [%] 84.81 87.82
Plant duct burner fuel flow [kpph] 0 0Plant fuel HHV to duct burner(s) [kBtu/hr] 0 0Plant fuel LHV to duct burner(s) [kBtu/hr] 0 0
HPT pressure before stop valve [psia] 799.2 800.1HPT temperature before stop valve [F] 950.0 950.0Plant HPT mass flow before stop valve [kpph] 985.0 978.8HP superheater steam pressure [psia] 827.2 828.1HP superheater steam temperature [F] 955.6 954.8HP superheater steam mass flow per HRSG [kpph] 492.0 489.1HPB pinch temperature difference [F] 36.8 35.9
IP superheater steam pressure [psia] 106.8 106.8IP superheater steam temperature [F] 500.6 500.6IP superheater steam mass flow per HRSG [kpph] 52.3 49.37IPB pinch temperature difference [F] 36.3 35.65LPB steam production rate per HRSG [kpph] 11.6 11.48LPB pinch temperature difference [F] 64.7 63.43Deaerator pressure [psia] 17.1 16.86Deaerator temperature [F] 219.8 219
Condenser pressure [psia] 2.1 1.229Condenser saturation temp [F] 128.6 108.7Plant LPT exhaust mass flow [kpph] 1,089.3 1,077.3Condenser coolant supply temp [F] 77.0 83.1Condenser coolant discharge temp [F] 112.8 104.0Condenser coolant mass flow [kpph] 117,339 47,732
Stack gas molecular weight 28.28 28.23Stack gas N2+Ar mole percentage [%] 74.56 74.2Stack gas O2 mole percentage [%] 12.45 12.4Stack gas CO2 mole percentage [%] 3.69 3.67Stack gas H2O mole percentage [%] 9.3 9.74
Duct burner exit temperature [F] 1,127 1,135Exhaust DT across main duct burner [F] 0 0Exhaust DT across HPB2 burner [F] 0 0
C-1
APPENDIX C
OFF-DESIGN PERFORMANCE DATA
C.1 Desert Site C.2 Valley Site C.3 Coast Site C.4 Mountain Site
C-2
C.1 Desert Site Operation
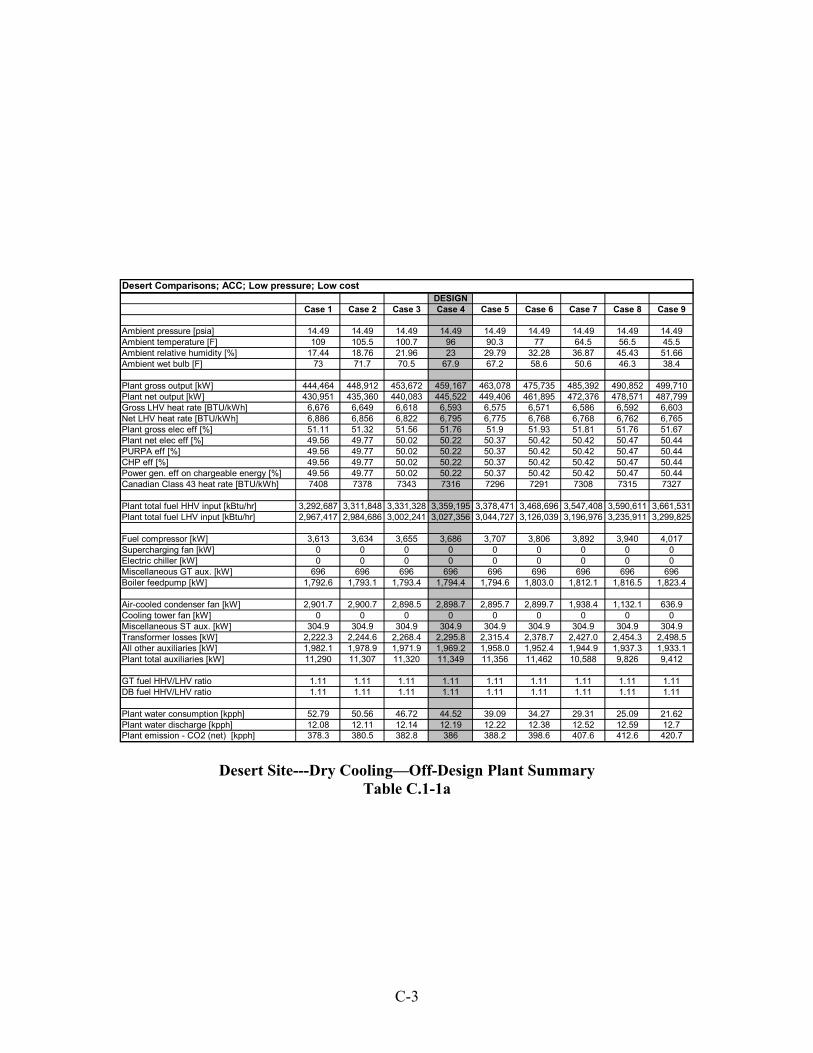
C-3
Desert Site---Dry Cooling—Off-Design Plant Summary
Table C.1-1a
DESIGNCase 1 Case 2 Case 3 Case 4 Case 5 Case 6 Case 7 Case 8 Case 9
Ambient pressure [psia] 14.49 14.49 14.49 14.49 14.49 14.49 14.49 14.49 14.49Ambient temperature [F] 109 105.5 100.7 96 90.3 77 64.5 56.5 45.5Ambient relative humidity [%] 17.44 18.76 21.96 23 29.79 32.28 36.87 45.43 51.66Ambient wet bulb [F] 73 71.7 70.5 67.9 67.2 58.6 50.6 46.3 38.4
Plant gross output [kW] 444,464 448,912 453,672 459,167 463,078 475,735 485,392 490,852 499,710Plant net output [kW] 430,951 435,360 440,083 445,522 449,406 461,895 472,376 478,571 487,799Gross LHV heat rate [BTU/kWh] 6,676 6,649 6,618 6,593 6,575 6,571 6,586 6,592 6,603Net LHV heat rate [BTU/kWh] 6,886 6,856 6,822 6,795 6,775 6,768 6,768 6,762 6,765Plant gross elec eff [%] 51.11 51.32 51.56 51.76 51.9 51.93 51.81 51.76 51.67Plant net elec eff [%] 49.56 49.77 50.02 50.22 50.37 50.42 50.42 50.47 50.44PURPA eff [%] 49.56 49.77 50.02 50.22 50.37 50.42 50.42 50.47 50.44CHP eff [%] 49.56 49.77 50.02 50.22 50.37 50.42 50.42 50.47 50.44Power gen. eff on chargeable energy [%] 49.56 49.77 50.02 50.22 50.37 50.42 50.42 50.47 50.44Canadian Class 43 heat rate [BTU/kWh] 7408 7378 7343 7316 7296 7291 7308 7315 7327
Plant total fuel HHV input [kBtu/hr] 3,292,687 3,311,848 3,331,328 3,359,195 3,378,471 3,468,696 3,547,408 3,590,611 3,661,531Plant total fuel LHV input [kBtu/hr] 2,967,417 2,984,686 3,002,241 3,027,356 3,044,727 3,126,039 3,196,976 3,235,911 3,299,825
Fuel compressor [kW] 3,613 3,634 3,655 3,686 3,707 3,806 3,892 3,940 4,017Supercharging fan [kW] 0 0 0 0 0 0 0 0 0Electric chiller [kW] 0 0 0 0 0 0 0 0 0Miscellaneous GT aux. [kW] 696 696 696 696 696 696 696 696 696Boiler feedpump [kW] 1,792.6 1,793.1 1,793.4 1,794.4 1,794.6 1,803.0 1,812.1 1,816.5 1,823.4
Air-cooled condenser fan [kW] 2,901.7 2,900.7 2,898.5 2,898.7 2,895.7 2,899.7 1,938.4 1,132.1 636.9Cooling tower fan [kW] 0 0 0 0 0 0 0 0 0Miscellaneous ST aux. [kW] 304.9 304.9 304.9 304.9 304.9 304.9 304.9 304.9 304.9Transformer losses [kW] 2,222.3 2,244.6 2,268.4 2,295.8 2,315.4 2,378.7 2,427.0 2,454.3 2,498.5All other auxiliaries [kW] 1,982.1 1,978.9 1,971.9 1,969.2 1,958.0 1,952.4 1,944.9 1,937.3 1,933.1Plant total auxiliaries [kW] 11,290 11,307 11,320 11,349 11,356 11,462 10,588 9,826 9,412
GT fuel HHV/LHV ratio 1.11 1.11 1.11 1.11 1.11 1.11 1.11 1.11 1.11DB fuel HHV/LHV ratio 1.11 1.11 1.11 1.11 1.11 1.11 1.11 1.11 1.11
Plant water consumption [kpph] 52.79 50.56 46.72 44.52 39.09 34.27 29.31 25.09 21.62Plant water discharge [kpph] 12.08 12.11 12.14 12.19 12.22 12.38 12.52 12.59 12.7Plant emission - CO2 (net) [kpph] 378.3 380.5 382.8 386 388.2 398.6 407.6 412.6 420.7
Desert Comparisons; ACC; Low pressure; Low cost
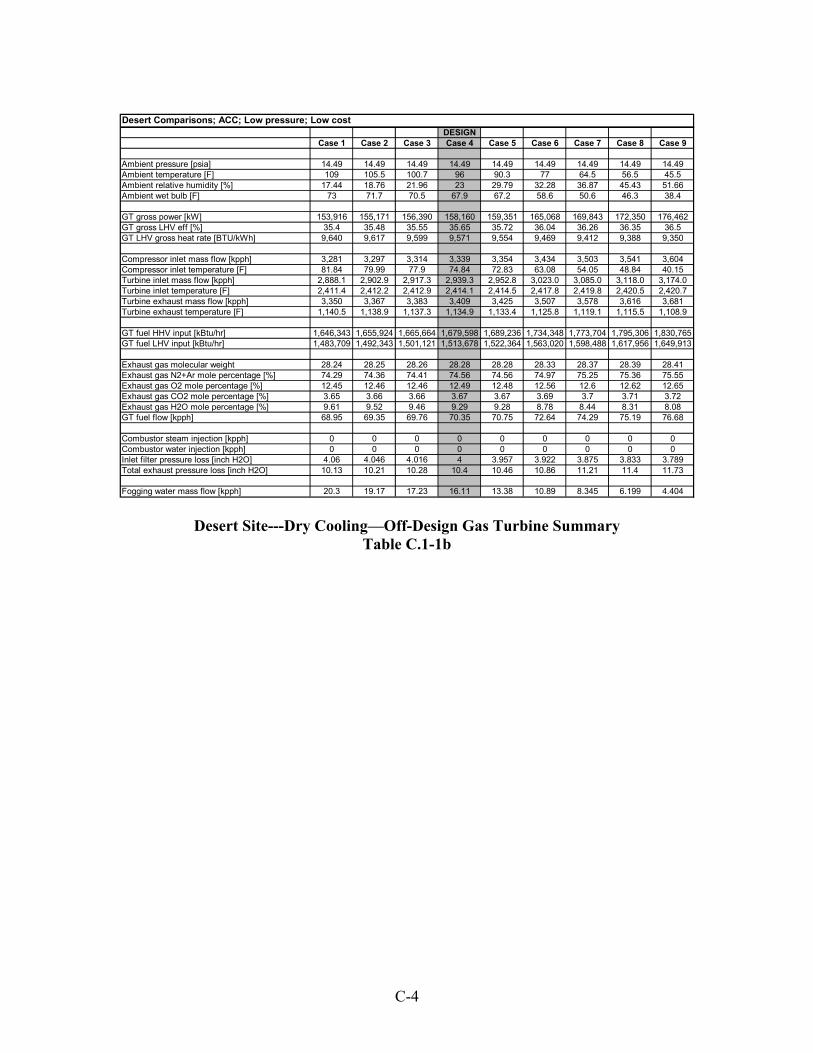
C-4
Desert Site---Dry Cooling—Off-Design Gas Turbine Summary
Table C.1-1b
DESIGNCase 1 Case 2 Case 3 Case 4 Case 5 Case 6 Case 7 Case 8 Case 9
Ambient pressure [psia] 14.49 14.49 14.49 14.49 14.49 14.49 14.49 14.49 14.49Ambient temperature [F] 109 105.5 100.7 96 90.3 77 64.5 56.5 45.5Ambient relative humidity [%] 17.44 18.76 21.96 23 29.79 32.28 36.87 45.43 51.66Ambient wet bulb [F] 73 71.7 70.5 67.9 67.2 58.6 50.6 46.3 38.4
GT gross power [kW] 153,916 155,171 156,390 158,160 159,351 165,068 169,843 172,350 176,462GT gross LHV eff [%] 35.4 35.48 35.55 35.65 35.72 36.04 36.26 36.35 36.5GT LHV gross heat rate [BTU/kWh] 9,640 9,617 9,599 9,571 9,554 9,469 9,412 9,388 9,350
Compressor inlet mass flow [kpph] 3,281 3,297 3,314 3,339 3,354 3,434 3,503 3,541 3,604Compressor inlet temperature [F] 81.84 79.99 77.9 74.84 72.83 63.08 54.05 48.84 40.15Turbine inlet mass flow [kpph] 2,888.1 2,902.9 2,917.3 2,939.3 2,952.8 3,023.0 3,085.0 3,118.0 3,174.0Turbine inlet temperature [F] 2,411.4 2,412.2 2,412.9 2,414.1 2,414.5 2,417.8 2,419.8 2,420.5 2,420.7Turbine exhaust mass flow [kpph] 3,350 3,367 3,383 3,409 3,425 3,507 3,578 3,616 3,681Turbine exhaust temperature [F] 1,140.5 1,138.9 1,137.3 1,134.9 1,133.4 1,125.8 1,119.1 1,115.5 1,108.9
GT fuel HHV input [kBtu/hr] 1,646,343 1,655,924 1,665,664 1,679,598 1,689,236 1,734,348 1,773,704 1,795,306 1,830,765GT fuel LHV input [kBtu/hr] 1,483,709 1,492,343 1,501,121 1,513,678 1,522,364 1,563,020 1,598,488 1,617,956 1,649,913
Exhaust gas molecular weight 28.24 28.25 28.26 28.28 28.28 28.33 28.37 28.39 28.41Exhaust gas N2+Ar mole percentage [%] 74.29 74.36 74.41 74.56 74.56 74.97 75.25 75.36 75.55Exhaust gas O2 mole percentage [%] 12.45 12.46 12.46 12.49 12.48 12.56 12.6 12.62 12.65Exhaust gas CO2 mole percentage [%] 3.65 3.66 3.66 3.67 3.67 3.69 3.7 3.71 3.72Exhaust gas H2O mole percentage [%] 9.61 9.52 9.46 9.29 9.28 8.78 8.44 8.31 8.08GT fuel flow [kpph] 68.95 69.35 69.76 70.35 70.75 72.64 74.29 75.19 76.68
Combustor steam injection [kpph] 0 0 0 0 0 0 0 0 0Combustor water injection [kpph] 0 0 0 0 0 0 0 0 0Inlet filter pressure loss [inch H2O] 4.06 4.046 4.016 4 3.957 3.922 3.875 3.833 3.789Total exhaust pressure loss [inch H2O] 10.13 10.21 10.28 10.4 10.46 10.86 11.21 11.4 11.73
Fogging water mass flow [kpph] 20.3 19.17 17.23 16.11 13.38 10.89 8.345 6.199 4.404
Desert Comparisons; ACC; Low pressure; Low cost
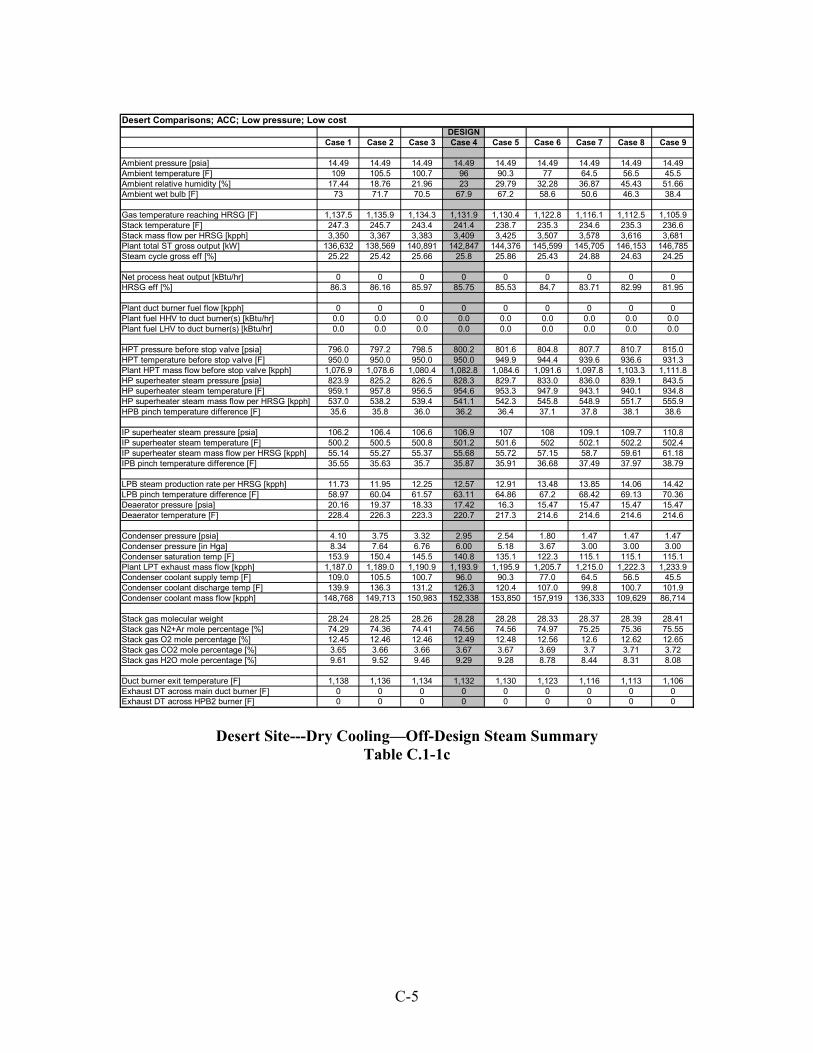
C-5
Desert Site---Dry Cooling—Off-Design Steam Summary
Table C.1-1c
DESIGNCase 1 Case 2 Case 3 Case 4 Case 5 Case 6 Case 7 Case 8 Case 9
Ambient pressure [psia] 14.49 14.49 14.49 14.49 14.49 14.49 14.49 14.49 14.49Ambient temperature [F] 109 105.5 100.7 96 90.3 77 64.5 56.5 45.5Ambient relative humidity [%] 17.44 18.76 21.96 23 29.79 32.28 36.87 45.43 51.66Ambient wet bulb [F] 73 71.7 70.5 67.9 67.2 58.6 50.6 46.3 38.4
Gas temperature reaching HRSG [F] 1,137.5 1,135.9 1,134.3 1,131.9 1,130.4 1,122.8 1,116.1 1,112.5 1,105.9Stack temperature [F] 247.3 245.7 243.4 241.4 238.7 235.3 234.6 235.3 236.6Stack mass flow per HRSG [kpph] 3,350 3,367 3,383 3,409 3,425 3,507 3,578 3,616 3,681Plant total ST gross output [kW] 136,632 138,569 140,891 142,847 144,376 145,599 145,705 146,153 146,785Steam cycle gross eff [%] 25.22 25.42 25.66 25.8 25.86 25.43 24.88 24.63 24.25
Net process heat output [kBtu/hr] 0 0 0 0 0 0 0 0 0HRSG eff [%] 86.3 86.16 85.97 85.75 85.53 84.7 83.71 82.99 81.95
Plant duct burner fuel flow [kpph] 0 0 0 0 0 0 0 0 0Plant fuel HHV to duct burner(s) [kBtu/hr] 0.0 0.0 0.0 0.0 0.0 0.0 0.0 0.0 0.0Plant fuel LHV to duct burner(s) [kBtu/hr] 0.0 0.0 0.0 0.0 0.0 0.0 0.0 0.0 0.0
HPT pressure before stop valve [psia] 796.0 797.2 798.5 800.2 801.6 804.8 807.7 810.7 815.0HPT temperature before stop valve [F] 950.0 950.0 950.0 950.0 949.9 944.4 939.6 936.6 931.3Plant HPT mass flow before stop valve [kpph] 1,076.9 1,078.6 1,080.4 1,082.8 1,084.6 1,091.6 1,097.8 1,103.3 1,111.8HP superheater steam pressure [psia] 823.9 825.2 826.5 828.3 829.7 833.0 836.0 839.1 843.5HP superheater steam temperature [F] 959.1 957.8 956.5 954.6 953.3 947.9 943.1 940.1 934.8HP superheater steam mass flow per HRSG [kpph] 537.0 538.2 539.4 541.1 542.3 545.8 548.9 551.7 555.9HPB pinch temperature difference [F] 35.6 35.8 36.0 36.2 36.4 37.1 37.8 38.1 38.6
IP superheater steam pressure [psia] 106.2 106.4 106.6 106.9 107 108 109.1 109.7 110.8IP superheater steam temperature [F] 500.2 500.5 500.8 501.2 501.6 502 502.1 502.2 502.4IP superheater steam mass flow per HRSG [kpph] 55.14 55.27 55.37 55.68 55.72 57.15 58.7 59.61 61.18IPB pinch temperature difference [F] 35.55 35.63 35.7 35.87 35.91 36.68 37.49 37.97 38.79
LPB steam production rate per HRSG [kpph] 11.73 11.95 12.25 12.57 12.91 13.48 13.85 14.06 14.42LPB pinch temperature difference [F] 58.97 60.04 61.57 63.11 64.86 67.2 68.42 69.13 70.36Deaerator pressure [psia] 20.16 19.37 18.33 17.42 16.3 15.47 15.47 15.47 15.47Deaerator temperature [F] 228.4 226.3 223.3 220.7 217.3 214.6 214.6 214.6 214.6
Condenser pressure [psia] 4.10 3.75 3.32 2.95 2.54 1.80 1.47 1.47 1.47Condenser pressure [in Hga] 8.34 7.64 6.76 6.00 5.18 3.67 3.00 3.00 3.00Condenser saturation temp [F] 153.9 150.4 145.5 140.8 135.1 122.3 115.1 115.1 115.1Plant LPT exhaust mass flow [kpph] 1,187.0 1,189.0 1,190.9 1,193.9 1,195.9 1,205.7 1,215.0 1,222.3 1,233.9Condenser coolant supply temp [F] 109.0 105.5 100.7 96.0 90.3 77.0 64.5 56.5 45.5Condenser coolant discharge temp [F] 139.9 136.3 131.2 126.3 120.4 107.0 99.8 100.7 101.9Condenser coolant mass flow [kpph] 148,768 149,713 150,983 152,338 153,850 157,919 136,333 109,629 86,714
Stack gas molecular weight 28.24 28.25 28.26 28.28 28.28 28.33 28.37 28.39 28.41Stack gas N2+Ar mole percentage [%] 74.29 74.36 74.41 74.56 74.56 74.97 75.25 75.36 75.55Stack gas O2 mole percentage [%] 12.45 12.46 12.46 12.49 12.48 12.56 12.6 12.62 12.65Stack gas CO2 mole percentage [%] 3.65 3.66 3.66 3.67 3.67 3.69 3.7 3.71 3.72Stack gas H2O mole percentage [%] 9.61 9.52 9.46 9.29 9.28 8.78 8.44 8.31 8.08
Duct burner exit temperature [F] 1,138 1,136 1,134 1,132 1,130 1,123 1,116 1,113 1,106Exhaust DT across main duct burner [F] 0 0 0 0 0 0 0 0 0Exhaust DT across HPB2 burner [F] 0 0 0 0 0 0 0 0 0
Desert Comparisons; ACC; Low pressure; Low cost
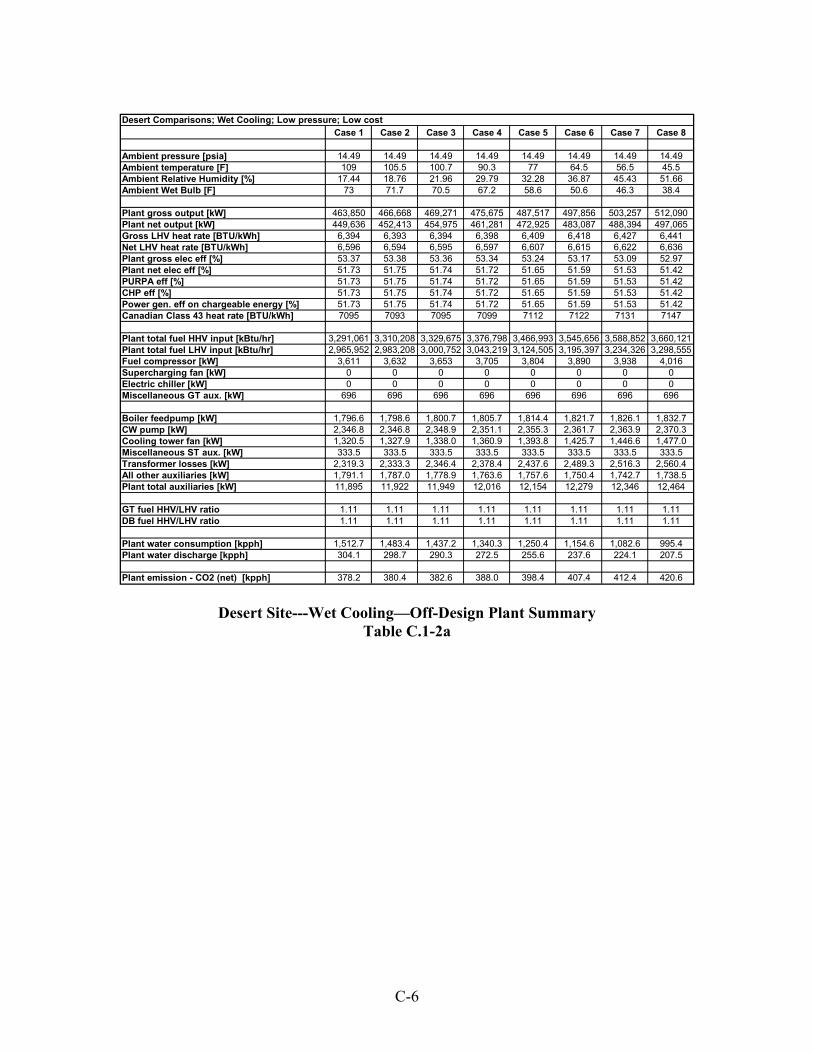
C-6
Desert Site---Wet Cooling—Off-Design Plant Summary
Table C.1-2a
Case 1 Case 2 Case 3 Case 4 Case 5 Case 6 Case 7 Case 8
Ambient pressure [psia] 14.49 14.49 14.49 14.49 14.49 14.49 14.49 14.49Ambient temperature [F] 109 105.5 100.7 90.3 77 64.5 56.5 45.5Ambient Relative Humidity [%] 17.44 18.76 21.96 29.79 32.28 36.87 45.43 51.66Ambient Wet Bulb [F] 73 71.7 70.5 67.2 58.6 50.6 46.3 38.4
Plant gross output [kW] 463,850 466,668 469,271 475,675 487,517 497,856 503,257 512,090Plant net output [kW] 449,636 452,413 454,975 461,281 472,925 483,087 488,394 497,065Gross LHV heat rate [BTU/kWh] 6,394 6,393 6,394 6,398 6,409 6,418 6,427 6,441Net LHV heat rate [BTU/kWh] 6,596 6,594 6,595 6,597 6,607 6,615 6,622 6,636Plant gross elec eff [%] 53.37 53.38 53.36 53.34 53.24 53.17 53.09 52.97Plant net elec eff [%] 51.73 51.75 51.74 51.72 51.65 51.59 51.53 51.42PURPA eff [%] 51.73 51.75 51.74 51.72 51.65 51.59 51.53 51.42CHP eff [%] 51.73 51.75 51.74 51.72 51.65 51.59 51.53 51.42Power gen. eff on chargeable energy [%] 51.73 51.75 51.74 51.72 51.65 51.59 51.53 51.42Canadian Class 43 heat rate [BTU/kWh] 7095 7093 7095 7099 7112 7122 7131 7147
Plant total fuel HHV input [kBtu/hr] 3,291,061 3,310,208 3,329,675 3,376,798 3,466,993 3,545,656 3,588,852 3,660,121Plant total fuel LHV input [kBtu/hr] 2,965,952 2,983,208 3,000,752 3,043,219 3,124,505 3,195,397 3,234,326 3,298,555Fuel compressor [kW] 3,611 3,632 3,653 3,705 3,804 3,890 3,938 4,016Supercharging fan [kW] 0 0 0 0 0 0 0 0Electric chiller [kW] 0 0 0 0 0 0 0 0Miscellaneous GT aux. [kW] 696 696 696 696 696 696 696 696
Boiler feedpump [kW] 1,796.6 1,798.6 1,800.7 1,805.7 1,814.4 1,821.7 1,826.1 1,832.7CW pump [kW] 2,346.8 2,346.8 2,348.9 2,351.1 2,355.3 2,361.7 2,363.9 2,370.3Cooling tower fan [kW] 1,320.5 1,327.9 1,338.0 1,360.9 1,393.8 1,425.7 1,446.6 1,477.0Miscellaneous ST aux. [kW] 333.5 333.5 333.5 333.5 333.5 333.5 333.5 333.5Transformer losses [kW] 2,319.3 2,333.3 2,346.4 2,378.4 2,437.6 2,489.3 2,516.3 2,560.4All other auxiliaries [kW] 1,791.1 1,787.0 1,778.9 1,763.6 1,757.6 1,750.4 1,742.7 1,738.5Plant total auxiliaries [kW] 11,895 11,922 11,949 12,016 12,154 12,279 12,346 12,464
GT fuel HHV/LHV ratio 1.11 1.11 1.11 1.11 1.11 1.11 1.11 1.11DB fuel HHV/LHV ratio 1.11 1.11 1.11 1.11 1.11 1.11 1.11 1.11
Plant water consumption [kpph] 1,512.7 1,483.4 1,437.2 1,340.3 1,250.4 1,154.6 1,082.6 995.4Plant water discharge [kpph] 304.1 298.7 290.3 272.5 255.6 237.6 224.1 207.5
Plant emission - CO2 (net) [kpph] 378.2 380.4 382.6 388.0 398.4 407.4 412.4 420.6
Desert Comparisons; Wet Cooling; Low pressure; Low cost
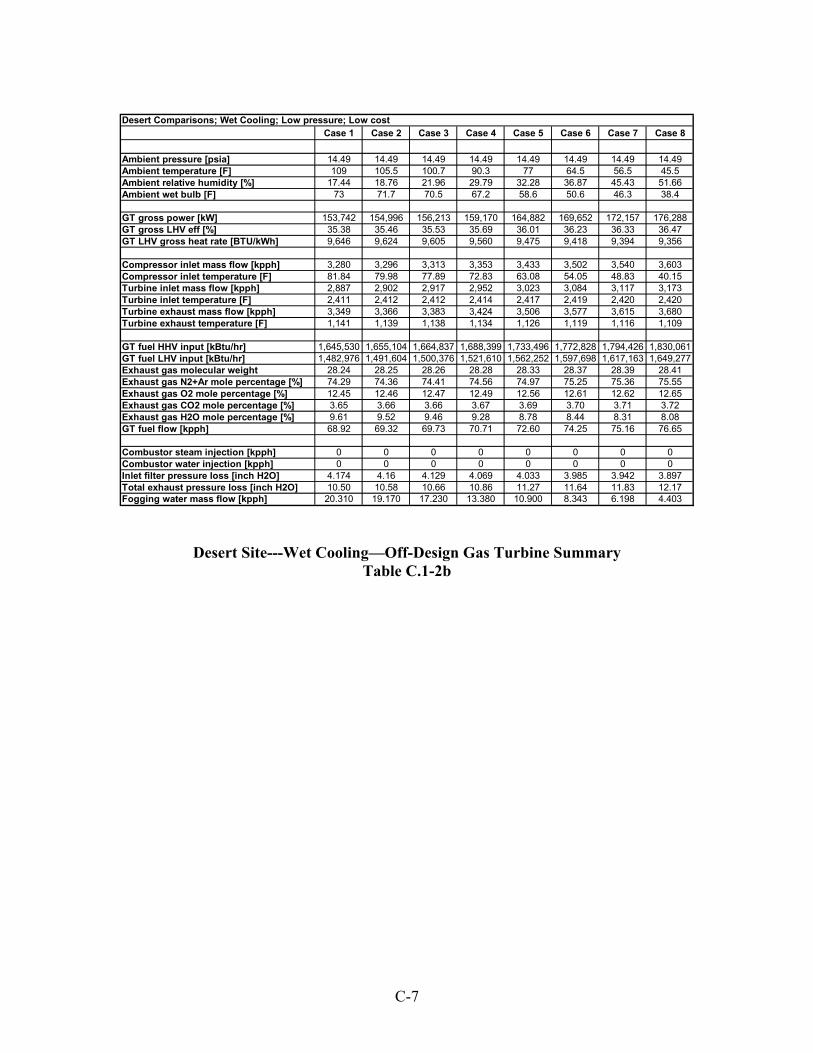
C-7
Desert Site---Wet Cooling—Off-Design Gas Turbine Summary Table C.1-2b
Case 1 Case 2 Case 3 Case 4 Case 5 Case 6 Case 7 Case 8
Ambient pressure [psia] 14.49 14.49 14.49 14.49 14.49 14.49 14.49 14.49Ambient temperature [F] 109 105.5 100.7 90.3 77 64.5 56.5 45.5Ambient relative humidity [%] 17.44 18.76 21.96 29.79 32.28 36.87 45.43 51.66Ambient wet bulb [F] 73 71.7 70.5 67.2 58.6 50.6 46.3 38.4
GT gross power [kW] 153,742 154,996 156,213 159,170 164,882 169,652 172,157 176,288GT gross LHV eff [%] 35.38 35.46 35.53 35.69 36.01 36.23 36.33 36.47GT LHV gross heat rate [BTU/kWh] 9,646 9,624 9,605 9,560 9,475 9,418 9,394 9,356
Compressor inlet mass flow [kpph] 3,280 3,296 3,313 3,353 3,433 3,502 3,540 3,603Compressor inlet temperature [F] 81.84 79.98 77.89 72.83 63.08 54.05 48.83 40.15Turbine inlet mass flow [kpph] 2,887 2,902 2,917 2,952 3,023 3,084 3,117 3,173Turbine inlet temperature [F] 2,411 2,412 2,412 2,414 2,417 2,419 2,420 2,420Turbine exhaust mass flow [kpph] 3,349 3,366 3,383 3,424 3,506 3,577 3,615 3,680Turbine exhaust temperature [F] 1,141 1,139 1,138 1,134 1,126 1,119 1,116 1,109
GT fuel HHV input [kBtu/hr] 1,645,530 1,655,104 1,664,837 1,688,399 1,733,496 1,772,828 1,794,426 1,830,061GT fuel LHV input [kBtu/hr] 1,482,976 1,491,604 1,500,376 1,521,610 1,562,252 1,597,698 1,617,163 1,649,277Exhaust gas molecular weight 28.24 28.25 28.26 28.28 28.33 28.37 28.39 28.41Exhaust gas N2+Ar mole percentage [%] 74.29 74.36 74.41 74.56 74.97 75.25 75.36 75.55Exhaust gas O2 mole percentage [%] 12.45 12.46 12.47 12.49 12.56 12.61 12.62 12.65Exhaust gas CO2 mole percentage [%] 3.65 3.66 3.66 3.67 3.69 3.70 3.71 3.72Exhaust gas H2O mole percentage [%] 9.61 9.52 9.46 9.28 8.78 8.44 8.31 8.08GT fuel flow [kpph] 68.92 69.32 69.73 70.71 72.60 74.25 75.16 76.65
Combustor steam injection [kpph] 0 0 0 0 0 0 0 0Combustor water injection [kpph] 0 0 0 0 0 0 0 0Inlet filter pressure loss [inch H2O] 4.174 4.16 4.129 4.069 4.033 3.985 3.942 3.897Total exhaust pressure loss [inch H2O] 10.50 10.58 10.66 10.86 11.27 11.64 11.83 12.17Fogging water mass flow [kpph] 20.310 19.170 17.230 13.380 10.900 8.343 6.198 4.403
Desert Comparisons; Wet Cooling; Low pressure; Low cost
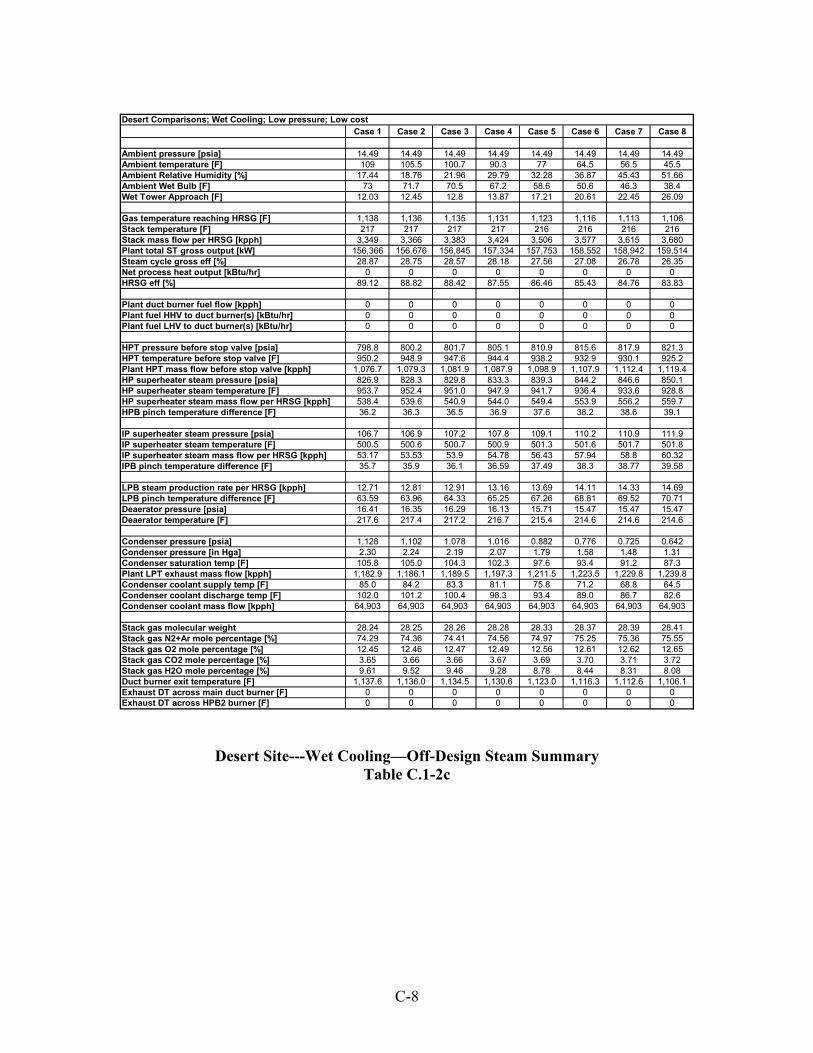
C-8
Desert Site---Wet Cooling—Off-Design Steam Summary Table C.1-2c
Case 1 Case 2 Case 3 Case 4 Case 5 Case 6 Case 7 Case 8
Ambient pressure [psia] 14.49 14.49 14.49 14.49 14.49 14.49 14.49 14.49Ambient temperature [F] 109 105.5 100.7 90.3 77 64.5 56.5 45.5Ambient Relative Humidity [%] 17.44 18.76 21.96 29.79 32.28 36.87 45.43 51.66Ambient Wet Bulb [F] 73 71.7 70.5 67.2 58.6 50.6 46.3 38.4Wet Tower Approach [F] 12.03 12.45 12.8 13.87 17.21 20.61 22.45 26.09
Gas temperature reaching HRSG [F] 1,138 1,136 1,135 1,131 1,123 1,116 1,113 1,106Stack temperature [F] 217 217 217 217 216 216 216 216Stack mass flow per HRSG [kpph] 3,349 3,366 3,383 3,424 3,506 3,577 3,615 3,680Plant total ST gross output [kW] 156,366 156,676 156,845 157,334 157,753 158,552 158,942 159,514Steam cycle gross eff [%] 28.87 28.75 28.57 28.18 27.56 27.08 26.78 26.35Net process heat output [kBtu/hr] 0 0 0 0 0 0 0 0HRSG eff [%] 89.12 88.82 88.42 87.55 86.46 85.43 84.76 83.83
Plant duct burner fuel flow [kpph] 0 0 0 0 0 0 0 0Plant fuel HHV to duct burner(s) [kBtu/hr] 0 0 0 0 0 0 0 0Plant fuel LHV to duct burner(s) [kBtu/hr] 0 0 0 0 0 0 0 0
HPT pressure before stop valve [psia] 798.8 800.2 801.7 805.1 810.9 815.6 817.9 821.3HPT temperature before stop valve [F] 950.2 948.9 947.6 944.4 938.2 932.9 930.1 925.2Plant HPT mass flow before stop valve [kpph] 1,076.7 1,079.3 1,081.9 1,087.9 1,098.9 1,107.9 1,112.4 1,119.4HP superheater steam pressure [psia] 826.9 828.3 829.8 833.3 839.3 844.2 846.6 850.1HP superheater steam temperature [F] 953.7 952.4 951.0 947.9 941.7 936.4 933.6 928.8HP superheater steam mass flow per HRSG [kpph] 538.4 539.6 540.9 544.0 549.4 553.9 556.2 559.7HPB pinch temperature difference [F] 36.2 36.3 36.5 36.9 37.6 38.2 38.6 39.1
IP superheater steam pressure [psia] 106.7 106.9 107.2 107.8 109.1 110.2 110.9 111.9IP superheater steam temperature [F] 500.5 500.6 500.7 500.9 501.3 501.6 501.7 501.8IP superheater steam mass flow per HRSG [kpph] 53.17 53.53 53.9 54.78 56.43 57.94 58.8 60.32IPB pinch temperature difference [F] 35.7 35.9 36.1 36.59 37.49 38.3 38.77 39.58
LPB steam production rate per HRSG [kpph] 12.71 12.81 12.91 13.16 13.69 14.11 14.33 14.69LPB pinch temperature difference [F] 63.59 63.96 64.33 65.25 67.26 68.81 69.52 70.71Deaerator pressure [psia] 16.41 16.35 16.29 16.13 15.71 15.47 15.47 15.47Deaerator temperature [F] 217.6 217.4 217.2 216.7 215.4 214.6 214.6 214.6
Condenser pressure [psia] 1.128 1.102 1.078 1.016 0.882 0.776 0.725 0.642Condenser pressure [in Hga] 2.30 2.24 2.19 2.07 1.79 1.58 1.48 1.31Condenser saturation temp [F] 105.8 105.0 104.3 102.3 97.6 93.4 91.2 87.3Plant LPT exhaust mass flow [kpph] 1,182.9 1,186.1 1,189.5 1,197.3 1,211.5 1,223.5 1,229.8 1,239.8Condenser coolant supply temp [F] 85.0 84.2 83.3 81.1 75.8 71.2 68.8 64.5Condenser coolant discharge temp [F] 102.0 101.2 100.4 98.3 93.4 89.0 86.7 82.6Condenser coolant mass flow [kpph] 64,903 64,903 64,903 64,903 64,903 64,903 64,903 64,903
Stack gas molecular weight 28.24 28.25 28.26 28.28 28.33 28.37 28.39 28.41Stack gas N2+Ar mole percentage [%] 74.29 74.36 74.41 74.56 74.97 75.25 75.36 75.55Stack gas O2 mole percentage [%] 12.45 12.46 12.47 12.49 12.56 12.61 12.62 12.65Stack gas CO2 mole percentage [%] 3.65 3.66 3.66 3.67 3.69 3.70 3.71 3.72Stack gas H2O mole percentage [%] 9.61 9.52 9.46 9.28 8.78 8.44 8.31 8.08Duct burner exit temperature [F] 1,137.6 1,136.0 1,134.5 1,130.6 1,123.0 1,116.3 1,112.6 1,106.1Exhaust DT across main duct burner [F] 0 0 0 0 0 0 0 0Exhaust DT across HPB2 burner [F] 0 0 0 0 0 0 0 0
Desert Comparisons; Wet Cooling; Low pressure; Low cost
C-9
C.2 Valley Site Operation
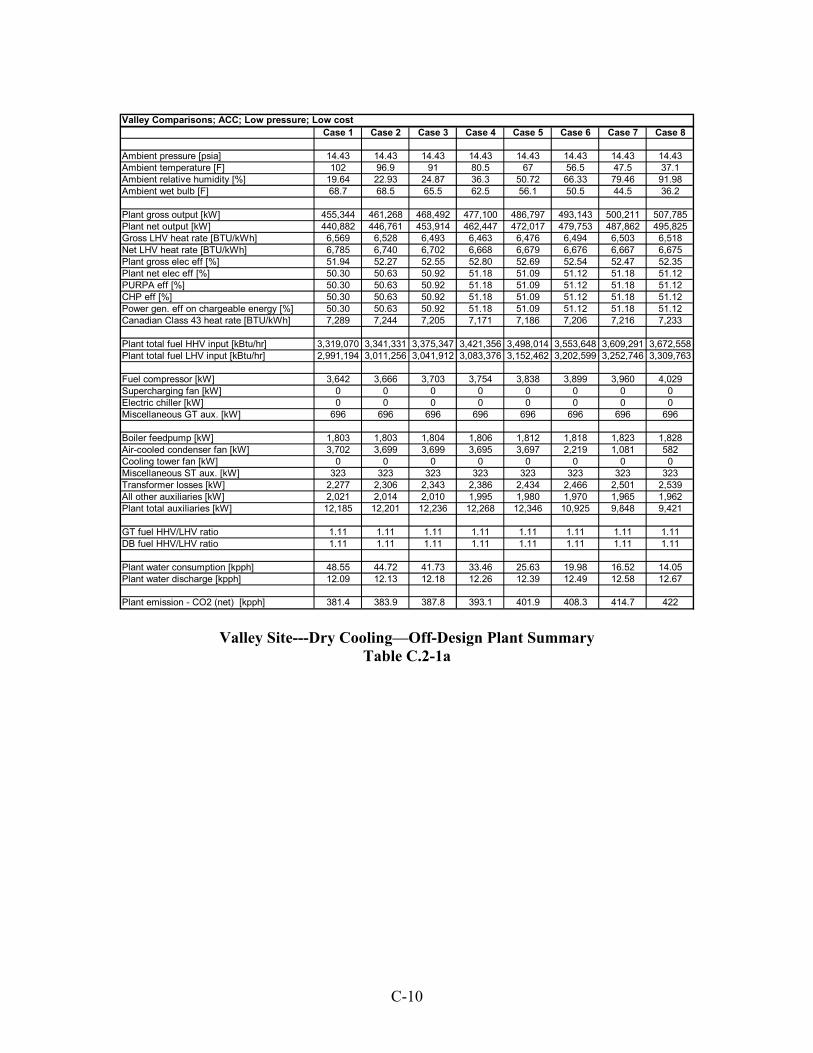
C-10
Valley Site---Dry Cooling—Off-Design Plant Summary
Table C.2-1a
Case 1 Case 2 Case 3 Case 4 Case 5 Case 6 Case 7 Case 8
Ambient pressure [psia] 14.43 14.43 14.43 14.43 14.43 14.43 14.43 14.43Ambient temperature [F] 102 96.9 91 80.5 67 56.5 47.5 37.1Ambient relative humidity [%] 19.64 22.93 24.87 36.3 50.72 66.33 79.46 91.98Ambient wet bulb [F] 68.7 68.5 65.5 62.5 56.1 50.5 44.5 36.2
Plant gross output [kW] 455,344 461,268 468,492 477,100 486,797 493,143 500,211 507,785Plant net output [kW] 440,882 446,761 453,914 462,447 472,017 479,753 487,862 495,825Gross LHV heat rate [BTU/kWh] 6,569 6,528 6,493 6,463 6,476 6,494 6,503 6,518Net LHV heat rate [BTU/kWh] 6,785 6,740 6,702 6,668 6,679 6,676 6,667 6,675Plant gross elec eff [%] 51.94 52.27 52.55 52.80 52.69 52.54 52.47 52.35Plant net elec eff [%] 50.30 50.63 50.92 51.18 51.09 51.12 51.18 51.12PURPA eff [%] 50.30 50.63 50.92 51.18 51.09 51.12 51.18 51.12CHP eff [%] 50.30 50.63 50.92 51.18 51.09 51.12 51.18 51.12Power gen. eff on chargeable energy [%] 50.30 50.63 50.92 51.18 51.09 51.12 51.18 51.12Canadian Class 43 heat rate [BTU/kWh] 7,289 7,244 7,205 7,171 7,186 7,206 7,216 7,233
Plant total fuel HHV input [kBtu/hr] 3,319,070 3,341,331 3,375,347 3,421,356 3,498,014 3,553,648 3,609,291 3,672,558Plant total fuel LHV input [kBtu/hr] 2,991,194 3,011,256 3,041,912 3,083,376 3,152,462 3,202,599 3,252,746 3,309,763
Fuel compressor [kW] 3,642 3,666 3,703 3,754 3,838 3,899 3,960 4,029Supercharging fan [kW] 0 0 0 0 0 0 0 0Electric chiller [kW] 0 0 0 0 0 0 0 0Miscellaneous GT aux. [kW] 696 696 696 696 696 696 696 696
Boiler feedpump [kW] 1,803 1,803 1,804 1,806 1,812 1,818 1,823 1,828Air-cooled condenser fan [kW] 3,702 3,699 3,699 3,695 3,697 2,219 1,081 582Cooling tower fan [kW] 0 0 0 0 0 0 0 0Miscellaneous ST aux. [kW] 323 323 323 323 323 323 323 323Transformer losses [kW] 2,277 2,306 2,343 2,386 2,434 2,466 2,501 2,539All other auxiliaries [kW] 2,021 2,014 2,010 1,995 1,980 1,970 1,965 1,962Plant total auxiliaries [kW] 12,185 12,201 12,236 12,268 12,346 10,925 9,848 9,421
GT fuel HHV/LHV ratio 1.11 1.11 1.11 1.11 1.11 1.11 1.11 1.11DB fuel HHV/LHV ratio 1.11 1.11 1.11 1.11 1.11 1.11 1.11 1.11
Plant water consumption [kpph] 48.55 44.72 41.73 33.46 25.63 19.98 16.52 14.05Plant water discharge [kpph] 12.09 12.13 12.18 12.26 12.39 12.49 12.58 12.67
Plant emission - CO2 (net) [kpph] 381.4 383.9 387.8 393.1 401.9 408.3 414.7 422
Valley Comparisons; ACC; Low pressure; Low cost
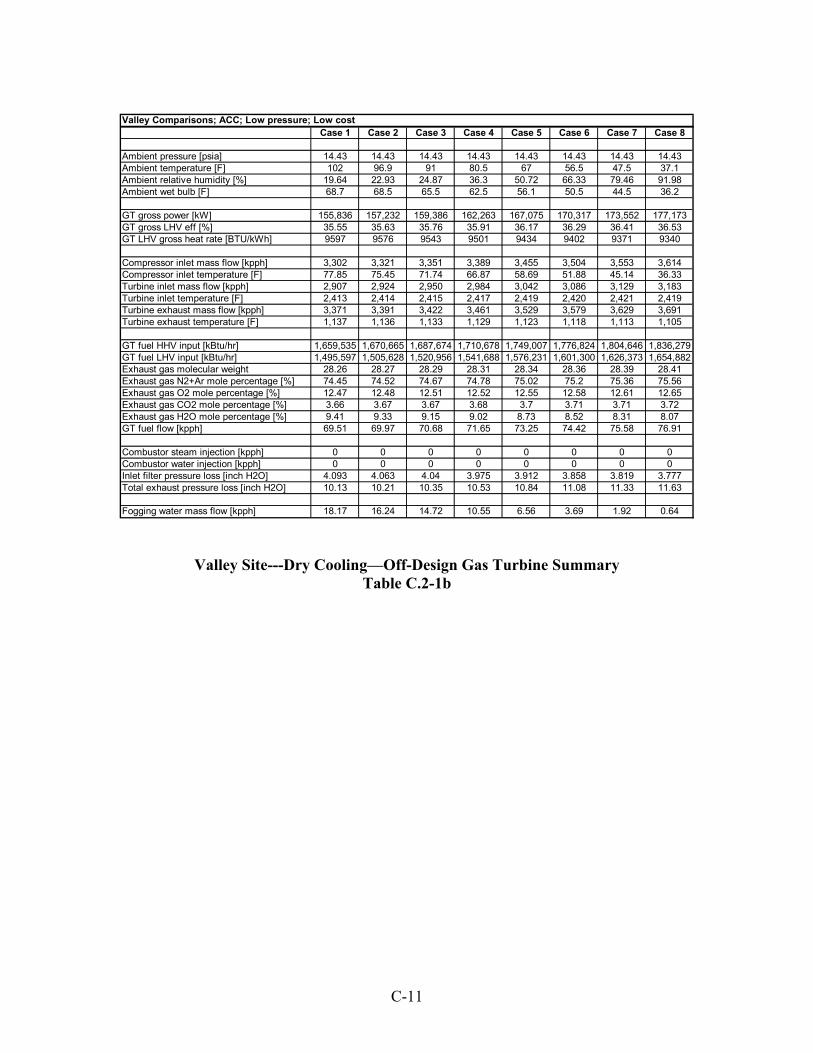
C-11
Valley Site---Dry Cooling—Off-Design Gas Turbine Summary Table C.2-1b
Case 1 Case 2 Case 3 Case 4 Case 5 Case 6 Case 7 Case 8
Ambient pressure [psia] 14.43 14.43 14.43 14.43 14.43 14.43 14.43 14.43Ambient temperature [F] 102 96.9 91 80.5 67 56.5 47.5 37.1Ambient relative humidity [%] 19.64 22.93 24.87 36.3 50.72 66.33 79.46 91.98Ambient wet bulb [F] 68.7 68.5 65.5 62.5 56.1 50.5 44.5 36.2
GT gross power [kW] 155,836 157,232 159,386 162,263 167,075 170,317 173,552 177,173GT gross LHV eff [%] 35.55 35.63 35.76 35.91 36.17 36.29 36.41 36.53GT LHV gross heat rate [BTU/kWh] 9597 9576 9543 9501 9434 9402 9371 9340
Compressor inlet mass flow [kpph] 3,302 3,321 3,351 3,389 3,455 3,504 3,553 3,614Compressor inlet temperature [F] 77.85 75.45 71.74 66.87 58.69 51.88 45.14 36.33Turbine inlet mass flow [kpph] 2,907 2,924 2,950 2,984 3,042 3,086 3,129 3,183Turbine inlet temperature [F] 2,413 2,414 2,415 2,417 2,419 2,420 2,421 2,419Turbine exhaust mass flow [kpph] 3,371 3,391 3,422 3,461 3,529 3,579 3,629 3,691Turbine exhaust temperature [F] 1,137 1,136 1,133 1,129 1,123 1,118 1,113 1,105
GT fuel HHV input [kBtu/hr] 1,659,535 1,670,665 1,687,674 1,710,678 1,749,007 1,776,824 1,804,646 1,836,279GT fuel LHV input [kBtu/hr] 1,495,597 1,505,628 1,520,956 1,541,688 1,576,231 1,601,300 1,626,373 1,654,882Exhaust gas molecular weight 28.26 28.27 28.29 28.31 28.34 28.36 28.39 28.41Exhaust gas N2+Ar mole percentage [%] 74.45 74.52 74.67 74.78 75.02 75.2 75.36 75.56Exhaust gas O2 mole percentage [%] 12.47 12.48 12.51 12.52 12.55 12.58 12.61 12.65Exhaust gas CO2 mole percentage [%] 3.66 3.67 3.67 3.68 3.7 3.71 3.71 3.72Exhaust gas H2O mole percentage [%] 9.41 9.33 9.15 9.02 8.73 8.52 8.31 8.07GT fuel flow [kpph] 69.51 69.97 70.68 71.65 73.25 74.42 75.58 76.91
Combustor steam injection [kpph] 0 0 0 0 0 0 0 0Combustor water injection [kpph] 0 0 0 0 0 0 0 0Inlet filter pressure loss [inch H2O] 4.093 4.063 4.04 3.975 3.912 3.858 3.819 3.777Total exhaust pressure loss [inch H2O] 10.13 10.21 10.35 10.53 10.84 11.08 11.33 11.63
Fogging water mass flow [kpph] 18.17 16.24 14.72 10.55 6.56 3.69 1.92 0.64
Valley Comparisons; ACC; Low pressure; Low cost
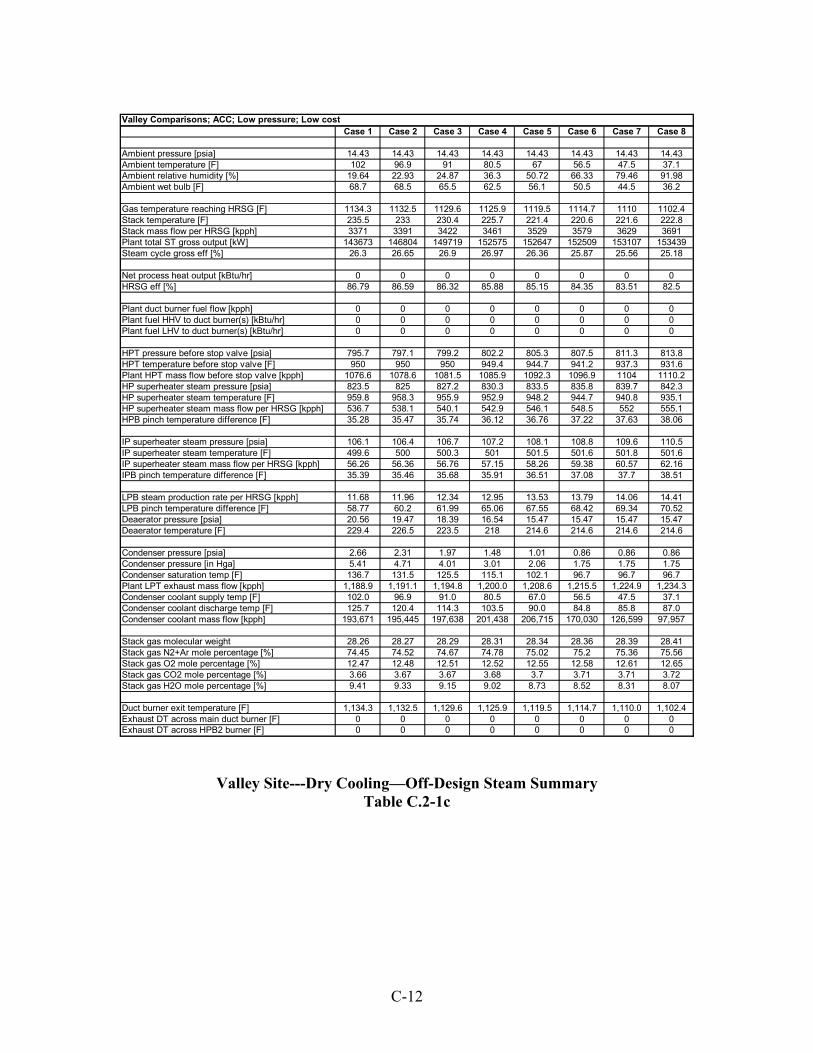
C-12
Valley Site---Dry Cooling—Off-Design Steam Summary Table C.2-1c
Case 1 Case 2 Case 3 Case 4 Case 5 Case 6 Case 7 Case 8
Ambient pressure [psia] 14.43 14.43 14.43 14.43 14.43 14.43 14.43 14.43Ambient temperature [F] 102 96.9 91 80.5 67 56.5 47.5 37.1Ambient relative humidity [%] 19.64 22.93 24.87 36.3 50.72 66.33 79.46 91.98Ambient wet bulb [F] 68.7 68.5 65.5 62.5 56.1 50.5 44.5 36.2
Gas temperature reaching HRSG [F] 1134.3 1132.5 1129.6 1125.9 1119.5 1114.7 1110 1102.4Stack temperature [F] 235.5 233 230.4 225.7 221.4 220.6 221.6 222.8Stack mass flow per HRSG [kpph] 3371 3391 3422 3461 3529 3579 3629 3691Plant total ST gross output [kW] 143673 146804 149719 152575 152647 152509 153107 153439Steam cycle gross eff [%] 26.3 26.65 26.9 26.97 26.36 25.87 25.56 25.18
Net process heat output [kBtu/hr] 0 0 0 0 0 0 0 0HRSG eff [%] 86.79 86.59 86.32 85.88 85.15 84.35 83.51 82.5
Plant duct burner fuel flow [kpph] 0 0 0 0 0 0 0 0Plant fuel HHV to duct burner(s) [kBtu/hr] 0 0 0 0 0 0 0 0Plant fuel LHV to duct burner(s) [kBtu/hr] 0 0 0 0 0 0 0 0
HPT pressure before stop valve [psia] 795.7 797.1 799.2 802.2 805.3 807.5 811.3 813.8HPT temperature before stop valve [F] 950 950 950 949.4 944.7 941.2 937.3 931.6Plant HPT mass flow before stop valve [kpph] 1076.6 1078.6 1081.5 1085.9 1092.3 1096.9 1104 1110.2HP superheater steam pressure [psia] 823.5 825 827.2 830.3 833.5 835.8 839.7 842.3HP superheater steam temperature [F] 959.8 958.3 955.9 952.9 948.2 944.7 940.8 935.1HP superheater steam mass flow per HRSG [kpph] 536.7 538.1 540.1 542.9 546.1 548.5 552 555.1HPB pinch temperature difference [F] 35.28 35.47 35.74 36.12 36.76 37.22 37.63 38.06
IP superheater steam pressure [psia] 106.1 106.4 106.7 107.2 108.1 108.8 109.6 110.5IP superheater steam temperature [F] 499.6 500 500.3 501 501.5 501.6 501.8 501.6IP superheater steam mass flow per HRSG [kpph] 56.26 56.36 56.76 57.15 58.26 59.38 60.57 62.16IPB pinch temperature difference [F] 35.39 35.46 35.68 35.91 36.51 37.08 37.7 38.51
LPB steam production rate per HRSG [kpph] 11.68 11.96 12.34 12.95 13.53 13.79 14.06 14.41LPB pinch temperature difference [F] 58.77 60.2 61.99 65.06 67.55 68.42 69.34 70.52Deaerator pressure [psia] 20.56 19.47 18.39 16.54 15.47 15.47 15.47 15.47Deaerator temperature [F] 229.4 226.5 223.5 218 214.6 214.6 214.6 214.6
Condenser pressure [psia] 2.66 2.31 1.97 1.48 1.01 0.86 0.86 0.86Condenser pressure [in Hga] 5.41 4.71 4.01 3.01 2.06 1.75 1.75 1.75Condenser saturation temp [F] 136.7 131.5 125.5 115.1 102.1 96.7 96.7 96.7Plant LPT exhaust mass flow [kpph] 1,188.9 1,191.1 1,194.8 1,200.0 1,208.6 1,215.5 1,224.9 1,234.3Condenser coolant supply temp [F] 102.0 96.9 91.0 80.5 67.0 56.5 47.5 37.1Condenser coolant discharge temp [F] 125.7 120.4 114.3 103.5 90.0 84.8 85.8 87.0Condenser coolant mass flow [kpph] 193,671 195,445 197,638 201,438 206,715 170,030 126,599 97,957
Stack gas molecular weight 28.26 28.27 28.29 28.31 28.34 28.36 28.39 28.41Stack gas N2+Ar mole percentage [%] 74.45 74.52 74.67 74.78 75.02 75.2 75.36 75.56Stack gas O2 mole percentage [%] 12.47 12.48 12.51 12.52 12.55 12.58 12.61 12.65Stack gas CO2 mole percentage [%] 3.66 3.67 3.67 3.68 3.7 3.71 3.71 3.72Stack gas H2O mole percentage [%] 9.41 9.33 9.15 9.02 8.73 8.52 8.31 8.07
Duct burner exit temperature [F] 1,134.3 1,132.5 1,129.6 1,125.9 1,119.5 1,114.7 1,110.0 1,102.4Exhaust DT across main duct burner [F] 0 0 0 0 0 0 0 0Exhaust DT across HPB2 burner [F] 0 0 0 0 0 0 0 0
Valley Comparisons; ACC; Low pressure; Low cost
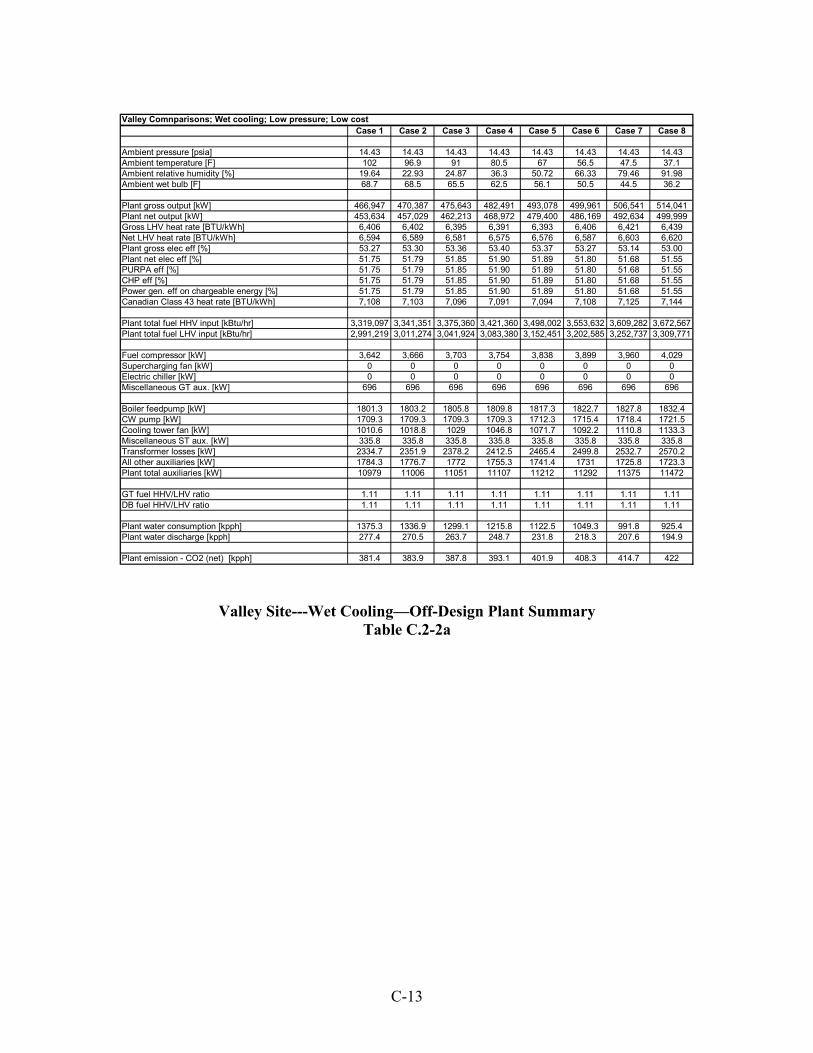
C-13
Valley Site---Wet Cooling—Off-Design Plant Summary Table C.2-2a
Case 1 Case 2 Case 3 Case 4 Case 5 Case 6 Case 7 Case 8
Ambient pressure [psia] 14.43 14.43 14.43 14.43 14.43 14.43 14.43 14.43Ambient temperature [F] 102 96.9 91 80.5 67 56.5 47.5 37.1Ambient relative humidity [%] 19.64 22.93 24.87 36.3 50.72 66.33 79.46 91.98Ambient wet bulb [F] 68.7 68.5 65.5 62.5 56.1 50.5 44.5 36.2
Plant gross output [kW] 466,947 470,387 475,643 482,491 493,078 499,961 506,541 514,041Plant net output [kW] 453,634 457,029 462,213 468,972 479,400 486,169 492,634 499,999Gross LHV heat rate [BTU/kWh] 6,406 6,402 6,395 6,391 6,393 6,406 6,421 6,439Net LHV heat rate [BTU/kWh] 6,594 6,589 6,581 6,575 6,576 6,587 6,603 6,620Plant gross elec eff [%] 53.27 53.30 53.36 53.40 53.37 53.27 53.14 53.00Plant net elec eff [%] 51.75 51.79 51.85 51.90 51.89 51.80 51.68 51.55PURPA eff [%] 51.75 51.79 51.85 51.90 51.89 51.80 51.68 51.55CHP eff [%] 51.75 51.79 51.85 51.90 51.89 51.80 51.68 51.55Power gen. eff on chargeable energy [%] 51.75 51.79 51.85 51.90 51.89 51.80 51.68 51.55Canadian Class 43 heat rate [BTU/kWh] 7,108 7,103 7,096 7,091 7,094 7,108 7,125 7,144
Plant total fuel HHV input [kBtu/hr] 3,319,097 3,341,351 3,375,360 3,421,360 3,498,002 3,553,632 3,609,282 3,672,567Plant total fuel LHV input [kBtu/hr] 2,991,219 3,011,274 3,041,924 3,083,380 3,152,451 3,202,585 3,252,737 3,309,771
Fuel compressor [kW] 3,642 3,666 3,703 3,754 3,838 3,899 3,960 4,029Supercharging fan [kW] 0 0 0 0 0 0 0 0Electric chiller [kW] 0 0 0 0 0 0 0 0Miscellaneous GT aux. [kW] 696 696 696 696 696 696 696 696
Boiler feedpump [kW] 1801.3 1803.2 1805.8 1809.8 1817.3 1822.7 1827.8 1832.4CW pump [kW] 1709.3 1709.3 1709.3 1709.3 1712.3 1715.4 1718.4 1721.5Cooling tower fan [kW] 1010.6 1018.8 1029 1046.8 1071.7 1092.2 1110.8 1133.3Miscellaneous ST aux. [kW] 335.8 335.8 335.8 335.8 335.8 335.8 335.8 335.8Transformer losses [kW] 2334.7 2351.9 2378.2 2412.5 2465.4 2499.8 2532.7 2570.2All other auxiliaries [kW] 1784.3 1776.7 1772 1755.3 1741.4 1731 1725.8 1723.3Plant total auxiliaries [kW] 10979 11006 11051 11107 11212 11292 11375 11472
GT fuel HHV/LHV ratio 1.11 1.11 1.11 1.11 1.11 1.11 1.11 1.11DB fuel HHV/LHV ratio 1.11 1.11 1.11 1.11 1.11 1.11 1.11 1.11
Plant water consumption [kpph] 1375.3 1336.9 1299.1 1215.8 1122.5 1049.3 991.8 925.4Plant water discharge [kpph] 277.4 270.5 263.7 248.7 231.8 218.3 207.6 194.9
Plant emission - CO2 (net) [kpph] 381.4 383.9 387.8 393.1 401.9 408.3 414.7 422
Valley Comnparisons; Wet cooling; Low pressure; Low cost
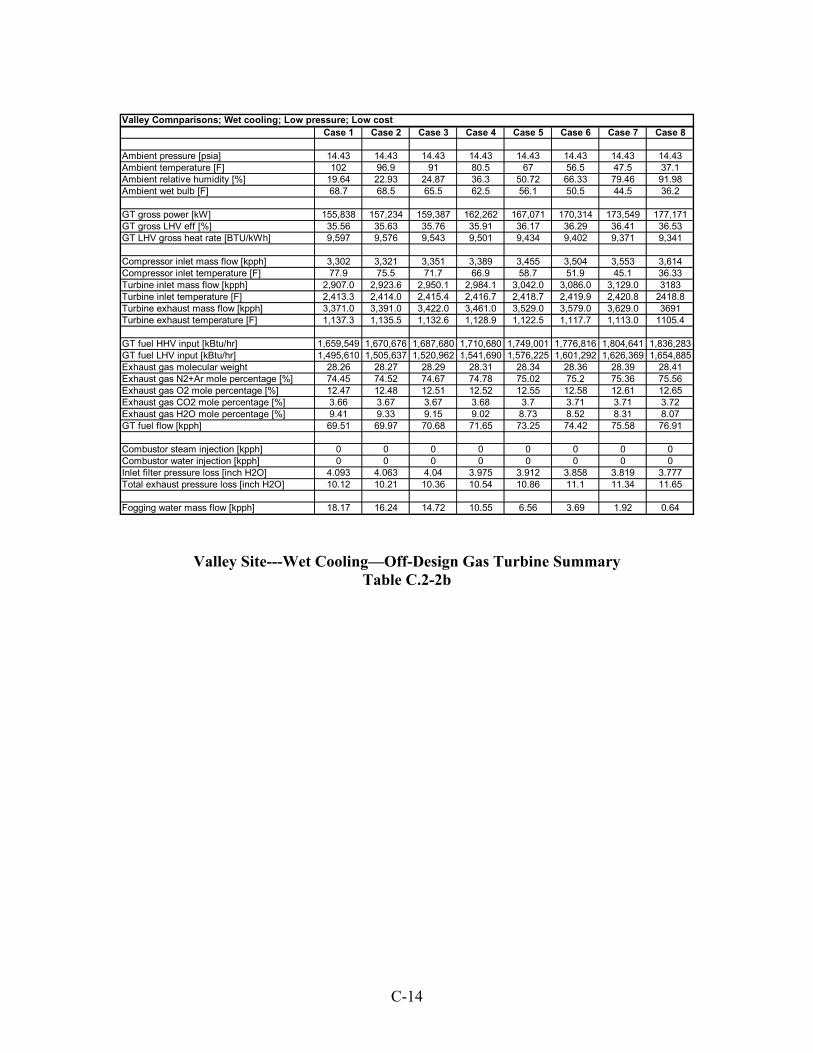
C-14
Valley Site---Wet Cooling—Off-Design Gas Turbine Summary Table C.2-2b
Case 1 Case 2 Case 3 Case 4 Case 5 Case 6 Case 7 Case 8
Ambient pressure [psia] 14.43 14.43 14.43 14.43 14.43 14.43 14.43 14.43Ambient temperature [F] 102 96.9 91 80.5 67 56.5 47.5 37.1Ambient relative humidity [%] 19.64 22.93 24.87 36.3 50.72 66.33 79.46 91.98Ambient wet bulb [F] 68.7 68.5 65.5 62.5 56.1 50.5 44.5 36.2
GT gross power [kW] 155,838 157,234 159,387 162,262 167,071 170,314 173,549 177,171GT gross LHV eff [%] 35.56 35.63 35.76 35.91 36.17 36.29 36.41 36.53GT LHV gross heat rate [BTU/kWh] 9,597 9,576 9,543 9,501 9,434 9,402 9,371 9,341
Compressor inlet mass flow [kpph] 3,302 3,321 3,351 3,389 3,455 3,504 3,553 3,614Compressor inlet temperature [F] 77.9 75.5 71.7 66.9 58.7 51.9 45.1 36.33Turbine inlet mass flow [kpph] 2,907.0 2,923.6 2,950.1 2,984.1 3,042.0 3,086.0 3,129.0 3183Turbine inlet temperature [F] 2,413.3 2,414.0 2,415.4 2,416.7 2,418.7 2,419.9 2,420.8 2418.8Turbine exhaust mass flow [kpph] 3,371.0 3,391.0 3,422.0 3,461.0 3,529.0 3,579.0 3,629.0 3691Turbine exhaust temperature [F] 1,137.3 1,135.5 1,132.6 1,128.9 1,122.5 1,117.7 1,113.0 1105.4
GT fuel HHV input [kBtu/hr] 1,659,549 1,670,676 1,687,680 1,710,680 1,749,001 1,776,816 1,804,641 1,836,283GT fuel LHV input [kBtu/hr] 1,495,610 1,505,637 1,520,962 1,541,690 1,576,225 1,601,292 1,626,369 1,654,885Exhaust gas molecular weight 28.26 28.27 28.29 28.31 28.34 28.36 28.39 28.41Exhaust gas N2+Ar mole percentage [%] 74.45 74.52 74.67 74.78 75.02 75.2 75.36 75.56Exhaust gas O2 mole percentage [%] 12.47 12.48 12.51 12.52 12.55 12.58 12.61 12.65Exhaust gas CO2 mole percentage [%] 3.66 3.67 3.67 3.68 3.7 3.71 3.71 3.72Exhaust gas H2O mole percentage [%] 9.41 9.33 9.15 9.02 8.73 8.52 8.31 8.07GT fuel flow [kpph] 69.51 69.97 70.68 71.65 73.25 74.42 75.58 76.91
Combustor steam injection [kpph] 0 0 0 0 0 0 0 0Combustor water injection [kpph] 0 0 0 0 0 0 0 0Inlet filter pressure loss [inch H2O] 4.093 4.063 4.04 3.975 3.912 3.858 3.819 3.777Total exhaust pressure loss [inch H2O] 10.12 10.21 10.36 10.54 10.86 11.1 11.34 11.65
Fogging water mass flow [kpph] 18.17 16.24 14.72 10.55 6.56 3.69 1.92 0.64
Valley Comnparisons; Wet cooling; Low pressure; Low cost
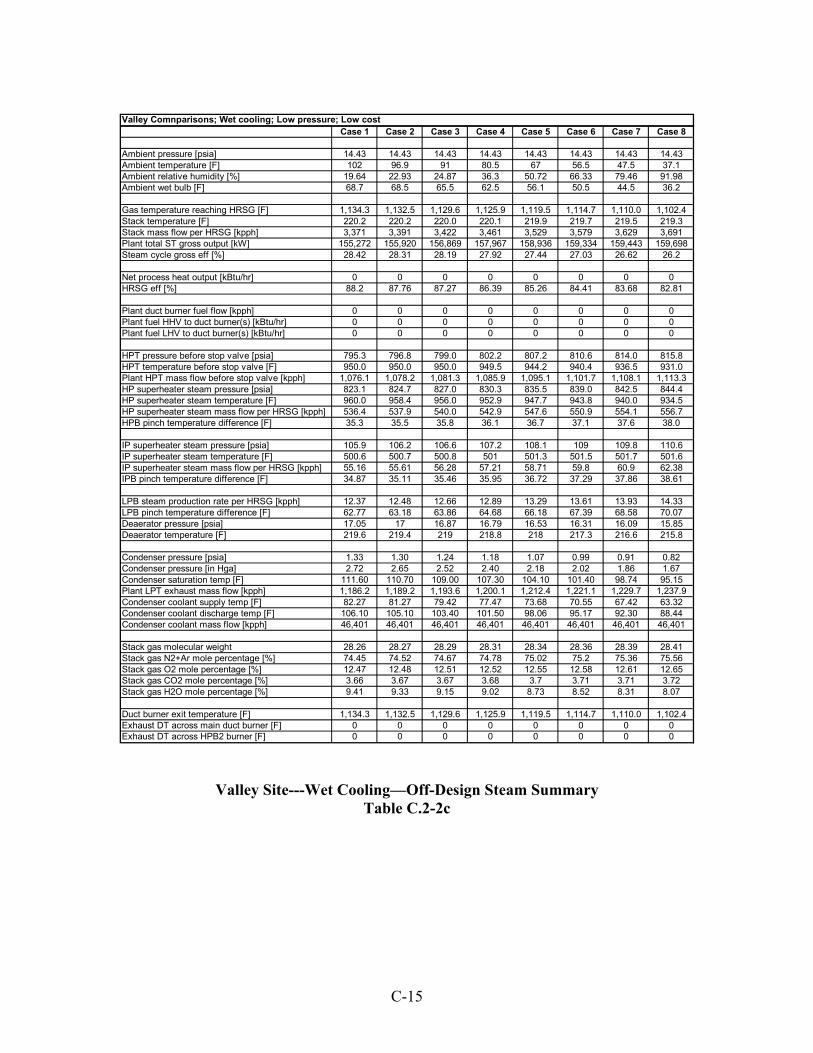
C-15
Valley Site---Wet Cooling—Off-Design Steam Summary Table C.2-2c
Case 1 Case 2 Case 3 Case 4 Case 5 Case 6 Case 7 Case 8
Ambient pressure [psia] 14.43 14.43 14.43 14.43 14.43 14.43 14.43 14.43Ambient temperature [F] 102 96.9 91 80.5 67 56.5 47.5 37.1Ambient relative humidity [%] 19.64 22.93 24.87 36.3 50.72 66.33 79.46 91.98Ambient wet bulb [F] 68.7 68.5 65.5 62.5 56.1 50.5 44.5 36.2
Gas temperature reaching HRSG [F] 1,134.3 1,132.5 1,129.6 1,125.9 1,119.5 1,114.7 1,110.0 1,102.4Stack temperature [F] 220.2 220.2 220.0 220.1 219.9 219.7 219.5 219.3Stack mass flow per HRSG [kpph] 3,371 3,391 3,422 3,461 3,529 3,579 3,629 3,691Plant total ST gross output [kW] 155,272 155,920 156,869 157,967 158,936 159,334 159,443 159,698Steam cycle gross eff [%] 28.42 28.31 28.19 27.92 27.44 27.03 26.62 26.2
Net process heat output [kBtu/hr] 0 0 0 0 0 0 0 0HRSG eff [%] 88.2 87.76 87.27 86.39 85.26 84.41 83.68 82.81
Plant duct burner fuel flow [kpph] 0 0 0 0 0 0 0 0Plant fuel HHV to duct burner(s) [kBtu/hr] 0 0 0 0 0 0 0 0Plant fuel LHV to duct burner(s) [kBtu/hr] 0 0 0 0 0 0 0 0
HPT pressure before stop valve [psia] 795.3 796.8 799.0 802.2 807.2 810.6 814.0 815.8HPT temperature before stop valve [F] 950.0 950.0 950.0 949.5 944.2 940.4 936.5 931.0Plant HPT mass flow before stop valve [kpph] 1,076.1 1,078.2 1,081.3 1,085.9 1,095.1 1,101.7 1,108.1 1,113.3HP superheater steam pressure [psia] 823.1 824.7 827.0 830.3 835.5 839.0 842.5 844.4HP superheater steam temperature [F] 960.0 958.4 956.0 952.9 947.7 943.8 940.0 934.5HP superheater steam mass flow per HRSG [kpph] 536.4 537.9 540.0 542.9 547.6 550.9 554.1 556.7HPB pinch temperature difference [F] 35.3 35.5 35.8 36.1 36.7 37.1 37.6 38.0
IP superheater steam pressure [psia] 105.9 106.2 106.6 107.2 108.1 109 109.8 110.6IP superheater steam temperature [F] 500.6 500.7 500.8 501 501.3 501.5 501.7 501.6IP superheater steam mass flow per HRSG [kpph] 55.16 55.61 56.28 57.21 58.71 59.8 60.9 62.38IPB pinch temperature difference [F] 34.87 35.11 35.46 35.95 36.72 37.29 37.86 38.61
LPB steam production rate per HRSG [kpph] 12.37 12.48 12.66 12.89 13.29 13.61 13.93 14.33LPB pinch temperature difference [F] 62.77 63.18 63.86 64.68 66.18 67.39 68.58 70.07Deaerator pressure [psia] 17.05 17 16.87 16.79 16.53 16.31 16.09 15.85Deaerator temperature [F] 219.6 219.4 219 218.8 218 217.3 216.6 215.8
Condenser pressure [psia] 1.33 1.30 1.24 1.18 1.07 0.99 0.91 0.82Condenser pressure [in Hga] 2.72 2.65 2.52 2.40 2.18 2.02 1.86 1.67Condenser saturation temp [F] 111.60 110.70 109.00 107.30 104.10 101.40 98.74 95.15Plant LPT exhaust mass flow [kpph] 1,186.2 1,189.2 1,193.6 1,200.1 1,212.4 1,221.1 1,229.7 1,237.9Condenser coolant supply temp [F] 82.27 81.27 79.42 77.47 73.68 70.55 67.42 63.32Condenser coolant discharge temp [F] 106.10 105.10 103.40 101.50 98.06 95.17 92.30 88.44Condenser coolant mass flow [kpph] 46,401 46,401 46,401 46,401 46,401 46,401 46,401 46,401
Stack gas molecular weight 28.26 28.27 28.29 28.31 28.34 28.36 28.39 28.41Stack gas N2+Ar mole percentage [%] 74.45 74.52 74.67 74.78 75.02 75.2 75.36 75.56Stack gas O2 mole percentage [%] 12.47 12.48 12.51 12.52 12.55 12.58 12.61 12.65Stack gas CO2 mole percentage [%] 3.66 3.67 3.67 3.68 3.7 3.71 3.71 3.72Stack gas H2O mole percentage [%] 9.41 9.33 9.15 9.02 8.73 8.52 8.31 8.07
Duct burner exit temperature [F] 1,134.3 1,132.5 1,129.6 1,125.9 1,119.5 1,114.7 1,110.0 1,102.4Exhaust DT across main duct burner [F] 0 0 0 0 0 0 0 0Exhaust DT across HPB2 burner [F] 0 0 0 0 0 0 0 0
Valley Comnparisons; Wet cooling; Low pressure; Low cost

C-16
C.3 Coast Site Operation
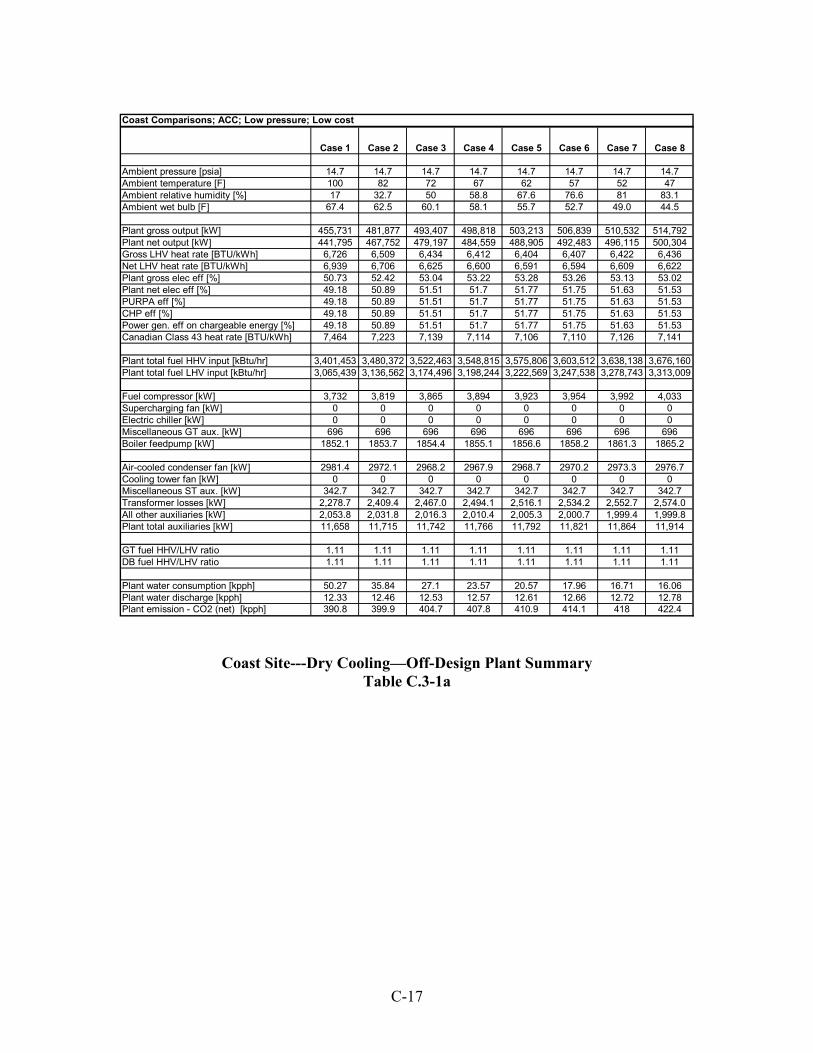
C-17
Coast Site---Dry Cooling—Off-Design Plant Summary Table C.3-1a
Case 1 Case 2 Case 3 Case 4 Case 5 Case 6 Case 7 Case 8
Ambient pressure [psia] 14.7 14.7 14.7 14.7 14.7 14.7 14.7 14.7Ambient temperature [F] 100 82 72 67 62 57 52 47Ambient relative humidity [%] 17 32.7 50 58.8 67.6 76.6 81 83.1Ambient wet bulb [F] 67.4 62.5 60.1 58.1 55.7 52.7 49.0 44.5
Plant gross output [kW] 455,731 481,877 493,407 498,818 503,213 506,839 510,532 514,792Plant net output [kW] 441,795 467,752 479,197 484,559 488,905 492,483 496,115 500,304Gross LHV heat rate [BTU/kWh] 6,726 6,509 6,434 6,412 6,404 6,407 6,422 6,436Net LHV heat rate [BTU/kWh] 6,939 6,706 6,625 6,600 6,591 6,594 6,609 6,622Plant gross elec eff [%] 50.73 52.42 53.04 53.22 53.28 53.26 53.13 53.02Plant net elec eff [%] 49.18 50.89 51.51 51.7 51.77 51.75 51.63 51.53PURPA eff [%] 49.18 50.89 51.51 51.7 51.77 51.75 51.63 51.53CHP eff [%] 49.18 50.89 51.51 51.7 51.77 51.75 51.63 51.53Power gen. eff on chargeable energy [%] 49.18 50.89 51.51 51.7 51.77 51.75 51.63 51.53Canadian Class 43 heat rate [BTU/kWh] 7,464 7,223 7,139 7,114 7,106 7,110 7,126 7,141
Plant total fuel HHV input [kBtu/hr] 3,401,453 3,480,372 3,522,463 3,548,815 3,575,806 3,603,512 3,638,138 3,676,160Plant total fuel LHV input [kBtu/hr] 3,065,439 3,136,562 3,174,496 3,198,244 3,222,569 3,247,538 3,278,743 3,313,009
Fuel compressor [kW] 3,732 3,819 3,865 3,894 3,923 3,954 3,992 4,033Supercharging fan [kW] 0 0 0 0 0 0 0 0Electric chiller [kW] 0 0 0 0 0 0 0 0Miscellaneous GT aux. [kW] 696 696 696 696 696 696 696 696Boiler feedpump [kW] 1852.1 1853.7 1854.4 1855.1 1856.6 1858.2 1861.3 1865.2
Air-cooled condenser fan [kW] 2981.4 2972.1 2968.2 2967.9 2968.7 2970.2 2973.3 2976.7Cooling tower fan [kW] 0 0 0 0 0 0 0 0Miscellaneous ST aux. [kW] 342.7 342.7 342.7 342.7 342.7 342.7 342.7 342.7Transformer losses [kW] 2,278.7 2,409.4 2,467.0 2,494.1 2,516.1 2,534.2 2,552.7 2,574.0All other auxiliaries [kW] 2,053.8 2,031.8 2,016.3 2,010.4 2,005.3 2,000.7 1,999.4 1,999.8Plant total auxiliaries [kW] 11,658 11,715 11,742 11,766 11,792 11,821 11,864 11,914
GT fuel HHV/LHV ratio 1.11 1.11 1.11 1.11 1.11 1.11 1.11 1.11DB fuel HHV/LHV ratio 1.11 1.11 1.11 1.11 1.11 1.11 1.11 1.11
Plant water consumption [kpph] 50.27 35.84 27.1 23.57 20.57 17.96 16.71 16.06Plant water discharge [kpph] 12.33 12.46 12.53 12.57 12.61 12.66 12.72 12.78Plant emission - CO2 (net) [kpph] 390.8 399.9 404.7 407.8 410.9 414.1 418 422.4
Coast Comparisons; ACC; Low pressure; Low cost
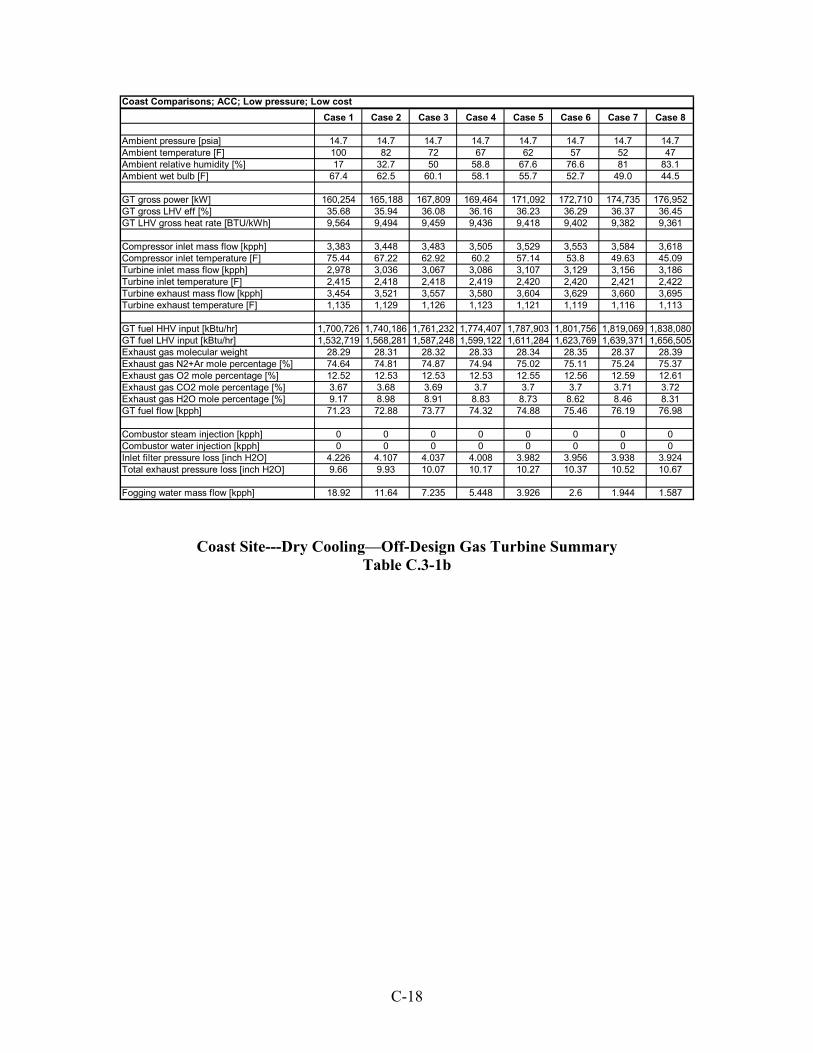
C-18
Coast Site---Dry Cooling—Off-Design Gas Turbine Summary Table C.3-1b
Case 1 Case 2 Case 3 Case 4 Case 5 Case 6 Case 7 Case 8
Ambient pressure [psia] 14.7 14.7 14.7 14.7 14.7 14.7 14.7 14.7Ambient temperature [F] 100 82 72 67 62 57 52 47Ambient relative humidity [%] 17 32.7 50 58.8 67.6 76.6 81 83.1Ambient wet bulb [F] 67.4 62.5 60.1 58.1 55.7 52.7 49.0 44.5
GT gross power [kW] 160,254 165,188 167,809 169,464 171,092 172,710 174,735 176,952GT gross LHV eff [%] 35.68 35.94 36.08 36.16 36.23 36.29 36.37 36.45GT LHV gross heat rate [BTU/kWh] 9,564 9,494 9,459 9,436 9,418 9,402 9,382 9,361
Compressor inlet mass flow [kpph] 3,383 3,448 3,483 3,505 3,529 3,553 3,584 3,618Compressor inlet temperature [F] 75.44 67.22 62.92 60.2 57.14 53.8 49.63 45.09Turbine inlet mass flow [kpph] 2,978 3,036 3,067 3,086 3,107 3,129 3,156 3,186Turbine inlet temperature [F] 2,415 2,418 2,418 2,419 2,420 2,420 2,421 2,422Turbine exhaust mass flow [kpph] 3,454 3,521 3,557 3,580 3,604 3,629 3,660 3,695Turbine exhaust temperature [F] 1,135 1,129 1,126 1,123 1,121 1,119 1,116 1,113
GT fuel HHV input [kBtu/hr] 1,700,726 1,740,186 1,761,232 1,774,407 1,787,903 1,801,756 1,819,069 1,838,080GT fuel LHV input [kBtu/hr] 1,532,719 1,568,281 1,587,248 1,599,122 1,611,284 1,623,769 1,639,371 1,656,505Exhaust gas molecular weight 28.29 28.31 28.32 28.33 28.34 28.35 28.37 28.39Exhaust gas N2+Ar mole percentage [%] 74.64 74.81 74.87 74.94 75.02 75.11 75.24 75.37Exhaust gas O2 mole percentage [%] 12.52 12.53 12.53 12.53 12.55 12.56 12.59 12.61Exhaust gas CO2 mole percentage [%] 3.67 3.68 3.69 3.7 3.7 3.7 3.71 3.72Exhaust gas H2O mole percentage [%] 9.17 8.98 8.91 8.83 8.73 8.62 8.46 8.31GT fuel flow [kpph] 71.23 72.88 73.77 74.32 74.88 75.46 76.19 76.98
Combustor steam injection [kpph] 0 0 0 0 0 0 0 0Combustor water injection [kpph] 0 0 0 0 0 0 0 0Inlet filter pressure loss [inch H2O] 4.226 4.107 4.037 4.008 3.982 3.956 3.938 3.924Total exhaust pressure loss [inch H2O] 9.66 9.93 10.07 10.17 10.27 10.37 10.52 10.67
Fogging water mass flow [kpph] 18.92 11.64 7.235 5.448 3.926 2.6 1.944 1.587
Coast Comparisons; ACC; Low pressure; Low cost
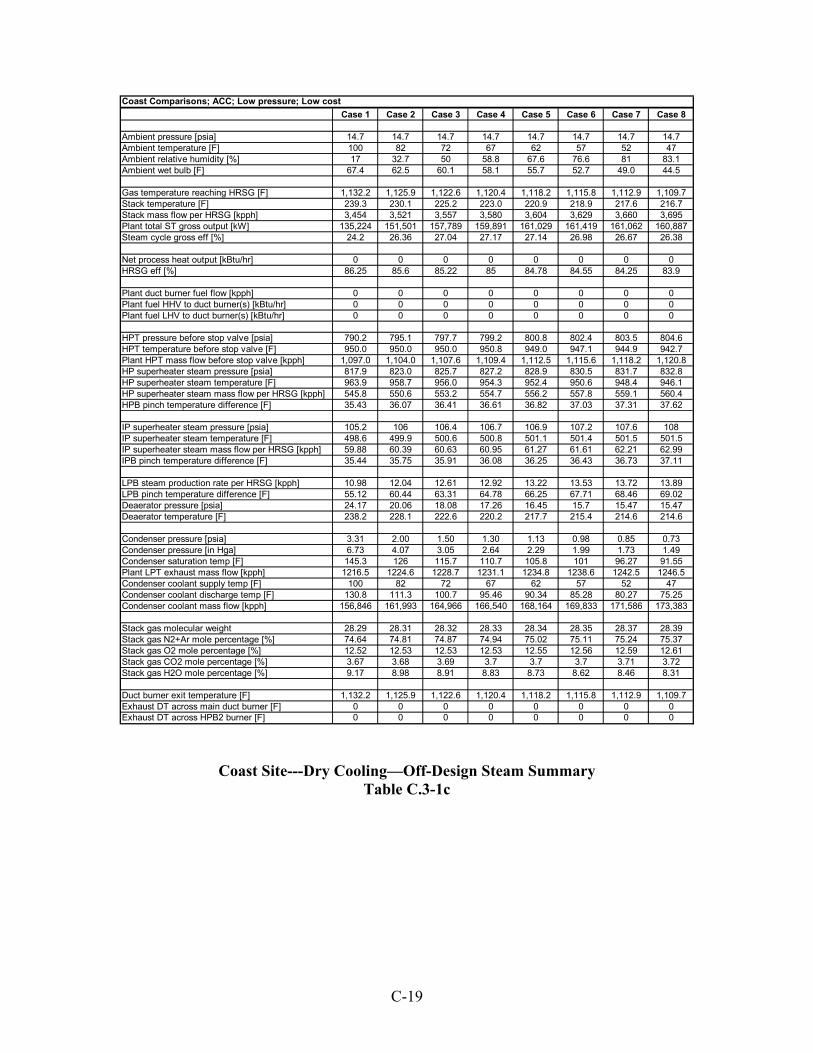
C-19
Coast Site---Dry Cooling—Off-Design Steam Summary Table C.3-1c
Case 1 Case 2 Case 3 Case 4 Case 5 Case 6 Case 7 Case 8
Ambient pressure [psia] 14.7 14.7 14.7 14.7 14.7 14.7 14.7 14.7Ambient temperature [F] 100 82 72 67 62 57 52 47Ambient relative humidity [%] 17 32.7 50 58.8 67.6 76.6 81 83.1Ambient wet bulb [F] 67.4 62.5 60.1 58.1 55.7 52.7 49.0 44.5
Gas temperature reaching HRSG [F] 1,132.2 1,125.9 1,122.6 1,120.4 1,118.2 1,115.8 1,112.9 1,109.7Stack temperature [F] 239.3 230.1 225.2 223.0 220.9 218.9 217.6 216.7Stack mass flow per HRSG [kpph] 3,454 3,521 3,557 3,580 3,604 3,629 3,660 3,695Plant total ST gross output [kW] 135,224 151,501 157,789 159,891 161,029 161,419 161,062 160,887Steam cycle gross eff [%] 24.2 26.36 27.04 27.17 27.14 26.98 26.67 26.38
Net process heat output [kBtu/hr] 0 0 0 0 0 0 0 0HRSG eff [%] 86.25 85.6 85.22 85 84.78 84.55 84.25 83.9
Plant duct burner fuel flow [kpph] 0 0 0 0 0 0 0 0Plant fuel HHV to duct burner(s) [kBtu/hr] 0 0 0 0 0 0 0 0Plant fuel LHV to duct burner(s) [kBtu/hr] 0 0 0 0 0 0 0 0
HPT pressure before stop valve [psia] 790.2 795.1 797.7 799.2 800.8 802.4 803.5 804.6HPT temperature before stop valve [F] 950.0 950.0 950.0 950.8 949.0 947.1 944.9 942.7Plant HPT mass flow before stop valve [kpph] 1,097.0 1,104.0 1,107.6 1,109.4 1,112.5 1,115.6 1,118.2 1,120.8HP superheater steam pressure [psia] 817.9 823.0 825.7 827.2 828.9 830.5 831.7 832.8HP superheater steam temperature [F] 963.9 958.7 956.0 954.3 952.4 950.6 948.4 946.1HP superheater steam mass flow per HRSG [kpph] 545.8 550.6 553.2 554.7 556.2 557.8 559.1 560.4HPB pinch temperature difference [F] 35.43 36.07 36.41 36.61 36.82 37.03 37.31 37.62
IP superheater steam pressure [psia] 105.2 106 106.4 106.7 106.9 107.2 107.6 108IP superheater steam temperature [F] 498.6 499.9 500.6 500.8 501.1 501.4 501.5 501.5IP superheater steam mass flow per HRSG [kpph] 59.88 60.39 60.63 60.95 61.27 61.61 62.21 62.99IPB pinch temperature difference [F] 35.44 35.75 35.91 36.08 36.25 36.43 36.73 37.11
LPB steam production rate per HRSG [kpph] 10.98 12.04 12.61 12.92 13.22 13.53 13.72 13.89LPB pinch temperature difference [F] 55.12 60.44 63.31 64.78 66.25 67.71 68.46 69.02Deaerator pressure [psia] 24.17 20.06 18.08 17.26 16.45 15.7 15.47 15.47Deaerator temperature [F] 238.2 228.1 222.6 220.2 217.7 215.4 214.6 214.6
Condenser pressure [psia] 3.31 2.00 1.50 1.30 1.13 0.98 0.85 0.73Condenser pressure [in Hga] 6.73 4.07 3.05 2.64 2.29 1.99 1.73 1.49Condenser saturation temp [F] 145.3 126 115.7 110.7 105.8 101 96.27 91.55Plant LPT exhaust mass flow [kpph] 1216.5 1224.6 1228.7 1231.1 1234.8 1238.6 1242.5 1246.5Condenser coolant supply temp [F] 100 82 72 67 62 57 52 47Condenser coolant discharge temp [F] 130.8 111.3 100.7 95.46 90.34 85.28 80.27 75.25Condenser coolant mass flow [kpph] 156,846 161,993 164,966 166,540 168,164 169,833 171,586 173,383
Stack gas molecular weight 28.29 28.31 28.32 28.33 28.34 28.35 28.37 28.39Stack gas N2+Ar mole percentage [%] 74.64 74.81 74.87 74.94 75.02 75.11 75.24 75.37Stack gas O2 mole percentage [%] 12.52 12.53 12.53 12.53 12.55 12.56 12.59 12.61Stack gas CO2 mole percentage [%] 3.67 3.68 3.69 3.7 3.7 3.7 3.71 3.72Stack gas H2O mole percentage [%] 9.17 8.98 8.91 8.83 8.73 8.62 8.46 8.31
Duct burner exit temperature [F] 1,132.2 1,125.9 1,122.6 1,120.4 1,118.2 1,115.8 1,112.9 1,109.7Exhaust DT across main duct burner [F] 0 0 0 0 0 0 0 0Exhaust DT across HPB2 burner [F] 0 0 0 0 0 0 0 0
Coast Comparisons; ACC; Low pressure; Low cost
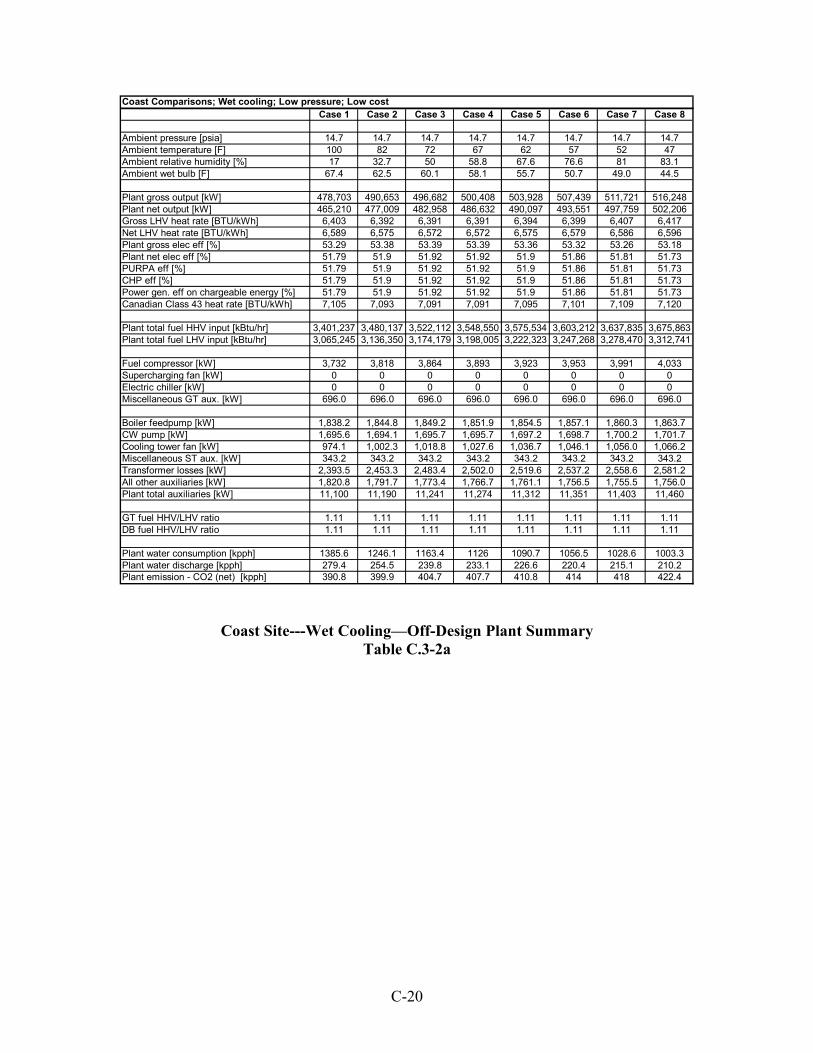
C-20
Coast Site---Wet Cooling—Off-Design Plant Summary Table C.3-2a
Case 1 Case 2 Case 3 Case 4 Case 5 Case 6 Case 7 Case 8
Ambient pressure [psia] 14.7 14.7 14.7 14.7 14.7 14.7 14.7 14.7Ambient temperature [F] 100 82 72 67 62 57 52 47Ambient relative humidity [%] 17 32.7 50 58.8 67.6 76.6 81 83.1Ambient wet bulb [F] 67.4 62.5 60.1 58.1 55.7 50.7 49.0 44.5
Plant gross output [kW] 478,703 490,653 496,682 500,408 503,928 507,439 511,721 516,248Plant net output [kW] 465,210 477,009 482,958 486,632 490,097 493,551 497,759 502,206Gross LHV heat rate [BTU/kWh] 6,403 6,392 6,391 6,391 6,394 6,399 6,407 6,417Net LHV heat rate [BTU/kWh] 6,589 6,575 6,572 6,572 6,575 6,579 6,586 6,596Plant gross elec eff [%] 53.29 53.38 53.39 53.39 53.36 53.32 53.26 53.18Plant net elec eff [%] 51.79 51.9 51.92 51.92 51.9 51.86 51.81 51.73PURPA eff [%] 51.79 51.9 51.92 51.92 51.9 51.86 51.81 51.73CHP eff [%] 51.79 51.9 51.92 51.92 51.9 51.86 51.81 51.73Power gen. eff on chargeable energy [%] 51.79 51.9 51.92 51.92 51.9 51.86 51.81 51.73Canadian Class 43 heat rate [BTU/kWh] 7,105 7,093 7,091 7,091 7,095 7,101 7,109 7,120
Plant total fuel HHV input [kBtu/hr] 3,401,237 3,480,137 3,522,112 3,548,550 3,575,534 3,603,212 3,637,835 3,675,863Plant total fuel LHV input [kBtu/hr] 3,065,245 3,136,350 3,174,179 3,198,005 3,222,323 3,247,268 3,278,470 3,312,741
Fuel compressor [kW] 3,732 3,818 3,864 3,893 3,923 3,953 3,991 4,033Supercharging fan [kW] 0 0 0 0 0 0 0 0Electric chiller [kW] 0 0 0 0 0 0 0 0Miscellaneous GT aux. [kW] 696.0 696.0 696.0 696.0 696.0 696.0 696.0 696.0
Boiler feedpump [kW] 1,838.2 1,844.8 1,849.2 1,851.9 1,854.5 1,857.1 1,860.3 1,863.7CW pump [kW] 1,695.6 1,694.1 1,695.7 1,695.7 1,697.2 1,698.7 1,700.2 1,701.7Cooling tower fan [kW] 974.1 1,002.3 1,018.8 1,027.6 1,036.7 1,046.1 1,056.0 1,066.2Miscellaneous ST aux. [kW] 343.2 343.2 343.2 343.2 343.2 343.2 343.2 343.2Transformer losses [kW] 2,393.5 2,453.3 2,483.4 2,502.0 2,519.6 2,537.2 2,558.6 2,581.2All other auxiliaries [kW] 1,820.8 1,791.7 1,773.4 1,766.7 1,761.1 1,756.5 1,755.5 1,756.0Plant total auxiliaries [kW] 11,100 11,190 11,241 11,274 11,312 11,351 11,403 11,460
GT fuel HHV/LHV ratio 1.11 1.11 1.11 1.11 1.11 1.11 1.11 1.11DB fuel HHV/LHV ratio 1.11 1.11 1.11 1.11 1.11 1.11 1.11 1.11
Plant water consumption [kpph] 1385.6 1246.1 1163.4 1126 1090.7 1056.5 1028.6 1003.3Plant water discharge [kpph] 279.4 254.5 239.8 233.1 226.6 220.4 215.1 210.2Plant emission - CO2 (net) [kpph] 390.8 399.9 404.7 407.7 410.8 414 418 422.4
Coast Comparisons; Wet cooling; Low pressure; Low cost
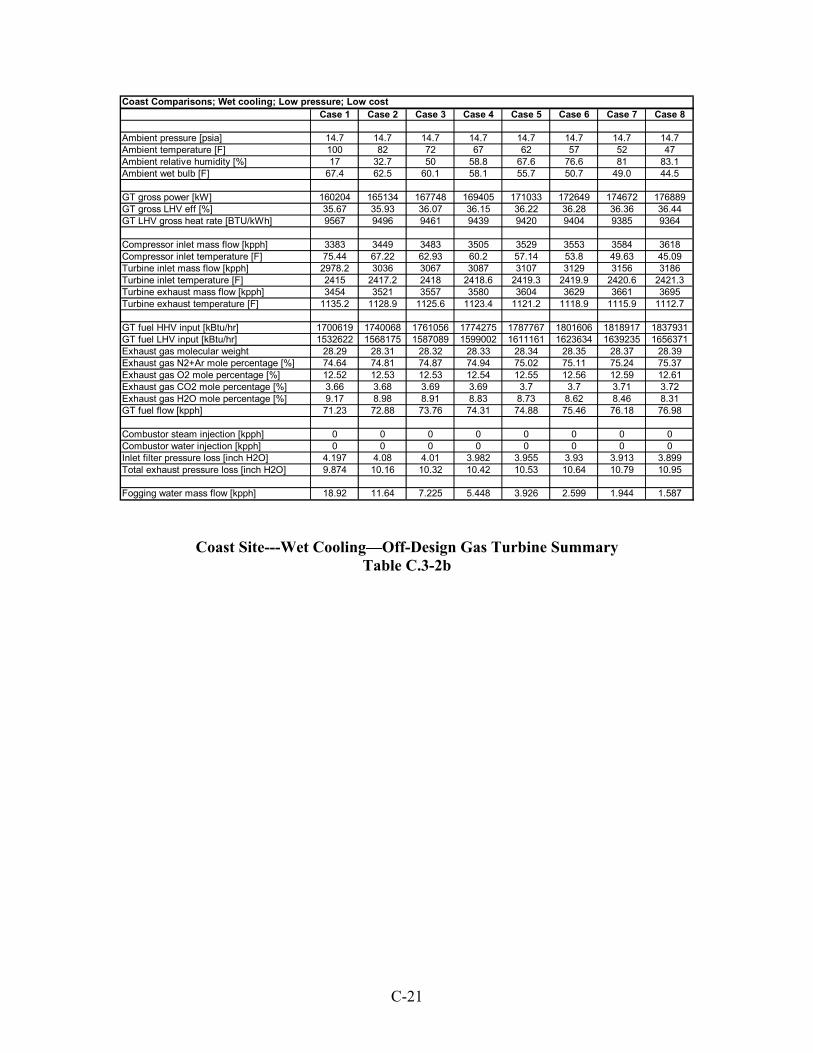
C-21
Coast Site---Wet Cooling—Off-Design Gas Turbine Summary Table C.3-2b
Case 1 Case 2 Case 3 Case 4 Case 5 Case 6 Case 7 Case 8
Ambient pressure [psia] 14.7 14.7 14.7 14.7 14.7 14.7 14.7 14.7Ambient temperature [F] 100 82 72 67 62 57 52 47Ambient relative humidity [%] 17 32.7 50 58.8 67.6 76.6 81 83.1Ambient wet bulb [F] 67.4 62.5 60.1 58.1 55.7 50.7 49.0 44.5
GT gross power [kW] 160204 165134 167748 169405 171033 172649 174672 176889GT gross LHV eff [%] 35.67 35.93 36.07 36.15 36.22 36.28 36.36 36.44GT LHV gross heat rate [BTU/kWh] 9567 9496 9461 9439 9420 9404 9385 9364
Compressor inlet mass flow [kpph] 3383 3449 3483 3505 3529 3553 3584 3618Compressor inlet temperature [F] 75.44 67.22 62.93 60.2 57.14 53.8 49.63 45.09Turbine inlet mass flow [kpph] 2978.2 3036 3067 3087 3107 3129 3156 3186Turbine inlet temperature [F] 2415 2417.2 2418 2418.6 2419.3 2419.9 2420.6 2421.3Turbine exhaust mass flow [kpph] 3454 3521 3557 3580 3604 3629 3661 3695Turbine exhaust temperature [F] 1135.2 1128.9 1125.6 1123.4 1121.2 1118.9 1115.9 1112.7
GT fuel HHV input [kBtu/hr] 1700619 1740068 1761056 1774275 1787767 1801606 1818917 1837931GT fuel LHV input [kBtu/hr] 1532622 1568175 1587089 1599002 1611161 1623634 1639235 1656371Exhaust gas molecular weight 28.29 28.31 28.32 28.33 28.34 28.35 28.37 28.39Exhaust gas N2+Ar mole percentage [%] 74.64 74.81 74.87 74.94 75.02 75.11 75.24 75.37Exhaust gas O2 mole percentage [%] 12.52 12.53 12.53 12.54 12.55 12.56 12.59 12.61Exhaust gas CO2 mole percentage [%] 3.66 3.68 3.69 3.69 3.7 3.7 3.71 3.72Exhaust gas H2O mole percentage [%] 9.17 8.98 8.91 8.83 8.73 8.62 8.46 8.31GT fuel flow [kpph] 71.23 72.88 73.76 74.31 74.88 75.46 76.18 76.98
Combustor steam injection [kpph] 0 0 0 0 0 0 0 0Combustor water injection [kpph] 0 0 0 0 0 0 0 0Inlet filter pressure loss [inch H2O] 4.197 4.08 4.01 3.982 3.955 3.93 3.913 3.899Total exhaust pressure loss [inch H2O] 9.874 10.16 10.32 10.42 10.53 10.64 10.79 10.95
Fogging water mass flow [kpph] 18.92 11.64 7.225 5.448 3.926 2.599 1.944 1.587
Coast Comparisons; Wet cooling; Low pressure; Low cost
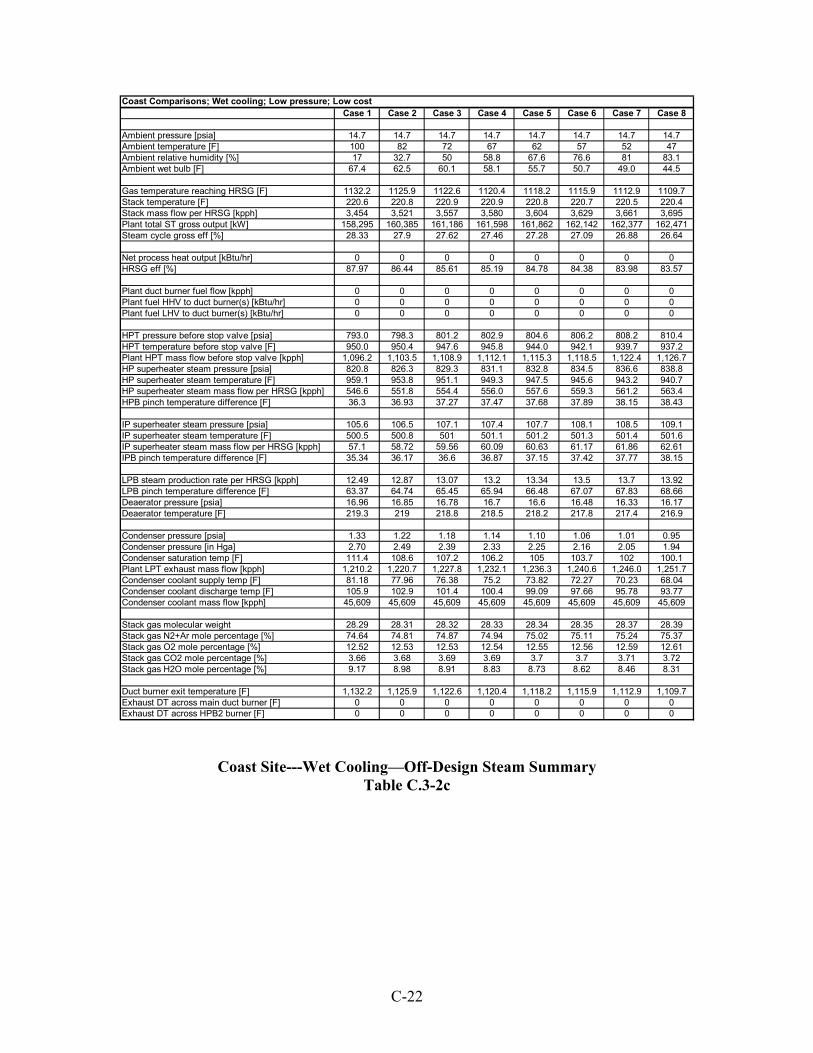
C-22
Coast Site---Wet Cooling—Off-Design Steam Summary Table C.3-2c
Case 1 Case 2 Case 3 Case 4 Case 5 Case 6 Case 7 Case 8
Ambient pressure [psia] 14.7 14.7 14.7 14.7 14.7 14.7 14.7 14.7Ambient temperature [F] 100 82 72 67 62 57 52 47Ambient relative humidity [%] 17 32.7 50 58.8 67.6 76.6 81 83.1Ambient wet bulb [F] 67.4 62.5 60.1 58.1 55.7 50.7 49.0 44.5
Gas temperature reaching HRSG [F] 1132.2 1125.9 1122.6 1120.4 1118.2 1115.9 1112.9 1109.7Stack temperature [F] 220.6 220.8 220.9 220.9 220.8 220.7 220.5 220.4Stack mass flow per HRSG [kpph] 3,454 3,521 3,557 3,580 3,604 3,629 3,661 3,695Plant total ST gross output [kW] 158,295 160,385 161,186 161,598 161,862 162,142 162,377 162,471Steam cycle gross eff [%] 28.33 27.9 27.62 27.46 27.28 27.09 26.88 26.64
Net process heat output [kBtu/hr] 0 0 0 0 0 0 0 0HRSG eff [%] 87.97 86.44 85.61 85.19 84.78 84.38 83.98 83.57
Plant duct burner fuel flow [kpph] 0 0 0 0 0 0 0 0Plant fuel HHV to duct burner(s) [kBtu/hr] 0 0 0 0 0 0 0 0Plant fuel LHV to duct burner(s) [kBtu/hr] 0 0 0 0 0 0 0 0
HPT pressure before stop valve [psia] 793.0 798.3 801.2 802.9 804.6 806.2 808.2 810.4HPT temperature before stop valve [F] 950.0 950.4 947.6 945.8 944.0 942.1 939.7 937.2Plant HPT mass flow before stop valve [kpph] 1,096.2 1,103.5 1,108.9 1,112.1 1,115.3 1,118.5 1,122.4 1,126.7HP superheater steam pressure [psia] 820.8 826.3 829.3 831.1 832.8 834.5 836.6 838.8HP superheater steam temperature [F] 959.1 953.8 951.1 949.3 947.5 945.6 943.2 940.7HP superheater steam mass flow per HRSG [kpph] 546.6 551.8 554.4 556.0 557.6 559.3 561.2 563.4HPB pinch temperature difference [F] 36.3 36.93 37.27 37.47 37.68 37.89 38.15 38.43
IP superheater steam pressure [psia] 105.6 106.5 107.1 107.4 107.7 108.1 108.5 109.1IP superheater steam temperature [F] 500.5 500.8 501 501.1 501.2 501.3 501.4 501.6IP superheater steam mass flow per HRSG [kpph] 57.1 58.72 59.56 60.09 60.63 61.17 61.86 62.61IPB pinch temperature difference [F] 35.34 36.17 36.6 36.87 37.15 37.42 37.77 38.15
LPB steam production rate per HRSG [kpph] 12.49 12.87 13.07 13.2 13.34 13.5 13.7 13.92LPB pinch temperature difference [F] 63.37 64.74 65.45 65.94 66.48 67.07 67.83 68.66Deaerator pressure [psia] 16.96 16.85 16.78 16.7 16.6 16.48 16.33 16.17Deaerator temperature [F] 219.3 219 218.8 218.5 218.2 217.8 217.4 216.9
Condenser pressure [psia] 1.33 1.22 1.18 1.14 1.10 1.06 1.01 0.95Condenser pressure [in Hga] 2.70 2.49 2.39 2.33 2.25 2.16 2.05 1.94Condenser saturation temp [F] 111.4 108.6 107.2 106.2 105 103.7 102 100.1Plant LPT exhaust mass flow [kpph] 1,210.2 1,220.7 1,227.8 1,232.1 1,236.3 1,240.6 1,246.0 1,251.7Condenser coolant supply temp [F] 81.18 77.96 76.38 75.2 73.82 72.27 70.23 68.04Condenser coolant discharge temp [F] 105.9 102.9 101.4 100.4 99.09 97.66 95.78 93.77Condenser coolant mass flow [kpph] 45,609 45,609 45,609 45,609 45,609 45,609 45,609 45,609
Stack gas molecular weight 28.29 28.31 28.32 28.33 28.34 28.35 28.37 28.39Stack gas N2+Ar mole percentage [%] 74.64 74.81 74.87 74.94 75.02 75.11 75.24 75.37Stack gas O2 mole percentage [%] 12.52 12.53 12.53 12.54 12.55 12.56 12.59 12.61Stack gas CO2 mole percentage [%] 3.66 3.68 3.69 3.69 3.7 3.7 3.71 3.72Stack gas H2O mole percentage [%] 9.17 8.98 8.91 8.83 8.73 8.62 8.46 8.31
Duct burner exit temperature [F] 1,132.2 1,125.9 1,122.6 1,120.4 1,118.2 1,115.9 1,112.9 1,109.7Exhaust DT across main duct burner [F] 0 0 0 0 0 0 0 0Exhaust DT across HPB2 burner [F] 0 0 0 0 0 0 0 0
Coast Comparisons; Wet cooling; Low pressure; Low cost
C-23
C.4 Mountain Site Operations
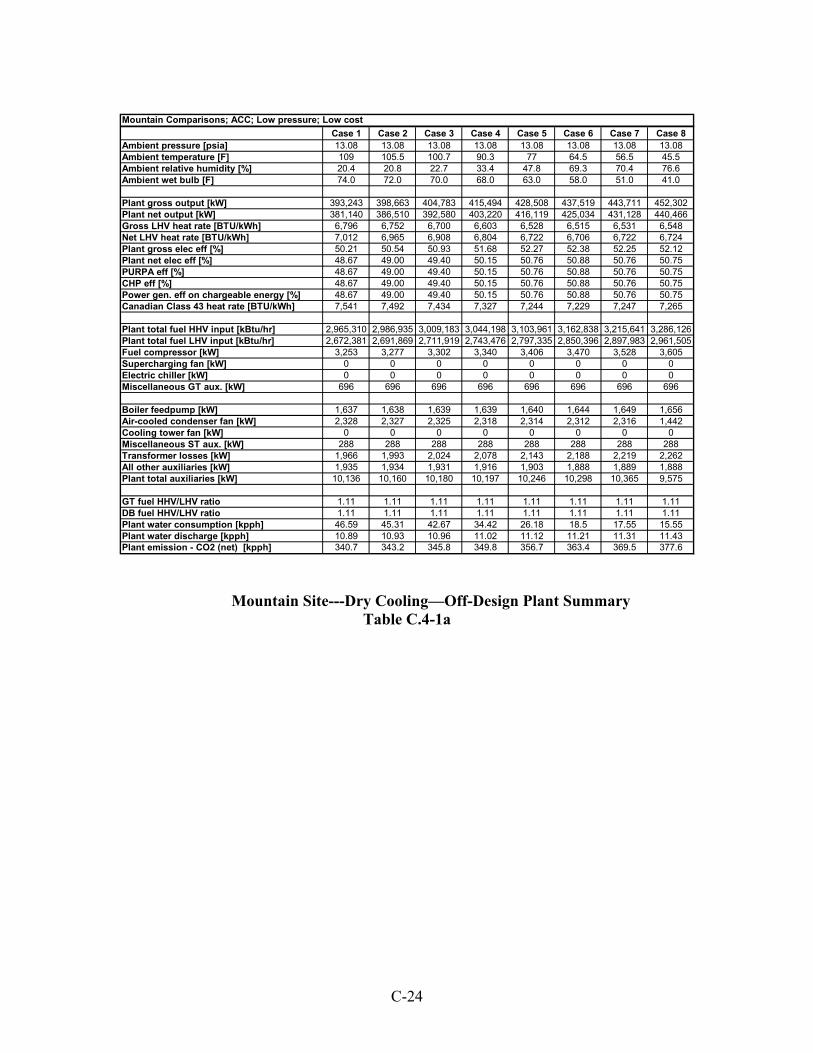
C-24
Mountain Site---Dry Cooling—Off-Design Plant Summary Table C.4-1a
Case 1 Case 2 Case 3 Case 4 Case 5 Case 6 Case 7 Case 8Ambient pressure [psia] 13.08 13.08 13.08 13.08 13.08 13.08 13.08 13.08Ambient temperature [F] 109 105.5 100.7 90.3 77 64.5 56.5 45.5Ambient relative humidity [%] 20.4 20.8 22.7 33.4 47.8 69.3 70.4 76.6Ambient wet bulb [F] 74.0 72.0 70.0 68.0 63.0 58.0 51.0 41.0
Plant gross output [kW] 393,243 398,663 404,783 415,494 428,508 437,519 443,711 452,302Plant net output [kW] 381,140 386,510 392,580 403,220 416,119 425,034 431,128 440,466Gross LHV heat rate [BTU/kWh] 6,796 6,752 6,700 6,603 6,528 6,515 6,531 6,548Net LHV heat rate [BTU/kWh] 7,012 6,965 6,908 6,804 6,722 6,706 6,722 6,724Plant gross elec eff [%] 50.21 50.54 50.93 51.68 52.27 52.38 52.25 52.12Plant net elec eff [%] 48.67 49.00 49.40 50.15 50.76 50.88 50.76 50.75PURPA eff [%] 48.67 49.00 49.40 50.15 50.76 50.88 50.76 50.75CHP eff [%] 48.67 49.00 49.40 50.15 50.76 50.88 50.76 50.75Power gen. eff on chargeable energy [%] 48.67 49.00 49.40 50.15 50.76 50.88 50.76 50.75Canadian Class 43 heat rate [BTU/kWh] 7,541 7,492 7,434 7,327 7,244 7,229 7,247 7,265
Plant total fuel HHV input [kBtu/hr] 2,965,310 2,986,935 3,009,183 3,044,198 3,103,961 3,162,838 3,215,641 3,286,126Plant total fuel LHV input [kBtu/hr] 2,672,381 2,691,869 2,711,919 2,743,476 2,797,335 2,850,396 2,897,983 2,961,505Fuel compressor [kW] 3,253 3,277 3,302 3,340 3,406 3,470 3,528 3,605Supercharging fan [kW] 0 0 0 0 0 0 0 0Electric chiller [kW] 0 0 0 0 0 0 0 0Miscellaneous GT aux. [kW] 696 696 696 696 696 696 696 696
Boiler feedpump [kW] 1,637 1,638 1,639 1,639 1,640 1,644 1,649 1,656Air-cooled condenser fan [kW] 2,328 2,327 2,325 2,318 2,314 2,312 2,316 1,442Cooling tower fan [kW] 0 0 0 0 0 0 0 0Miscellaneous ST aux. [kW] 288 288 288 288 288 288 288 288Transformer losses [kW] 1,966 1,993 2,024 2,078 2,143 2,188 2,219 2,262All other auxiliaries [kW] 1,935 1,934 1,931 1,916 1,903 1,888 1,889 1,888Plant total auxiliaries [kW] 10,136 10,160 10,180 10,197 10,246 10,298 10,365 9,575
GT fuel HHV/LHV ratio 1.11 1.11 1.11 1.11 1.11 1.11 1.11 1.11DB fuel HHV/LHV ratio 1.11 1.11 1.11 1.11 1.11 1.11 1.11 1.11Plant water consumption [kpph] 46.59 45.31 42.67 34.42 26.18 18.5 17.55 15.55Plant water discharge [kpph] 10.89 10.93 10.96 11.02 11.12 11.21 11.31 11.43Plant emission - CO2 (net) [kpph] 340.7 343.2 345.8 349.8 356.7 363.4 369.5 377.6
Mountain Comparisons; ACC; Low pressure; Low cost
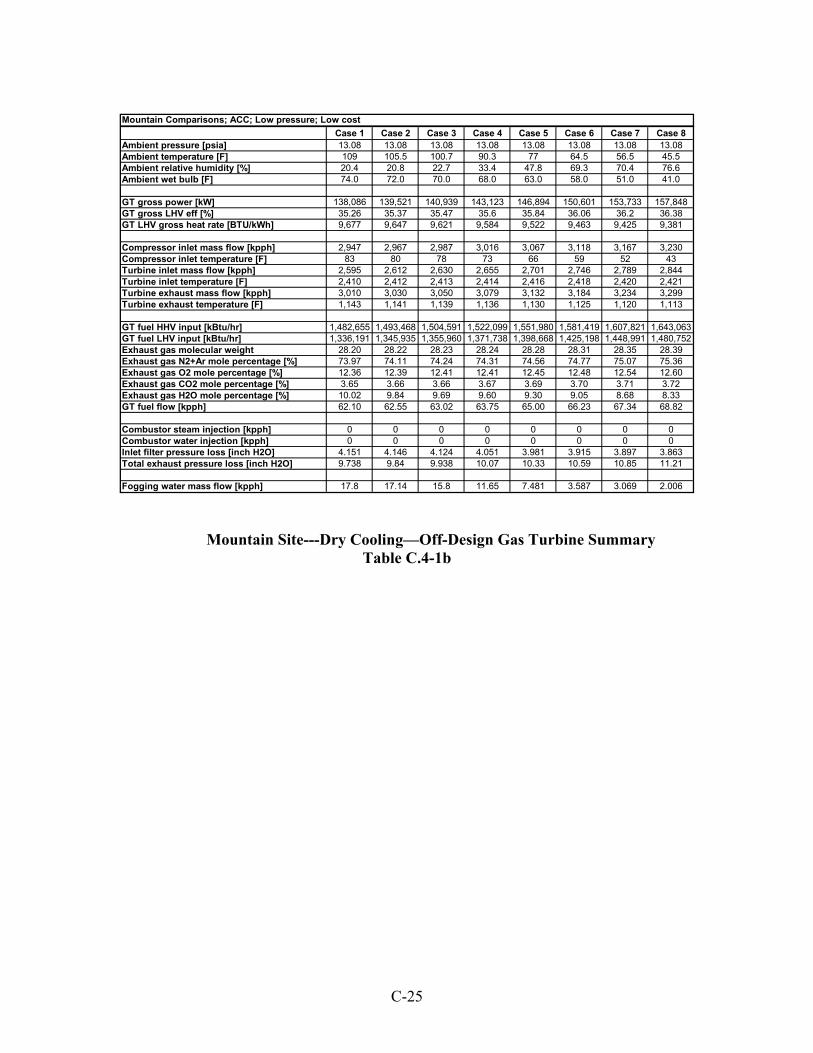
C-25
Mountain Site---Dry Cooling—Off-Design Gas Turbine Summary Table C.4-1b
Case 1 Case 2 Case 3 Case 4 Case 5 Case 6 Case 7 Case 8Ambient pressure [psia] 13.08 13.08 13.08 13.08 13.08 13.08 13.08 13.08Ambient temperature [F] 109 105.5 100.7 90.3 77 64.5 56.5 45.5Ambient relative humidity [%] 20.4 20.8 22.7 33.4 47.8 69.3 70.4 76.6Ambient wet bulb [F] 74.0 72.0 70.0 68.0 63.0 58.0 51.0 41.0
GT gross power [kW] 138,086 139,521 140,939 143,123 146,894 150,601 153,733 157,848GT gross LHV eff [%] 35.26 35.37 35.47 35.6 35.84 36.06 36.2 36.38GT LHV gross heat rate [BTU/kWh] 9,677 9,647 9,621 9,584 9,522 9,463 9,425 9,381
Compressor inlet mass flow [kpph] 2,947 2,967 2,987 3,016 3,067 3,118 3,167 3,230Compressor inlet temperature [F] 83 80 78 73 66 59 52 43Turbine inlet mass flow [kpph] 2,595 2,612 2,630 2,655 2,701 2,746 2,789 2,844Turbine inlet temperature [F] 2,410 2,412 2,413 2,414 2,416 2,418 2,420 2,421Turbine exhaust mass flow [kpph] 3,010 3,030 3,050 3,079 3,132 3,184 3,234 3,299Turbine exhaust temperature [F] 1,143 1,141 1,139 1,136 1,130 1,125 1,120 1,113
GT fuel HHV input [kBtu/hr] 1,482,655 1,493,468 1,504,591 1,522,099 1,551,980 1,581,419 1,607,821 1,643,063GT fuel LHV input [kBtu/hr] 1,336,191 1,345,935 1,355,960 1,371,738 1,398,668 1,425,198 1,448,991 1,480,752Exhaust gas molecular weight 28.20 28.22 28.23 28.24 28.28 28.31 28.35 28.39Exhaust gas N2+Ar mole percentage [%] 73.97 74.11 74.24 74.31 74.56 74.77 75.07 75.36Exhaust gas O2 mole percentage [%] 12.36 12.39 12.41 12.41 12.45 12.48 12.54 12.60Exhaust gas CO2 mole percentage [%] 3.65 3.66 3.66 3.67 3.69 3.70 3.71 3.72Exhaust gas H2O mole percentage [%] 10.02 9.84 9.69 9.60 9.30 9.05 8.68 8.33GT fuel flow [kpph] 62.10 62.55 63.02 63.75 65.00 66.23 67.34 68.82
Combustor steam injection [kpph] 0 0 0 0 0 0 0 0Combustor water injection [kpph] 0 0 0 0 0 0 0 0Inlet filter pressure loss [inch H2O] 4.151 4.146 4.124 4.051 3.981 3.915 3.897 3.863Total exhaust pressure loss [inch H2O] 9.738 9.84 9.938 10.07 10.33 10.59 10.85 11.21
Fogging water mass flow [kpph] 17.8 17.14 15.8 11.65 7.481 3.587 3.069 2.006
Mountain Comparisons; ACC; Low pressure; Low cost
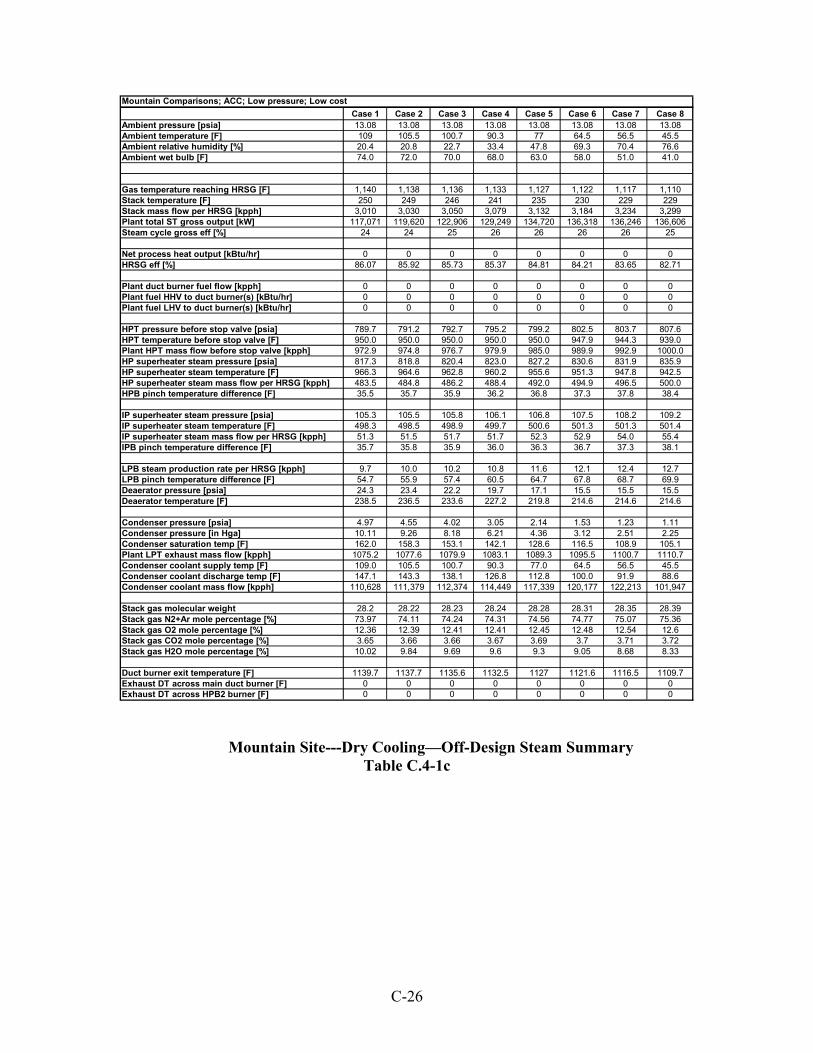
C-26
Mountain Site---Dry Cooling—Off-Design Steam Summary Table C.4-1c
Case 1 Case 2 Case 3 Case 4 Case 5 Case 6 Case 7 Case 8Ambient pressure [psia] 13.08 13.08 13.08 13.08 13.08 13.08 13.08 13.08Ambient temperature [F] 109 105.5 100.7 90.3 77 64.5 56.5 45.5Ambient relative humidity [%] 20.4 20.8 22.7 33.4 47.8 69.3 70.4 76.6Ambient wet bulb [F] 74.0 72.0 70.0 68.0 63.0 58.0 51.0 41.0
Gas temperature reaching HRSG [F] 1,140 1,138 1,136 1,133 1,127 1,122 1,117 1,110Stack temperature [F] 250 249 246 241 235 230 229 229Stack mass flow per HRSG [kpph] 3,010 3,030 3,050 3,079 3,132 3,184 3,234 3,299Plant total ST gross output [kW] 117,071 119,620 122,906 129,249 134,720 136,318 136,246 136,606Steam cycle gross eff [%] 24 24 25 26 26 26 26 25
Net process heat output [kBtu/hr] 0 0 0 0 0 0 0 0HRSG eff [%] 86.07 85.92 85.73 85.37 84.81 84.21 83.65 82.71
Plant duct burner fuel flow [kpph] 0 0 0 0 0 0 0 0Plant fuel HHV to duct burner(s) [kBtu/hr] 0 0 0 0 0 0 0 0Plant fuel LHV to duct burner(s) [kBtu/hr] 0 0 0 0 0 0 0 0
HPT pressure before stop valve [psia] 789.7 791.2 792.7 795.2 799.2 802.5 803.7 807.6HPT temperature before stop valve [F] 950.0 950.0 950.0 950.0 950.0 947.9 944.3 939.0Plant HPT mass flow before stop valve [kpph] 972.9 974.8 976.7 979.9 985.0 989.9 992.9 1000.0HP superheater steam pressure [psia] 817.3 818.8 820.4 823.0 827.2 830.6 831.9 835.9HP superheater steam temperature [F] 966.3 964.6 962.8 960.2 955.6 951.3 947.8 942.5HP superheater steam mass flow per HRSG [kpph] 483.5 484.8 486.2 488.4 492.0 494.9 496.5 500.0HPB pinch temperature difference [F] 35.5 35.7 35.9 36.2 36.8 37.3 37.8 38.4
IP superheater steam pressure [psia] 105.3 105.5 105.8 106.1 106.8 107.5 108.2 109.2IP superheater steam temperature [F] 498.3 498.5 498.9 499.7 500.6 501.3 501.3 501.4IP superheater steam mass flow per HRSG [kpph] 51.3 51.5 51.7 51.7 52.3 52.9 54.0 55.4IPB pinch temperature difference [F] 35.7 35.8 35.9 36.0 36.3 36.7 37.3 38.1
LPB steam production rate per HRSG [kpph] 9.7 10.0 10.2 10.8 11.6 12.1 12.4 12.7LPB pinch temperature difference [F] 54.7 55.9 57.4 60.5 64.7 67.8 68.7 69.9Deaerator pressure [psia] 24.3 23.4 22.2 19.7 17.1 15.5 15.5 15.5Deaerator temperature [F] 238.5 236.5 233.6 227.2 219.8 214.6 214.6 214.6
Condenser pressure [psia] 4.97 4.55 4.02 3.05 2.14 1.53 1.23 1.11Condenser pressure [in Hga] 10.11 9.26 8.18 6.21 4.36 3.12 2.51 2.25Condenser saturation temp [F] 162.0 158.3 153.1 142.1 128.6 116.5 108.9 105.1Plant LPT exhaust mass flow [kpph] 1075.2 1077.6 1079.9 1083.1 1089.3 1095.5 1100.7 1110.7Condenser coolant supply temp [F] 109.0 105.5 100.7 90.3 77.0 64.5 56.5 45.5Condenser coolant discharge temp [F] 147.1 143.3 138.1 126.8 112.8 100.0 91.9 88.6Condenser coolant mass flow [kpph] 110,628 111,379 112,374 114,449 117,339 120,177 122,213 101,947
Stack gas molecular weight 28.2 28.22 28.23 28.24 28.28 28.31 28.35 28.39Stack gas N2+Ar mole percentage [%] 73.97 74.11 74.24 74.31 74.56 74.77 75.07 75.36Stack gas O2 mole percentage [%] 12.36 12.39 12.41 12.41 12.45 12.48 12.54 12.6Stack gas CO2 mole percentage [%] 3.65 3.66 3.66 3.67 3.69 3.7 3.71 3.72Stack gas H2O mole percentage [%] 10.02 9.84 9.69 9.6 9.3 9.05 8.68 8.33
Duct burner exit temperature [F] 1139.7 1137.7 1135.6 1132.5 1127 1121.6 1116.5 1109.7Exhaust DT across main duct burner [F] 0 0 0 0 0 0 0 0Exhaust DT across HPB2 burner [F] 0 0 0 0 0 0 0 0
Mountain Comparisons; ACC; Low pressure; Low cost
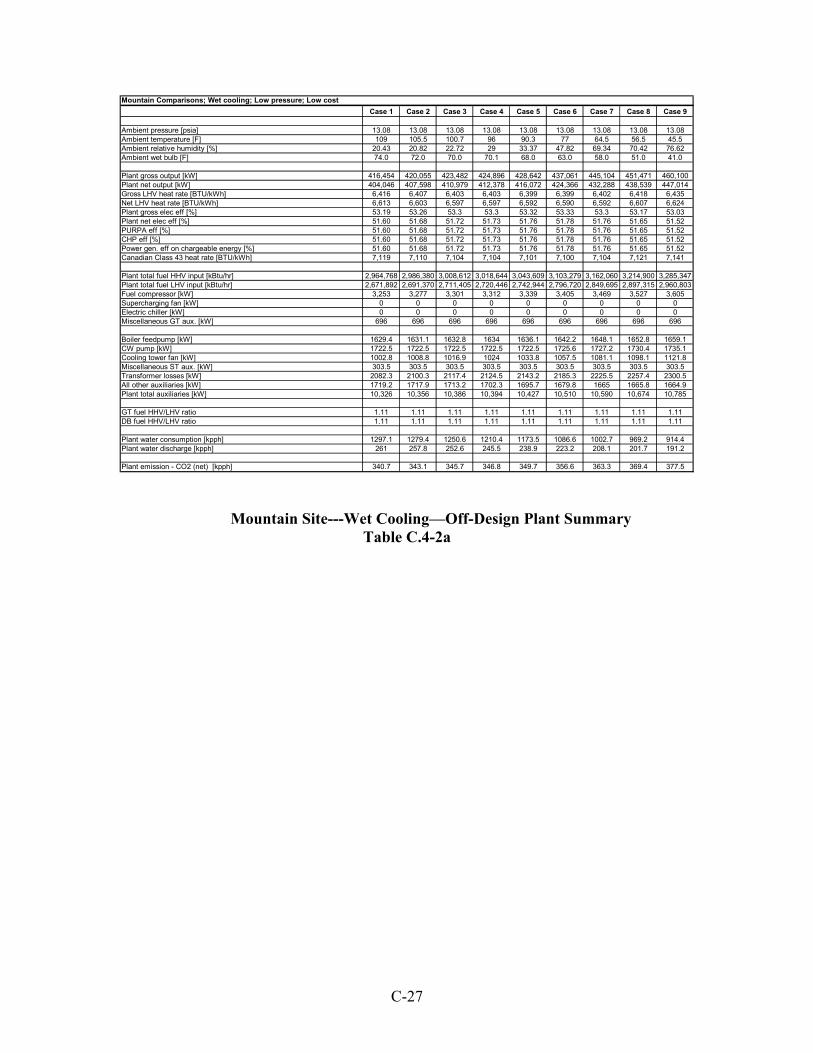
C-27
Mountain Site---Wet Cooling—Off-Design Plant Summary Table C.4-2a
Case 1 Case 2 Case 3 Case 4 Case 5 Case 6 Case 7 Case 8 Case 9
Ambient pressure [psia] 13.08 13.08 13.08 13.08 13.08 13.08 13.08 13.08 13.08Ambient temperature [F] 109 105.5 100.7 96 90.3 77 64.5 56.5 45.5Ambient relative humidity [%] 20.43 20.82 22.72 29 33.37 47.82 69.34 70.42 76.62Ambient wet bulb [F] 74.0 72.0 70.0 70.1 68.0 63.0 58.0 51.0 41.0
Plant gross output [kW] 416,454 420,055 423,482 424,896 428,642 437,061 445,104 451,471 460,100Plant net output [kW] 404,046 407,598 410,979 412,378 416,072 424,366 432,288 438,539 447,014Gross LHV heat rate [BTU/kWh] 6,416 6,407 6,403 6,403 6,399 6,399 6,402 6,418 6,435Net LHV heat rate [BTU/kWh] 6,613 6,603 6,597 6,597 6,592 6,590 6,592 6,607 6,624Plant gross elec eff [%] 53.19 53.26 53.3 53.3 53.32 53.33 53.3 53.17 53.03Plant net elec eff [%] 51.60 51.68 51.72 51.73 51.76 51.78 51.76 51.65 51.52PURPA eff [%] 51.60 51.68 51.72 51.73 51.76 51.78 51.76 51.65 51.52CHP eff [%] 51.60 51.68 51.72 51.73 51.76 51.78 51.76 51.65 51.52Power gen. eff on chargeable energy [%] 51.60 51.68 51.72 51.73 51.76 51.78 51.76 51.65 51.52Canadian Class 43 heat rate [BTU/kWh] 7,119 7,110 7,104 7,104 7,101 7,100 7,104 7,121 7,141
Plant total fuel HHV input [kBtu/hr] 2,964,768 2,986,380 3,008,612 3,018,644 3,043,609 3,103,279 3,162,060 3,214,900 3,285,347Plant total fuel LHV input [kBtu/hr] 2,671,892 2,691,370 2,711,405 2,720,446 2,742,944 2,796,720 2,849,695 2,897,315 2,960,803Fuel compressor [kW] 3,253 3,277 3,301 3,312 3,339 3,405 3,469 3,527 3,605Supercharging fan [kW] 0 0 0 0 0 0 0 0 0Electric chiller [kW] 0 0 0 0 0 0 0 0 0Miscellaneous GT aux. [kW] 696 696 696 696 696 696 696 696 696
Boiler feedpump [kW] 1629.4 1631.1 1632.8 1634 1636.1 1642.2 1648.1 1652.8 1659.1CW pump [kW] 1722.5 1722.5 1722.5 1722.5 1722.5 1725.6 1727.2 1730.4 1735.1Cooling tower fan [kW] 1002.8 1008.8 1016.9 1024 1033.8 1057.5 1081.1 1098.1 1121.8Miscellaneous ST aux. [kW] 303.5 303.5 303.5 303.5 303.5 303.5 303.5 303.5 303.5Transformer losses [kW] 2082.3 2100.3 2117.4 2124.5 2143.2 2185.3 2225.5 2257.4 2300.5All other auxiliaries [kW] 1719.2 1717.9 1713.2 1702.3 1695.7 1679.8 1665 1665.8 1664.9Plant total auxiliaries [kW] 10,326 10,356 10,386 10,394 10,427 10,510 10,590 10,674 10,785
GT fuel HHV/LHV ratio 1.11 1.11 1.11 1.11 1.11 1.11 1.11 1.11 1.11DB fuel HHV/LHV ratio 1.11 1.11 1.11 1.11 1.11 1.11 1.11 1.11 1.11
Plant water consumption [kpph] 1297.1 1279.4 1250.6 1210.4 1173.5 1086.6 1002.7 969.2 914.4Plant water discharge [kpph] 261 257.8 252.6 245.5 238.9 223.2 208.1 201.7 191.2
Plant emission - CO2 (net) [kpph] 340.7 343.1 345.7 346.8 349.7 356.6 363.3 369.4 377.5
Mountain Comparisons; Wet cooling; Low pressure; Low cost
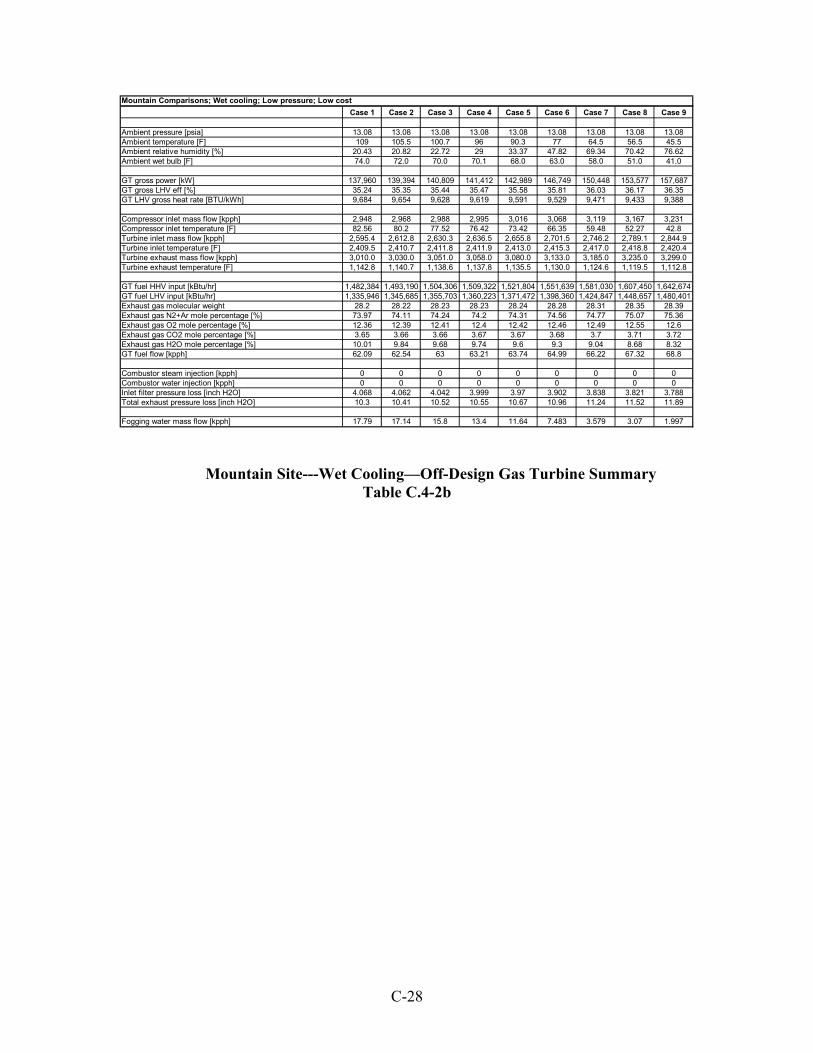
C-28
Mountain Site---Wet Cooling—Off-Design Gas Turbine Summary Table C.4-2b
Case 1 Case 2 Case 3 Case 4 Case 5 Case 6 Case 7 Case 8 Case 9
Ambient pressure [psia] 13.08 13.08 13.08 13.08 13.08 13.08 13.08 13.08 13.08Ambient temperature [F] 109 105.5 100.7 96 90.3 77 64.5 56.5 45.5Ambient relative humidity [%] 20.43 20.82 22.72 29 33.37 47.82 69.34 70.42 76.62Ambient wet bulb [F] 74.0 72.0 70.0 70.1 68.0 63.0 58.0 51.0 41.0
GT gross power [kW] 137,960 139,394 140,809 141,412 142,989 146,749 150,448 153,577 157,687GT gross LHV eff [%] 35.24 35.35 35.44 35.47 35.58 35.81 36.03 36.17 36.35GT LHV gross heat rate [BTU/kWh] 9,684 9,654 9,628 9,619 9,591 9,529 9,471 9,433 9,388
Compressor inlet mass flow [kpph] 2,948 2,968 2,988 2,995 3,016 3,068 3,119 3,167 3,231Compressor inlet temperature [F] 82.56 80.2 77.52 76.42 73.42 66.35 59.48 52.27 42.8Turbine inlet mass flow [kpph] 2,595.4 2,612.8 2,630.3 2,636.5 2,655.8 2,701.5 2,746.2 2,789.1 2,844.9Turbine inlet temperature [F] 2,409.5 2,410.7 2,411.8 2,411.9 2,413.0 2,415.3 2,417.0 2,418.8 2,420.4Turbine exhaust mass flow [kpph] 3,010.0 3,030.0 3,051.0 3,058.0 3,080.0 3,133.0 3,185.0 3,235.0 3,299.0Turbine exhaust temperature [F] 1,142.8 1,140.7 1,138.6 1,137.8 1,135.5 1,130.0 1,124.6 1,119.5 1,112.8
GT fuel HHV input [kBtu/hr] 1,482,384 1,493,190 1,504,306 1,509,322 1,521,804 1,551,639 1,581,030 1,607,450 1,642,674GT fuel LHV input [kBtu/hr] 1,335,946 1,345,685 1,355,703 1,360,223 1,371,472 1,398,360 1,424,847 1,448,657 1,480,401Exhaust gas molecular weight 28.2 28.22 28.23 28.23 28.24 28.28 28.31 28.35 28.39Exhaust gas N2+Ar mole percentage [%] 73.97 74.11 74.24 74.2 74.31 74.56 74.77 75.07 75.36Exhaust gas O2 mole percentage [%] 12.36 12.39 12.41 12.4 12.42 12.46 12.49 12.55 12.6Exhaust gas CO2 mole percentage [%] 3.65 3.66 3.66 3.67 3.67 3.68 3.7 3.71 3.72Exhaust gas H2O mole percentage [%] 10.01 9.84 9.68 9.74 9.6 9.3 9.04 8.68 8.32GT fuel flow [kpph] 62.09 62.54 63 63.21 63.74 64.99 66.22 67.32 68.8
Combustor steam injection [kpph] 0 0 0 0 0 0 0 0 0Combustor water injection [kpph] 0 0 0 0 0 0 0 0 0Inlet filter pressure loss [inch H2O] 4.068 4.062 4.042 3.999 3.97 3.902 3.838 3.821 3.788Total exhaust pressure loss [inch H2O] 10.3 10.41 10.52 10.55 10.67 10.96 11.24 11.52 11.89
Fogging water mass flow [kpph] 17.79 17.14 15.8 13.4 11.64 7.483 3.579 3.07 1.997
Mountain Comparisons; Wet cooling; Low pressure; Low cost
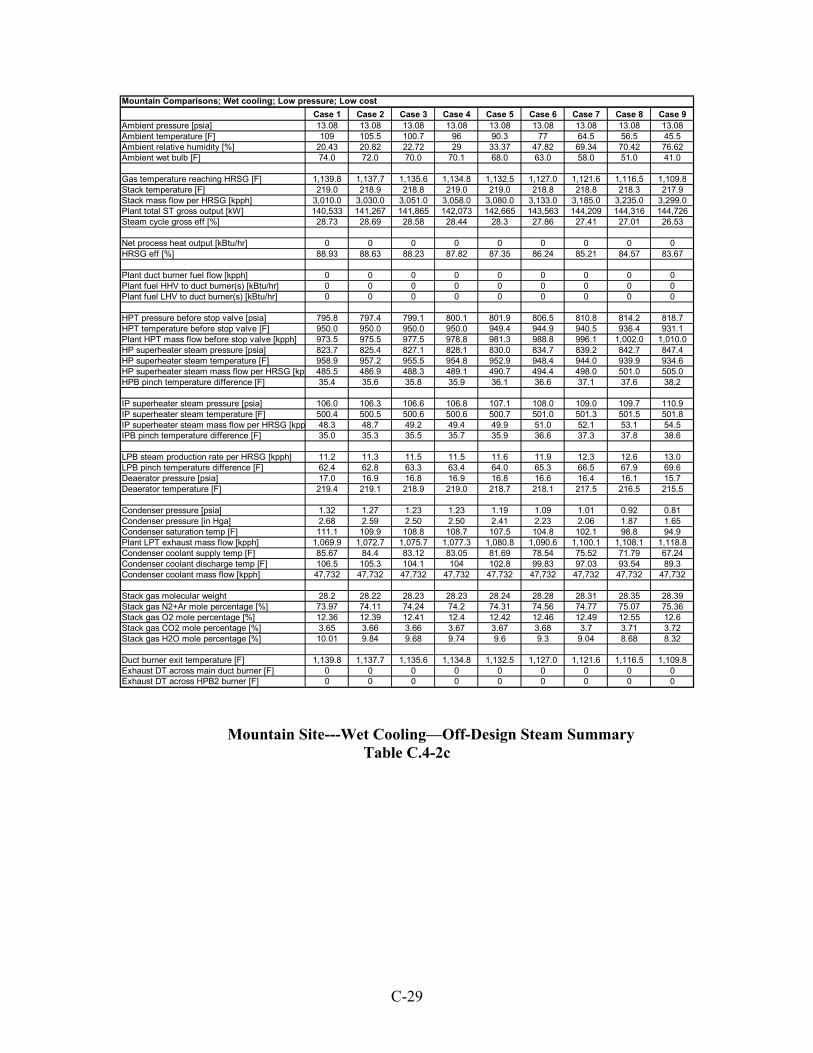
C-29
Mountain Site---Wet Cooling—Off-Design Steam Summary Table C.4-2c
Case 1 Case 2 Case 3 Case 4 Case 5 Case 6 Case 7 Case 8 Case 9Ambient pressure [psia] 13.08 13.08 13.08 13.08 13.08 13.08 13.08 13.08 13.08Ambient temperature [F] 109 105.5 100.7 96 90.3 77 64.5 56.5 45.5Ambient relative humidity [%] 20.43 20.82 22.72 29 33.37 47.82 69.34 70.42 76.62Ambient wet bulb [F] 74.0 72.0 70.0 70.1 68.0 63.0 58.0 51.0 41.0
Gas temperature reaching HRSG [F] 1,139.8 1,137.7 1,135.6 1,134.8 1,132.5 1,127.0 1,121.6 1,116.5 1,109.8Stack temperature [F] 219.0 218.9 218.8 219.0 219.0 218.8 218.8 218.3 217.9Stack mass flow per HRSG [kpph] 3,010.0 3,030.0 3,051.0 3,058.0 3,080.0 3,133.0 3,185.0 3,235.0 3,299.0Plant total ST gross output [kW] 140,533 141,267 141,865 142,073 142,665 143,563 144,209 144,316 144,726Steam cycle gross eff [%] 28.73 28.69 28.58 28.44 28.3 27.86 27.41 27.01 26.53
Net process heat output [kBtu/hr] 0 0 0 0 0 0 0 0 0HRSG eff [%] 88.93 88.63 88.23 87.82 87.35 86.24 85.21 84.57 83.67
Plant duct burner fuel flow [kpph] 0 0 0 0 0 0 0 0 0Plant fuel HHV to duct burner(s) [kBtu/hr] 0 0 0 0 0 0 0 0 0Plant fuel LHV to duct burner(s) [kBtu/hr] 0 0 0 0 0 0 0 0 0
HPT pressure before stop valve [psia] 795.8 797.4 799.1 800.1 801.9 806.5 810.8 814.2 818.7HPT temperature before stop valve [F] 950.0 950.0 950.0 950.0 949.4 944.9 940.5 936.4 931.1Plant HPT mass flow before stop valve [kpph] 973.5 975.5 977.5 978.8 981.3 988.8 996.1 1,002.0 1,010.0HP superheater steam pressure [psia] 823.7 825.4 827.1 828.1 830.0 834.7 839.2 842.7 847.4HP superheater steam temperature [F] 958.9 957.2 955.5 954.8 952.9 948.4 944.0 939.9 934.6HP superheater steam mass flow per HRSG [kp 485.5 486.9 488.3 489.1 490.7 494.4 498.0 501.0 505.0HPB pinch temperature difference [F] 35.4 35.6 35.8 35.9 36.1 36.6 37.1 37.6 38.2
IP superheater steam pressure [psia] 106.0 106.3 106.6 106.8 107.1 108.0 109.0 109.7 110.9IP superheater steam temperature [F] 500.4 500.5 500.6 500.6 500.7 501.0 501.3 501.5 501.8IP superheater steam mass flow per HRSG [kpp 48.3 48.7 49.2 49.4 49.9 51.0 52.1 53.1 54.5IPB pinch temperature difference [F] 35.0 35.3 35.5 35.7 35.9 36.6 37.3 37.8 38.6
LPB steam production rate per HRSG [kpph] 11.2 11.3 11.5 11.5 11.6 11.9 12.3 12.6 13.0LPB pinch temperature difference [F] 62.4 62.8 63.3 63.4 64.0 65.3 66.5 67.9 69.6Deaerator pressure [psia] 17.0 16.9 16.8 16.9 16.8 16.6 16.4 16.1 15.7Deaerator temperature [F] 219.4 219.1 218.9 219.0 218.7 218.1 217.5 216.5 215.5
Condenser pressure [psia] 1.32 1.27 1.23 1.23 1.19 1.09 1.01 0.92 0.81Condenser pressure [in Hga] 2.68 2.59 2.50 2.50 2.41 2.23 2.06 1.87 1.65Condenser saturation temp [F] 111.1 109.9 108.8 108.7 107.5 104.8 102.1 98.8 94.9Plant LPT exhaust mass flow [kpph] 1,069.9 1,072.7 1,075.7 1,077.3 1,080.8 1,090.6 1,100.1 1,108.1 1,118.8Condenser coolant supply temp [F] 85.67 84.4 83.12 83.05 81.69 78.54 75.52 71.79 67.24Condenser coolant discharge temp [F] 106.5 105.3 104.1 104 102.8 99.83 97.03 93.54 89.3Condenser coolant mass flow [kpph] 47,732 47,732 47,732 47,732 47,732 47,732 47,732 47,732 47,732
Stack gas molecular weight 28.2 28.22 28.23 28.23 28.24 28.28 28.31 28.35 28.39Stack gas N2+Ar mole percentage [%] 73.97 74.11 74.24 74.2 74.31 74.56 74.77 75.07 75.36Stack gas O2 mole percentage [%] 12.36 12.39 12.41 12.4 12.42 12.46 12.49 12.55 12.6Stack gas CO2 mole percentage [%] 3.65 3.66 3.66 3.67 3.67 3.68 3.7 3.71 3.72Stack gas H2O mole percentage [%] 10.01 9.84 9.68 9.74 9.6 9.3 9.04 8.68 8.32
Duct burner exit temperature [F] 1,139.8 1,137.7 1,135.6 1,134.8 1,132.5 1,127.0 1,121.6 1,116.5 1,109.8Exhaust DT across main duct burner [F] 0 0 0 0 0 0 0 0 0Exhaust DT across HPB2 burner [F] 0 0 0 0 0 0 0 0 0
Mountain Comparisons; Wet cooling; Low pressure; Low cost
D-1
APPENDIX D
HOURLY OPERATING DATA FOR ALL SITES, PLANTS, AND WATER SOURCES
D.1 Desert Site D.2 Valley Site D.3 Coast Site D.4 Mountain Site

D-2
D.1 Desert Site
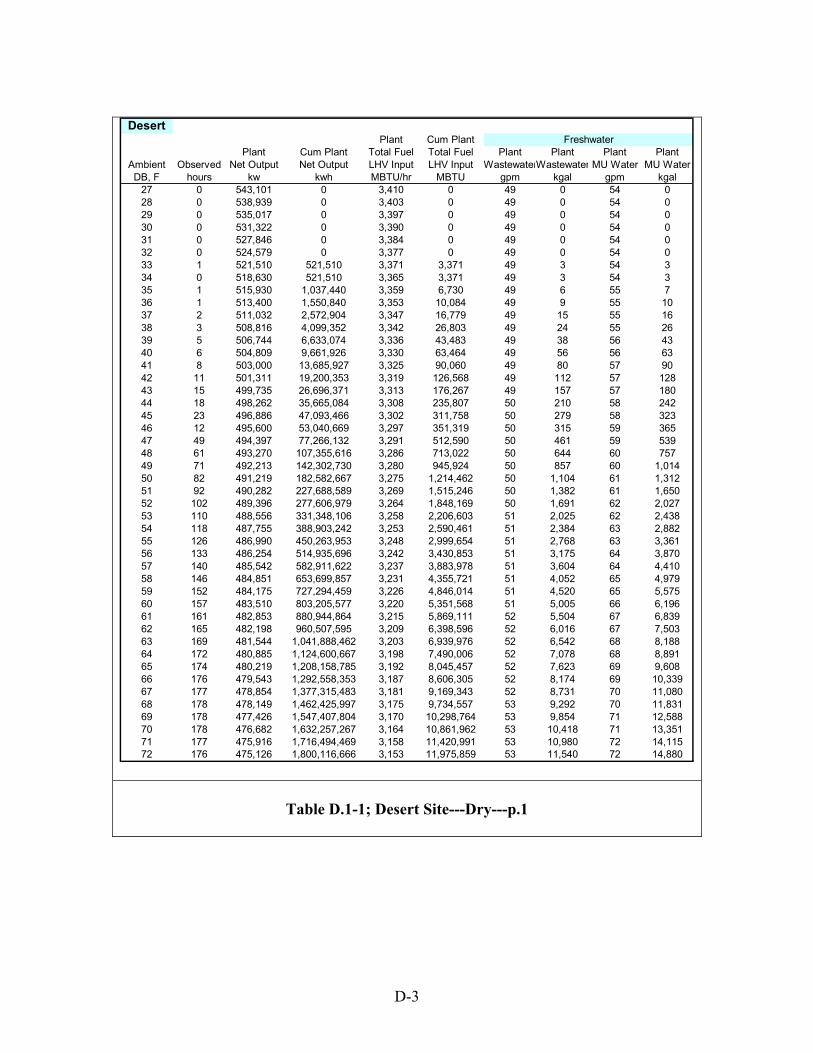
D-3
Table D.1-1; Desert Site---Dry---p.1
DesertPlant Cum Plant
Plant Cum Plant Total Fuel Total Fuel Plant Plant Plant PlantAmbient Observed Net Output Net Output LHV Input LHV Input WastewaterWastewater MU Water MU WaterDB, F hours kw kwh MBTU/hr MBTU gpm kgal gpm kgal
27 0 543,101 0 3,410 0 49 0 54 028 0 538,939 0 3,403 0 49 0 54 029 0 535,017 0 3,397 0 49 0 54 030 0 531,322 0 3,390 0 49 0 54 031 0 527,846 0 3,384 0 49 0 54 032 0 524,579 0 3,377 0 49 0 54 033 1 521,510 521,510 3,371 3,371 49 3 54 334 0 518,630 521,510 3,365 3,371 49 3 54 335 1 515,930 1,037,440 3,359 6,730 49 6 55 736 1 513,400 1,550,840 3,353 10,084 49 9 55 1037 2 511,032 2,572,904 3,347 16,779 49 15 55 1638 3 508,816 4,099,352 3,342 26,803 49 24 55 2639 5 506,744 6,633,074 3,336 43,483 49 38 56 4340 6 504,809 9,661,926 3,330 63,464 49 56 56 6341 8 503,000 13,685,927 3,325 90,060 49 80 57 9042 11 501,311 19,200,353 3,319 126,568 49 112 57 12843 15 499,735 26,696,371 3,313 176,267 49 157 57 18044 18 498,262 35,665,084 3,308 235,807 50 210 58 24245 23 496,886 47,093,466 3,302 311,758 50 279 58 32346 12 495,600 53,040,669 3,297 351,319 50 315 59 36547 49 494,397 77,266,132 3,291 512,590 50 461 59 53948 61 493,270 107,355,616 3,286 713,022 50 644 60 75749 71 492,213 142,302,730 3,280 945,924 50 857 60 1,01450 82 491,219 182,582,667 3,275 1,214,462 50 1,104 61 1,31251 92 490,282 227,688,589 3,269 1,515,246 50 1,382 61 1,65052 102 489,396 277,606,979 3,264 1,848,169 50 1,691 62 2,02753 110 488,556 331,348,106 3,258 2,206,603 51 2,025 62 2,43854 118 487,755 388,903,242 3,253 2,590,461 51 2,384 63 2,88255 126 486,990 450,263,953 3,248 2,999,654 51 2,768 63 3,36156 133 486,254 514,935,696 3,242 3,430,853 51 3,175 64 3,87057 140 485,542 582,911,622 3,237 3,883,978 51 3,604 64 4,41058 146 484,851 653,699,857 3,231 4,355,721 51 4,052 65 4,97959 152 484,175 727,294,459 3,226 4,846,014 51 4,520 65 5,57560 157 483,510 803,205,577 3,220 5,351,568 51 5,005 66 6,19661 161 482,853 880,944,864 3,215 5,869,111 52 5,504 67 6,83962 165 482,198 960,507,595 3,209 6,398,596 52 6,016 67 7,50363 169 481,544 1,041,888,462 3,203 6,939,976 52 6,542 68 8,18864 172 480,885 1,124,600,667 3,198 7,490,006 52 7,078 68 8,89165 174 480,219 1,208,158,785 3,192 8,045,457 52 7,623 69 9,60866 176 479,543 1,292,558,353 3,187 8,606,305 52 8,174 69 10,33967 177 478,854 1,377,315,483 3,181 9,169,343 52 8,731 70 11,08068 178 478,149 1,462,425,997 3,175 9,734,557 53 9,292 70 11,83169 178 477,426 1,547,407,804 3,170 10,298,764 53 9,854 71 12,58870 178 476,682 1,632,257,267 3,164 10,861,962 53 10,418 71 13,35171 177 475,916 1,716,494,469 3,158 11,420,991 53 10,980 72 14,11572 176 475,126 1,800,116,666 3,153 11,975,859 53 11,540 72 14,880
Freshwater
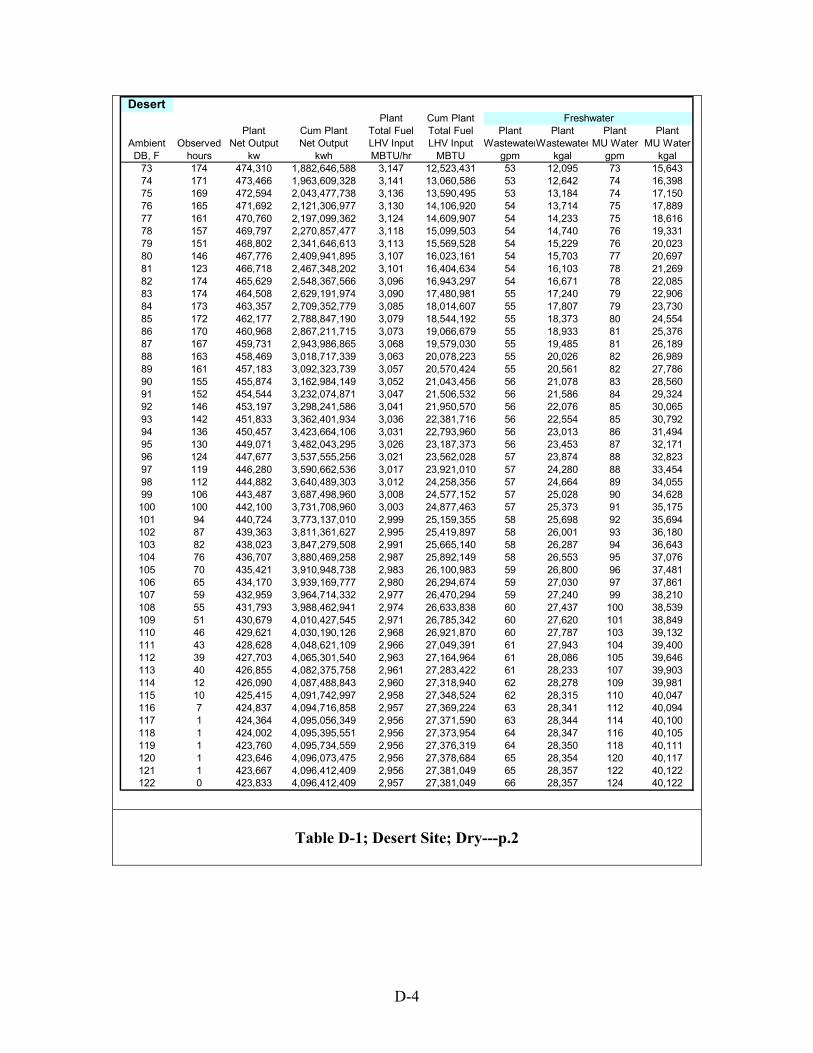
D-4
Table D-1; Desert Site; Dry---p.2
DesertPlant Cum Plant
Plant Cum Plant Total Fuel Total Fuel Plant Plant Plant PlantAmbient Observed Net Output Net Output LHV Input LHV Input WastewaterWastewater MU Water MU WaterDB, F hours kw kwh MBTU/hr MBTU gpm kgal gpm kgal
73 174 474,310 1,882,646,588 3,147 12,523,431 53 12,095 73 15,64374 171 473,466 1,963,609,328 3,141 13,060,586 53 12,642 74 16,39875 169 472,594 2,043,477,738 3,136 13,590,495 53 13,184 74 17,15076 165 471,692 2,121,306,977 3,130 14,106,920 54 13,714 75 17,88977 161 470,760 2,197,099,362 3,124 14,609,907 54 14,233 75 18,61678 157 469,797 2,270,857,477 3,118 15,099,503 54 14,740 76 19,33179 151 468,802 2,341,646,613 3,113 15,569,528 54 15,229 76 20,02380 146 467,776 2,409,941,895 3,107 16,023,161 54 15,703 77 20,69781 123 466,718 2,467,348,202 3,101 16,404,634 54 16,103 78 21,26982 174 465,629 2,548,367,566 3,096 16,943,297 54 16,671 78 22,08583 174 464,508 2,629,191,974 3,090 17,480,981 55 17,240 79 22,90684 173 463,357 2,709,352,779 3,085 18,014,607 55 17,807 79 23,73085 172 462,177 2,788,847,190 3,079 18,544,192 55 18,373 80 24,55486 170 460,968 2,867,211,715 3,073 19,066,679 55 18,933 81 25,37687 167 459,731 2,943,986,865 3,068 19,579,030 55 19,485 81 26,18988 163 458,469 3,018,717,339 3,063 20,078,223 55 20,026 82 26,98989 161 457,183 3,092,323,739 3,057 20,570,424 55 20,561 82 27,78690 155 455,874 3,162,984,149 3,052 21,043,456 56 21,078 83 28,56091 152 454,544 3,232,074,871 3,047 21,506,532 56 21,586 84 29,32492 146 453,197 3,298,241,586 3,041 21,950,570 56 22,076 85 30,06593 142 451,833 3,362,401,934 3,036 22,381,716 56 22,554 85 30,79294 136 450,457 3,423,664,106 3,031 22,793,960 56 23,013 86 31,49495 130 449,071 3,482,043,295 3,026 23,187,373 56 23,453 87 32,17196 124 447,677 3,537,555,256 3,021 23,562,028 57 23,874 88 32,82397 119 446,280 3,590,662,536 3,017 23,921,010 57 24,280 88 33,45498 112 444,882 3,640,489,303 3,012 24,258,356 57 24,664 89 34,05599 106 443,487 3,687,498,960 3,008 24,577,152 57 25,028 90 34,628100 100 442,100 3,731,708,960 3,003 24,877,463 57 25,373 91 35,175101 94 440,724 3,773,137,010 2,999 25,159,355 58 25,698 92 35,694102 87 439,363 3,811,361,627 2,995 25,419,897 58 26,001 93 36,180103 82 438,023 3,847,279,508 2,991 25,665,140 58 26,287 94 36,643104 76 436,707 3,880,469,258 2,987 25,892,149 58 26,553 95 37,076105 70 435,421 3,910,948,738 2,983 26,100,983 59 26,800 96 37,481106 65 434,170 3,939,169,777 2,980 26,294,674 59 27,030 97 37,861107 59 432,959 3,964,714,332 2,977 26,470,294 59 27,240 99 38,210108 55 431,793 3,988,462,941 2,974 26,633,838 60 27,437 100 38,539109 51 430,679 4,010,427,545 2,971 26,785,342 60 27,620 101 38,849110 46 429,621 4,030,190,126 2,968 26,921,870 60 27,787 103 39,132111 43 428,628 4,048,621,109 2,966 27,049,391 61 27,943 104 39,400112 39 427,703 4,065,301,540 2,963 27,164,964 61 28,086 105 39,646113 40 426,855 4,082,375,758 2,961 27,283,422 61 28,233 107 39,903114 12 426,090 4,087,488,843 2,960 27,318,940 62 28,278 109 39,981115 10 425,415 4,091,742,997 2,958 27,348,524 62 28,315 110 40,047116 7 424,837 4,094,716,858 2,957 27,369,224 63 28,341 112 40,094117 1 424,364 4,095,056,349 2,956 27,371,590 63 28,344 114 40,100118 1 424,002 4,095,395,551 2,956 27,373,954 64 28,347 116 40,105119 1 423,760 4,095,734,559 2,956 27,376,319 64 28,350 118 40,111120 1 423,646 4,096,073,475 2,956 27,378,684 65 28,354 120 40,117121 1 423,667 4,096,412,409 2,956 27,381,049 65 28,357 122 40,122122 0 423,833 4,096,412,409 2,957 27,381,049 66 28,357 124 40,122
Freshwater
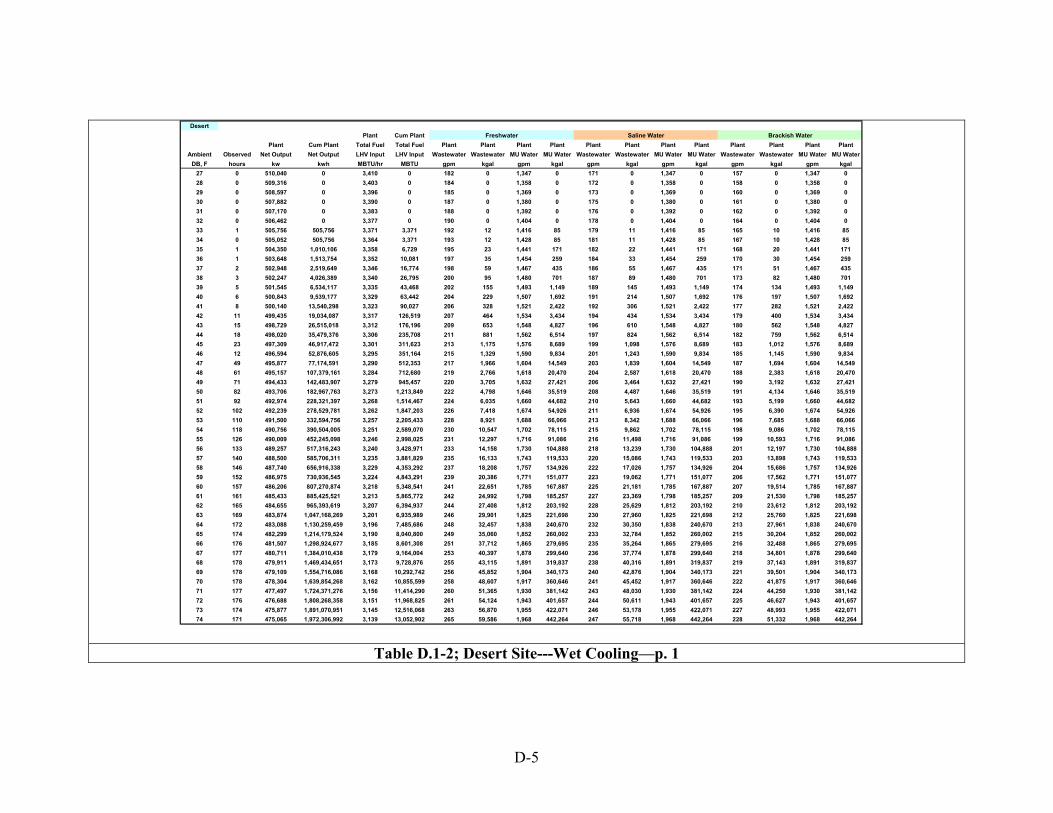
D-5
Table D.1-2; Desert Site---Wet Cooling—p. 1
DesertPlant Cum Plant
Plant Cum Plant Total Fuel Total Fuel Plant Plant Plant Plant Plant Plant Plant Plant Plant Plant Plant PlantAmbient Observed Net Output Net Output LHV Input LHV Input Wastewater Wastewater MU Water MU Water Wastewater Wastewater MU Water MU Water Wastewater Wastewater MU Water MU Water
DB, F hours kw kwh MBTU/hr MBTU gpm kgal gpm kgal gpm kgal gpm kgal gpm kgal gpm kgal27 0 510,040 0 3,410 0 182 0 1,347 0 171 0 1,347 0 157 0 1,347 028 0 509,316 0 3,403 0 184 0 1,358 0 172 0 1,358 0 158 0 1,358 029 0 508,597 0 3,396 0 185 0 1,369 0 173 0 1,369 0 160 0 1,369 030 0 507,882 0 3,390 0 187 0 1,380 0 175 0 1,380 0 161 0 1,380 031 0 507,170 0 3,383 0 188 0 1,392 0 176 0 1,392 0 162 0 1,392 032 0 506,462 0 3,377 0 190 0 1,404 0 178 0 1,404 0 164 0 1,404 033 1 505,756 505,756 3,371 3,371 192 12 1,416 85 179 11 1,416 85 165 10 1,416 8534 0 505,052 505,756 3,364 3,371 193 12 1,428 85 181 11 1,428 85 167 10 1,428 8535 1 504,350 1,010,106 3,358 6,729 195 23 1,441 171 182 22 1,441 171 168 20 1,441 17136 1 503,648 1,513,754 3,352 10,081 197 35 1,454 259 184 33 1,454 259 170 30 1,454 25937 2 502,948 2,519,649 3,346 16,774 198 59 1,467 435 186 55 1,467 435 171 51 1,467 43538 3 502,247 4,026,389 3,340 26,795 200 95 1,480 701 187 89 1,480 701 173 82 1,480 70139 5 501,545 6,534,117 3,335 43,468 202 155 1,493 1,149 189 145 1,493 1,149 174 134 1,493 1,14940 6 500,843 9,539,177 3,329 63,442 204 229 1,507 1,692 191 214 1,507 1,692 176 197 1,507 1,69241 8 500,140 13,540,298 3,323 90,027 206 328 1,521 2,422 192 306 1,521 2,422 177 282 1,521 2,42242 11 499,435 19,034,087 3,317 126,519 207 464 1,534 3,434 194 434 1,534 3,434 179 400 1,534 3,43443 15 498,729 26,515,018 3,312 176,196 209 653 1,548 4,827 196 610 1,548 4,827 180 562 1,548 4,82744 18 498,020 35,479,376 3,306 235,708 211 881 1,562 6,514 197 824 1,562 6,514 182 759 1,562 6,51445 23 497,309 46,917,472 3,301 311,623 213 1,175 1,576 8,689 199 1,098 1,576 8,689 183 1,012 1,576 8,68946 12 496,594 52,876,605 3,295 351,164 215 1,329 1,590 9,834 201 1,243 1,590 9,834 185 1,145 1,590 9,83447 49 495,877 77,174,591 3,290 512,353 217 1,966 1,604 14,549 203 1,839 1,604 14,549 187 1,694 1,604 14,54948 61 495,157 107,379,161 3,284 712,680 219 2,766 1,618 20,470 204 2,587 1,618 20,470 188 2,383 1,618 20,47049 71 494,433 142,483,907 3,279 945,457 220 3,705 1,632 27,421 206 3,464 1,632 27,421 190 3,192 1,632 27,42150 82 493,706 182,967,763 3,273 1,213,849 222 4,798 1,646 35,519 208 4,487 1,646 35,519 191 4,134 1,646 35,51951 92 492,974 228,321,397 3,268 1,514,467 224 6,035 1,660 44,682 210 5,643 1,660 44,682 193 5,199 1,660 44,68252 102 492,239 278,529,781 3,262 1,847,203 226 7,418 1,674 54,926 211 6,936 1,674 54,926 195 6,390 1,674 54,92653 110 491,500 332,594,756 3,257 2,205,433 228 8,921 1,688 66,066 213 8,342 1,688 66,066 196 7,685 1,688 66,06654 118 490,756 390,504,005 3,251 2,589,070 230 10,547 1,702 78,115 215 9,862 1,702 78,115 198 9,086 1,702 78,11555 126 490,009 452,245,098 3,246 2,998,025 231 12,297 1,716 91,086 216 11,498 1,716 91,086 199 10,593 1,716 91,08656 133 489,257 517,316,243 3,240 3,428,971 233 14,158 1,730 104,888 218 13,239 1,730 104,888 201 12,197 1,730 104,88857 140 488,500 585,706,311 3,235 3,881,829 235 16,133 1,743 119,533 220 15,086 1,743 119,533 203 13,898 1,743 119,53358 146 487,740 656,916,338 3,229 4,353,292 237 18,208 1,757 134,926 222 17,026 1,757 134,926 204 15,686 1,757 134,92659 152 486,975 730,936,545 3,224 4,843,291 239 20,386 1,771 151,077 223 19,062 1,771 151,077 206 17,562 1,771 151,07760 157 486,206 807,270,874 3,218 5,348,541 241 22,651 1,785 167,887 225 21,181 1,785 167,887 207 19,514 1,785 167,88761 161 485,433 885,425,521 3,213 5,865,772 242 24,992 1,798 185,257 227 23,369 1,798 185,257 209 21,530 1,798 185,25762 165 484,655 965,393,619 3,207 6,394,937 244 27,408 1,812 203,192 228 25,629 1,812 203,192 210 23,612 1,812 203,19263 169 483,874 1,047,168,269 3,201 6,935,989 246 29,901 1,825 221,698 230 27,960 1,825 221,698 212 25,760 1,825 221,69864 172 483,088 1,130,259,459 3,196 7,485,686 248 32,457 1,838 240,670 232 30,350 1,838 240,670 213 27,961 1,838 240,67065 174 482,299 1,214,179,524 3,190 8,040,800 249 35,060 1,852 260,002 233 32,784 1,852 260,002 215 30,204 1,852 260,00266 176 481,507 1,298,924,677 3,185 8,601,308 251 37,712 1,865 279,695 235 35,264 1,865 279,695 216 32,488 1,865 279,69567 177 480,711 1,384,010,438 3,179 9,164,004 253 40,397 1,878 299,640 236 37,774 1,878 299,640 218 34,801 1,878 299,64068 178 479,911 1,469,434,651 3,173 9,728,876 255 43,115 1,891 319,837 238 40,316 1,891 319,837 219 37,143 1,891 319,83769 178 479,109 1,554,716,086 3,168 10,292,742 256 45,852 1,904 340,173 240 42,876 1,904 340,173 221 39,501 1,904 340,17370 178 478,304 1,639,854,268 3,162 10,855,599 258 48,607 1,917 360,646 241 45,452 1,917 360,646 222 41,875 1,917 360,64671 177 477,497 1,724,371,276 3,156 11,414,290 260 51,365 1,930 381,142 243 48,030 1,930 381,142 224 44,250 1,930 381,14272 176 476,688 1,808,268,358 3,151 11,968,825 261 54,124 1,943 401,657 244 50,611 1,943 401,657 225 46,627 1,943 401,65773 174 475,877 1,891,070,951 3,145 12,516,068 263 56,870 1,955 422,071 246 53,178 1,955 422,071 227 48,993 1,955 422,07174 171 475,065 1,972,306,992 3,139 13,052,902 265 59,586 1,968 442,264 247 55,718 1,968 442,264 228 51,332 1,968 442,264
Freshwater Saline Water Brackish Water
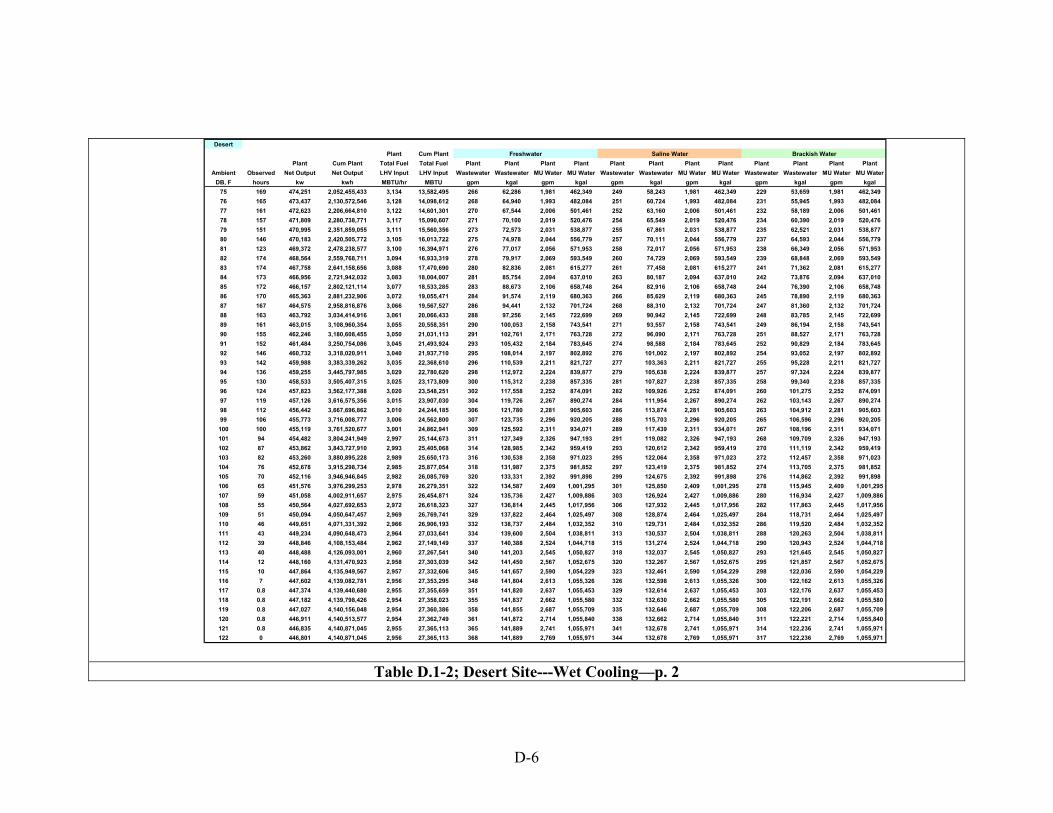
D-6
Table D.1-2; Desert Site---Wet Cooling—p. 2
DesertPlant Cum Plant
Plant Cum Plant Total Fuel Total Fuel Plant Plant Plant Plant Plant Plant Plant Plant Plant Plant Plant PlantAmbient Observed Net Output Net Output LHV Input LHV Input Wastewater Wastewater MU Water MU Water Wastewater Wastewater MU Water MU Water Wastewater Wastewater MU Water MU Water
DB, F hours kw kwh MBTU/hr MBTU gpm kgal gpm kgal gpm kgal gpm kgal gpm kgal gpm kgal75 169 474,251 2,052,455,433 3,134 13,582,495 266 62,286 1,981 462,349 249 58,243 1,981 462,349 229 53,659 1,981 462,34976 165 473,437 2,130,572,546 3,128 14,098,612 268 64,940 1,993 482,084 251 60,724 1,993 482,084 231 55,945 1,993 482,08477 161 472,623 2,206,664,810 3,122 14,601,301 270 67,544 2,006 501,461 252 63,160 2,006 501,461 232 58,189 2,006 501,46178 157 471,809 2,280,738,771 3,117 15,090,607 271 70,100 2,019 520,476 254 65,549 2,019 520,476 234 60,390 2,019 520,47679 151 470,995 2,351,859,055 3,111 15,560,356 273 72,573 2,031 538,877 255 67,861 2,031 538,877 235 62,521 2,031 538,87780 146 470,183 2,420,505,772 3,105 16,013,722 275 74,978 2,044 556,779 257 70,111 2,044 556,779 237 64,593 2,044 556,77981 123 469,372 2,478,238,577 3,100 16,394,971 276 77,017 2,056 571,953 258 72,017 2,056 571,953 238 66,349 2,056 571,95382 174 468,564 2,559,768,711 3,094 16,933,319 278 79,917 2,069 593,549 260 74,729 2,069 593,549 239 68,848 2,069 593,54983 174 467,758 2,641,158,656 3,088 17,470,690 280 82,836 2,081 615,277 261 77,458 2,081 615,277 241 71,362 2,081 615,27784 173 466,956 2,721,942,032 3,083 18,004,007 281 85,754 2,094 637,010 263 80,187 2,094 637,010 242 73,876 2,094 637,01085 172 466,157 2,802,121,114 3,077 18,533,285 283 88,673 2,106 658,748 264 82,916 2,106 658,748 244 76,390 2,106 658,74886 170 465,363 2,881,232,906 3,072 19,055,471 284 91,574 2,119 680,363 266 85,629 2,119 680,363 245 78,890 2,119 680,36387 167 464,575 2,958,816,876 3,066 19,567,527 286 94,441 2,132 701,724 268 88,310 2,132 701,724 247 81,360 2,132 701,72488 163 463,792 3,034,414,916 3,061 20,066,433 288 97,256 2,145 722,699 269 90,942 2,145 722,699 248 83,785 2,145 722,69989 161 463,015 3,108,960,354 3,055 20,558,351 290 100,053 2,158 743,541 271 93,557 2,158 743,541 249 86,194 2,158 743,54190 155 462,246 3,180,608,455 3,050 21,031,113 291 102,761 2,171 763,728 272 96,090 2,171 763,728 251 88,527 2,171 763,72891 152 461,484 3,250,754,086 3,045 21,493,924 293 105,432 2,184 783,645 274 98,588 2,184 783,645 252 90,829 2,184 783,64592 146 460,732 3,318,020,911 3,040 21,937,710 295 108,014 2,197 802,892 276 101,002 2,197 802,892 254 93,052 2,197 802,89293 142 459,988 3,383,339,262 3,035 22,368,610 296 110,539 2,211 821,727 277 103,363 2,211 821,727 255 95,228 2,211 821,72794 136 459,255 3,445,797,985 3,029 22,780,620 298 112,972 2,224 839,877 279 105,638 2,224 839,877 257 97,324 2,224 839,87795 130 458,533 3,505,407,315 3,025 23,173,809 300 115,312 2,238 857,335 281 107,827 2,238 857,335 258 99,340 2,238 857,33596 124 457,823 3,562,177,388 3,020 23,548,251 302 117,558 2,252 874,091 282 109,926 2,252 874,091 260 101,275 2,252 874,09197 119 457,126 3,616,575,356 3,015 23,907,030 304 119,726 2,267 890,274 284 111,954 2,267 890,274 262 103,143 2,267 890,27498 112 456,442 3,667,696,862 3,010 24,244,185 306 121,780 2,281 905,603 286 113,874 2,281 905,603 263 104,912 2,281 905,60399 106 455,773 3,716,008,777 3,006 24,562,800 307 123,735 2,296 920,205 288 115,703 2,296 920,205 265 106,596 2,296 920,205100 100 455,119 3,761,520,677 3,001 24,862,941 309 125,592 2,311 934,071 289 117,439 2,311 934,071 267 108,196 2,311 934,071101 94 454,482 3,804,241,949 2,997 25,144,673 311 127,349 2,326 947,193 291 119,082 2,326 947,193 268 109,709 2,326 947,193102 87 453,862 3,843,727,910 2,993 25,405,068 314 128,985 2,342 959,419 293 120,612 2,342 959,419 270 111,119 2,342 959,419103 82 453,260 3,880,895,228 2,989 25,650,173 316 130,538 2,358 971,023 295 122,064 2,358 971,023 272 112,457 2,358 971,023104 76 452,678 3,915,298,734 2,985 25,877,054 318 131,987 2,375 981,852 297 123,419 2,375 981,852 274 113,705 2,375 981,852105 70 452,116 3,946,946,845 2,982 26,085,769 320 133,331 2,392 991,898 299 124,675 2,392 991,898 276 114,862 2,392 991,898106 65 451,576 3,976,299,253 2,978 26,279,351 322 134,587 2,409 1,001,295 301 125,850 2,409 1,001,295 278 115,945 2,409 1,001,295107 59 451,058 4,002,911,657 2,975 26,454,871 324 135,736 2,427 1,009,886 303 126,924 2,427 1,009,886 280 116,934 2,427 1,009,886108 55 450,564 4,027,692,653 2,972 26,618,323 327 136,814 2,445 1,017,956 306 127,932 2,445 1,017,956 282 117,863 2,445 1,017,956109 51 450,094 4,050,647,457 2,969 26,769,741 329 137,822 2,464 1,025,497 308 128,874 2,464 1,025,497 284 118,731 2,464 1,025,497110 46 449,651 4,071,331,392 2,966 26,906,193 332 138,737 2,484 1,032,352 310 129,731 2,484 1,032,352 286 119,520 2,484 1,032,352111 43 449,234 4,090,648,473 2,964 27,033,641 334 139,600 2,504 1,038,811 313 130,537 2,504 1,038,811 288 120,263 2,504 1,038,811112 39 448,846 4,108,153,484 2,962 27,149,149 337 140,388 2,524 1,044,718 315 131,274 2,524 1,044,718 290 120,943 2,524 1,044,718113 40 448,488 4,126,093,001 2,960 27,267,541 340 141,203 2,545 1,050,827 318 132,037 2,545 1,050,827 293 121,645 2,545 1,050,827114 12 448,160 4,131,470,923 2,958 27,303,039 342 141,450 2,567 1,052,675 320 132,267 2,567 1,052,675 295 121,857 2,567 1,052,675115 10 447,864 4,135,949,567 2,957 27,332,606 345 141,657 2,590 1,054,229 323 132,461 2,590 1,054,229 298 122,036 2,590 1,054,229116 7 447,602 4,139,082,781 2,956 27,353,295 348 141,804 2,613 1,055,326 326 132,598 2,613 1,055,326 300 122,162 2,613 1,055,326117 0.8 447,374 4,139,440,680 2,955 27,355,659 351 141,820 2,637 1,055,453 329 132,614 2,637 1,055,453 303 122,176 2,637 1,055,453118 0.8 447,182 4,139,798,426 2,954 27,358,023 355 141,837 2,662 1,055,580 332 132,630 2,662 1,055,580 305 122,191 2,662 1,055,580119 0.8 447,027 4,140,156,048 2,954 27,360,386 358 141,855 2,687 1,055,709 335 132,646 2,687 1,055,709 308 122,206 2,687 1,055,709120 0.8 446,911 4,140,513,577 2,954 27,362,749 361 141,872 2,714 1,055,840 338 132,662 2,714 1,055,840 311 122,221 2,714 1,055,840121 0.8 446,835 4,140,871,045 2,955 27,365,113 365 141,889 2,741 1,055,971 341 132,678 2,741 1,055,971 314 122,236 2,741 1,055,971122 0 446,801 4,140,871,045 2,956 27,365,113 368 141,889 2,769 1,055,971 344 132,678 2,769 1,055,971 317 122,236 2,769 1,055,971
Freshwater Saline Water Brackish Water

D-7
D.2 Valley Site
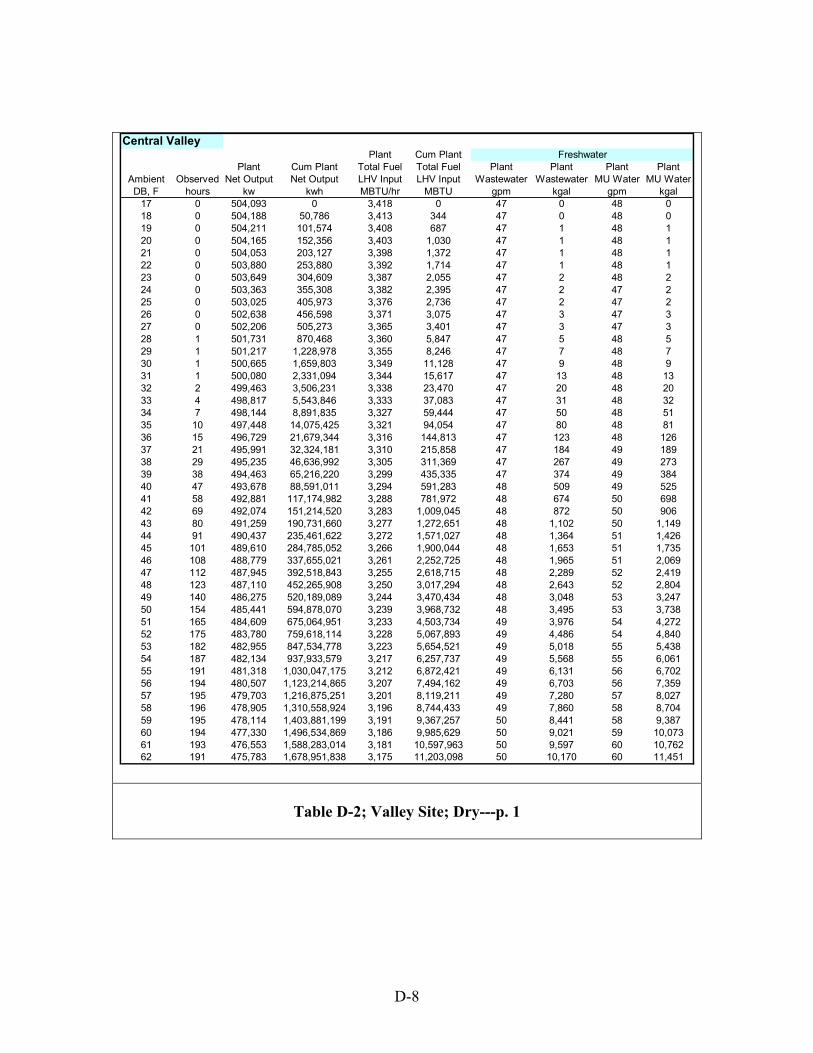
D-8
Table D-2; Valley Site; Dry---p. 1
Central ValleyPlant Cum Plant
Plant Cum Plant Total Fuel Total Fuel Plant Plant Plant PlantAmbient Observed Net Output Net Output LHV Input LHV Input Wastewater Wastewater MU Water MU WaterDB, F hours kw kwh MBTU/hr MBTU gpm kgal gpm kgal
17 0 504,093 0 3,418 0 47 0 48 018 0 504,188 50,786 3,413 344 47 0 48 019 0 504,211 101,574 3,408 687 47 1 48 120 0 504,165 152,356 3,403 1,030 47 1 48 121 0 504,053 203,127 3,398 1,372 47 1 48 122 0 503,880 253,880 3,392 1,714 47 1 48 123 0 503,649 304,609 3,387 2,055 47 2 48 224 0 503,363 355,308 3,382 2,395 47 2 47 225 0 503,025 405,973 3,376 2,736 47 2 47 226 0 502,638 456,598 3,371 3,075 47 3 47 327 0 502,206 505,273 3,365 3,401 47 3 47 328 1 501,731 870,468 3,360 5,847 47 5 48 529 1 501,217 1,228,978 3,355 8,246 47 7 48 730 1 500,665 1,659,803 3,349 11,128 47 9 48 931 1 500,080 2,331,094 3,344 15,617 47 13 48 1332 2 499,463 3,506,231 3,338 23,470 47 20 48 2033 4 498,817 5,543,846 3,333 37,083 47 31 48 3234 7 498,144 8,891,835 3,327 59,444 47 50 48 5135 10 497,448 14,075,425 3,321 94,054 47 80 48 8136 15 496,729 21,679,344 3,316 144,813 47 123 48 12637 21 495,991 32,324,181 3,310 215,858 47 184 49 18938 29 495,235 46,636,992 3,305 311,369 47 267 49 27339 38 494,463 65,216,220 3,299 435,335 47 374 49 38440 47 493,678 88,591,011 3,294 591,283 48 509 49 52541 58 492,881 117,174,982 3,288 781,972 48 674 50 69842 69 492,074 151,214,520 3,283 1,009,045 48 872 50 90643 80 491,259 190,731,660 3,277 1,272,651 48 1,102 50 1,14944 91 490,437 235,461,622 3,272 1,571,027 48 1,364 51 1,42645 101 489,610 284,785,052 3,266 1,900,044 48 1,653 51 1,73546 108 488,779 337,655,021 3,261 2,252,725 48 1,965 51 2,06947 112 487,945 392,518,843 3,255 2,618,715 48 2,289 52 2,41948 123 487,110 452,265,908 3,250 3,017,294 48 2,643 52 2,80449 140 486,275 520,189,089 3,244 3,470,434 48 3,048 53 3,24750 154 485,441 594,878,070 3,239 3,968,732 48 3,495 53 3,73851 165 484,609 675,064,951 3,233 4,503,734 49 3,976 54 4,27252 175 483,780 759,618,114 3,228 5,067,893 49 4,486 54 4,84053 182 482,955 847,534,778 3,223 5,654,521 49 5,018 55 5,43854 187 482,134 937,933,579 3,217 6,257,737 49 5,568 55 6,06155 191 481,318 1,030,047,175 3,212 6,872,421 49 6,131 56 6,70256 194 480,507 1,123,214,865 3,207 7,494,162 49 6,703 56 7,35957 195 479,703 1,216,875,251 3,201 8,119,211 49 7,280 57 8,02758 196 478,905 1,310,558,924 3,196 8,744,433 49 7,860 58 8,70459 195 478,114 1,403,881,199 3,191 9,367,257 50 8,441 58 9,38760 194 477,330 1,496,534,869 3,186 9,985,629 50 9,021 59 10,07361 193 476,553 1,588,283,014 3,181 10,597,963 50 9,597 60 10,76262 191 475,783 1,678,951,838 3,175 11,203,098 50 10,170 60 11,451
Freshwater
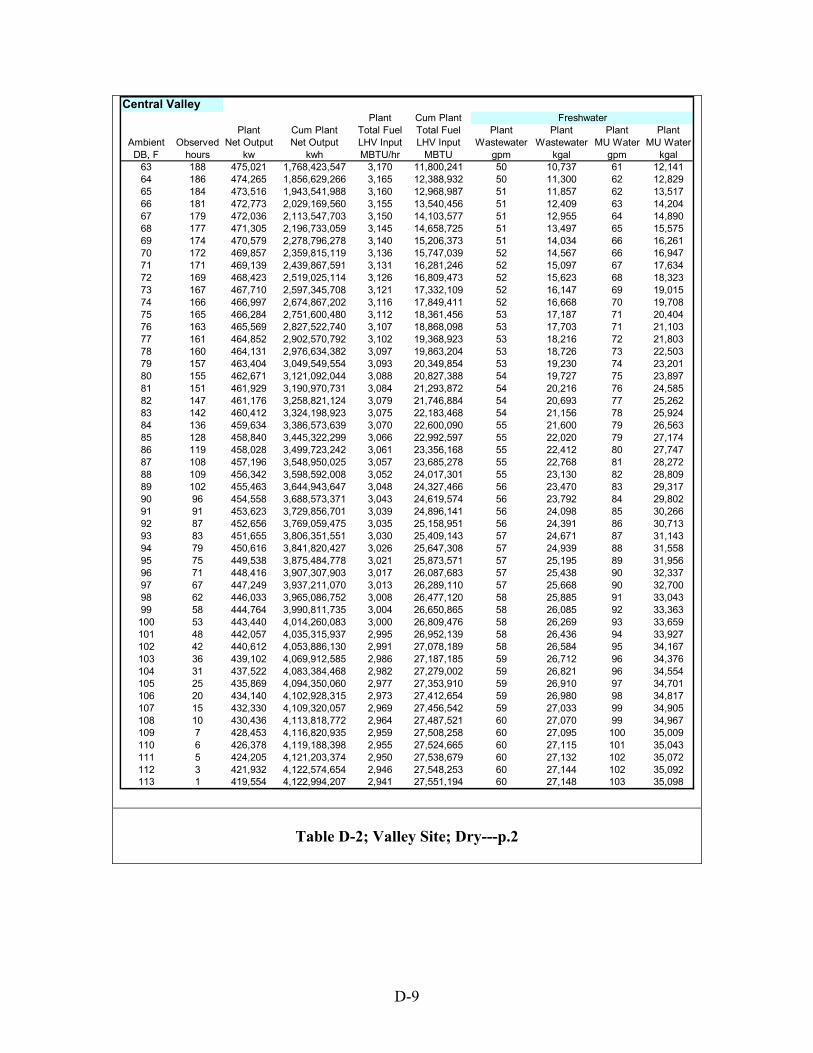
D-9
Table D-2; Valley Site; Dry---p.2
Central ValleyPlant Cum Plant
Plant Cum Plant Total Fuel Total Fuel Plant Plant Plant PlantAmbient Observed Net Output Net Output LHV Input LHV Input Wastewater Wastewater MU Water MU WaterDB, F hours kw kwh MBTU/hr MBTU gpm kgal gpm kgal
63 188 475,021 1,768,423,547 3,170 11,800,241 50 10,737 61 12,14164 186 474,265 1,856,629,266 3,165 12,388,932 50 11,300 62 12,82965 184 473,516 1,943,541,988 3,160 12,968,987 51 11,857 62 13,51766 181 472,773 2,029,169,560 3,155 13,540,456 51 12,409 63 14,20467 179 472,036 2,113,547,703 3,150 14,103,577 51 12,955 64 14,89068 177 471,305 2,196,733,059 3,145 14,658,725 51 13,497 65 15,57569 174 470,579 2,278,796,278 3,140 15,206,373 51 14,034 66 16,26170 172 469,857 2,359,815,119 3,136 15,747,039 52 14,567 66 16,94771 171 469,139 2,439,867,591 3,131 16,281,246 52 15,097 67 17,63472 169 468,423 2,519,025,114 3,126 16,809,473 52 15,623 68 18,32373 167 467,710 2,597,345,708 3,121 17,332,109 52 16,147 69 19,01574 166 466,997 2,674,867,202 3,116 17,849,411 52 16,668 70 19,70875 165 466,284 2,751,600,480 3,112 18,361,456 53 17,187 71 20,40476 163 465,569 2,827,522,740 3,107 18,868,098 53 17,703 71 21,10377 161 464,852 2,902,570,792 3,102 19,368,923 53 18,216 72 21,80378 160 464,131 2,976,634,382 3,097 19,863,204 53 18,726 73 22,50379 157 463,404 3,049,549,554 3,093 20,349,854 53 19,230 74 23,20180 155 462,671 3,121,092,044 3,088 20,827,388 54 19,727 75 23,89781 151 461,929 3,190,970,731 3,084 21,293,872 54 20,216 76 24,58582 147 461,176 3,258,821,124 3,079 21,746,884 54 20,693 77 25,26283 142 460,412 3,324,198,923 3,075 22,183,468 54 21,156 78 25,92484 136 459,634 3,386,573,639 3,070 22,600,090 55 21,600 79 26,56385 128 458,840 3,445,322,299 3,066 22,992,597 55 22,020 79 27,17486 119 458,028 3,499,723,242 3,061 23,356,168 55 22,412 80 27,74787 108 457,196 3,548,950,025 3,057 23,685,278 55 22,768 81 28,27288 109 456,342 3,598,592,008 3,052 24,017,301 55 23,130 82 28,80989 102 455,463 3,644,943,647 3,048 24,327,466 56 23,470 83 29,31790 96 454,558 3,688,573,371 3,043 24,619,574 56 23,792 84 29,80291 91 453,623 3,729,856,701 3,039 24,896,141 56 24,098 85 30,26692 87 452,656 3,769,059,475 3,035 25,158,951 56 24,391 86 30,71393 83 451,655 3,806,351,551 3,030 25,409,143 57 24,671 87 31,14394 79 450,616 3,841,820,427 3,026 25,647,308 57 24,939 88 31,55895 75 449,538 3,875,484,778 3,021 25,873,571 57 25,195 89 31,95696 71 448,416 3,907,307,903 3,017 26,087,683 57 25,438 90 32,33797 67 447,249 3,937,211,070 3,013 26,289,110 57 25,668 90 32,70098 62 446,033 3,965,086,752 3,008 26,477,120 58 25,885 91 33,04399 58 444,764 3,990,811,735 3,004 26,650,865 58 26,085 92 33,363100 53 443,440 4,014,260,083 3,000 26,809,476 58 26,269 93 33,659101 48 442,057 4,035,315,937 2,995 26,952,139 58 26,436 94 33,927102 42 440,612 4,053,886,130 2,991 27,078,189 58 26,584 95 34,167103 36 439,102 4,069,912,585 2,986 27,187,185 59 26,712 96 34,376104 31 437,522 4,083,384,468 2,982 27,279,002 59 26,821 96 34,554105 25 435,869 4,094,350,060 2,977 27,353,910 59 26,910 97 34,701106 20 434,140 4,102,928,315 2,973 27,412,654 59 26,980 98 34,817107 15 432,330 4,109,320,057 2,969 27,456,542 59 27,033 99 34,905108 10 430,436 4,113,818,772 2,964 27,487,521 60 27,070 99 34,967109 7 428,453 4,116,820,935 2,959 27,508,258 60 27,095 100 35,009110 6 426,378 4,119,188,398 2,955 27,524,665 60 27,115 101 35,043111 5 424,205 4,121,203,374 2,950 27,538,679 60 27,132 102 35,072112 3 421,932 4,122,574,654 2,946 27,548,253 60 27,144 102 35,092113 1 419,554 4,122,994,207 2,941 27,551,194 60 27,148 103 35,098
Freshwater
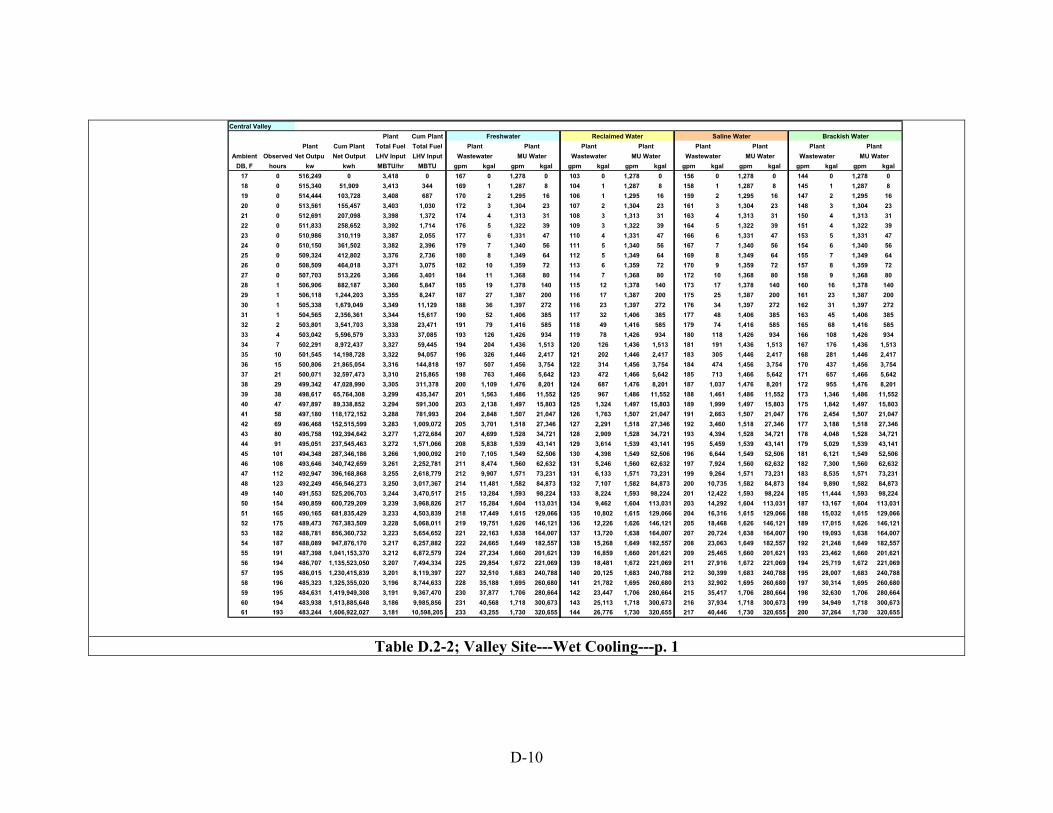
D-10
Table D.2-2; Valley Site---Wet Cooling---p. 1
Central ValleyPlant Cum Plant
Plant Cum Plant Total Fuel Total FuelAmbient Observed Net Output Net Output LHV Input LHV Input
DB, F hours kw kwh MBTU/hr MBTU gpm kgal gpm kgal gpm kgal gpm kgal gpm kgal gpm kgal gpm kgal gpm kgal17 0 516,249 0 3,418 0 167 0 1,278 0 103 0 1,278 0 156 0 1,278 0 144 0 1,278 018 0 515,340 51,909 3,413 344 169 1 1,287 8 104 1 1,287 8 158 1 1,287 8 145 1 1,287 819 0 514,444 103,728 3,408 687 170 2 1,295 16 106 1 1,295 16 159 2 1,295 16 147 2 1,295 1620 0 513,561 155,457 3,403 1,030 172 3 1,304 23 107 2 1,304 23 161 3 1,304 23 148 3 1,304 2321 0 512,691 207,098 3,398 1,372 174 4 1,313 31 108 3 1,313 31 163 4 1,313 31 150 4 1,313 3122 0 511,833 258,652 3,392 1,714 176 5 1,322 39 109 3 1,322 39 164 5 1,322 39 151 4 1,322 3923 0 510,986 310,119 3,387 2,055 177 6 1,331 47 110 4 1,331 47 166 6 1,331 47 153 5 1,331 4724 0 510,150 361,502 3,382 2,396 179 7 1,340 56 111 5 1,340 56 167 7 1,340 56 154 6 1,340 5625 0 509,324 412,802 3,376 2,736 180 8 1,349 64 112 5 1,349 64 169 8 1,349 64 155 7 1,349 6426 0 508,509 464,018 3,371 3,075 182 10 1,359 72 113 6 1,359 72 170 9 1,359 72 157 8 1,359 7227 0 507,703 513,226 3,366 3,401 184 11 1,368 80 114 7 1,368 80 172 10 1,368 80 158 9 1,368 8028 1 506,906 882,187 3,360 5,847 185 19 1,378 140 115 12 1,378 140 173 17 1,378 140 160 16 1,378 14029 1 506,118 1,244,203 3,355 8,247 187 27 1,387 200 116 17 1,387 200 175 25 1,387 200 161 23 1,387 20030 1 505,338 1,679,049 3,349 11,129 188 36 1,397 272 116 23 1,397 272 176 34 1,397 272 162 31 1,397 27231 1 504,565 2,356,361 3,344 15,617 190 52 1,406 385 117 32 1,406 385 177 48 1,406 385 163 45 1,406 38532 2 503,801 3,541,703 3,338 23,471 191 79 1,416 585 118 49 1,416 585 179 74 1,416 585 165 68 1,416 58533 4 503,042 5,596,579 3,333 37,085 193 126 1,426 934 119 78 1,426 934 180 118 1,426 934 166 108 1,426 93434 7 502,291 8,972,437 3,327 59,445 194 204 1,436 1,513 120 126 1,436 1,513 181 191 1,436 1,513 167 176 1,436 1,51335 10 501,545 14,198,728 3,322 94,057 196 326 1,446 2,417 121 202 1,446 2,417 183 305 1,446 2,417 168 281 1,446 2,41736 15 500,806 21,865,054 3,316 144,818 197 507 1,456 3,754 122 314 1,456 3,754 184 474 1,456 3,754 170 437 1,456 3,75437 21 500,071 32,597,473 3,310 215,865 198 763 1,466 5,642 123 472 1,466 5,642 185 713 1,466 5,642 171 657 1,466 5,64238 29 499,342 47,028,990 3,305 311,378 200 1,109 1,476 8,201 124 687 1,476 8,201 187 1,037 1,476 8,201 172 955 1,476 8,20139 38 498,617 65,764,308 3,299 435,347 201 1,563 1,486 11,552 125 967 1,486 11,552 188 1,461 1,486 11,552 173 1,346 1,486 11,55240 47 497,897 89,338,852 3,294 591,300 203 2,138 1,497 15,803 125 1,324 1,497 15,803 189 1,999 1,497 15,803 175 1,842 1,497 15,80341 58 497,180 118,172,152 3,288 781,993 204 2,848 1,507 21,047 126 1,763 1,507 21,047 191 2,663 1,507 21,047 176 2,454 1,507 21,04742 69 496,468 152,515,599 3,283 1,009,072 205 3,701 1,518 27,346 127 2,291 1,518 27,346 192 3,460 1,518 27,346 177 3,188 1,518 27,34643 80 495,758 192,394,642 3,277 1,272,684 207 4,699 1,528 34,721 128 2,909 1,528 34,721 193 4,394 1,528 34,721 178 4,048 1,528 34,72144 91 495,051 237,545,463 3,272 1,571,066 208 5,838 1,539 43,141 129 3,614 1,539 43,141 195 5,459 1,539 43,141 179 5,029 1,539 43,14145 101 494,348 287,346,186 3,266 1,900,092 210 7,105 1,549 52,506 130 4,398 1,549 52,506 196 6,644 1,549 52,506 181 6,121 1,549 52,50646 108 493,646 340,742,659 3,261 2,252,781 211 8,474 1,560 62,632 131 5,246 1,560 62,632 197 7,924 1,560 62,632 182 7,300 1,560 62,63247 112 492,947 396,168,868 3,255 2,618,779 212 9,907 1,571 73,231 131 6,133 1,571 73,231 199 9,264 1,571 73,231 183 8,535 1,571 73,23148 123 492,249 456,546,273 3,250 3,017,367 214 11,481 1,582 84,873 132 7,107 1,582 84,873 200 10,735 1,582 84,873 184 9,890 1,582 84,87349 140 491,553 525,206,703 3,244 3,470,517 215 13,284 1,593 98,224 133 8,224 1,593 98,224 201 12,422 1,593 98,224 185 11,444 1,593 98,22450 154 490,859 600,729,209 3,239 3,968,826 217 15,284 1,604 113,031 134 9,462 1,604 113,031 203 14,292 1,604 113,031 187 13,167 1,604 113,03151 165 490,165 681,835,429 3,233 4,503,839 218 17,449 1,615 129,066 135 10,802 1,615 129,066 204 16,316 1,615 129,066 188 15,032 1,615 129,06652 175 489,473 767,383,509 3,228 5,068,011 219 19,751 1,626 146,121 136 12,226 1,626 146,121 205 18,468 1,626 146,121 189 17,015 1,626 146,12153 182 488,781 856,360,732 3,223 5,654,652 221 22,163 1,638 164,007 137 13,720 1,638 164,007 207 20,724 1,638 164,007 190 19,093 1,638 164,00754 187 488,089 947,876,170 3,217 6,257,882 222 24,665 1,649 182,557 138 15,268 1,649 182,557 208 23,063 1,649 182,557 192 21,248 1,649 182,55755 191 487,398 1,041,153,370 3,212 6,872,579 224 27,234 1,660 201,621 139 16,859 1,660 201,621 209 25,465 1,660 201,621 193 23,462 1,660 201,62156 194 486,707 1,135,523,050 3,207 7,494,334 225 29,854 1,672 221,069 139 18,481 1,672 221,069 211 27,916 1,672 221,069 194 25,719 1,672 221,06957 195 486,015 1,230,415,839 3,201 8,119,397 227 32,510 1,683 240,788 140 20,125 1,683 240,788 212 30,399 1,683 240,788 195 28,007 1,683 240,78858 196 485,323 1,325,355,020 3,196 8,744,633 228 35,188 1,695 260,680 141 21,782 1,695 260,680 213 32,902 1,695 260,680 197 30,314 1,695 260,68059 195 484,631 1,419,949,308 3,191 9,367,470 230 37,877 1,706 280,664 142 23,447 1,706 280,664 215 35,417 1,706 280,664 198 32,630 1,706 280,66460 194 483,938 1,513,885,648 3,186 9,985,856 231 40,568 1,718 300,673 143 25,113 1,718 300,673 216 37,934 1,718 300,673 199 34,949 1,718 300,67361 193 483,244 1,606,922,027 3,181 10,598,205 233 43,255 1,730 320,655 144 26,776 1,730 320,655 217 40,446 1,730 320,655 200 37,264 1,730 320,655
MU WaterMU WaterWastewater WastewaterPlant Plant
MU WaterWastewater
FreshwaterPlant
WastewaterPlant
MU Water
Reclaimed Water Saline Water Brackish WaterPlant Plant Plant Plant
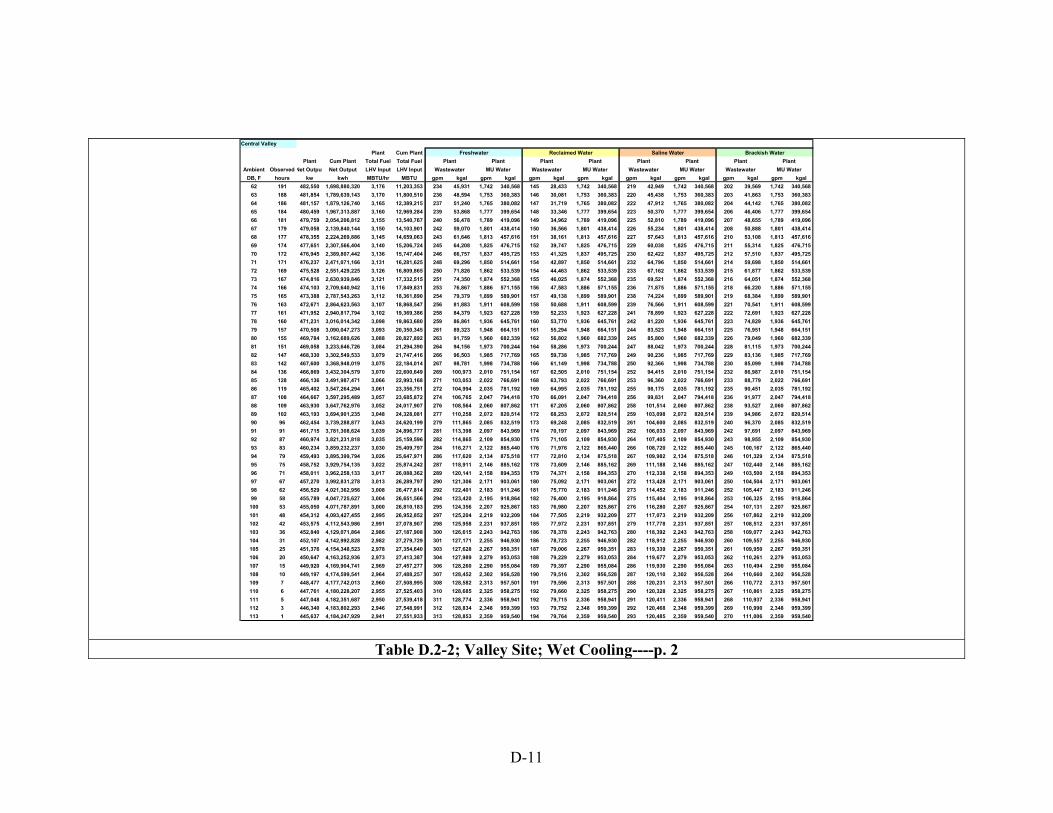
D-11
Table D.2-2; Valley Site; Wet Cooling----p. 2
Central ValleyPlant Cum Plant
Plant Cum Plant Total Fuel Total FuelAmbient Observed Net Output Net Output LHV Input LHV Input
DB, F hours kw kwh MBTU/hr MBTU gpm kgal gpm kgal gpm kgal gpm kgal gpm kgal gpm kgal gpm kgal gpm kgal62 191 482,550 1,698,880,320 3,176 11,203,353 234 45,931 1,742 340,568 145 28,433 1,742 340,568 219 42,949 1,742 340,568 202 39,569 1,742 340,56863 188 481,854 1,789,639,143 3,170 11,800,510 236 48,594 1,753 360,383 146 30,081 1,753 360,383 220 45,438 1,753 360,383 203 41,863 1,753 360,38364 186 481,157 1,879,126,740 3,165 12,389,215 237 51,240 1,765 380,082 147 31,719 1,765 380,082 222 47,912 1,765 380,082 204 44,142 1,765 380,08265 184 480,459 1,967,313,887 3,160 12,969,284 239 53,868 1,777 399,654 148 33,346 1,777 399,654 223 50,370 1,777 399,654 206 46,406 1,777 399,65466 181 479,759 2,054,206,812 3,155 13,540,767 240 56,478 1,789 419,096 149 34,962 1,789 419,096 225 52,810 1,789 419,096 207 48,655 1,789 419,09667 179 479,058 2,139,840,144 3,150 14,103,901 242 59,070 1,801 438,414 150 36,566 1,801 438,414 226 55,234 1,801 438,414 208 50,888 1,801 438,41468 177 478,355 2,224,269,886 3,145 14,659,063 243 61,646 1,813 457,616 151 38,161 1,813 457,616 227 57,643 1,813 457,616 210 53,108 1,813 457,61669 174 477,651 2,307,566,404 3,140 15,206,724 245 64,208 1,825 476,715 152 39,747 1,825 476,715 229 60,038 1,825 476,715 211 55,314 1,825 476,71570 172 476,945 2,389,807,442 3,136 15,747,404 246 66,757 1,837 495,725 153 41,325 1,837 495,725 230 62,422 1,837 495,725 212 57,510 1,837 495,72571 171 476,237 2,471,071,166 3,131 16,281,625 248 69,296 1,850 514,661 154 42,897 1,850 514,661 232 64,796 1,850 514,661 214 59,698 1,850 514,66172 169 475,528 2,551,429,225 3,126 16,809,865 250 71,826 1,862 533,539 154 44,463 1,862 533,539 233 67,162 1,862 533,539 215 61,877 1,862 533,53973 167 474,816 2,630,939,846 3,121 17,332,515 251 74,350 1,874 552,368 155 46,025 1,874 552,368 235 69,521 1,874 552,368 216 64,051 1,874 552,36874 166 474,103 2,709,640,942 3,116 17,849,831 253 76,867 1,886 571,155 156 47,583 1,886 571,155 236 71,875 1,886 571,155 218 66,220 1,886 571,15575 165 473,388 2,787,543,263 3,112 18,361,890 254 79,379 1,899 589,901 157 49,138 1,899 589,901 238 74,224 1,899 589,901 219 68,384 1,899 589,90176 163 472,671 2,864,623,563 3,107 18,868,547 256 81,883 1,911 608,599 158 50,688 1,911 608,599 239 76,566 1,911 608,599 221 70,541 1,911 608,59977 161 471,952 2,940,817,794 3,102 19,369,386 258 84,379 1,923 627,228 159 52,233 1,923 627,228 241 78,899 1,923 627,228 222 72,691 1,923 627,22878 160 471,231 3,016,014,342 3,098 19,863,680 259 86,861 1,936 645,761 160 53,770 1,936 645,761 242 81,220 1,936 645,761 223 74,829 1,936 645,76179 157 470,508 3,090,047,273 3,093 20,350,345 261 89,323 1,948 664,151 161 55,294 1,948 664,151 244 83,523 1,948 664,151 225 76,951 1,948 664,15180 155 469,784 3,162,689,626 3,088 20,827,892 263 91,759 1,960 682,339 162 56,802 1,960 682,339 245 85,800 1,960 682,339 226 79,049 1,960 682,33981 151 469,058 3,233,646,726 3,084 21,294,390 264 94,156 1,973 700,244 164 58,286 1,973 700,244 247 88,042 1,973 700,244 228 81,115 1,973 700,24482 147 468,330 3,302,549,533 3,079 21,747,416 266 96,503 1,985 717,769 165 59,738 1,985 717,769 249 90,236 1,985 717,769 229 83,136 1,985 717,76983 142 467,600 3,368,948,019 3,075 22,184,014 267 98,781 1,998 734,788 166 61,149 1,998 734,788 250 92,366 1,998 734,788 230 85,099 1,998 734,78884 136 466,869 3,432,304,579 3,070 22,600,649 269 100,973 2,010 751,154 167 62,505 2,010 751,154 252 94,415 2,010 751,154 232 86,987 2,010 751,15485 128 466,136 3,491,987,471 3,066 22,993,168 271 103,053 2,022 766,691 168 63,793 2,022 766,691 253 96,360 2,022 766,691 233 88,779 2,022 766,69186 119 465,402 3,547,264,294 3,061 23,356,751 272 104,994 2,035 781,192 169 64,995 2,035 781,192 255 98,175 2,035 781,192 235 90,451 2,035 781,19287 108 464,667 3,597,295,489 3,057 23,685,872 274 106,765 2,047 794,418 170 66,091 2,047 794,418 256 99,831 2,047 794,418 236 91,977 2,047 794,41888 109 463,930 3,647,762,976 3,052 24,017,907 276 108,564 2,060 807,862 171 67,205 2,060 807,862 258 101,514 2,060 807,862 238 93,527 2,060 807,86289 102 463,193 3,694,901,235 3,048 24,328,081 277 110,258 2,072 820,514 172 68,253 2,072 820,514 259 103,098 2,072 820,514 239 94,986 2,072 820,51490 96 462,454 3,739,288,877 3,043 24,620,199 279 111,865 2,085 832,519 173 69,248 2,085 832,519 261 104,600 2,085 832,519 240 96,370 2,085 832,51991 91 461,715 3,781,308,624 3,039 24,896,777 281 113,398 2,097 843,969 174 70,197 2,097 843,969 262 106,033 2,097 843,969 242 97,691 2,097 843,96992 87 460,974 3,821,231,818 3,035 25,159,596 282 114,865 2,109 854,930 175 71,105 2,109 854,930 264 107,405 2,109 854,930 243 98,955 2,109 854,93093 83 460,234 3,859,232,237 3,030 25,409,797 284 116,271 2,122 865,440 176 71,976 2,122 865,440 266 108,720 2,122 865,440 245 100,167 2,122 865,44094 79 459,493 3,895,399,794 3,026 25,647,971 286 117,620 2,134 875,518 177 72,810 2,134 875,518 267 109,982 2,134 875,518 246 101,329 2,134 875,51895 75 458,752 3,929,754,135 3,022 25,874,242 287 118,911 2,146 885,162 178 73,609 2,146 885,162 269 111,188 2,146 885,162 247 102,440 2,146 885,16296 71 458,011 3,962,258,133 3,017 26,088,362 289 120,141 2,158 894,353 179 74,371 2,158 894,353 270 112,338 2,158 894,353 249 103,500 2,158 894,35397 67 457,270 3,992,831,278 3,013 26,289,797 290 121,306 2,171 903,061 180 75,092 2,171 903,061 272 113,428 2,171 903,061 250 104,504 2,171 903,06198 62 456,529 4,021,362,956 3,008 26,477,814 292 122,401 2,183 911,246 181 75,770 2,183 911,246 273 114,452 2,183 911,246 252 105,447 2,183 911,24699 58 455,789 4,047,725,627 3,004 26,651,566 294 123,420 2,195 918,864 182 76,400 2,195 918,864 275 115,404 2,195 918,864 253 106,325 2,195 918,864
100 53 455,050 4,071,787,891 3,000 26,810,183 295 124,356 2,207 925,867 183 76,980 2,207 925,867 276 116,280 2,207 925,867 254 107,131 2,207 925,867101 48 454,312 4,093,427,455 2,995 26,952,852 297 125,204 2,219 932,209 184 77,505 2,219 932,209 277 117,073 2,219 932,209 256 107,862 2,219 932,209102 42 453,575 4,112,543,986 2,991 27,078,907 298 125,958 2,231 937,851 185 77,972 2,231 937,851 279 117,778 2,231 937,851 257 108,512 2,231 937,851103 36 452,840 4,129,071,864 2,986 27,187,908 300 126,615 2,243 942,763 186 78,378 2,243 942,763 280 118,392 2,243 942,763 258 109,077 2,243 942,763104 31 452,107 4,142,992,828 2,982 27,279,729 301 127,171 2,255 946,930 186 78,723 2,255 946,930 282 118,912 2,255 946,930 260 109,557 2,255 946,930105 25 451,376 4,154,348,523 2,978 27,354,640 303 127,628 2,267 950,351 187 79,006 2,267 950,351 283 119,339 2,267 950,351 261 109,950 2,267 950,351106 20 450,647 4,163,252,936 2,973 27,413,387 304 127,989 2,279 953,053 188 79,229 2,279 953,053 284 119,677 2,279 953,053 262 110,261 2,279 953,053107 15 449,920 4,169,904,741 2,969 27,457,277 306 128,260 2,290 955,084 189 79,397 2,290 955,084 286 119,930 2,290 955,084 263 110,494 2,290 955,084108 10 449,197 4,174,599,541 2,964 27,488,257 307 128,452 2,302 956,528 190 79,516 2,302 956,528 287 120,110 2,302 956,528 264 110,660 2,302 956,528109 7 448,477 4,177,742,013 2,960 27,508,995 308 128,582 2,313 957,501 191 79,596 2,313 957,501 288 120,231 2,313 957,501 266 110,772 2,313 957,501110 6 447,761 4,180,228,207 2,955 27,525,403 310 128,685 2,325 958,275 192 79,660 2,325 958,275 290 120,328 2,325 958,275 267 110,861 2,325 958,275111 5 447,048 4,182,351,687 2,950 27,539,418 311 128,774 2,336 958,941 192 79,715 2,336 958,941 291 120,411 2,336 958,941 268 110,937 2,336 958,941112 3 446,340 4,183,802,293 2,946 27,548,991 312 128,834 2,348 959,399 193 79,752 2,348 959,399 292 120,468 2,348 959,399 269 110,990 2,348 959,399113 1 445,637 4,184,247,929 2,941 27,551,933 313 128,853 2,359 959,540 194 79,764 2,359 959,540 293 120,485 2,359 959,540 270 111,006 2,359 959,540
PlantWastewater MU Water Wastewater MU Water Wastewater MU Water Wastewater MU Water
Plant Plant Plant PlantFreshwater
Plant Plant PlantReclaimed Water Saline Water Brackish Water

D-12
D.3 Coast Site
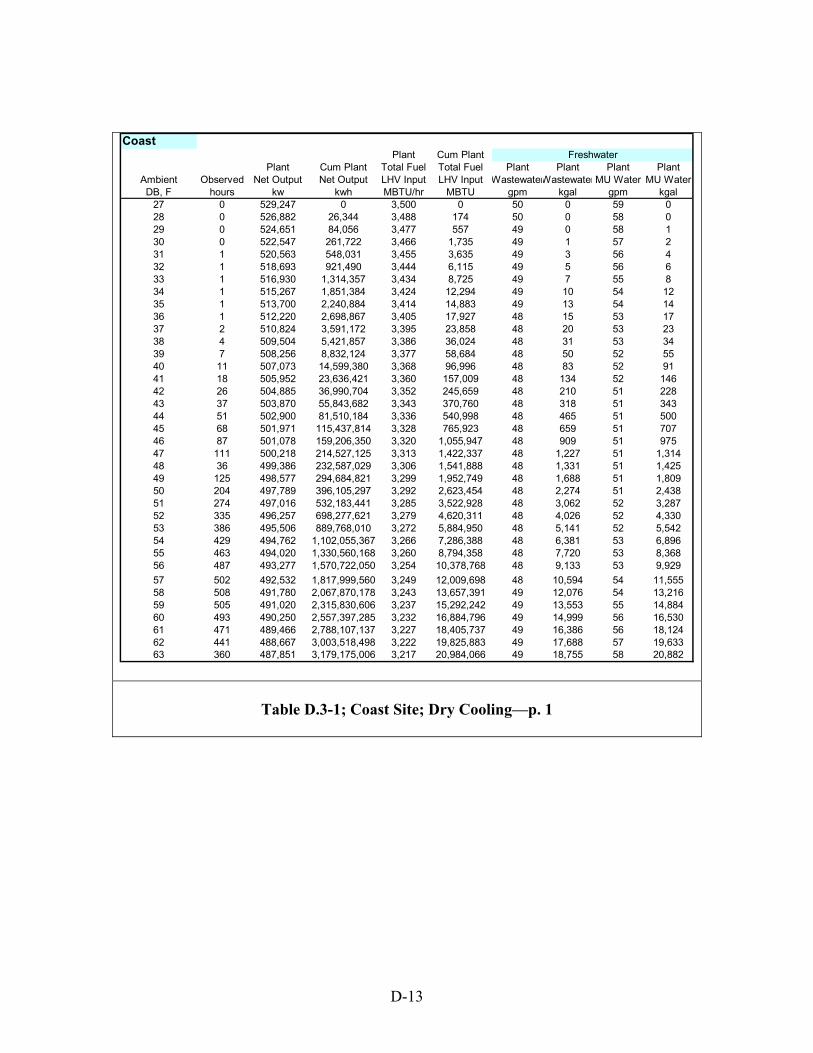
D-13
Table D.3-1; Coast Site; Dry Cooling—p. 1
CoastPlant Cum Plant
Plant Cum Plant Total Fuel Total Fuel Plant Plant Plant PlantAmbient Observed Net Output Net Output LHV Input LHV Input WastewaterWastewaterMU Water MU WaterDB, F hours kw kwh MBTU/hr MBTU gpm kgal gpm kgal
27 0 529,247 0 3,500 0 50 0 59 028 0 526,882 26,344 3,488 174 50 0 58 029 0 524,651 84,056 3,477 557 49 0 58 130 0 522,547 261,722 3,466 1,735 49 1 57 231 1 520,563 548,031 3,455 3,635 49 3 56 432 1 518,693 921,490 3,444 6,115 49 5 56 633 1 516,930 1,314,357 3,434 8,725 49 7 55 834 1 515,267 1,851,384 3,424 12,294 49 10 54 1235 1 513,700 2,240,884 3,414 14,883 49 13 54 1436 1 512,220 2,698,867 3,405 17,927 48 15 53 1737 2 510,824 3,591,172 3,395 23,858 48 20 53 2338 4 509,504 5,421,857 3,386 36,024 48 31 53 3439 7 508,256 8,832,124 3,377 58,684 48 50 52 5540 11 507,073 14,599,380 3,368 96,996 48 83 52 9141 18 505,952 23,636,421 3,360 157,009 48 134 52 14642 26 504,885 36,990,704 3,352 245,659 48 210 51 22843 37 503,870 55,843,682 3,343 370,760 48 318 51 34344 51 502,900 81,510,184 3,336 540,998 48 465 51 50045 68 501,971 115,437,814 3,328 765,923 48 659 51 70746 87 501,078 159,206,350 3,320 1,055,947 48 909 51 97547 111 500,218 214,527,125 3,313 1,422,337 48 1,227 51 1,31448 36 499,386 232,587,029 3,306 1,541,888 48 1,331 51 1,42549 125 498,577 294,684,821 3,299 1,952,749 48 1,688 51 1,80950 204 497,789 396,105,297 3,292 2,623,454 48 2,274 51 2,43851 274 497,016 532,183,441 3,285 3,522,928 48 3,062 52 3,28752 335 496,257 698,277,621 3,279 4,620,311 48 4,026 52 4,33053 386 495,506 889,768,010 3,272 5,884,950 48 5,141 52 5,54254 429 494,762 1,102,055,367 3,266 7,286,388 48 6,381 53 6,89655 463 494,020 1,330,560,168 3,260 8,794,358 48 7,720 53 8,36856 487 493,277 1,570,722,050 3,254 10,378,768 48 9,133 53 9,92957 502 492,532 1,817,999,560 3,249 12,009,698 48 10,594 54 11,55558 508 491,780 2,067,870,178 3,243 13,657,391 49 12,076 54 13,21659 505 491,020 2,315,830,606 3,237 15,292,242 49 13,553 55 14,88460 493 490,250 2,557,397,285 3,232 16,884,796 49 14,999 56 16,53061 471 489,466 2,788,107,137 3,227 18,405,737 49 16,386 56 18,12462 441 488,667 3,003,518,498 3,222 19,825,883 49 17,688 57 19,63363 360 487,851 3,179,175,006 3,217 20,984,066 49 18,755 58 20,882
Freshwater
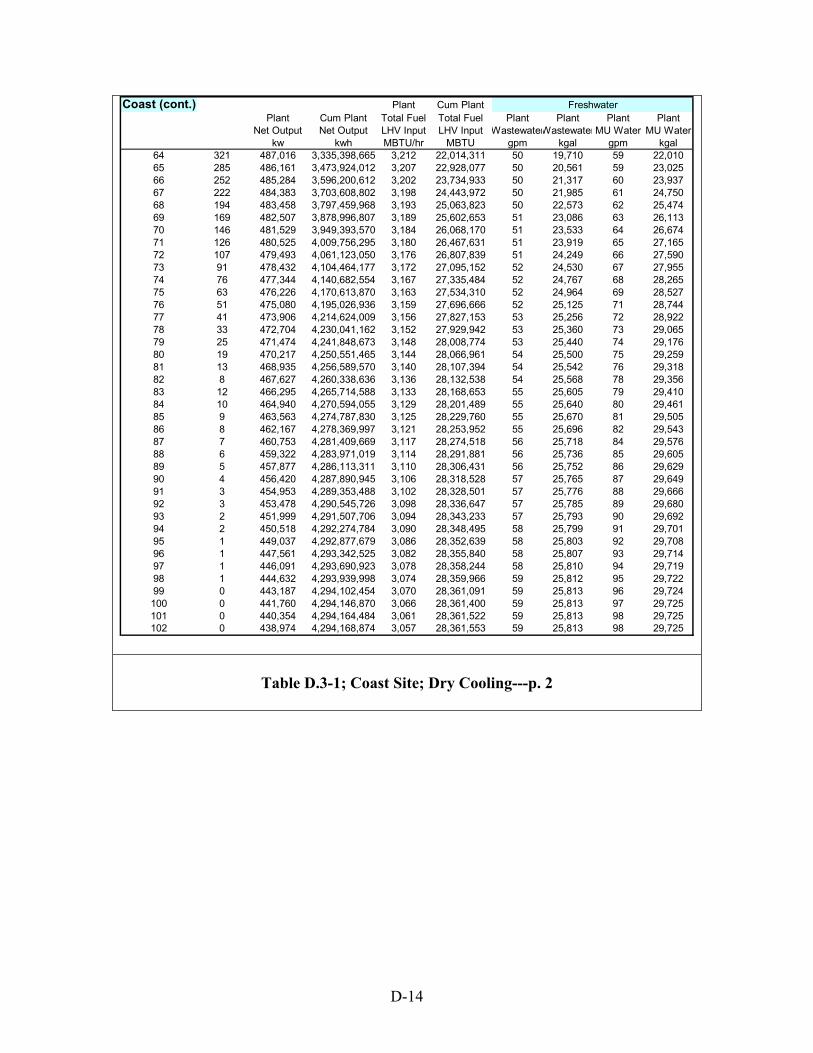
D-14
Table D.3-1; Coast Site; Dry Cooling---p. 2
Coast (cont.) Plant Cum PlantPlant Cum Plant Total Fuel Total Fuel Plant Plant Plant Plant
Net Output Net Output LHV Input LHV Input WastewaterWastewaterMU Water MU Waterkw kwh MBTU/hr MBTU gpm kgal gpm kgal
64 321 487,016 3,335,398,665 3,212 22,014,311 50 19,710 59 22,01065 285 486,161 3,473,924,012 3,207 22,928,077 50 20,561 59 23,02566 252 485,284 3,596,200,612 3,202 23,734,933 50 21,317 60 23,93767 222 484,383 3,703,608,802 3,198 24,443,972 50 21,985 61 24,75068 194 483,458 3,797,459,968 3,193 25,063,823 50 22,573 62 25,47469 169 482,507 3,878,996,807 3,189 25,602,653 51 23,086 63 26,11370 146 481,529 3,949,393,570 3,184 26,068,170 51 23,533 64 26,67471 126 480,525 4,009,756,295 3,180 26,467,631 51 23,919 65 27,16572 107 479,493 4,061,123,050 3,176 26,807,839 51 24,249 66 27,59073 91 478,432 4,104,464,177 3,172 27,095,152 52 24,530 67 27,95574 76 477,344 4,140,682,554 3,167 27,335,484 52 24,767 68 28,26575 63 476,226 4,170,613,870 3,163 27,534,310 52 24,964 69 28,52776 51 475,080 4,195,026,936 3,159 27,696,666 52 25,125 71 28,74477 41 473,906 4,214,624,009 3,156 27,827,153 53 25,256 72 28,92278 33 472,704 4,230,041,162 3,152 27,929,942 53 25,360 73 29,06579 25 471,474 4,241,848,673 3,148 28,008,774 53 25,440 74 29,17680 19 470,217 4,250,551,465 3,144 28,066,961 54 25,500 75 29,25981 13 468,935 4,256,589,570 3,140 28,107,394 54 25,542 76 29,31882 8 467,627 4,260,338,636 3,136 28,132,538 54 25,568 78 29,35683 12 466,295 4,265,714,588 3,133 28,168,653 55 25,605 79 29,41084 10 464,940 4,270,594,055 3,129 28,201,489 55 25,640 80 29,46185 9 463,563 4,274,787,830 3,125 28,229,760 55 25,670 81 29,50586 8 462,167 4,278,369,997 3,121 28,253,952 55 25,696 82 29,54387 7 460,753 4,281,409,669 3,117 28,274,518 56 25,718 84 29,57688 6 459,322 4,283,971,019 3,114 28,291,881 56 25,736 85 29,60589 5 457,877 4,286,113,311 3,110 28,306,431 56 25,752 86 29,62990 4 456,420 4,287,890,945 3,106 28,318,528 57 25,765 87 29,64991 3 454,953 4,289,353,488 3,102 28,328,501 57 25,776 88 29,66692 3 453,478 4,290,545,726 3,098 28,336,647 57 25,785 89 29,68093 2 451,999 4,291,507,706 3,094 28,343,233 57 25,793 90 29,69294 2 450,518 4,292,274,784 3,090 28,348,495 58 25,799 91 29,70195 1 449,037 4,292,877,679 3,086 28,352,639 58 25,803 92 29,70896 1 447,561 4,293,342,525 3,082 28,355,840 58 25,807 93 29,71497 1 446,091 4,293,690,923 3,078 28,358,244 58 25,810 94 29,71998 1 444,632 4,293,939,998 3,074 28,359,966 59 25,812 95 29,72299 0 443,187 4,294,102,454 3,070 28,361,091 59 25,813 96 29,724100 0 441,760 4,294,146,870 3,066 28,361,400 59 25,813 97 29,725101 0 440,354 4,294,164,484 3,061 28,361,522 59 25,813 98 29,725102 0 438,974 4,294,168,874 3,057 28,361,553 59 25,813 98 29,725
Freshwater
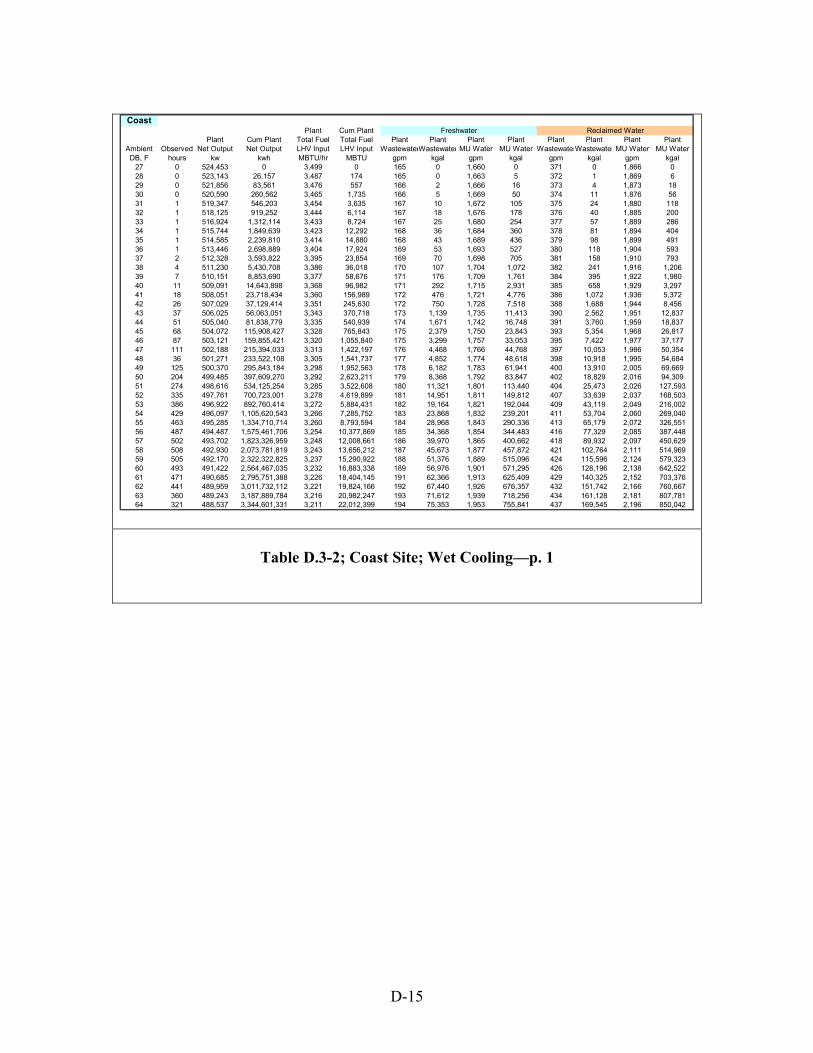
D-15
Table D.3-2; Coast Site; Wet Cooling—p. 1
CoastPlant Cum Plant
Plant Cum Plant Total Fuel Total Fuel Plant Plant Plant Plant Plant Plant Plant PlantAmbient Observed Net Output Net Output LHV Input LHV Input WastewaterWastewater MU Water MU Water WastewaterWastewater MU Water MU Water
DB, F hours kw kwh MBTU/hr MBTU gpm kgal gpm kgal gpm kgal gpm kgal27 0 524,453 0 3,499 0 165 0 1,660 0 371 0 1,866 028 0 523,143 26,157 3,487 174 165 0 1,663 5 372 1 1,869 629 0 521,856 83,561 3,476 557 166 2 1,666 16 373 4 1,873 1830 0 520,590 260,562 3,465 1,735 166 5 1,669 50 374 11 1,876 5631 1 519,347 546,203 3,454 3,635 167 10 1,672 105 375 24 1,880 11832 1 518,125 919,252 3,444 6,114 167 18 1,676 178 376 40 1,885 20033 1 516,924 1,312,114 3,433 8,724 167 25 1,680 254 377 57 1,889 28634 1 515,744 1,849,639 3,423 12,292 168 36 1,684 360 378 81 1,894 40435 1 514,585 2,239,810 3,414 14,880 168 43 1,689 436 379 98 1,899 49136 1 513,446 2,698,889 3,404 17,924 169 53 1,693 527 380 118 1,904 59337 2 512,328 3,593,822 3,395 23,854 169 70 1,698 705 381 158 1,910 79338 4 511,230 5,430,708 3,386 36,018 170 107 1,704 1,072 382 241 1,916 1,20639 7 510,151 8,853,690 3,377 58,676 171 176 1,709 1,761 384 395 1,922 1,98040 11 509,091 14,643,898 3,368 96,982 171 292 1,715 2,931 385 658 1,929 3,29741 18 508,051 23,718,434 3,360 156,989 172 476 1,721 4,776 386 1,072 1,936 5,37242 26 507,029 37,129,414 3,351 245,630 172 750 1,728 7,518 388 1,688 1,944 8,45643 37 506,025 56,063,051 3,343 370,718 173 1,139 1,735 11,413 390 2,562 1,951 12,83744 51 505,040 81,838,779 3,335 540,939 174 1,671 1,742 16,748 391 3,760 1,959 18,83745 68 504,072 115,908,427 3,328 765,843 175 2,379 1,750 23,843 393 5,354 1,968 26,81746 87 503,121 159,855,421 3,320 1,055,840 175 3,299 1,757 33,053 395 7,422 1,977 37,17747 111 502,188 215,394,033 3,313 1,422,197 176 4,468 1,766 44,768 397 10,053 1,986 50,35448 36 501,271 233,522,108 3,305 1,541,737 177 4,852 1,774 48,618 398 10,918 1,995 54,68449 125 500,370 295,843,184 3,298 1,952,563 178 6,182 1,783 61,941 400 13,910 2,005 69,66950 204 499,485 397,609,270 3,292 2,623,211 179 8,368 1,792 83,847 402 18,829 2,016 94,30951 274 498,616 534,125,254 3,285 3,522,608 180 11,321 1,801 113,440 404 25,473 2,026 127,59352 335 497,761 700,723,001 3,278 4,619,899 181 14,951 1,811 149,812 407 33,639 2,037 168,50353 386 496,922 892,760,414 3,272 5,884,431 182 19,164 1,821 192,044 409 43,119 2,049 216,00254 429 496,097 1,105,620,543 3,266 7,285,752 183 23,868 1,832 239,201 411 53,704 2,060 269,04055 463 495,285 1,334,710,714 3,260 8,793,594 184 28,968 1,843 290,336 413 65,179 2,072 326,55156 487 494,487 1,575,461,706 3,254 10,377,869 185 34,368 1,854 344,483 416 77,329 2,085 387,44857 502 493,702 1,823,326,959 3,248 12,008,661 186 39,970 1,865 400,662 418 89,932 2,097 450,62958 508 492,930 2,073,781,819 3,243 13,656,212 187 45,673 1,877 457,872 421 102,764 2,111 514,96959 505 492,170 2,322,322,825 3,237 15,290,922 188 51,376 1,889 515,096 424 115,596 2,124 579,32360 493 491,422 2,564,467,035 3,232 16,883,338 189 56,976 1,901 571,295 426 128,196 2,138 642,52261 471 490,685 2,795,751,388 3,226 18,404,145 191 62,366 1,913 625,409 429 140,325 2,152 703,37662 441 489,959 3,011,732,112 3,221 19,824,166 192 67,440 1,926 676,357 432 151,742 2,166 760,66763 360 489,243 3,187,889,784 3,216 20,982,247 193 71,612 1,939 718,256 434 161,128 2,181 807,78164 321 488,537 3,344,601,331 3,211 22,012,399 194 75,353 1,953 755,841 437 169,545 2,196 850,042
Reclaimed WaterFreshwater
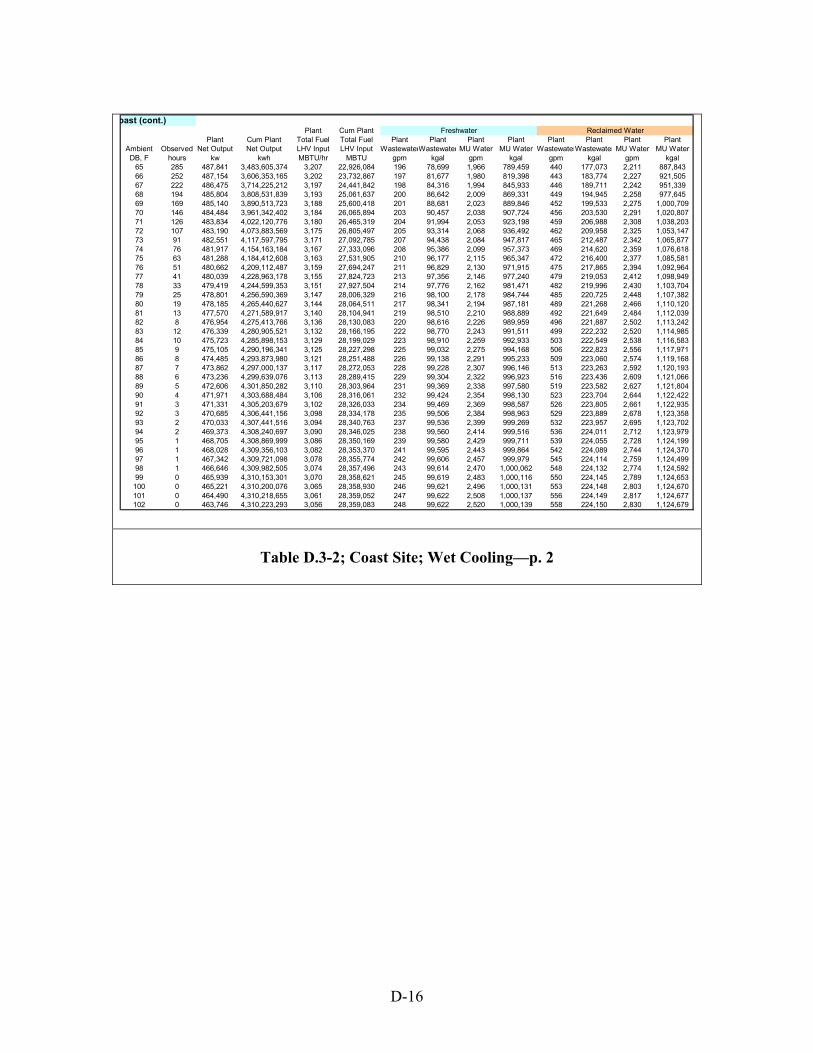
D-16
Table D.3-2; Coast Site; Wet Cooling—p. 2
oast (cont.)Plant Cum Plant
Plant Cum Plant Total Fuel Total Fuel Plant Plant Plant Plant Plant Plant Plant PlantAmbient Observed Net Output Net Output LHV Input LHV Input WastewaterWastewater MU Water MU Water WastewaterWastewater MU Water MU Water
DB, F hours kw kwh MBTU/hr MBTU gpm kgal gpm kgal gpm kgal gpm kgal65 285 487,841 3,483,605,374 3,207 22,926,084 196 78,699 1,966 789,459 440 177,073 2,211 887,84366 252 487,154 3,606,353,165 3,202 23,732,867 197 81,677 1,980 819,398 443 183,774 2,227 921,50567 222 486,475 3,714,225,212 3,197 24,441,842 198 84,316 1,994 845,933 446 189,711 2,242 951,33968 194 485,804 3,808,531,839 3,193 25,061,637 200 86,642 2,009 869,331 449 194,945 2,258 977,64569 169 485,140 3,890,513,723 3,188 25,600,418 201 88,681 2,023 889,846 452 199,533 2,275 1,000,70970 146 484,484 3,961,342,402 3,184 26,065,894 203 90,457 2,038 907,724 456 203,530 2,291 1,020,80771 126 483,834 4,022,120,776 3,180 26,465,319 204 91,994 2,053 923,198 459 206,988 2,308 1,038,20372 107 483,190 4,073,883,569 3,175 26,805,497 205 93,314 2,068 936,492 462 209,958 2,325 1,053,14773 91 482,551 4,117,597,795 3,171 27,092,785 207 94,438 2,084 947,817 465 212,487 2,342 1,065,87774 76 481,917 4,154,163,184 3,167 27,333,096 208 95,386 2,099 957,373 469 214,620 2,359 1,076,61875 63 481,288 4,184,412,608 3,163 27,531,905 210 96,177 2,115 965,347 472 216,400 2,377 1,085,58176 51 480,662 4,209,112,487 3,159 27,694,247 211 96,829 2,130 971,915 475 217,865 2,394 1,092,96477 41 480,039 4,228,963,178 3,155 27,824,723 213 97,356 2,146 977,240 479 219,053 2,412 1,098,94978 33 479,419 4,244,599,353 3,151 27,927,504 214 97,776 2,162 981,471 482 219,996 2,430 1,103,70479 25 478,801 4,256,590,369 3,147 28,006,329 216 98,100 2,178 984,744 485 220,725 2,448 1,107,38280 19 478,185 4,265,440,627 3,144 28,064,511 217 98,341 2,194 987,181 489 221,268 2,466 1,110,12081 13 477,570 4,271,589,917 3,140 28,104,941 219 98,510 2,210 988,889 492 221,649 2,484 1,112,03982 8 476,954 4,275,413,766 3,136 28,130,083 220 98,616 2,226 989,959 496 221,887 2,502 1,113,24283 12 476,339 4,280,905,521 3,132 28,166,195 222 98,770 2,243 991,511 499 222,232 2,520 1,114,98584 10 475,723 4,285,898,153 3,129 28,199,029 223 98,910 2,259 992,933 503 222,549 2,538 1,116,58385 9 475,105 4,290,196,341 3,125 28,227,298 225 99,032 2,275 994,168 506 222,823 2,556 1,117,97186 8 474,485 4,293,873,980 3,121 28,251,488 226 99,138 2,291 995,233 509 223,060 2,574 1,119,16887 7 473,862 4,297,000,137 3,117 28,272,053 228 99,228 2,307 996,146 513 223,263 2,592 1,120,19388 6 473,236 4,299,639,076 3,113 28,289,415 229 99,304 2,322 996,923 516 223,436 2,609 1,121,06689 5 472,606 4,301,850,282 3,110 28,303,964 231 99,369 2,338 997,580 519 223,582 2,627 1,121,80490 4 471,971 4,303,688,484 3,106 28,316,061 232 99,424 2,354 998,130 523 223,704 2,644 1,122,42291 3 471,331 4,305,203,679 3,102 28,326,033 234 99,469 2,369 998,587 526 223,805 2,661 1,122,93592 3 470,685 4,306,441,156 3,098 28,334,178 235 99,506 2,384 998,963 529 223,889 2,678 1,123,35893 2 470,033 4,307,441,516 3,094 28,340,763 237 99,536 2,399 999,269 532 223,957 2,695 1,123,70294 2 469,373 4,308,240,697 3,090 28,346,025 238 99,560 2,414 999,516 536 224,011 2,712 1,123,97995 1 468,705 4,308,869,999 3,086 28,350,169 239 99,580 2,429 999,711 539 224,055 2,728 1,124,19996 1 468,028 4,309,356,103 3,082 28,353,370 241 99,595 2,443 999,864 542 224,089 2,744 1,124,37097 1 467,342 4,309,721,098 3,078 28,355,774 242 99,606 2,457 999,979 545 224,114 2,759 1,124,49998 1 466,646 4,309,982,505 3,074 28,357,496 243 99,614 2,470 1,000,062 548 224,132 2,774 1,124,59299 0 465,939 4,310,153,301 3,070 28,358,621 245 99,619 2,483 1,000,116 550 224,145 2,789 1,124,653
100 0 465,221 4,310,200,076 3,065 28,358,930 246 99,621 2,496 1,000,131 553 224,148 2,803 1,124,670101 0 464,490 4,310,218,655 3,061 28,359,052 247 99,622 2,508 1,000,137 556 224,149 2,817 1,124,677102 0 463,746 4,310,223,293 3,056 28,359,083 248 99,622 2,520 1,000,139 558 224,150 2,830 1,124,679
Freshwater Reclaimed Water

D-17
D.4 Mountain Site
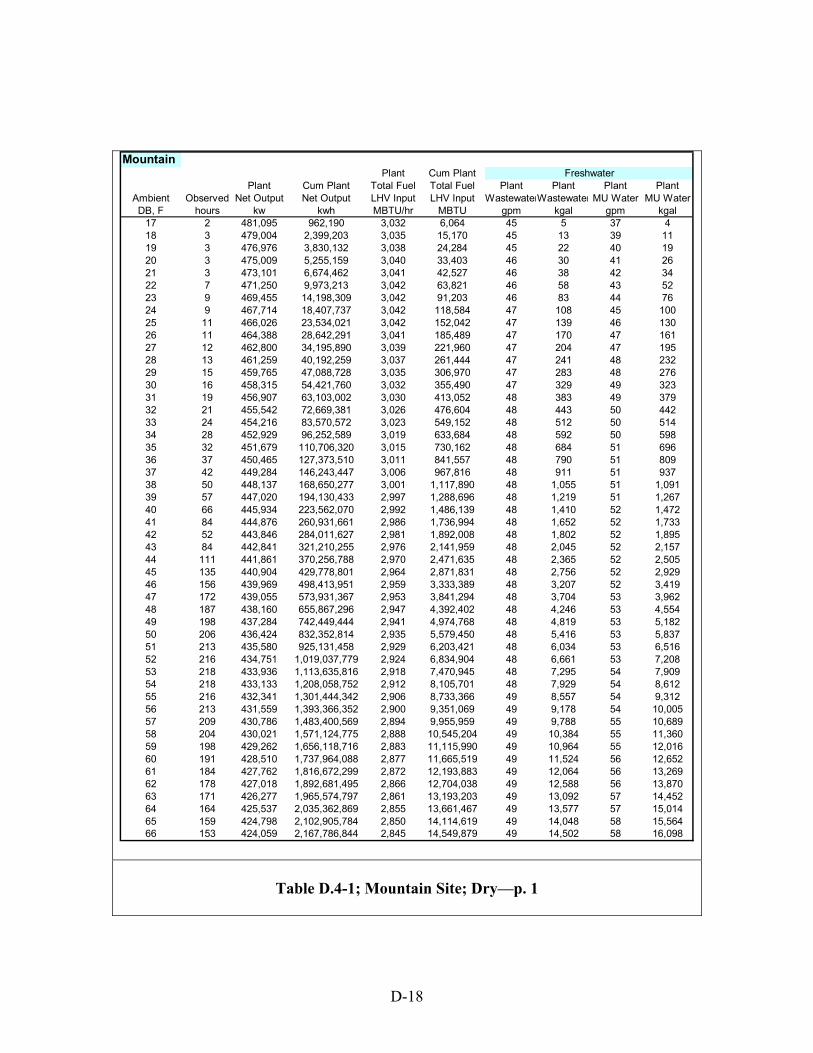
D-18
Table D.4-1; Mountain Site; Dry—p. 1
MountainPlant Cum Plant
Plant Cum Plant Total Fuel Total Fuel Plant Plant Plant PlantAmbient Observed Net Output Net Output LHV Input LHV Input WastewaterWastewater MU Water MU WaterDB, F hours kw kwh MBTU/hr MBTU gpm kgal gpm kgal
17 2 481,095 962,190 3,032 6,064 45 5 37 418 3 479,004 2,399,203 3,035 15,170 45 13 39 1119 3 476,976 3,830,132 3,038 24,284 45 22 40 1920 3 475,009 5,255,159 3,040 33,403 46 30 41 2621 3 473,101 6,674,462 3,041 42,527 46 38 42 3422 7 471,250 9,973,213 3,042 63,821 46 58 43 5223 9 469,455 14,198,309 3,042 91,203 46 83 44 7624 9 467,714 18,407,737 3,042 118,584 47 108 45 10025 11 466,026 23,534,021 3,042 152,042 47 139 46 13026 11 464,388 28,642,291 3,041 185,489 47 170 47 16127 12 462,800 34,195,890 3,039 221,960 47 204 47 19528 13 461,259 40,192,259 3,037 261,444 47 241 48 23229 15 459,765 47,088,728 3,035 306,970 47 283 48 27630 16 458,315 54,421,760 3,032 355,490 47 329 49 32331 19 456,907 63,103,002 3,030 413,052 48 383 49 37932 21 455,542 72,669,381 3,026 476,604 48 443 50 44233 24 454,216 83,570,572 3,023 549,152 48 512 50 51434 28 452,929 96,252,589 3,019 633,684 48 592 50 59835 32 451,679 110,706,320 3,015 730,162 48 684 51 69636 37 450,465 127,373,510 3,011 841,557 48 790 51 80937 42 449,284 146,243,447 3,006 967,816 48 911 51 93738 50 448,137 168,650,277 3,001 1,117,890 48 1,055 51 1,09139 57 447,020 194,130,433 2,997 1,288,696 48 1,219 51 1,26740 66 445,934 223,562,070 2,992 1,486,139 48 1,410 52 1,47241 84 444,876 260,931,661 2,986 1,736,994 48 1,652 52 1,73342 52 443,846 284,011,627 2,981 1,892,008 48 1,802 52 1,89543 84 442,841 321,210,255 2,976 2,141,959 48 2,045 52 2,15744 111 441,861 370,256,788 2,970 2,471,635 48 2,365 52 2,50545 135 440,904 429,778,801 2,964 2,871,831 48 2,756 52 2,92946 156 439,969 498,413,951 2,959 3,333,389 48 3,207 52 3,41947 172 439,055 573,931,367 2,953 3,841,294 48 3,704 53 3,96248 187 438,160 655,867,296 2,947 4,392,402 48 4,246 53 4,55449 198 437,284 742,449,444 2,941 4,974,768 48 4,819 53 5,18250 206 436,424 832,352,814 2,935 5,579,450 48 5,416 53 5,83751 213 435,580 925,131,458 2,929 6,203,421 48 6,034 53 6,51652 216 434,751 1,019,037,779 2,924 6,834,904 48 6,661 53 7,20853 218 433,936 1,113,635,816 2,918 7,470,945 48 7,295 54 7,90954 218 433,133 1,208,058,752 2,912 8,105,701 48 7,929 54 8,61255 216 432,341 1,301,444,342 2,906 8,733,366 49 8,557 54 9,31256 213 431,559 1,393,366,352 2,900 9,351,069 49 9,178 54 10,00557 209 430,786 1,483,400,569 2,894 9,955,959 49 9,788 55 10,68958 204 430,021 1,571,124,775 2,888 10,545,204 49 10,384 55 11,36059 198 429,262 1,656,118,716 2,883 11,115,990 49 10,964 55 12,01660 191 428,510 1,737,964,088 2,877 11,665,519 49 11,524 56 12,65261 184 427,762 1,816,672,299 2,872 12,193,883 49 12,064 56 13,26962 178 427,018 1,892,681,495 2,866 12,704,038 49 12,588 56 13,87063 171 426,277 1,965,574,797 2,861 13,193,203 49 13,092 57 14,45264 164 425,537 2,035,362,869 2,855 13,661,467 49 13,577 57 15,01465 159 424,798 2,102,905,784 2,850 14,114,619 49 14,048 58 15,56466 153 424,059 2,167,786,844 2,845 14,549,879 49 14,502 58 16,098
Freshwater
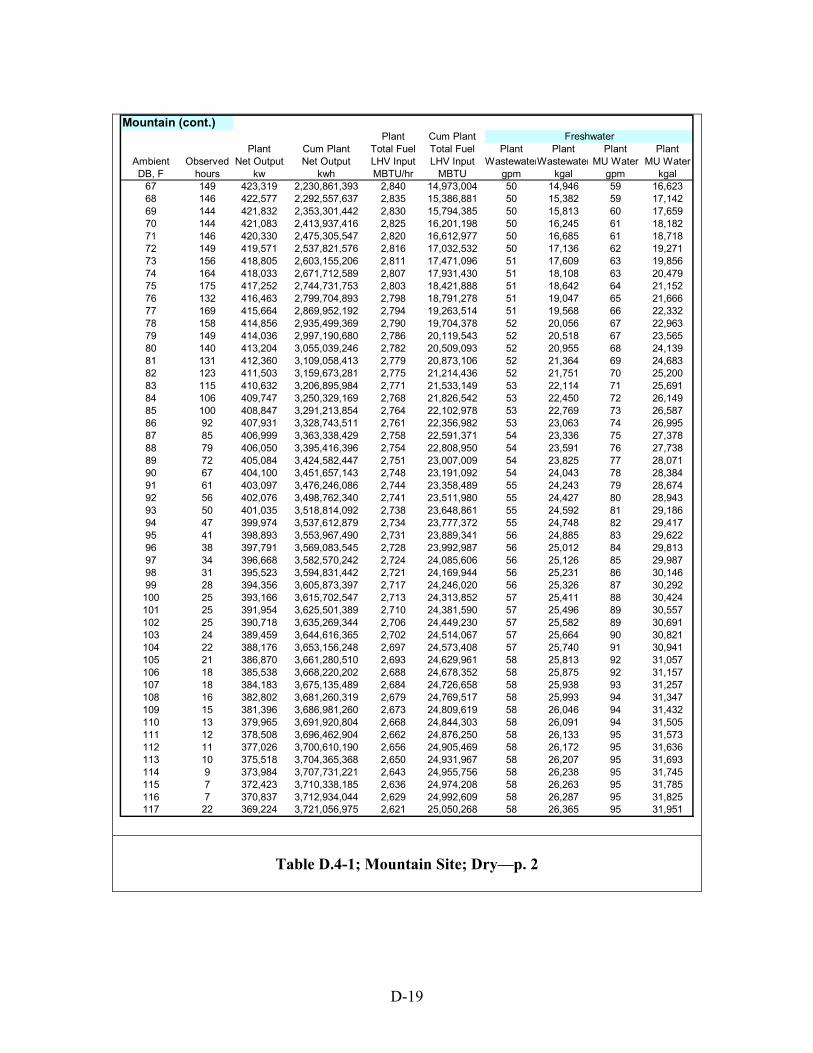
D-19
Table D.4-1; Mountain Site; Dry—p. 2
Mountain (cont.)Plant Cum Plant
Plant Cum Plant Total Fuel Total Fuel Plant Plant Plant PlantAmbient Observed Net Output Net Output LHV Input LHV Input WastewaterWastewater MU Water MU WaterDB, F hours kw kwh MBTU/hr MBTU gpm kgal gpm kgal
67 149 423,319 2,230,861,393 2,840 14,973,004 50 14,946 59 16,62368 146 422,577 2,292,557,637 2,835 15,386,881 50 15,382 59 17,14269 144 421,832 2,353,301,442 2,830 15,794,385 50 15,813 60 17,65970 144 421,083 2,413,937,416 2,825 16,201,198 50 16,245 61 18,18271 146 420,330 2,475,305,547 2,820 16,612,977 50 16,685 61 18,71872 149 419,571 2,537,821,576 2,816 17,032,532 50 17,136 62 19,27173 156 418,805 2,603,155,206 2,811 17,471,096 51 17,609 63 19,85674 164 418,033 2,671,712,589 2,807 17,931,430 51 18,108 63 20,47975 175 417,252 2,744,731,753 2,803 18,421,888 51 18,642 64 21,15276 132 416,463 2,799,704,893 2,798 18,791,278 51 19,047 65 21,66677 169 415,664 2,869,952,192 2,794 19,263,514 51 19,568 66 22,33278 158 414,856 2,935,499,369 2,790 19,704,378 52 20,056 67 22,96379 149 414,036 2,997,190,680 2,786 20,119,543 52 20,518 67 23,56580 140 413,204 3,055,039,246 2,782 20,509,093 52 20,955 68 24,13981 131 412,360 3,109,058,413 2,779 20,873,106 52 21,364 69 24,68382 123 411,503 3,159,673,281 2,775 21,214,436 52 21,751 70 25,20083 115 410,632 3,206,895,984 2,771 21,533,149 53 22,114 71 25,69184 106 409,747 3,250,329,169 2,768 21,826,542 53 22,450 72 26,14985 100 408,847 3,291,213,854 2,764 22,102,978 53 22,769 73 26,58786 92 407,931 3,328,743,511 2,761 22,356,982 53 23,063 74 26,99587 85 406,999 3,363,338,429 2,758 22,591,371 54 23,336 75 27,37888 79 406,050 3,395,416,396 2,754 22,808,950 54 23,591 76 27,73889 72 405,084 3,424,582,447 2,751 23,007,009 54 23,825 77 28,07190 67 404,100 3,451,657,143 2,748 23,191,092 54 24,043 78 28,38491 61 403,097 3,476,246,086 2,744 23,358,489 55 24,243 79 28,67492 56 402,076 3,498,762,340 2,741 23,511,980 55 24,427 80 28,94393 50 401,035 3,518,814,092 2,738 23,648,861 55 24,592 81 29,18694 47 399,974 3,537,612,879 2,734 23,777,372 55 24,748 82 29,41795 41 398,893 3,553,967,490 2,731 23,889,341 56 24,885 83 29,62296 38 397,791 3,569,083,545 2,728 23,992,987 56 25,012 84 29,81397 34 396,668 3,582,570,242 2,724 24,085,606 56 25,126 85 29,98798 31 395,523 3,594,831,442 2,721 24,169,944 56 25,231 86 30,14699 28 394,356 3,605,873,397 2,717 24,246,020 56 25,326 87 30,292100 25 393,166 3,615,702,547 2,713 24,313,852 57 25,411 88 30,424101 25 391,954 3,625,501,389 2,710 24,381,590 57 25,496 89 30,557102 25 390,718 3,635,269,344 2,706 24,449,230 57 25,582 89 30,691103 24 389,459 3,644,616,365 2,702 24,514,067 57 25,664 90 30,821104 22 388,176 3,653,156,248 2,697 24,573,408 57 25,740 91 30,941105 21 386,870 3,661,280,510 2,693 24,629,961 58 25,813 92 31,057106 18 385,538 3,668,220,202 2,688 24,678,352 58 25,875 92 31,157107 18 384,183 3,675,135,489 2,684 24,726,658 58 25,938 93 31,257108 16 382,802 3,681,260,319 2,679 24,769,517 58 25,993 94 31,347109 15 381,396 3,686,981,260 2,673 24,809,619 58 26,046 94 31,432110 13 379,965 3,691,920,804 2,668 24,844,303 58 26,091 94 31,505111 12 378,508 3,696,462,904 2,662 24,876,250 58 26,133 95 31,573112 11 377,026 3,700,610,190 2,656 24,905,469 58 26,172 95 31,636113 10 375,518 3,704,365,368 2,650 24,931,967 58 26,207 95 31,693114 9 373,984 3,707,731,221 2,643 24,955,756 58 26,238 95 31,745115 7 372,423 3,710,338,185 2,636 24,974,208 58 26,263 95 31,785116 7 370,837 3,712,934,044 2,629 24,992,609 58 26,287 95 31,825117 22 369,224 3,721,056,975 2,621 25,050,268 58 26,365 95 31,951
Freshwater
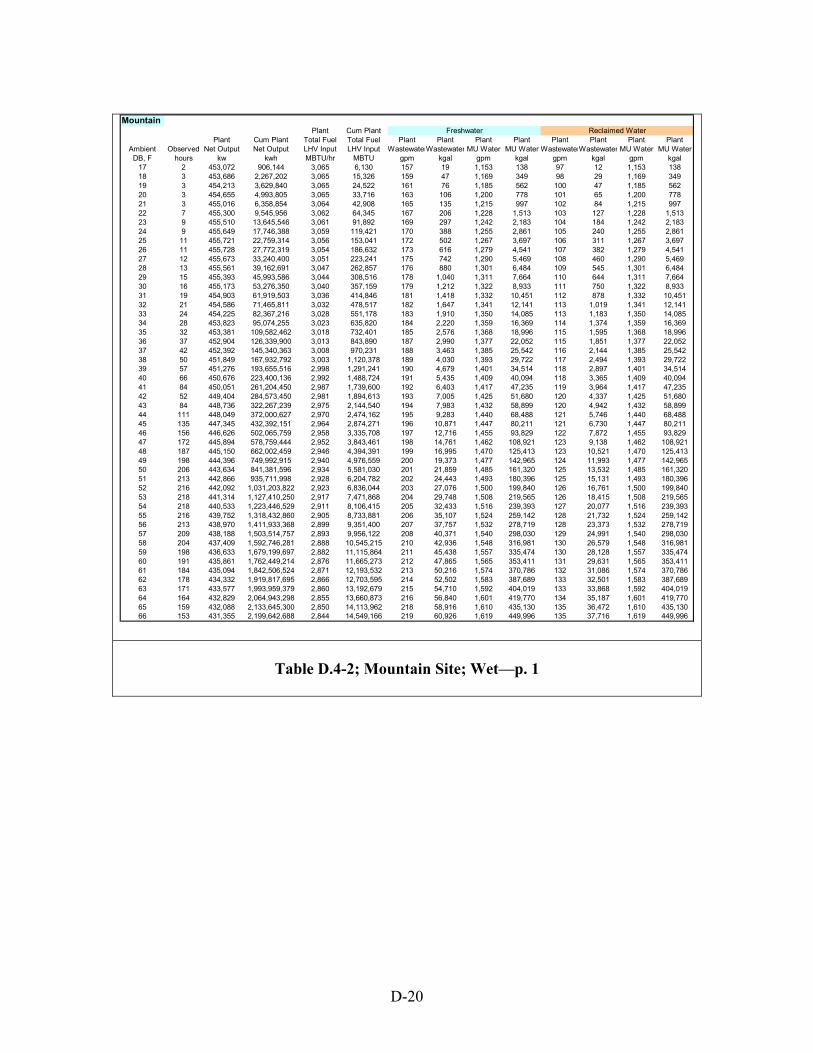
D-20
Table D.4-2; Mountain Site; Wet—p. 1
MountainPlant Cum Plant
Plant Cum Plant Total Fuel Total Fuel Plant Plant Plant Plant Plant Plant Plant PlantAmbient Observed Net Output Net Output LHV Input LHV Input WastewaterWastewater MU Water MU Water WastewaterWastewater MU Water MU Water
DB, F hours kw kwh MBTU/hr MBTU gpm kgal gpm kgal gpm kgal gpm kgal17 2 453,072 906,144 3,065 6,130 157 19 1,153 138 97 12 1,153 13818 3 453,686 2,267,202 3,065 15,326 159 47 1,169 349 98 29 1,169 34919 3 454,213 3,629,840 3,065 24,522 161 76 1,185 562 100 47 1,185 56220 3 454,655 4,993,805 3,065 33,716 163 106 1,200 778 101 65 1,200 77821 3 455,016 6,358,854 3,064 42,908 165 135 1,215 997 102 84 1,215 99722 7 455,300 9,545,956 3,062 64,345 167 206 1,228 1,513 103 127 1,228 1,51323 9 455,510 13,645,546 3,061 91,892 169 297 1,242 2,183 104 184 1,242 2,18324 9 455,649 17,746,388 3,059 119,421 170 388 1,255 2,861 105 240 1,255 2,86125 11 455,721 22,759,314 3,056 153,041 172 502 1,267 3,697 106 311 1,267 3,69726 11 455,728 27,772,319 3,054 186,632 173 616 1,279 4,541 107 382 1,279 4,54127 12 455,673 33,240,400 3,051 223,241 175 742 1,290 5,469 108 460 1,290 5,46928 13 455,561 39,162,691 3,047 262,857 176 880 1,301 6,484 109 545 1,301 6,48429 15 455,393 45,993,586 3,044 308,516 178 1,040 1,311 7,664 110 644 1,311 7,66430 16 455,173 53,276,350 3,040 357,159 179 1,212 1,322 8,933 111 750 1,322 8,93331 19 454,903 61,919,503 3,036 414,846 181 1,418 1,332 10,451 112 878 1,332 10,45132 21 454,586 71,465,811 3,032 478,517 182 1,647 1,341 12,141 113 1,019 1,341 12,14133 24 454,225 82,367,216 3,028 551,178 183 1,910 1,350 14,085 113 1,183 1,350 14,08534 28 453,823 95,074,255 3,023 635,820 184 2,220 1,359 16,369 114 1,374 1,359 16,36935 32 453,381 109,582,462 3,018 732,401 185 2,576 1,368 18,996 115 1,595 1,368 18,99636 37 452,904 126,339,900 3,013 843,890 187 2,990 1,377 22,052 115 1,851 1,377 22,05237 42 452,392 145,340,363 3,008 970,231 188 3,463 1,385 25,542 116 2,144 1,385 25,54238 50 451,849 167,932,792 3,003 1,120,378 189 4,030 1,393 29,722 117 2,494 1,393 29,72239 57 451,276 193,655,516 2,998 1,291,241 190 4,679 1,401 34,514 118 2,897 1,401 34,51440 66 450,676 223,400,136 2,992 1,488,724 191 5,435 1,409 40,094 118 3,365 1,409 40,09441 84 450,051 261,204,450 2,987 1,739,600 192 6,403 1,417 47,235 119 3,964 1,417 47,23542 52 449,404 284,573,450 2,981 1,894,613 193 7,005 1,425 51,680 120 4,337 1,425 51,68043 84 448,736 322,267,239 2,975 2,144,540 194 7,983 1,432 58,899 120 4,942 1,432 58,89944 111 448,049 372,000,627 2,970 2,474,162 195 9,283 1,440 68,488 121 5,746 1,440 68,48845 135 447,345 432,392,151 2,964 2,874,271 196 10,871 1,447 80,211 121 6,730 1,447 80,21146 156 446,626 502,065,759 2,958 3,335,708 197 12,716 1,455 93,829 122 7,872 1,455 93,82947 172 445,894 578,759,444 2,952 3,843,461 198 14,761 1,462 108,921 123 9,138 1,462 108,92148 187 445,150 662,002,459 2,946 4,394,391 199 16,995 1,470 125,413 123 10,521 1,470 125,41349 198 444,396 749,992,915 2,940 4,976,559 200 19,373 1,477 142,965 124 11,993 1,477 142,96550 206 443,634 841,381,596 2,934 5,581,030 201 21,859 1,485 161,320 125 13,532 1,485 161,32051 213 442,866 935,711,998 2,928 6,204,782 202 24,443 1,493 180,396 125 15,131 1,493 180,39652 216 442,092 1,031,203,822 2,923 6,836,044 203 27,076 1,500 199,840 126 16,761 1,500 199,84053 218 441,314 1,127,410,250 2,917 7,471,868 204 29,748 1,508 219,565 126 18,415 1,508 219,56554 218 440,533 1,223,446,529 2,911 8,106,415 205 32,433 1,516 239,393 127 20,077 1,516 239,39355 216 439,752 1,318,432,860 2,905 8,733,881 206 35,107 1,524 259,142 128 21,732 1,524 259,14256 213 438,970 1,411,933,368 2,899 9,351,400 207 37,757 1,532 278,719 128 23,373 1,532 278,71957 209 438,188 1,503,514,757 2,893 9,956,122 208 40,371 1,540 298,030 129 24,991 1,540 298,03058 204 437,409 1,592,746,281 2,888 10,545,215 210 42,936 1,548 316,981 130 26,579 1,548 316,98159 198 436,633 1,679,199,697 2,882 11,115,864 211 45,438 1,557 335,474 130 28,128 1,557 335,47460 191 435,861 1,762,449,214 2,876 11,665,273 212 47,865 1,565 353,411 131 29,631 1,565 353,41161 184 435,094 1,842,506,524 2,871 12,193,532 213 50,216 1,574 370,786 132 31,086 1,574 370,78662 178 434,332 1,919,817,695 2,866 12,703,595 214 52,502 1,583 387,689 133 32,501 1,583 387,68963 171 433,577 1,993,959,379 2,860 13,192,679 215 54,710 1,592 404,019 133 33,868 1,592 404,01964 164 432,829 2,064,943,298 2,855 13,660,873 216 56,840 1,601 419,770 134 35,187 1,601 419,77065 159 432,088 2,133,645,300 2,850 14,113,962 218 58,916 1,610 435,130 135 36,472 1,610 435,13066 153 431,355 2,199,642,688 2,844 14,549,166 219 60,926 1,619 449,996 135 37,716 1,619 449,996
Freshwater Reclaimed Water
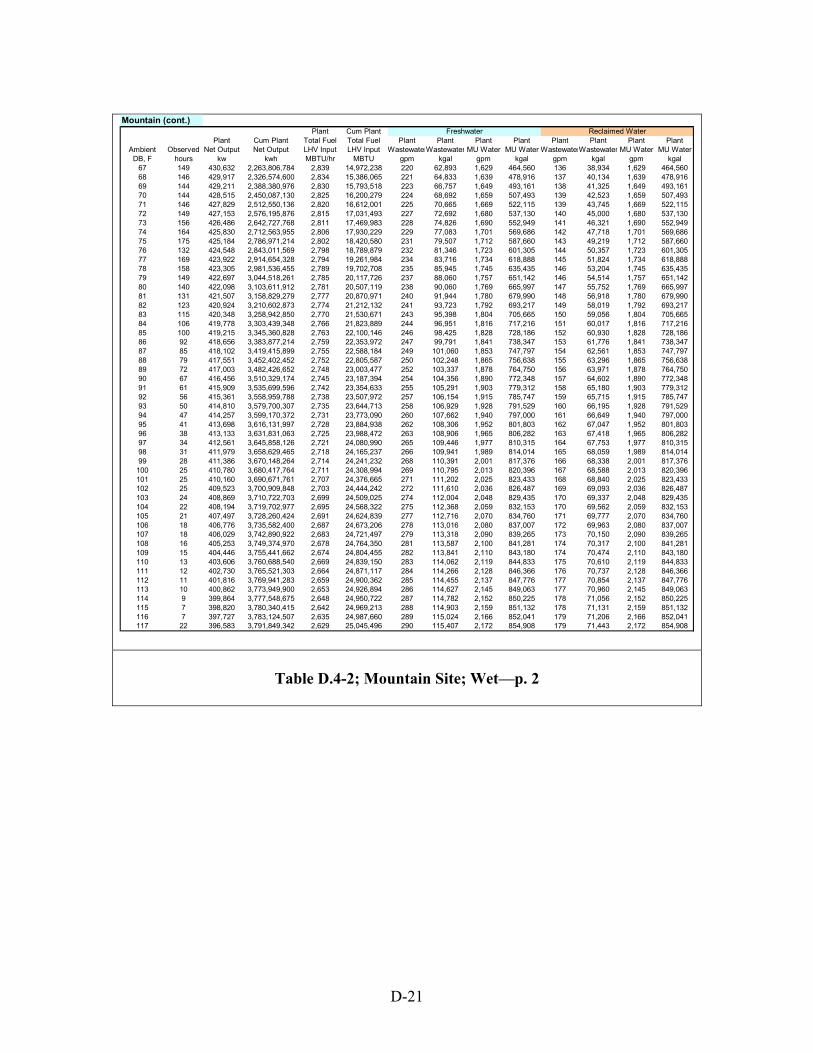
D-21
Table D.4-2; Mountain Site; Wet—p. 2
Mountain (cont.)Plant Cum Plant
Plant Cum Plant Total Fuel Total Fuel Plant Plant Plant Plant Plant Plant Plant PlantAmbient Observed Net Output Net Output LHV Input LHV Input WastewaterWastewater MU Water MU Water WastewaterWastewater MU Water MU Water
DB, F hours kw kwh MBTU/hr MBTU gpm kgal gpm kgal gpm kgal gpm kgal67 149 430,632 2,263,806,784 2,839 14,972,238 220 62,893 1,629 464,560 136 38,934 1,629 464,56068 146 429,917 2,326,574,600 2,834 15,386,065 221 64,833 1,639 478,916 137 40,134 1,639 478,91669 144 429,211 2,388,380,976 2,830 15,793,518 223 66,757 1,649 493,161 138 41,325 1,649 493,16170 144 428,515 2,450,087,130 2,825 16,200,279 224 68,692 1,659 507,493 139 42,523 1,659 507,49371 146 427,829 2,512,550,136 2,820 16,612,001 225 70,665 1,669 522,115 139 43,745 1,669 522,11572 149 427,153 2,576,195,876 2,815 17,031,493 227 72,692 1,680 537,130 140 45,000 1,680 537,13073 156 426,486 2,642,727,768 2,811 17,469,983 228 74,826 1,690 552,949 141 46,321 1,690 552,94974 164 425,830 2,712,563,955 2,806 17,930,229 229 77,083 1,701 569,686 142 47,718 1,701 569,68675 175 425,184 2,786,971,214 2,802 18,420,580 231 79,507 1,712 587,660 143 49,219 1,712 587,66076 132 424,548 2,843,011,569 2,798 18,789,879 232 81,346 1,723 601,305 144 50,357 1,723 601,30577 169 423,922 2,914,654,328 2,794 19,261,984 234 83,716 1,734 618,888 145 51,824 1,734 618,88878 158 423,305 2,981,536,455 2,789 19,702,708 235 85,945 1,745 635,435 146 53,204 1,745 635,43579 149 422,697 3,044,518,261 2,785 20,117,726 237 88,060 1,757 651,142 146 54,514 1,757 651,14280 140 422,098 3,103,611,912 2,781 20,507,119 238 90,060 1,769 665,997 147 55,752 1,769 665,99781 131 421,507 3,158,829,279 2,777 20,870,971 240 91,944 1,780 679,990 148 56,918 1,780 679,99082 123 420,924 3,210,602,873 2,774 21,212,132 241 93,723 1,792 693,217 149 58,019 1,792 693,21783 115 420,348 3,258,942,850 2,770 21,530,671 243 95,398 1,804 705,665 150 59,056 1,804 705,66584 106 419,778 3,303,439,348 2,766 21,823,889 244 96,951 1,816 717,216 151 60,017 1,816 717,21685 100 419,215 3,345,360,828 2,763 22,100,146 246 98,425 1,828 728,186 152 60,930 1,828 728,18686 92 418,656 3,383,877,214 2,759 22,353,972 247 99,791 1,841 738,347 153 61,776 1,841 738,34787 85 418,102 3,419,415,899 2,755 22,588,184 249 101,060 1,853 747,797 154 62,561 1,853 747,79788 79 417,551 3,452,402,452 2,752 22,805,587 250 102,248 1,865 756,638 155 63,296 1,865 756,63889 72 417,003 3,482,426,652 2,748 23,003,477 252 103,337 1,878 764,750 156 63,971 1,878 764,75090 67 416,456 3,510,329,174 2,745 23,187,394 254 104,356 1,890 772,348 157 64,602 1,890 772,34891 61 415,909 3,535,699,596 2,742 23,354,633 255 105,291 1,903 779,312 158 65,180 1,903 779,31292 56 415,361 3,558,959,788 2,738 23,507,972 257 106,154 1,915 785,747 159 65,715 1,915 785,74793 50 414,810 3,579,700,307 2,735 23,644,713 258 106,929 1,928 791,529 160 66,195 1,928 791,52994 47 414,257 3,599,170,372 2,731 23,773,090 260 107,662 1,940 797,000 161 66,649 1,940 797,00095 41 413,698 3,616,131,997 2,728 23,884,938 262 108,306 1,952 801,803 162 67,047 1,952 801,80396 38 413,133 3,631,831,063 2,725 23,988,472 263 108,906 1,965 806,282 163 67,418 1,965 806,28297 34 412,561 3,645,858,126 2,721 24,080,990 265 109,446 1,977 810,315 164 67,753 1,977 810,31598 31 411,979 3,658,629,465 2,718 24,165,237 266 109,941 1,989 814,014 165 68,059 1,989 814,01499 28 411,386 3,670,148,264 2,714 24,241,232 268 110,391 2,001 817,376 166 68,338 2,001 817,376
100 25 410,780 3,680,417,764 2,711 24,308,994 269 110,795 2,013 820,396 167 68,588 2,013 820,396101 25 410,160 3,690,671,761 2,707 24,376,665 271 111,202 2,025 823,433 168 68,840 2,025 823,433102 25 409,523 3,700,909,848 2,703 24,444,242 272 111,610 2,036 826,487 169 69,093 2,036 826,487103 24 408,869 3,710,722,703 2,699 24,509,025 274 112,004 2,048 829,435 170 69,337 2,048 829,435104 22 408,194 3,719,702,977 2,695 24,568,322 275 112,368 2,059 832,153 170 69,562 2,059 832,153105 21 407,497 3,728,260,424 2,691 24,624,839 277 112,716 2,070 834,760 171 69,777 2,070 834,760106 18 406,776 3,735,582,400 2,687 24,673,206 278 113,016 2,080 837,007 172 69,963 2,080 837,007107 18 406,029 3,742,890,922 2,683 24,721,497 279 113,318 2,090 839,265 173 70,150 2,090 839,265108 16 405,253 3,749,374,970 2,678 24,764,350 281 113,587 2,100 841,281 174 70,317 2,100 841,281109 15 404,446 3,755,441,662 2,674 24,804,455 282 113,841 2,110 843,180 174 70,474 2,110 843,180110 13 403,606 3,760,688,540 2,669 24,839,150 283 114,062 2,119 844,833 175 70,610 2,119 844,833111 12 402,730 3,765,521,303 2,664 24,871,117 284 114,266 2,128 846,366 176 70,737 2,128 846,366112 11 401,816 3,769,941,283 2,659 24,900,362 285 114,455 2,137 847,776 177 70,854 2,137 847,776113 10 400,862 3,773,949,900 2,653 24,926,894 286 114,627 2,145 849,063 177 70,960 2,145 849,063114 9 399,864 3,777,548,675 2,648 24,950,722 287 114,782 2,152 850,225 178 71,056 2,152 850,225115 7 398,820 3,780,340,415 2,642 24,969,213 288 114,903 2,159 851,132 178 71,131 2,159 851,132116 7 397,727 3,783,124,507 2,635 24,987,660 289 115,024 2,166 852,041 179 71,206 2,166 852,041117 22 396,583 3,791,849,342 2,629 25,045,496 290 115,407 2,172 854,908 179 71,443 2,172 854,908
Freshwater Reclaimed Water
E-1
APPENDIX E
WASTE WATER TREATMENT OPTIONS SUMMARY
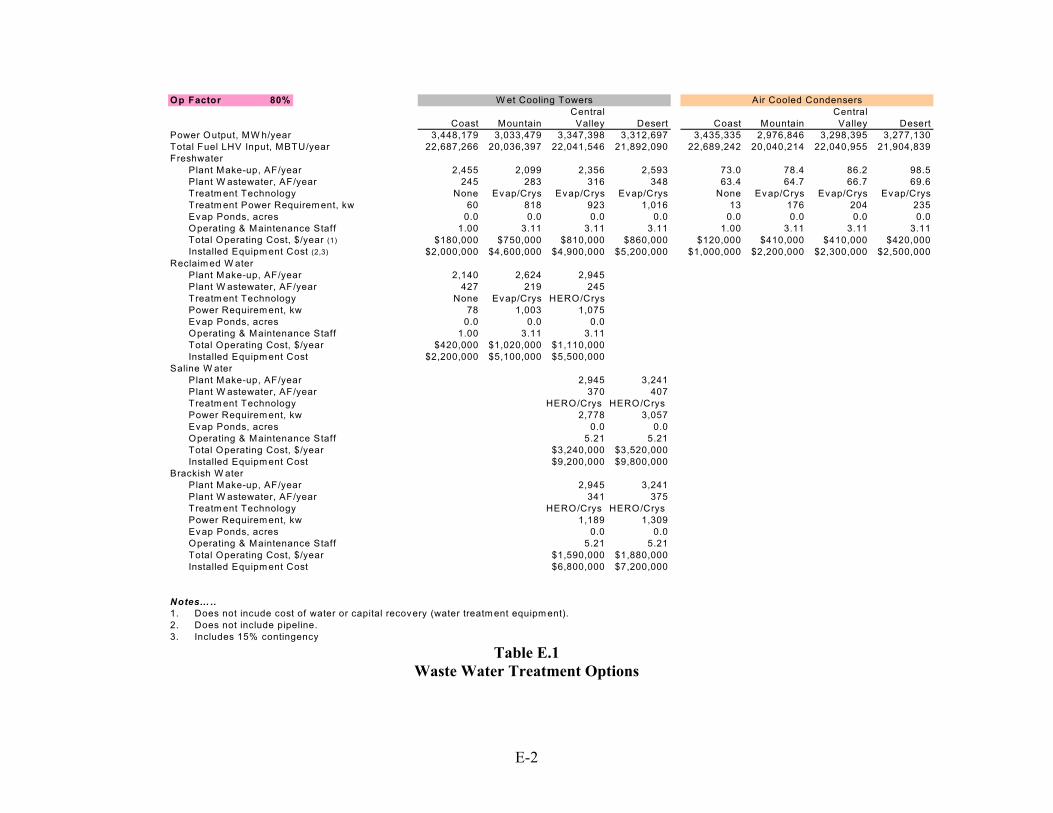
E-2
Table E.1 Waste Water Treatment Options
Op Factor 80%Central Central
Coast Mountain Valley Desert Coast Mountain Valley DesertPower Output, MW h/year 3,448,179 3,033,479 3,347,398 3,312,697 3,435,335 2,976,846 3,298,395 3,277,130Total Fuel LHV Input, MBTU/year 22,687,266 20,036,397 22,041,546 21,892,090 22,689,242 20,040,214 22,040,955 21,904,839Freshwater
Plant Make-up, AF/year 2,455 2,099 2,356 2,593 73.0 78.4 86.2 98.5Plant W astewater, AF/year 245 283 316 348 63.4 64.7 66.7 69.6Treatm ent Technology None Evap/Crys Evap/Crys Evap/Crys None Evap/Crys Evap/Crys Evap/CrysTreatm ent Power Requirem ent, kw 60 818 923 1,016 13 176 204 235Evap Ponds, acres 0.0 0.0 0.0 0.0 0.0 0.0 0.0 0.0Operating & Maintenance Staff 1.00 3.11 3.11 3.11 1.00 3.11 3.11 3.11Total Operating Cost, $/year (1) $180,000 $750,000 $810,000 $860,000 $120,000 $410,000 $410,000 $420,000Installed Equipm ent Cost (2,3) $2,000,000 $4,600,000 $4,900,000 $5,200,000 $1,000,000 $2,200,000 $2,300,000 $2,500,000
Reclaim ed W aterPlant Make-up, AF/year 2,140 2,624 2,945Plant W astewater, AF/year 427 219 245Treatm ent Technology None Evap/Crys HERO/CrysPower Requirem ent, kw 78 1,003 1,075Evap Ponds, acres 0.0 0.0 0.0Operating & Maintenance Staff 1.00 3.11 3.11Total Operating Cost, $/year $420,000 $1,020,000 $1,110,000Installed Equipm ent Cost $2,200,000 $5,100,000 $5,500,000
Saline W aterPlant Make-up, AF/year 2,945 3,241Plant W astewater, AF/year 370 407Treatm ent Technology HERO/Crys HERO/CrysPower Requirem ent, kw 2,778 3,057Evap Ponds, acres 0.0 0.0Operating & Maintenance Staff 5.21 5.21Total Operating Cost, $/year $3,240,000 $3,520,000Installed Equipm ent Cost $9,200,000 $9,800,000
Brackish W aterPlant Make-up, AF/year 2,945 3,241Plant W astewater, AF/year 341 375Treatm ent Technology HERO/Crys HERO/CrysPower Requirem ent, kw 1,189 1,309Evap Ponds, acres 0.0 0.0Operating & Maintenance Staff 5.21 5.21Total Operating Cost, $/year $1,590,000 $1,880,000Installed Equipm ent Cost $6,800,000 $7,200,000
Notes… ..1. Does not incude cost of water or capital recovery (water treatm ent equipm ent).2. Does not include pipeline.3. Includes 15% contingency
W et Cooling Towers Air Cooled Condensers