Embed Size (px)
Citation preview
Cost Behaviour, Operating Leverage, and Profitability Analysis
Chapter 2
Copyright © 2003 McGraw-Hill Ryerson Limited, Canada2-2
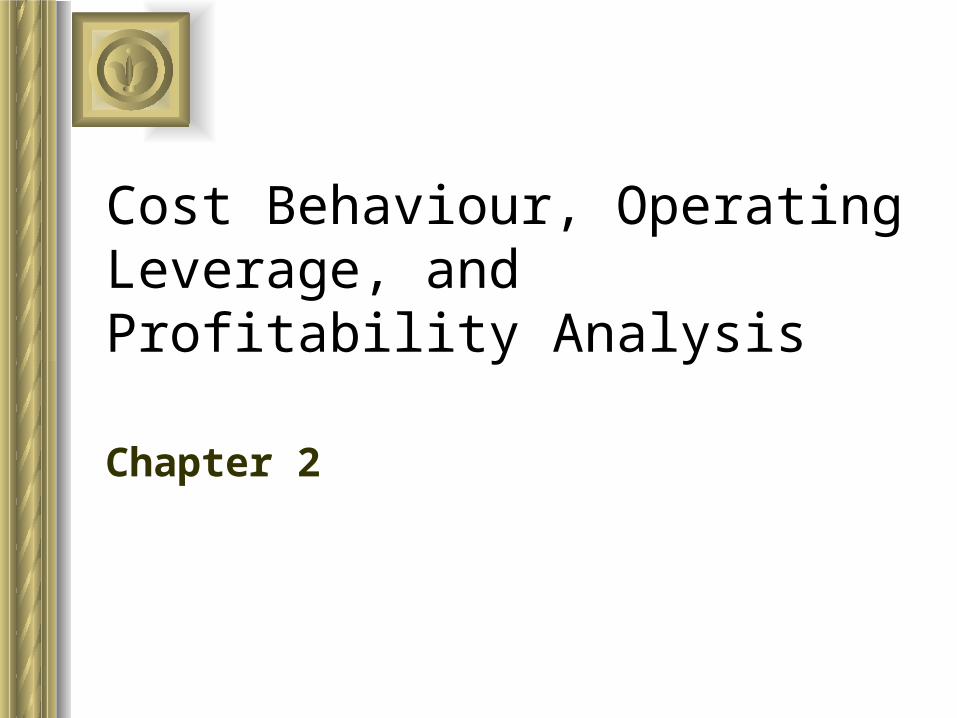
Fixed Cost Behaviour
Increases Decreases
Total Fixed Cost Remains constant Remains Constant
Fixed Cost Per Unit Decreases Increases
Consider the followingconcert example where theband will be paid $48,000
regardless of the number of tickets sold.
When activity . . . .
Copyright © 2003 McGraw-Hill Ryerson Limited, Canada2-3
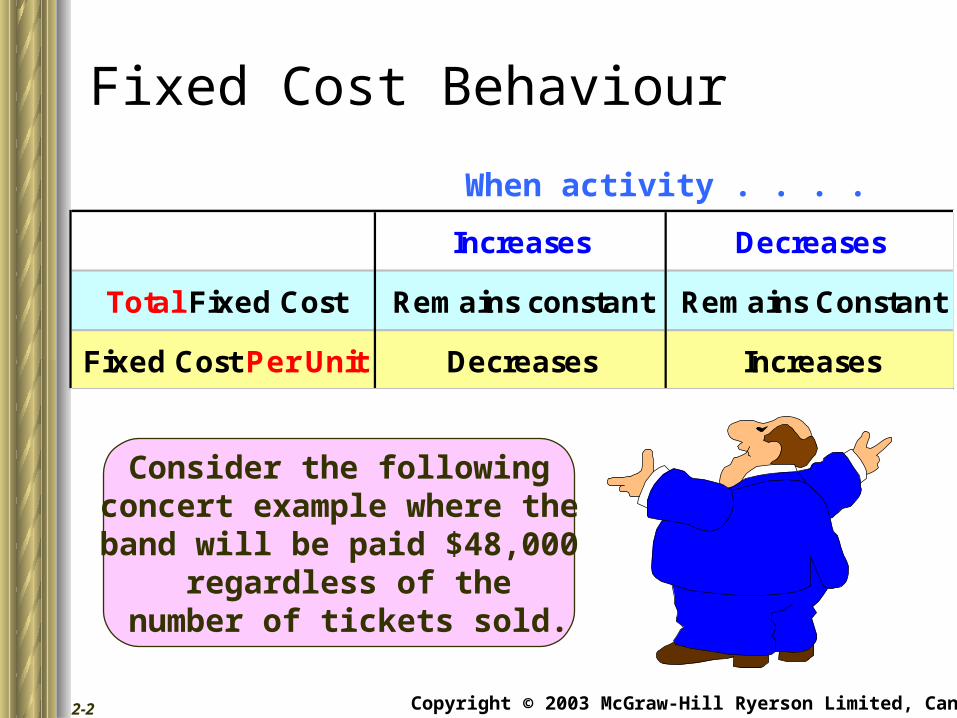
Fixed Cost Behaviour
Tickets sold 2,700 3,000 3,300
Total Cost of Band 48,000$ 48,000$ 48,000$
Per Unit Cost of Band 17.78$ 16.00$ 14.55$
$48,000 ÷ 3,000 Tickets = $16.00 per Ticket
Copyright © 2003 McGraw-Hill Ryerson Limited, Canada2-4
Operating Leverage
A measure of the extent to which fixedcosts are being used in an organization.
Operating leverage is greatest in companies that have a high proportion of fixed costs in
relation to variable costs.
Consider the followingconcert example where
all costs are fixed.
Copyright © 2003 McGraw-Hill Ryerson Limited, Canada2-5
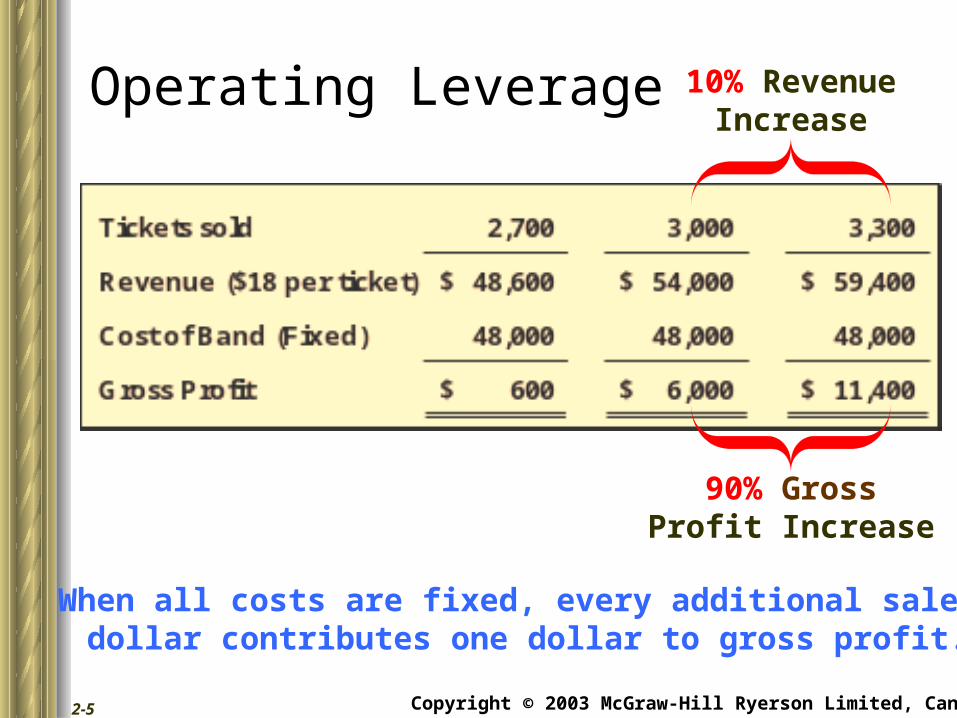
Operating Leverage
When all costs are fixed, every additional sales dollar contributes one dollar to gross profit.
10% RevenueIncrease
90% GrossProfit Increase
Copyright © 2003 McGraw-Hill Ryerson Limited, Canada2-6
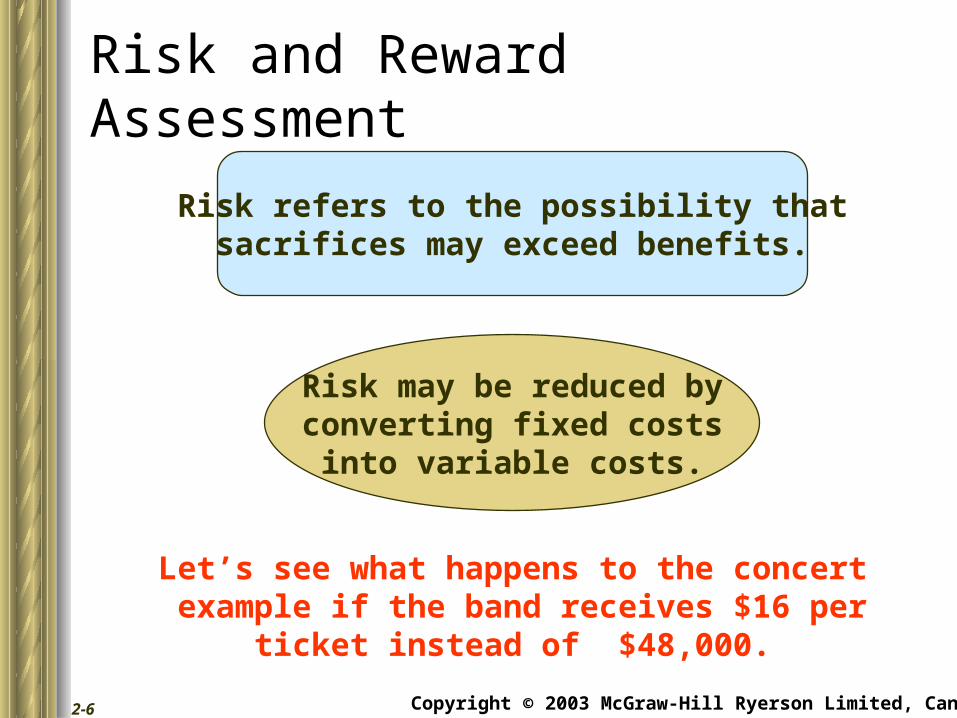
Risk and Reward Assessment
Risk refers to the possibility thatsacrifices may exceed benefits.
Risk may be reduced byconverting fixed costs
into variable costs.
Let’s see what happens to the concert example if the band receives $16 per
ticket instead of $48,000.
Copyright © 2003 McGraw-Hill Ryerson Limited, Canada2-7
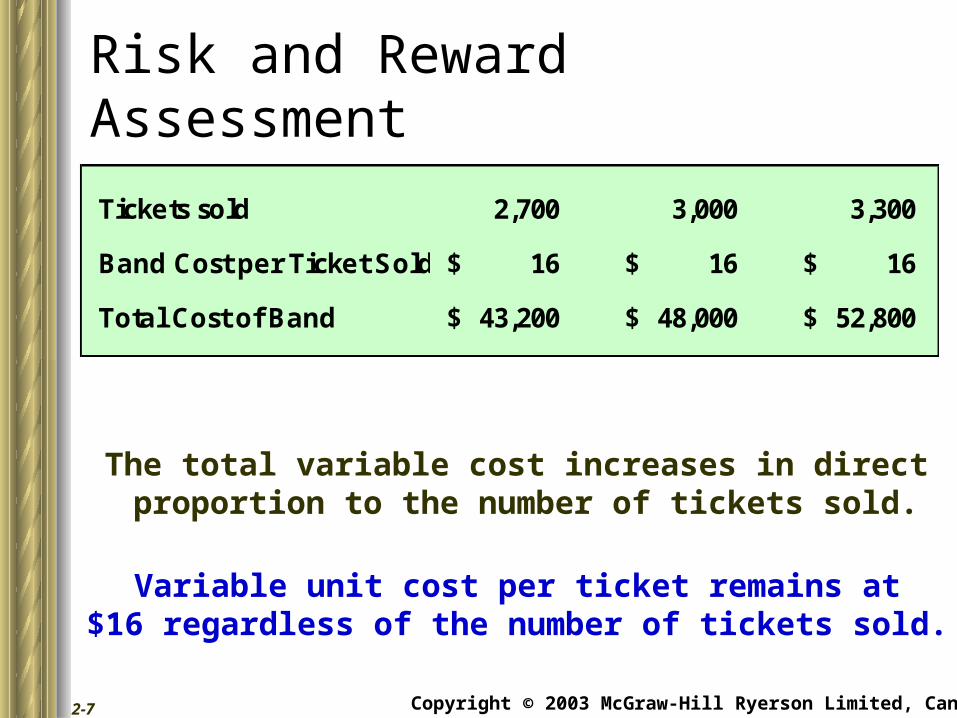
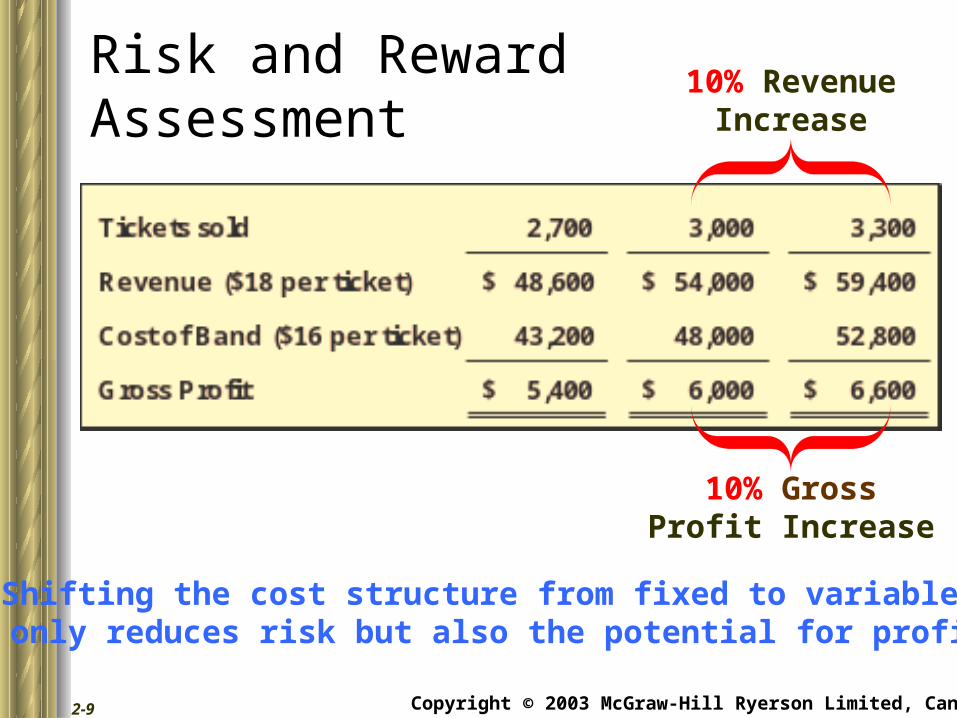
Tickets sold 2,700 3,000 3,300
Band Cost per Ticket Sold 16$ 16$ 16$
Total Cost of Band 43,200$ 48,000$ 52,800$
The total variable cost increases in direct proportion to the number of tickets sold.
Variable unit cost per ticket remains at$16 regardless of the number of tickets sold.
Risk and Reward Assessment
Copyright © 2003 McGraw-Hill Ryerson Limited, Canada2-8
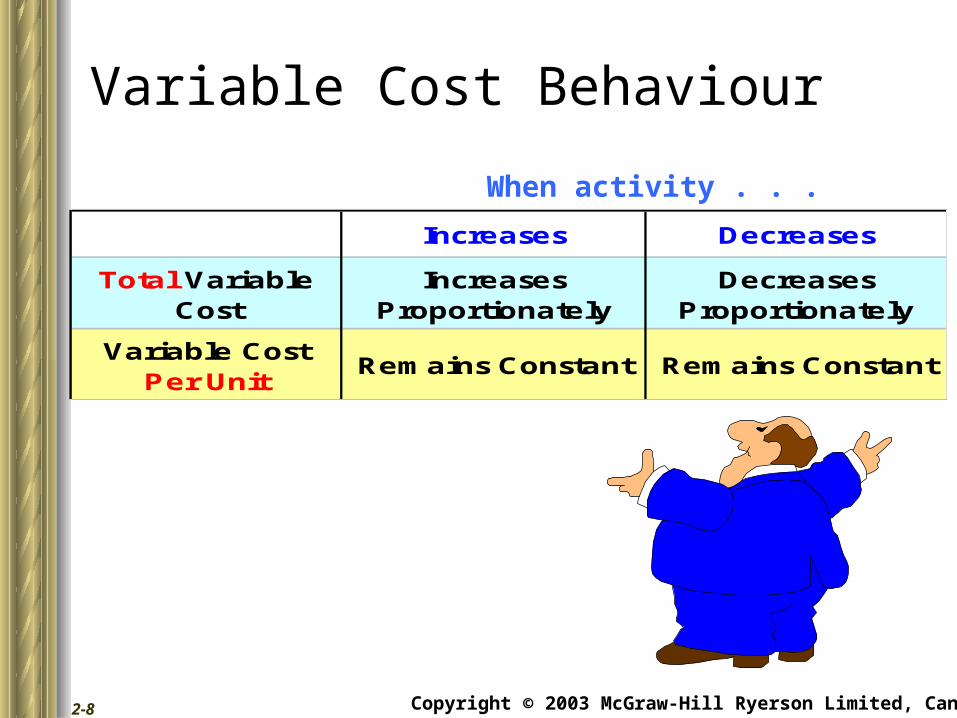
Variable Cost Behaviour
Increases Decreases
Total Variable Cost
Increases Proportionately
Decreases Proportionately
Variable Cost Per Unit
Remains Constant Remains Constant
When activity . . .
Copyright © 2003 McGraw-Hill Ryerson Limited, Canada2-9
Shifting the cost structure from fixed to variable notonly reduces risk but also the potential for profits.
Risk and RewardAssessment
10% RevenueIncrease
10% GrossProfit Increase
Copyright © 2003 McGraw-Hill Ryerson Limited, Canada2-10
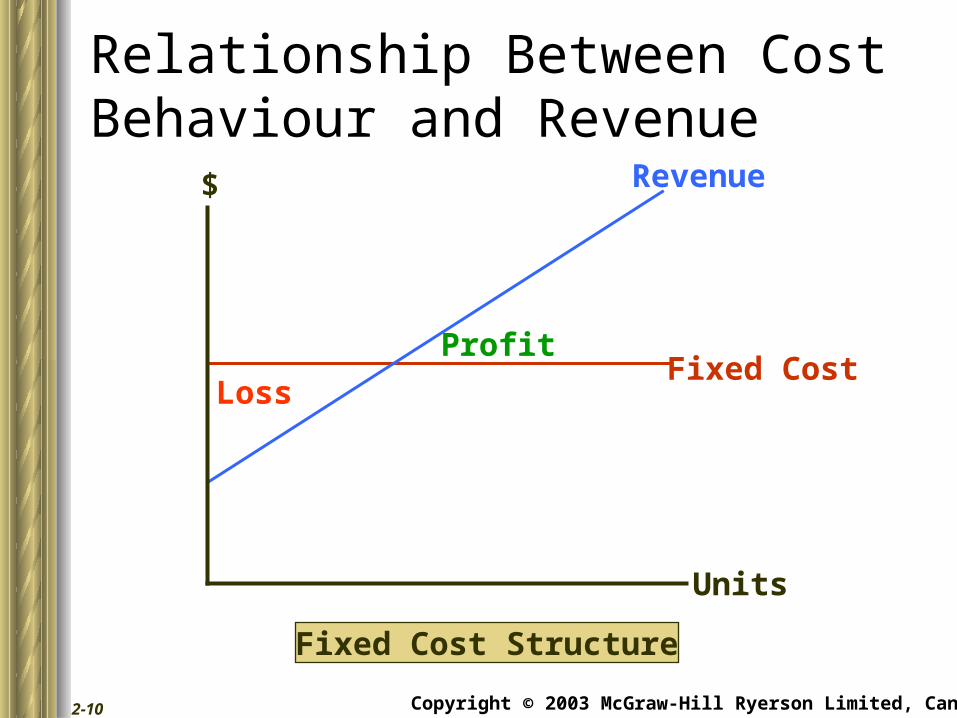
Relationship Between CostBehaviour and Revenue
Fixed Cost Structure
$
Units
Revenue
Fixed CostProfit
Loss
Copyright © 2003 McGraw-Hill Ryerson Limited, Canada2-11
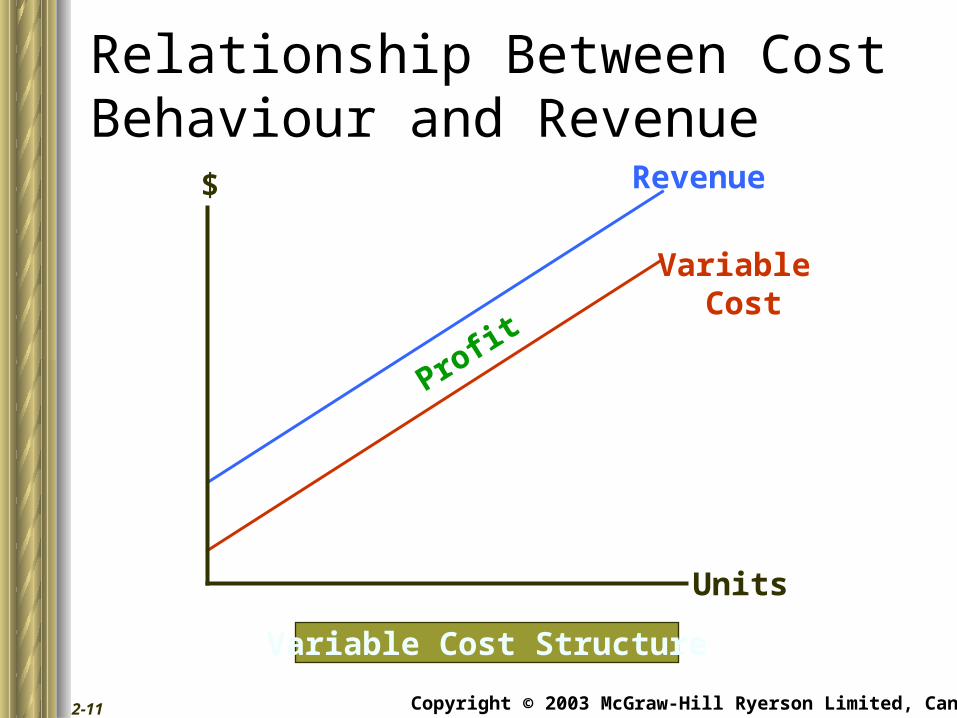
Relationship Between CostBehaviour and Revenue
Variable Cost Structure
Variable Cost
Revenue
Profit
$
Units
Copyright © 2003 McGraw-Hill Ryerson Limited, Canada2-12
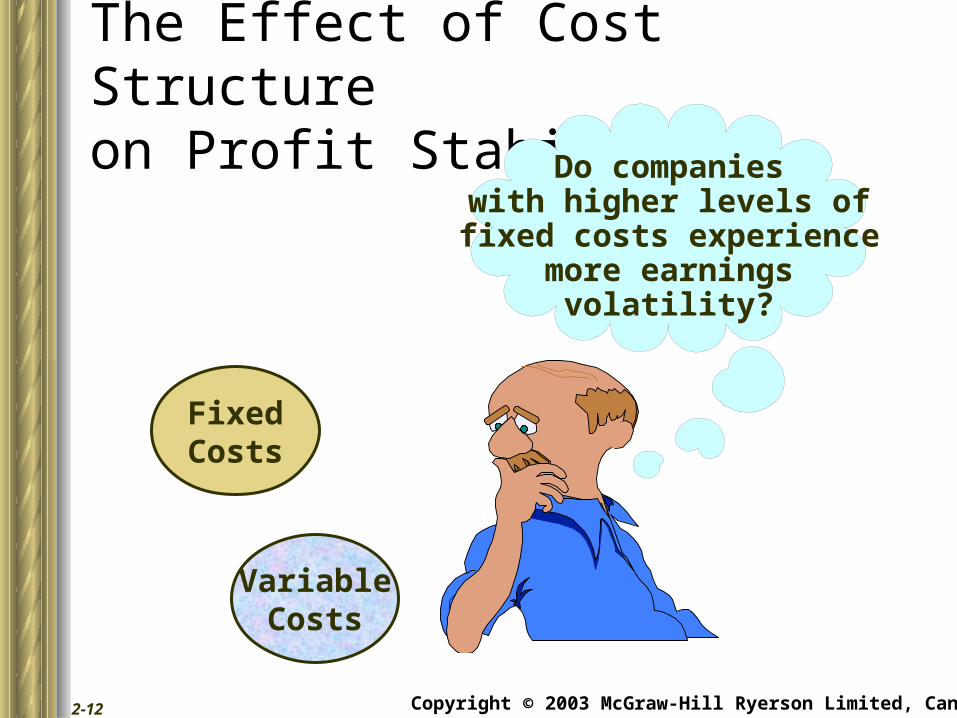
The Effect of Cost Structureon Profit Stability
VariableCosts
FixedCosts
Do companieswith higher levels of
fixed costs experiencemore earnings
volatility?
Copyright © 2003 McGraw-Hill Ryerson Limited, Canada2-13
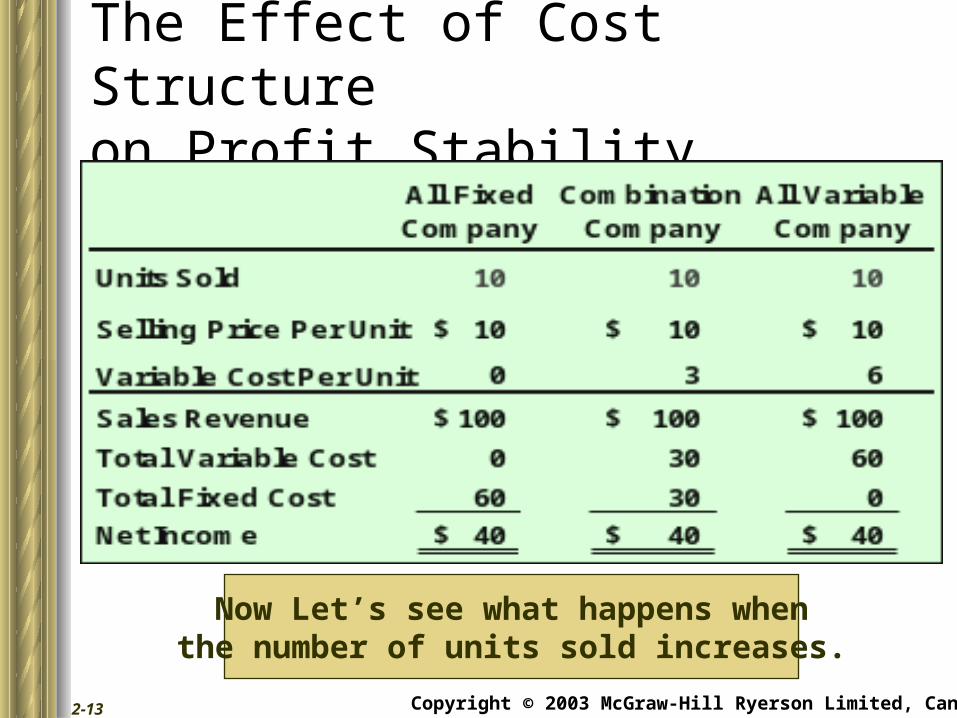
The Effect of Cost Structureon Profit Stability
Now Let’s see what happens whenthe number of units sold increases.
Copyright © 2003 McGraw-Hill Ryerson Limited, Canada2-14
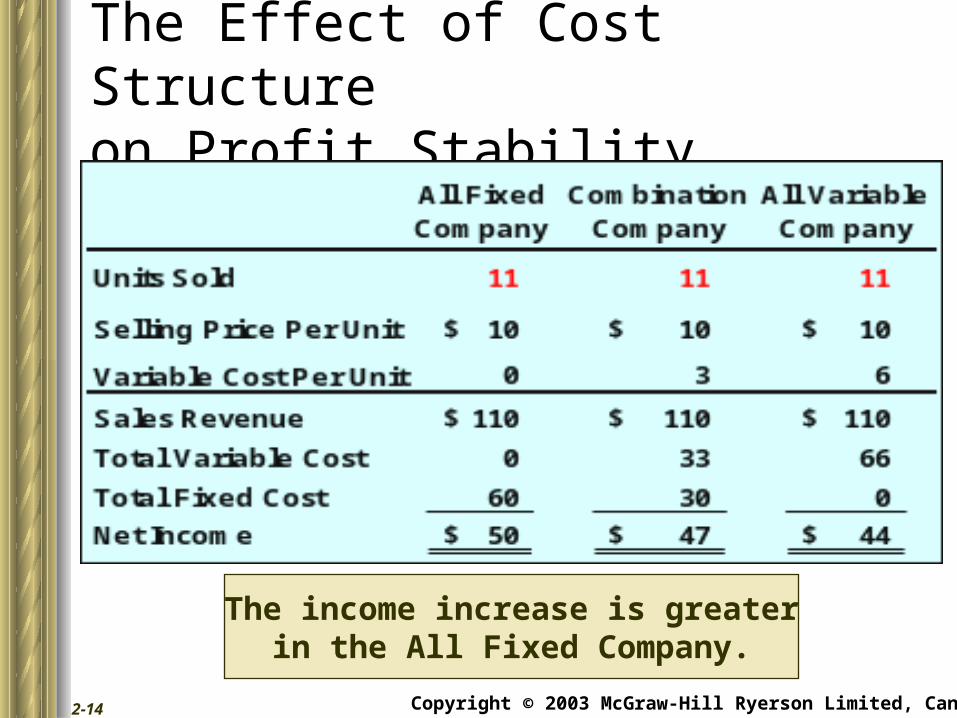
The Effect of Cost Structureon Profit Stability
The income increase is greaterin the All Fixed Company.
Copyright © 2003 McGraw-Hill Ryerson Limited, Canada2-15
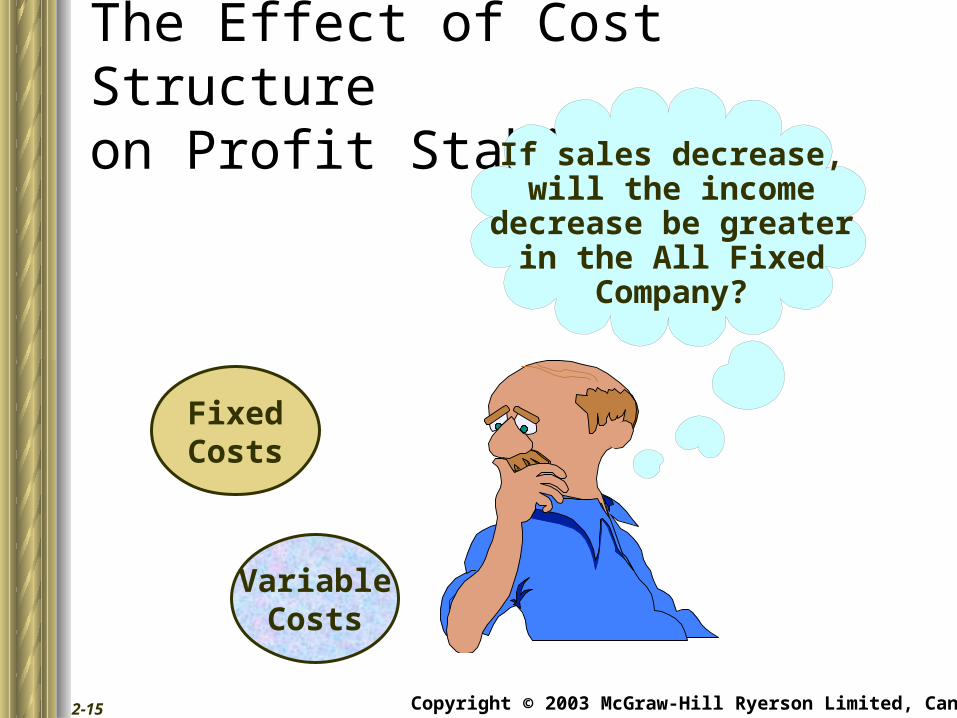
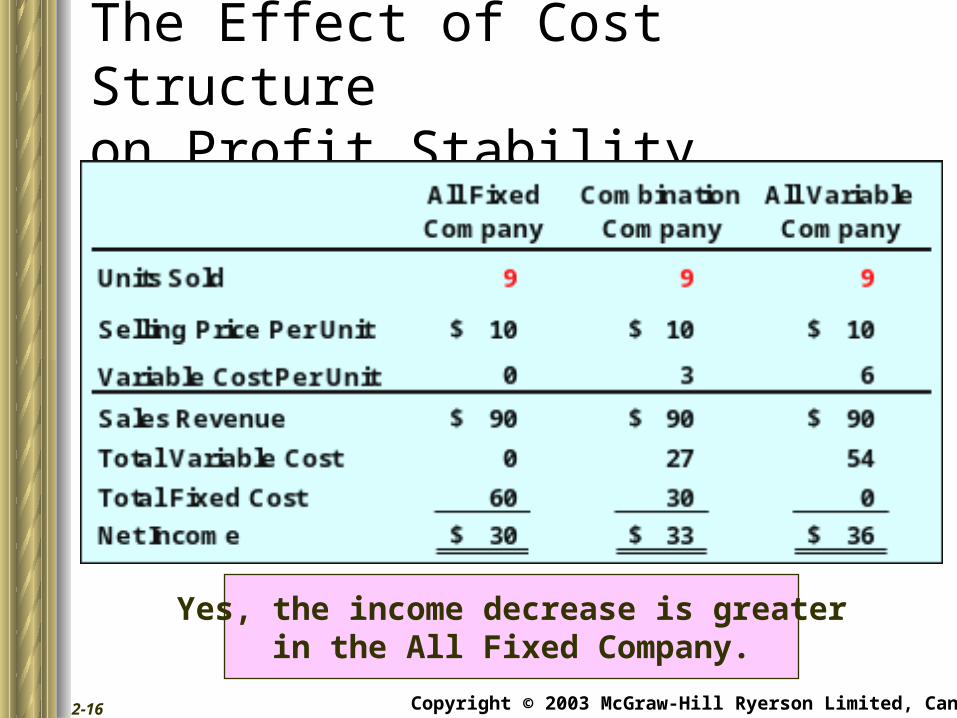
The Effect of Cost Structureon Profit Stability
VariableCosts
FixedCosts
If sales decrease,will the income
decrease be greaterin the All Fixed
Company?
Copyright © 2003 McGraw-Hill Ryerson Limited, Canada2-16
The Effect of Cost Structureon Profit Stability
Yes, the income decrease is greaterin the All Fixed Company.
Copyright © 2003 McGraw-Hill Ryerson Limited, Canada2-17
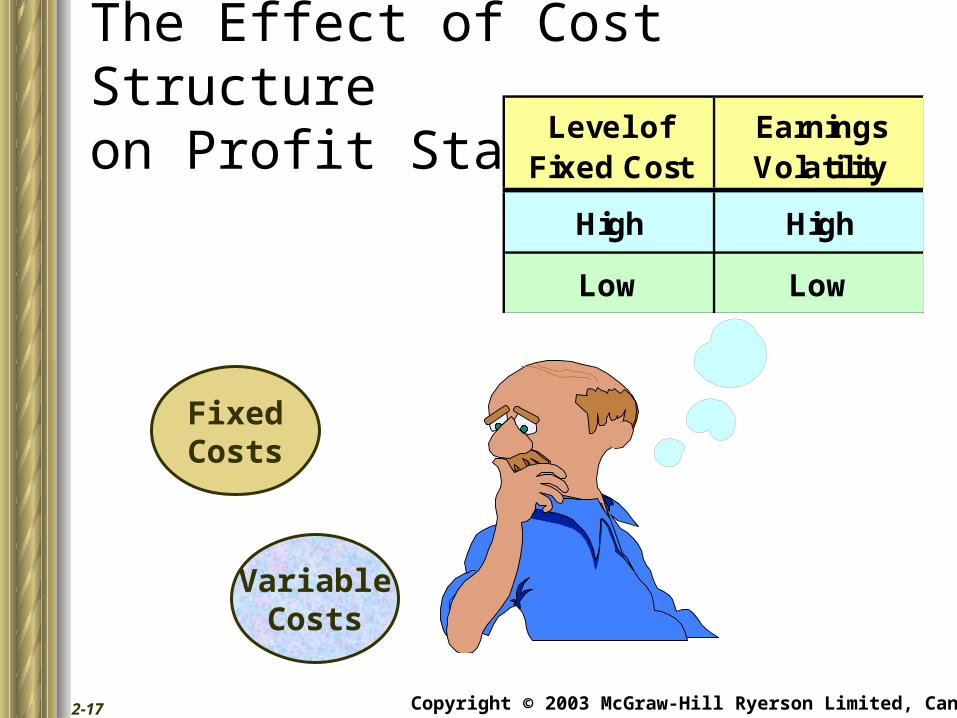
The Effect of Cost Structureon Profit Stability
VariableCosts
FixedCosts
Level of Fixed Cost
Earnings Volatility
High High
Low Low
Copyright © 2003 McGraw-Hill Ryerson Limited, Canada2-18
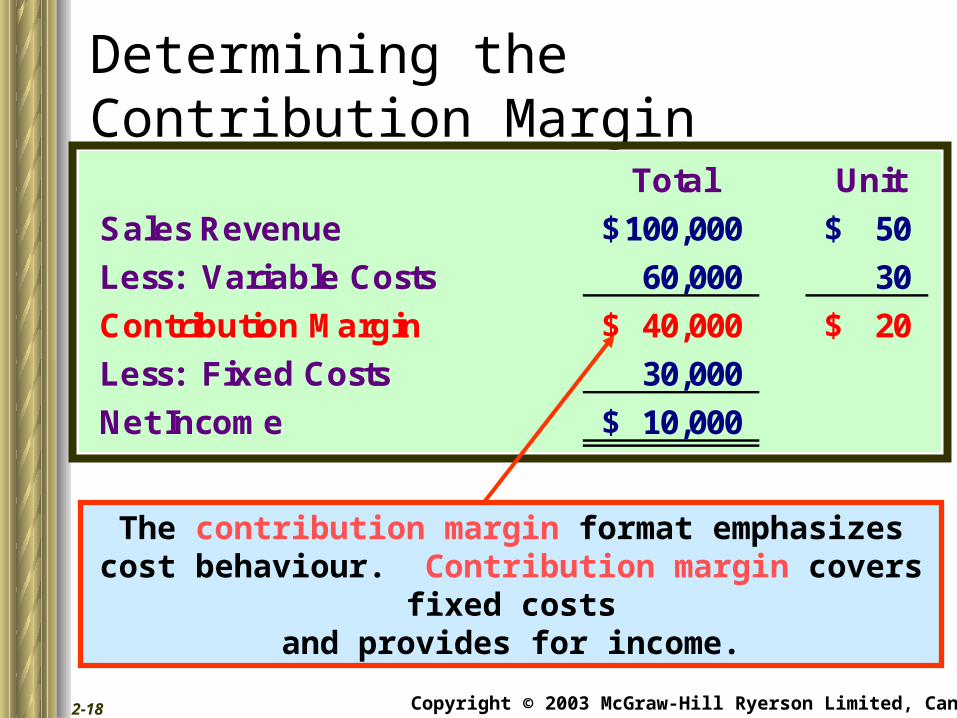
Determining the Contribution Margin
Total Unit
Sales Revenue 100,000$ 50$
Less: Variable Costs 60,000 30
Contribution Margin 40,000$ 20$
Less: Fixed Costs 30,000
Net Income 10,000$
The contribution margin format emphasizes cost behaviour. Contribution margin covers fixed costs
and provides for income.
Copyright © 2003 McGraw-Hill Ryerson Limited, Canada2-19
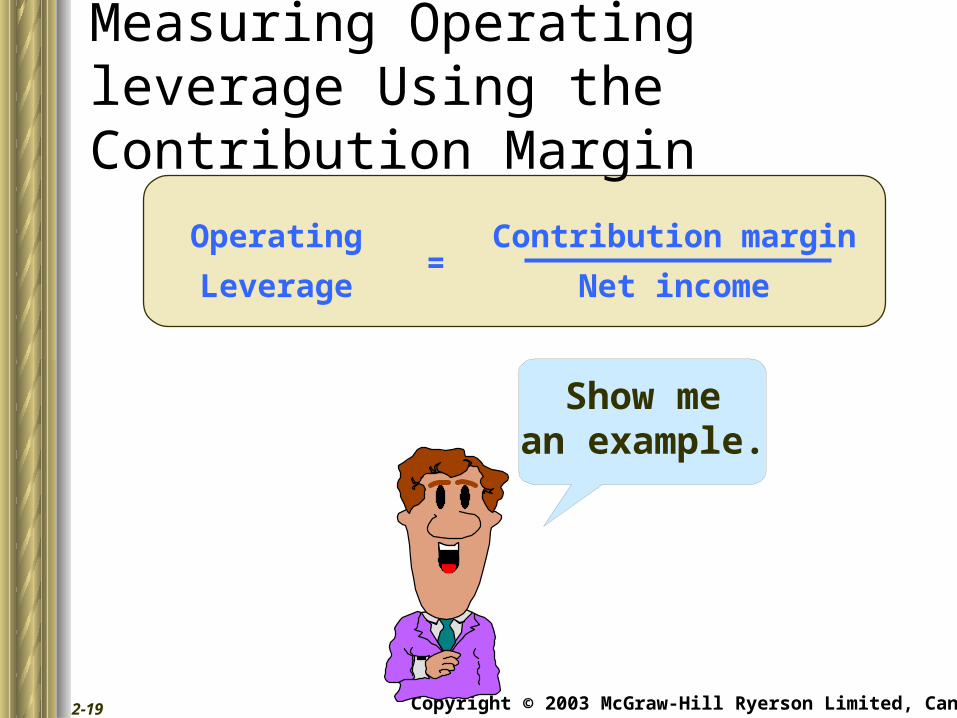
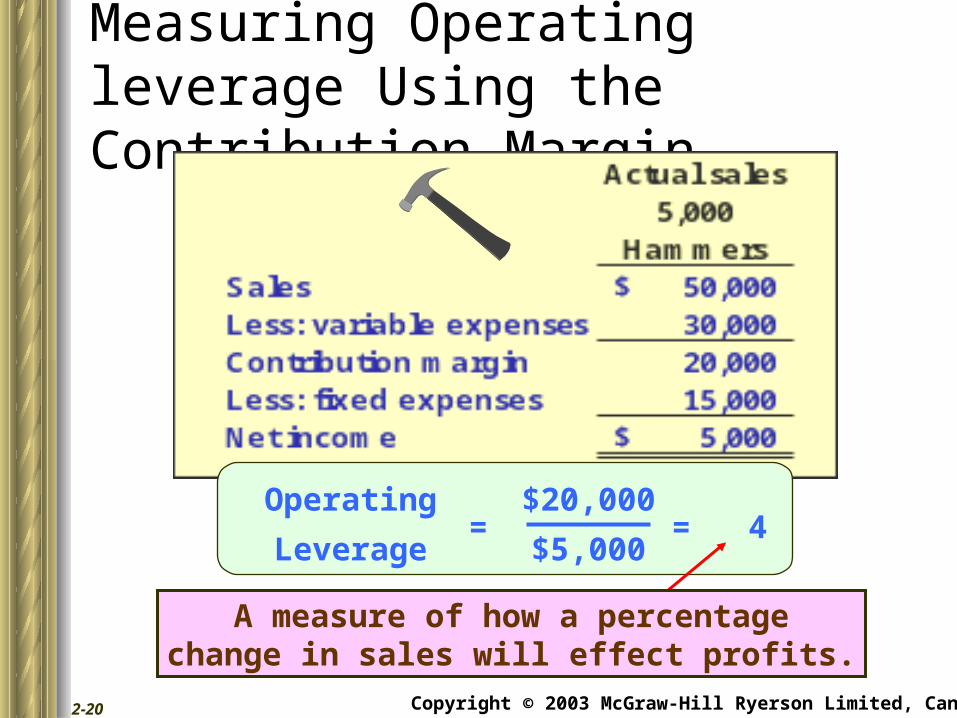
Measuring Operating leverage Using the Contribution Margin
Contribution margin
Net income
Operating
Leverage=
Show mean example.
Copyright © 2003 McGraw-Hill Ryerson Limited, Canada2-20
Measuring Operating leverage Using the Contribution Margin
$20,000
$5,000
Operating
Leverage= = 4
A measure of how a percentagechange in sales will effect profits.
Copyright © 2003 McGraw-Hill Ryerson Limited, Canada2-21
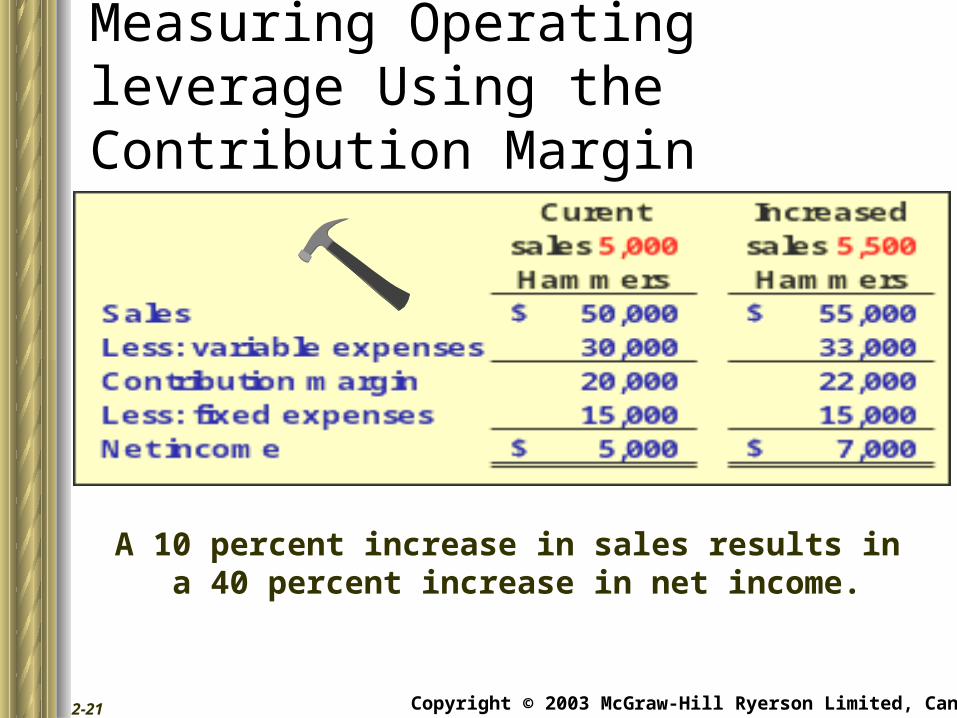
Measuring Operating leverage Using the Contribution Margin
A 10 percent increase in sales results in a 40 percent increase in net income.
Copyright © 2003 McGraw-Hill Ryerson Limited, Canada2-22
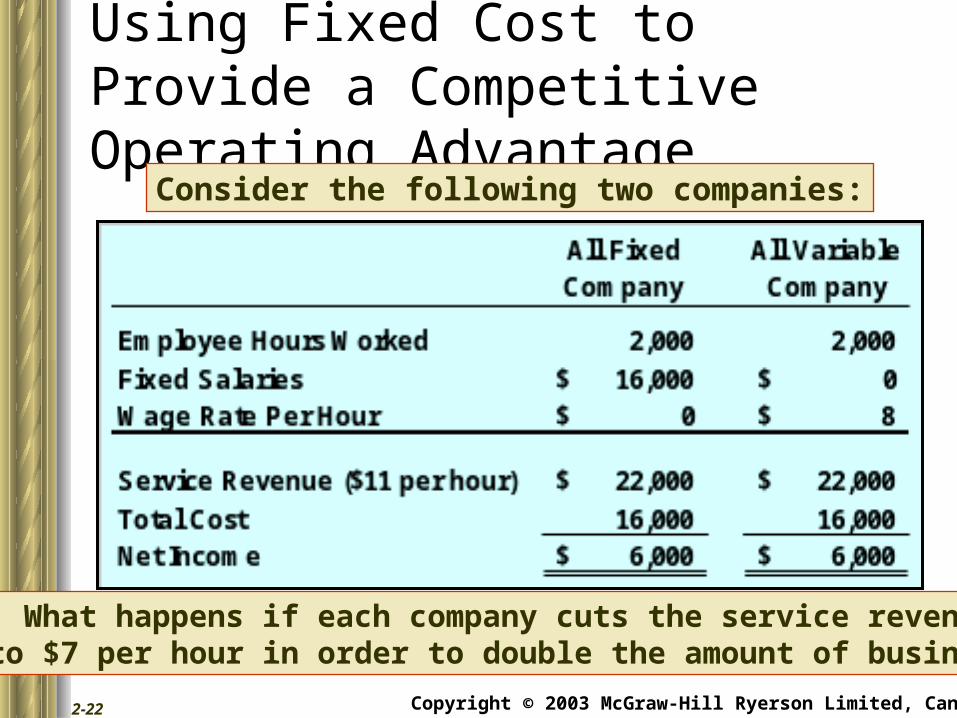
Using Fixed Cost to Provide a Competitive Operating Advantage
Consider the following two companies:
What happens if each company cuts the service revenueto $7 per hour in order to double the amount of business?
Copyright © 2003 McGraw-Hill Ryerson Limited, Canada2-23
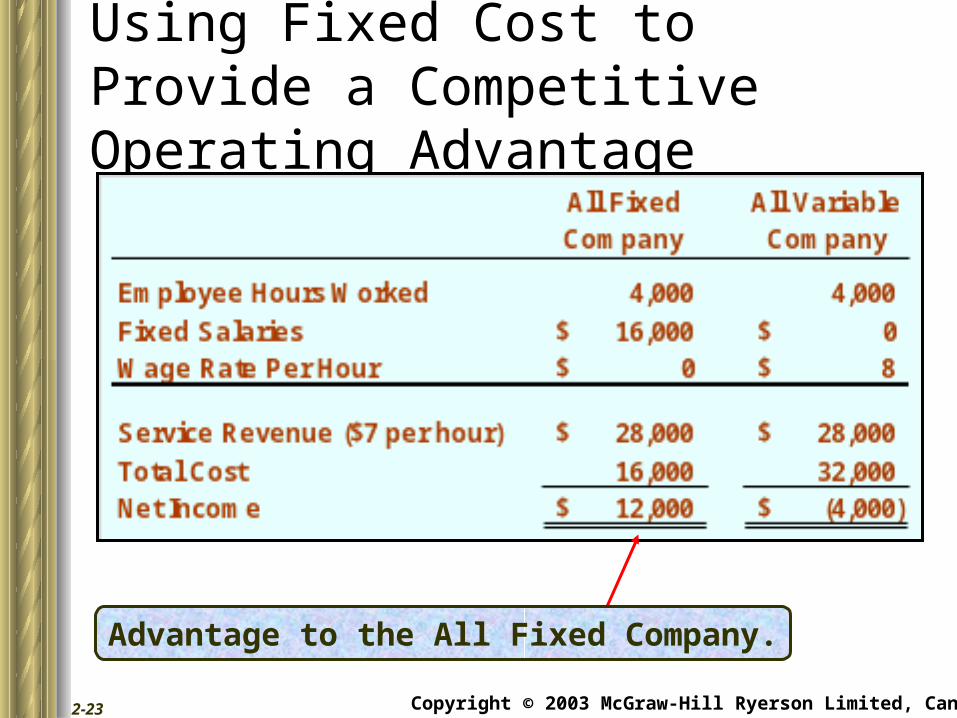
Using Fixed Cost to Provide a Competitive Operating Advantage
Advantage to the All Fixed Company.
Copyright © 2003 McGraw-Hill Ryerson Limited, Canada2-24
Using Fixed Cost to Provide a Competitive Operating Advantage
What happens toincome if demand
falls to 1,000 hoursfor each company?
Copyright © 2003 McGraw-Hill Ryerson Limited, Canada2-25
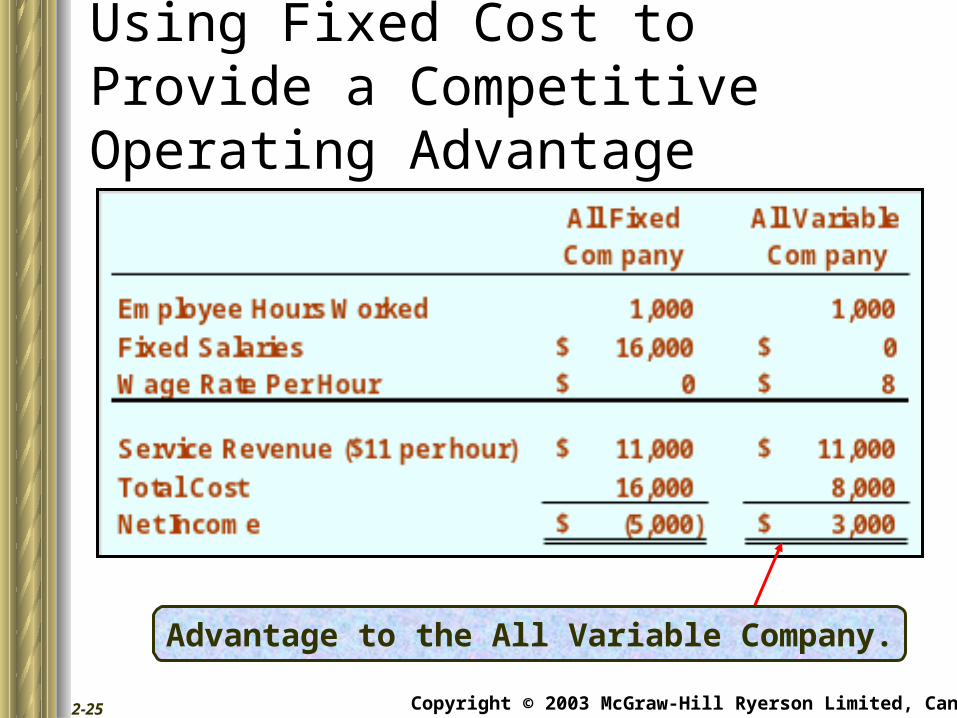
Using Fixed Cost to Provide a Competitive Operating Advantage
Advantage to the All Variable Company.
Copyright © 2003 McGraw-Hill Ryerson Limited, Canada2-26
Using Fixed Cost to Provide a Competitive Operating Advantage
I suppose fixed costs arebetter if volume is increasing,but variable costs are better
if business is declining.
Copyright © 2003 McGraw-Hill Ryerson Limited, Canada2-27
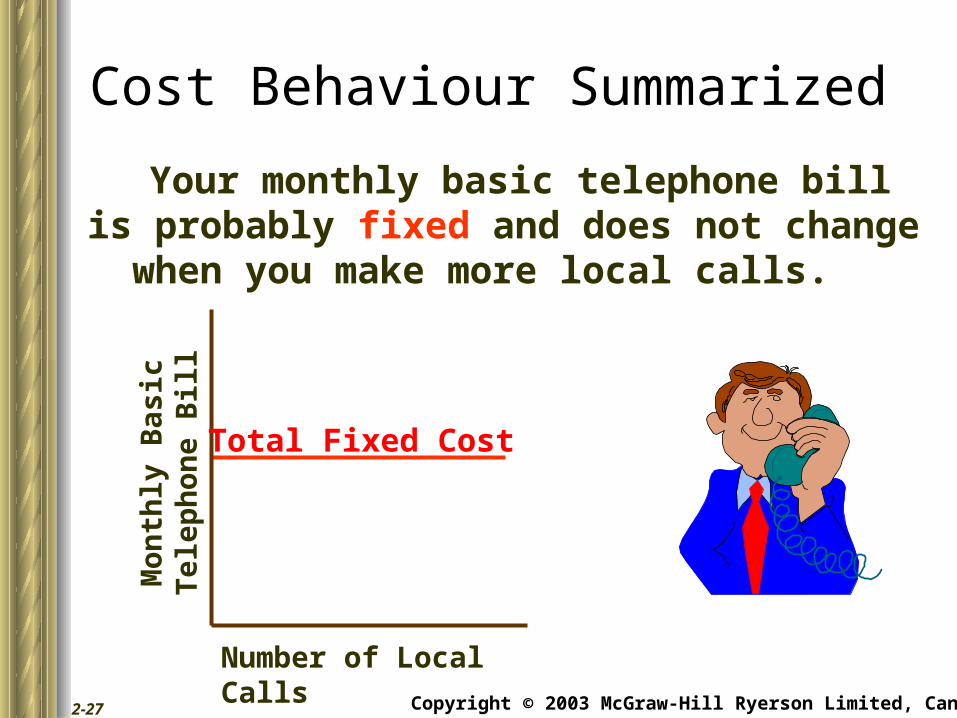
Cost Behaviour Summarized
Your monthly basic telephone bill is probably fixed and does not change when
you make more local calls.
Number of Local Calls
Mo
nth
ly B
asic
T
elep
ho
ne
Bill
Total Fixed Cost
Copyright © 2003 McGraw-Hill Ryerson Limited, Canada2-28
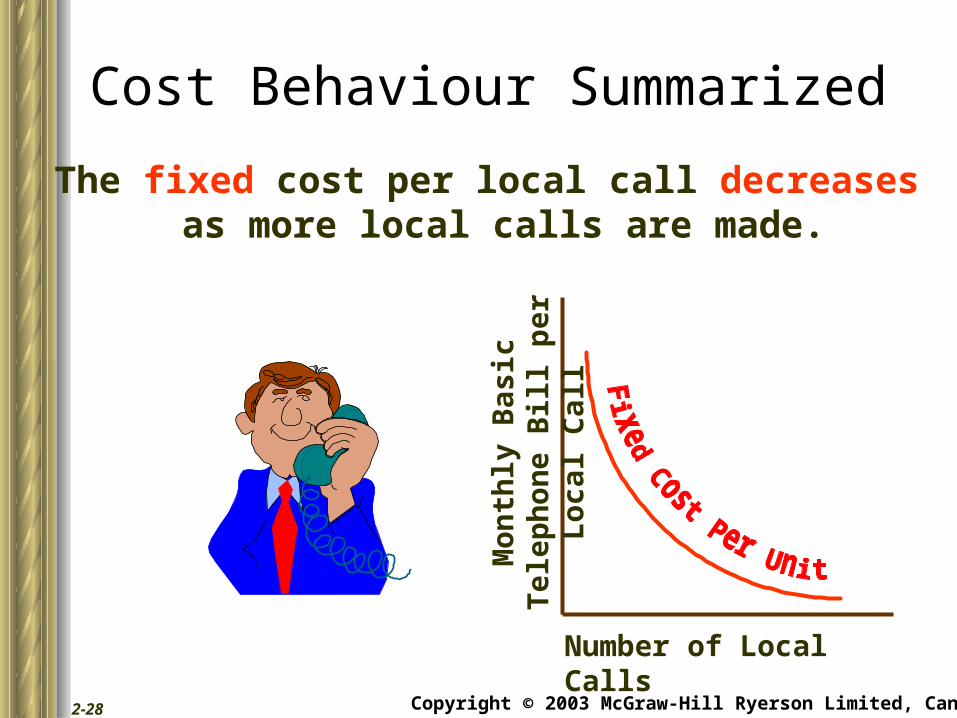
Number of Local Calls
Mo
nth
ly B
asic
Tel
eph
on
e B
ill p
er L
oca
l Cal
l
The fixed cost per local call decreasesas more local calls are made.
Cost Behaviour Summarized
Copyright © 2003 McGraw-Hill Ryerson Limited, Canada2-29
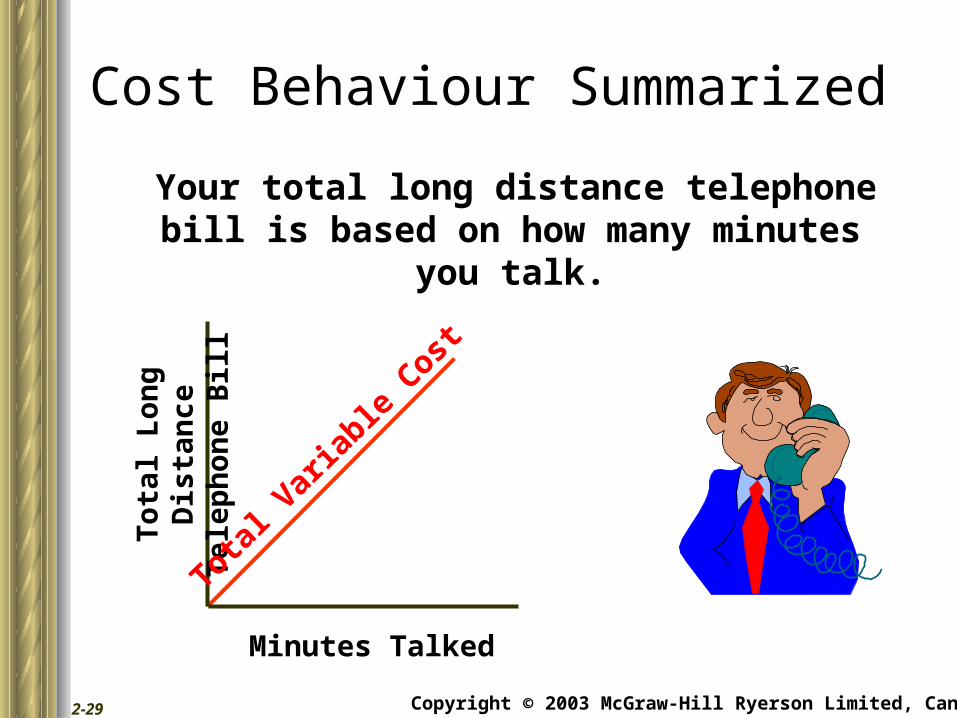
Your total long distance telephone bill is based on how many minutes you talk.
Minutes Talked
To
tal L
on
g D
ista
nce
Tel
eph
on
e B
ill
Cost Behaviour Summarized
Total V
aria
ble C
ost
Copyright © 2003 McGraw-Hill Ryerson Limited, Canada2-30
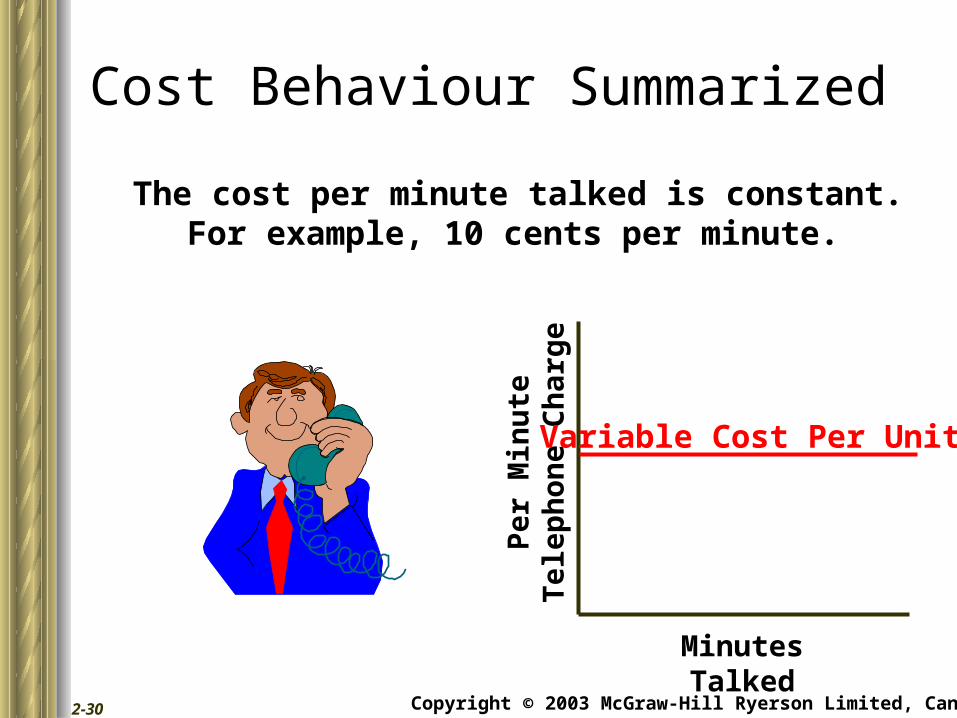
Minutes Talked
Per
Min
ute
Tel
eph
on
e C
har
ge
The cost per minute talked is constant.For example, 10 cents per minute.
Cost Behaviour Summarized
Variable Cost Per Unit
Copyright © 2003 McGraw-Hill Ryerson Limited, Canada2-31
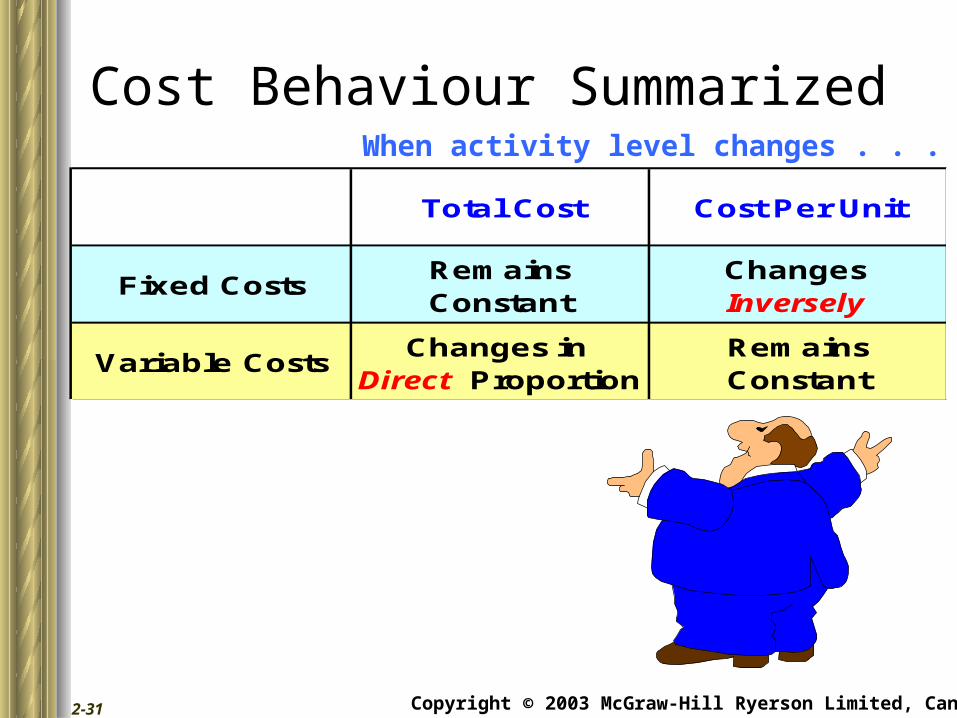
Total Cost Cost Per Unit
Fixed CostsRemains Constant
Changes Inversely
Variable CostsChanges in
Direct ProportionRemains Constant
Cost Behaviour SummarizedWhen activity level changes . . .
Copyright © 2003 McGraw-Hill Ryerson Limited, Canada2-32
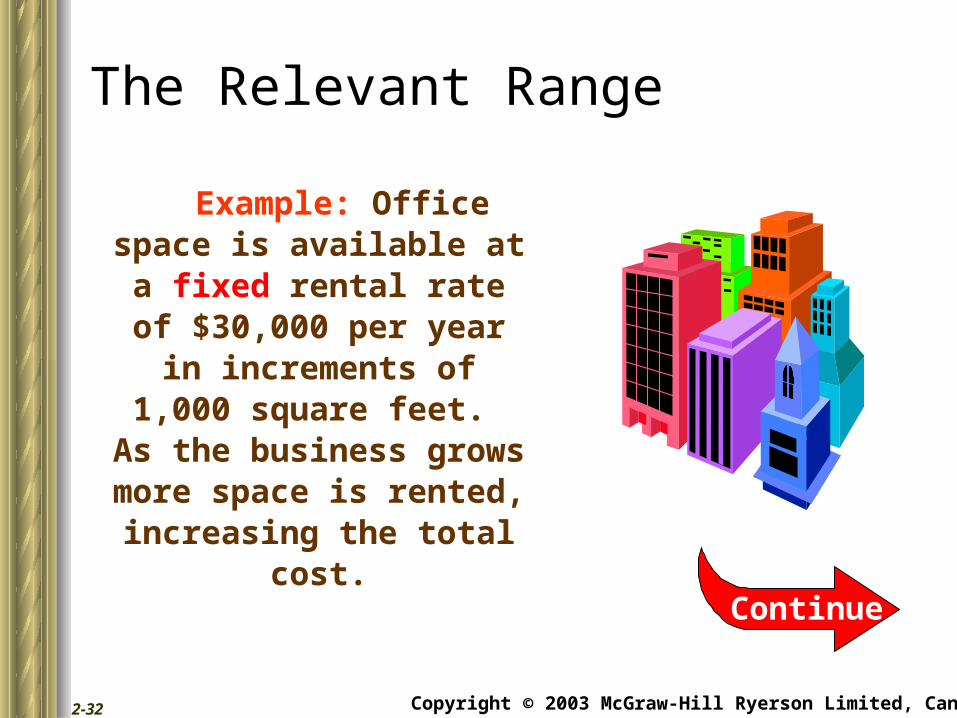
Example: Office space is available at a fixed rental rate of $30,000
per year in increments of 1,000 square feet.
As the business grows more space is rented,
increasing the total cost.
The Relevant Range
Continue
Copyright © 2003 McGraw-Hill Ryerson Limited, Canada2-33
Ren
t C
ost
in
T
ho
usa
nd
s o
f D
oll
ars
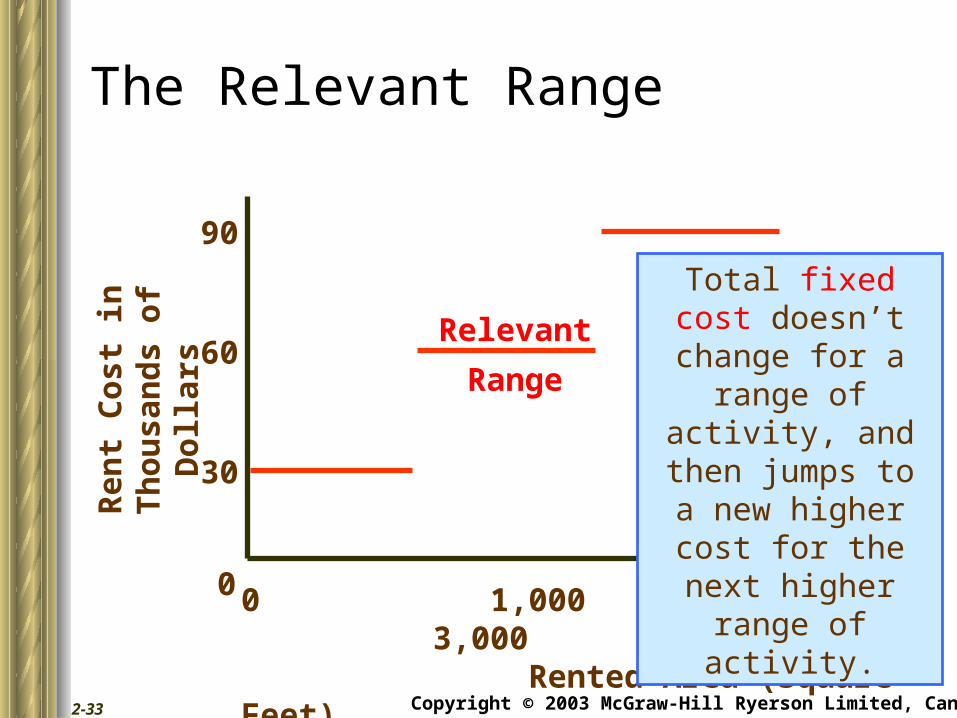
0 1,000 2,000 3,000 Rented Area (Square Feet)
0
30
60
The Relevant Range
90
Relevant
Range
Total fixed cost doesn’t change for a range of activity,
and then jumps to a new higher cost for
the next higher range of activity.
Copyright © 2003 McGraw-Hill Ryerson Limited, Canada2-34
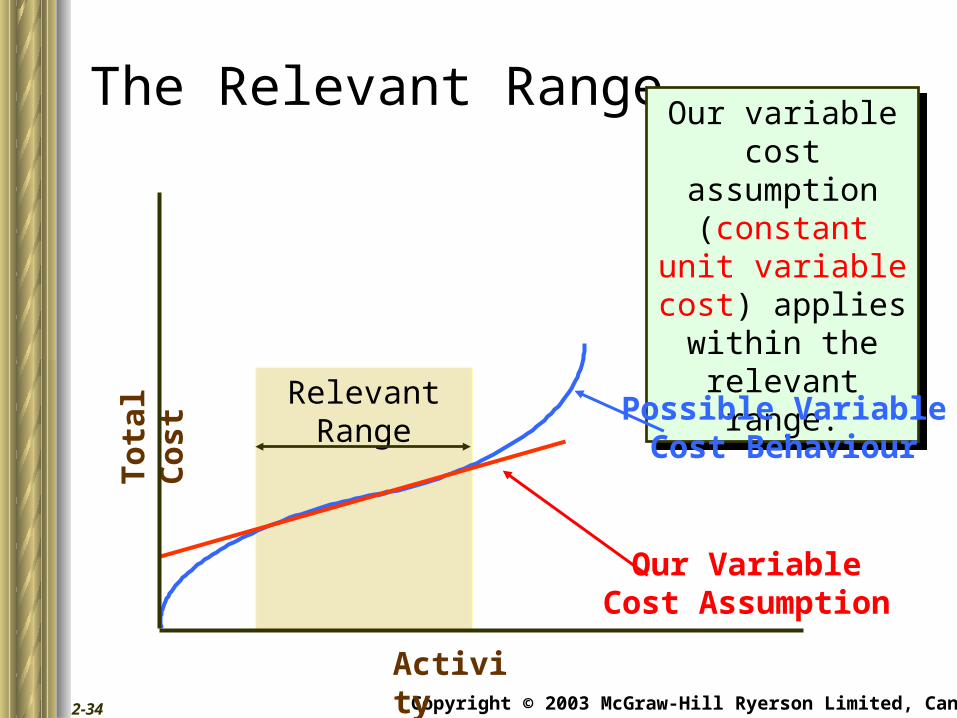
Activity
To
tal
Co
st
RelevantRange
The Relevant RangeOur variable cost
assumption (constant unit variable cost)
applies within the relevant range.
Our variable cost assumption
(constant unit variable cost)
applies within the relevant range.
Possible VariableCost Behaviour
Our VariableCost Assumption
Copyright © 2003 McGraw-Hill Ryerson Limited, Canada2-35
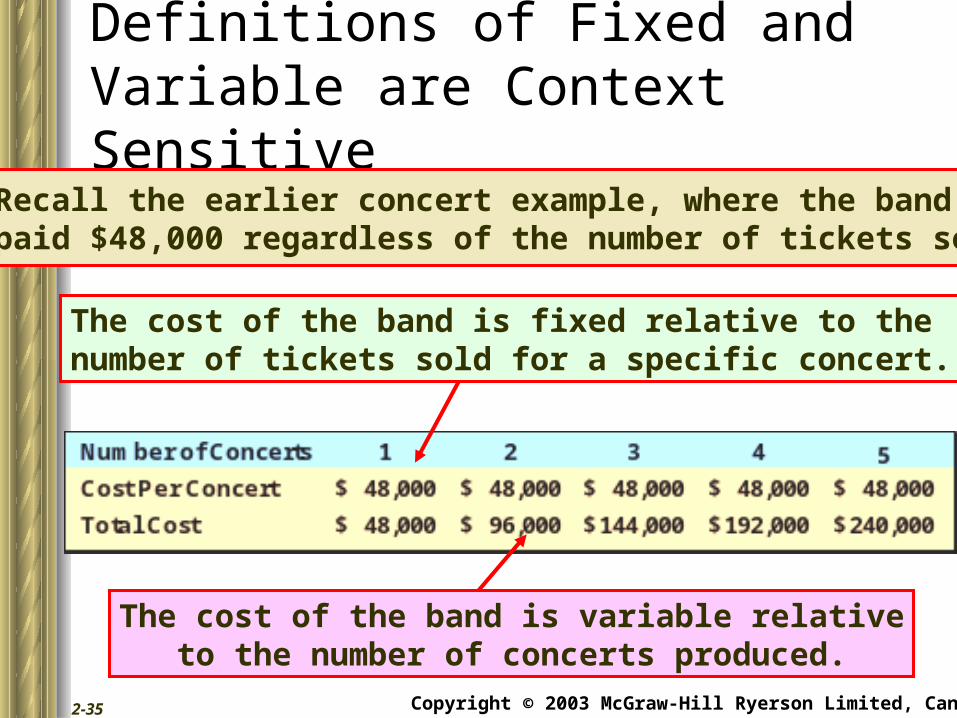
Definitions of Fixed and Variable are Context Sensitive
Recall the earlier concert example, where the band waspaid $48,000 regardless of the number of tickets sold.
The cost of the band is fixed relative to the number of tickets sold for a specific concert.
The cost of the band is variable relativeto the number of concerts produced.
Copyright © 2003 McGraw-Hill Ryerson Limited, Canada2-36
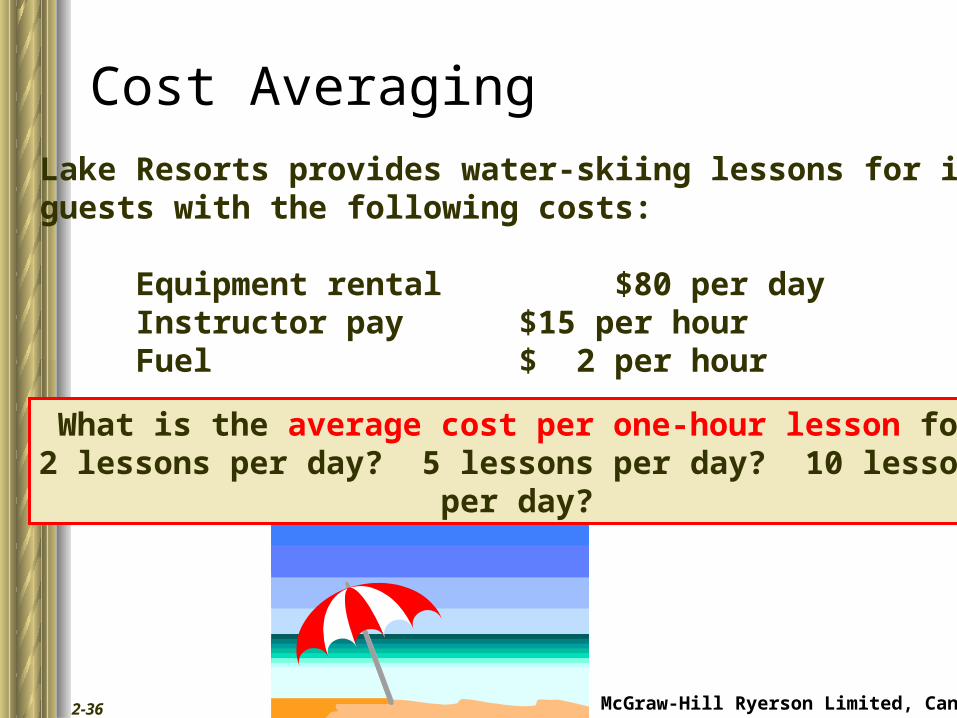
Cost Averaging
Lake Resorts provides water-skiing lessons for itsguests with the following costs:
Equipment rental $80 per dayInstructor pay $15 per hourFuel $ 2 per hour
What is the average cost per one-hour lesson for2 lessons per day? 5 lessons per day? 10 lessons
per day?
Copyright © 2003 McGraw-Hill Ryerson Limited, Canada2-37
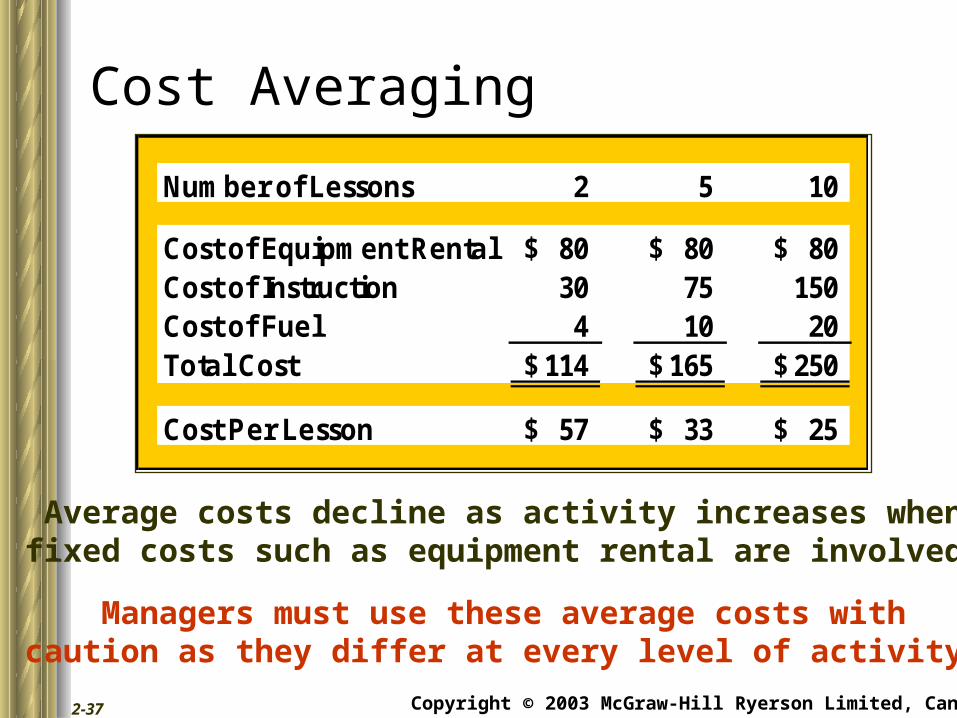
Cost Averaging
Number of Lessons 2 5 10
Cost of Equipment Rental 80$ 80$ 80$ Cost of Instruction 30 75 150 Cost of Fuel 4 10 20 Total Cost 114$ 165$ 250$
Cost Per Lesson 57$ 33$ 25$
Average costs decline as activity increases whenfixed costs such as equipment rental are involved.
Managers must use these average costs withcaution as they differ at every level of activity.
Copyright © 2003 McGraw-Hill Ryerson Limited, Canada2-38
A mixed costhas both fixed and variablecomponents.
Mixed Costs
Consider thefollowing electric utility example.
Copyright © 2003 McGraw-Hill Ryerson Limited, Canada2-39
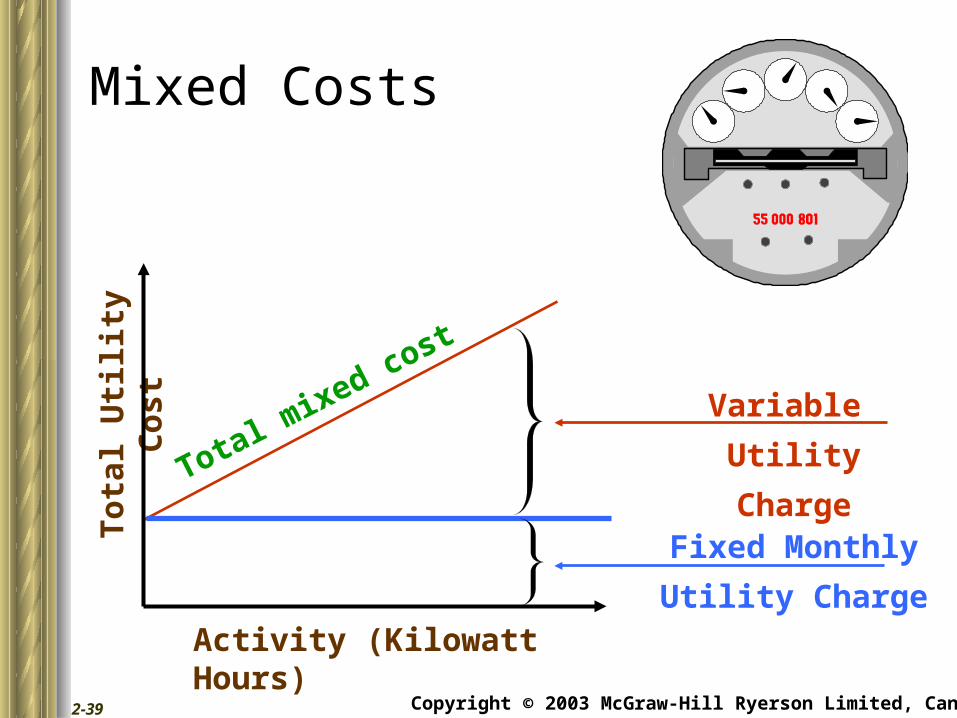
Fixed Monthly
Utility Charge
Variable
Utility Charge
Activity (Kilowatt Hours)
To
tal
Uti
lity
Co
stMixed Costs
Total mixed cost
Copyright © 2003 McGraw-Hill Ryerson Limited, Canada2-40
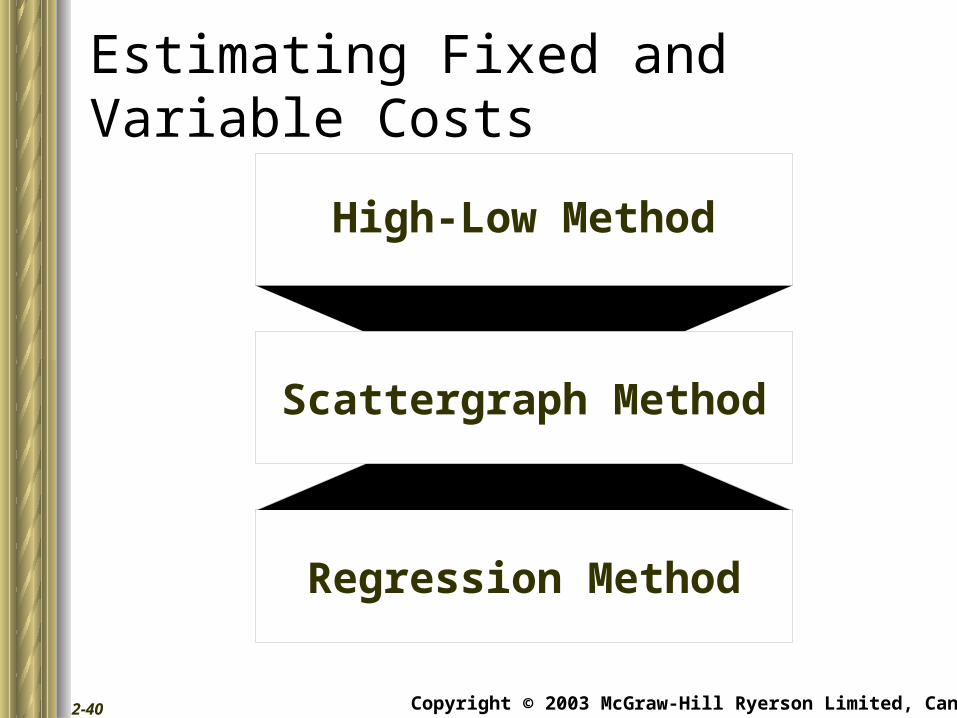
Estimating Fixed and Variable Costs
High-Low Method
Scattergraph Method
Regression Method
Copyright © 2003 McGraw-Hill Ryerson Limited, Canada2-41
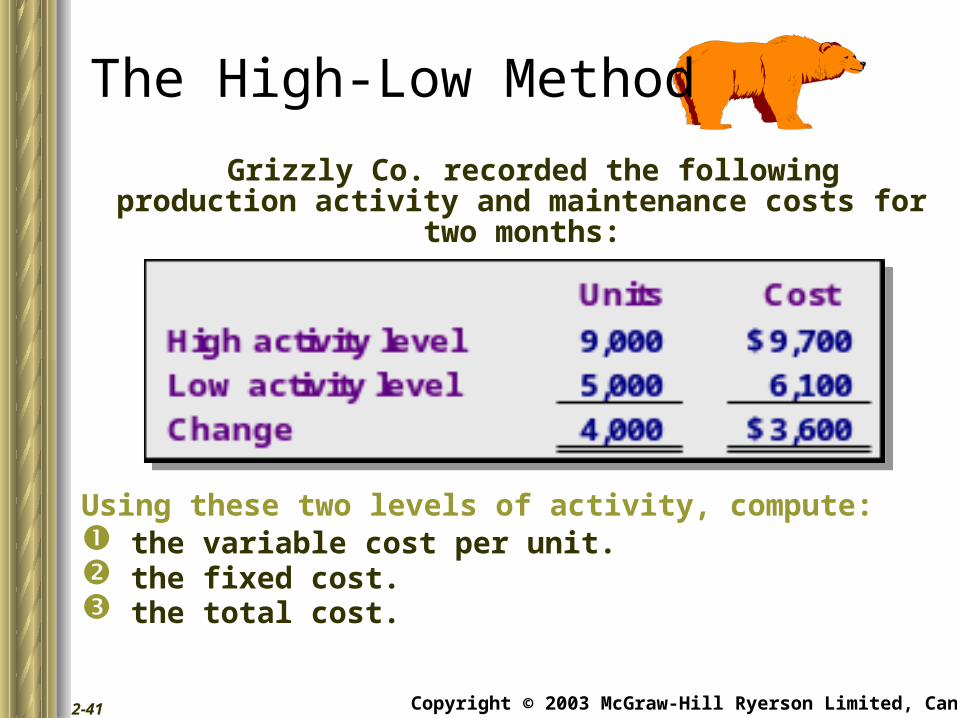
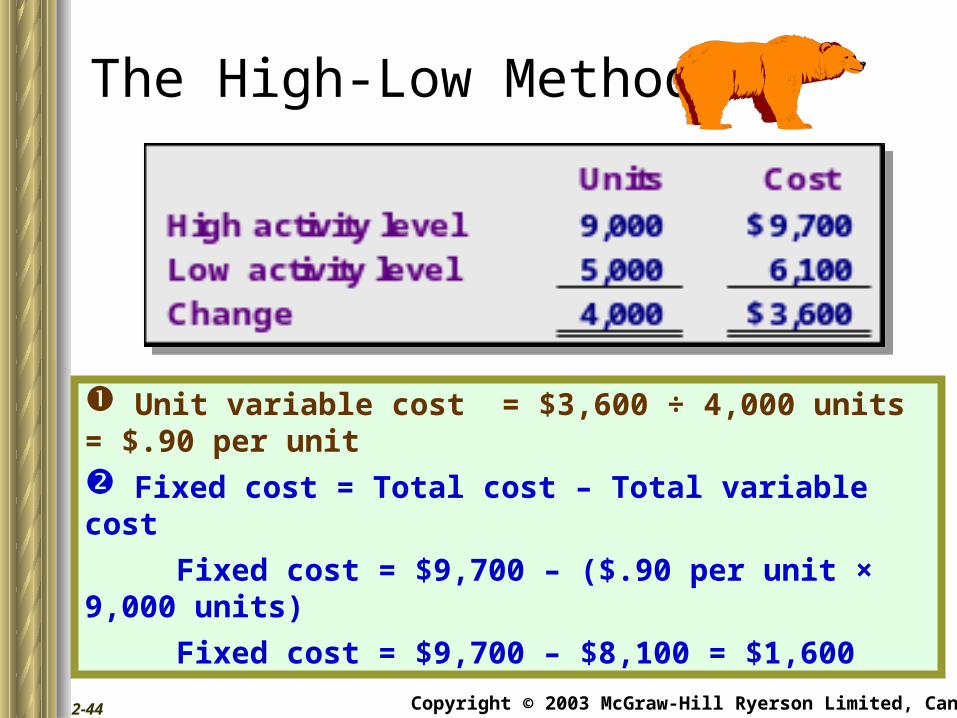
Grizzly Co. recorded the following production activity and maintenance costs for two months:
Using these two levels of activity, compute: the variable cost per unit. the fixed cost. the total cost.
The High-Low Method
Copyright © 2003 McGraw-Hill Ryerson Limited, Canada2-42
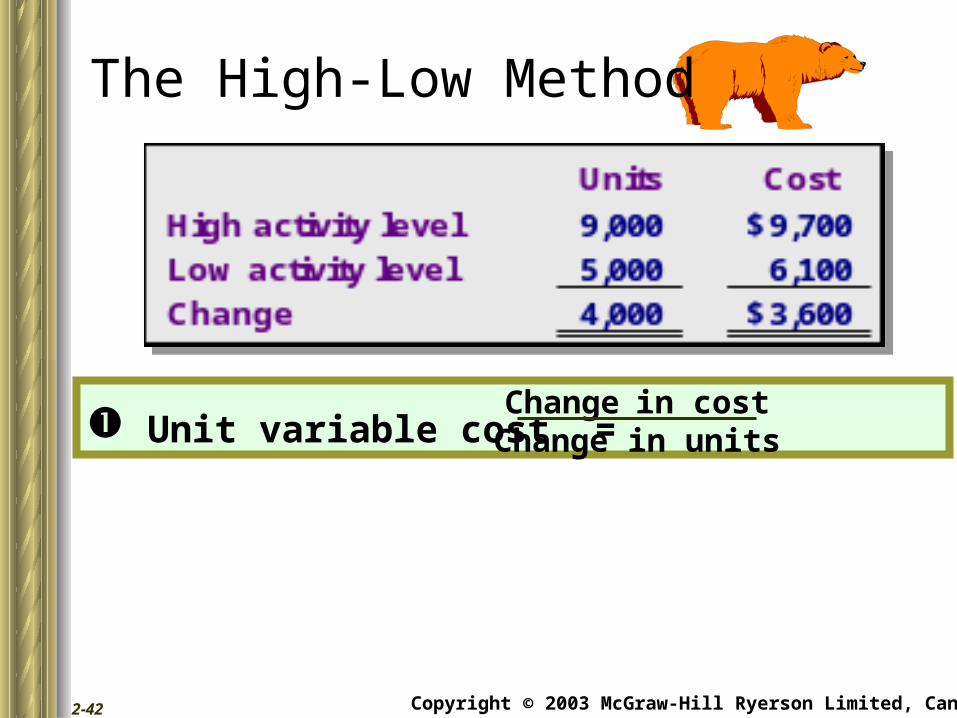
Unit variable cost =Changein costChange in units
The High-Low Method
Copyright © 2003 McGraw-Hill Ryerson Limited, Canada2-43
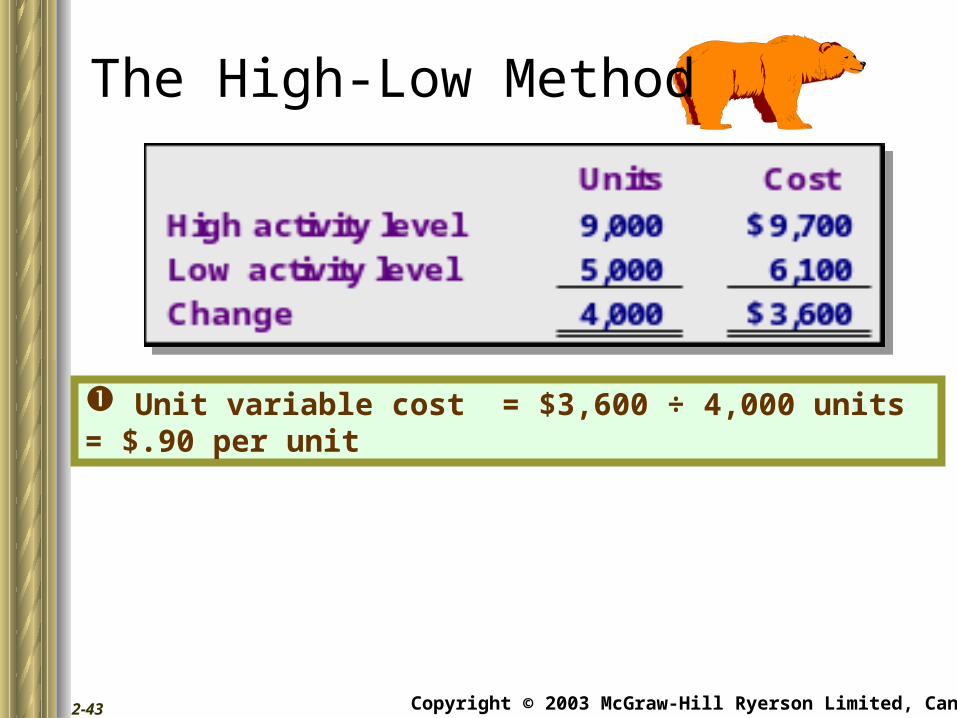
Unit variable cost = $3,600 ÷ 4,000 units = $.90 per unit
The High-Low Method
Copyright © 2003 McGraw-Hill Ryerson Limited, Canada2-44
The High-Low Method
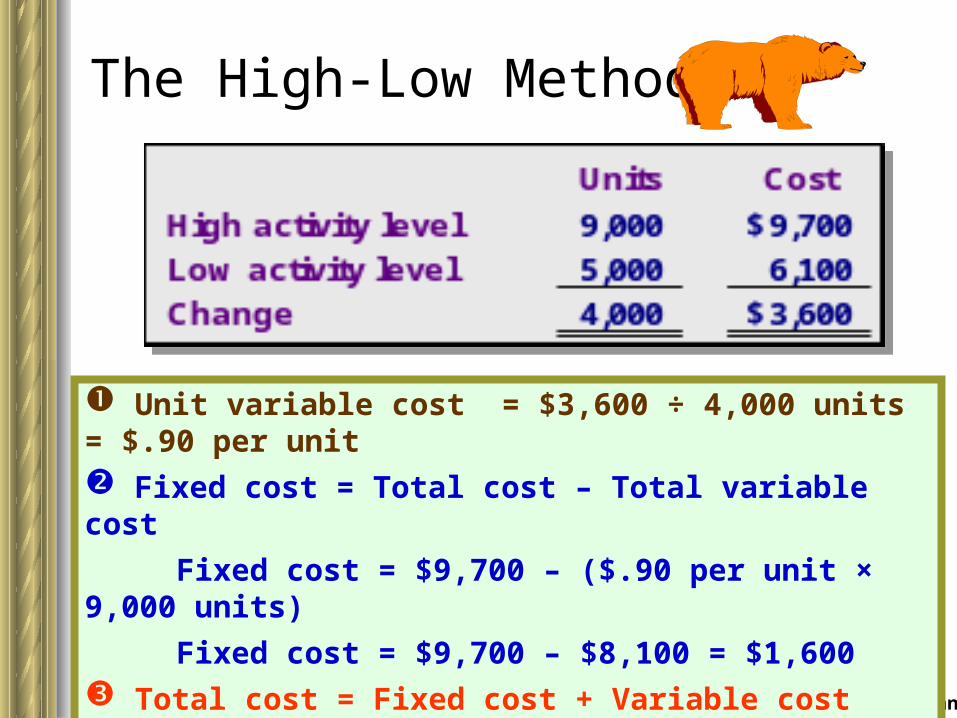
Unit variable cost = $3,600 ÷ 4,000 units = $.90 per unit Fixed cost = Total cost – Total variable cost
Fixed cost = $9,700 – ($.90 per unit × 9,000 units)
Fixed cost = $9,700 – $8,100 = $1,600
Copyright © 2003 McGraw-Hill Ryerson Limited, Canada2-45
Unit variable cost = $3,600 ÷ 4,000 units = $.90 per unit Fixed cost = Total cost – Total variable cost
Fixed cost = $9,700 – ($.90 per unit × 9,000 units)
Fixed cost = $9,700 – $8,100 = $1,600 Total cost = Fixed cost + Variable cost Total cost = $1,600 + $0.90X
The High-Low Method
Copyright © 2003 McGraw-Hill Ryerson Limited, Canada2-46
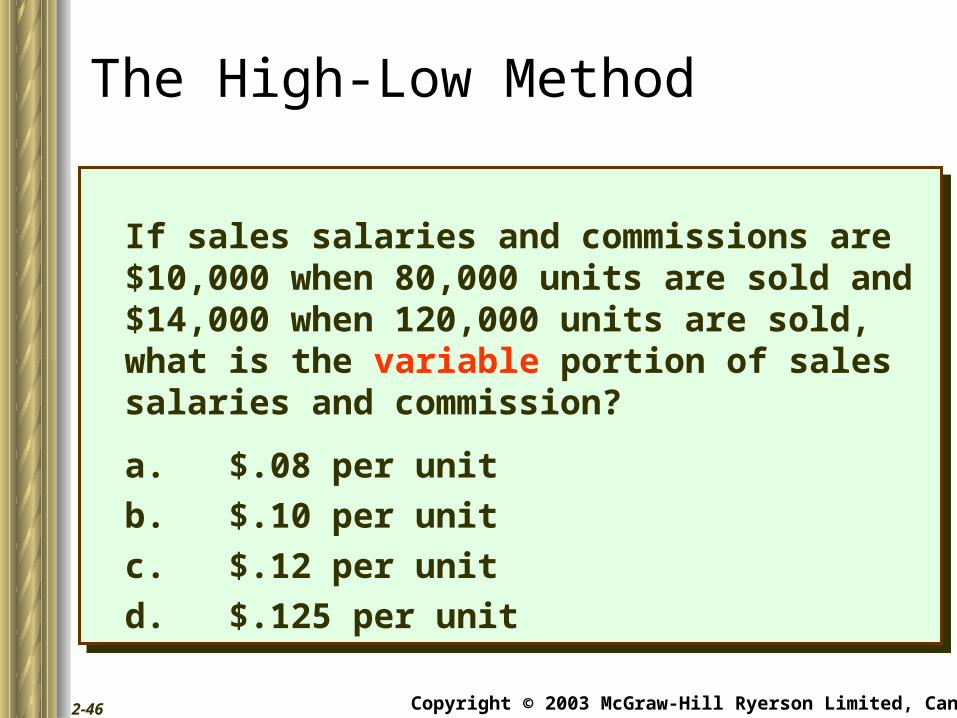
If sales salaries and commissions are $10,000 when 80,000 units are sold and $14,000 when 120,000 units are sold, what is the variable portion of sales salaries and commission?
a. $.08 per unit
b. $.10 per unit
c. $.12 per unit
d. $.125 per unit
If sales salaries and commissions are $10,000 when 80,000 units are sold and $14,000 when 120,000 units are sold, what is the variable portion of sales salaries and commission?
a. $.08 per unit
b. $.10 per unit
c. $.12 per unit
d. $.125 per unit
The High-Low Method
Copyright © 2003 McGraw-Hill Ryerson Limited, Canada2-47
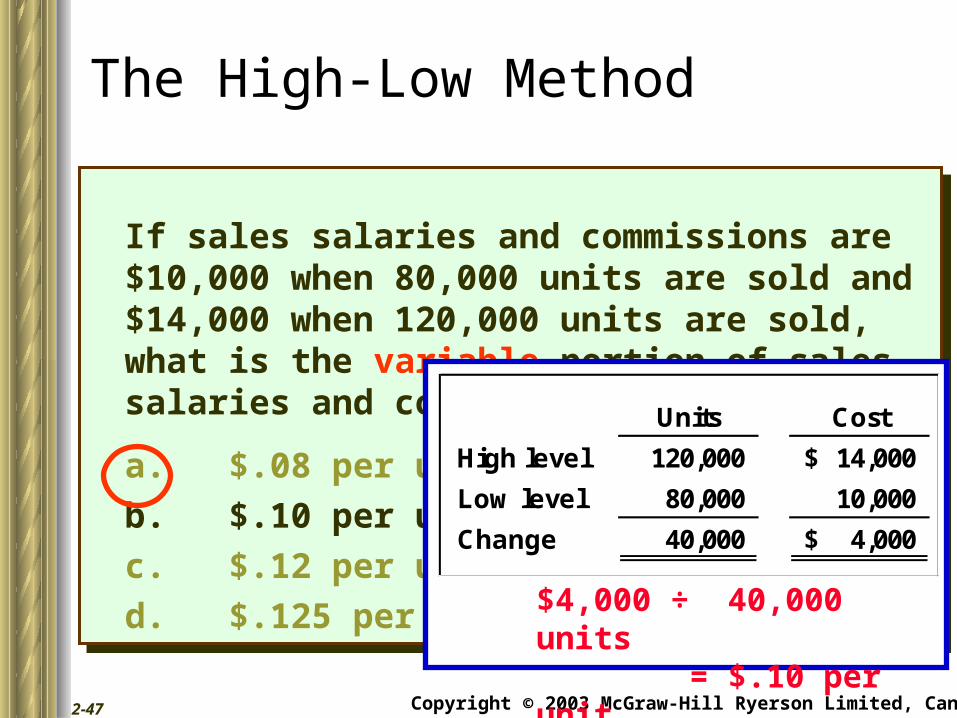
If sales salaries and commissions are $10,000 when 80,000 units are sold and $14,000 when 120,000 units are sold, what is the variable portion of sales salaries and commission?
a. $.08 per unit
b. $.10 per unit
c. $.12 per unit
d. $.125 per unit
If sales salaries and commissions are $10,000 when 80,000 units are sold and $14,000 when 120,000 units are sold, what is the variable portion of sales salaries and commission?
a. $.08 per unit
b. $.10 per unit
c. $.12 per unit
d. $.125 per unit
The High-Low Method
$4,000 ÷ 40,000 units = $.10 per unit
Units Cost
High level 120,000 14,000$
Low level 80,000 10,000
Change 40,000 4,000$
Copyright © 2003 McGraw-Hill Ryerson Limited, Canada2-48
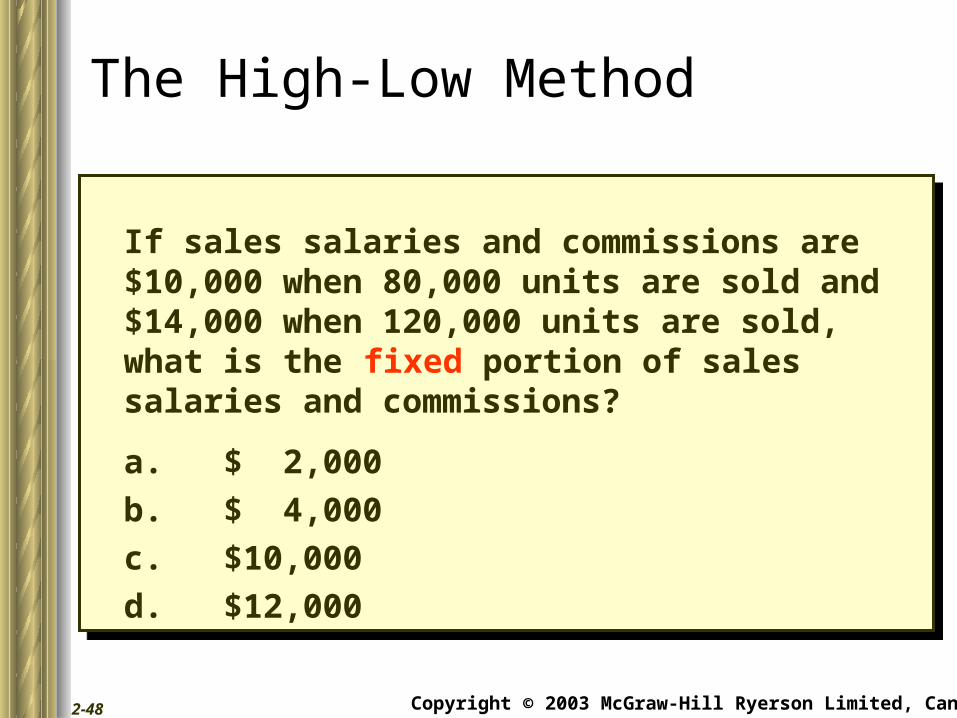
If sales salaries and commissions are $10,000 when 80,000 units are sold and $14,000 when 120,000 units are sold, what is the fixed portion of sales salaries and commissions?
a. $ 2,000
b. $ 4,000
c. $10,000
d. $12,000
If sales salaries and commissions are $10,000 when 80,000 units are sold and $14,000 when 120,000 units are sold, what is the fixed portion of sales salaries and commissions?
a. $ 2,000
b. $ 4,000
c. $10,000
d. $12,000
The High-Low Method
Copyright © 2003 McGraw-Hill Ryerson Limited, Canada2-49
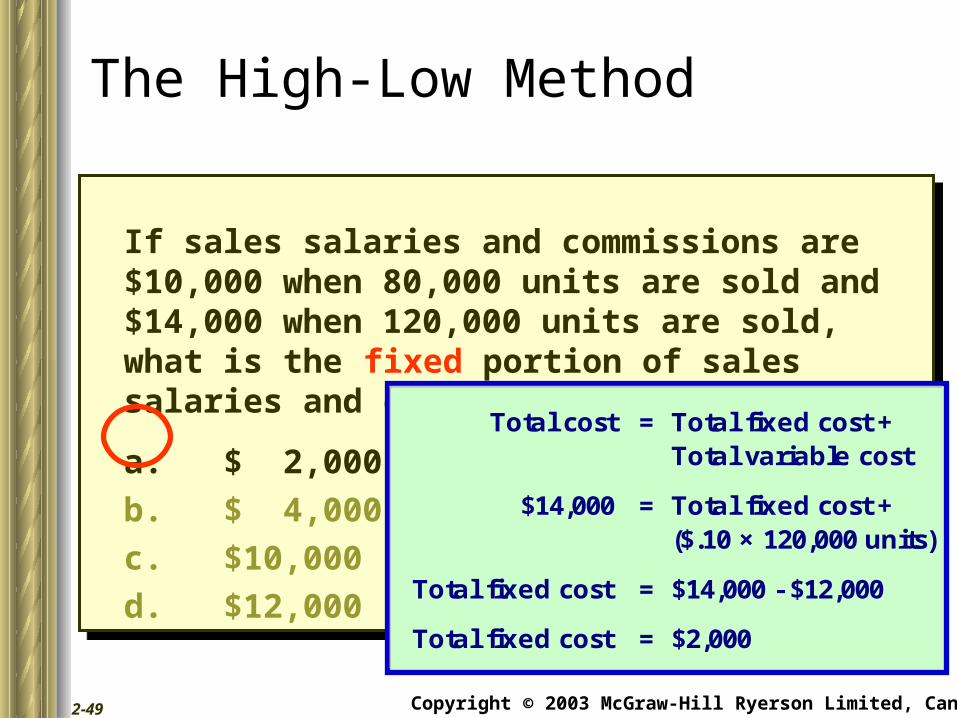
If sales salaries and commissions are $10,000 when 80,000 units are sold and $14,000 when 120,000 units are sold, what is the fixed portion of sales salaries and commissions?
a. $ 2,000
b. $ 4,000
c. $10,000
d. $12,000
If sales salaries and commissions are $10,000 when 80,000 units are sold and $14,000 when 120,000 units are sold, what is the fixed portion of sales salaries and commissions?
a. $ 2,000
b. $ 4,000
c. $10,000
d. $12,000
The High-Low Method
Total cost = Total fixed cost + Total variable cost
$14,000 = Total fixed cost +($.10 × 120,000 units)
Total fixed cost = $14,000 - $12,000
Total fixed cost = $2,000
Copyright © 2003 McGraw-Hill Ryerson Limited, Canada2-50
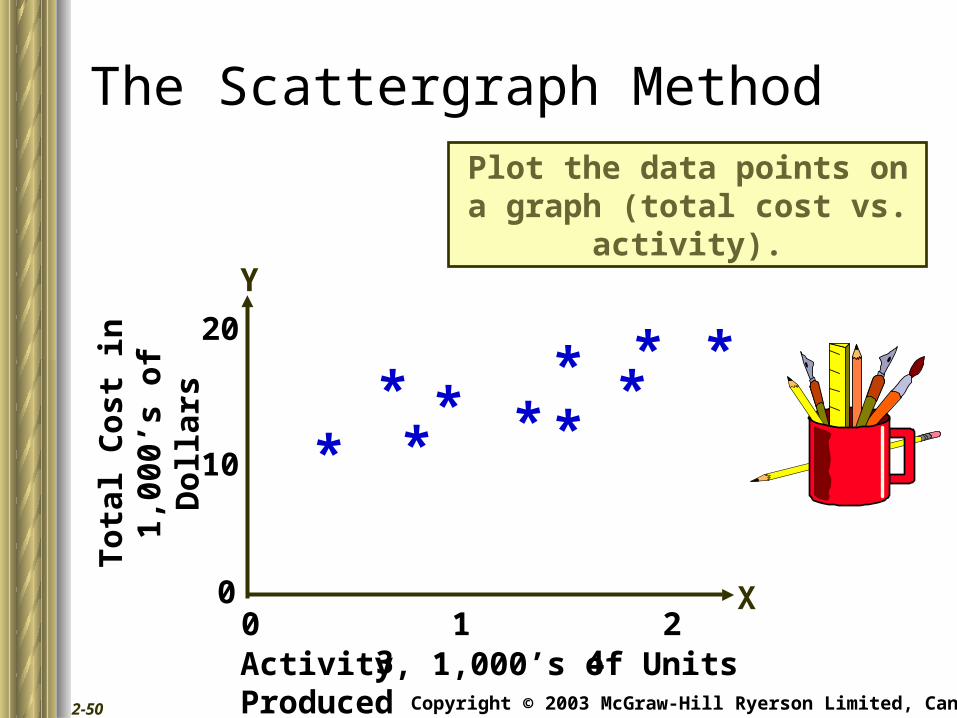
The Scattergraph Method
Plot the data points on a graph (total cost vs. activity).
0 1 2 3 4
*
To
tal
Co
st i
n1,
000’
s o
f D
oll
ars
10
20
0
***
**
**
*
*
Activity, 1,000’s of Units Produced
X
Y

Copyright © 2003 McGraw-Hill Ryerson Limited, Canada2-51
Draw a line through the data points with about anequal numbers of points above and below the line.
0 1 2 3 4
*
To
tal
Co
st i
n1,
000’
s o
f D
oll
ars
10
20
0
***
**
**
*
*
Activity, 1,000’s of Units Produced
X
Y
The Scattergraph Method
Copyright © 2003 McGraw-Hill Ryerson Limited, Canada2-52
0 1 2 3 4
*
To
tal
Co
st i
n1,
000’
s o
f D
oll
ars
10
20
0
***
**
**
*
*
Activity, 1,000’s of Units Produced
X
Y
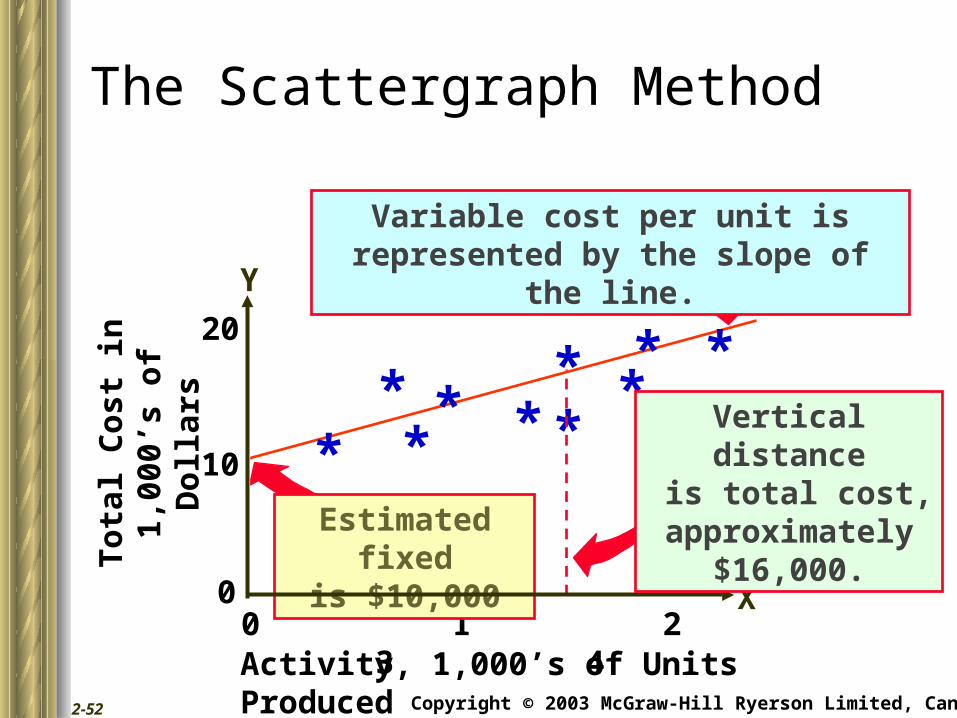
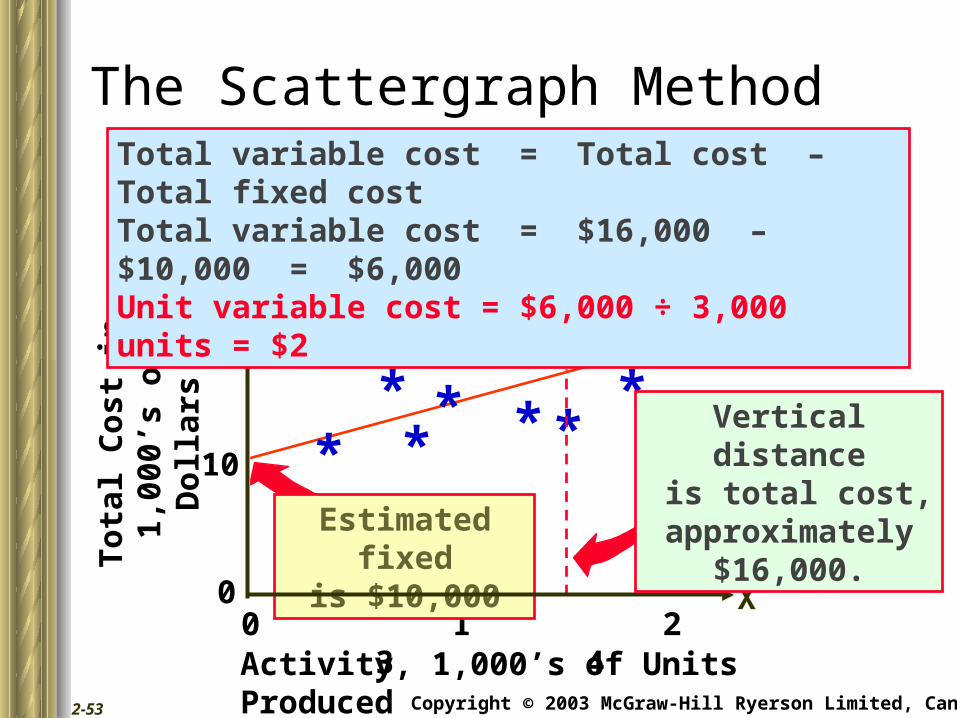
Estimated fixedis $10,000
Vertical distance is total cost,
approximately $16,000.
The Scattergraph Method
Variable cost per unit is represented by the slope of the line.
Copyright © 2003 McGraw-Hill Ryerson Limited, Canada2-53
0 1 2 3 4
*
To
tal
Co
st i
n1,
000’
s o
f D
oll
ars
10
20
0
***
**
**
*
*
Activity, 1,000’s of Units Produced
X
Y
Estimated fixedis $10,000
Vertical distance is total cost,
approximately $16,000.
Total variable cost = Total cost – Total fixed costTotal variable cost = $16,000 – $10,000 = $6,000Unit variable cost = $6,000 ÷ 3,000 units = $2
The Scattergraph Method
Copyright © 2003 McGraw-Hill Ryerson Limited, Canada2-54
Regression Method
Least-squares regression also provides
a statistic, called the adjusted R2, that
is a measure of the goodness of fit of the
regression line to the data points.
Least-squares regression also provides
a statistic, called the adjusted R2, that
is a measure of the goodness of fit of the
regression line to the data points.
I can use spreadsheet software to fit a
regression line throughthe data points.
Copyright © 2003 McGraw-Hill Ryerson Limited, Canada2-55
End of Chapter 2