Embed Size (px)
Citation preview
Cost-Benefit Analysis for PCCD’s Evidence-based Initiatives – Full Report:
Investing in Effective Programs to Improve Lives and Save Tax Payer Dollars
A Report of the Pennsylvania Commission on Crime and Delinquency in collaboration with the Pew-MacArthur Results First Initiative

1 | P a g e
Contents Introduction.................................................................................................................................................................. 6
The Policy Challenge .................................................................................................................................................... 6
Challenge #1: Limited Reach ..................................................................................................................................... 6
Challenge #2: Sustainability Barriers ........................................................................................................................ 6
Challenge #3: Limited Understanding of Economic Benefits of Evidence-Based Approaches for Pennsylvania ..... 7
The Results First Approach .................................................................................................................................. 7
Step One: Establish Pennsylvania-Specific Program Benefits ............................................................................ 7
Step Two: Establish Pennsylvania-Specific Program Costs ................................................................................. 7
Model Results ............................................................................................................................................................... 9
Caveats to the Current Model ..................................................................................................................................... 9
Recommendations Based on Findings ....................................................................................................................... 10
1. Provide Incentives for Increasing the Use of Evidence-based Programs: ...................................................... 10
2. Increase Funding for Scaling Low-Cost Universal EBPs: ................................................................................. 10
3. Increase Duration of Funding for EBP Implementation: ................................................................................. 10
4. Extend Implementation Monitoring and Outcome Evaluation Support Beyond PCCD’s Two-year Grants: .. 11
5. Increase Funding for Researching What Works: ............................................................................................ 11
Appendix A: Program Specific Reports ...................................................................................................................... 12
Explanation of Program Specific Reports ............................................................................................................... 12
Aggression Replacement Training® (ART) ................................................................................................................. 13
Effectiveness Ratings .............................................................................................................................................. 13
Proven Impacts ....................................................................................................................................................... 13
PCCD Grantee Data Summary ................................................................................................................................. 13
Program Reach and Dosage ............................................................................................................................... 13
Model Adherence ............................................................................................................................................... 13
Outcomes Measurement and Program Impacts ............................................................................................... 13
Cost Benefit Analysis For 2017 ............................................................................................................................... 14
Successes ................................................................................................................................................................ 14
Barriers .................................................................................................................................................................... 14
Recommendations .................................................................................................................................................. 14
Big Brothers Big Sisters (BBBS) .................................................................................................................................. 15
Effectiveness Ratings .............................................................................................................................................. 15
Proven Impacts ....................................................................................................................................................... 15
PCCD Grantee Data Summary ................................................................................................................................. 15
Program Reach and Dosage ............................................................................................................................... 15
Model Adherence ............................................................................................................................................... 15
2 | P a g e
Outcomes Measurement and Program Impacts ............................................................................................... 15
Cost Benefit Analysis For 2017 ............................................................................................................................... 16
Successes ................................................................................................................................................................ 16
Barriers .................................................................................................................................................................... 16
Recommendations .................................................................................................................................................. 16
Functional Family Therapy (FFT) ................................................................................................................................ 17
Proven Impacts ....................................................................................................................................................... 17
PCCD Data Summary ............................................................................................................................................... 17
Program Reach and Dosage ............................................................................................................................... 17
Model Adherence ............................................................................................................................................... 17
Outcomes Measurement and Program Impacts ............................................................................................... 17
Successes ................................................................................................................................................................ 18
Barriers .................................................................................................................................................................... 18
Recommendations .................................................................................................................................................. 18
Incredible Years Basic Parent Program (IYS® Basic) .................................................................................................. 19
Effectiveness Ratings .............................................................................................................................................. 19
Proven Impacts ....................................................................................................................................................... 19
PCCD Grantee Data Summary ................................................................................................................................. 19
Program Reach and Dosage ............................................................................................................................... 19
Model Adherence ............................................................................................................................................... 19
Outcomes Measurement and Program Impacts ............................................................................................... 19
Cost Benefit Analysis For 2017 ............................................................................................................................... 20
Successes ................................................................................................................................................................ 20
Barriers .................................................................................................................................................................... 20
Recommendations .................................................................................................................................................. 20
LifeSkills Training (LST®) ............................................................................................................................................. 21
Effectiveness Ratings .............................................................................................................................................. 21
Proven Impacts ....................................................................................................................................................... 21
PCCD Grantee Data Summary ................................................................................................................................. 21
Program Reach and Dosage ............................................................................................................................... 21
Model Adherence ............................................................................................................................................... 21
Outcomes Measurement and Program Impacts ............................................................................................... 21
Cost Benefit Analysis For 2017 ............................................................................................................................... 22
Successes ................................................................................................................................................................ 22
Barriers .................................................................................................................................................................... 22
Recommendations .................................................................................................................................................. 22
3 | P a g e
Multisystemic Therapy (MST) .................................................................................................................................... 23
Effectiveness Ratings .............................................................................................................................................. 23
Proven Impacts ....................................................................................................................................................... 23
PCCD Grantee Data Summary ................................................................................................................................. 23
Program Reach and Dosage ............................................................................................................................... 23
Model Adherence ............................................................................................................................................... 23
Outcomes Measurement and Program Impacts ............................................................................................... 24
Cost Benefit Analysis For 2017 ............................................................................................................................... 24
Successes ................................................................................................................................................................ 24
Barriers .................................................................................................................................................................... 24
Recommendations .................................................................................................................................................. 24
Positive Action® (PA) .................................................................................................................................................. 25
Effectiveness Ratings .............................................................................................................................................. 25
Proven Impacts ....................................................................................................................................................... 25
PCCD Grantee Data Summary ................................................................................................................................. 25
Program Reach and Dosage ............................................................................................................................... 25
Model Adherence ............................................................................................................................................... 25
Outcomes Measurement and Program Impacts ............................................................................................... 25
Cost Benefit Analysis For 2017 ............................................................................................................................... 26
Successes ................................................................................................................................................................ 26
Barriers .................................................................................................................................................................... 26
Recommendations .................................................................................................................................................. 26
Positive Parenting Program (Triple P®) ..................................................................................................................... 27
Effectiveness Ratings .............................................................................................................................................. 27
Proven Impacts ....................................................................................................................................................... 27
PCCD Grantee Data Summary ................................................................................................................................. 27
Program Reach and Dosage ............................................................................................................................... 27
Model Adherence ............................................................................................................................................... 27
Outcomes Measurement and Program Impacts ............................................................................................... 27
Cost Benefit Analysis For 2017 ............................................................................................................................... 28
Successes ................................................................................................................................................................ 28
Barriers .................................................................................................................................................................... 28
Recommendations .................................................................................................................................................. 28
Project Towards No Drug Abuse (TND®) ................................................................................................................... 29
Effectiveness Ratings .............................................................................................................................................. 29
Proven Impacts ....................................................................................................................................................... 29

4 | P a g e
PCCD Grantee Data Summary ................................................................................................................................. 29
Program Reach and Dosage ............................................................................................................................... 29
Model Adherence ............................................................................................................................................... 29
Outcomes Measurement and Program Impacts ............................................................................................... 29
Cost Benefit Analysis For 2017 ............................................................................................................................... 30
Successes ................................................................................................................................................................ 30
Barriers .................................................................................................................................................................... 30
Recommendations .................................................................................................................................................. 30
Promoting Alternative THinking Strategies (PATHS®) .............................................................................................. 31
Effectiveness Ratings .............................................................................................................................................. 31
Proven Impacts ....................................................................................................................................................... 31
PCCD Grantee Data Summary ................................................................................................................................. 31
Program Reach and Dosage ............................................................................................................................... 31
Model Adherence ............................................................................................................................................... 31
Outcomes Measurement and Program Impacts ............................................................................................... 31
Cost Benefit Analysis For 2017 ............................................................................................................................... 32
Successes ................................................................................................................................................................ 32
Barriers .................................................................................................................................................................... 32
Recommendations .................................................................................................................................................. 32
Strengthening Families Program 10-14 (SFP 10-14) .................................................................................................. 33
Effectiveness Ratings .............................................................................................................................................. 33
Proven Impacts ....................................................................................................................................................... 33
PCCD Grantee Data Summary ................................................................................................................................. 33
Program Reach and Dosage ............................................................................................................................... 33
Model Adherence ............................................................................................................................................... 33
Outcomes Measurement and Program Impacts ............................................................................................... 33
Cost Benefit Analysis For 2017 ............................................................................................................................... 34
Successes ................................................................................................................................................................ 34
Barriers .................................................................................................................................................................... 34
Recommendations .................................................................................................................................................. 34
Trauma-Focused Cognitive-Behavioral Therapy (TF-CBT) ........................................................................................ 35
Effectiveness Ratings .............................................................................................................................................. 35
Proven Impacts ....................................................................................................................................................... 35
PCCD Grantee Data Summary ................................................................................................................................. 35
Program Reach and Dosage ............................................................................................................................... 35
Model Adherence ............................................................................................................................................... 35

5 | P a g e
Outcomes Measurement and Program Impacts ............................................................................................... 35
Cost Benefit Analysis For 2017 ............................................................................................................................... 36
Successes ................................................................................................................................................................ 36
Barriers .................................................................................................................................................................... 36
Recommendations .................................................................................................................................................. 36
Acknowledgements .................................................................................................................................................... 37

6 | P a g e
Cost-Benefit Analysis for PCCD’s Evidence-based Initiatives – Full Report: Investing in Effective Programs to Improve Lives and Save Tax Payer Dollars
A Report of the Pennsylvania Commission on Crime and Delinquency in collaboration with the Pew-MacArthur Results First Initiative
Introduction Pennsylvania policymakers have been utilizing cost-benefit and return on investment (ROI) information to inform decision-making for over twenty years (Jones, et al, 2008). Through the leadership of the Pennsylvania Commission on Crime and Delinquency (PCCD), in partnership with Penn State’s Edna Bennett Pierce Prevention Research Center (PRC), our Commonwealth has led the field in investing in evidence-based prevention and intervention programming to reduce the flow of youth entering the Juvenile Justice System and to enhance the well-being of youth, families, and communities. In partnership with the Pew-MacArthur Results First Initiative, PCCD and PRC have endeavored to build a Pennsylvania specific cost-benefit model utilizing Pennsylvania service costs, and Pennsylvania crime and recidivism data. This report summarizes these efforts to date and identifies strengths and limitations of the Pennsylvania data. The report also includes recommendations for policymakers, researchers, and program providers to maximize the impact and return on investment for specific evidence-based programs (EBPs) and increase evidence-based decision making throughout the state.
The Policy Challenge Policy makers and providers can collectively improve the well-being of Pennsylvania’s families and reduce costs to tax payers related to treating problems like violence, depression, school failure, delinquency, teen pregnancy, and substance misuse, if we invest in prevention and intervention programs that are evidence-based – programs demonstrated to work through rigorous evaluation. Pennsylvania has, in fact, led the nation in investing in evidence-based programming and implementation support via a 10-year partnership between PCCD and the PRC, called The Evidence-based Prevention and Intervention Support Center (EPISCenter) Project. The EPISCenter provides implementation support for evidence-based programs to achieve the following goals: broad scale dissemination; high quality implementation; valid impact assessment; and long-term sustainability. It accomplishes this work utilizing five cores of support: learning communities; general capacity building resources and trainings; standardized data collection, evaluation tools, and processes for specific EBPs; sustainability knowledge base; and building in-state infrastructures (TOTs, etc.) for specific evidence-based programs. Despite the success of these efforts, there are still challenges related to both our major goals of improving lives, and potentially saving taxpayer dollars:
Challenge #1: Limited Reach Despite Pennsylvania’s impressive investment in and support for a menu of evidence-based prevention practices (see Table 1), currently EPISCenter-supported programs impact less than 1% of the state’s 4.7 million households each year.
Challenge #2: Sustainability Barriers Most funding for evidence-based prevention is short-term. PCCD grants are designed to be seed funding and are typically awarded for a two-year period. After this, grantees need to obtain other funding to sustain their prevention initiatives. For many communities, this is a significant challenge that may result in poor sustainability of evidence-based practices.

7 | P a g e
Challenge #3: Limited Understanding of Economic Benefits of Evidence-Based Approaches for Pennsylvania Effective prevention saves money in the long run. Since 2004, the Washington State Institute for Public Policy (WSIPP) has been developing and refining a sophisticated econometric model that demonstrates the costs and benefits of investments in public programs. The model relies on the best available research on program effectiveness to predict the outcomes of a program. The model produces projections for benefits that would accrue to program participants, nonparticipants, and taxpayers, based on Washington’s specific cost and population data. These are combined to produce a total bottom line benefit. The model then calculates the cost of producing these outcomes and the return on investment that can be expected.
In 2008, an initial cost-benefit analysis of PCCD’s evidence-based programs was conducted using WSIPP’s model analysis. Since then, PCCD, in consultation with the PRC, has continually worked to improve cost-savings estimates. One drawback is that past estimates have relied on the Washington state systems costs, and national estimates of program costs, rather than using Pennsylvania-based costs.
Therefore, the goal of this project was to build a Pennsylvania-specific Return on Investment (ROI) Model to help policy makers, and providers better understand the economic costs and benefits of evidence-based prevention programs supported by PCCD. PCCD partnered with Results First to take WSIPP’s approach and customize it for Pennsylvania, using state specific cost and population data.
The Results First Approach The Pew-MacArthur Results First Initiative, a project of The Pew Charitable Trusts and the John D. and Catherine T. MacArthur Foundation, works with states and localities to develop the tools needed to identify and fund effective programs that yield higher returns on investment or at least pay for themselves. Using innovative and customizable methods, Results First partners learn to:
• Create an inventory of currently funded programs. • Review which programs work. • Conduct benefit-cost analysis to compare programs’ likely return on investment. • Use evidence to inform spending and policy decisions.
PCCD’s collaboration with Results First, is focused solely on developing Pennsylvania-specific return on investment estimates for a select subset of programs that have long been identified as effective, evidence-based programs – with the intent of estimating the monetized value of such interventions. Step One: Establish Pennsylvania-Specific Program Benefits A variety of Pennsylvania specific data was used to estimate the benefits to taxpayers and to individuals who experience increased wages, improved health, and less utilization of costly services as a result of evidence-based programming funded by PCCD. The model incorporated data from both the juvenile and adult justice systems, and the Pennsylvania Department of Education to calculate a variety of benefits for each analyzed program, based on the research conducted that shows specific outcomes from that program (i.e., lower recidivism rates, higher rates of high school graduation, reduced substance abuse, etc.). The theory behind this approach is that participating in a prevention program will result in a reduction in youth who would have incurred costs to the justice and human services systems, an increase in youth graduating high school and earning higher wages, and a reduction in health costs associated with substance abuse or mental illness. Cost savings can also be seen in the reduction of harm to crime victims. Step Two: Establish Pennsylvania-Specific Program Costs The EPISCenter utilized fiscal records and the quality of implementation data reported by grantees to calculate a cost per person for each of the evidence-based programs listed in Table 1.
8 | P a g e
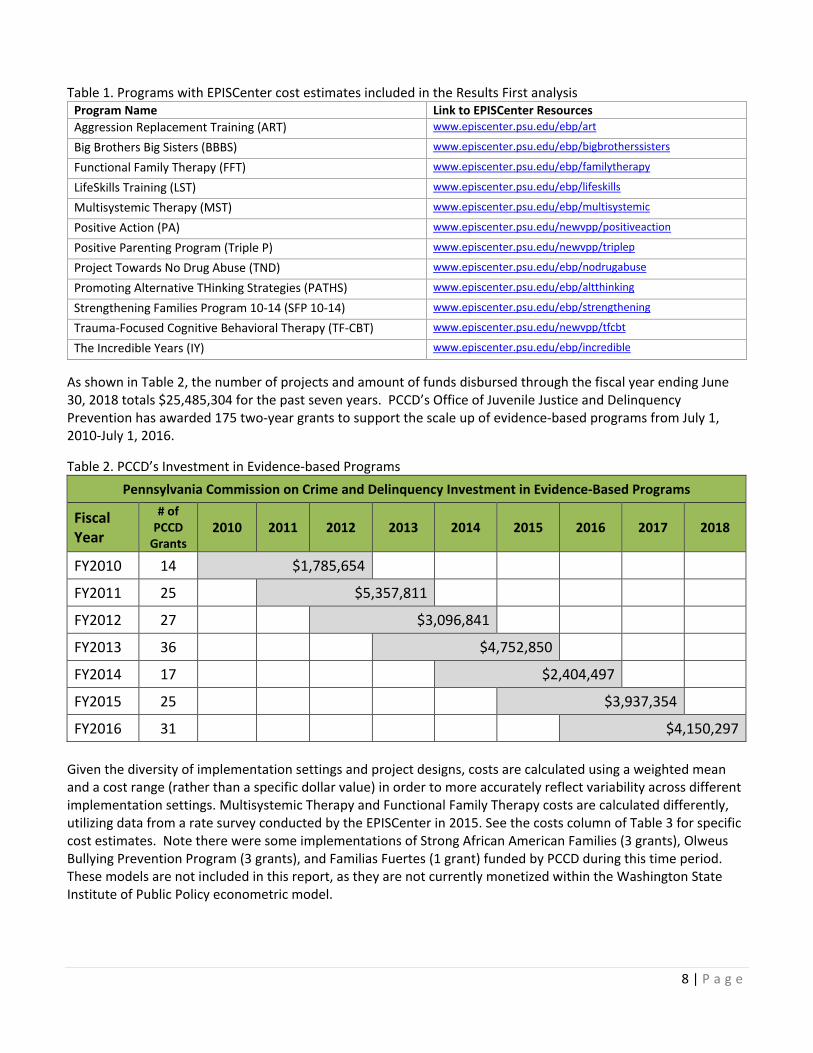
Table 1. Programs with EPISCenter cost estimates included in the Results First analysis Program Name Link to EPISCenter Resources Aggression Replacement Training (ART) www.episcenter.psu.edu/ebp/art
Big Brothers Big Sisters (BBBS) www.episcenter.psu.edu/ebp/bigbrotherssisters
Functional Family Therapy (FFT) www.episcenter.psu.edu/ebp/familytherapy
LifeSkills Training (LST) www.episcenter.psu.edu/ebp/lifeskills
Multisystemic Therapy (MST) www.episcenter.psu.edu/ebp/multisystemic
Positive Action (PA) www.episcenter.psu.edu/newvpp/positiveaction
Positive Parenting Program (Triple P) www.episcenter.psu.edu/newvpp/triplep
Project Towards No Drug Abuse (TND) www.episcenter.psu.edu/ebp/nodrugabuse
Promoting Alternative THinking Strategies (PATHS) www.episcenter.psu.edu/ebp/altthinking
Strengthening Families Program 10-14 (SFP 10-14) www.episcenter.psu.edu/ebp/strengthening
Trauma-Focused Cognitive Behavioral Therapy (TF-CBT) www.episcenter.psu.edu/newvpp/tfcbt
The Incredible Years (IY) www.episcenter.psu.edu/ebp/incredible
As shown in Table 2, the number of projects and amount of funds disbursed through the fiscal year ending June 30, 2018 totals $25,485,304 for the past seven years. PCCD’s Office of Juvenile Justice and Delinquency Prevention has awarded 175 two-year grants to support the scale up of evidence-based programs from July 1, 2010-July 1, 2016.
Table 2. PCCD’s Investment in Evidence-based Programs Pennsylvania Commission on Crime and Delinquency Investment in Evidence-Based Programs
Fiscal Year
# of PCCD
Grants 2010 2011 2012 2013 2014 2015 2016 2017 2018
FY2010 14 $1,785,654
FY2011 25 $5,357,811
FY2012 27 $3,096,841
FY2013 36 $4,752,850
FY2014 17 $2,404,497
FY2015 25 $3,937,354
FY2016 31 $4,150,297 Given the diversity of implementation settings and project designs, costs are calculated using a weighted mean and a cost range (rather than a specific dollar value) in order to more accurately reflect variability across different implementation settings. Multisystemic Therapy and Functional Family Therapy costs are calculated differently, utilizing data from a rate survey conducted by the EPISCenter in 2015. See the costs column of Table 3 for specific cost estimates. Note there were some implementations of Strong African American Families (3 grants), Olweus Bullying Prevention Program (3 grants), and Familias Fuertes (1 grant) funded by PCCD during this time period. These models are not included in this report, as they are not currently monetized within the Washington State Institute of Public Policy econometric model.

9 | P a g e
Model Results The table below shows the program-specific benefits, costs and total net benefit for all programs included in the Pennsylvania Results First Cost-Benefit model. The model shows a positive return on investment for the majority of programs included.
• Benefits refers to the avoided costs to tax payers, higher wages to participants, and benefits to others as a result of improved outcomes as monetized in the Pennsylvania Results First Model.
• Costs reflect the average cost per participant for PCCD funded projects. • Costs Confidence Interval (+/-) shows the range of costs across diverse regions and implementation
settings. • Benefit/Cost Ratio includes a low, mid, and high estimate of expected return on investment for every
dollar invested in each program. o Numbers higher than $1 indicate a positive return on investment. o Numbers lower than $1 indicate that the benefits do not exceed the costs of the program. o Numbers in parenthesis indicate zero economic benefits and the presence of additional economic
costs beyond what it costs to implement the program
Table 3. Pennsylvania Cost-Benefit Analysis COSTS CI
(+/-) Benefit/Cost Ratio
PROGRAM NAME BENEFITS COSTS LOW MID HIGH Aggression Replacement Training (ART) $2,214 $905 $602 $1.47 $2.45 $7.31 Big Brothers Big Sisters (BBBS) ($169) $1,603 $504 ($0.08) ($0.11) ($0.15) Functional Family Therapy (FFT) $11,015 $3,918 * $2.20 $2.81 $3.98 LifeSkills Training (LST) $1,489 $131 $60 $7.80 $11.37 $20.97 Multisystemic Therapy (MST) $5,632 $8,683 * $0.52 $0.65 $0.89 Positive Action (PA) $13,727 $63 ** $66.64 $217.89 $334.80 Positive Parenting Program (Triple P) $1,072 $1,376 $388 $0.61 $0.78 $1.09 Project Towards No Drug Abuse (TND) $303 $117 $47 $1.85 $2.59 $4.33 Promoting Alternative THinking Strategies (PATHS) $7,711 $215 $54 $28.67 $35.87 $47.89 Strengthening Families Program 10-14 (SFP 10-14) $5,056 $1,754 $287 $2.48 $2.88 $3.45 Trauma-Focused Cognitive Behavioral Therapy (TF-CBT) $19,300 $1,666 $580 $8.59 $11.58 $17.77 The Incredible Years (IY) $2,612 $2,104 $658 $0.95 $1.24 $1.81 * Based on survey completed by MST and FFT providers. ** Based on 2 grants, MID is weighted average, LOW and HIGH are actual costs per service. CI = Confidence Interval.
ROI data like that shown above is only one way to understand the value of evidence-based programs. This report includes additional information on each program’s proven outcomes, reach, impact in Pennsylvania, and a comparison between Pennsylvania cost-benefit results and those obtained by the Washington State Institute for Public Policy analysis, at the end of this document in Appendix A.
Caveats to the Current Model When reviewing the findings in this report it is important to keep in mind some caveats to the current model estimation.

10 | P a g e
1. The ROI calculations for Aggression Replacement Training, Functional Family Therapy and Multisystemic Therapy all rely on Pennsylvania specific recidivism rates. Due to data constraints the Pennsylvania model only contains five years’ worth of recidivism data compared to 15 years for WSIPP. This means the benefits for these programs are lower than they otherwise would be if recidivism data were available for additional years.
2. The results of the other nine programs run through Pennsylvania’s benefit-cost model will be more similar to WSIPP’s results. However, there are still some important differences.
a. All programs contain Pennsylvania specific cost estimates. b. All benefits include wage adjustments to reflect state differences in average wages. c. WSIPP includes the dead-weight cost of taxation in their calculations and the Pennsylvania model
did not include this adjustment.
It is important to remember that many programs have additional value, beyond what can be shown through return on investment analysis. Notably, many outcomes that these programs are proven to produce are not currently monetized in the Results First model. When implemented with a high level of quality, the programs discussed in this report have been shown to promote healthy youth development and prevent risky behaviors. These additional benefits, along with the high return on investment, make them a strong investment for the Commonwealth.
Recommendations Based on Findings The following recommendations are broadly focused and geared towards state policy makers such as legislators, the Governor’s office, and key system directors. They may also be relevant for federal policy makers including congressional representatives and federal agencies that provide funding and set policy for human services. Program specific recommendations for providers, program developers, and policy makers can be found in Appendix A of this report.
1. Provide Incentives for Increasing the Use of Evidence-based Programs: Human service providers,
schools, and policy makers are under pressure to meet the needs of youth and families in an atmosphere of constrained budgets and complex needs. In order to make space for replacing less effective approaches with evidence-based programs significant financial and policy incentives need to be in place, and policies that create barriers must be changed or eliminated. Appendix A of this report provides more specific recommendations for each evidence-based program in the report.
2. Increase Funding for Scaling Low-Cost Universal EBPs: Many counties are forced to focus needs-based budget funds on the most at-risk populations, thus foregoing low-cost, universal interventions that reach a broad segment of the population. Within the Results First Analysis, programs with a low cost per participant tend to be those that have a universal focus. By adding funding for universal prevention, particularly the lower cost programs shown in the PA Results First model, we can reduce the flow of youth and families into more costly services.
3. Increase Duration of Funding for EBP Implementation: In order to reduce average cost per participant and thus increase return on investment, implementing organizations should be funded for a longer period. This would increase their capacity to serve more youth and families and to sustain services beyond grant funding, thereby decreasing the cost per participant and increasing the net benefit to the state.

11 | P a g e
4. Extend Implementation Monitoring and Outcome Evaluation Support Beyond PCCD’s Two-year Grants: Current cost estimates are based on data collected during a two-year initial grant period for PCCD funded projects supported by the EPISCenter. If the state were able to extend these implementation support services beyond PCCD’s seed grant initiative it would be possible to demonstrate an ongoing return on investment for other state initiatives, with the added benefit of helping to sustain quality over time.
5. Increase Funding for Researching What Works: In order to conduct sound cost-benefit estimates it is essential to have current research demonstrating the effects of the program(s) being analyzed and understand the economic benefits of those effects. Many of the programs on the current menu would benefit from additional research in order to explore long-term impact on a wider variety of outcomes, and to explore how those outcomes create economic benefits for communities. In addition, many of the widely implemented programs that have little to no evidence-base and would benefit from evaluation so that they can be included in these types of analysis.

12 | P a g e
Appendix A: Program Specific Reports
Explanation of Program Specific Reports Each of the programs featured in this report has a unique history in the state of Pennsylvania. Each one has a community of providers who have invested time and energy to deliver the model effectively to youth and families. These provider communities, with the support of program developers and policy makers, are continuously working to overcome barriers, improve quality, and expand their reach. This Appendix explains each program in more depth, including the benefits of each program beyond the Results First Cost-Benefit Analysis and specific recommendations for improving cost effectiveness.
Each program break down includes: 1. Program Description: includes information on target population, implementation setting, and key focus
area. 2. Effectiveness Ratings: List of effectiveness ratings for each program from a variety of clearinghouses,
including Results First Color Coding: o Green = Highest level of evidence of effectiveness o Yellow= Promising level of evidence
3. Proven Impacts: o A list of the key outcomes shown in the research base for the model.
4. PCCD Data summary: summarizes data collected and reported by PCCD with support from the EPISCenter: o Program Reach and Dosage o Model Adherence/Fidelity o Outcomes/Impact
5. Cost Benefit Analysis for 2017 (most recent fiscal year) o PA Cost
PA Cost information generally includes an average with a confidence interval below, indicated by the +/- $xx See main report for an explanation of this methodology.
For certain programs a confidence interval is not available, in which case we provide a range.
Positive Action only had two implementations. FFT and MST evidence-based intervention model costs were determined via a provider
rate survey conducted by the EPISCenter in 2015. o WSIPP Benefit (Feb. 2019) o 2017 Savings Estimate using WSIPP Benefit minus PA Cost times 2017 number served o Results First PA Model Benefit o 2017 Savings Estimate using Results First PA Model Benefit minus PA Cost times 2017 number
served o Important Note: parentheses indicate a negative number.
6. Successes: A brief note of the successes shown in the data, or insights from the technical assistance experiences of EPISCenter Implementation Specialists.
7. Barriers: A brief note of any problems shown in the data, or insights from the technical assistance experiences of EPISCenter Implementation Specialists.
8. Specific recommendations for action geared towards three key audiences: o Developer - Generally refers to program developers and other research experts in the model. o Provider - Targets organizations and individuals who implement programs. o Policy - Can be geared towards county, state, or federal level policy makers or any combination of
the three.

13 | P a g e
Aggression Replacement Training® (ART) Aggression Replacement Training® is a cognitive behavioral intervention to help youth improve social skill competence, moral reasoning, better manage anger, and reduce aggressive behavior. The program targets chronically aggressive children and adolescents ages 12-17 in both residential treatment and community-based settings. The 30 ART lessons are delivered to groups of at-risk youth by a trained facilitator over a period of 10-15 weeks. PCCD has awarded 21 grants to support ART programs in the past six years.
Effectiveness Ratings 1. Promising, The California Evidence-Based Clearinghouse for Child Welfare 2. Effective, Crime Solutions
Proven Impacts • Reduced Recidivism: Youth in the program were less likely to commit another felony offense.1 • Reduced Problem Behavior: Parents and teachers reported significant reductions in problem behavior for
youth in the program.2 • Improved Social Skills: Parents and teachers reported significant improvements in social skills for youth
who participated in the program.2 PCCD Grantee Data Summary EPISCenter standardized measures have been in place for ART since 2012, data below reflects fiscal years from 2012 through 2017.
Program Reach and Dosage • 21 PCCD funded implementations served 1684 youth during fiscal years 2012 through 2017. • The average number of youth served per implementation was 88. • 58% of youth who participated completed the program (defined as receiving 28 of 30 lessons)
Model Adherence • Model adherence is determined by third
party observations of program facilitation, using an observation checklist from the developer. Meets minimum is defined by scoring 80% or higher of total points possible for the observation.
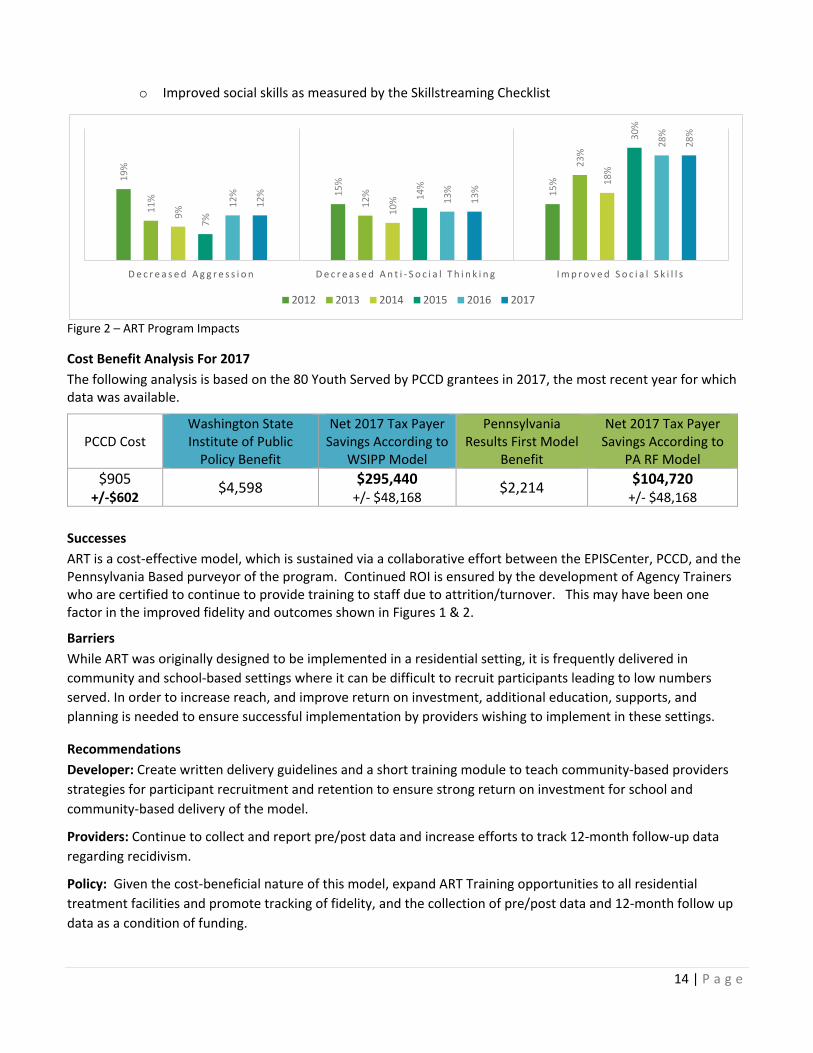
Figure 1 – ART Model Adherence Outcomes Measurement and Program Impacts • PCCD requires grantees to measure outcomes using standardized pre/post measures. Of all youth served
by PCCD funded projects between 2011 and 2017, 70% completed pre/post measures. • Program impacts are measured as total anticipated change on three main constructs:
o Decreased aggression as measured by the Aggression Questionnaire o Decreased anti-social thinking as measured by the How I think Questionnaire
1 Washington State Institute for Public Policy. 2004. Outcome Evaluation of Washington State’s Research-Based Programs for Juvenile Offenders. Olympia, Wash.: Washington State Institute for Public Policy. 2 Gundersen, Knut K., and Frode Svartdal. 2006. “Aggression Replacement Training in Norway: Outcome Evaluation of 11 Norwegian Student Projects.” Scandinavian Journal of Education Research 50(1):63–81.
50%60%70%80%90%
100%
2012 2013 2014 2015 2016 2017
Meets Minimum Needs Improvement
14 | P a g e
o Improved social skills as measured by the Skillstreaming Checklist
Figure 2 – ART Program Impacts
Cost Benefit Analysis For 2017 The following analysis is based on the 80 Youth Served by PCCD grantees in 2017, the most recent year for which data was available.
PCCD Cost Washington State Institute of Public
Policy Benefit
Net 2017 Tax Payer Savings According to
WSIPP Model
Pennsylvania Results First Model
Benefit
Net 2017 Tax Payer Savings According to
PA RF Model $905
+/-$602 $4,598 $295,440
+/- $48,168 $2,214 $104,720 +/- $48,168
Successes ART is a cost-effective model, which is sustained via a collaborative effort between the EPISCenter, PCCD, and the Pennsylvania Based purveyor of the program. Continued ROI is ensured by the development of Agency Trainers who are certified to continue to provide training to staff due to attrition/turnover. This may have been one factor in the improved fidelity and outcomes shown in Figures 1 & 2.
Barriers While ART was originally designed to be implemented in a residential setting, it is frequently delivered in community and school-based settings where it can be difficult to recruit participants leading to low numbers served. In order to increase reach, and improve return on investment, additional education, supports, and planning is needed to ensure successful implementation by providers wishing to implement in these settings.
Recommendations Developer: Create written delivery guidelines and a short training module to teach community-based providers strategies for participant recruitment and retention to ensure strong return on investment for school and community-based delivery of the model.
Providers: Continue to collect and report pre/post data and increase efforts to track 12-month follow-up data regarding recidivism.
Policy: Given the cost-beneficial nature of this model, expand ART Training opportunities to all residential treatment facilities and promote tracking of fidelity, and the collection of pre/post data and 12-month follow up data as a condition of funding.
19%
15%
15%
11% 12
%
23%
9% 10%
18%
7%
14%
30%
12%
13%
28%
12%
13%
28%
D e c r e a s e d A g g r e s s i o n D e c r e a s e d A n t i - S o c i a l T h i n k i n g I m p r o v e d S o c i a l S k i l l s
2012 2013 2014 2015 2016 2017

15 | P a g e
Big Brothers Big Sisters (BBBS) Big Brothers Big Sisters mentoring programs have supported at-risk youth in Pennsylvania for well over 50 years, with 17 affiliates operating in the state as of January 2019. Professional BBBS caseworkers help connect a trained and screened adult mentor with a youth, and then support that match over time. The matched “big” and “little” meet several times a month to talk and take part in activities together in a variety of community-based venues or in their respective homes. The resulting supportive relationships lead to decreased risk and promote healthy youth development. PCCD has awarded 43 grants to support BBBS in the past six years.
Effectiveness Ratings 1. Promising, Blueprints for Healthy Youth Development 2. Promising, The California Evidence-Based Clearinghouse for Child Welfare 3. Effective, Crime Solutions
Proven Impacts • Reduced Substance Use: Youth in the program were less likely to initiate drug and alcohol use.3 • Reduced Antisocial Behavior: Teachers reported youth in the program were less likely to have a serious
offence such as fighting.3 • Improved Academics: Youth were less likely to skip school, and showed improved grades.3 • Improved Relationships: Youth showed improved relationships with parents and peers. 3
PCCD Grantee Data Summary EPISCenter standardized measures have been in place for BBBS since 2010, data below reflects fiscal years from 2012 through 2017.
Program Reach and Dosage • 43 PCCD funded implementations served 3,173 youth during fiscal years 2012 through 2017. • The average number of youth served per implementation was 74. • 63% of youth who participated received a full dose of the program (defined as meeting three or more
times per month with their big for one year or more) Model Adherence • Model adherence is measured in terms of
the quality of the mentoring relationship using a Strength of Relationship survey completed by each youth. Meets minimum is defined by youth reporting an average score of four or higher on items 7 and 10.
Figure 1 – BBBS Model Adherence Outcomes Measurement and Program Impacts • PCCD requires grantees to measure outcomes using standardized pre/post measures. Of all youth served
by PCCD funded projects between 2011 and 2017, 50% completed pre/post measures. • Program impacts are measured utilizing the Youth Outcomes Survey, data is reported for three constructs
from this tool: o Improved academics o Decreased anti-social behavior
3 https://www.blueprintsprograms.org/factsheet/big-brothers-big-sisters-of-america (accessed Oct. 2018)
50%60%70%80%90%
100%
2012 2013 2014 2015 2016 2017
Meets Minimum Needs Improvement

16 | P a g e
o Decreased intent to use ATOD (numbers are expected to be low, given developmental trajectories for youth are to increase intent to use)
Figure 2 – BBBS Program Impacts
Cost Benefit Analysis For 2017 The following analysis is based on the 538 Youth Served by PCCD grantees in 2017, the most recent year for which data was available.
PCCD Cost Washington State Institute of Public
Policy Benefit
Net 2017 Tax Payer Savings According to
WSIPP Model
Pennsylvania Results First Model
Benefit
Net 2017 Tax Payer Savings According to
PA RF Model $1,603 +/-$504
($759) ($1,270,756) +/- $271,102 ($169) ($953,501)
+/- $271,102
Successes BBBS National launched a new quality improvement initiative in the fall of 2017 to ensure high quality implementation and sustainability of programs. These standards included productivity and budget standards to ensure cost-effective operations. Every PCCD funded provider met these new standards and were confirmed to be implementing within guidelines for quality and efficiency.
Barriers Several barriers to cost-efficiency exist for BBBS. Sustainability of the model in rural areas has been a challenge and as a result the state has seen a decrease in the number of affiliates from 23 in 2008 to the current number of 17. Some affiliates have been asked to expand their service areas which can lead to the approach being less efficient and effective due to staff travel time. Training costs are high due to frequent turnover related to staff who look at BBBS positions as a stepping stone and eventually pursue higher wages and benefits. Finally, lack of research showing impact on key monetized outcomes has resulted in a negative return on investment for this model.
Recommendations
Developer: Conduct new research to show effectiveness of the model and identify solutions to rural sustainability.
Providers: Ensure cost effective implementation by following new national standards for staffing and minimum number of matches.
Policy: Re-organize legislatively directed funds for the three major urban providers and smaller PCCD grants into one large award to be disseminated across ALL BBBS affiliates based on population of the service area.
50%
30%
8%
39%
25%
5%
31%
19%
1%
41%
17%
5%
42%
24%
7%
42%
27%
7%
I M P R O V E D A C A D E M I C S D E C R E A S E D A N T I - S O C I A L B E H A V I O R D E C R E A S E D I N T E N T T O U S E A T O D
2012 2013 2014 2015 2016 2017

17 | P a g e
Functional Family Therapy (FFT) Functional Family Therapy is a family intervention program for at-risk youth ages 10-18 and their families, including youth with problems such as conduct disorder, violent acting-out, and substance abuse. Youth often also present with additional comorbid challenges such as depression. The Intervention is conducted in clinic settings, as outpatient therapy, and as a home-based model, including delivery in schools, child welfare, probation, parole/aftercare, and mental health, and as an alternative to incarceration or out-of-home placement. Treatment typically is for approximately three months, up to five months in serious cases. As of January 2019, there are eight FFT providers in Pennsylvania serving 13 counties.
Effectiveness Ratings 1. Model Program, Blueprints For Healthy Youth Development 2. Supported by Research Evidence, The California Evidence-Based Clearinghouse for Child Welfare 3. Effective, Crime Solutions
Proven Impacts • Reduction in Criminal Recidivism and Substance Use.4 • Reduction in Sibling Court Involvement.4 • Improvement in Family Functioning, Behavior and Mental Health.4
PCCD Data Summary PCCD awarded its last startup funding for FFT in 2008. However, it has continued to support FFT providers with funding for replacement training and from 2011-2017 via a Pennsylvania specific EBI data collection system called INSPIRE. FFT has a 30% sustainability rate with 8 out of 27 sites still in operation.
Program Reach and Dosage • The number of youth served by FFT has steadily declined since 2012.
Figure 1-FFT Clinical Discharges
Model Adherence • The FFT, Inc. National Experts closely monitor model adherence for FFT through an intensive clinical
supervision process. • The EPISCenter does not monitor model adherence data for FFT, therefore there is no data to report for
this model.
Outcomes Measurement and Program Impacts • The youth served by PCCD supported FFT projects between 2011 and 2017, who were clinically discharged
were assessed for the three FFT ultimate outcomes: o Avoided placement, and remained living at home or in the community.
4 https://www.blueprintsprograms.org/factsheet/functional-family-therapy-fft (Accessed January 2019)
1102 933 948 886 807653
0200400600800
10001200
2012 2013 2014 2015 2016 2017
Number of Youth

18 | P a g e
o No new criminal offenses or recidivism. o Stayed in school.
Figure 2 – FFT Program Impacts Cost Benefit Analysis For 2017
The following analysis is based on the 653 Youth who were clinically discharged from FFT programs in 2017, the most recent year for which data was available. Pennsylvania costs were calculated via a 2015 provider rate survey conducted by the EPISCenter.
PA Cost per case
Washington State Institute of Public
Policy Benefit
Net 2017 Tax Payer Savings According to
WSIPP Model
Pennsylvania Results First Model
Benefit
Net 2017 Tax Payer Savings According to
PA RF Model $3,918
Range from $2,765-$5,005
$27,844 $15,623,678 $11,015 $4,634,341
Successes The FFT programs shows a significant cost savings for Pennsylvania, and the current provider community seems to be able to sustain the program via a combined or “braided” funding approach utilizing billing of Behavioral Health Managed Care Organizations (BH-MCOs), Medical Assistance (MA) and County Needs Based or Special Grants funding. PCCD’s support of replacement training also helps to reduce overhead costs and sustain the program.
Barriers There are distinct differences in the savings estimate between the WSIPP and the PA Results First model due to the Pennsylvania’s model including only five years of recidivism data vs. the WSIPP model’s 15 years. There is a significant variation in the billable rates for FFT across counties and BH-MCO providers. Some rates do not allow for sustainable implementation. Some FFT service components are not reimbursable by MA due to federal restrictions. MA rates have not been increased in over 10 years. Together these issues create barriers to sustainability and growth of this cost-effective service.
Recommendations Developer: Maintain and grow Pennsylvania-based expertise to allow for additional technical assistance to FFT providers to help them overcome barriers to sustainability and cost-effective delivery of the FFT model within the PA context. Providers: Maintain and strengthen partnerships across Probation, Child Welfare, and Mental Health referral sources in order to ensure high utilization of existing FFT capacity, and to advocate for expansion of this highly cost-effective model. Policy: Given the cost-effectiveness of this model, federal and state policy makers should advocate for an increase to the MA rate for FFT, and ensure all necessary model components are reimbursable.
90%
85%
60%
90%
87%
67%
91%
87%
59%
91%
89%
61%
91%
87%
62%79
%
no d
ata
avai
laba
le
89%
N O P L A C E M E N T N O N E W C R I M I N A L O F F E N S E S I N S C H O O L
2012 2013 2014 2015 2016 2017
19 | P a g e
Incredible Years Basic Parent Program (IYS® Basic) IYS Basic Parent is for parents of children ages 3-12 years. Over 10-20 weeks it emphasizes parenting skills such as child-led play, effective praise, and limit setting in order to promote children's social competence and reduce behavior problems. There are other Incredible Years models such as Incredible Years Classroom Dinosaur School, Small Group Therapy, and IY Advanced. PCCD has funded 23 Incredible Years projects across these various models. The IYS Basic model is a core component of all other versions of the IY programs, hence the focus on it for the purposes of this report.
Effectiveness Ratings 1. Promising Program, Blueprints for Healthy Youth Development 2. Well-Supported-Highest Rated, The California Evidence-Based Clearinghouse for Child Welfare 3. Effective-Highest Rated, Crime Solutions
Proven Impacts • Increases in children’s positive affect and compliance to parental commands.5 • Increases in parental self-confidence.5 • Reduction in parental depression.5
PCCD Grantee Data Summary EPISCenter standardized measures have been in place for the Incredible Years since 2011, data below reflects fiscal years from 2012 through 2017.
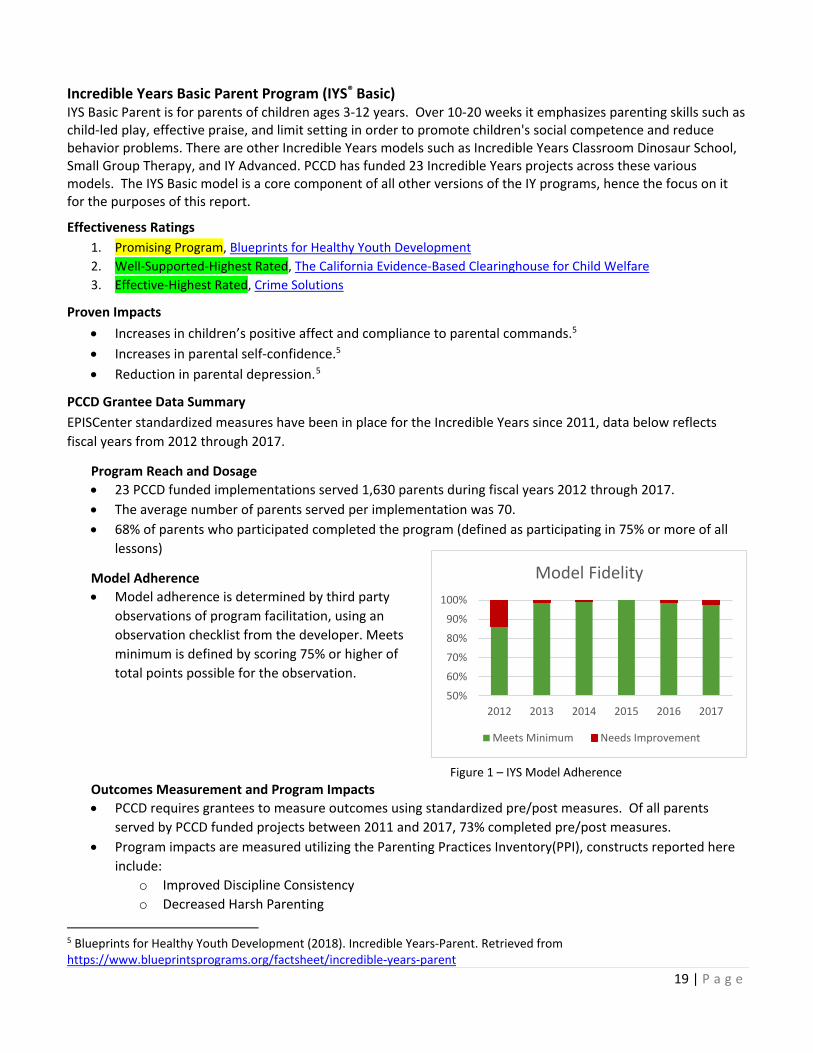
Program Reach and Dosage • 23 PCCD funded implementations served 1,630 parents during fiscal years 2012 through 2017. • The average number of parents served per implementation was 70. • 68% of parents who participated completed the program (defined as participating in 75% or more of all
lessons)
Model Adherence • Model adherence is determined by third party
observations of program facilitation, using an observation checklist from the developer. Meets minimum is defined by scoring 75% or higher of total points possible for the observation.
Figure 1 – IYS Model Adherence Outcomes Measurement and Program Impacts • PCCD requires grantees to measure outcomes using standardized pre/post measures. Of all parents
served by PCCD funded projects between 2011 and 2017, 73% completed pre/post measures. • Program impacts are measured utilizing the Parenting Practices Inventory(PPI), constructs reported here
include: o Improved Discipline Consistency o Decreased Harsh Parenting
5 Blueprints for Healthy Youth Development (2018). Incredible Years-Parent. Retrieved from https://www.blueprintsprograms.org/factsheet/incredible-years-parent
50%
60%
70%
80%
90%
100%
2012 2013 2014 2015 2016 2017
Model Fidelity
Meets Minimum Needs Improvement

20 | P a g e
o Increased Positive Parenting
Figure 2 – IYS Basic Program Impacts
Cost Benefit Analysis For 2017 The following analysis is based on the 280 Parents Served by PCCD grantees in 2017, the most recent year for which data was available.
PCCD Cost Washington State Institute of Public
Policy Benefit
Net 2017 Tax Payer Savings According to
WSIPP Model
Pennsylvania Results First Model
Benefit
Net 2017 Tax Payer Savings According to
PA RF Model $2104
+/-$658 $7,871 $1,614,760 +/-$184,240 $2,612 $142,240
+/- $184,240
Successes The Incredible Years Basic Parent program is a cost-effective model with a dynamic and pro-active provider community in Pennsylvania. The EPISCenter has established infrastructure to support in-state trainings to decrease implementation costs, and promote high quality implementation. This is evidenced in the high level of model fidelity achieved throughout the last six years (figure 1). There is consistent evidence that the program is having the desired impact for the majority of parents who participate. (figure 2)
Barriers Parent education programs like IY Basic cannot currently be billed to MA or most BH-MCOs. The Incredible Years Dina Small Group Therapy model is not shown to be as effective as the Basic Parent Program, yet there are a number of providers who are only able to sustain their Incredible Years parent programs by billing MA and the BH-MCOs for the child focused component. There is a high level of turnover amongst IY facilitators and an ongoing need for training that can sometimes be difficult to access.
Recommendations Developer: Consider shifting training structure to streamline facilitator certification process and expand local training options, which would allow for more efficient, cost effective, and higher quality scale up of the IY models.
Providers: Advocate for including the IY Basic Parent component as a billable service to address child behavior problems with local policy makers and BH-MCO representatives. Note that while billing MA and BH-MCOs to sustain IY programming is possible, the Basic Parent Component must be included in order to achieve impacts.
Policy: Given the cost-beneficial nature of the Basic Parent Model, and the lack of benefit for the child focused components policy makers need to remove barriers to billing MA and BH-MCOs for parent-focused programs that are proven to reduce children’s behavior problems.
55%
93%
70%
61%
86%
81%
71%
88%
76%
64% 77
% 83%
72%
74%
71%
68% 76
%
74%
I M P R O V E D D I S C I P L I N E C O N S I S T E N C Y
D E C R E A S E D H A R S H P A R E N T I N G I N C R E A S E D P O S I T I V E P A R E N T I N G
2012 2013 2014 2015 2016 2017

21 | P a g e
LifeSkills Training (LST®) LifeSkills Training (LST) is utilized in school-based settings throughout Pennsylvania. PCCD has funded 11 projects in the past six years. LST is delivered to middle/junior high school students. This three-year intervention is designed to prevent or reduce gateway drug use (i.e., tobacco, alcohol, and marijuana), and is primarily implemented in school classrooms by teachers. Effectiveness Ratings
1. Model Plus, Blueprints for Healthy Youth Development 2. Effective, Crime Solutions
Proven Impacts
• Increase in consistency for school attendance.6 • Increase in building confidence to resist influences for the use of tobacco, alcohol and drugs.6 • Increase in knowledge about misconceptions of substance use and building effective coping skills to resist
social pressures.6 • Increase skills for managing behavior.6 • Increases in effective communication to build positive peer relationships.6
PCCD Grantee Data Summary EPISCenter standardized measures have been in place for LST since 2011, data below reflects fiscal years from 2012 through 2017.
Program Reach and Dosage • 11 PCCD funded implementations served 18,159 youth during fiscal years 2012 through 2017. • The average number of youth served per implementation was 1,650. • 49% of youth who participated received a full dose of the core LST Level One Lessons (defined as receiving
at least 12 of 18 lessons).
Model Adherence • Model adherence is determined by third party
observations of program facilitation, using an observation checklist from the developer. Meets minimum is defined as facilitators delivering 75% or more of core components with a high level of adherence. Note: In 2014 an error resulted in no fidelity data for that year.
Figure 1 – LST Model Adherence Outcomes Measurement and Program Impacts
• PCCD requires grantees to measure outcomes using standardized pre/post measures. Of all youth served by PCCD funded projects between 2012 and 2017, 64% completed pre/post measures.
• Program impacts are measured as total anticipated change on many constructs, those shared here include:
o Improved Knowledge of Alcohol, Tobacco, and Other Drugs (ATOD)
6 https://www.blueprintsprograms.org/factsheet/lifeskills-training-lst (Accessed Jan. 2019)
50%
60%
70%
80%
90%
100%
2012 2013 2014 2015 2016 2017
Model Fidelity
Meets Minimum Needs Improvement

22 | P a g e
o Improved Peer Pressure Resistance Skills o Decreased 30 Day Use of Alcohol Tobacco and Other Drugs (ATOD) (numbers are expected to be
low, given developmental trajectory for youth is to increase ATOD use)
Figure 2 – LST Program Impacts
Cost Benefit Analysis For 2017 The following analysis is based on the 1,916 Youth Served by PCCD grantees in 2017, the most recent year for which data was available.
PCCD Cost Washington State Institute of Public
Policy Benefit
Net 2017 Tax Payer Savings According to
WSIPP Model
Pennsylvania Results First Model
Benefit
Net 2017 Tax Payer Savings According to
PA RF Model $131
+/-$60 $802 $1,285,636
+/- $55,571 $1,489 $1,254,837 +/- $55,571
Successes LifeSkills Training is a cost-beneficial program with demonstrated impacts on improving knowledge of alcohol, tobacco, and other drug use for Pennsylvania middle school students.
Barriers Many communities choose to have drug and alcohol prevention organizations from outside the school come in temporarily to deliver LST lessons, rather than training teachers. This practice increases the cost, makes the program more difficult to sustain, and may lead to lower model fidelity due to the lack of classroom management skills and familiarity with students of outside providers. Additionally, the developer has created new modules that many schools have purchased without getting the necessary training and support to know how to integrate the new modules into the core lessons without negatively effecting fidelity.
Recommendations Developer: The program developer should continue to research the efficacy of the addition of the Marijuana and Prescription Drug Abuse modules to the core LST lessons.
Providers: Drug and alcohol prevention organizations can focus their efforts on becoming LST trainers and supporting quality implementation across many districts. Middle school teachers are the best-qualified people to implement the LST program lessons, ideally as part of a health class curriculum. Seek training for integrating additional modules into the core LST lessons.
Policy: Promote the integration of this evidence-based health curriculum into the educational standards for Pennsylvania’s middle schools.
20%
9%
56%
21%
12%
51%
38%
6%
80%
13%
8%
74%
18%
8%
68%
19%
9%
66%
I M P R O V E D P E E R P R E S S U R E R E S I S T A N C E S K I L L S
D E C R E A S E D 3 0 D A Y A T O D U S E I M P R O V E D K N O W L E D G E O F A T O D
2012 2013 2014 2015 2016 2017

23 | P a g e
Multisystemic Therapy (MST) Multisystemic Therapy (MST) is an intensive family-based intervention program that addresses the multiple determinants of serious antisocial behavior in chronic, violent, or substance abusing male or female juvenile offenders, ages 12 to 17, at high-risk of out-of-home placement. The multisystemic approach views individuals as nested within a network of interconnected systems that encompass individual, family, and extra-familial (peer, school, neighborhood) factors. The primary goals of MST are: to decrease rates of antisocial behavior and other clinical problems, improve functioning (e.g., family relations, school performance), and promote behavior change in the youth’s natural environment. Pennsylvania has 12 MST providers, with 45 MST teams serving 59 counties.
Effectiveness Ratings
1. Model Plus Program, Blueprints For Healthy Youth Development 2. Well-Supported, The California Evidence-Based Clearinghouse for Child Welfare 3. Effective, Crime Solutions
Proven Impacts • Youth in MST show improved family cohesion, improved peer relations, decrease in recidivism, decrease in
incarceration.7 • Youth who received MST show significantly lower rates of re-arrest for sexual offending and other criminal
offending than youth in individual therapy.8
PCCD Grantee Data Summary PCCD awarded its last startup funding for MST in 2008. However, it has continued to support MST providers with funding for replacement training and from 2011-2017 via a Pennsylvania specific EBI data collection system called INSPIRE. MST has a 76% sustainability rate, with 45 out of 59 teams still in operation.
Program Reach and Dosage • The number of youth discharged from MST has generally declined from 2012 through 2017.
Figure 1- MST Non-Administrative Discharges by Year
Model Adherence • Model adherence for MST is closely monitored via a system of supervision and consultation provided by
MST Services, Inc. • The EPISCenter does not monitor fidelity data for MST, therefore there is no model adherence data to
report for this program.
7 Henggeler, S. W., Melton, G. B., & Smith, L. A. (1992). Family preservation using Multisystemic Therapy: An effective alternative to incarcerating serious juvenile offenders. Journal of Consulting and Clinical Psychology, 60, 953-961. 8 Borduin, C. M., Henggeler, S. W., Blaske, D. M., & Stein, R. (1990). Multisystemic treatment of adolescent sexual offenders. International Journal of Offender Therapy and Comparative Criminology, 35, 105-114.
1676 1544 1403 1348 1400 1226
0
500
1000
1500
2000
2012 2013 2014 2015 2016 2017
Number of Youth

24 | P a g e
Outcomes Measurement and Program Impacts • The youth served by PCCD supported MST projects between 2011 and 2017, who were clinically
discharged were assessed for the three MST ultimate outcomes: o Avoided placement, and remained living at home or in the community. o No new criminal offenses or recidivism – (no data available for 2017). o Stayed in school.
Figure 2 – MST Program Impacts
Cost Benefit Analysis For 2017 The following analysis is based on the 1,226 Youth Served by PCCD supported providers in 2017, the most recent year for which data was available. Pennsylvania costs were calculated via a 2015 provider rate survey conducted by the EPISCenter.
Pennsylvania Cost
Washington State Institute of Public
Policy Benefit
Net 2017 Tax Payer Savings According to
WSIPP Model
Pennsylvania Results First Model
Benefit
Net 2017 Tax Payer Savings According to
PA RF Model $8,683
Ranges from $6,307-$10,732
$12,655 $4,444,250 $5,362 ($4,071,546)
Successes MST is a sustainable and effective intervention model for youth who are at risk of placement.
Barriers There are distinct differences in the savings estimate between the WSIPP and the PA results first model due to Pennsylvania’s model including only five years of recidivism data vs. the WSIPP model’s 15 years. There is a significant variation in the billable rates for MST across counties and BH-MCO providers. Some rates do not allow for sustainable implementation. Some MST service components are not reimbursable by MA due to federal restrictions. Examples include case coordination, collaboration with collateral contacts, and transportation. MA rates have not been increased in over 10 years. Together these issues create barriers to sustainability and growth of this cost-effective service.
Recommendations Developer: Continue to conduct and publish research on the use of MST with diverse populations and problem behaviors. Providers: Continue to utilize braided funding to sustain programming, specifically leverage policy shifts that will take place in light of the Families First Prevention act. Policy: Establish rate increases to promote increased wages for clinicians who provide intensive home-based services. Establish tuition reimbursement programs for clinicians who are willing to commit five years to delivering home-based intensive services to keep at-risk youth at home.
87%
88%
71%88
%
90%
74%88
%
89%
73%89
%
91%
74%89
%
92%
72%88
%
0No
data
ava
ilbal
e fo
r thi
s yea
r
89%
N O P L A C E M E N T N O N E W C R I M I N A L O F F E N S E S I N S C H O O L
2012 2013 2014 2015 2016 2017
25 | P a g e
Positive Action® (PA) Positive Action is a school-based program that focuses on climate change for grades K-6 (140 15-minute lessons) and grades 7-8 (82 15-minute lessons). The program content is designed to be delivered in classroom settings by teachers and is divided into six units that help students understand the impact of their positive or negative actions, and teach skills and knowledge to support physical, intellectual, social and emotional development. PCCD has funded two projects in the past two years.
Effectiveness Ratings
1. Model Program, Blueprints for Healthy Youth Development 2. Effective, Crime Solutions
Proven Impacts • Reduced self-reported substance use.9 • Reduced depression and anxiety.9 • Increased socio-emotional and character development.9
PCCD Grantee Data Summary EPISCenter standardized measures have been in place for Positive Action since 2016; data below reflects fiscal years 2016-2017.
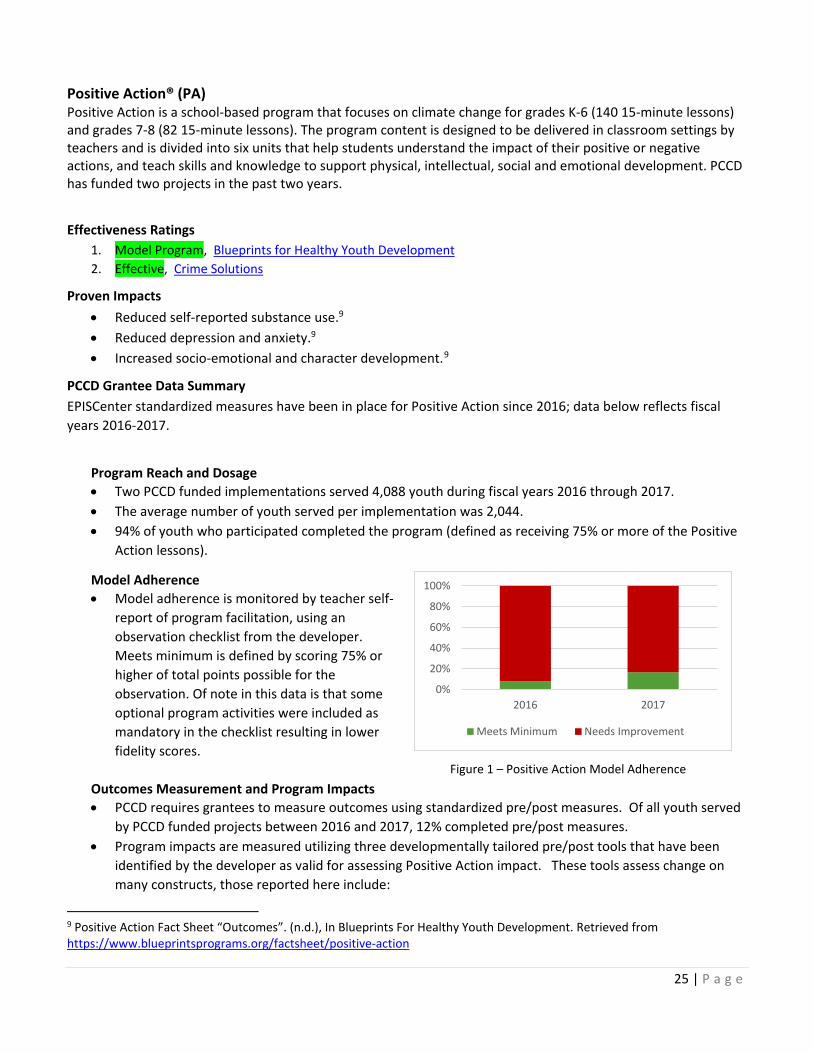
Program Reach and Dosage • Two PCCD funded implementations served 4,088 youth during fiscal years 2016 through 2017. • The average number of youth served per implementation was 2,044. • 94% of youth who participated completed the program (defined as receiving 75% or more of the Positive
Action lessons).
Model Adherence • Model adherence is monitored by teacher self-
report of program facilitation, using an observation checklist from the developer. Meets minimum is defined by scoring 75% or higher of total points possible for the observation. Of note in this data is that some optional program activities were included as mandatory in the checklist resulting in lower fidelity scores.
Figure 1 – Positive Action Model Adherence Outcomes Measurement and Program Impacts • PCCD requires grantees to measure outcomes using standardized pre/post measures. Of all youth served
by PCCD funded projects between 2016 and 2017, 12% completed pre/post measures. • Program impacts are measured utilizing three developmentally tailored pre/post tools that have been
identified by the developer as valid for assessing Positive Action impact. These tools assess change on many constructs, those reported here include:
9 Positive Action Fact Sheet “Outcomes”. (n.d.), In Blueprints For Healthy Youth Development. Retrieved from https://www.blueprintsprograms.org/factsheet/positive-action
0%
20%
40%
60%
80%
100%
2016 2017
Meets Minimum Needs Improvement

26 | P a g e
o Improved Intellectual Functioning o Improved Self-Honesty
Figure 2 – Positive Action Program Impacts
Cost Benefit Analysis For 2017 The following analysis is based on the 2,712 Youth Served by PCCD grantees in 2017, the most recent year for which data was available. No confidence interval for accuracy of cost calculation is available due to the limitation of only two implementations in the data set at the time of this report.
PCCD Cost Washington State Institute of Public
Policy Benefit
Net 2017 Tax Payer Savings According to
WSIPP Model
Pennsylvania Results First Model
Benefit
Net 2017 Tax Payer Savings According to
PA RF Model $63
Range $70-$164
$33,181 $89,816,016 +/- $212,080 $13,727 $37,056,003
+/- $212,080
Successes Positive Action shows a significant return on investment and outcomes data indicates the model is positively impacting a large proportion of the youth served. Barriers Positive Action would benefit from refined model fidelity tools to ensure accurate assessment of model adherence.
Recommendations Developer: Simplify and clarify model fidelity checklists to ensure accurate assessment of model adherence. Provide more focused readiness and training resources to ensure that school administrators and teachers are fully in support of the model prior to training and implementation.
Providers: Work closely with the EPISCenter to identify and overcome barriers to pre/post data collection in school settings. Communities looking to implement Positive Action need to be certain that prior to training and implementation all staff, teachers, and administrators are onboard with bringing this whole-school climate program to the students.
Policy: Promote the use of evidence-based social emotional learning curriculums to prevent mental health and substance misuse disorders before they start. Prioritize funding for classroom-based implementation and incentivize participation in training by teachers.
34%
31%
28%
43%
I m p r o v e d I n t e l l e c t u a l F u n c t i o n i n g I m p r o v e d S e l f H o n e s t y
2016 2017

27 | P a g e
Positive Parenting Program (Triple P®) Positive Parenting Program (Triple P) is a system of family-focused prevention programs, structured over 5 levels, that provide parents with useful strategies to assist them in managing their children’s behavior, prevent future problems, and build strong and healthy relationships. PCCD has funded three projects since this program was added to the EPISCenter menu in 2015. Implementations in Pennsylvania have focused primarily on levels 3 and 4.
Effectiveness Ratings 1. Promising Program, Blueprints for Healthy Youth Development 2. Supported by Research Evidence, The California Evidence-Based Clearinghouse for Child Welfare
Proven Impacts
• Increases in parental competence, knowledge, and confidence in using positive parenting.10 • Decreased child maltreatment, child out-of-home placements, and hospitalization or emergency-room visits
for child maltreatment injuries.11 • Reduction in emotional problems and psychosocial distress in both children and their parents.11
PCCD Grantee Data Summary EPISCenter standardized measures have been in place for Triple P since 2016, data below reflects fiscal years 2016 and 2017.
Program Reach and Dosage • Three PCCD funded implementations served 335 parents during fiscal years 2016 and 2017. • The average number of parents served per implementation was 112. • 79% of parents who participated completed the program (defined as participating in 75% or more of the
Triple P sessions).
Model Adherence • Model adherence is monitored by an external
observer using an observation checklist from the developer. Meets minimum is defined as implementing 75% or more of the components as designed by the developer.
Figure 1 – Triple P Model Adherence Outcomes Measurement and Program Impacts • PCCD requires grantees to measure outcomes using standardized pre/post measures. Of all parents
served by PCCD funded projects in 2016 and 2017, 59% completed pre/post measures.
10 Triple P Logic Model (2018). Retrieved from https://www.blueprintsprograms.org/resources/logic_model/TripleP.pdf 11 Blueprints for Healthy Youth Development (2018). Triple P System. Retrieved from https://www.blueprintsprograms.org/factsheet/triple-p-system
50%
60%
70%
80%
90%
100%
2016 2017
Meets Minimum Needs Improvement

28 | P a g e
• Program impacts are measured utilizing the Parenting and Family Adjustment Scale (PAFAS) This tool assesses change on two main constructs, including:
o Improved Overall Parenting Practices o Improved Overall Family Adjustment
Figure 2 – Triple P Program Impacts
Cost Benefit Analysis For 2017 The following analysis is based on the 235 Parents Served by PCCD grantees in 2017, the most recent year for which data was available.
PCCD Cost Washington State Institute of Public
Policy Benefit
Net 2017 Tax Payer Savings According to
WSIPP Model
Pennsylvania Results First Model
Benefit
Net 2017 Tax Payer Savings According to
PA RF Model $1,376 +/- 388
$3,078 $399,970 +/- $28,726 $1,072 ($71,440)
+/- $28,726
Successes Triple P outcomes data indicates the model is positively impacting a large proportion of the parents served and is being implemented with a high level of fidelity. Cross site coordination of training by the EPISCenter has created cost savings for providers, enhancing the cost-efficiency of scale up. A dynamic learning community in the state serves 30 providers who are not funded by PCCD- thus extended the impact of EPISCenter support and ensuring high levels of Triple P fidelity across systems. Barriers There is some discrepancy between the Washington State Institute of Public Policy Model and the Pennsylvania Results First Model regarding the cost-effectiveness of the program.
Recommendations Developer: Coordinate with the EPISCenter and PCCD to establish a PA-based trainer who can deliver training in both Level 4 Standard, & Group. This would help reduce costs and improve accessibility.
Providers: Focus Triple P Implementations on Level 4, which is the most cost-effective.
Policy: Promote the use of Triple P as one strategy to support child welfare workforce development, and as a way to address the need for more evidence-based alternatives to placement and congregate care- as required by the Families First Prevention Act.
66%
57%
48%
35%
I m p r o v e d O v e r a l l P a r e n t i n g P r a c t i c e s I m p r o v e d O v e r a l l F a m i l y A d j u s t m e n t
2016 2017
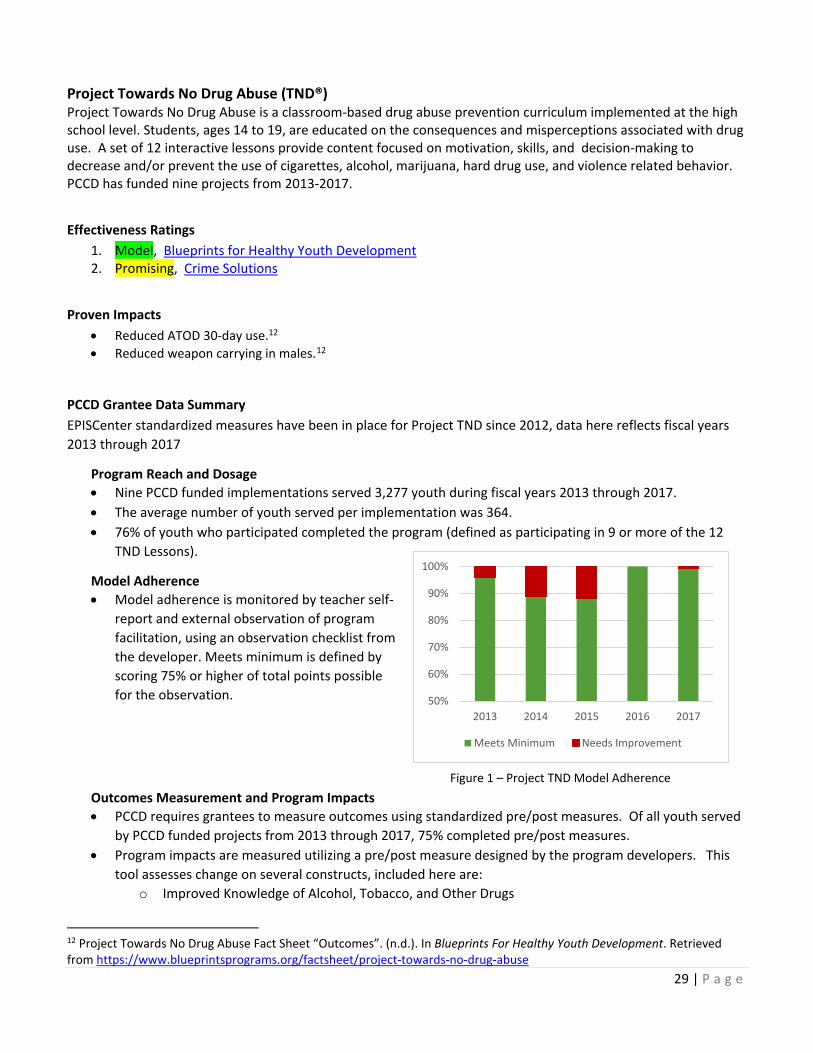
29 | P a g e
Project Towards No Drug Abuse (TND®) Project Towards No Drug Abuse is a classroom-based drug abuse prevention curriculum implemented at the high school level. Students, ages 14 to 19, are educated on the consequences and misperceptions associated with drug use. A set of 12 interactive lessons provide content focused on motivation, skills, and decision-making to decrease and/or prevent the use of cigarettes, alcohol, marijuana, hard drug use, and violence related behavior. PCCD has funded nine projects from 2013-2017.
Effectiveness Ratings
1. Model, Blueprints for Healthy Youth Development 2. Promising, Crime Solutions
Proven Impacts
• Reduced ATOD 30-day use.12 • Reduced weapon carrying in males.12
PCCD Grantee Data Summary EPISCenter standardized measures have been in place for Project TND since 2012, data here reflects fiscal years 2013 through 2017
Program Reach and Dosage • Nine PCCD funded implementations served 3,277 youth during fiscal years 2013 through 2017. • The average number of youth served per implementation was 364. • 76% of youth who participated completed the program (defined as participating in 9 or more of the 12
TND Lessons).
Model Adherence • Model adherence is monitored by teacher self-
report and external observation of program facilitation, using an observation checklist from the developer. Meets minimum is defined by scoring 75% or higher of total points possible for the observation.
Figure 1 – Project TND Model Adherence Outcomes Measurement and Program Impacts • PCCD requires grantees to measure outcomes using standardized pre/post measures. Of all youth served
by PCCD funded projects from 2013 through 2017, 75% completed pre/post measures. • Program impacts are measured utilizing a pre/post measure designed by the program developers. This
tool assesses change on several constructs, included here are: o Improved Knowledge of Alcohol, Tobacco, and Other Drugs
12 Project Towards No Drug Abuse Fact Sheet “Outcomes”. (n.d.). In Blueprints For Healthy Youth Development. Retrieved from https://www.blueprintsprograms.org/factsheet/project-towards-no-drug-abuse
50%
60%
70%
80%
90%
100%
2013 2014 2015 2016 2017
Meets Minimum Needs Improvement

30 | P a g e
o Decreased Intent to Use Alcohol, Tobacco, and Other Drugs
Figure 2 – Project TND Program Impacts
Cost Benefit Analysis For 2017 The following analysis is based on the 152 youth Served by PCCD grantees in 2017, the most recent year for which data was available.
PCCD Cost Washington State Institute of Public
Policy Benefit
Net 2017 Tax Payer Savings According to
WSIPP Model
Pennsylvania Results First Model
Benefit
Net 2017 Tax Payer Savings According to
PA RF Model $117
+/- $47 $425 $46,816
+/- $7,168 $303 $28,263 +/- $7,168
Successes Project TND is a cost-beneficial program for Pennsylvania with evidence of effectiveness in addressing the risk and protective factors that lead to substance misuse. Model fidelity is consistently high, increasing the chances that the program will be effective. The program has lower overall costs than other programs, thus increasing the likelihood of sustaining within schools. Barriers Training costs and availability have been a barrier to scale up of this cost-effective model. Many communities choose to have drug and alcohol prevention organizations from outside the school come in temporarily to deliver TND lessons, rather than training teachers. This practice increases the cost, makes the program more difficult to sustain, and may lead to lower model fidelity due to the lack of classroom management skills and familiarity with students of outside providers.
Recommendations Developer: Coordinate with the EPISCenter and PCCD to establish additional PA-based trainers in order to reduce costs and improve access to training.
Providers: Focus on planning school based implementations that use health teachers to deliver the curriculum. External providers can support schools by conducting fidelity observations, supporting pre/post assessments, and providing training.
Policy: Focus on embedding this curriculum and others with a similar evidence level into core requirements for Health Education in Pennsylvania, fund universal school-based implementations over other types of projects.
74%
21%
68%
29%
62%
29%
82%
64%
81%
26%
I M P R O V E D K N O W L E D G E O F A L C O H O L , T O B A C C O , A N D O T H E R D R U G S
D E C R E A S E D I N T E N T T O U S E A L C O H O L , T O B A C C O , A N D O T H E R D R U G S
2013 2014 2015 2016 2017
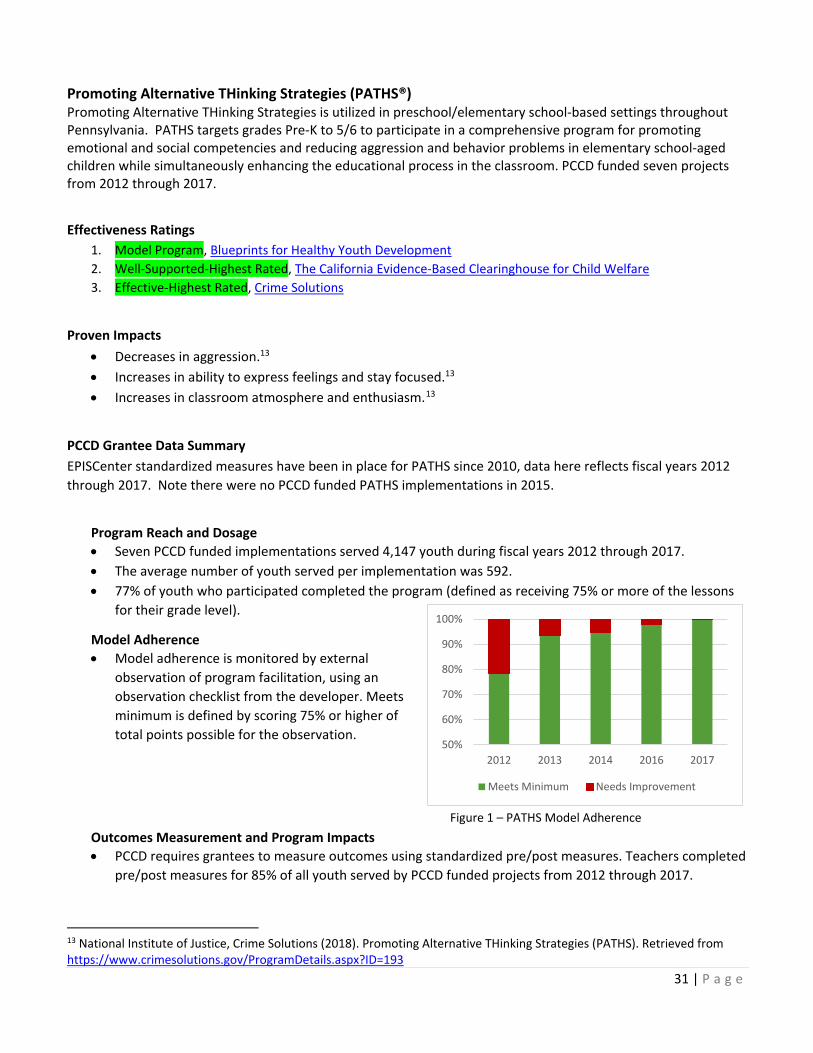
31 | P a g e
Promoting Alternative THinking Strategies (PATHS®) Promoting Alternative THinking Strategies is utilized in preschool/elementary school-based settings throughout Pennsylvania. PATHS targets grades Pre-K to 5/6 to participate in a comprehensive program for promoting emotional and social competencies and reducing aggression and behavior problems in elementary school-aged children while simultaneously enhancing the educational process in the classroom. PCCD funded seven projects from 2012 through 2017.
Effectiveness Ratings
1. Model Program, Blueprints for Healthy Youth Development 2. Well-Supported-Highest Rated, The California Evidence-Based Clearinghouse for Child Welfare 3. Effective-Highest Rated, Crime Solutions
Proven Impacts
• Decreases in aggression.13 • Increases in ability to express feelings and stay focused.13 • Increases in classroom atmosphere and enthusiasm.13
PCCD Grantee Data Summary EPISCenter standardized measures have been in place for PATHS since 2010, data here reflects fiscal years 2012 through 2017. Note there were no PCCD funded PATHS implementations in 2015.
Program Reach and Dosage • Seven PCCD funded implementations served 4,147 youth during fiscal years 2012 through 2017. • The average number of youth served per implementation was 592. • 77% of youth who participated completed the program (defined as receiving 75% or more of the lessons
for their grade level).
Model Adherence • Model adherence is monitored by external
observation of program facilitation, using an observation checklist from the developer. Meets minimum is defined by scoring 75% or higher of total points possible for the observation.
Figure 1 – PATHS Model Adherence Outcomes Measurement and Program Impacts • PCCD requires grantees to measure outcomes using standardized pre/post measures. Teachers completed
pre/post measures for 85% of all youth served by PCCD funded projects from 2012 through 2017.
13 National Institute of Justice, Crime Solutions (2018). Promoting Alternative THinking Strategies (PATHS). Retrieved from https://www.crimesolutions.gov/ProgramDetails.aspx?ID=193
50%
60%
70%
80%
90%
100%
2012 2013 2014 2016 2017
Meets Minimum Needs Improvement

32 | P a g e
• Program impacts are measured utilizing a developer approved, modified version of the Teacher Observation of Classroom Adaptation (TOCA) as a pre/post measure at the beginning and end of a school year. This tool assesses change on several constructs, reported here are:
o Improved Concentration o Decreased Anti-Social Behaviors
Figure 2 – PATHS Program Impacts
Cost Benefit Analysis For 2017 The following analysis is based on the 695 youth Served by PCCD grantees in 2017, the most recent year for which data was available.
PCCD Cost Washington State Institute of Public
Policy Benefit
Net 2017 Tax Payer Savings According to
WSIPP Model
Pennsylvania Results First Model
Benefit
Net 2017 Tax Payer Savings According to
PA RF Model $215
+/- $54 $8,135 $5,504,400
+/- $26,024 $7,711 $5,209,720 +/- $26,024
Successes PATHS shows a significant return on investment and increasing model fidelity over time. Barriers PATHS has experienced a decrease in applicants for PCCD funding and hence a decrease in reach. Recommendations Developer: Increase marketing efforts to ensure prospective applicants are aware of the effectiveness and cost-benefit value of the PATHS program.
Providers: Maintain high levels of model fidelity by building internal PATHS Peer coach capacity and offering replacement training as needed.
Policy: Fund replacement training for existing PATHS providers; eliminate barriers for school-based applicants for PCCD funding; set standards for the use of evidence-based social emotional learning curriculums in all schools.
58%
51%
90%
48%
61%
53%
37%
33%
69%
59%
I M P R O V E D C O N C E N T R A T I O N D E C R E A S E D A N T I S O C I A L B E H A V I O R S
2012 2013 2014 2016 2017

33 | P a g e
Strengthening Families Program 10-14 (SFP 10-14) Strengthening Families Program 10-14 is utilized in community-based settings throughout Pennsylvania. PCCD has funded 38 projects in the past six years. SFP 10-14 targets youth ages 10 to 14 and their caregivers, conveying the tenant of “love and limits” parenting. The caregiver, youth, and family skills-building curriculum is delivered in seven weekly sessions and is offered as independent, concurrent learning sessions for parents and youth, followed by joint family sessions.
Effectiveness Ratings 1. Promising, Blueprints for Healthy Youth Development 2. Effective, Crime Solutions
Proven Impacts
• Reduced ATOD initiation and use.14 • Reduced anxiety/depression rates by 12th grade follow-up.14
PCCD Grantee Data Summary EPISCenter standardized measures have been in place for SFP 10-14 since 2010, data here reflects fiscal years 2012 through 2017.
Program Reach and Dosage • 38 PCCD funded implementations served 1,933 youth and 2,070 parents during fiscal years 2012 through
2017. • The average number of youth served per implementation was 50, the average number of parents served
was 54. • 77% of families who participated completed the program (defined as attending 5 or more of the 7
sessions)
Model Adherence • Model adherence is monitored by external
observation of program facilitation, using an observation checklist from the developer. Meets minimum is defined by scoring 75% or higher of total points possible for the observation.
Figure 1 – SFP 10-14 Model Adherence Outcomes Measurement and Program Impacts • PCCD requires grantees to measure outcomes using standardized pre/post measures. On average 76% of
all participants completed pre/post measures. • Program impacts are measured utilizing a developer approved, pre/post measures completed by youth
and parents at the beginning and end of the program. These tools assess change on several parent and youth constructs; reported here are:
14 Strengthening Families 10-14 Fact Sheet “Outcomes”. (n.d.). In Blueprints For Healthy Youth Development. Retrieved from https://www.blueprintsprograms.org/factsheet/strengthening-families-10-14
50%
60%
70%
80%
90%
100%
2012 2013 2014 2015 2016 2017
Model Fidelity
Meets Minimum Needs Improvement
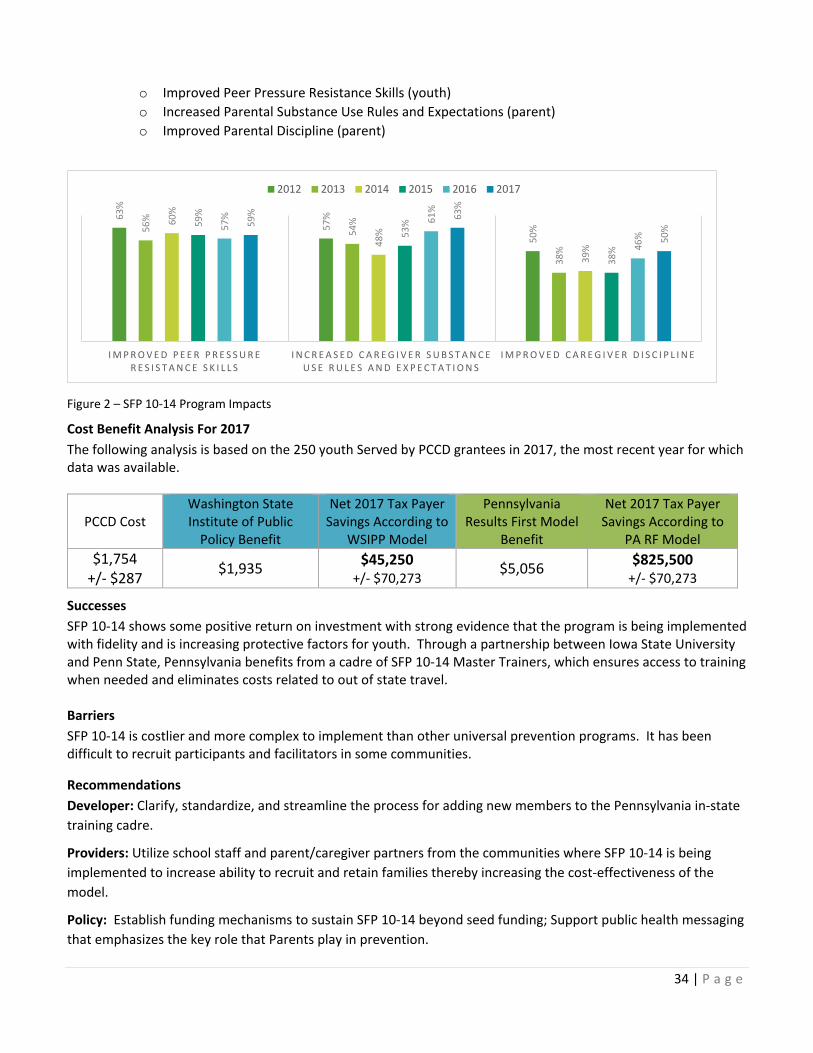
34 | P a g e
o Improved Peer Pressure Resistance Skills (youth) o Increased Parental Substance Use Rules and Expectations (parent) o Improved Parental Discipline (parent)
Figure 2 – SFP 10-14 Program Impacts
Cost Benefit Analysis For 2017 The following analysis is based on the 250 youth Served by PCCD grantees in 2017, the most recent year for which data was available.
PCCD Cost Washington State Institute of Public
Policy Benefit
Net 2017 Tax Payer Savings According to
WSIPP Model
Pennsylvania Results First Model
Benefit
Net 2017 Tax Payer Savings According to
PA RF Model $1,754
+/- $287 $1,935 $45,250
+/- $70,273 $5,056 $825,500 +/- $70,273
Successes SFP 10-14 shows some positive return on investment with strong evidence that the program is being implemented with fidelity and is increasing protective factors for youth. Through a partnership between Iowa State University and Penn State, Pennsylvania benefits from a cadre of SFP 10-14 Master Trainers, which ensures access to training when needed and eliminates costs related to out of state travel. Barriers SFP 10-14 is costlier and more complex to implement than other universal prevention programs. It has been difficult to recruit participants and facilitators in some communities.
Recommendations Developer: Clarify, standardize, and streamline the process for adding new members to the Pennsylvania in-state training cadre.
Providers: Utilize school staff and parent/caregiver partners from the communities where SFP 10-14 is being implemented to increase ability to recruit and retain families thereby increasing the cost-effectiveness of the model.
Policy: Establish funding mechanisms to sustain SFP 10-14 beyond seed funding; Support public health messaging that emphasizes the key role that Parents play in prevention.
63%
57%
50%56
%
54%
38%
60%
48%
39%
59%
53%
38%
57% 61
%
46%
59% 63
%
50%
I M P R O V E D P E E R P R E S S U R E R E S I S T A N C E S K I L L S
I N C R E A S E D C A R E G I V E R S U B S T A N C E U S E R U L E S A N D E X P E C T A T I O N S
I M P R O V E D C A R E G I V E R D I S C I P L I N E
2012 2013 2014 2015 2016 2017

35 | P a g e
Trauma-Focused Cognitive-Behavioral Therapy (TF-CBT)
Trauma-Focused Cognitive-Behavioral Therapy is an intervention program for moderate to high-risk children who have experienced trauma and their families. TF-CBT is designed to help 3- to 18-year-olds and their caregivers overcome the negative effects of traumatic life events such as child sexual or physical abuse. TF-CBT aims to treat serious emotional problems such as posttraumatic stress, fear, anxiety, and depression by teaching children and parents’ new skills to process thoughts and feelings resulting from traumatic events. PCCD funded six TF-CBT projects from 2015-2017
Effectiveness Ratings
1. Well-Supported, The California Evidence-Based Clearinghouse for Child Welfare 2. Effective, Crime Solutions
Proven Impacts
• Children show decreases in PTSD symptoms, behavior problems (including sexualized behavior), anxiety, and depression.15
• Caregivers show improved parenting skills, increased support to the child, and reduced levels of depression and trauma-related distress.15
PCCD Grantee Data Summary EPISCenter standardized measures have been in place for TF-CBT since 2015, data here reflects fiscal years 2016 through 2017.
Program Reach and Dosage • Six PCCD funded implementations served 448 youth during fiscal years 2016 through 2017. • The average number of youth served per implementation was 75. • 25% of youth who began treatment between 2015 and 2017 completed treatment and were clinically
discharged by their therapist.
Model Adherence • Model adherence is monitored by clinicians and
their supervisors, using the TF-CBT brief practice checklist. Meets minimum is defined as implementing all 10 TF-CBT components. The main component missed by clinicians was in-vivo desensitization which is not clinically required for all cases. The next most common component that was missed was conjoint sessions with youth and caregiver.
Figure 1 – TF-CBT Model Adherence Outcomes Measurement and Program Impacts • PCCD requires grantees to measure outcomes using standardized pre/post measures. On average 89% of
all youth who were discharged had completed pre/post measures.
15 http://www.episcenter.psu.edu/newvpp/tfcbt/research
50%
60%
70%
80%
90%
100%
2016 2017
Meets Minimum Needs Improvement

36 | P a g e
• Program impacts are measured utilizing the Child Post-traumatic Stress Symptom Scale (CPSS). This tool assesses change in overall PTSD symptoms and also the degree to which symptoms cause impairment in daily functioning for youth who are discharged from TF-CBT:
Figure 2 – TF-CBT Program Impacts
Cost Benefit Analysis For 2017 The following analysis is based on the 207 youth Served by PCCD grantees in 2017, the most recent year for which data was available.
PCCD Cost Washington State Institute of Public
Policy Benefit
Net 2017 Tax Payer Savings According to
WSIPP Model
Pennsylvania Results First Model
Benefit
Net 2017 Tax Payer Savings According to
PA RF Model $1,666
+/- $580 $21,728 $4,152,834
+/- $55,118 $19,300 $3,650,238 +/- $55,118
Successes The TF-CBT model demonstrates significant cost savings and has been well integrated into a variety of clinical settings across the Commonwealth. The model is easily sustained via billing of third-party payers, many of whom offer an enhanced rate as an incentive for implementing this evidence-based intervention.
Barriers Of the 12 TF-CBT model core components, there were two that were most commonly missed- Conjoint Parent Sessions and In vivo Mastery of Trauma Reminders. In vivo Mastery of Trauma Reminders is not required for all cases, although there is not a way to account for this within the fidelity-tracking tool. As a result, fidelity may be higher than it appears in the data shared here. Recommendations Developer: Refine Fidelity tracking tool to allow clinicians to indicate cases where In vivo Mastery is not required to improve the accuracy of fidelity data.
Providers: Identify and overcome barriers to engaging parents in conjoint sessions to improve fidelity.
Policy: Eliminate barriers to fidelity and sustainability by funding parent outreach activities via enhanced rates, and expanded service descriptions that allow for billing of non-direct service parent engagement activities.
66%
52%
54% 69
%
D e c r e a s e d O v e r a l l P T S D S y m p t o m s D e c r e a s e d I m p a i r m e n t
2016 2017

37 | P a g e
Acknowledgements
PCCD would like to thank the following individuals and groups for their assistance in providing the necessary data: • Justine Fowler, Bob Tomassini, and Rick Steele (Juvenile Court Judge’s Commission - JCJC); • Bret Bucklen and Nikki Bell (Pennsylvania Department of Corrections - DOC); • Leigh Tinik, Rhys Hester, and Mark Bergstrom (Pennsylvania Commission on Sentencing - Sentencing); • Gloria Gilligan and Jonathan Hudson (Pennsylvania Department of Human Services, Office of Children,
Youth and Families - OCYF); • Carol Kuntz (Pennsylvania Department of Education – PDE); • EPISCenter Evaluation and Implementation Specialist teams; • Pew MacArthur Results First Initiative Technical Assistance Team; • The past and present grantees of PCCD’s evidence-based programs initiatives.