Embed Size (px)
Citation preview
B u r e a u o f E n v i r o n m e n t a l S e r v i c e s • C i t y o f P o r t l a n d
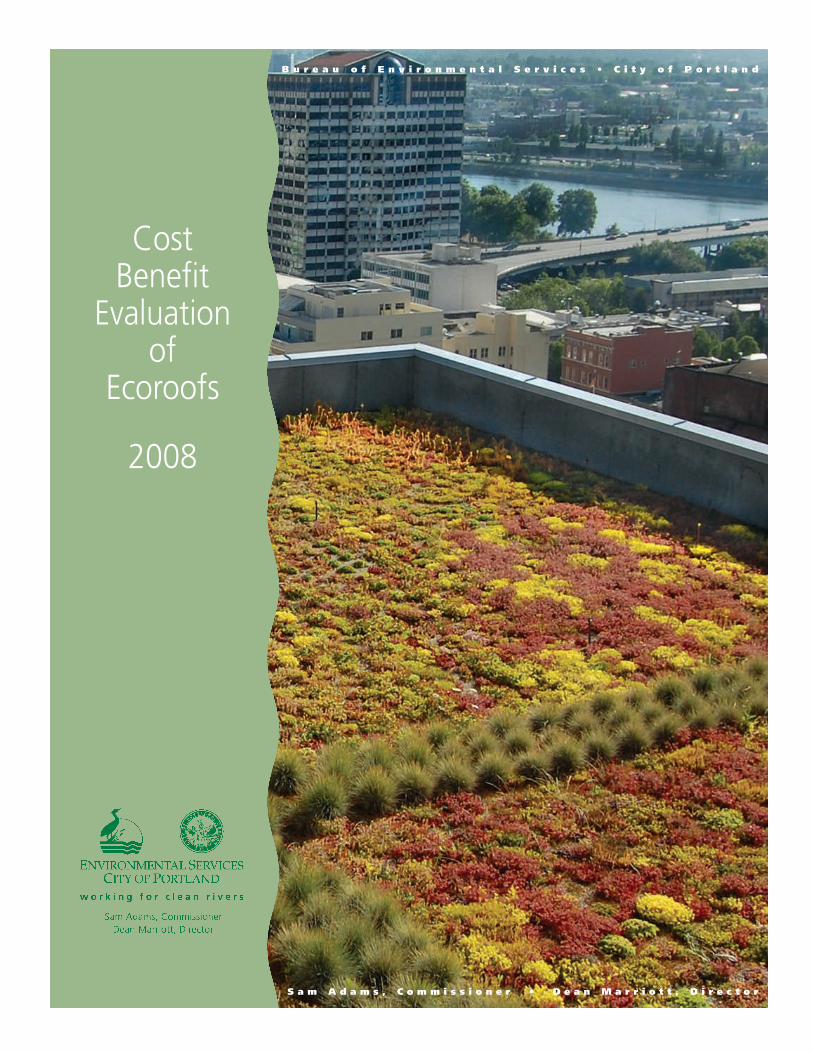
CostBenefit
Evaluationof
Ecoroofs
2008
S a m A d a m s , C o m m i s s i o n e r • D e a n M a r r i o t t , D i r e c t o r
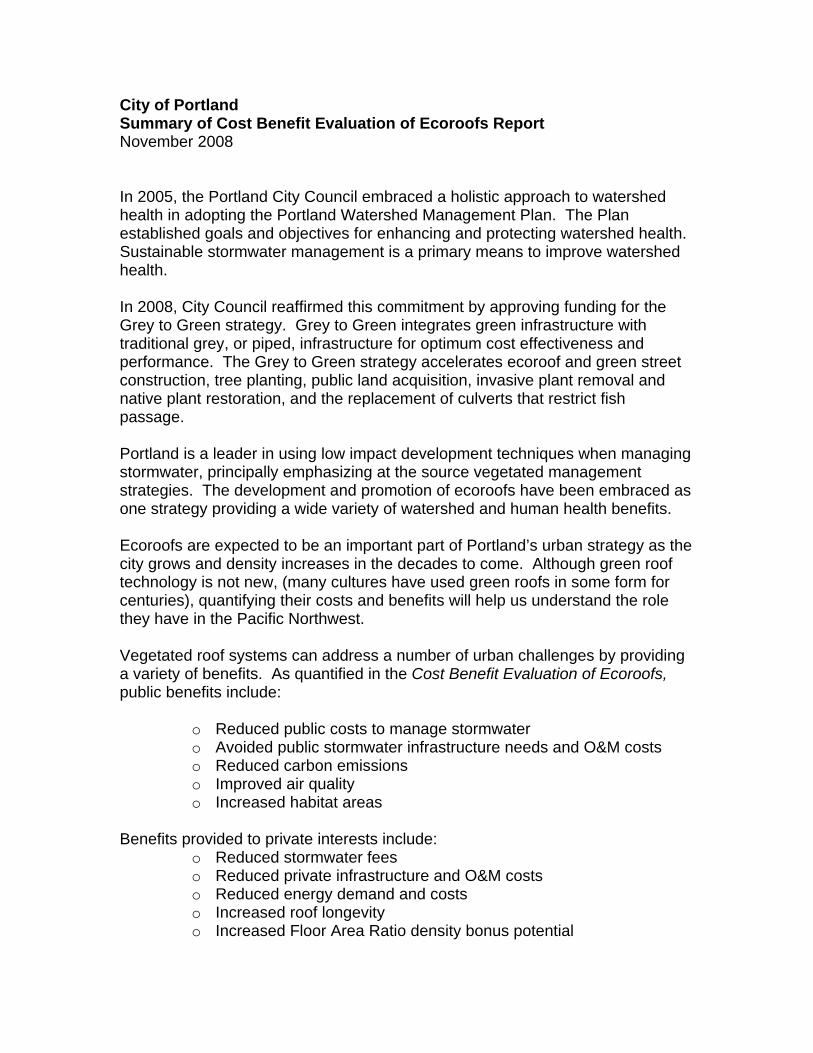
City of Portland Summary of Cost Benefit Evaluation of Ecoroofs Report November 2008 In 2005, the Portland City Council embraced a holistic approach to watershed health in adopting the Portland Watershed Management Plan. The Plan established goals and objectives for enhancing and protecting watershed health. Sustainable stormwater management is a primary means to improve watershed health. In 2008, City Council reaffirmed this commitment by approving funding for the Grey to Green strategy. Grey to Green integrates green infrastructure with traditional grey, or piped, infrastructure for optimum cost effectiveness and performance. The Grey to Green strategy accelerates ecoroof and green street construction, tree planting, public land acquisition, invasive plant removal and native plant restoration, and the replacement of culverts that restrict fish passage. Portland is a leader in using low impact development techniques when managing stormwater, principally emphasizing at the source vegetated management strategies. The development and promotion of ecoroofs have been embraced as one strategy providing a wide variety of watershed and human health benefits. Ecoroofs are expected to be an important part of Portland’s urban strategy as the city grows and density increases in the decades to come. Although green roof technology is not new, (many cultures have used green roofs in some form for centuries), quantifying their costs and benefits will help us understand the role they have in the Pacific Northwest. Vegetated roof systems can address a number of urban challenges by providing a variety of benefits. As quantified in the Cost Benefit Evaluation of Ecoroofs, public benefits include:
o Reduced public costs to manage stormwater o Avoided public stormwater infrastructure needs and O&M costs o Reduced carbon emissions o Improved air quality o Increased habitat areas
Benefits provided to private interests include:
o Reduced stormwater fees o Reduced private infrastructure and O&M costs o Reduced energy demand and costs o Increased roof longevity o Increased Floor Area Ratio density bonus potential
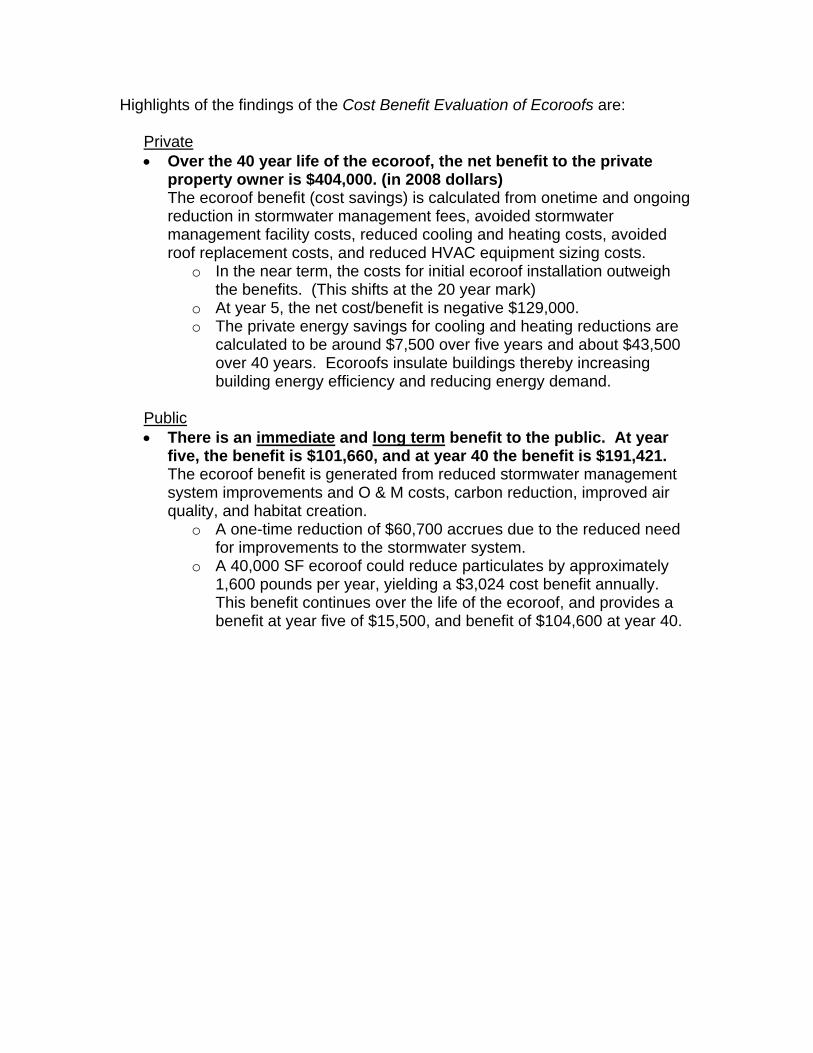
Highlights of the findings of the Cost Benefit Evaluation of Ecoroofs are:
Private • Over the 40 year life of the ecoroof, the net benefit to the private
property owner is $404,000. (in 2008 dollars) The ecoroof benefit (cost savings) is calculated from onetime and ongoing reduction in stormwater management fees, avoided stormwater management facility costs, reduced cooling and heating costs, avoided roof replacement costs, and reduced HVAC equipment sizing costs.
o In the near term, the costs for initial ecoroof installation outweigh the benefits. (This shifts at the 20 year mark)
o At year 5, the net cost/benefit is negative $129,000. o The private energy savings for cooling and heating reductions are
calculated to be around $7,500 over five years and about $43,500 over 40 years. Ecoroofs insulate buildings thereby increasing building energy efficiency and reducing energy demand.
Public • There is an immediate and long term benefit to the public. At year
five, the benefit is $101,660, and at year 40 the benefit is $191,421. The ecoroof benefit is generated from reduced stormwater management system improvements and O & M costs, carbon reduction, improved air quality, and habitat creation.
o A one-time reduction of $60,700 accrues due to the reduced need for improvements to the stormwater system.
o A 40,000 SF ecoroof could reduce particulates by approximately 1,600 pounds per year, yielding a $3,024 cost benefit annually. This benefit continues over the life of the ecoroof, and provides a benefit at year five of $15,500, and benefit of $104,600 at year 40.
City of Portland BES Sustainable Stormwater Ecoroof Evaluation
City of Portland Bureau of Environmental Services
Watershed Services
Cost Benefit Evaluation Of Ecoroofs
April 2008
Revised November 2008
Prepared for: City of Portland Bureau of Environmental Services Sustainable Stormwater Group Contact: Tom Liptan
Prepared by: David Evans and Associates, Inc. 2100 SW River Parkway Portland, OR 97201 ECONorthwest 888 SW Fifth Ave, Suite 1460 Portland, OR 97204
Cost Benefit Evaluation of Ecoroofs
City of Portland BES Sustainable Stormwater Ecoroof Evaluation
Table of Contents
1 INTRODUCTION ..................................................................................................................................... 1 1.1 EVALUATION PURPOSE................................................................................................................................1 1.2 COSTS AND BENEFITS ASSOCIATED WITH ECOROOFS..........................................................................1
1.2.1 Accrual of Costs and Benefits .................................................................................................................3 1.3 LITERATURE REVIEW OVERVIEW ...............................................................................................................3 1.4 CERTAINTY OF INFORMATION ....................................................................................................................3 1.5 EVALUATION ASSUMPTIONS .......................................................................................................................3
1.5.1 City of Portland Focus .............................................................................................................................3 1.5.2 Building Scale and Scalability of Findings ...............................................................................................4 1.5.3 Roof Description......................................................................................................................................4 1.5.4 Units of Measure .....................................................................................................................................4
2 STORMWATER MANAGEMENT AND INFRASTRUCTURE ................................................................ 5 2.1 PHYSICAL BENEFITS.....................................................................................................................................5
2.1.1 Stormwater Quantity................................................................................................................................5 2.2 ECONOMIC BENEFITS...................................................................................................................................7
2.2.1 Public Benefits ........................................................................................................................................7 2.2.2 Private Benefits .......................................................................................................................................8
3 ENERGY.................................................................................................................................................. 9 3.1 PHYSICAL BENEFITS.....................................................................................................................................9
3.1.1 Reduced Energy Demand .......................................................................................................................9 3.2 ECONOMIC BENEFITS.................................................................................................................................10
3.2.1 Private Benefits .....................................................................................................................................10
4 CLIMATE ............................................................................................................................................... 11 4.1 PHYSICAL BENEFIT.....................................................................................................................................11
4.1.1 Avoided Carbon Emissions ...................................................................................................................11 4.1.2 Improved Urban Heat Island Effect .......................................................................................................12 4.1.3 Improved Air Quality..............................................................................................................................12
4.2 ECONOMIC BENEFITS.................................................................................................................................13 4.2.1 Public Benefit ........................................................................................................................................13
5 HABITAT ............................................................................................................................................... 14 5.1 PHYSICAL BENEFITS...................................................................................................................................14
5.1.1 Habitat Creation ....................................................................................................................................14 5.2 ECONOMIC BENEFITS.................................................................................................................................14
5.2.1 Public Benefits ......................................................................................................................................15
Cost Benefit Evaluation of Ecoroofs i
City of Portland BES Sustainable Stormwater Ecoroof Evaluation
6 AMENITY VALUE.................................................................................................................................. 16 6.1 PHYSICAL BENEFITS...................................................................................................................................16
6.1.1 Amenity Value .......................................................................................................................................16 6.2 ECONOMIC BENEFITS.................................................................................................................................16
6.2.1 Private Benefits .....................................................................................................................................16
7 BUILDING DEVELOPMENT ................................................................................................................. 17 7.1 PHYSICAL COSTS........................................................................................................................................17
7.1.1 Ecoroof Construction Cost ....................................................................................................................17 7.1.2 Ecoroof Operations and Maintenance...................................................................................................18
7.2 PHYSICAL BENEFITS...................................................................................................................................18 7.2.1 Roof Longevity ......................................................................................................................................19 7.2.2 HVAC Equipment Sizing .......................................................................................................................19
7.3 ECONOMIC BENEFITS.................................................................................................................................19 7.3.1 Private Benefits .....................................................................................................................................20
7.4 DENSITY BONUS .........................................................................................................................................20
8 SUMMARY OF ECOROOF COSTS AND BENEFITS.......................................................................... 21
9 REFERENCES ...................................................................................................................................... 22
Appendix
Appendix A: Net Present Value Analysis Worksheets
Cost Benefit Evaluation of Ecoroofs ii
City of Portland BES Sustainable Stormwater Ecoroof Evaluation
Cost Benefit Evaluation of Ecoroofs iii
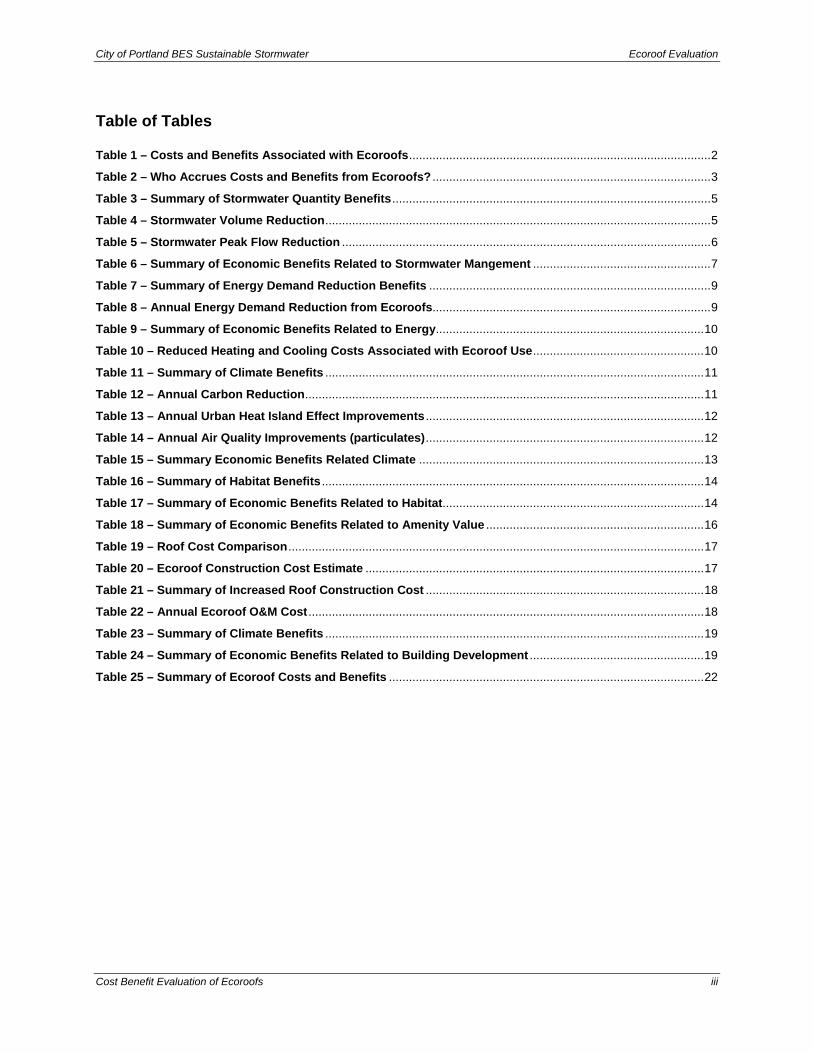
Table of Tables
Table 1 – Costs and Benefits Associated with Ecoroofs..........................................................................................2 Table 2 – Who Accrues Costs and Benefits from Ecoroofs? ...................................................................................3 Table 3 – Summary of Stormwater Quantity Benefits...............................................................................................5 Table 4 – Stormwater Volume Reduction...................................................................................................................5 Table 5 – Stormwater Peak Flow Reduction ..............................................................................................................6 Table 6 – Summary of Economic Benefits Related to Stormwater Mangement .....................................................7 Table 7 – Summary of Energy Demand Reduction Benefits ....................................................................................9 Table 8 – Annual Energy Demand Reduction from Ecoroofs...................................................................................9 Table 9 – Summary of Economic Benefits Related to Energy................................................................................10 Table 10 – Reduced Heating and Cooling Costs Associated with Ecoroof Use...................................................10 Table 11 – Summary of Climate Benefits .................................................................................................................11 Table 12 – Annual Carbon Reduction.......................................................................................................................11 Table 13 – Annual Urban Heat Island Effect Improvements ...................................................................................12 Table 14 – Annual Air Quality Improvements (particulates)...................................................................................12 Table 15 – Summary Economic Benefits Related Climate .....................................................................................13 Table 16 – Summary of Habitat Benefits ..................................................................................................................14 Table 17 – Summary of Economic Benefits Related to Habitat..............................................................................14 Table 18 – Summary of Economic Benefits Related to Amenity Value .................................................................16 Table 19 – Roof Cost Comparison............................................................................................................................17 Table 20 – Ecoroof Construction Cost Estimate .....................................................................................................17 Table 21 – Summary of Increased Roof Construction Cost ...................................................................................18 Table 22 – Annual Ecoroof O&M Cost ......................................................................................................................18 Table 23 – Summary of Climate Benefits .................................................................................................................19 Table 24 – Summary of Economic Benefits Related to Building Development ....................................................19 Table 25 – Summary of Ecoroof Costs and Benefits ..............................................................................................22
City of Portland BES Sustainable Stormwater Ecoroof Evaluation
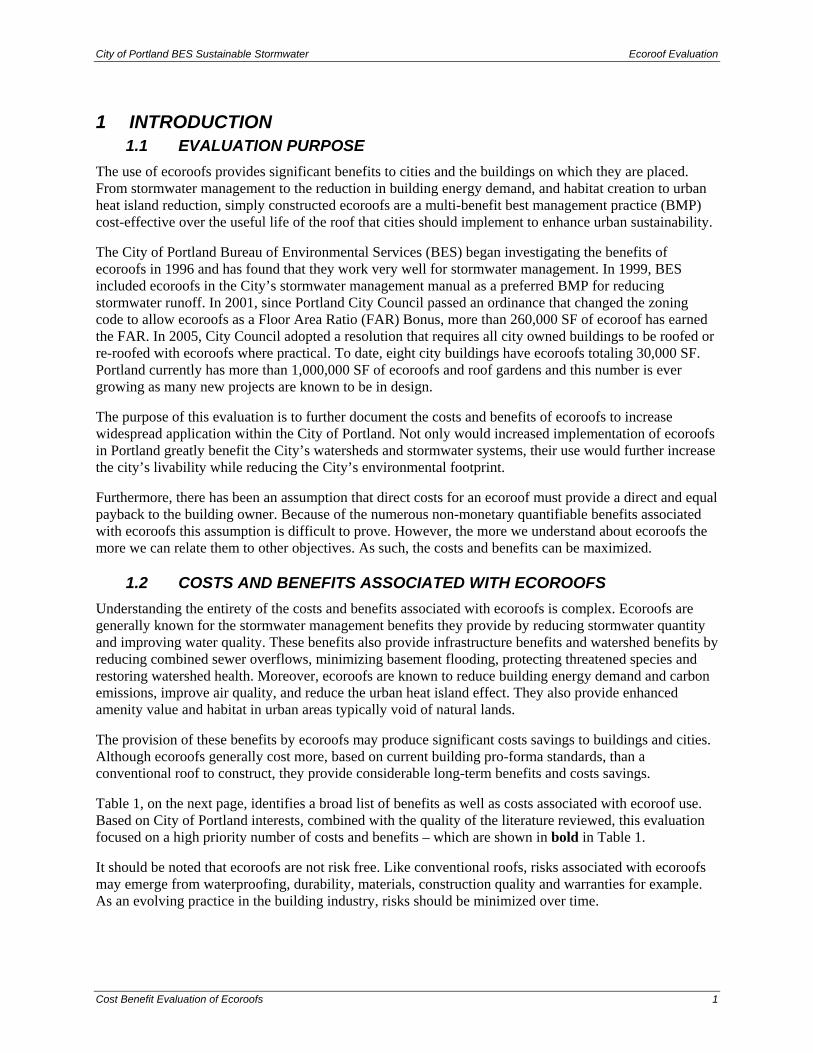
1 INTRODUCTION
1.1 EVALUATION PURPOSE The use of ecoroofs provides significant benefits to cities and the buildings on which they are placed. From stormwater management to the reduction in building energy demand, and habitat creation to urban heat island reduction, simply constructed ecoroofs are a multi-benefit best management practice (BMP) cost-effective over the useful life of the roof that cities should implement to enhance urban sustainability.
The City of Portland Bureau of Environmental Services (BES) began investigating the benefits of ecoroofs in 1996 and has found that they work very well for stormwater management. In 1999, BES included ecoroofs in the City’s stormwater management manual as a preferred BMP for reducing stormwater runoff. In 2001, since Portland City Council passed an ordinance that changed the zoning code to allow ecoroofs as a Floor Area Ratio (FAR) Bonus, more than 260,000 SF of ecoroof has earned the FAR. In 2005, City Council adopted a resolution that requires all city owned buildings to be roofed or re-roofed with ecoroofs where practical. To date, eight city buildings have ecoroofs totaling 30,000 SF. Portland currently has more than 1,000,000 SF of ecoroofs and roof gardens and this number is ever growing as many new projects are known to be in design.
The purpose of this evaluation is to further document the costs and benefits of ecoroofs to increase widespread application within the City of Portland. Not only would increased implementation of ecoroofs in Portland greatly benefit the City’s watersheds and stormwater systems, their use would further increase the city’s livability while reducing the City’s environmental footprint.
Furthermore, there has been an assumption that direct costs for an ecoroof must provide a direct and equal payback to the building owner. Because of the numerous non-monetary quantifiable benefits associated with ecoroofs this assumption is difficult to prove. However, the more we understand about ecoroofs the more we can relate them to other objectives. As such, the costs and benefits can be maximized.
1.2 COSTS AND BENEFITS ASSOCIATED WITH ECOROOFS Understanding the entirety of the costs and benefits associated with ecoroofs is complex. Ecoroofs are generally known for the stormwater management benefits they provide by reducing stormwater quantity and improving water quality. These benefits also provide infrastructure benefits and watershed benefits by reducing combined sewer overflows, minimizing basement flooding, protecting threatened species and restoring watershed health. Moreover, ecoroofs are known to reduce building energy demand and carbon emissions, improve air quality, and reduce the urban heat island effect. They also provide enhanced amenity value and habitat in urban areas typically void of natural lands.
The provision of these benefits by ecoroofs may produce significant costs savings to buildings and cities. Although ecoroofs generally cost more, based on current building pro-forma standards, than a conventional roof to construct, they provide considerable long-term benefits and costs savings.
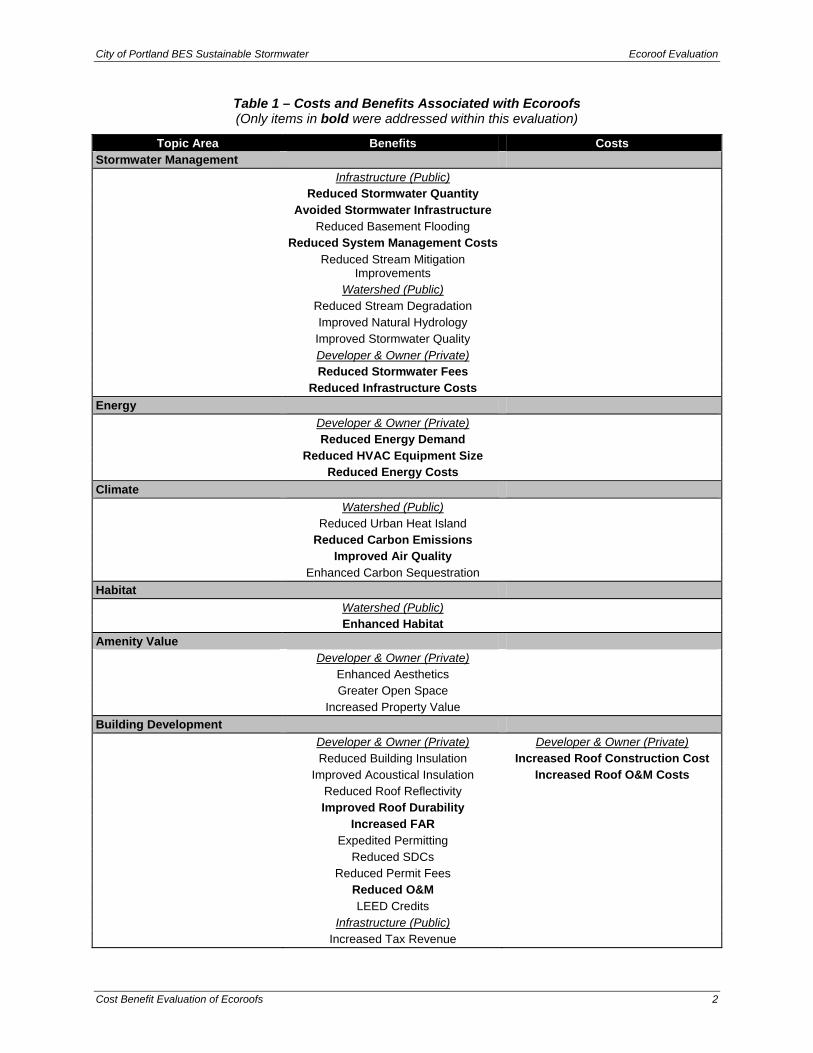
Table 1, on the next page, identifies a broad list of benefits as well as costs associated with ecoroof use. Based on City of Portland interests, combined with the quality of the literature reviewed, this evaluation focused on a high priority number of costs and benefits – which are shown in bold in Table 1.
It should be noted that ecoroofs are not risk free. Like conventional roofs, risks associated with ecoroofs may emerge from waterproofing, durability, materials, construction quality and warranties for example. As an evolving practice in the building industry, risks should be minimized over time.
Cost Benefit Evaluation of Ecoroofs 1
City of Portland BES Sustainable Stormwater Ecoroof Evaluation
Cost Benefit Evaluation of Ecoroofs 2
Table 1 – Costs and Benefits Associated with Ecoroofs (Only items in bold were addressed within this evaluation)
Topic Area Benefits Costs Stormwater Management Infrastructure (Public) Reduced Stormwater Quantity Avoided Stormwater Infrastructure Reduced Basement Flooding Reduced System Management Costs Reduced Stream Mitigation
Improvements
Watershed (Public) Reduced Stream Degradation Improved Natural Hydrology Improved Stormwater Quality Developer & Owner (Private) Reduced Stormwater Fees Reduced Infrastructure Costs Energy Developer & Owner (Private) Reduced Energy Demand Reduced HVAC Equipment Size Reduced Energy Costs Climate Watershed (Public) Reduced Urban Heat Island Reduced Carbon Emissions Improved Air Quality Enhanced Carbon Sequestration Habitat Watershed (Public) Enhanced Habitat Amenity Value Developer & Owner (Private) Enhanced Aesthetics Greater Open Space Increased Property Value Building Development Developer & Owner (Private) Developer & Owner (Private)
Reduced Building Insulation Increased Roof Construction Cost Improved Acoustical Insulation Increased Roof O&M Costs Reduced Roof Reflectivity Improved Roof Durability Increased FAR Expedited Permitting Reduced SDCs Reduced Permit Fees Reduced O&M LEED Credits Infrastructure (Public) Increased Tax Revenue
City of Portland BES Sustainable Stormwater Ecoroof Evaluation
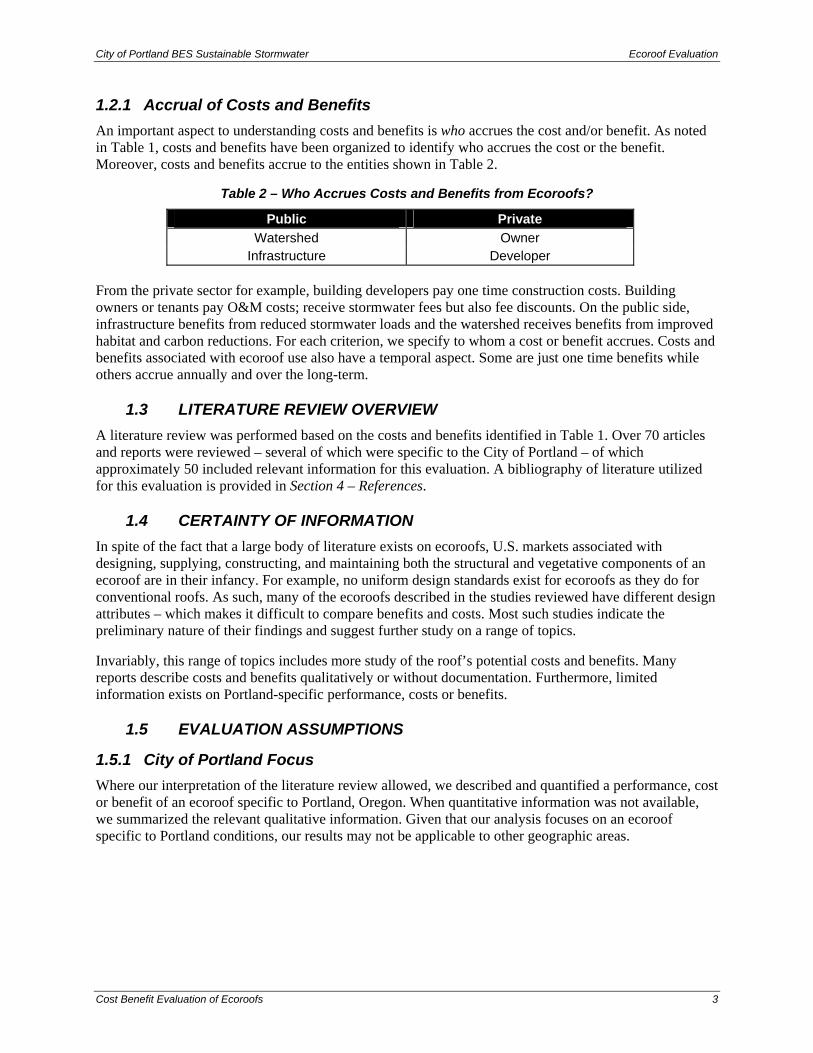
1.2.1 Accrual of Costs and Benefits An important aspect to understanding costs and benefits is who accrues the cost and/or benefit. As noted in Table 1, costs and benefits have been organized to identify who accrues the cost or the benefit. Moreover, costs and benefits accrue to the entities shown in Table 2.
Table 2 – Who Accrues Costs and Benefits from Ecoroofs?
Public Private Watershed Owner
Infrastructure Developer
From the private sector for example, building developers pay one time construction costs. Building owners or tenants pay O&M costs; receive stormwater fees but also fee discounts. On the public side, infrastructure benefits from reduced stormwater loads and the watershed receives benefits from improved habitat and carbon reductions. For each criterion, we specify to whom a cost or benefit accrues. Costs and benefits associated with ecoroof use also have a temporal aspect. Some are just one time benefits while others accrue annually and over the long-term.
1.3 LITERATURE REVIEW OVERVIEW A literature review was performed based on the costs and benefits identified in Table 1. Over 70 articles and reports were reviewed – several of which were specific to the City of Portland – of which approximately 50 included relevant information for this evaluation. A bibliography of literature utilized for this evaluation is provided in Section 4 – References.
1.4 CERTAINTY OF INFORMATION In spite of the fact that a large body of literature exists on ecoroofs, U.S. markets associated with designing, supplying, constructing, and maintaining both the structural and vegetative components of an ecoroof are in their infancy. For example, no uniform design standards exist for ecoroofs as they do for conventional roofs. As such, many of the ecoroofs described in the studies reviewed have different design attributes – which makes it difficult to compare benefits and costs. Most such studies indicate the preliminary nature of their findings and suggest further study on a range of topics.
Invariably, this range of topics includes more study of the roof’s potential costs and benefits. Many reports describe costs and benefits qualitatively or without documentation. Furthermore, limited information exists on Portland-specific performance, costs or benefits.
1.5 EVALUATION ASSUMPTIONS
1.5.1 City of Portland Focus Where our interpretation of the literature review allowed, we described and quantified a performance, cost or benefit of an ecoroof specific to Portland, Oregon. When quantitative information was not available, we summarized the relevant qualitative information. Given that our analysis focuses on an ecoroof specific to Portland conditions, our results may not be applicable to other geographic areas.
Cost Benefit Evaluation of Ecoroofs 3
City of Portland BES Sustainable Stormwater Ecoroof Evaluation
1.5.2 Building Scale and Scalability of Findings For illustrative purposes, we describe the costs and benefits for a new five-story commercial building with a 40,000 square-foot roof in downtown Portland. A 40,000 square-foot building footprint was also utilized because that is the area of a typical 200-ft by 200-ft Portland block. As such, the findings from this evaluation may be utilized for determining a general approximation of the benefits and costs associated with ecoroof implementation on a multi-block basis.
1.5.3 Roof Description The literature on ecoroofs describes “intensive” and “extensive” green roofs. Intensive green roofs have a thick growth medium and can support a wide variety of plant species including trees and large shrubs. As the name implies, an intensive green roof requires significant structural support and intensive maintenance. Intensive green roofs are also known as roof gardens. Extensive green roofs have a thinner and lightweight growing medium that supports a simpler palette of plant materials. Extensive green roofs are also known as ecoroofs, which is the preferred term in Portland.
For the purposes of this study, the team and BES defined a “basic” ecoroof that is appropriate for Portland’s climate. This includes a moisture mat, protection board, a 5-inch growing medium and gravel drainage, a simple irrigation system and a plant palette composed of sedums, grasses and wildflowers.
1.5.4 Units of Measure Because the evaluation draws from a broad source of literature, units of measure were often different. As part of this evaluation, units were normalized to account for these differences in measure and variability in the literature. Where necessary, assumptions were made to convert values of different units.
Cost Benefit Evaluation of Ecoroofs 4
City of Portland BES Sustainable Stormwater Ecoroof Evaluation
Cost Benefit Evaluation of Ecoroofs 5
2 STORMWATER MANAGEMENT AND INFRASTRUCTURE The City of Portland has invested hundreds of millions of dollars to manage stormwater and stormwater-related issues including reducing combined sewer overflows, minimizing basement flooding, protecting endangered species and restoring watershed health. Much of these expenditures fund efforts that manage stormwater volumes, reduce the magnitude and extend the duration of peak flows, and improve water quality.
2.1 PHYSICAL BENEFITS
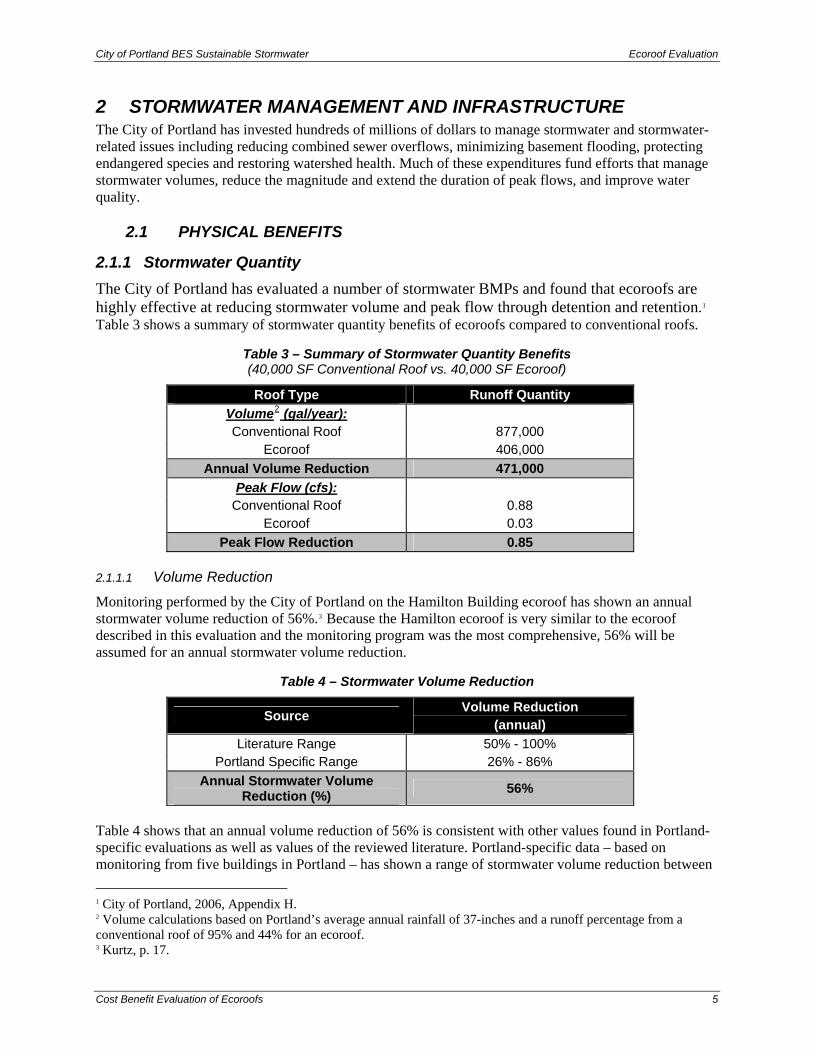
2.1.1 Stormwater Quantity The City of Portland has evaluated a number of stormwater BMPs and found that ecoroofs are highly effective at reducing stormwater volume and peak flow through detention and retention.1 Table 3 shows a summary of stormwater quantity benefits of ecoroofs compared to conventional roofs.
Table 3 – Summary of Stormwater Quantity Benefits (40,000 SF Conventional Roof vs. 40,000 SF Ecoroof)
Roof Type Runoff Quantity Volume2 (gal/year): Conventional Roof 877,000
Ecoroof 406,000 Annual Volume Reduction 471,000
Peak Flow (cfs): Conventional Roof 0.88
Ecoroof 0.03 Peak Flow Reduction 0.85
2.1.1.1 Volume Reduction
Monitoring performed by the City of Portland on the Hamilton Building ecoroof has shown an annual stormwater volume reduction of 56%.3 Because the Hamilton ecoroof is very similar to the ecoroof described in this evaluation and the monitoring program was the most comprehensive, 56% will be assumed for an annual stormwater volume reduction.
Table 4 – Stormwater Volume Reduction
Source Volume Reduction (annual)
Literature Range 50% - 100% Portland Specific Range 26% - 86%
Annual Stormwater Volume Reduction (%) 56%
Table 4 shows that an annual volume reduction of 56% is consistent with other values found in Portland-specific evaluations as well as values of the reviewed literature. Portland-specific data – based on monitoring from five buildings in Portland – has shown a range of stormwater volume reduction between 1 City of Portland, 2006, Appendix H. 2 Volume calculations based on Portland’s average annual rainfall of 37-inches and a runoff percentage from a conventional roof of 95% and 44% for an ecoroof. 3 Kurtz, p. 17.
City of Portland BES Sustainable Stormwater Ecoroof Evaluation
Cost Benefit Evaluation of Ecoroofs 6
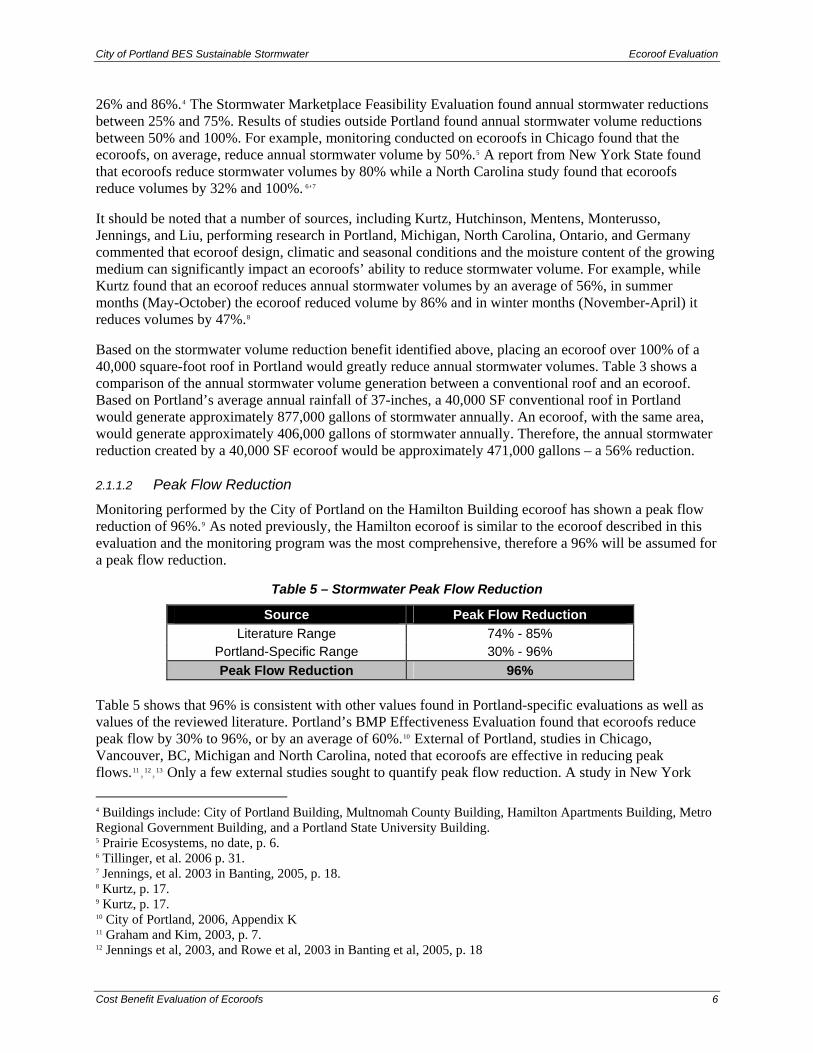
26% and 86%.4 The Stormwater Marketplace Feasibility Evaluation found annual stormwater reductions between 25% and 75%. Results of studies outside Portland found annual stormwater volume reductions between 50% and 100%. For example, monitoring conducted on ecoroofs in Chicago found that the ecoroofs, on average, reduce annual stormwater volume by 50%.5 A report from New York State found that ecoroofs reduce stormwater volumes by 80% while a North Carolina study found that ecoroofs reduce volumes by 32% and 100%. 6,7
It should be noted that a number of sources, including Kurtz, Hutchinson, Mentens, Monterusso, Jennings, and Liu, performing research in Portland, Michigan, North Carolina, Ontario, and Germany commented that ecoroof design, climatic and seasonal conditions and the moisture content of the growing medium can significantly impact an ecoroofs’ ability to reduce stormwater volume. For example, while Kurtz found that an ecoroof reduces annual stormwater volumes by an average of 56%, in summer months (May-October) the ecoroof reduced volume by 86% and in winter months (November-April) it reduces volumes by 47%.8
Based on the stormwater volume reduction benefit identified above, placing an ecoroof over 100% of a 40,000 square-foot roof in Portland would greatly reduce annual stormwater volumes. Table 3 shows a comparison of the annual stormwater volume generation between a conventional roof and an ecoroof. Based on Portland’s average annual rainfall of 37-inches, a 40,000 SF conventional roof in Portland would generate approximately 877,000 gallons of stormwater annually. An ecoroof, with the same area, would generate approximately 406,000 gallons of stormwater annually. Therefore, the annual stormwater reduction created by a 40,000 SF ecoroof would be approximately 471,000 gallons – a 56% reduction.
2.1.1.2 Peak Flow Reduction
Monitoring performed by the City of Portland on the Hamilton Building ecoroof has shown a peak flow reduction of 96%.9 As noted previously, the Hamilton ecoroof is similar to the ecoroof described in this evaluation and the monitoring program was the most comprehensive, therefore a 96% will be assumed for a peak flow reduction.
Table 5 – Stormwater Peak Flow Reduction
Source Peak Flow Reduction Literature Range 74% - 85%
Portland-Specific Range 30% - 96% Peak Flow Reduction 96%
Table 5 shows that 96% is consistent with other values found in Portland-specific evaluations as well as values of the reviewed literature. Portland’s BMP Effectiveness Evaluation found that ecoroofs reduce peak flow by 30% to 96%, or by an average of 60%.10 External of Portland, studies in Chicago, Vancouver, BC, Michigan and North Carolina, noted that ecoroofs are effective in reducing peak flows.11,12,13 Only a few external studies sought to quantify peak flow reduction. A study in New York 4 Buildings include: City of Portland Building, Multnomah County Building, Hamilton Apartments Building, Metro Regional Government Building, and a Portland State University Building. 5 Prairie Ecosystems, no date, p. 6. 6 Tillinger, et al. 2006 p. 31. 7 Jennings, et al. 2003 in Banting, 2005, p. 18. 8 Kurtz, p. 17. 9 Kurtz, p. 17. 10 City of Portland, 2006, Appendix K 11 Graham and Kim, 2003, p. 7. 12 Jennings et al, 2003, and Rowe et al, 2003 in Banting et al, 2005, p. 18
City of Portland BES Sustainable Stormwater Ecoroof Evaluation
Cost Benefit Evaluation of Ecoroofs 7
found that ecoroofs could reduce peak flow by approximately 74%14 while a North Carolina study found a peak flow reduction of 85%.15
Based on the peak flow reduction benefit identified above, placing an ecoroof over 100% of a 40,000 square-foot roof in Portland would greatly reduce peak flows. Table 3 shows a comparison of the peak flow generation between a conventional roof and an ecoroof for a Portland specific 25-year event (3.9 inches over 24 hours) based on Santa Barbara Urban Hydrograph methodology. For a 25-year event, a 40,000 SF conventional roof would generate a peak flow of 0.88 cfs. An ecoroof, with the same 40,000 SF area, would generate a peak flow of 0.03 cfs, reducing peak flow from a conventional roof by 0.85 cfs – a 96% reduction.
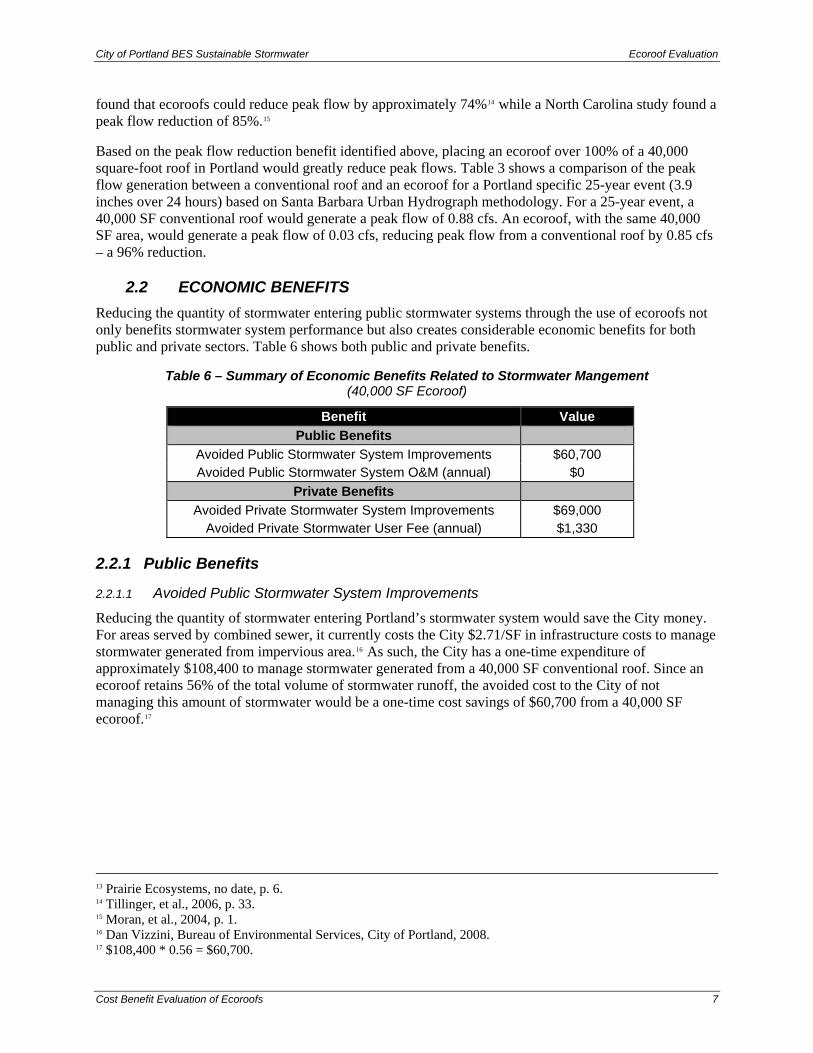
2.2 ECONOMIC BENEFITS Reducing the quantity of stormwater entering public stormwater systems through the use of ecoroofs not only benefits stormwater system performance but also creates considerable economic benefits for both public and private sectors. Table 6 shows both public and private benefits.
Table 6 – Summary of Economic Benefits Related to Stormwater Mangement (40,000 SF Ecoroof)
Benefit Value Public Benefits
Avoided Public Stormwater System Improvements $60,700 Avoided Public Stormwater System O&M (annual) $0
Private Benefits Avoided Private Stormwater System Improvements $69,000
Avoided Private Stormwater User Fee (annual) $1,330
2.2.1 Public Benefits
2.2.1.1 Avoided Public Stormwater System Improvements
Reducing the quantity of stormwater entering Portland’s stormwater system would save the City money. For areas served by combined sewer, it currently costs the City $2.71/SF in infrastructure costs to manage stormwater generated from impervious area.16 As such, the City has a one-time expenditure of approximately $108,400 to manage stormwater generated from a 40,000 SF conventional roof. Since an ecoroof retains 56% of the total volume of stormwater runoff, the avoided cost to the City of not managing this amount of stormwater would be a one-time cost savings of $60,700 from a 40,000 SF ecoroof.17
13 Prairie Ecosystems, no date, p. 6. 14 Tillinger, et al., 2006, p. 33. 15 Moran, et al., 2004, p. 1. 16 Dan Vizzini, Bureau of Environmental Services, City of Portland, 2008. 17 $108,400 * 0.56 = $60,700.
City of Portland BES Sustainable Stormwater Ecoroof Evaluation
Cost Benefit Evaluation of Ecoroofs 8
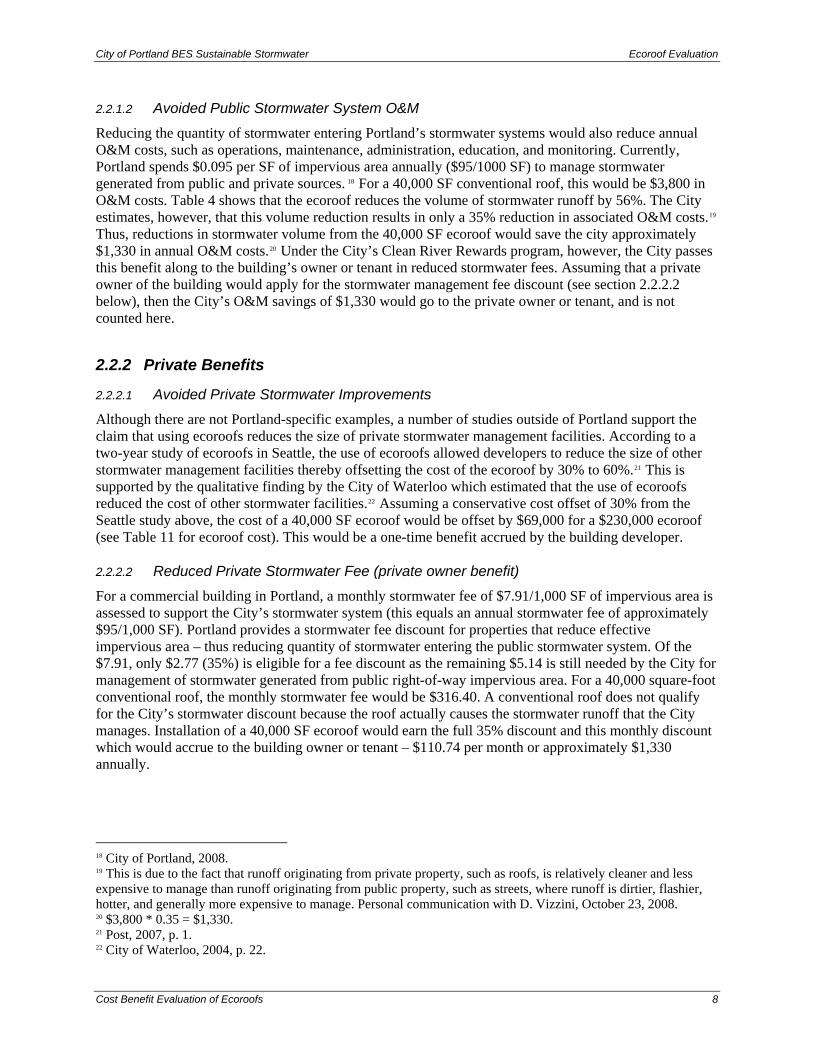
2.2.1.2 Avoided Public Stormwater System O&M
Reducing the quantity of stormwater entering Portland’s stormwater systems would also reduce annual O&M costs, such as operations, maintenance, administration, education, and monitoring. Currently, Portland spends $0.095 per SF of impervious area annually ($95/1000 SF) to manage stormwater generated from public and private sources. 18 For a 40,000 SF conventional roof, this would be $3,800 in O&M costs. Table 4 shows that the ecoroof reduces the volume of stormwater runoff by 56%. The City estimates, however, that this volume reduction results in only a 35% reduction in associated O&M costs.19 Thus, reductions in stormwater volume from the 40,000 SF ecoroof would save the city approximately $1,330 in annual O&M costs.20 Under the City’s Clean River Rewards program, however, the City passes this benefit along to the building’s owner or tenant in reduced stormwater fees. Assuming that a private owner of the building would apply for the stormwater management fee discount (see section 2.2.2.2 below), then the City’s O&M savings of $1,330 would go to the private owner or tenant, and is not counted here.
2.2.2 Private Benefits
2.2.2.1 Avoided Private Stormwater Improvements
Although there are not Portland-specific examples, a number of studies outside of Portland support the claim that using ecoroofs reduces the size of private stormwater management facilities. According to a two-year study of ecoroofs in Seattle, the use of ecoroofs allowed developers to reduce the size of other stormwater management facilities thereby offsetting the cost of the ecoroof by 30% to 60%.21 This is supported by the qualitative finding by the City of Waterloo which estimated that the use of ecoroofs reduced the cost of other stormwater facilities.22 Assuming a conservative cost offset of 30% from the Seattle study above, the cost of a 40,000 SF ecoroof would be offset by $69,000 for a $230,000 ecoroof (see Table 11 for ecoroof cost). This would be a one-time benefit accrued by the building developer.
2.2.2.2 Reduced Private Stormwater Fee (private owner benefit)
For a commercial building in Portland, a monthly stormwater fee of $7.91/1,000 SF of impervious area is assessed to support the City’s stormwater system (this equals an annual stormwater fee of approximately $95/1,000 SF). Portland provides a stormwater fee discount for properties that reduce effective impervious area – thus reducing quantity of stormwater entering the public stormwater system. Of the $7.91, only $2.77 (35%) is eligible for a fee discount as the remaining $5.14 is still needed by the City for management of stormwater generated from public right-of-way impervious area. For a 40,000 square-foot conventional roof, the monthly stormwater fee would be $316.40. A conventional roof does not qualify for the City’s stormwater discount because the roof actually causes the stormwater runoff that the City manages. Installation of a 40,000 SF ecoroof would earn the full 35% discount and this monthly discount which would accrue to the building owner or tenant – $110.74 per month or approximately $1,330 annually.
18 City of Portland, 2008. 19 This is due to the fact that runoff originating from private property, such as roofs, is relatively cleaner and less expensive to manage than runoff originating from public property, such as streets, where runoff is dirtier, flashier, hotter, and generally more expensive to manage. Personal communication with D. Vizzini, October 23, 2008. 20 $3,800 * 0.35 = $1,330. 21 Post, 2007, p. 1. 22 City of Waterloo, 2004, p. 22.
City of Portland BES Sustainable Stormwater Ecoroof Evaluation
Cost Benefit Evaluation of Ecoroofs 9
3 ENERGY Ecoroofs provide energy benefits for buildings by reducing building energy demand. The insulative properties of an ecoroof reduce energy demand for both heating and cooling. This reduced energy demand also reduces building energy costs.
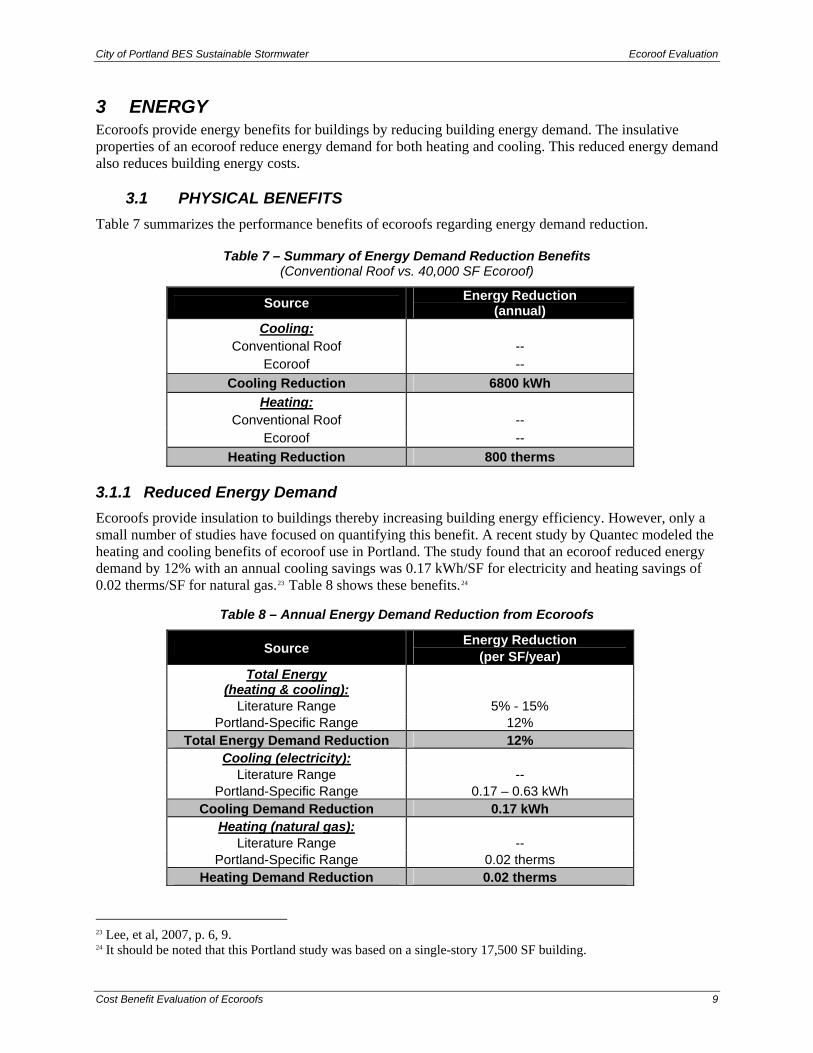
3.1 PHYSICAL BENEFITS Table 7 summarizes the performance benefits of ecoroofs regarding energy demand reduction.
Table 7 – Summary of Energy Demand Reduction Benefits (Conventional Roof vs. 40,000 SF Ecoroof)
Source Energy Reduction (annual)
Cooling: Conventional Roof --
Ecoroof -- Cooling Reduction 6800 kWh
Heating: Conventional Roof --
Ecoroof -- Heating Reduction 800 therms
3.1.1 Reduced Energy Demand Ecoroofs provide insulation to buildings thereby increasing building energy efficiency. However, only a small number of studies have focused on quantifying this benefit. A recent study by Quantec modeled the heating and cooling benefits of ecoroof use in Portland. The study found that an ecoroof reduced energy demand by 12% with an annual cooling savings was 0.17 kWh/SF for electricity and heating savings of 0.02 therms/SF for natural gas.23 Table 8 shows these benefits.24
Table 8 – Annual Energy Demand Reduction from Ecoroofs
Source Energy Reduction (per SF/year)
Total Energy (heating & cooling):
Literature Range 5% - 15% Portland-Specific Range 12%
Total Energy Demand Reduction 12% Cooling (electricity):
Literature Range -- Portland-Specific Range 0.17 – 0.63 kWh
Cooling Demand Reduction 0.17 kWh Heating (natural gas):
Literature Range -- Portland-Specific Range 0.02 therms
Heating Demand Reduction 0.02 therms
23 Lee, et al, 2007, p. 6, 9. 24 It should be noted that this Portland study was based on a single-story 17,500 SF building.
City of Portland BES Sustainable Stormwater Ecoroof Evaluation
Cost Benefit Evaluation of Ecoroofs 10
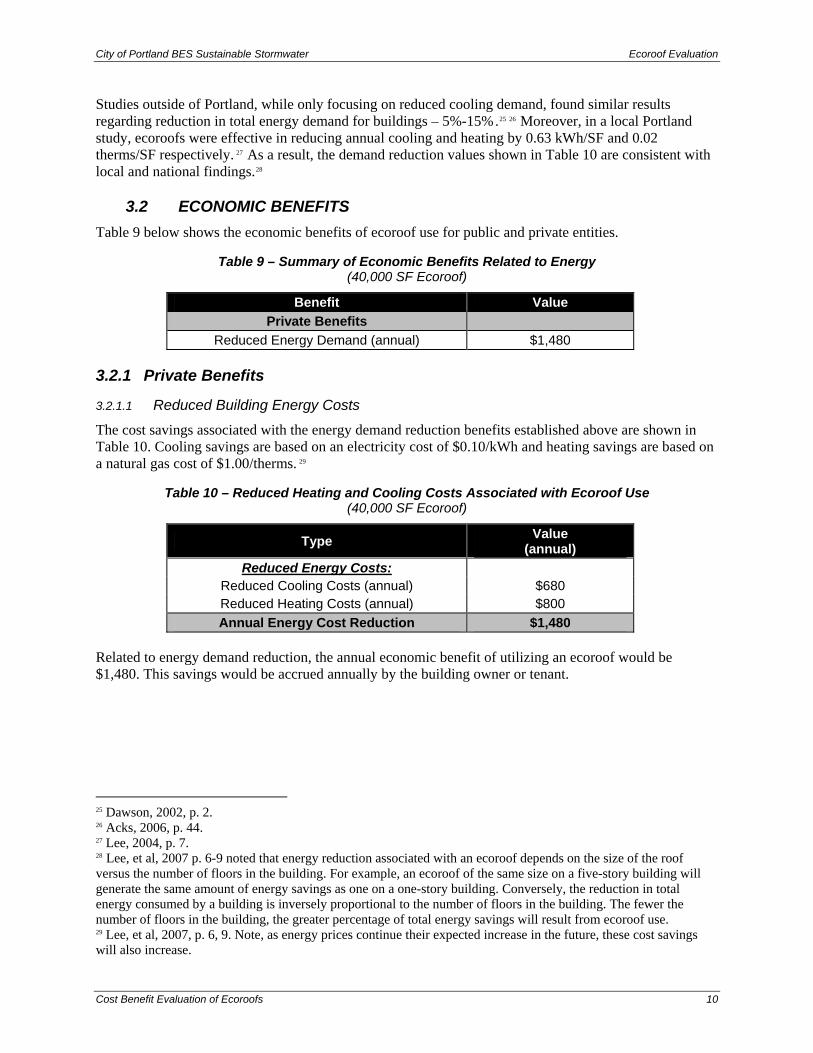
Studies outside of Portland, while only focusing on reduced cooling demand, found similar results regarding reduction in total energy demand for buildings – 5%-15% .25 26 Moreover, in a local Portland study, ecoroofs were effective in reducing annual cooling and heating by 0.63 kWh/SF and 0.02 therms/SF respectively. 27 As a result, the demand reduction values shown in Table 10 are consistent with local and national findings.28
3.2 ECONOMIC BENEFITS Table 9 below shows the economic benefits of ecoroof use for public and private entities.
Table 9 – Summary of Economic Benefits Related to Energy (40,000 SF Ecoroof)
Benefit Value Private Benefits
Reduced Energy Demand (annual) $1,480
3.2.1 Private Benefits
3.2.1.1 Reduced Building Energy Costs
The cost savings associated with the energy demand reduction benefits established above are shown in Table 10. Cooling savings are based on an electricity cost of $0.10/kWh and heating savings are based on a natural gas cost of $1.00/therms. 29
Table 10 – Reduced Heating and Cooling Costs Associated with Ecoroof Use (40,000 SF Ecoroof)
Type Value (annual)
Reduced Energy Costs: Reduced Cooling Costs (annual) $680 Reduced Heating Costs (annual) $800 Annual Energy Cost Reduction $1,480
Related to energy demand reduction, the annual economic benefit of utilizing an ecoroof would be $1,480. This savings would be accrued annually by the building owner or tenant.
25 Dawson, 2002, p. 2. 26 Acks, 2006, p. 44. 27 Lee, 2004, p. 7. 28 Lee, et al, 2007 p. 6-9 noted that energy reduction associated with an ecoroof depends on the size of the roof versus the number of floors in the building. For example, an ecoroof of the same size on a five-story building will generate the same amount of energy savings as one on a one-story building. Conversely, the reduction in total energy consumed by a building is inversely proportional to the number of floors in the building. The fewer the number of floors in the building, the greater percentage of total energy savings will result from ecoroof use. 29 Lee, et al, 2007, p. 6, 9. Note, as energy prices continue their expected increase in the future, these cost savings will also increase.
City of Portland BES Sustainable Stormwater Ecoroof Evaluation
Cost Benefit Evaluation of Ecoroofs 11
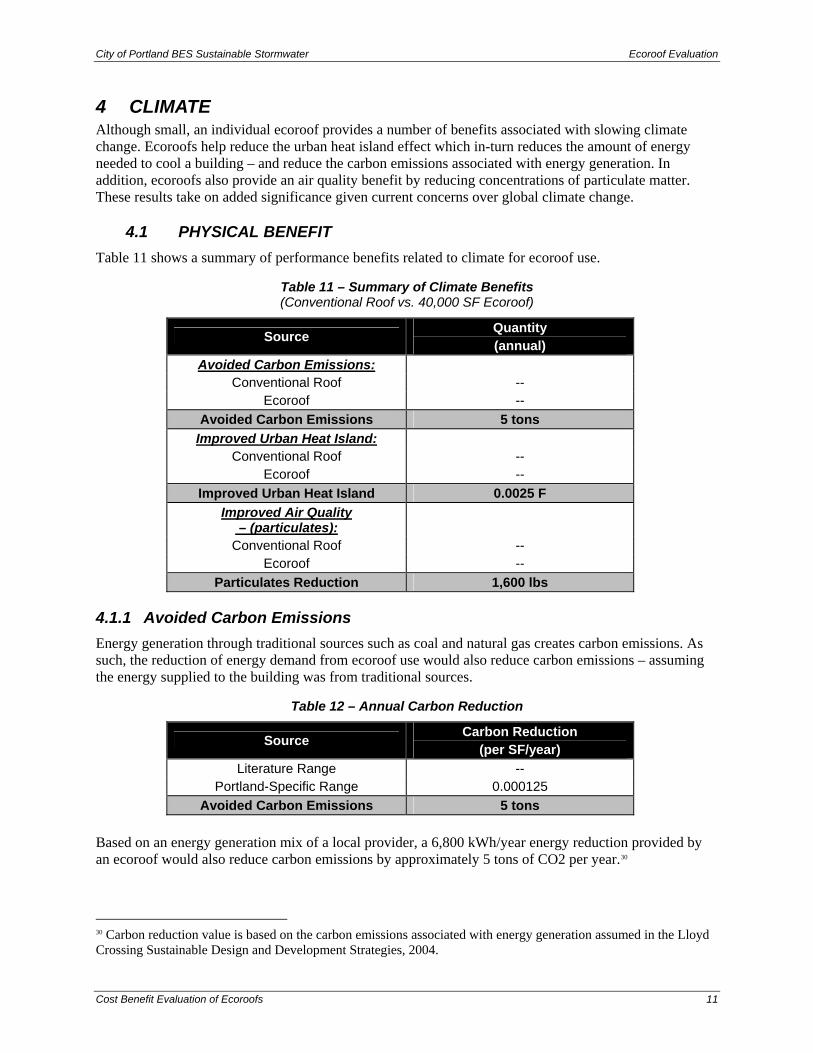
4 CLIMATE Although small, an individual ecoroof provides a number of benefits associated with slowing climate change. Ecoroofs help reduce the urban heat island effect which in-turn reduces the amount of energy needed to cool a building – and reduce the carbon emissions associated with energy generation. In addition, ecoroofs also provide an air quality benefit by reducing concentrations of particulate matter. These results take on added significance given current concerns over global climate change.
4.1 PHYSICAL BENEFIT Table 11 shows a summary of performance benefits related to climate for ecoroof use.
Table 11 – Summary of Climate Benefits (Conventional Roof vs. 40,000 SF Ecoroof)
Source Quantity (annual)
Avoided Carbon Emissions: Conventional Roof --
Ecoroof -- Avoided Carbon Emissions 5 tons
Improved Urban Heat Island: Conventional Roof --
Ecoroof -- Improved Urban Heat Island 0.0025 F
Improved Air Quality – (particulates):
Conventional Roof -- Ecoroof --
Particulates Reduction 1,600 lbs
4.1.1 Avoided Carbon Emissions Energy generation through traditional sources such as coal and natural gas creates carbon emissions. As such, the reduction of energy demand from ecoroof use would also reduce carbon emissions – assuming the energy supplied to the building was from traditional sources.
Table 12 – Annual Carbon Reduction
Source Carbon Reduction (per SF/year)
Literature Range -- Portland-Specific Range 0.000125
Avoided Carbon Emissions 5 tons Based on an energy generation mix of a local provider, a 6,800 kWh/year energy reduction provided by an ecoroof would also reduce carbon emissions by approximately 5 tons of CO2 per year.30
30 Carbon reduction value is based on the carbon emissions associated with energy generation assumed in the Lloyd Crossing Sustainable Design and Development Strategies, 2004.
City of Portland BES Sustainable Stormwater Ecoroof Evaluation
Cost Benefit Evaluation of Ecoroofs 12
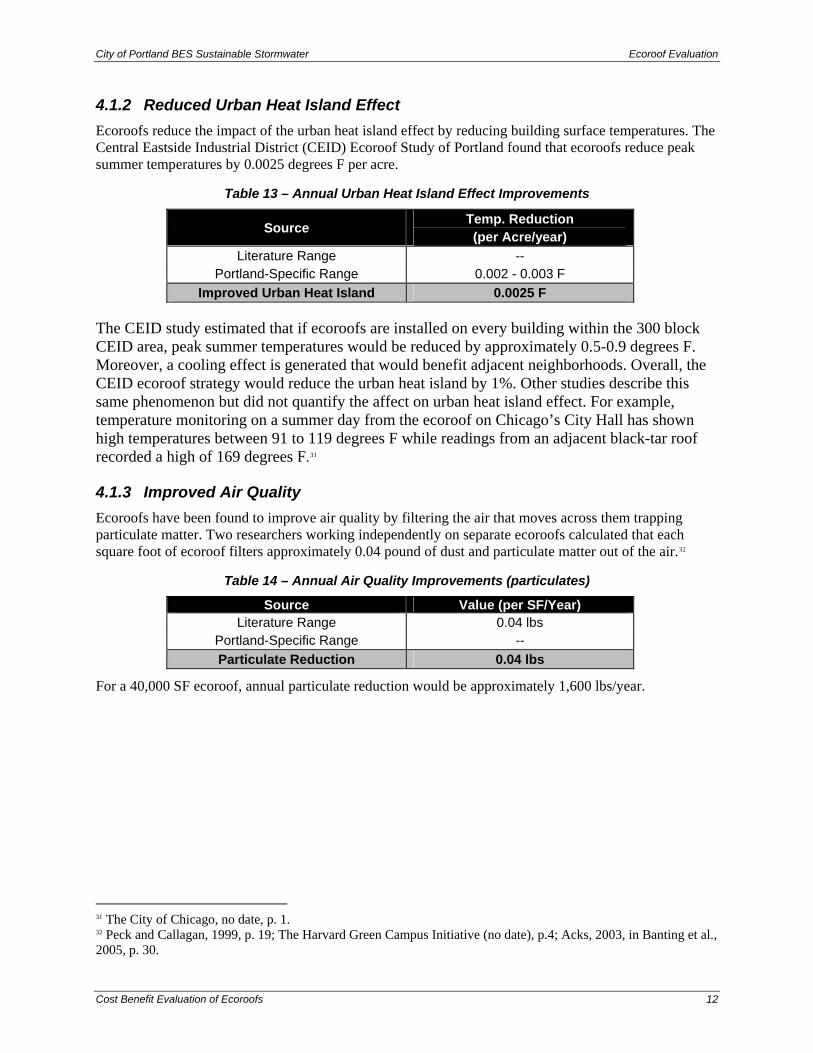
4.1.2 Reduced Urban Heat Island Effect Ecoroofs reduce the impact of the urban heat island effect by reducing building surface temperatures. The Central Eastside Industrial District (CEID) Ecoroof Study of Portland found that ecoroofs reduce peak summer temperatures by 0.0025 degrees F per acre.
Table 13 – Annual Urban Heat Island Effect Improvements
Source Temp. Reduction (per Acre/year)
Literature Range -- Portland-Specific Range 0.002 - 0.003 F
Improved Urban Heat Island 0.0025 F
The CEID study estimated that if ecoroofs are installed on every building within the 300 block CEID area, peak summer temperatures would be reduced by approximately 0.5-0.9 degrees F. Moreover, a cooling effect is generated that would benefit adjacent neighborhoods. Overall, the CEID ecoroof strategy would reduce the urban heat island by 1%. Other studies describe this same phenomenon but did not quantify the affect on urban heat island effect. For example, temperature monitoring on a summer day from the ecoroof on Chicago’s City Hall has shown high temperatures between 91 to 119 degrees F while readings from an adjacent black-tar roof recorded a high of 169 degrees F.31
4.1.3 Improved Air Quality Ecoroofs have been found to improve air quality by filtering the air that moves across them trapping particulate matter. Two researchers working independently on separate ecoroofs calculated that each square foot of ecoroof filters approximately 0.04 pound of dust and particulate matter out of the air.32
Table 14 – Annual Air Quality Improvements (particulates)
Source Value (per SF/Year) Literature Range 0.04 lbs
Portland-Specific Range -- Particulate Reduction 0.04 lbs
For a 40,000 SF ecoroof, annual particulate reduction would be approximately 1,600 lbs/year.
31 The City of Chicago, no date, p. 1. 32 Peck and Callagan, 1999, p. 19; The Harvard Green Campus Initiative (no date), p.4; Acks, 2003, in Banting et al., 2005, p. 30.
City of Portland BES Sustainable Stormwater Ecoroof Evaluation
Cost Benefit Evaluation of Ecoroofs 13
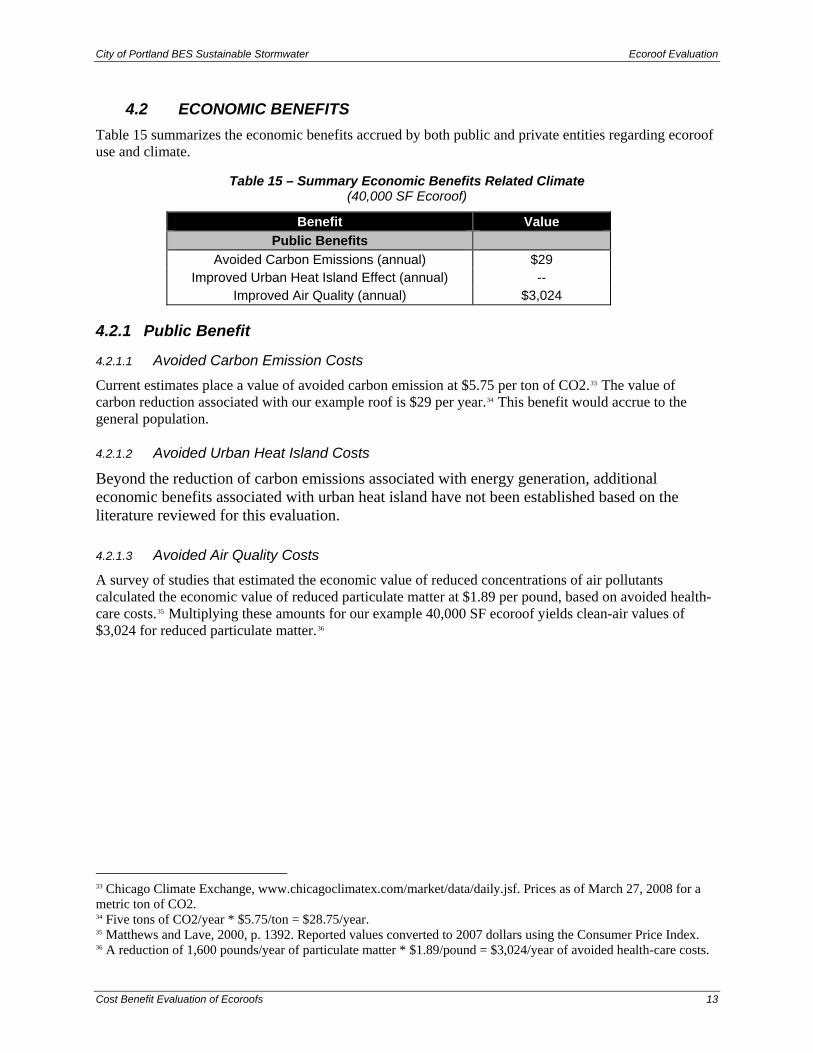
4.2 ECONOMIC BENEFITS Table 15 summarizes the economic benefits accrued by both public and private entities regarding ecoroof use and climate.
Table 15 – Summary Economic Benefits Related Climate (40,000 SF Ecoroof)
Benefit Value Public Benefits
Avoided Carbon Emissions (annual) $29 Improved Urban Heat Island Effect (annual) --
Improved Air Quality (annual) $3,024
4.2.1 Public Benefit
4.2.1.1 Avoided Carbon Emission Costs
Current estimates place a value of avoided carbon emission at $5.75 per ton of CO2.33 The value of carbon reduction associated with our example roof is $29 per year.34 This benefit would accrue to the general population.
4.2.1.2 Avoided Urban Heat Island Costs
Beyond the reduction of carbon emissions associated with energy generation, additional economic benefits associated with urban heat island have not been established based on the literature reviewed for this evaluation. 4.2.1.3 Avoided Air Quality Costs
A survey of studies that estimated the economic value of reduced concentrations of air pollutants calculated the economic value of reduced particulate matter at $1.89 per pound, based on avoided health-care costs.35 Multiplying these amounts for our example 40,000 SF ecoroof yields clean-air values of $3,024 for reduced particulate matter.36
33 Chicago Climate Exchange, www.chicagoclimatex.com/market/data/daily.jsf. Prices as of March 27, 2008 for a metric ton of CO2. 34 Five tons of CO2/year * $5.75/ton = $28.75/year. 35 Matthews and Lave, 2000, p. 1392. Reported values converted to 2007 dollars using the Consumer Price Index. 36 A reduction of 1,600 pounds/year of particulate matter * $1.89/pound = $3,024/year of avoided health-care costs.
City of Portland BES Sustainable Stormwater Ecoroof Evaluation
Cost Benefit Evaluation of Ecoroofs 14
5 HABITAT 5.1 PHYSICAL BENEFITS
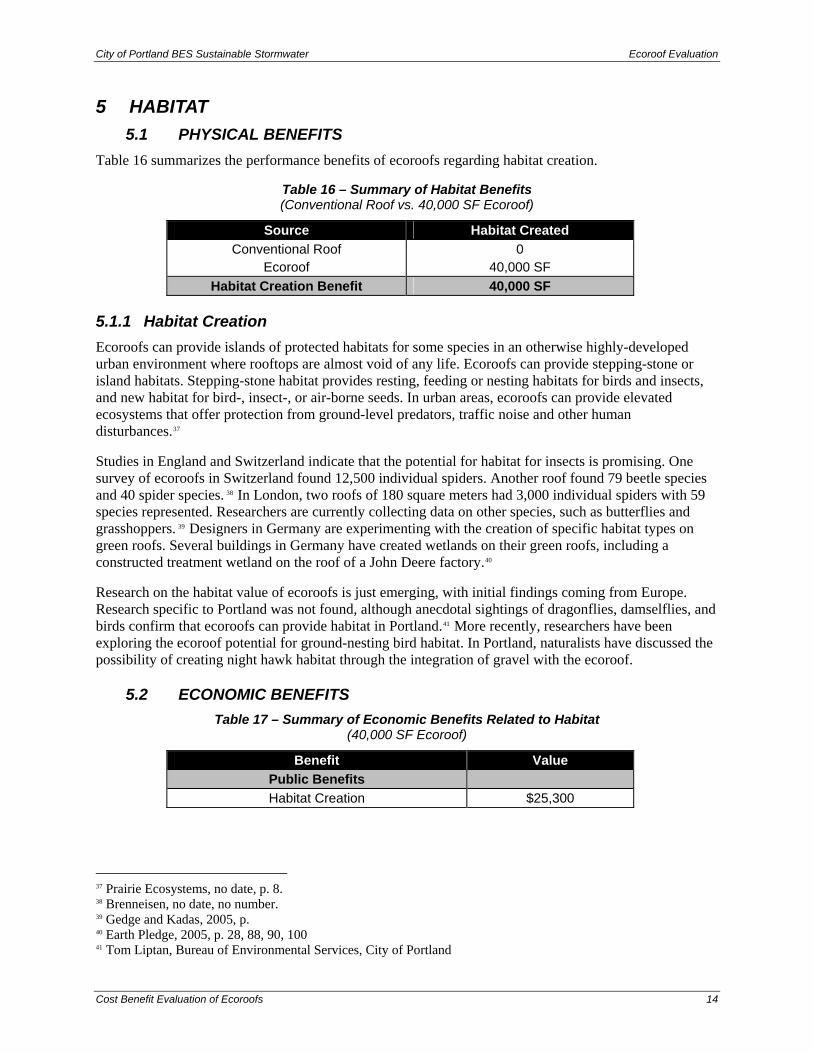
Table 16 summarizes the performance benefits of ecoroofs regarding habitat creation.
Table 16 – Summary of Habitat Benefits (Conventional Roof vs. 40,000 SF Ecoroof)
Source Habitat Created Conventional Roof 0
Ecoroof 40,000 SF Habitat Creation Benefit 40,000 SF
5.1.1 Habitat Creation Ecoroofs can provide islands of protected habitats for some species in an otherwise highly-developed urban environment where rooftops are almost void of any life. Ecoroofs can provide stepping-stone or island habitats. Stepping-stone habitat provides resting, feeding or nesting habitats for birds and insects, and new habitat for bird-, insect-, or air-borne seeds. In urban areas, ecoroofs can provide elevated ecosystems that offer protection from ground-level predators, traffic noise and other human disturbances.37
Studies in England and Switzerland indicate that the potential for habitat for insects is promising. One survey of ecoroofs in Switzerland found 12,500 individual spiders. Another roof found 79 beetle species and 40 spider species. 38 In London, two roofs of 180 square meters had 3,000 individual spiders with 59 species represented. Researchers are currently collecting data on other species, such as butterflies and grasshoppers. 39 Designers in Germany are experimenting with the creation of specific habitat types on green roofs. Several buildings in Germany have created wetlands on their green roofs, including a constructed treatment wetland on the roof of a John Deere factory.40
Research on the habitat value of ecoroofs is just emerging, with initial findings coming from Europe. Research specific to Portland was not found, although anecdotal sightings of dragonflies, damselflies, and birds confirm that ecoroofs can provide habitat in Portland.41 More recently, researchers have been exploring the ecoroof potential for ground-nesting bird habitat. In Portland, naturalists have discussed the possibility of creating night hawk habitat through the integration of gravel with the ecoroof.
5.2 ECONOMIC BENEFITS Table 17 – Summary of Economic Benefits Related to Habitat
(40,000 SF Ecoroof)
Benefit Value Public Benefits Habitat Creation $25,300
37 Prairie Ecosystems, no date, p. 8. 38 Brenneisen, no date, no number. 39 Gedge and Kadas, 2005, p. 40 Earth Pledge, 2005, p. 28, 88, 90, 100 41 Tom Liptan, Bureau of Environmental Services, City of Portland
City of Portland BES Sustainable Stormwater Ecoroof Evaluation
Cost Benefit Evaluation of Ecoroofs 15
5.2.1 Public Benefits
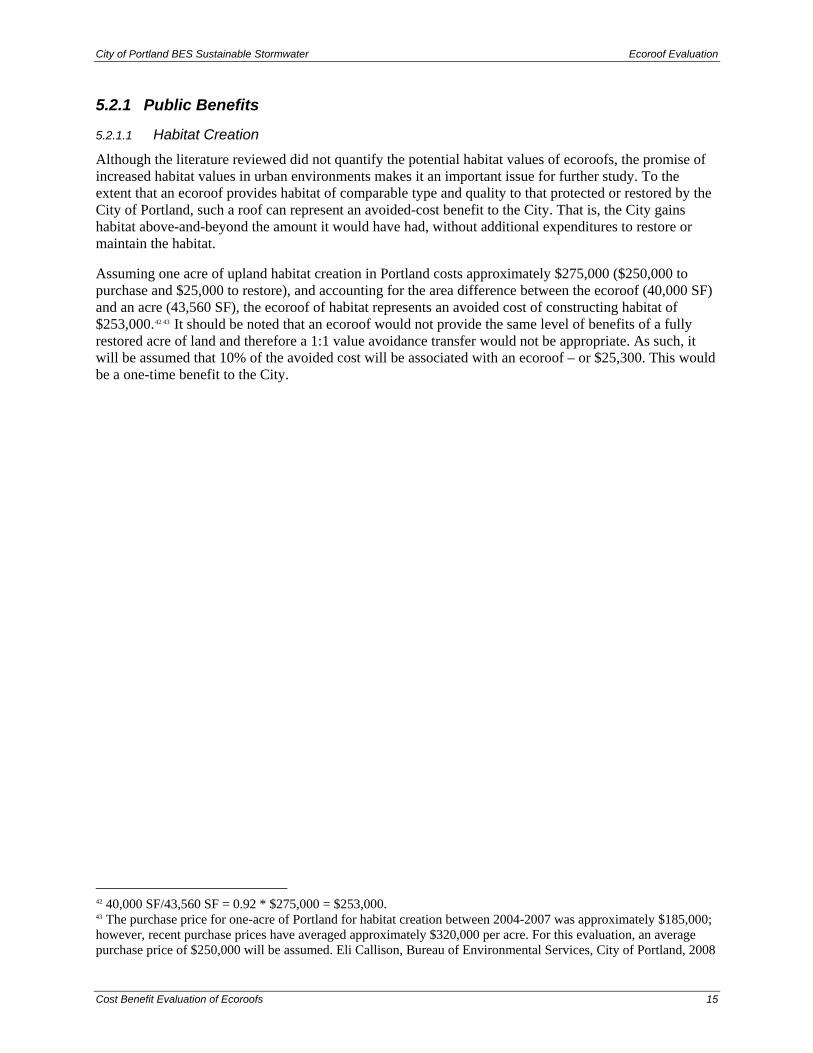
5.2.1.1 Habitat Creation
Although the literature reviewed did not quantify the potential habitat values of ecoroofs, the promise of increased habitat values in urban environments makes it an important issue for further study. To the extent that an ecoroof provides habitat of comparable type and quality to that protected or restored by the City of Portland, such a roof can represent an avoided-cost benefit to the City. That is, the City gains habitat above-and-beyond the amount it would have had, without additional expenditures to restore or maintain the habitat.
Assuming one acre of upland habitat creation in Portland costs approximately $275,000 ($250,000 to purchase and $25,000 to restore), and accounting for the area difference between the ecoroof (40,000 SF) and an acre (43,560 SF), the ecoroof of habitat represents an avoided cost of constructing habitat of $253,000.42 43 It should be noted that an ecoroof would not provide the same level of benefits of a fully restored acre of land and therefore a 1:1 value avoidance transfer would not be appropriate. As such, it will be assumed that 10% of the avoided cost will be associated with an ecoroof – or $25,300. This would be a one-time benefit to the City.
42 40,000 SF/43,560 SF = 0.92 * $275,000 = $253,000. 43 The purchase price for one-acre of Portland for habitat creation between 2004-2007 was approximately $185,000; however, recent purchase prices have averaged approximately $320,000 per acre. For this evaluation, an average purchase price of $250,000 will be assumed. Eli Callison, Bureau of Environmental Services, City of Portland, 2008
City of Portland BES Sustainable Stormwater Ecoroof Evaluation
Cost Benefit Evaluation of Ecoroofs 16
6 AMENITY VALUE 6.1 PHYSICAL BENEFITS
6.1.1 Amenity Value An ecoroof can potentially provide two types of amenity values. Building occupants, if they have access to the roof, may derive amenity value from visiting the ecoroof similar to value they associate with visiting parks or other passive recreation locations. In this case, an ecoroof is a unique resource given its height, urban setting and the associated views. Studies show that occupants of buildings surrounding a building with an ecoroof may also derive amenity values associated with viewing the roof. An ecoroof can also enhance the view of a well-designed building or help disguise a poorly designed roof or rooftop equipment. Ecoroofs can also help buildings blend into the surrounding area. For example, the ecoroof on Vancouver, BC’s public library was designed to provide a visual amenity for occupants of surrounding office buildings.44
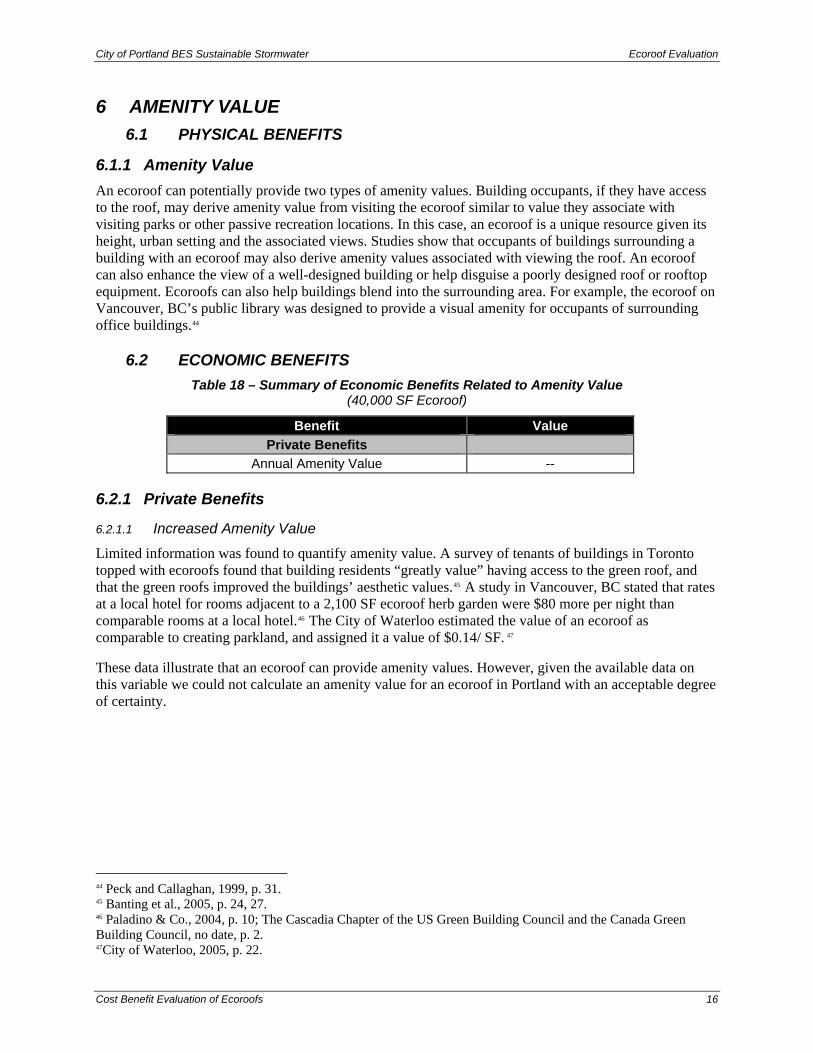
6.2 ECONOMIC BENEFITS Table 18 – Summary of Economic Benefits Related to Amenity Value
(40,000 SF Ecoroof)
Benefit Value Private Benefits
Annual Amenity Value --
6.2.1 Private Benefits
6.2.1.1 Increased Amenity Value
Limited information was found to quantify amenity value. A survey of tenants of buildings in Toronto topped with ecoroofs found that building residents “greatly value” having access to the green roof, and that the green roofs improved the buildings’ aesthetic values.45 A study in Vancouver, BC stated that rates at a local hotel for rooms adjacent to a 2,100 SF ecoroof herb garden were $80 more per night than comparable rooms at a local hotel.46 The City of Waterloo estimated the value of an ecoroof as comparable to creating parkland, and assigned it a value of $0.14/ SF. 47
These data illustrate that an ecoroof can provide amenity values. However, given the available data on this variable we could not calculate an amenity value for an ecoroof in Portland with an acceptable degree of certainty.
44 Peck and Callaghan, 1999, p. 31. 45 Banting et al., 2005, p. 24, 27. 46 Paladino & Co., 2004, p. 10; The Cascadia Chapter of the US Green Building Council and the Canada Green Building Council, no date, p. 2. 47City of Waterloo, 2005, p. 22.
City of Portland BES Sustainable Stormwater Ecoroof Evaluation
Cost Benefit Evaluation of Ecoroofs 17
7 BUILDING DEVELOPMENT There are a number of building associated costs and benefits attributed to ecoroofs. Costs include construction costs and annual O&M. Benefits may include density bonuses, increased roof longevity and reduced HVAC equipment sizing.
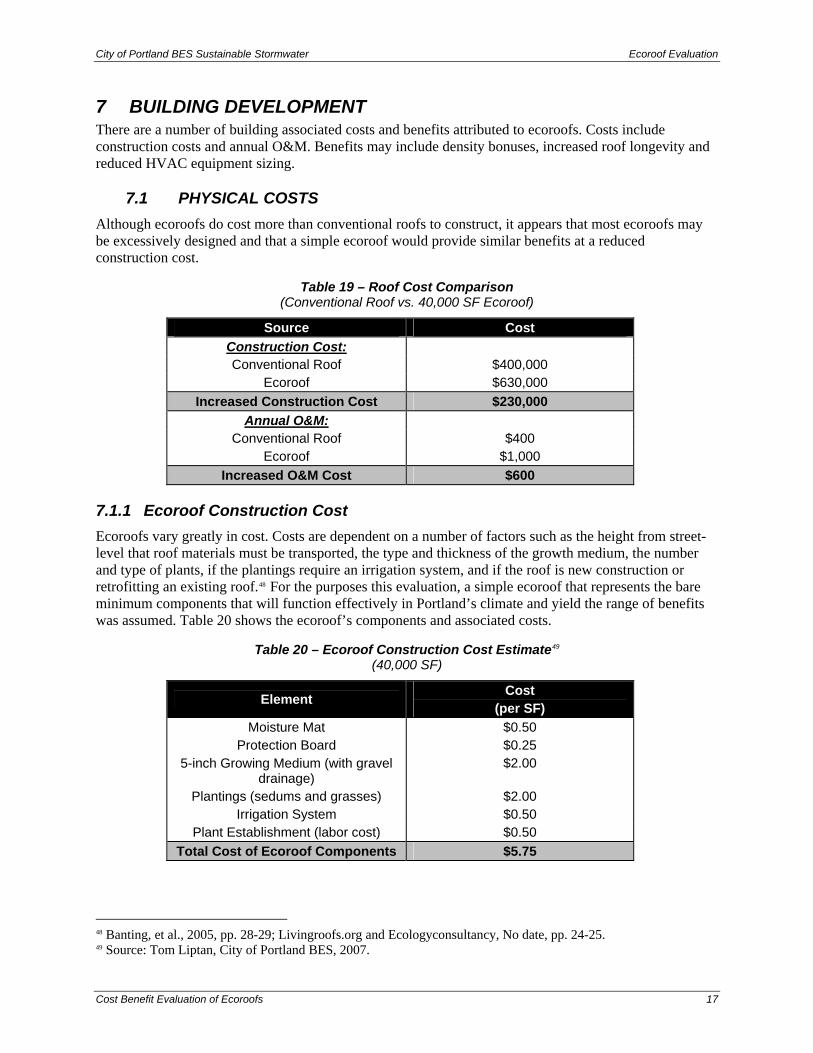
7.1 PHYSICAL COSTS Although ecoroofs do cost more than conventional roofs to construct, it appears that most ecoroofs may be excessively designed and that a simple ecoroof would provide similar benefits at a reduced construction cost.
Table 19 – Roof Cost Comparison (Conventional Roof vs. 40,000 SF Ecoroof)
Source Cost Construction Cost: Conventional Roof $400,000
Ecoroof $630,000 Increased Construction Cost $230,000
Annual O&M: Conventional Roof $400
Ecoroof $1,000 Increased O&M Cost $600
7.1.1 Ecoroof Construction Cost Ecoroofs vary greatly in cost. Costs are dependent on a number of factors such as the height from street-level that roof materials must be transported, the type and thickness of the growth medium, the number and type of plants, if the plantings require an irrigation system, and if the roof is new construction or retrofitting an existing roof.48 For the purposes this evaluation, a simple ecoroof that represents the bare minimum components that will function effectively in Portland’s climate and yield the range of benefits was assumed. Table 20 shows the ecoroof’s components and associated costs.
Table 20 – Ecoroof Construction Cost Estimate49 (40,000 SF)
Element Cost (per SF)
Moisture Mat $0.50 Protection Board $0.25
5-inch Growing Medium (with gravel drainage)
$2.00
Plantings (sedums and grasses) $2.00 Irrigation System $0.50
Plant Establishment (labor cost) $0.50 Total Cost of Ecoroof Components $5.75
48 Banting, et al., 2005, pp. 28-29; Livingroofs.org and Ecologyconsultancy, No date, pp. 24-25. 49 Source: Tom Liptan, City of Portland BES, 2007.
City of Portland BES Sustainable Stormwater Ecoroof Evaluation
Cost Benefit Evaluation of Ecoroofs 18
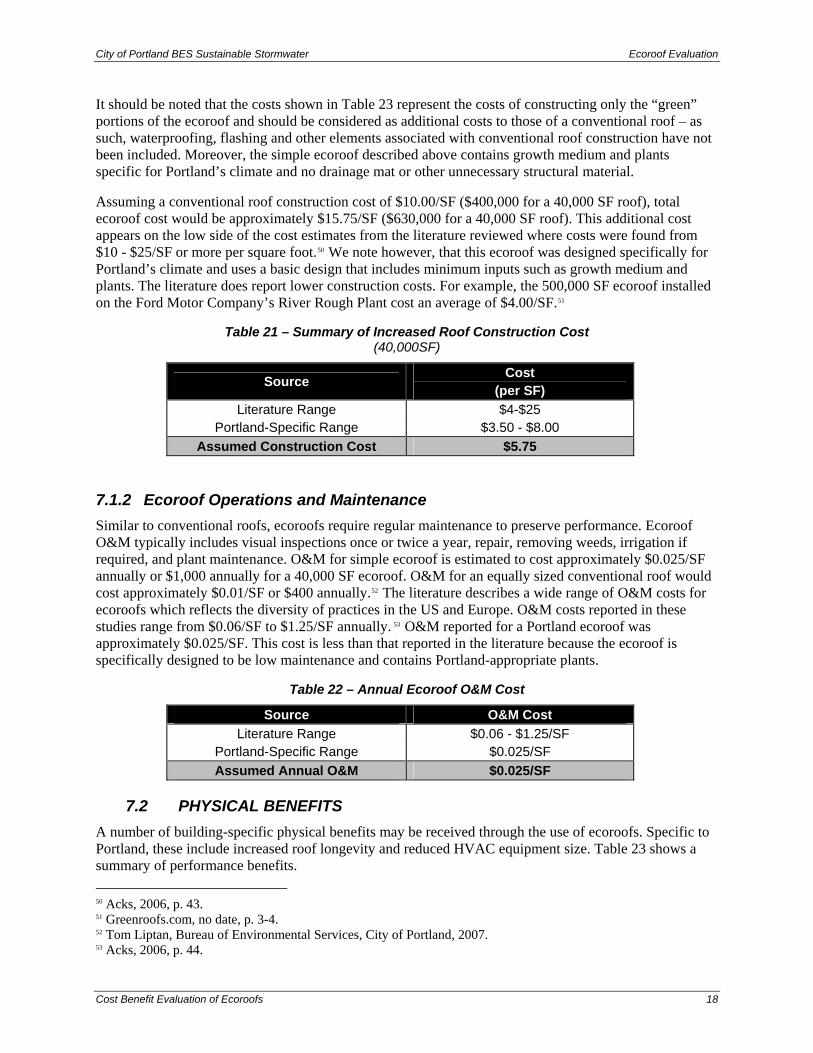
It should be noted that the costs shown in Table 23 represent the costs of constructing only the “green” portions of the ecoroof and should be considered as additional costs to those of a conventional roof – as such, waterproofing, flashing and other elements associated with conventional roof construction have not been included. Moreover, the simple ecoroof described above contains growth medium and plants specific for Portland’s climate and no drainage mat or other unnecessary structural material.
Assuming a conventional roof construction cost of $10.00/SF ($400,000 for a 40,000 SF roof), total ecoroof cost would be approximately $15.75/SF ($630,000 for a 40,000 SF roof). This additional cost appears on the low side of the cost estimates from the literature reviewed where costs were found from $10 - $25/SF or more per square foot.50 We note however, that this ecoroof was designed specifically for Portland’s climate and uses a basic design that includes minimum inputs such as growth medium and plants. The literature does report lower construction costs. For example, the 500,000 SF ecoroof installed on the Ford Motor Company’s River Rough Plant cost an average of $4.00/SF.51
Table 21 – Summary of Increased Roof Construction Cost (40,000SF)
Source Cost (per SF)
Literature Range $4-$25 Portland-Specific Range $3.50 - $8.00
Assumed Construction Cost $5.75
7.1.2 Ecoroof Operations and Maintenance Similar to conventional roofs, ecoroofs require regular maintenance to preserve performance. Ecoroof O&M typically includes visual inspections once or twice a year, repair, removing weeds, irrigation if required, and plant maintenance. O&M for simple ecoroof is estimated to cost approximately $0.025/SF annually or $1,000 annually for a 40,000 SF ecoroof. O&M for an equally sized conventional roof would cost approximately $0.01/SF or $400 annually.52 The literature describes a wide range of O&M costs for ecoroofs which reflects the diversity of practices in the US and Europe. O&M costs reported in these studies range from $0.06/SF to $1.25/SF annually. 53 O&M reported for a Portland ecoroof was approximately $0.025/SF. This cost is less than that reported in the literature because the ecoroof is specifically designed to be low maintenance and contains Portland-appropriate plants.
Table 22 – Annual Ecoroof O&M Cost
Source O&M Cost Literature Range $0.06 - $1.25/SF
Portland-Specific Range $0.025/SF Assumed Annual O&M $0.025/SF
7.2 PHYSICAL BENEFITS A number of building-specific physical benefits may be received through the use of ecoroofs. Specific to Portland, these include increased roof longevity and reduced HVAC equipment size. Table 23 shows a summary of performance benefits. 50 Acks, 2006, p. 43. 51 Greenroofs.com, no date, p. 3-4. 52 Tom Liptan, Bureau of Environmental Services, City of Portland, 2007. 53 Acks, 2006, p. 44.
City of Portland BES Sustainable Stormwater Ecoroof Evaluation
Cost Benefit Evaluation of Ecoroofs 19
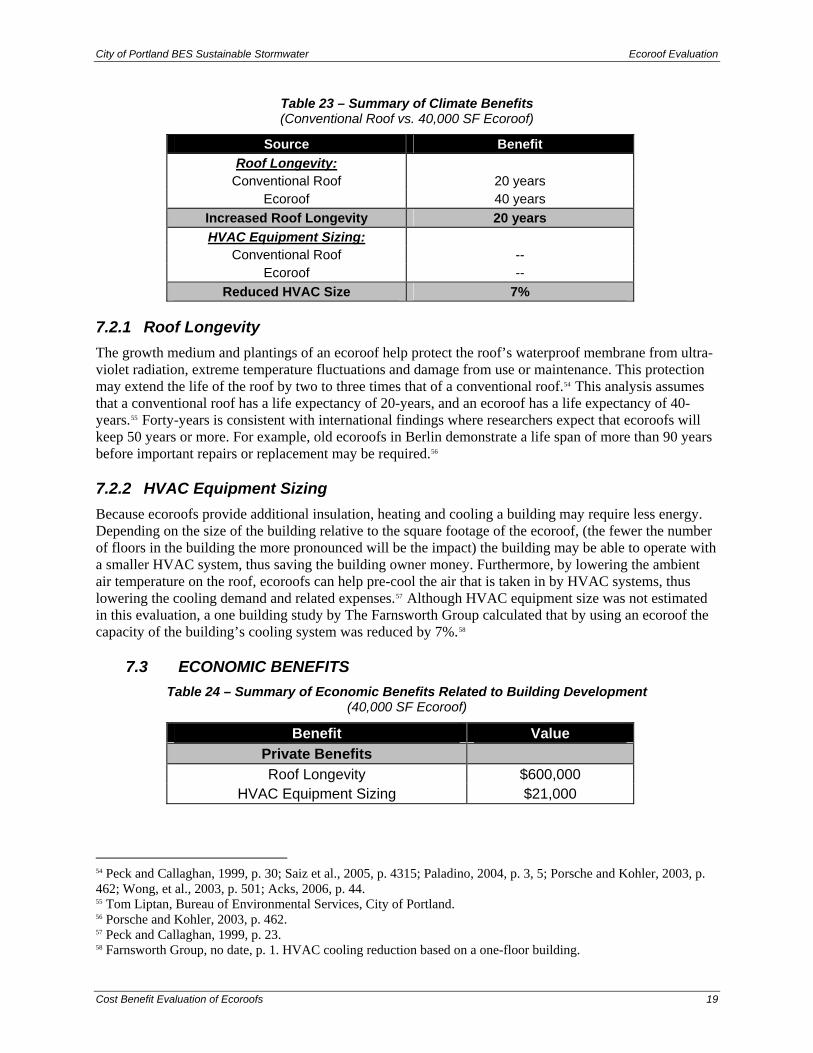
Table 23 – Summary of Climate Benefits (Conventional Roof vs. 40,000 SF Ecoroof)
Source Benefit Roof Longevity:
Conventional Roof 20 years Ecoroof 40 years
Increased Roof Longevity 20 years HVAC Equipment Sizing:
Conventional Roof -- Ecoroof --
Reduced HVAC Size 7%
7.2.1 Roof Longevity The growth medium and plantings of an ecoroof help protect the roof’s waterproof membrane from ultra-violet radiation, extreme temperature fluctuations and damage from use or maintenance. This protection may extend the life of the roof by two to three times that of a conventional roof.54 This analysis assumes that a conventional roof has a life expectancy of 20-years, and an ecoroof has a life expectancy of 40-years.55 Forty-years is consistent with international findings where researchers expect that ecoroofs will keep 50 years or more. For example, old ecoroofs in Berlin demonstrate a life span of more than 90 years before important repairs or replacement may be required.56
7.2.2 HVAC Equipment Sizing Because ecoroofs provide additional insulation, heating and cooling a building may require less energy. Depending on the size of the building relative to the square footage of the ecoroof, (the fewer the number of floors in the building the more pronounced will be the impact) the building may be able to operate with a smaller HVAC system, thus saving the building owner money. Furthermore, by lowering the ambient air temperature on the roof, ecoroofs can help pre-cool the air that is taken in by HVAC systems, thus lowering the cooling demand and related expenses.57 Although HVAC equipment size was not estimated in this evaluation, a one building study by The Farnsworth Group calculated that by using an ecoroof the capacity of the building’s cooling system was reduced by 7%.58
7.3 ECONOMIC BENEFITS Table 24 – Summary of Economic Benefits Related to Building Development
(40,000 SF Ecoroof)
Benefit Value Private Benefits Roof Longevity $600,000
HVAC Equipment Sizing $21,000
54 Peck and Callaghan, 1999, p. 30; Saiz et al., 2005, p. 4315; Paladino, 2004, p. 3, 5; Porsche and Kohler, 2003, p. 462; Wong, et al., 2003, p. 501; Acks, 2006, p. 44. 55 Tom Liptan, Bureau of Environmental Services, City of Portland. 56 Porsche and Kohler, 2003, p. 462. 57 Peck and Callaghan, 1999, p. 23. 58 Farnsworth Group, no date, p. 1. HVAC cooling reduction based on a one-floor building.
City of Portland BES Sustainable Stormwater Ecoroof Evaluation
Cost Benefit Evaluation of Ecoroofs 20
7.3.1 Private Benefits
7.3.1.1 Roof Longevity
Assuming that a conventional roof has a life span of 20-years, it would need to be replaced or significantly repaired once over the period of an ecoroof’s expected life (40 years). The cost of re-roofing over existing membranes is at least $15/SF. Not needing to replace or significantly improve the conventional roof twice would provide an avoided cost of $600,000.59
7.3.1.2 HVAC Equipment Sizing
No information specific to Portland was found to quantify this economic benefit. A California study found that lower cooling demands can allow downsizing of air conditioning in buildings, providing an additional savings of about $0.10 per square foot in capital costs.60 HVAC installation costs for a conventional building have been estimated at $15/SF which would total $3-million for a 5 story building with 40,000 SF per floor.61 Assuming half the HVAC cost is associated with cooling and a per floor HVAC cost of $600,000, per floor cooling costs would total approximately $300,000. The use of an ecoroof would reduce HVAC cooling equipment size for one floor by 7% generating a $21,000 savings.62
7.4 DENSITY BONUS Constructing a building in Portland with an ecoroof may qualify the development for a density bonus that allows exceeding the permitted cap that would otherwise apply to the building’s maximum square footage. The density bonus, known as a floor-area-ratio (FAR), for ecoroofs in Portland varies between one additional square foot of development per square foot of ecoroof, a 1:1 ratio, to a 3:1 ratio, or three feet of additional development per square foot of ecoroof. To date in Portland, developers have taken advantage of the ecoroof FAR by constructing approximately 260,000 SF of ecoroofs, which permitted an additional 600,000 SF of developable area–roughly a 2:1 ratio. Portland allows other types of FAR bonuses and not all developments that qualify for the ecoroof FAR bonus take advantage of it.63 For this reason the economic benefits attributed to the ecoroof FAR bonus are not included in the summary of calculated costs and benefits reported in Table 25.
For illustrative purposes however, what might the benefits be to a developer and the City should the ecoroof FAR bonus be utilitized? Assuming a 2:1 density bonus applied to a 40,000 SF ecoroof will allow for 80,000 SF of additional building area and a condo building in Portland sells for $450/SF, a developer’s revenue for the building would increase by $36 million.64 The City would also benefit through increased property taxes on the additional building area – assuming that the additional building area would not have been built elsewhere in the City or without the density bonus. The additional tax revenue to the City would be approximately $378,000 – assuming the assessed value of the additional building area is $18 million, or half the market value, and it is taxed at a tax rate of $21/$1,000 of assessed value.
59 This analysis assumes that the conventional roof would be replaced in year 20 of our analysis. Accounting for inflation of construction costs during this time, and discounting the future construction costs back to 2008 dollars, the costs savings of future replacement in 2008 dollars is $561,718. See the “Roof Longevity” calculation in the tables in the Appendix for the details of this calculation. 60 Kats, et al., 2003, p. 79. 61 Tom Liptan, Bureau of Environmental Services, City of Portland. 62 This underestimates the total cost savings because it excludes savings associated with reduced heating capacity of the HVAC system. 63 For example, constructing a mixed-use development may qualify the project for a FAR of 9:1. 64 This illustrative analysis assumes that the increased supply of FAR-related buildable area has no impact on the market value of condo developments in Portland. Profit per SF is the preferred measure of economic benefit, however, profit data are unavailable at this time.
City of Portland BES Sustainable Stormwater Ecoroof Evaluation
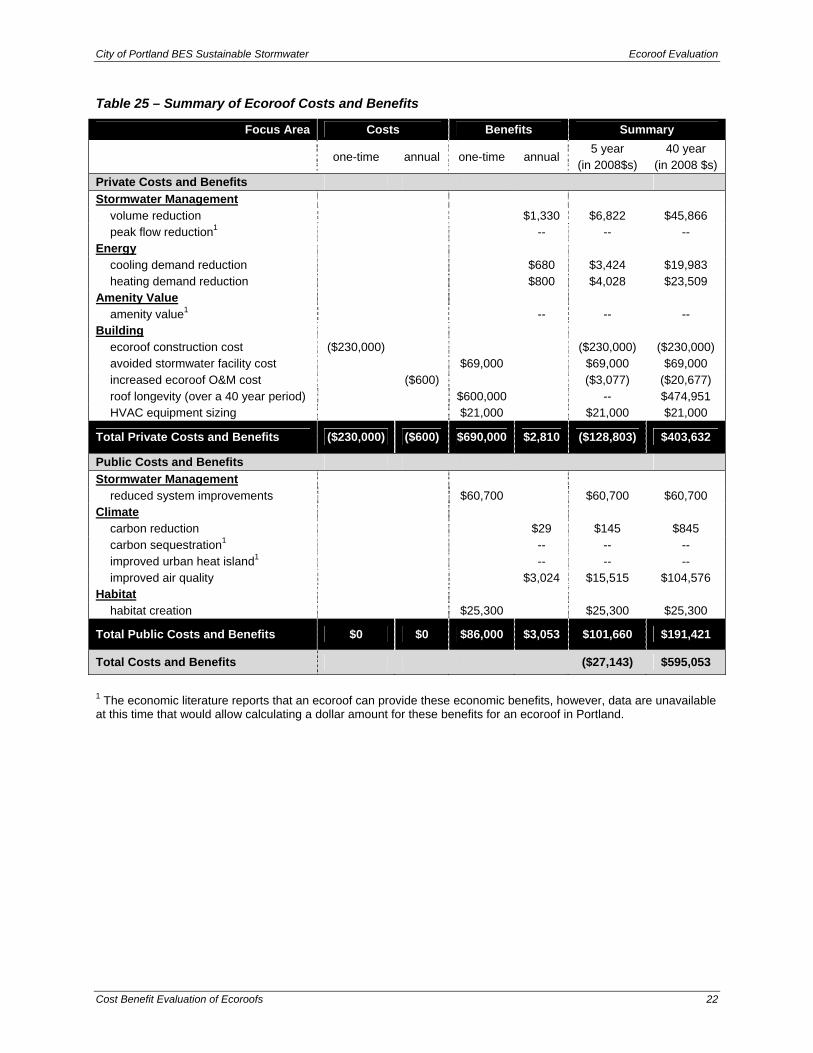
8 SUMMARY OF ECOROOF COSTS AND BENEFITS The cost and benefit findings reported in the preceding tables have been summarized in Table 25. Table 25 also includes total costs and benefits at five years after development and at forty years, the expected useful life of the ecoroof. See the Appendix for details of the calculations of future costs and benefits, and the associated inflation and discount factors. All dollar amounts in Table 25 are in year 2008 dollars.
At five years, the calculated costs of the ecoroof exceed benefits by about $15,000. However, the benefits estimated may be conservative because data constraints prevented calculating economic benefits associated with peak flow reduction, amenity value, carbon sequestration and improved heat island effect. By forty years after development, the calculated economic benefits exceed costs by approximately $700,000. In both the five-year and forty-year time period, the public benefit of the ecoroof is positive.
The costs and benefits identified in this evaluation clearly show that investment in ecoroof construction generates, in the long run (40-year), significant benefits both to developers and building owners as well as to the public stormwater system and the environment. However, from a short-term (5-year) perspective – one typically associated with developers – benefits accrued by a developer for ecoroof construction would only account for approximately half the cost of the ecoroof. Benefits do not appear to exceed costs until year 20 when an avoided cost of conventional roof replacement would be accrued. This finding likely accounts for the limited implementation of ecoroofs in Portland and beyond. It should be noted that over that same short-term period, benefits accrued to Portland’s stormwater system and environment are positive. As such, Portland may want to evaluate ecoroof incentive options for developers to further animate ecoroof implementation in the city.
Cost Benefit Evaluation of Ecoroofs 21
City of Portland BES Sustainable Stormwater Ecoroof Evaluation
Cost Benefit Evaluation of Ecoroofs 22
Table 25 – Summary of Ecoroof Costs and Benefits
Focus Area Costs Benefits Summary
one-time annual one-time annual 5 year
(in 2008$s) 40 year
(in 2008 $s) Private Costs and Benefits Stormwater Management
volume reduction $1,330 $6,822 $45,866 peak flow reduction1 -- -- --
Energy cooling demand reduction $680 $3,424 $19,983 heating demand reduction $800 $4,028 $23,509
Amenity Value amenity value1 -- -- --
Building ecoroof construction cost ($230,000) ($230,000) ($230,000) avoided stormwater facility cost $69,000 $69,000 $69,000 increased ecoroof O&M cost ($600) ($3,077) ($20,677) roof longevity (over a 40 year period) $600,000 -- $474,951 HVAC equipment sizing $21,000 $21,000 $21,000
Total Private Costs and Benefits ($230,000) ($600) $690,000 $2,810 ($128,803) $403,632
Public Costs and Benefits Stormwater Management
reduced system improvements $60,700 $60,700 $60,700 Climate
carbon reduction $29 $145 $845 carbon sequestration1 -- -- -- improved urban heat island1 -- -- -- improved air quality $3,024 $15,515 $104,576
Habitat habitat creation $25,300 $25,300 $25,300
Total Public Costs and Benefits $0 $0 $86,000 $3,053 $101,660 $191,421
Total Costs and Benefits ($27,143) $595,053
1 The economic literature reports that an ecoroof can provide these economic benefits, however, data are unavailable at this time that would allow calculating a dollar amount for these benefits for an ecoroof in Portland.
City of Portland BES Sustainable Stormwater Ecoroof Evaluation
REFERENCES Acks, K. 2006. “A Framework for Cost-Benefit Analysis of Green Roofs: Initial Estimates.” in Green Roofs in the Metropolitan Region: Research Report. C. Rosenzweig, S. Gaffin, and L. Parshall (Eds.) Columbia Center for Climate Systems Research and NASA Goddard Institute for Space Studies.
Banting, D., H Doshi, J. Li, and P. Missios. 2005. Report on the Environmental Benefits and Costs of Green Roof Technology for the City of Toronto. Prepared for City of Toronto and Ontario Centers of Excellence- Earth and Environmental Technologies (OCE-Etech). October 31.
Brenneisen, S. 2003. “The Benefits of Biodiversity from Green Roofs – Key Design Consequences.” Greening Rooftops for Sustainable Communities, Chicago, IL, May 30.
Brenneisen, S. No Date. “Space for Urban Wildlife: Designing Green Roofs as Habitats in Urban Switzerland.” Urban Habitats. Retrieved September 24, 2007 from http://www.urbanhabitats.org/v04n01/wildlife_full.html#cite2#cite2
Cascadia Chapter of the U.S. Green Building Council and the Canada Green Building Council. No date. Green Roofs Fact Sheet. Retrieved September 19, 2007 from http://www.cascadiagbc.org.
City of Chicago. 2003. A Guide to Stormwater Best Management Practices.
City of Chicago. No date. Monitoring the Rooftop Garden’s Benefits. Department of Environment.
City of Portland, Bureau of Environmental Services, no date. Ecoroof Facts Related to City Zoning Code 33.510.
City of Portland. 2006. Bureau of Environmental Services, Effectiveness Evaluation of Best Management Practices for Stormwater Management in Portland, Oregon. Version 1. September.
City of Waterloo. 2005. Green Roofs Feasibility Study and City Wide Implementation Plan. Final Revised Report.
Clark, C., B. Talbot, J. Bulkley and P. Adriens. 2005. Optimization of Green Roofs for Air Pollution Mitigation. University of Michigan
Clark, C., P. Adriaens, and F.B. Talbot. 2007. Green Roof Valuation: A Probabilistic Economic Analysis of Environmental Benefits. University of Michigan. Retrieved September 20, 2007, from http://www.erb.umich.edu/News-and-Events/colloquium_papers/ Clarketal.pdf
Dawson, D. 2002. “Plant-Covered Roofs Ease Urban Heat,” National Geographic News, November 15. Retrieved September 19, 2007 from http://news.nationalgeographic.com/news/2002/11/1115_021115_GreenRoofs.html.
Dramstad, W.E., J.D. Olson, and R.T.T. Forman. 1996. Principles in Landscape Architecture and Land-Use Planning, Harvard University Graduate School of Design, Island Press and American Society of Landscape Architects, Washington, D.C.
Earth Pledge. 2005. Green Roofs: Ecological Design and Construction. Atglen, Penn.: Schiffer Publishing
Gedge, D. and G. Kadas. 2005. Green Roofs for Biodiversity: Design Green Roofs to Meet Targets of BAP (Biodiversity Action Plan species). World Green Roof Congress, Basel, Switzerland, September 15-16. World Green Roof Congress.
Graham, P. and M. Kim. 2003. Evaluating the Stormwater Management Benefits of Green Roofs through Water Balance Modeling in Proc: Green Roofs for Healthy Cities. Chicago
Cost Benefit Evaluation of Ecoroofs 23
City of Portland BES Sustainable Stormwater Ecoroof Evaluation
The Great Lakes WATER Institute. No date. Great Lakes WATER Institute Green Roof Project. Retrieved on September 19, 2007 from http://www.glwi.uwm.edu/research/genomics/ecoli/greenroof/roofinstall.php.
Greenroofs.com. No date. Retrieved September 28, 2007 from http://greenroofs.com/
Green Roofs for Healthy Cities (GRHC). 2003. Private Benefits of Green Roofs. http://www.cardinalgroup.ca/grhcc/private.html
Harvard Green Campus Initiative. No data. Green Campus Building Service: Green Roofs at Harvard. Retrieved September 19, 2007 from http://www.greencampus.harvard.edu/hpbs/green_roofs.php.
Hutchinson, D. and P. Abrams, R. Retzlaff, and T. Liptan. 2003. Stormwater Monitoring Two Ecoroofs in Portland, Oregon, USA. In Proc: Greening Rooftops for Sustainable Communities: Chicago.
Jennings, G., B. Hunt, A. Moran. 2003. A North Carolina Field Study to Evaluate Green Roof Runoff Quantity, Quality, and Plant Growth. ASAE Annual International Meeting, Las Vegas, NV 27-30 July 2003.
Johnston, J. and J. Newton. 1993. Building Green, A Guide for Using Plants on Roofs, Walls, and Pavements, The London Ecology Unit, London
Kats, G., et al. 2003. The Costs and Financial Benefits of Green Buildings: A Report to California’s Sustainable Building Task Force. October. Retrieved September 20, 2007, from http://www.ciwmb.ca.gov/GreenBuilding/Design/CostBenefit/Report.pdf
Langdon, D. 2007. Cost of Green Revisited. Downloaded September 19, 2007 from http://www.davislangdon.com/USA/Research/ResearchFinder/2007-The-Cost-of-Green-Revisited/.
Lee, A. 2004. Life Cycle Cost Analysis – Green Roofs From An Investment Perspective. In Proc: Greening Rooftops for Sustainable Communities: Portland, June 2-4, 2004
Lee, A., D. Sailor, T. Larson, and R. Ogle. 2007. “Developing a Web-Based Tool for Assessing Green Roofs”. Greening Rooftops for Sustainable Communities, Minneapolis, April 29-May 1. Green Roofs for Healthy Cities.
Liu, K. 2003. Engineering Performance of Rooftop Gardens Through Field Evaluation, Proc: from the 18th International Convention of Greenroof Consultants Institute: 13-16 March 2003. Tampa, FL p. 99-103
Livingroofs.org and Ecology consultancy. No Date. Green Roofs Benefits and Cost Implications. Sustainable Eastside. Retrieved September 20, 2007, from http://www.sustainable-eastside.net/Green%20Roofs%20Report%202.07.05.pdf
Low Impact Development Center, Inc. No data. Costs of Green Roofs. Downloaded September 19, 2007 from http://www.lid-stormwater.net/greenroofs/greenroofs_cost.htm.
Matthews, H.S., and Lave, L.B. 2000. “Applications of Environmental Valuation for Determining Externality Costs.” Environmental Science & Technology 34 (8): 1390-1395.
Mentens, J., D. Raes, and M. Hermy. 2006. “Green Roofs as a Tool for Solving the Rainwater Runoff Problem in the Urbanized 21st Century?” Landscape and Urban Planning 77: 217-226.
Monterusso, M. 2003. Species Selection and Stormwater Runoff Analysis from Green Roof System. Department of Horticulture, Michigan State University.
Moran, A., B. Hunt, and G. Jennings. 2004. A North Carolina Field Study to Evaluate Greenroof Runoff Quantity, Runoff Quality, and Plant Growth. In Proc: Greening Rooftops for Sustainable Communities: Portland, June 2-4, 2004
Cost Benefit Evaluation of Ecoroofs 24
City of Portland BES Sustainable Stormwater Ecoroof Evaluation
Cost Benefit Evaluation of Ecoroofs 25
Paladino & Co., Inc. 2004. Green Roof Feasibility Review. Prepared for the King County Office Project,
Peck, S., C. Callaghan, M. Kuhn, B. Bass. 1999. Greenbacks from Green Roofs: Forging A New Industry In Canada. Status Report on Benefits, Barriers and Opportunities for Green Roof and Vertical Garden Technology Diffusion. Prepared for Canada Mortgage and Housing Corporation. March.
Philippi, P. 2006. “How To Get Cost Reduction In Green Roof Construction,” in Proc. Greening Rooftops for Sustainable Communities: Boston 2006: May 11-12, 2005; Boston, MA.
Porsche, U. and M. Kohler. 2003. “Life Cycle Costs of Green Roofs: A Comparison of Germany, USA, and Brazil.” Presented at the World Climate and Energy Event. December 1-5, Rio de Janeiro, Brazil.
Post, N. 2007. “Green-Roof Study Results Offer Positive Surprises,” ENR.com. April 16. Retrieved September 19, 2007 from http://enr.construction.com/print.asp?REF=http://enr.construction.com/news/buildings/archives/070416.asp.
Prairie Ecosystems. No date. Crerar Benefit-Cost Analysis. Retrieved September 20, 2007 from http://prairieecosystems.pbwiki.com/Crerar+Benefit-Cost+Analysis.
Rosenzweig, C., S. Gaffin, and L. Parshall (Eds). 2006. Green Roofs in the New York Metropolitan Region: Research Report. Columbia University Center for Climate Systems Research, NASA Goddard Institute for Space Studies. Retrieved September 20, 2007, from http://ccsr.columbia.edu/cig/greenroofs/Green_Roof_Full_Report.pdf
Rosenzweig, C., D. Hillel, and L. Parshall. 2006. “Green Roof Research Station: Rationale, Experimental Design and Estimated Costs.” in Green Roofs in the Metropolitan Region: Research Report. C. Rosenzweig, S. Gaffin, and L. Parshall (Eds.) Columbia Center for Climate Systems Research and NASA Goddard Institute for Space Studies.
Saiz, S., et al. 2006. “Comparative Life Cycle Assessment of Standard and Green Roofs.” Environmental Science and Technology 40: 4312-4316.
Scholz-Barth, K. 2001. “Green Roofs: Stormwater Management from the Top Down.” Environmental Design and Construction. Retrieved September 28, 2007 from www.edcmag.com.
Tillinger, D., G. Ostroff, D. Beattie, R. Berhage, P. Mankiewicz, and F. Montalto. 2006. “Hydrologic Functions of Green Roofs in New York City.” in Green Roofs in the Metropolitan Region: Research Report. C. Rosenzweig, S. Gaffin, and L. Parshall (Eds.) Columbia Center for Climate Systems Research and NASA Goddard Institute for Space Studies.
Toronto and Region Conservation. An Economic Analysis of Green Roofs: Evaluating the Costs and Savings to Building Owners in Toronto and Surrounding Regions. Sustainable Technologies Evaluation Program. July. Retrieved September 26, 2007, from http://www.sustainabletechnologies.ca/Portals/_Rainbow/Documents/GR_Econ_Full%20document.pdf
Sailor, D., 1995. Simulated Urban Climate Response to Modification in Surface Albedo and Vegetative Cover. Journal of Applied Meteorology 34 (7) 1694-1704
Solecki, W.D., C. Rosenzweig, J. Cox, L. Parshall, J. Rosenthal, and S. Hodges. 2006. “Potential Impact of Green Roofs on the Urban Heat Island Effect.” in Green Roofs in the Metropolitan Region: Research Report. C. Rosenzweig, S. Gaffin, and L. Parshall (Eds.) Columbia Center for Climate Systems Research and NASA Goddard Institute for Space Studies
WRTEP, Western Regional Transmission Expansion Partnership. 2007. Benefit-Cost Analysis of Frontier Line Possibilities. Final Report. Economic Analysis Subcommittee, April 27.
Wong, N.H., et al. 2003. “Life Cycle Cost Analysis of Rooftop Gardens in Singapore.” Building and Environment 38.

APPENDIX A
Net Present Value Analysis Worksheets
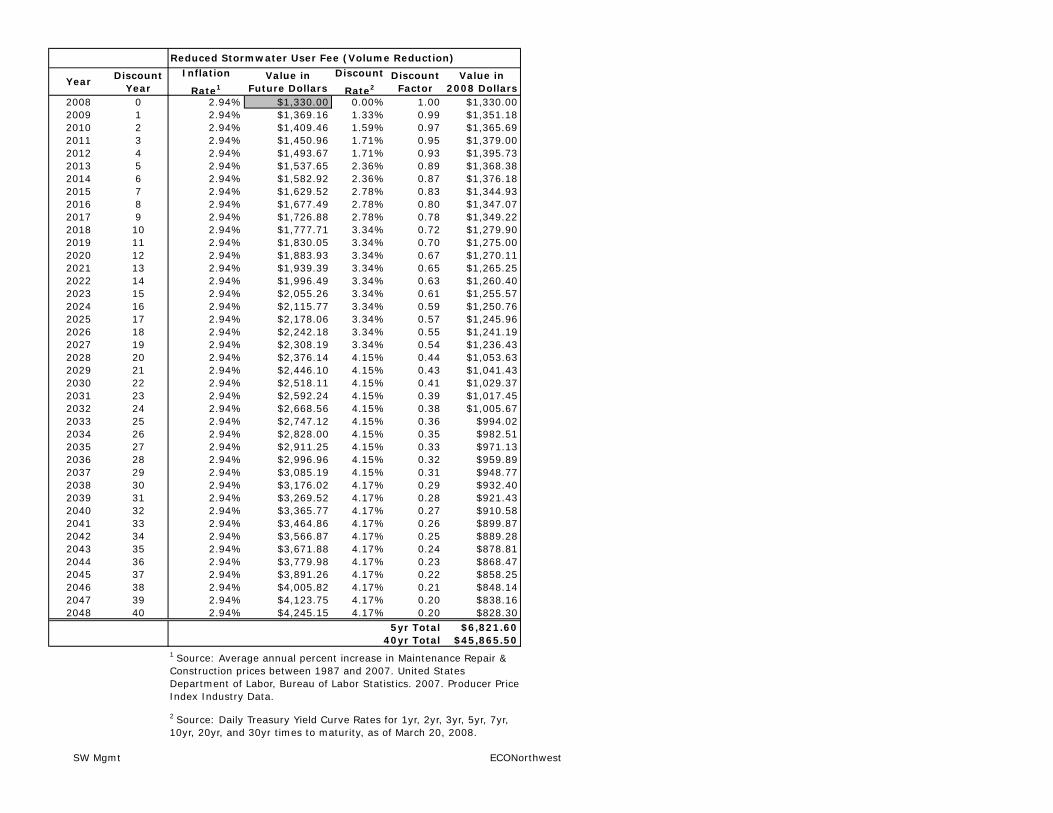
SW Mgmt ECONorthwest
Reduced Stormwater User Fee (Volume Reduction)
YearDiscount
Year
Inflation
Rate1
Value in
Future Dollars
Discount
Rate2
Discount
Factor
Value in
2008 Dollars
2008 0 2.94% $1,330.00 0.00% 1.00 $1,330.00
2009 1 2.94% $1,369.16 1.33% 0.99 $1,351.18
2010 2 2.94% $1,409.46 1.59% 0.97 $1,365.69
2011 3 2.94% $1,450.96 1.71% 0.95 $1,379.00
2012 4 2.94% $1,493.67 1.71% 0.93 $1,395.73
2013 5 2.94% $1,537.65 2.36% 0.89 $1,368.38
2014 6 2.94% $1,582.92 2.36% 0.87 $1,376.18
2015 7 2.94% $1,629.52 2.78% 0.83 $1,344.93
2016 8 2.94% $1,677.49 2.78% 0.80 $1,347.07
2017 9 2.94% $1,726.88 2.78% 0.78 $1,349.22
2018 10 2.94% $1,777.71 3.34% 0.72 $1,279.90
2019 11 2.94% $1,830.05 3.34% 0.70 $1,275.00
2020 12 2.94% $1,883.93 3.34% 0.67 $1,270.11
2021 13 2.94% $1,939.39 3.34% 0.65 $1,265.25
2022 14 2.94% $1,996.49 3.34% 0.63 $1,260.40
2023 15 2.94% $2,055.26 3.34% 0.61 $1,255.57
2024 16 2.94% $2,115.77 3.34% 0.59 $1,250.76
2025 17 2.94% $2,178.06 3.34% 0.57 $1,245.96
2026 18 2.94% $2,242.18 3.34% 0.55 $1,241.19
2027 19 2.94% $2,308.19 3.34% 0.54 $1,236.43
2028 20 2.94% $2,376.14 4.15% 0.44 $1,053.63
2029 21 2.94% $2,446.10 4.15% 0.43 $1,041.43
2030 22 2.94% $2,518.11 4.15% 0.41 $1,029.37
2031 23 2.94% $2,592.24 4.15% 0.39 $1,017.45
2032 24 2.94% $2,668.56 4.15% 0.38 $1,005.67
2033 25 2.94% $2,747.12 4.15% 0.36 $994.02
2034 26 2.94% $2,828.00 4.15% 0.35 $982.51
2035 27 2.94% $2,911.25 4.15% 0.33 $971.13
2036 28 2.94% $2,996.96 4.15% 0.32 $959.89
2037 29 2.94% $3,085.19 4.15% 0.31 $948.77
2038 30 2.94% $3,176.02 4.17% 0.29 $932.40
2039 31 2.94% $3,269.52 4.17% 0.28 $921.43
2040 32 2.94% $3,365.77 4.17% 0.27 $910.58
2041 33 2.94% $3,464.86 4.17% 0.26 $899.87
2042 34 2.94% $3,566.87 4.17% 0.25 $889.28
2043 35 2.94% $3,671.88 4.17% 0.24 $878.81
2044 36 2.94% $3,779.98 4.17% 0.23 $868.47
2045 37 2.94% $3,891.26 4.17% 0.22 $858.25
2046 38 2.94% $4,005.82 4.17% 0.21 $848.14
2047 39 2.94% $4,123.75 4.17% 0.20 $838.16
2048 40 2.94% $4,245.15 4.17% 0.20 $828.30
5yr Total $6,821.60
40yr Total $45,865.50
1 Source: Average annual percent increase in Maintenance Repair &
Construction prices between 1987 and 2007. United States
Department of Labor, Bureau of Labor Statistics. 2007. Producer Price
Index Industry Data.
2 Source: Daily Treasury Yield Curve Rates for 1yr, 2yr, 3yr, 5yr, 7yr,
10yr, 20yr, and 30yr times to maturity, as of March 20, 2008.
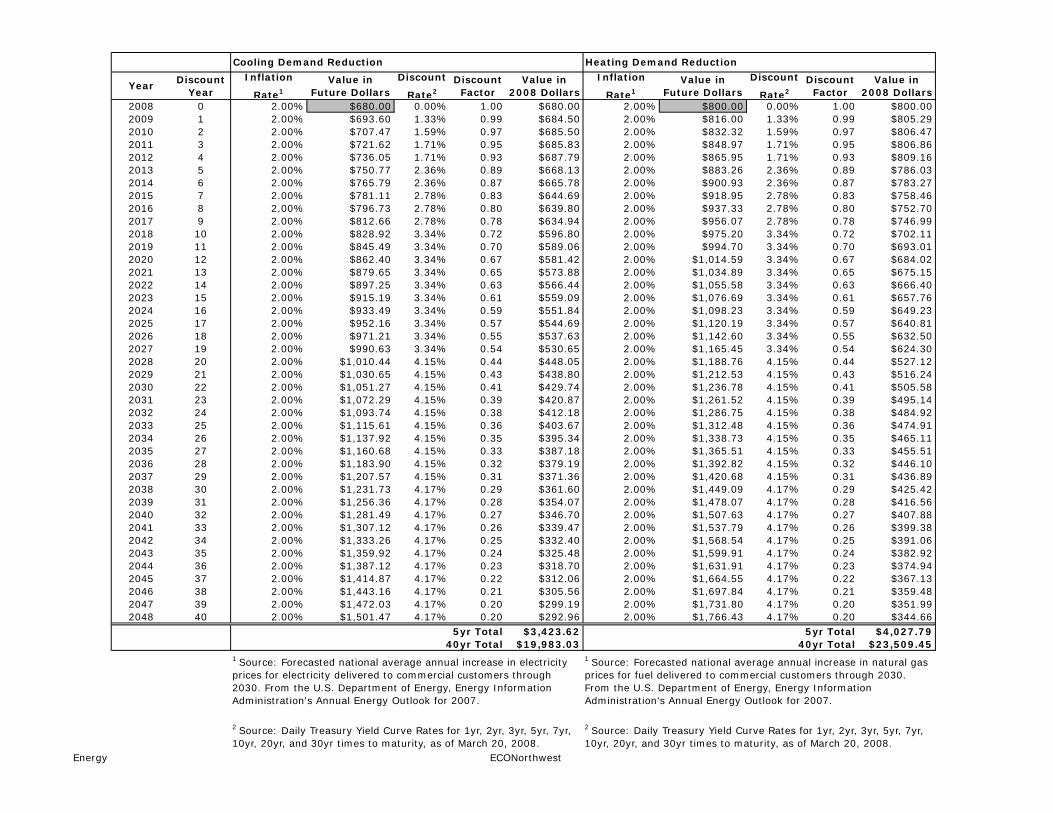
Energy ECONorthwest
Cooling Demand Reduction Heating Demand Reduction
YearDiscount
Year
Inflation
Rate1
Value in
Future Dollars
Discount
Rate2
Discount
Factor
Value in
2008 Dollars
Inflation
Rate1
Value in
Future Dollars
Discount
Rate2
Discount
Factor
Value in
2008 Dollars
2008 0 2.00% $680.00 0.00% 1.00 $680.00 2.00% $800.00 0.00% 1.00 $800.00
2009 1 2.00% $693.60 1.33% 0.99 $684.50 2.00% $816.00 1.33% 0.99 $805.29
2010 2 2.00% $707.47 1.59% 0.97 $685.50 2.00% $832.32 1.59% 0.97 $806.47
2011 3 2.00% $721.62 1.71% 0.95 $685.83 2.00% $848.97 1.71% 0.95 $806.86
2012 4 2.00% $736.05 1.71% 0.93 $687.79 2.00% $865.95 1.71% 0.93 $809.16
2013 5 2.00% $750.77 2.36% 0.89 $668.13 2.00% $883.26 2.36% 0.89 $786.03
2014 6 2.00% $765.79 2.36% 0.87 $665.78 2.00% $900.93 2.36% 0.87 $783.27
2015 7 2.00% $781.11 2.78% 0.83 $644.69 2.00% $918.95 2.78% 0.83 $758.46
2016 8 2.00% $796.73 2.78% 0.80 $639.80 2.00% $937.33 2.78% 0.80 $752.70
2017 9 2.00% $812.66 2.78% 0.78 $634.94 2.00% $956.07 2.78% 0.78 $746.99
2018 10 2.00% $828.92 3.34% 0.72 $596.80 2.00% $975.20 3.34% 0.72 $702.11
2019 11 2.00% $845.49 3.34% 0.70 $589.06 2.00% $994.70 3.34% 0.70 $693.01
2020 12 2.00% $862.40 3.34% 0.67 $581.42 2.00% $1,014.59 3.34% 0.67 $684.02
2021 13 2.00% $879.65 3.34% 0.65 $573.88 2.00% $1,034.89 3.34% 0.65 $675.15
2022 14 2.00% $897.25 3.34% 0.63 $566.44 2.00% $1,055.58 3.34% 0.63 $666.40
2023 15 2.00% $915.19 3.34% 0.61 $559.09 2.00% $1,076.69 3.34% 0.61 $657.76
2024 16 2.00% $933.49 3.34% 0.59 $551.84 2.00% $1,098.23 3.34% 0.59 $649.23
2025 17 2.00% $952.16 3.34% 0.57 $544.69 2.00% $1,120.19 3.34% 0.57 $640.81
2026 18 2.00% $971.21 3.34% 0.55 $537.63 2.00% $1,142.60 3.34% 0.55 $632.50
2027 19 2.00% $990.63 3.34% 0.54 $530.65 2.00% $1,165.45 3.34% 0.54 $624.30
2028 20 2.00% $1,010.44 4.15% 0.44 $448.05 2.00% $1,188.76 4.15% 0.44 $527.12
2029 21 2.00% $1,030.65 4.15% 0.43 $438.80 2.00% $1,212.53 4.15% 0.43 $516.24
2030 22 2.00% $1,051.27 4.15% 0.41 $429.74 2.00% $1,236.78 4.15% 0.41 $505.58
2031 23 2.00% $1,072.29 4.15% 0.39 $420.87 2.00% $1,261.52 4.15% 0.39 $495.14
2032 24 2.00% $1,093.74 4.15% 0.38 $412.18 2.00% $1,286.75 4.15% 0.38 $484.92
2033 25 2.00% $1,115.61 4.15% 0.36 $403.67 2.00% $1,312.48 4.15% 0.36 $474.91
2034 26 2.00% $1,137.92 4.15% 0.35 $395.34 2.00% $1,338.73 4.15% 0.35 $465.11
2035 27 2.00% $1,160.68 4.15% 0.33 $387.18 2.00% $1,365.51 4.15% 0.33 $455.51
2036 28 2.00% $1,183.90 4.15% 0.32 $379.19 2.00% $1,392.82 4.15% 0.32 $446.10
2037 29 2.00% $1,207.57 4.15% 0.31 $371.36 2.00% $1,420.68 4.15% 0.31 $436.89
2038 30 2.00% $1,231.73 4.17% 0.29 $361.60 2.00% $1,449.09 4.17% 0.29 $425.42
2039 31 2.00% $1,256.36 4.17% 0.28 $354.07 2.00% $1,478.07 4.17% 0.28 $416.56
2040 32 2.00% $1,281.49 4.17% 0.27 $346.70 2.00% $1,507.63 4.17% 0.27 $407.88
2041 33 2.00% $1,307.12 4.17% 0.26 $339.47 2.00% $1,537.79 4.17% 0.26 $399.38
2042 34 2.00% $1,333.26 4.17% 0.25 $332.40 2.00% $1,568.54 4.17% 0.25 $391.06
2043 35 2.00% $1,359.92 4.17% 0.24 $325.48 2.00% $1,599.91 4.17% 0.24 $382.92
2044 36 2.00% $1,387.12 4.17% 0.23 $318.70 2.00% $1,631.91 4.17% 0.23 $374.94
2045 37 2.00% $1,414.87 4.17% 0.22 $312.06 2.00% $1,664.55 4.17% 0.22 $367.13
2046 38 2.00% $1,443.16 4.17% 0.21 $305.56 2.00% $1,697.84 4.17% 0.21 $359.48
2047 39 2.00% $1,472.03 4.17% 0.20 $299.19 2.00% $1,731.80 4.17% 0.20 $351.99
2048 40 2.00% $1,501.47 4.17% 0.20 $292.96 2.00% $1,766.43 4.17% 0.20 $344.66
5yr Total $3,423.62 5yr Total $4,027.79
40yr Total $19,983.03 40yr Total $23,509.45
2 Source: Daily Treasury Yield Curve Rates for 1yr, 2yr, 3yr, 5yr, 7yr,
10yr, 20yr, and 30yr times to maturity, as of March 20, 2008.
2 Source: Daily Treasury Yield Curve Rates for 1yr, 2yr, 3yr, 5yr, 7yr,
10yr, 20yr, and 30yr times to maturity, as of March 20, 2008.
1 Source: Forecasted national average annual increase in electricity
prices for electricity delivered to commercial customers through
2030. From the U.S. Department of Energy, Energy Information
Administration's Annual Energy Outlook for 2007.
1 Source: Forecasted national average annual increase in natural gas
prices for fuel delivered to commercial customers through 2030.
From the U.S. Department of Energy, Energy Information
Administration's Annual Energy Outlook for 2007.
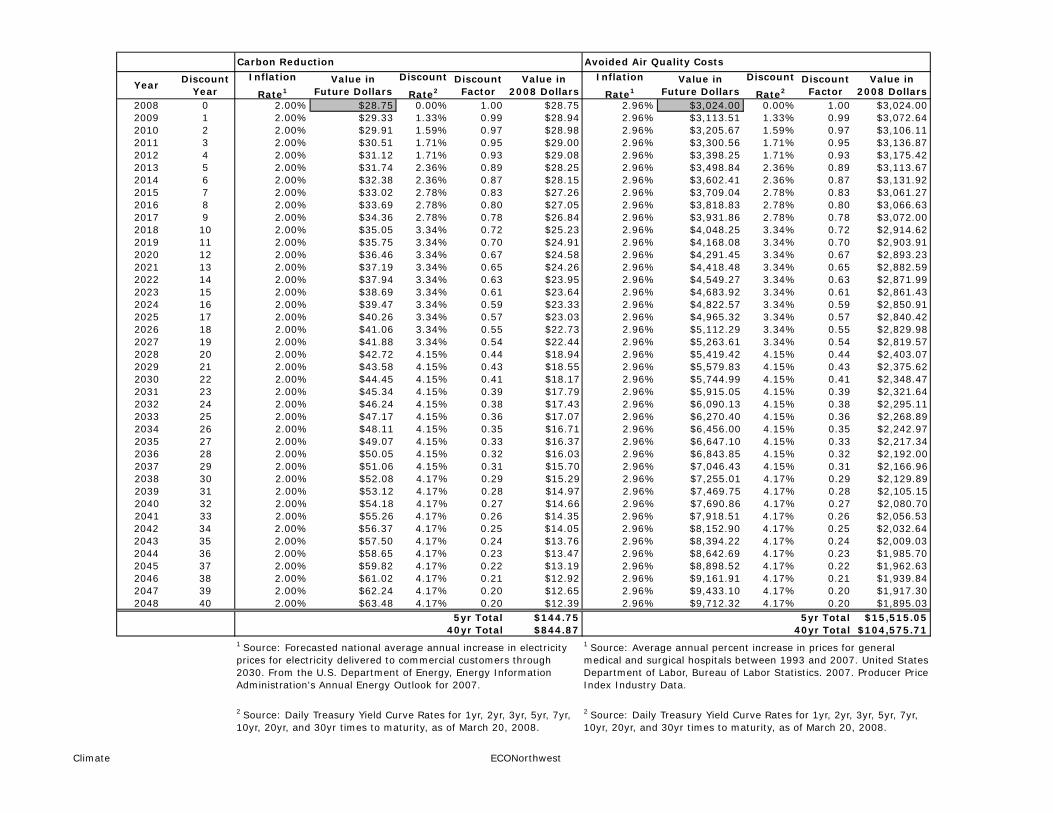
Climate ECONorthwest
Carbon Reduction Avoided Air Quality Costs
YearDiscount
Year
Inflation
Rate1
Value in
Future Dollars
Discount
Rate2
Discount
Factor
Value in
2008 Dollars
Inflation
Rate1
Value in
Future Dollars
Discount
Rate2
Discount
Factor
Value in
2008 Dollars
2008 0 2.00% $28.75 0.00% 1.00 $28.75 2.96% $3,024.00 0.00% 1.00 $3,024.00
2009 1 2.00% $29.33 1.33% 0.99 $28.94 2.96% $3,113.51 1.33% 0.99 $3,072.64
2010 2 2.00% $29.91 1.59% 0.97 $28.98 2.96% $3,205.67 1.59% 0.97 $3,106.11
2011 3 2.00% $30.51 1.71% 0.95 $29.00 2.96% $3,300.56 1.71% 0.95 $3,136.87
2012 4 2.00% $31.12 1.71% 0.93 $29.08 2.96% $3,398.25 1.71% 0.93 $3,175.42
2013 5 2.00% $31.74 2.36% 0.89 $28.25 2.96% $3,498.84 2.36% 0.89 $3,113.67
2014 6 2.00% $32.38 2.36% 0.87 $28.15 2.96% $3,602.41 2.36% 0.87 $3,131.92
2015 7 2.00% $33.02 2.78% 0.83 $27.26 2.96% $3,709.04 2.78% 0.83 $3,061.27
2016 8 2.00% $33.69 2.78% 0.80 $27.05 2.96% $3,818.83 2.78% 0.80 $3,066.63
2017 9 2.00% $34.36 2.78% 0.78 $26.84 2.96% $3,931.86 2.78% 0.78 $3,072.00
2018 10 2.00% $35.05 3.34% 0.72 $25.23 2.96% $4,048.25 3.34% 0.72 $2,914.62
2019 11 2.00% $35.75 3.34% 0.70 $24.91 2.96% $4,168.08 3.34% 0.70 $2,903.91
2020 12 2.00% $36.46 3.34% 0.67 $24.58 2.96% $4,291.45 3.34% 0.67 $2,893.23
2021 13 2.00% $37.19 3.34% 0.65 $24.26 2.96% $4,418.48 3.34% 0.65 $2,882.59
2022 14 2.00% $37.94 3.34% 0.63 $23.95 2.96% $4,549.27 3.34% 0.63 $2,871.99
2023 15 2.00% $38.69 3.34% 0.61 $23.64 2.96% $4,683.92 3.34% 0.61 $2,861.43
2024 16 2.00% $39.47 3.34% 0.59 $23.33 2.96% $4,822.57 3.34% 0.59 $2,850.91
2025 17 2.00% $40.26 3.34% 0.57 $23.03 2.96% $4,965.32 3.34% 0.57 $2,840.42
2026 18 2.00% $41.06 3.34% 0.55 $22.73 2.96% $5,112.29 3.34% 0.55 $2,829.98
2027 19 2.00% $41.88 3.34% 0.54 $22.44 2.96% $5,263.61 3.34% 0.54 $2,819.57
2028 20 2.00% $42.72 4.15% 0.44 $18.94 2.96% $5,419.42 4.15% 0.44 $2,403.07
2029 21 2.00% $43.58 4.15% 0.43 $18.55 2.96% $5,579.83 4.15% 0.43 $2,375.62
2030 22 2.00% $44.45 4.15% 0.41 $18.17 2.96% $5,744.99 4.15% 0.41 $2,348.47
2031 23 2.00% $45.34 4.15% 0.39 $17.79 2.96% $5,915.05 4.15% 0.39 $2,321.64
2032 24 2.00% $46.24 4.15% 0.38 $17.43 2.96% $6,090.13 4.15% 0.38 $2,295.11
2033 25 2.00% $47.17 4.15% 0.36 $17.07 2.96% $6,270.40 4.15% 0.36 $2,268.89
2034 26 2.00% $48.11 4.15% 0.35 $16.71 2.96% $6,456.00 4.15% 0.35 $2,242.97
2035 27 2.00% $49.07 4.15% 0.33 $16.37 2.96% $6,647.10 4.15% 0.33 $2,217.34
2036 28 2.00% $50.05 4.15% 0.32 $16.03 2.96% $6,843.85 4.15% 0.32 $2,192.00
2037 29 2.00% $51.06 4.15% 0.31 $15.70 2.96% $7,046.43 4.15% 0.31 $2,166.96
2038 30 2.00% $52.08 4.17% 0.29 $15.29 2.96% $7,255.01 4.17% 0.29 $2,129.89
2039 31 2.00% $53.12 4.17% 0.28 $14.97 2.96% $7,469.75 4.17% 0.28 $2,105.15
2040 32 2.00% $54.18 4.17% 0.27 $14.66 2.96% $7,690.86 4.17% 0.27 $2,080.70
2041 33 2.00% $55.26 4.17% 0.26 $14.35 2.96% $7,918.51 4.17% 0.26 $2,056.53
2042 34 2.00% $56.37 4.17% 0.25 $14.05 2.96% $8,152.90 4.17% 0.25 $2,032.64
2043 35 2.00% $57.50 4.17% 0.24 $13.76 2.96% $8,394.22 4.17% 0.24 $2,009.03
2044 36 2.00% $58.65 4.17% 0.23 $13.47 2.96% $8,642.69 4.17% 0.23 $1,985.70
2045 37 2.00% $59.82 4.17% 0.22 $13.19 2.96% $8,898.52 4.17% 0.22 $1,962.63
2046 38 2.00% $61.02 4.17% 0.21 $12.92 2.96% $9,161.91 4.17% 0.21 $1,939.84
2047 39 2.00% $62.24 4.17% 0.20 $12.65 2.96% $9,433.10 4.17% 0.20 $1,917.30
2048 40 2.00% $63.48 4.17% 0.20 $12.39 2.96% $9,712.32 4.17% 0.20 $1,895.03
5yr Total $144.75 5yr Total $15,515.05
40yr Total $844.87 40yr Total $104,575.71
2 Source: Daily Treasury Yield Curve Rates for 1yr, 2yr, 3yr, 5yr, 7yr,
10yr, 20yr, and 30yr times to maturity, as of March 20, 2008.
2 Source: Daily Treasury Yield Curve Rates for 1yr, 2yr, 3yr, 5yr, 7yr,
10yr, 20yr, and 30yr times to maturity, as of March 20, 2008.
1 Source: Forecasted national average annual increase in electricity
prices for electricity delivered to commercial customers through
2030. From the U.S. Department of Energy, Energy Information
Administration's Annual Energy Outlook for 2007.
1 Source: Average annual percent increase in prices for general
medical and surgical hospitals between 1993 and 2007. United States
Department of Labor, Bureau of Labor Statistics. 2007. Producer Price
Index Industry Data.
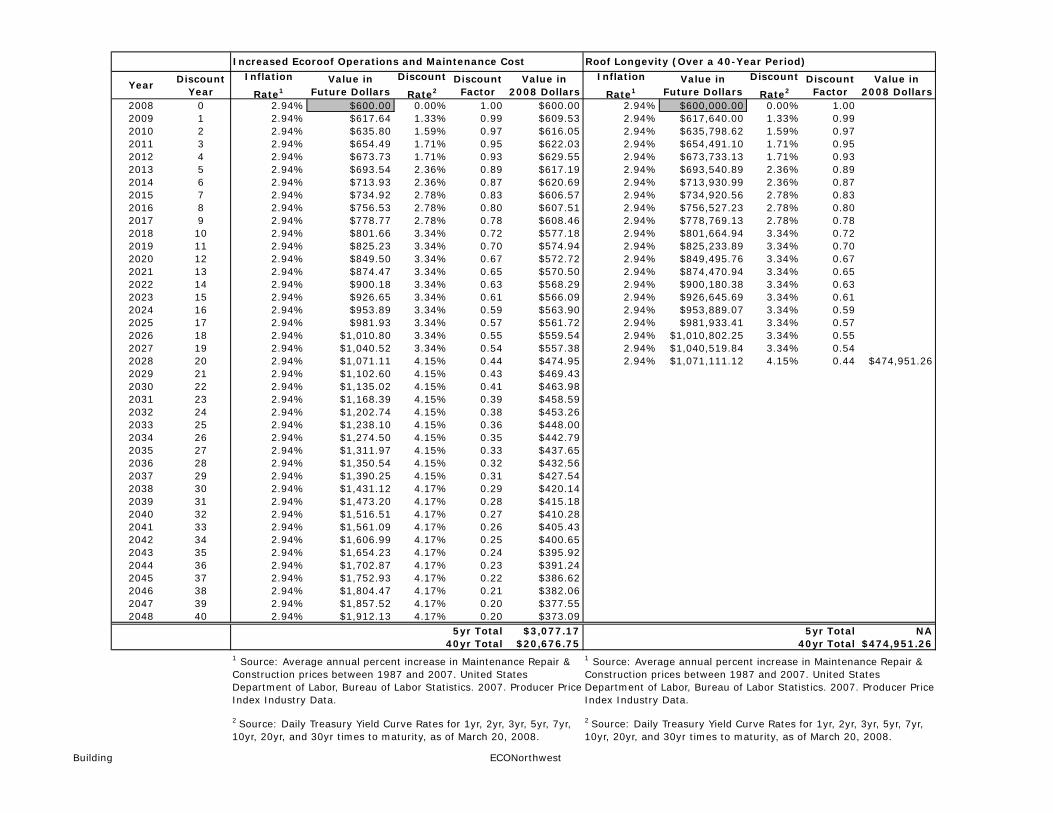
Building ECONorthwest
Increased Ecoroof Operations and Maintenance Cost Roof Longevity (Over a 40-Year Period)
YearDiscount
Year
Inflation
Rate1
Value in
Future Dollars
Discount
Rate2
Discount
Factor
Value in
2008 Dollars
Inflation
Rate1
Value in
Future Dollars
Discount
Rate2
Discount
Factor
Value in
2008 Dollars
2008 0 2.94% $600.00 0.00% 1.00 $600.00 2.94% $600,000.00 0.00% 1.00
2009 1 2.94% $617.64 1.33% 0.99 $609.53 2.94% $617,640.00 1.33% 0.99
2010 2 2.94% $635.80 1.59% 0.97 $616.05 2.94% $635,798.62 1.59% 0.97
2011 3 2.94% $654.49 1.71% 0.95 $622.03 2.94% $654,491.10 1.71% 0.95
2012 4 2.94% $673.73 1.71% 0.93 $629.55 2.94% $673,733.13 1.71% 0.93
2013 5 2.94% $693.54 2.36% 0.89 $617.19 2.94% $693,540.89 2.36% 0.89
2014 6 2.94% $713.93 2.36% 0.87 $620.69 2.94% $713,930.99 2.36% 0.87
2015 7 2.94% $734.92 2.78% 0.83 $606.57 2.94% $734,920.56 2.78% 0.83
2016 8 2.94% $756.53 2.78% 0.80 $607.51 2.94% $756,527.23 2.78% 0.80
2017 9 2.94% $778.77 2.78% 0.78 $608.46 2.94% $778,769.13 2.78% 0.78
2018 10 2.94% $801.66 3.34% 0.72 $577.18 2.94% $801,664.94 3.34% 0.72
2019 11 2.94% $825.23 3.34% 0.70 $574.94 2.94% $825,233.89 3.34% 0.70
2020 12 2.94% $849.50 3.34% 0.67 $572.72 2.94% $849,495.76 3.34% 0.67
2021 13 2.94% $874.47 3.34% 0.65 $570.50 2.94% $874,470.94 3.34% 0.65
2022 14 2.94% $900.18 3.34% 0.63 $568.29 2.94% $900,180.38 3.34% 0.63
2023 15 2.94% $926.65 3.34% 0.61 $566.09 2.94% $926,645.69 3.34% 0.61
2024 16 2.94% $953.89 3.34% 0.59 $563.90 2.94% $953,889.07 3.34% 0.59
2025 17 2.94% $981.93 3.34% 0.57 $561.72 2.94% $981,933.41 3.34% 0.57
2026 18 2.94% $1,010.80 3.34% 0.55 $559.54 2.94% $1,010,802.25 3.34% 0.55
2027 19 2.94% $1,040.52 3.34% 0.54 $557.38 2.94% $1,040,519.84 3.34% 0.54
2028 20 2.94% $1,071.11 4.15% 0.44 $474.95 2.94% $1,071,111.12 4.15% 0.44 $474,951.26
2029 21 2.94% $1,102.60 4.15% 0.43 $469.43
2030 22 2.94% $1,135.02 4.15% 0.41 $463.98
2031 23 2.94% $1,168.39 4.15% 0.39 $458.59
2032 24 2.94% $1,202.74 4.15% 0.38 $453.26
2033 25 2.94% $1,238.10 4.15% 0.36 $448.00
2034 26 2.94% $1,274.50 4.15% 0.35 $442.79
2035 27 2.94% $1,311.97 4.15% 0.33 $437.65
2036 28 2.94% $1,350.54 4.15% 0.32 $432.56
2037 29 2.94% $1,390.25 4.15% 0.31 $427.54
2038 30 2.94% $1,431.12 4.17% 0.29 $420.14
2039 31 2.94% $1,473.20 4.17% 0.28 $415.18
2040 32 2.94% $1,516.51 4.17% 0.27 $410.28
2041 33 2.94% $1,561.09 4.17% 0.26 $405.43
2042 34 2.94% $1,606.99 4.17% 0.25 $400.65
2043 35 2.94% $1,654.23 4.17% 0.24 $395.92
2044 36 2.94% $1,702.87 4.17% 0.23 $391.24
2045 37 2.94% $1,752.93 4.17% 0.22 $386.62
2046 38 2.94% $1,804.47 4.17% 0.21 $382.06
2047 39 2.94% $1,857.52 4.17% 0.20 $377.55
2048 40 2.94% $1,912.13 4.17% 0.20 $373.09
5yr Total $3,077.17 5yr Total NA
40yr Total $20,676.75 40yr Total $474,951.26
2 Source: Daily Treasury Yield Curve Rates for 1yr, 2yr, 3yr, 5yr, 7yr,
10yr, 20yr, and 30yr times to maturity, as of March 20, 2008.
2 Source: Daily Treasury Yield Curve Rates for 1yr, 2yr, 3yr, 5yr, 7yr,
10yr, 20yr, and 30yr times to maturity, as of March 20, 2008.
1 Source: Average annual percent increase in Maintenance Repair &
Construction prices between 1987 and 2007. United States
Department of Labor, Bureau of Labor Statistics. 2007. Producer Price
Index Industry Data.
1 Source: Average annual percent increase in Maintenance Repair &
Construction prices between 1987 and 2007. United States
Department of Labor, Bureau of Labor Statistics. 2007. Producer Price
Index Industry Data.